Embed Size (px)
Citation preview

www.defra.gov.uk
Environmental Key Performance Indicators
Reporting Guidelines for UK Business

Environmental Key Performance Indicators
Reporting Guidelines for UK Business

Department for Environment, Food and Rural AffairsNobel House17 Smith SquareLondon SW1P 3JRTelephone 020 7238 6000Website: www.defra.gov.uk
© Queen’s Printer and Controller 2006
Copyright in the typographical arrangement and design rests with the Crown.
This publication (excluding the logo) may be reproduced free of charge in any format or mediumprovided that it is reproduced accurately and not used in a misleading context. The material mustbe acknowledged as Crown copyright with the title and source of the publication specified.
This document is also available on the Defra website.
Product code PB 11321

Content
3
Foreword by Sir Digby Jones
Responsible businesses are at the heart of society. Companies that understand their linkswith the communities they operate in, and their impact on the environment, are most likely to prosper in the long-term.
At the same time, interest from stakeholders in firms’ environmental performance is at anall-time high. The Accounts Modernisation Directive means that whether you are a plc or a large private company, you will need to report to investors on how environmental issueswill affect your profitability. And growing environmental awareness means more firms thanever are coming under scrutiny from community groups and NGOs.
Reporting on your environmental performance will benefit you in two ways:
• It will provide you with management information to help you exploit the cost savingsthat, in my experience, good environmental performance usually brings; and,
• It gives you the chance to set out what you believe is significant in your firm’s environmental performance.
But producing a report of value both to your business and to stakeholders can be a challenging task. As the environmental debate moves on, this can be true even if you have produced one before. These guidelines are designed to make the process less daunting.They propose most firms concentrate on five or fewer performance indicators of greatestrelevance, and suggest which indicators these might be for firms in your sector. But don’tforget you know your business better than anyone – if you think there are other indicatorsthat are more relevant, include those and explain why.
These guidelines are voluntary – it is up to you whether to use them or not. But I’m a strong believer in businesses communicating their successes and being honest about the challenges faced. Reporting on your environmental performance gives you the opportunity to do this.
Sir Digby JonesDirector GeneralCBI

4
There is an increasing recognition that good environmental performance makes good business sense. Environmental risks and uncertainties impact to some extent on all companies, and affect investment decisions, consumer behaviour and Government policy.Management of energy, natural resources or waste will affect current performance; failureto plan for a future in which environmental factors are likely to be increasingly significantmay risk the long-term future of a business.
Companies that measure, manage and communicate their environmental performance areinherently well placed. They understand how to improve their processes, reduce their costs,comply with regulatory requirements and stakeholder expectations and take advantage ofnew market opportunities. Over a third of FTSE 350 companies already report KPIs accordingto the guidance specified here. Nevertheless, the landscape of environmental, sustainabilityand corporate responsibility reporting can be complex. These Guidelines seek to help companies report their environmental impacts in a meaningful and cost-effective way.The Guidelines are consistent with other standards and reporting guidance as far as possible.
There is an increasing demand for company reporting that is sharper and more focused onthe key impacts on the business and on the environment. The requirement for a BusinessReview1 is designed to improve company reporting, and requires companies to report onenvironmental matters where necessary for an understanding of the business. The use ofKey Performance Indicators (KPIs) will help companies manage and communicate the linksbetween environmental and financial performance.
These Guidelines seek to make this process easier for businesses by setting out 22 environmental KPIs, together with information on how environmental impacts arisingfrom the supply chain and from the use of products can be taken into account. Although22 direct KPIs are described, no one company is expected to report on all of these. Ananalysis of business sectors suggests that around 80 per cent of companies are likely tohave 5 or fewer KPIs. Whilst some companies already have sophisticated reporting systems in place, these Guidelines aim to help many more companies reach a level wherethey understand their environmental performance and can improve it.
Executive Summary
1 Introduced into the Companies Act 1985 from the EU Accounts Modernisation Directive.
Contents
5
Foreword by Sir Digby Jones 3
Executive Summary 4
Contents 5
Chapter 1 71.1 The purpose of the Guidelines 71.2 Who are these Guidelines for? 71.3 Policy and regulatory context 91.4 Why manage and report environmental performance? 101.5 Why use environmental KPIs? 121.6 Current reporting situation 131.7 Types of report 131.8 Guidelines and frameworks 141.9 Principles of reporting 15
Chapter 2 182.1 How were these key performance indicators determined? 182.2 The KPIs 182.3 How to determine reporting boundaries 212.4 Reporting on direct and indirect KPIs 22
Chapter 3 243.1 The reporting process 243.2 How to use these Guidelines 26
Chapter 4 284.1 Emissions to Air 284.2 Emissions to Water 404.3 Emissions to Land 454.4 Resource Use 534.5 Supply Chains 624.6 Products 64

6

Chapter 1
7
1.1 The purpose of the Guidelines
The purpose of these Guidelines is to:
• Give clear guidance to companies on how to report on their environmental performanceusing environmental Key Performance Indicators (KPIs)
• Define which KPIs are most relevant to which sectors, and
• Set out the business rationale for managing environmental performance using KPIs.
These Guidelines place no new mandatory requirements on business and they have been designed, as far as possible, to be compatible with other reporting guidelines and frameworks. Companies using them will be well-placed to respond to requirementsfor a business review brought in by the EU Accounts Modernisation Directive.
The Guidelines aim to help businesses address their most significant environmentalimpacts, and report on these impacts in a way that meets the needs of a range of stakeholders. They set out 22 environmental KPIs that are significant to UK businesses and describe which KPIs are most significant to which business sectors. The majority of sectors (c.80 per cent) have five or fewer relevant KPIs and no sector needs to report onmore than ten. For most companies greenhouse gas emission is the most significant KPI and the Government expects business to tackle its climate change impacts.
1.2 Who are these Guidelines for?
These Guidelines are for all businesses operating in the UK. The Government believes thatthere are sections of the business community that will find these Guidelines particularlyuseful, for example:
• First-time reporters:There are many companies that do not currently report their environmental performance.These Guidelines are a practical guide to identifying and reporting environmental KPIsand signpost to other guides and frameworks which might be useful;
• Businesses required to produce a Report Business Review under the AccountsModernisation Directive (AMD):If the directors have decided that there are environmental matters which should be included in the Business Review then these Guidelines offer KPIs which can be used to quantifiably report this information;

Chapter 1
8
• Small and Medium-Sized Enterprises (SMEs):Some SMEs are already effectively managing and reporting on their environmental performance; others have such a negligible impact on the environment that reportingwill be a low priority. But there are SMEs that can benefit from improving, and reportingon, their environmental performance; for example, an SME might be part of a supplychain containing a larger company that expects its suppliers to behave responsibly.These Guidelines show how SMEs can cost-effectively manage and report their environmental performance using KPIs. Tools such as BS8555 will also be of assistance in helping SMEs manage their environmental performance;
• Experienced reporters:The Guidelines show how companies can address environmental impacts in their supplychains and products, and demonstrate their own environmental performance to existingand potential customers; and,
• The Public Sector:Whilst aimed at businesses, some of the KPIs will be relevant to public sector organisations.
In addition, there will also be secondary users of the Guidelines, i.e. users of the informationwhich companies disclose, for example:
• Shareholders:When a company reports using the standard framework provided by these Guidelinesinvestors will be able to assess environmental performance effectively. Where a businessdoes not use these Guidelines, investors will need to consider whether that business isusing other recognised, sector-specific and/or bespoke environmental KPIs to manageand improve their environmental performance;
• Other stakeholders:A business can demonstrate to other stakeholders its progress towards sustainable development through the use of recognised guidelines and frameworks with appropriateperformance indicators; and,
• Government:The Government is committed to evidence-based policy making; the extent to whichbusiness uses these, and other recognised guidelines and frameworks will help shapefuture policy in this area.

Chapter 1
9
1.3 Policy and regulatory context
Sustainable Development
The Government recently published the UK Sustainable Development Strategy Securing the Future2 which sets out a vision through to 2020. One of four priorities for immediateaction is sustainable consumption and production. The strategy sets out how this is beingtaken forward, through measures to promote:
• better products and services, which reduce the environmental impacts from the use of energy, resources, or hazardous substances;
• cleaner, more efficient production processes, which strengthen competitiveness; and
• shifts in consumption towards goods and services with lower impacts.
Sustainable businesses and organisations can be powerful drivers for more sustainable production and consumption. In this context, the strategy challenges the FTSE All Shareand large private companies to report their performance in a transparent and meaningful way.
However, companies that qualify as medium sized3 are not required to included non-financial key performance indicators, but are required to produce a Business Review.
The Accounts Modernisation Directive (AMD)
The EU Accounts Modernisation Directive introduces requirements for companies toinclude a balanced and comprehensive analysis of the development and performance of the business in their Directors’ Report. The analysis should “include both financial and, where appropriate, non-financial key performance indicators relevant to the particularbusiness, including information relating to environmental and employee matters”. Thispart of the EU Accounts Modernisation Directive is effective for financial years beginningon or after 1 April 2005. The EU Accounts Modernisation Directive applies to over 36,000large and medium GB businesses (including over 1,200 quoted companies). However,companies that qualify as medium are not required to include non-financial key performance indicators.
To assist companies with reporting on significant ‘environmental matters’, the Governmenthas provided some guidance on the interpretation of this term. ‘Environmental matters’include:
• Environmental impacts, both of the company on the environment (e.g. greenhouse gasemissions, waste to landfill), and of the environment on the company (e.g. a depletingnatural resource base, how a company is operating in a carbon constrained world);
2 Securing the Future – The UK Government Sustainable Development Strategy, March 2005.3 ‘Medium company’ turnover not more than £22.8m, balance sheet not more than £11.4m,
not more than 250 employees.

Chapter 1
10
• Company policies – how a company is managing, or intending to manage, theseimpacts; and,
• Company performance, in managing their impacts and against their policies.
Defra Environmental Reporting Guidelines
Defra has previously produced General Environmental Reporting Guidelines with supplements on Waste, Water and Greenhouse Gases. These are superseded by this document with its web links to technical reporting protocols (e.g. on greenhouse gas emissions). The old Guidelines are still available from the Defra website4.
1.4 Why manage and report environmental performance?
Managing and reporting on environmental performance can lead to significant businessbenefits as well as benefits for the environment.
Cost savings and productivity gains
Businesses can save costs and increase efficiency through reducing and managing resourceuse. Typical areas where cost savings are identified include the use of raw materials andsupplies, reductions in waste, water and energy use and transport, travel, and packaging.By reducing environmental impacts, such as waste to landfill, businesses can significantlyreduce any associated taxes or levies, or avoid the cost of compliance altogether.Responsible management of risks and liabilities can lead to reduced insurance costs.
Improved sales
Businesses can benefit from improved reputation amongst their customers (and potentialcustomers) by reporting on relevant environmental issues in a clear and transparent way.Good reporting improves customer confidence. Informing customers of your efforts toimprove your organisation’s environmental performance can lead to increased confidencein your products and services.
4 http://www.defra.gov.uk/environment/business/envrp/guidelines.htm
The Environment Agency estimates British manufacturing would save £2–3 billion eachyear, equivalent to 7 per cent of profits by adopting best practice waste minimisation techniques, often with little or no investment.

Chapter 1
11
Preferred supplier status
Large organisations are increasingly requiring suppliers and contractors to submit environmental performance information to satisfy the expectations of their own shareholders.Reporting on environmental information can make you a more attractive supplier thanyour competitors.
Increased attractiveness to the investment community
Investors, financial analysts and brokers are now asking questions about the sustainabilityof business operations. Reporting on environmental matters provides a good indication of what measures an organisation is taking to reduce risks and develop opportunities. For example, the UNEP Finance Initiative (UNEP FI)5 works closely with over 200 financialinstitutions who are signatories to the UNEP FI Statements, and a range of partnerorganisations, to develop and promote linkages between the environment, sustainabilityand financial performance.
Product and service innovation
Measuring and managing environmental impacts drives and supports innovation in productand service development, helping to secure new markets and customers or safeguardexisting ones.
Employee recruitment
Clear reporting of an organisation’s efforts to manage its environmental performance helpsto attract high-calibre employees as good environmental reputation and performance canbe an important factor in an employee’s choice of employer.
74 per cent of the British population say more information on a company’s social and ethical behaviour would influence their purchasing decisions. MORI CSR Study, 2003.
In Spring 2005, the Government appointed a business-led Sustainable Procurement TaskForce to develop a national action plan for Sustainable Procurement across the public sector by April 2006. Public sector expenditure is over £125bn.
Example 1: GE’s research-and-development investments in eco-friendlier technologies will rise from $700 million in 2004 to $1.5 billion in 2010.
Example 2: The Carbon Trust estimates there has been over £1 billion of investment in UK clean technology companies since 2000.
5 http://www.unepfi.org

Chapter 1
12
Licence to operate
Managing environmental impacts and minimising the organisation’s impact on the environment can reduce the exposure to fines. It can improve relations with regulators and help ensure the company maintains its licence to operate by providing assurancesabout compliance with environmental legislation and conformity with other relevant laws and regulations.
1.5 Why use environmental KPIs?
Environmental Key Performance Indicators (KPIs) provide businesses with a tool for measurement. They are quantifiable metrics that reflect the environmental performance of a business in the context of achieving its wider goals and objectives. KPIs help businessesto implement strategies by linking various levels of an organisation (business units,departments and individuals) with clearly defined targets and benchmarks.
The impact of environmental matters on business performance is increasing and will continue to do so. For example, poor management of energy, natural resources or wastecan affect current performance; failure to plan for a future in which environmental factorsare likely to be significant may risk the long-term value and future of a business. Therefore,the Government expects that businesses will need to use environmental KPIs to adequatelycapture the link between environmental and financial performance.
There are additional reasons why KPIs are important:
• They focus on ‘key’ measures – i.e. those most important to an understanding of abusiness and they mitigate the need for lengthy reports on a wide range of measuresmany of which may be less relevant; and
• New regulations such as the Business Review required by the EU AccountsModernisation Directive require significant environmental issues to be reported using KPIs.
Many companies are already collecting the data required to report on environmental KPIs,either because they can be calculated from standard business data, such as energy bills, orbecause the company separately already reports such information to a regulator.
Three in five people want to work for a company whose values are consistent with theirown. Source: A survey of 1,200 undergraduates across the 20 largest economies in theworld by Environics’ Global Campus Monitor (2003).

Chapter 1
13
1.6 Current reporting situation
The latest study by corporateregister.com6 notes that over 1,500 companies worldwide now produce a separate Corporate Social Responsibility (CSR) Report, compared with less than 100 reports in 1993. In the UK, some good progress has been made – 145 of the FTSE250 report to some extent on their sustainability performance7.
However, there is still a lack of quantification in most reporting. The Environment Agencystudy of Annual Reports and Accounts of the FTSE All Share companies8, noted that themajority of reports lack depth, rigour or quantification. The study concluded that quantifiedenvironmental disclosure levels in Annual Reports and Accounts were found to be low.Only 10 per cent of FTSE All Share companies report quantitatively on climate change,water and waste.
1.7 Types of report
Companies can report on environmental matters in two contexts:
1. Mandatory reports – for example a Business Review and/or,2. Voluntary reports – for example a Corporate Responsibility (CR) report.
Mandatory reports
Some 89 per cent of FTSE All Share companies currently report on environmental issues in their Annual Report and Accounts according to the Environment Agency study. Manybusinesses will now have to produce a Business Review that will include discussion of environmental matters where necessary for an understanding of the business.
Voluntary reports
Organisations publish environmental information in Corporate Social Responsibility (CSR),Corporate Responsibility (CR), Sustainability, or stand-alone Environmental reports. TheGovernment does not believe that one type of report is necessarily better than another;what is important is that organisations understand and can be transparent about theiractions to reduce the harmful environmental and social impacts of their activities, products and services.
These Guidelines are relevant to both mandatory and voluntary reports. In fact, the sameinformation can be used in different reports. For example, a company might disclose its climate change performance as a part of a voluntary report, and take the view that, sincethis will affect the financial performance and shareholder value of the company, it shouldalso be reported in the Annual Report or Business Review.6 Towards transparency: progress on global sustainability reporting 2004, corporateregister.com, ACCA7 Salterbaxter/Context, ‘Directions: trends in CSR reporting 2003–2004’, 2004, joint report by Salterbaxter and Context.8 Environmental Disclosures in the Annual Report & Accounts of companies in FTSE All-Share, The Environment Agency, 2004

Chapter 1
14
1.8 Guidelines and frameworks
The increasing demand for businesses to be transparent about the environmental and othercorporate responsibility challenges they face, has meant that a number of reporting guide-lines and frameworks have evolved.
Reporting guidelines and frameworks
These Guidelines seek to help companies report their environmental impacts in a meaningfuland cost-effective way and, where possible, the Government has sought to ensure that the Guidelines are consistent with other standards and reporting guidance.
In a recent report9, Chatham House recommended that the Government bring clarity to the international CSR agenda by supporting a limited number of ‘gold standard’ initiatives. One such framework proposed in the Chatham House report is the GlobalReporting Initiative (GRI)10 which provides a detailed, globally applicable framework forsustainability reporting. There are also a number of other reporting frameworks11.
Environmental Management Systems (EMSs)
EMSs can be used by companies of all sizes as a means to improve their overall environmental performance. These systems will also provide useful information from a reporting perspective. The Government’s EMS Position Statement12 sets out policy in this area in more detail; it recommends the following types of certified EMSs:
• The global standard ISO 14001
• The European Regulation EMAS (the EU Eco Management and Audit Scheme) and
• Businesses that wish to take a phased approach to implementing an EMS can follow the BS8555 process13; this is particularly appropriate for SMEs.
9 ‘Following up the World Summit on Sustainable Development commitments on Corporate Social Responsibility’,Chatham House, 2005.
10 http://www.globalreporting.org11 ‘Guidelines on environmental management accounting’, International Federation of Accountants, http://www.ifac.org;
and, ‘The Greenhouse Gas Protocol: a corporate accounting and reporting standard’, World Business Council forSustainable Development (WBCSD), http://www.wbcsd.org
12 http://www.defra.gov.uk/environment/business/scp/index.htm13 http://www.theacorntrust.org and http://www.bsi-global.com

Chapter 1
15
Stakeholder engagement
UNEP’s Stakeholder Engagement Manual14 provides comprehensive information on howa company can undertake a rigorous stakeholder engagement process. The GRI also provides comprehensive guidance on this.
Assurance
The use of independent third party assurance statements adds credibility to a business’reporting and provides an important feedback mechanism for the business. A number of organisations provide this service, and an assurance framework – AA1000 – has been developed15.
1.9 Principles of reporting
General principles
Regardless of which framework a company uses, there are some common principles which, if followed, can provide assurance to a business and its stakeholders that appropriateprocesses and procedures have been followed. This information can be included in the narrative part of a report, to add context to quantitative KPIs.
Principle 1 – transparency
Transparency is essential to producing a credible report. Internal processes, systems andprocedures are just as important as the quantitative data, i.e. the value of the quantitativedata will be greatly enhanced if accompanied by a description of how and why the dataare collected. Particular issues which could be relevant to this principle are:
• The level of public disclosure
• Responsibility for environment/sustainable development exists
• Clear definition of boundaries of the company to which the report applies, and
• An explanation of internal processes to manage and report risk.
14 http://www.uneptie.org15 http://www.accountability.org.uk/aa1000/default.asp#

Chapter 1
16
Principle 2 – accountability
A company can be accountable to a variety of different people for its behaviour. In a financialsense directors are ultimately accountable to the owners of the company. Particular issueswhich could be relevant to this principle are:
• The definition, level and nature of stakeholder engagement
• The existence and quality of a third party assurance statement
• Integration of environmental reporting within the Annual Report and Accounts, and Business Review
• The existence and success of a communications strategy, and
• The extent to which information is specifically identified and tailored to the needs of institutional investors.
Principle 3 – credibility
It is essential that any reporting is placed in context, to link the specific impacts and understanding of the company to the wider movement by society to embed the principles of sustainable development. Particular issues which could be relevant to this principle are:
• Understanding of the concept of sustainable development and how it applies to the business;
• A company’s procurement policy and efforts to manage the impacts of its supply chains and products; and,
• The existence and description of an externally certified (or other) environmental management system (EMS), and other data collection, measurement and management procedures.
KPI principles
In addition to these general reporting principles, there are also some common KPI-specific principles:
Principle 1 – quantitative
KPIs should be measured, and should therefore be quantitative in nature. This also meansthat they can be acted upon; for example, targets can be set to reduce a particular emissionif it is expressed in a quantitative term. In this way the effectiveness of environmental policiesand management systems can be substantiated.

Chapter 1
17
Measurement of environmental impacts often requires some form of conversion methodology or estimation, such as the estimation of carbon dioxide emissions resultingfrom the consumption of heating oil. There are many standards that can be used toperform this type of calculation, and it is important to report on the protocols used todetermine these impacts. More information regarding relevant protocols can be found in the description of each KPI, below.
Units of measurement should be uniform, such as metric tonnes rather than imperial tons.Sources of underlying data should be as readily available as possible. This adds to reportingtransparency, and should enable independent analysts to undertake in-depth research.
Principle 2 – relevance
In addition to the quantitative information, a KPI should be accompanied by a general narrative, explaining its purpose and impacts (likely impacts are set out in the definitions of each KPI in Section 4). As part of this narrative, all relevant information and comparatorsshould be taken into account for that KPI. Each KPI should describe the process undergone,the calculation methods and any relevant assumptions. Progress should also be discussed,including against targets, whether improvements or set-backs have occurred and howthese are being tackled. Any information relating environmental performance (i.e. theenvironmental KPI) to financial performance should be also discussed. This can includeenvironmental fines and expenditures.
Principle 3 – comparability
The Government is seeking to stimulate the provision of comparable, comprehensiveand quantitative data, whilst avoiding the problem of over-prescriptive guidance leading to ‘boilerplate’ or ‘cut and paste’ responses. As far as possible, all companies should beable to report data in a comparable format, so users of reports can assess the performanceof a single company over time and relative to its competitors. It is important that companiesavoid using bespoke KPIs to hide poor environmental performance; the narrative part of a report provides the opportunity for a company to discuss any tensions which exist between providing comparable data and reporting company-specific KPIs.
KPIs should be expressed in absolute terms that cover the entire business for each periodof reporting (most commonly annually), and also related to a normalising factor. Two commonly used normalising factors are turnover and production output; but there are others which may be relevant for companies in a particular sector, for example companieswith offices may normalise to floor space.
This allows stakeholders to know how much environmental impact companies have relativeto a given amount of goods and/or services produced. Normalised data can be particularlyhelpful in demonstrating environmental improvements in a growing business.
Environmental information should be published at the same time as Annual Reports andAccounts, and relate to the same accounting period. Reporting should be consistent withother types of company reporting as far as possible.

Chapter 2
18
2.1 How were these key performance indicators determined?
These Guidelines are derived from an analysis of the impact that UK businesses have on the natural environment. The analysis takes into account the value of a number of different ecosystem services16. Ecosystems, and the biological diversity contained withinthem, provide goods and services essential to our economic and social welfare. Ecosystemstend to be significantly undervalued by society and in many cases no formal market existsfor the services that ecosystems provide. In this analysis a value has been placed on theseservices in order to determine the relative importance of different environmental impacts.
2.2 The KPIs
There are 22 Key Performance Indicators considered to be significant to UK businesses.These are supplemented by sections on supply chains and products:
Emissions to air
1. Greenhouse Gases
2. Acid Rain, Eutrophication and Smog Precursors
3. Dust and Particles
4. Ozone Depleting Substances
5. Volatile Organic Compounds
6. Metal emissions to air
Emissions to water
7. Nutrients and Organic Pollutants
8. Metal emissions to water
16 For further information on the value of ecosystem services please refer to the recently published United NationsMillennium Ecosystem Assessment, a 4-year study involving 1,360 experts worldwide. This can be found athttp://www.millenniumassessment.org

Chapter 2
19
Emissions to land
9. Pesticides and Fertilisers
10. Metal emissions to land
11. Acids and Organic Pollutants
12. Waste (Landfill, Incinerated and Recycled)
13. Radioactive Waste
Resource use
14. Water Use and Abstraction
15. Natural Gas
16. Oil
17. Metals
18. Coal
19. Minerals
20. Aggregates
21. Forestry
22. Agriculture
Every business should also consider reporting on how it influences the environmental performance of its supply chain and products, the following additional sections in Chapter 4 provide guidance on this:
• Supply chains
• Products
These KPIs have been designed with company reporting in mind. Where possible, recommendations as to how to measure these KPIs make use of information that is routinely collected by companies. Accordingly, many of the KPIs described can be calculatedfrom information such as quantity of fuel consumed per annum, business mileage, and howmuch electricity has been purchased.

Chapter 2
20
Biodiversity
These guidelines do not include a KPI specifically for biodiversity.
There is no single, universally accepted method for measuring the impacts of companyactivity on biodiversity. However, there are developing initiatives and schemes which provide a model for companies to report qualitatively on their biodiversity impacts in a holistic and integrated way such as the Global Reporting Initiative (GRI).
This will be particularly relevant for certain sectors of business who are involved with supply chain issues (see Section 4.5). This will also be important for those industries withsignificant impacts on biodiversity, including but not limited to the extractive industries,natural resource use (including forestry) and agriculture (including pesticides/fertilisers).
Many of the KPIs in this guidance will provide a contribution to understanding how businessactivities will affect biodiversity. Most of the KPIs (indirectly or directly) do take account ofsome of the activities which will have biodiversity impacts. Performance against the KPIswill allow companies to assess the ecosystem services whose degradation can result in biodiversity loss (i.e. emissions to water), allowing for a more strategic assessment ofimpacts to be made.
Further guidance is available to assist business17.
Environmental fines and expenditures
Businesses can incur environmental fines and expenditures during the course of their operations. Linking these types of costs to specific KPIs provides a financial context tothose stakeholders that are interested, especially institutional investors. Some expendituremay be attributable to a specific KPI, for example waste, in which case it should bedescribed alongside the information disclosed on each KPI. Other fines and expendituresmay be harder to attribute to one specific KPI, in which case they should be reported separately.
17 The Global Reporting Initiative suggests nine indicators which will assist companies in reporting on their impacts.http://www.globalreporting.org
– The Convention on Biological Diversity (CBD) has developed trial indicators for measuring biodiversity loss whichmay also be useful in an evaluation of the indirect and direct effects of business activities on biodiversity:http://www.biodiv.org/doc/publications/cbd-2010-brochure-en.pdf
– Earthwatch have produced guidance for business on biodiversity impacts management http://www.businessandbiodiversity.org/action_options.html
– The Business and Biodiversity Strategy Implementation Group (BBSIG) is looking at issues of biodiversity, reporting and corporate responsibility as part of its remit under the England Biodiversity Strategy.

Chapter 2
21
All businesses must comply with environmental legislation that applies to them. It is importantthat businesses that have incurred fines report on them. For each financial accounting year,a summary of the number of prosecutions and the size of the fines and associated costsshould be reported, regardless of actual size. Incident locations could also be reported ifdeemed relevant, as regulatory regimes can differ significantly. The Environment Agencyhas launched a free website (www.netregs.gov.uk) designed to help small and mediumbusinesses understand and comply with their environmental obligations.
Environmental expenditures are classified as types of costs aimed at directly preventing,reducing or ceasing pollution and nuisances created by a company’s activities, includingaccumulated liabilities, provisions, public funding or other grants, and capital expendituresrelated to environmental issues. Where these expenditures can be separated from mainstreamoperational costs businesses should consider reporting them.
2.3 How to determine reporting boundaries
Determining reporting boundaries can be complicated. The polluter pays principle is a wayto clarify reporting boundaries. This principle assigns responsibility to those parties thatdirectly cause the pollution or use a natural resource. Using this model, emissions causedor resources used directly by the company fall under its direct responsibility; all otherimpacts are indirect.
Direct environmental impacts result from a businesses own operations and include greenhouse gas emissions from heating boilers and vehicles, other emissions from anymanufacturing operations, and waste produced. The purchase of finished products, suchas electricity and outsourced logistics, results in upstream indirect (supply chain) impactsthat are embedded in the products and services supplied. Thus, the purchase of electricity,any form of transport where a company does not pay for the fuel, and supplied water, raw materials and finished products are considered indirect impacts. Downstream indirect(products in use) environmental impacts can be caused by the use or disposal of a productafter it has been sold. Figure 1 sets out some direct and indirect impacts.
Energy and Water Use
Even though energy and water use are indirect impacts, the Government believes thatresponsibility for managing these is shared; this is because more than one company caninfluence this impact. For example, an electricity generator can reduce the carbon contentof the electricity which it generates, but equally, a company which uses that electricity canimprove its energy efficiency. In this example, both companies can improve their performanceso both can usefully measure, manage and report their performance against this impact.For this reason, the Greenhouse Gas and Water Key Performance Indicators, and the SupplyChain section contain information on energy and water use.
The Government accepts that in this situation two companies will be reporting the sameimpact. However, these Guidelines do not establish an emissions trading regime whereit is necessary to avoid this.
Chapter 2
22
2.4 Reporting on direct and indirect KPIs
The Government expects businesses to report on their significant environmental impactswhether they are direct or indirect.
Businesses are likely to derive benefit from positively influencing their indirect environmentalimpacts for at least three reasons:
• The issues may be significant in terms of the organisation’s overall environmental impact;
• Organisations need to be able to demonstrate that reducing their direct impacts is not at the expense of increased impacts elsewhere; and,
• Some stakeholders may deem them accountable for supply-chain impacts, particularlywhere they have significant purchasing power in the marketplace.
These issues are best tackled by adopting a strategic approach to environmental purchasingand supply-chain management that is set within the wider context of an organisation’spurchasing and environmental management activities. There is a wide range of supportand guidance available to organisations from the relevant professional bodies including the “Strategic Supply-Chain Group”18 and the handbook “Environmental Purchasing in Practice”19.
18 http://www.sscf.info19 Environmental Purchasing in Practice – guidance for organisations, 2002, Institute for Environmental Management
and Assessment, Chartered Institute for Purchasing and Supply, NHS Purchasing and Supply Agency.

Chapter 2
23
Fig
ure
1:D
irec
tK
eyPe
rfo
rman
ceIn
dic
ato
rsb
ySe
cto
rty
pe
Sup
ply
Ch
ain
Imp
acts
Dir
ect
Co
mp
any
Imp
acts
Do
wn
stre
amIm
pac
ts
Ener
gy
Wat
er
Raw
mat
eria
ls
Log
isti
cs
Bo
iler
emis
sio
ns
Car
flee
tem
issi
on
s
Man
ufa
ctu
rin
gem
issi
on
s
Lan
dfi
llw
aste
Rec
yclin
gra
te
Pro
du
cts
inu
se
Pro
du
ctd
isp
osa
l

Chapter 3
24
3.1 The reporting process
Figure 2 sets out the recommended environmental reporting processes.
Step 1: Determine relevant KPIs
There are a number of different ways to do this and the most appropriate way will depend on the internal resources and expertise available, and whether the organisation is experienced at reporting.
Figure 2: Process for reporting environmental KPIs
1.Determine relevant KPIs by benchmarking against:
Defra GuidelinesPeers & Sectors
Reporting Standards
4. Collect further data as necessary
2. Identifyaudience & decide
on reporting medium
3. Review data requirements & sources
5. Report on relevant KPIs
Environmental Management
System
Other datasources
Internal review
Externalverification

Chapter 3
25
For many businesses these Guidelines will provide a useful guide as to which environmentalimpacts are relevant for particular sectors. Figure 4 describes the KPIs that are typicallysignificant for over 50 sectors, and this information can be used to help with deciding onthe most appropriate KPIs to report. There is more information on using these Guidelinesin the next section. Many businesses also review what their peer companies are reportingso that they have a good benchmark of the relative extent of reporting.
Finally, for organisations that expect to report on a diverse and wide range of KPIs it maybe useful to refer to other standards that exist for environmental reporting, such as theGlobal Reporting Initiative, in addition to these Guidelines. This may be especially usefulfor those organisations that already report and wish to make their environmental reportingmore extensive and appeal to a wider set of stakeholders.
Step 2: Identify audience & decide on reporting medium
It is important to ensure that when reporting environmental performance, the KPIs selected meet the expectations of the key audiences or stakeholders. Audiences can include shareholders, employees, government, suppliers, customers, academics/consultancies, the local community and NGOs.
Step 3: Review data requirements & sources
The next step is to gather the data as appropriate. Companies that are already reportingmay have the appropriate systems in place; new reporters will need to consider the mostappropriate way of gathering the information.
Environmental Management Systems (EMS)
Environmental Management Systems (such as ISO14001, EMAS and BS8555) are describedin Chapter 1. The Government believes that these systems are a robust and effective wayof managing the data-gathering process to an appropriate standard. More informationabout EMS can be found at: http://www.defra.gov.uk/environment/business/scp/index.htm
Other data sources
In some cases it will be possible to collect information using standard business systemssuch as transactional systems. These Guidelines describe how businesses can use informationthat is already collected, such as fuel and electricity bills, to calculate environmental KPIs.
Chapter 3
26
Step 4: Collect further data as necessary
Once the data requirements and systems have been assessed, it may be necessary to collectmore information than is currently available. This may involve implementing or expandingthe data collection systems currently in place.
Step 5: Report on relevant KPIs
Once the appropriate information has been gathered, the relevant KPIs can be reported.This process can be repeated for every reporting period. Most companies that report on environmental KPIs do so annually.
Figure 3 illustrates how a number of KPIs could be reported for a typical service industry company.
3.2 How to use these Guidelines
The recommended way to use this document is:
1. Find the appropriate Sector Classification for your company. Figure 4 (p66) contains information on 56 sector types, the most significant direct KPIs, and other KPIs. Look up the sector type, or types, that most accurately reflect your business type.
2. Assess direct KPIs. Assess the relevance of the direct KPIs to your business. Each sectorcross-references page numbers for each KPI. Please refer to each individual KPI for furtherinformation on the definition, the process and sectors that give rise to the impact, howto measure or calculate it, and how to report it.
3. Assess indirect KPIs. Once you have determined relevant direct KPIs, please refer againto Figure 4 to assess Indirect Impacts (Upstream). When examining your sector in thetable, refer to the column that states Significant Supplier Industries. Look up the relevantdirect KPIs for each supplier sector in order to determine which issues are relevant for a given supplier industry. Then refer to the sections on Supply Chains and Products.
4. Measure and report on KPIs according to Guidelines. These Guidelines providedetails of how to measure each KPI, in many cases making use of standard business data that may already be collected. The Guidelines also describe in clear terms how to report on each KPI.
Figure 3 illustrates the way in which a number of KPIs for a typical service industry company could be reported.

Chapter 3
27
Figure 3: Sample Company Plc – Environmental Key Performance Indicators
Environmental Key Performance Indicators – Financial Year 2005
Direct Impacts (Operational) Quantity
GreenhouseGases
Definition Data source & CalculationMethods
Absolute TonnesCO2
NormalisedTonnesCO2 Per £M Turnover
2004 2005 2004 Target 2005 Target
Gas Emissions fromutility boilers.
Yearly consumption in kWh collectedfrom fuel bills, converted according to Defra Guidelines.
Vehicle Fuel Petrol and dieselused by staff andvan hire fleet.
Expense claims and MOT recordedmileage, converted according to Defra Guidelines.
Waste Definition Data source & CalculationMethods
Quantity
Absolute Tonnes
NormalisedTonnes Waste Per £M Turnover
2004 2005 2004 Target 2005 Target
Landfill General officewaste, whichincludes a mixtureof paper, card,wood, plasticsand metals.
Volume of waste generated perannum, calculated by recording the number of bins and skipsremoved, converted to tonnes according to Defra Guidelines.
Recycled General officewaste recycled,primarily cardboard.
Volume of waste recycled per annum,calculated by recording the number of bins and skips removed for recycling, converted to tonnes according to Defra Guidelines.
Indirect Impacts (Supply Chain)
GreenhouseGases
Definition Data source & CalculationMethods
Quantity
AbsoluteTonnes CO2
NormalisedTonnes CO2 Per £M Turnover
2004 2005 2004 Target 2005 Target
Energy use Directly purchasedelectricity, whichgeneratesGreenhouseGases includingCO2 emissions.
Yearly consumption of directly purchased electricity in kWh, converted according to Defra Guidelines.
Water Definition Data source & CalculationMethods
Quantity
AbsoluteCubic Metres
NormalisedCubic Metres Water Per £M Turnover
2004 2005 2004 Target 2005 Target
Supplied water Consumption ofpiped water. Nowater directlyabstracted by the Group.
Yearly consumption of purchased water.

Chapter 4
28
4.1 Emissions to Air
KPI 1 Greenhouse Gases
Definition
Greenhouse gases (GHGs) are so called because they contribute towards the greenhouseeffect. The greenhouse effect describes the natural phenomenon where certain gases in the atmosphere increase the Earth’s surface temperature due to an ability to trap heat, similar to the way in which glass traps heat in a greenhouse.
The six main GHGs are covered by the Kyoto Protocol, these gases are outlined in thebox below. Each GHG has a different capacity to cause global warming, depending on its radiative properties, its molecular weight and its lifetime in the atmosphere. The so-calledglobal warming potential (GWP) of a gas encapsulates these factors. The GWP used forthe Kyoto Protocol is defined as the warming influence over a 100-year time horizon relative to that of carbon dioxide. The GWP of methane is 21 (i.e. a 1kg emission ofmethane to the atmosphere will cause an equivalent warming effect as 21kg of carbondioxide over 100 years). GWP of nitrous oxide is 310, for F-gases GWP can be severalthousands. GWP for carbon dioxide is, by definition, 1.
Greenhouse Gases covered by the Kyoto Protocol
Carbon Dioxide – CO2 Emitted mainly from the burning of fossil fuels, carbon dioxideaccounted for some 86 per cent of the UK’s human-induced (anthropogenic) GHG emissions in 2003. Typically quantified in tonnes of CO2 per year.
Methane – CH4 Emitted mainly from agriculture, waste disposal, leakage from the gasdistribution system and coal mining, methane contributed to over 6 per cent of UK anthropogenic GHG emissions in 2003.
Nitrous Oxide – N2O The main anthropogenic sources of nitrous oxide emissions areagriculture, transport, industrial processes and coal combustion. Nitrous oxide accountedfor approximately 6 per cent of UK GHG emissions in 2003.
Hydrofluorocarbons – HFCs, Perfluorocarbons – PFCs and Sulphur Hexafluoride – SF6 Collectively known as ‘F-gases’ they are emitted mainly from air conditioning and refrigeration and industrial processes. Together F-gases accounted for around 2 per cent of the UK’s anthropogenic GHG emissions in 2003.

Chapter 4
29
There is considerable scientific evidence that the increase in atmospheric concentrations of GHGs due to human-induced (anthropogenic) GHG emissions is having a noticeableeffect on climate. The Intergovernmental Panel on Climate Change (IPCC) was set up in 1988 to assess the science of climate change20. Reports are prepared by thousands of scientists from around the world and agreed at intergovernmental meetings of the IPCC.The IPCC’s Third Assessment Report, issued in 2001, makes the following observations:“The Earth’s climate system has demonstrably changed on both global and regional scalessince the pre-industrial era, with some of these changes attributable to human activities.Human activities have increased the atmospheric concentrations of greenhouse gases andaerosols since the pre-industrial era. The atmospheric concentrations of key anthropogenicgreenhouse gases (i.e. carbon dioxide (CO2), methane (CH4), nitrous oxide (N2O), and tropospheric ozone (O3) reached their highest recorded levels in the 1990s, primarily due to the combustion of fossil fuels, agriculture, and land-use changes.” The increase in the natural process of the greenhouse effect caused by human activities is known as the enhanced greenhouse effect and leads to global warming. Globally, the ten hottestyears on record have all occurred since the beginning of the 1990s. Current climate models predict that global temperatures could increase from between 1.4 and 5.8oCover the next 100 years, depending on the amounts of GHGs emitted and the sensitivityof the climate system21. The social, environmental and economic costs associated with this could be considerable.
The contributing role of man-made GHGs to climate change is accepted by most countries.A large number of global, national and local initiatives are developing that will limit thenumber of GHGs emitted by corporations. At an international level, the United NationsFramework Convention on Climate Change (UNFCCC) and the Kyoto Protocol have established a framework within which many countries are taking action to limit or reduceGHG emissions. The Kyoto Protocol entered into force on 16 February 2005 and imposes a legally binding GHG emission reduction target on the UK of 12.5 per cent22 of baseyear emissions23 between 2008 and 2012. The Government has also committed to adomestic goal of a 20 per cent reduction in CO2 emissions by 2010. At a UK and EU level,this has led to initiatives which include the UK Climate Change Programme, the EuropeanClimate Change Programme, the Greenhouse Gas Emissions Trading Scheme Regulations,and the EU Emissions Trading Scheme.
20 http://www.ipcc.ch21 http://www.defra.gov.uk/environment/climatechange/22 Reduction of UK carbon dioxide emissions from 1990 levels as apportioned under the Burden Sharing Agreement.23 Base year emissions are 1990 for CO2, CH4 and N2O and 1995 for the F-gases.

Chapter 4
30
EU ETS, UK ETS and CCAs
The EU Emissions Trading Scheme (EU ETS) that commenced in 2005 is one of the mainpolicies being introduced across Europe to tackle emissions of carbon dioxide and fight climate change. Participants in the Scheme are allocated allowances, each allowance representing a tonne of the relevant emission, in this case carbon dioxide. Installationsmust then monitor and report their CO2 emissions and at the end of the year surrender an equivalent number of allowances from their account. Emissions trading gives companiesthe flexibility to meet emission reduction targets according to their own strategy; for exampleby reducing emissions on site or by buying allowances from other companies who havemade reductions and consequently have excess allowances available to sell. The EU ETS will become one of the main ways to cut carbon dioxide emissions, while maintaining economic growth. Phase 1 of the EU ETS (2005 to 2007) involves around 1,100 installationsfrom a range of sectors, including power stations, iron and steel, pulp and paper, and oilrefineries in the UK, and regulates approximately 45 per cent of EU CO2 emissions24.
The UK Emissions Trading Scheme (UK ETS) that began in March 2002 was the world’s first economy-wide greenhouse gas emissions trading scheme. Thirty-one organisations(‘Direct Participants’ in the scheme) have voluntarily taken on emission reduction targets to reduce their emissions against 1998–2000 levels, delivering 11.88 million tonnes of additional carbon dioxide equivalent (CO2 e) emission reductions over the life of thescheme (2002–2006). In the first year (2002), the Direct Participants achieved emissionreductions of 4.64 million tonnes CO2 e against their baselines and in the second year(2003) they achieved emission reductions of nearly 5.2 million tonnes CO2 e against theirbaselines. A reduction of 5.9 million tonnes CO2 e was achieved by direct participantsagainst their baselines in the 2004 compliance period.
The UK ETS trading facility is also open to the 6000 companies with Climate ChangeAgreements (CCAs). These negotiated agreements between business and Government setenergy-related targets. Companies meeting their targets will receive an 80 per cent discountfrom the Climate Change Levy, a tax on the business use of energy. These companies can use the scheme either to buy allowances to meet their targets, or to sell any over-achievement of these targets. Anyone can open an account on the registry to buy and sell allowances.
Processes
The most significant activity that contributes to GHG production is the combustion of fossilfuels; mostly for the generation of energy for businesses and homes, but also and increasinglyfor transportation. In addition to fossil fuel combustion, other significant human inducedsources of GHG include agriculture (enteric fermentation, manure management and others),industrial processes (particularly the production of cement, glass chemicals, steel, and foodand drink), land-use change and forestry, waste management (landfill and incineration),and others. Significant GHG intensive activities are cement production (resulting in processCO2) and chlorofluorocarbons (CFC) production or use.
24 Further information: http://www.defra.gov.uk/environment/climatechange/trading/eu/index.htm

Chapter 4
31
Sectors
Every business sector is responsible for GHG emissions. Companies could be affected by present or future regulation due to either direct impacts as a result of their own operations or indirect impacts arising from their supply chain.
Boundaries
Companies may decide to report on impacts that occur outside their normal financialreporting boundaries and this is common practice in the case of GHG emissions.
Direct impacts
The most significant contributor to GHG production is the combustion of fossil fuels, so any business that burns large amounts of fuel will have significant direct GHG emissions.
Indirect impacts – energy use
Many companies report on the GHG emissions incurred in the generation of the electricitythey consume and for service companies these indirect emissions can be more importantthan their direct environmental impacts. There are also some ways that companies can mitigate these emissions, for example by paying a renewables tariff or improving energyefficiency. As such the Government encourages companies to measure and understand the GHG emissions in supplied electricity. The detailed advice below on how this can becalculated is therefore repeated within the supply chain section (4.5) of this document.It is important to note that these indirect GHG emissions should be reported separatelyfrom direct emissions.
Over 70 per cent of UK electricity is generated from fossil fuels25. Businesses that consume a large amount of electricity will be indirectly responsible for significant GHG emissions.These emissions should be reported separately from the GHG that companies emit directlyas described in KPI 1.
If you have not defined any special requirements with regard to your electricity supply (i.e. you are supplied standard grid electricity) you should use Defra’s standard electricitygeneration factor to estimate emissions from kWh of electricity consumed. Guidance on standard conversion factors can be found on Defra’s website, in the annex sections of Defra’s Guidelines for Company Reporting on Greenhouse Gas Emissions, at:http://www.defra.gov.uk/environment/business/envrp/gas/index.htm
25 http://www.dti.gov.uk/energy/inform/energy_stats/electricity/index.shtml

Chapter 4
32
If you have operations outside of the UK that are supplied electricity, you can apply the appropriate conversion factor for each country, as different countries have differentgeneration mixes. The United Nations Conference on Trade and Development (UNCTAD)has published guidance on standard emission factors for each country, which is availablefrom their website26.
Calculation or measurement procedures
GHGs can be measured by recording emissions at source by continuous emissions monitoringor by estimating the amount emitted using activity data (such as the amount of fuel used)and conversion factors (e.g. calorific values, emission factors, oxidation factors). Forinstance, factors can be used to calculate the amount of CO2 emitted as a result of burninga particular quantity of oil in a heating boiler. Conversion factors are published by a numberof agencies. It is recommended that UK companies not already reporting for regulatorypurposes use Defra’s conversion protocols. These can be found on Defra’s website, in the annex sections of Defra’s Guidelines for Company Reporting on Greenhouse GasEmissions, at: http://www.defra.gov.uk/environment/business/envrp/index.htm
Conversion factors are categorised as follows:
The National Atmospheric Emissions Inventory is also a useful source of information:http://www.naei.org.uk/
26 A Manual for the Preparers and Users of Eco-efficiency Indicators. UNCTAD, 2004. http://www.unctad.org
Category Explanation
Fuel For example, conversion of tonnes of oil used in heating boilers to tonnes of CO2 emitted.
Combined Heat and Power Conversion of kWh to tonnes of CO2 emitted.
Electricity conversion factors For example, conversion of kWh to tonnes of CO2 emitted.
Typical process emissions Identification of emissions derived from certain processes. For example, cement production results in CO2 emissions.
Greenhouse gas conversion protocols Conversion of individual GHGs to CO2 equivalents.
Transport: Road, Rail, Air, Road Freight and Other Freight
For example, conversion of miles travelled in medium-sized petrol car to tonnes of CO2 emitted.
Chapter 4
33
Many of the initiatives mentioned in the definition of this KPI, such as the EU and UKEmissions Trading Schemes, have specific monitoring and reporting requirements thatmust be used by the installations involved27,28. For example, the monitoring requirements for installations in the EU ETS are specified in their greenhouse gas permit conditions in accordance with the Commission’s Monitoring and Reporting Decision. Failure to meetthese permit conditions could lead to prosecution. However, there may be other sources or types of greenhouse gases that are emitted from the site that are not part of theScheme and are not included on the permit (for example CO2 from transport emissions on a site). For example, non-CO2 gases are included in the UK ETS but not included in the EU ETS at this stage. To calculate the total CO2 and CO2 equivalents from the site as a whole, installations can use these Guidelines. It should therefore be recognised thatbusinesses will report different emissions under the UK ETS and EU ETS because of theirdifferent scope and coverage. Where emissions are reported there should be a clear statement about what sources they cover and a clear explanation for any variation in total annual emissions figures (including variations due to the different nature of the UK ETS and EU ETS).
Reporting guidance
Greenhouse gases should be reported in metric tonnes emitted per annum individually. If an estimation method has been used this should also be reported.
Greenhouse gases should always be reported in this way. For normalising purposes, GHGs can also be reported as CO2 equivalents.
KPI 2 Acid Rain and Smog Precursors
Definition
Acid Rain and Smog Precursors, for purposes of this KPI, are sulphur dioxide (SO2), nitrous oxides (NOx), ammonia (NH3) and carbon monoxide (CO). Other acid rain and smogprecursors include VOCs and particulate matter, but these are covered by other KPIs.
Acid rain and smog precursors (which can also be eutrophication precursors) are emissionsto air which, with dispersion, can be transported in the atmosphere over distances of hundreds to thousands of miles, and eventually deposited through precipitation or bydirect “dry” processes. The term acid rain refers to all types of precipitation (rain, snow,fog, dew) or dry deposition (fly ash, sulphates, nitrates) that are acidic in nature.Eutrophication is the process by which excess nutrient is added to an ecosystem.Significant inputs of nutrients to water can stimulate the growth of plant life, subsequently affecting other aquatic life by depleting oxygen levels.
27 See: http://www.defra.gov.uk/environment/climatechange/trading/eu/permits/index.htm for EU ETS monitoring andreporting Guidance.
28 See: http://www.defra.gov.uk/environment/climatechange/trading/uk/index.htm for UK ETS reporting.

Chapter 4
34
The most significant acidification precursors are sulphur dioxide (SO2), nitrous oxides (NOx) and ammonia (NH3). Nitrous oxides (NOx) and ammonia are also the most commoneutrophication precursors. Both acid rain and eutrophication precursors can have adverseeffects on biodiversity. Emissions from industrial activities of these pollutants are heavilyregulated, including the Integrated Pollution Prevention and Control Directive (IPPC) at the EU level, the Clear Skies Initiative in the US and the Pollution Prevention and ControlAct in the UK.
Smog precursors can be a variety of pollutants, including nitrogen oxides, carbon monoxideand a huge range of Volatile Organic Compounds. When combined with sunlight, theseprecursors interact in a complex reaction to produce ground level ozone and peroxyaceticnitric anhydride (PAN) which, along with particulate matter, are the main components ofphotochemical smog. Photochemical smog is a health hazard and, as sunlight is a factor in smog formation, it is usually more severe in summer when light levels are higher.Ground-level ozone is also damaging to plant life and can destroy synthetic material if long-term exposure occurs.
Processes
Smog precursors are emitted by a wide variety of natural and human-influenced processes.The primary human-influenced processes that emit smog precursors are fossil fuel combustion,for example in road transport and electricity generation, and processes that release VOCs.Nitrogen oxides are also used in the Ostwald process, an industrial process that producesnitric acid from ammonia. Nitric acid is commonly used in the production of ammoniumnitrate fertilisers. The heavy use of nitrogen-based fertilisers and the intensive farming of animals leads to releases of ammonia from these activities – 80–85 per cent of UKammonia emissions come from agriculture, with the great majority resulting from the collection, storage and disposal of animal waste.
Pollutant Impact Source
Nitrogen Oxides Precursor to ozone formation, secondaryparticulate matter formation, acid deposition (including acid rain), andeutrophication. NO2 is also toxic.
Fuel combustion
Sulphur Dioxide Precursor to acid deposition (including acid rain) and secondary particulate matter formation. Also toxic.
Fuel combustion (especially coal)
Ammonia Precursor to eutrophication, acid rain andsecondary particulate matter formation.
Animal wastes and fertilisers
Carbon Monoxide Carbon monoxide – toxic, binds to haemoglobin in blood, ozone (smog) precursors.
Fuel combustion, paints and finishes, solvent based cleaners and de-greasing agents
Chapter 4
35
Sectors
Sectors that use fossil fuels will contribute towards acid rain, eutrophication and smog. For more information please refer to Figure 4.
Calculation or measurement procedures
Although ozone is one of the primary components of smog, it is produced through secondary processes that occur naturally rather than directly from industrial processes or fuel consumption. However, the precursors (see table) are primary emissions and can be measured, as can the other main component of smog – primary emissions of particulatematter (note that particulate matter is covered by a separate KPI). These emissions arisefrom the consumption of fossil fuels and can be calculated using standard emissions factors, provided the quantity and type of fuel combusted is known, along with the type of boiler or engine.
Producers of nitric acid who utilise the Ostwald process should be able to calculate theiremissions of nitrogen oxide based on the efficiency of their process (which can be calculatedby comparing the mass of products compared to the mass of reactants). In a 100 per centefficient process, no nitrogen oxides would be emitted, however it is unlikely that theprocess would be 100 per cent efficient.
Reporting guidance
SO2, NOx, NH3 and CO should be reported in metric tonnes emitted per annum. If an estimation method has been used this should also be reported.
KPI 3 Dust and Particles
Definition
Dust and particulate matter, alternatively referred to as particulates, aerosols or fine particles,are tiny particles ranging from 10 nanometres to 100 micrometres in diameter. There aretwo types of processes that contribute to ambient particles: (1) primary emissions of particles,where particles are emitted directly to the atmosphere, and (2) emissions of precursorgases that react in the atmosphere to form secondary particles. Exposure to particulatematter (PM) is associated with a number of health outcomes including shortened lifeexpectancy, cardiovascular and lung disease. Particles smaller than 10 micrometres (PM10) are small enough to enter the airways and lungs.

Chapter 4
36
The EU has set strict limits on the level of airborne PM10. These limit values came into forcein 2005. Ambient PM10 concentrations are expected to fall as improved vehicle enginetechnologies are adopted and stationary fuel combustion emissions are controlled throughabatement or the use of low sulphur fuels such as natural gas. Despite this, some areas of the country, particularly near to some busy roads, are expected to exceed the 24-houraverage EU limit value. It is expected that concentrations of PM10 will remain a hazard topublic health in most of the urban areas of the UK for the near future. This is partly due to increased use of diesel vehicles in car fleets and also due to high background levels ofPM resulting from regional and trans-boundary emissions of secondary PM precursor gasessuch as NOx and SO2.
Processes
Combustion of fossil fuels is the primary source of ambient particulate matter, althoughother activities such as non-exhaust emissions from road traffic (e.g brake and tyre wear)and re-suspension contribute to ambient levels near roads. Processes such as waste handlingand minerals extraction can also cause emissions of PM10. Primary particulate emissionsfrom combustion are chiefly composed of unburned hydrocarbons, carbon (soot), sulphur,salts and toxic metals. Secondary particles arise when ammonia interacts with acidic speciesin the atmosphere – note that this is covered by the Acid Rain and Smog Precursors KPI.
Sectors
The main sectors contributing to primary particulate emissions are the energy industry (fossilfuel burning electricity generators) and road transport. The main sectors directly contributingto secondary particulate emissions are the power generation sector and any company thatowns petrol/diesel powered vehicles. All sectors indirectly contribute to ambient particulatelevels as a result of electricity consumption, although this is an indirect impact. For moreinformation please refer to Figure 4.
Calculation or measurement procedures
Primary particulate matter emissions arise from the consumption of fossil fuels and can becalculated using estimation methods29, provided the quantity and type of fuel combusted is known, along with the type of boiler or engine.
Reporting guidance
Primary particulate matter emissions should be reported in metric tonnes emitted per annum, by size of particle. If an estimation method has been used this should also be reported.
29 For further guidance please refer to the US Environmental Protection Agency’s website.
Oil-fired boilers: http://www.epa.gov/ttn/chief/ap42/ch01/final/c01s03.pdf table 1.3-4 in the Tables section. Gas-fired boilers: http://www.epa.gov/ttn/chief/ap42/ch01/final/c01s04.pdf

Chapter 4
37
KPI 4 Ozone Depleting Substances
Definition
Ozone depleting substances (ODS) catalyse the destruction of ozone in the upper atmosphere (the ozone layer).
The most important Ozone Depleting Substances are Chlorofluorocarbons (CFCs and Freons), Hydrochlorofluorcarbons (HCFCs), Halons, Methyl Chloroform, CarbonTetrachloride (the main precursor of Freons) and Methyl Bromide. There are a wide rangeof Ozone Depleting Substances, but the majority of uses of them have been phased outfollowing the 1987 Montreal Protocol. CFCs were used as refrigerants, propellants inaerosol cans, cleaning solvents for circuit boards and blowing agents for making expandedplastics. They have been replaced with HCFCs, which still contribute to ozone destructionbut are less harmful, and other non-ozone depleting substances. HCFCs are also beingphased out of use. Currently in the EU HCFCs can only be used to refill existing air conditioning and refrigeration systems; halons can only be used for specific critical uses;and methyl bromide can only be used for agreed critical uses and for quarantine and pre-shipment purposes.
Processes
HCFC emissions are caused largely by leakage from air conditioning and refrigeration systems. Halons are used in fire extinguisher systems on aeroplanes and other highlyspecialised uses, where fires must be extinguished as quickly as possible, and are emittedwhen these systems are used.
Sectors
For more information please refer to Figure 4.
Calculation or measurement procedures
Ozone Depleting Substances are often only emitted to the environment by accident.Companies should record the ODS currently in use (which can be estimated based on thetype of refrigeration, air conditioning or fire extinguisher system containing the ODS) andthe amount emitted if leakage occurs, or fire extinguishers are used. The manufacturer of the system should be able to provide data on the quantity of ODS used in the systemand the likely amount emitted in the case of a fault.
Ozone Depleting Potentials or Global Warming Potentials can be used to compare the effects of ODS30 substances.
30 http://www.epa.gov/docs/ozone/ods.html

Chapter 4
38
Reporting guidance
ODS should be reported in metric tonnes by type emitted per annum. If an estimationmethod has been used this should also be reported.
KPI 5 Volatile Organic Compounds
Definition
Volatile organic compounds (VOC) are a group of commonly used chemicals that evaporatewhen exposed to air. VOCs are able to act as a solvent, or carrier, for many substances andas such are widely used as cleaning and liquefying agents in fuels, degreasers, solvents,polishes, cosmetics, drugs, and dry cleaning solutions. Some common VOCs aretrichloroethylene (TCE), tetrachloroethylene (which is a dry cleaning fluid), trichloroethane,benzene, toluene, and xylenes. Methane is also a VOC, but it is covered by theGreenhouse Gas KPI.
VOCs are either emitted to air as gases from certain substances or as a by-product of fossilfuel combustion. There are thousands of different substances which emit VOCs, such aspaints, lacquers, paint strippers, cleaning supplies, pesticides, building materials, officeequipment and materials, adhesives, photographic solutions and many more.
Processes
Industrial processes that emit VOCs include manufacturing, mining, textiles and paper production. VOCs also arise from fuel consumption. However, given the broad range of VOCs and their multitude of uses, it is often impractical to give an exhaustive list of the processes that produce them.
Sectors
For more information please refer to Figure 4.
Calculation or measurement procedures
VOC emissions from fuel consumption can be calculated using the appropriate fuel conversion protocols which convert fuel used to VOC emitted, provided the amount and type of fuel and the type of boiler or engine is known. VOC emissions from specificindustrial processes can be estimated based on the specific type of chemical known, itsvolatility/vapour pressure and the amount used. Solvent mass inventories can also be used to measure VOC emissions (amount of solvent used subtracted from the amount of solvent recovered).

Chapter 4
39
Reporting guidance
VOCs should be reported in metric tonnes emitted per annum. If an estimation methodhas been used this should also be reported. The combustion of fuel gives rise to many different types of VOC, so it is impractical to record them individually, in which case themasses of individual VOCs should be totalled together. This approach should also be taken where the amount of any individual VOC emitted is negligible (i.e. in kilograms per annum). In cases where a large quantity of an easily identifiable VOC is emitted (e.g. formaldehyde) the specific name and amount of that VOC should be reported.
KPI 6 Metal Emissions to Air
Definition
Metals that can have significant environmental impacts include lead, mercury, cadmium,arsenic and nickel. Certain heavy metals that are in common usage are often emitted to air as particulates or dust. Metals emitted to air are eventually deposited on land or waterand accumulate in soil, water, sediments and sludge, depending on the atmospheric conditions and type of metal. From here they can then accumulate in flora and fauna and,as they are often toxic, this can have highly harmful effects on the environment. The relativemobility of metals differs, and consequently their environmental effects can also be varied.For example, once lead has fixed into soil it takes a very long time to migrate out, and as such lead can have long-term effects on soil quality. Mercury (and to a lesser extentCadmium) quickly leaches out of soil and into watercourses; once there it is rapidly takenup by fish and subsequently accumulates in the food chain.
Processes
Heavy metals can be emitted from the burning of coal or oil and are also emitted from avariety of industrial processes. Metal ore mining causes metal based dust formation, as domanufacturing processes that involve working with large amounts of metal (in particularfoundries, auto-manufacturers and heavy manufacturing). Smaller amounts of metal willbe emitted from light manufacturing (for example, electronics) and power generation willhave high emission rates if the combustion of coal or oil is involved.
Sectors
For more information please refer to Figure 4.
Calculation or measurement procedures
The amounts of metal emitted as a result of fuel combustion can be estimated using standard fuel emission factors, based on both the type of fuel used and the type of boiler/engine it is combusted in. The quantity of fuel used can often be estimated from fuel bills.

Chapter 4
40
In the case of industrial processes, emissions are likely to be highly localised and can be calculated by direct measurement at emission sources (as required under PPC permitconditions) or estimated by sampling and analysing the local air quality. The best way of sampling varies between industrial practices but generally involves the analysis of dust samples to determine metal content and particle size and an estimation of how much dust is produced.
Reporting guidance
Metal emissions to air should be reported in metric tonnes emitted per annum. If an estimation method has been used this should also be reported.
As metals vary in toxicity, reporting should involve a discussion of the type of metal, the mass emitted (kilograms or tonnes), particle size (which has a large effect on potentialtoxicity) and the means by which it is emitted – i.e. from a point or dispersed source.
4.2 Emissions to Water
KPI 7 Nutrients and Organic Pollutants
Definition
Organic matter is commonly found in groundwater and inland waters, and can cause significant pollution and disruption to aquatic habitats. Significant discharges of organicwaste into bodies of water can cause eutrophication in rivers, lakes, estuaries, coastal and marine waters (where the growth of plant life is stimulated by excess nutrients, subsequently affecting other aquatic life by depleting oxygen levels).
While nutrients have an indirect effect on oxygen levels, oxygen-demanding pollutantshave a direct effect. They are contained in organic effluents such as sewage discharges and discharges from the industrial sectors (food and drink) listed in Annex III of the Urban Waste Water Treatment Directive. Organic effluent includes contaminants such as Polychlorinated Biphenyls (PCBs), Polycyclic Aromatic Hydrocarbons (PAHs),Hexachlorocyclohexanes (HCH), Benzene, Toluene, Xylenes, Ethylbenzene, Dioxins and Phenols, as well as general brewing waste and sewage. Oil spills can also contribute to organic pollutants.
Processes
Sources of nutrients commonly include human sewage, crops and animal production, food processing, pulp and paper manufacturing, detergents manufacturing and fertilisermanufacturing. Organic contaminants can lead to the death of animals and fish as well as changes in appearance, reproductive patterns or behaviour. Organic pollutants can be found in influent and effluent of wastewater treatment, drinking water, boiler feedwater, cooling water and storm water.
Chapter 4
41
Sectors
Many sectors are responsible for emitting organic pollutants to water. The processes that commonly result in these emissions are described above. For more information please refer to Figure 4.
Calculation or measurement procedures
Discharged organic substances are commonly measured in one of two ways: by determiningthe concentration of the emitted substances where it is known that specific substanceshave been emitted (where few of them are emitted or when they are easy to identify inprocesses) or by assessing the overall quality of the effluent when specific assessments are difficult to make due to the diverse nature of the components of the discharge. Forspecific measures, standard laboratory tests can be performed to determine the concentrationof the contaminant in the water. Water quality measures are more varied. Combinedparameters to assess potential eutrophication in water include:
• Biochemical Oxygen Demand (BOD), which refers to the amount of oxygen that wouldbe used if all the organic components in water were consumed by bacteria.
• Total Suspended Solids (TSS or SS) are solids in water, which constitute an indication of high concentrations of bacteria, nutrients or pesticides and can harm the aquatic life/cause problems for the industrial use of water.
General organic matter concentration can be defined by the following measures:
• Total Organic Carbon (TOC), which measures the organic content of a sample that can be oxidised to Carbon Dioxide.
• Chemical Oxygen Demand (COD), which is the amount of oxidisable material as measured by the potassium dichromate test.
Materials and data collection processes are particular to each one of the methods statedand require more or less costly investments in resources and equipment depending on the technique used.
Reporting guidance
Total discharge of effluents should be recorded in absolute cubic meters per annum,and the content of effluent described. In addition, specific or general water quality measuresshould be undertaken to assess the impact of these emissions to water. For specific measures,the kg of pollutant per cubic metre should be reported. If spills have contributed to organicpollutant emissions to water directly, the absolute number of spills should be reported, and the volume of individual spills if they are significant. If an estimation method has been used this should also be reported. Discharge consents should also be discussed where relevant.

Chapter 4
42
KPI 8 Metal Emissions to Water
Definition
Metals and metal compounds can be found in effluent, drinking water, cooling water andrun-off water. Metal emissions to water include: arsenic (As), cadmium (Cd), chromium(Cr), copper (Cu), mercury (Hg), nickel (Ni), lead (Pb) and zinc (Zn). Other metals that areregularly detected in waters comprise antimony (Sb), barium (Ba), beryllium (Be), boron (B),cobalt (Co), manganese (Mn), selenium (Se), silver (Ag) and vanadium (V).
Metal can affect the aquatic environment in a number of different ways, and for somemetals their concentration can increase in the food chain at each trophic level, a processcalled biological magnification.
Pollutants 31 Processes & Sectors
Antimony Petroleum refineries
Fire retardants
Electronic production
Ceramic production
Steel production (solder)
Arsenic Glass production
Electronic production
Fruit production
Barium Metal refineries
Mining
Beryllium Metal refineries
Electronic and electrical production
Aerospace and defence industries
Boron Pyrotechnic flares
Insulation fibreglass
Sodium bleach and disinfectants
Manufacture of borosilicate glasses
Boron filaments in aerospace structures
31 Main source: United States Environmental Protection Authority

Chapter 4
43
Pollutants Processes & Sectors
Cadmium Corrosion of pipes
Stabilisers for PVC
Alloys and electronic compounds
Landfill
Metal refineries
Refined petroleum products
Batteries
Paint
Coatings (marine - aerospace applications)
Chromium Steel production (metal alloys)
Landfill
Pigments for paper, paints, cement and rubber
Cobalt Cobalt-bearing portables
Rechargeable batteries
Copper Corrosion of pipes
Landfill
Additives to control algal growth
Lead Corrosion of pipes
Batteries
Petrol additives (forbidden in the EU)
Pigments
Landfill
Cable sheathing
Ammunition
Manganese Used in quantitative analysis and medicine
Paints
Landfill
Glass colourant
Alloys
Mercury Refineries
Crop production
Landfill
Batteries
Lamps
Thermometers
Fillings (dentistry)

Chapter 4
44
Sectors
For more information please refer to Figure 4.
Calculation or measurement procedures
Metal emissions to water arise from various processes as described in the table above.These emissions can be calculated using emission estimation techniques and manuals.Sampling and source monitoring procedures for analyses vary from country to country and requirements for direct measurement methods depend on the reporting requirementsand methods established by pollution inventories. In the EU various tools have been developed to quantify emissions of metal to water.
Reporting guidance
Substances should be reported as absolute kilograms emitted per annum. Where dischargesare made to surrounding controlled waters discharge consents are required which may provide useful data. Details of the technique used for sampling and monitoring shouldbe given to enable comparisons to be made.
Pollutants Processes & Sectors
Nickel Stainless steel and related alloys
Coins
Landfill
Electronic devices’ batteries
Selenium Petroleum refineries
Mining
Silver Photographic material and processes
Mirrors
Electric conductors
Batteries
Table cutlery
Dental and medical
Vanadium Aerospace titanium alloys
Chemical catalyst for glass and ceramics
Dyes
Target material for X-rays

Chapter 4
45
4.3 Emissions to Land
KPI 9 Pesticides and Fertilisers
Definition
Pesticides and fertilisers are distributed predominantly on farmland, and can have a significant impact on the natural environment.
Fertilisers
The primary nutrients in fertilisers are nitrogen, phosphorus and potassium. Secondarynutrients include sulphur, magnesium and calcium. The use of fertilisers can have anadverse effect on the environment. They can lead to poor drainage of soil and excessiveuse of fertilisers leads to micronutrient deficiency in soil. The organic matter of British soils has decreased by approximately 50 per cent in the past 20 years. Surplus fertiliser discharged into bodies of water can cause river/lake eutrophication (where the growth of plant life is stimulated by excess nutrients, subsequently affecting other aquatic life by depleting oxygen levels).
Pesticides
A pesticide is any agent used to kill or limit damaging effects by any of the following:insects, rodents, birds, unwanted plants (weeds), fungi, or micro-organisms such as bacteriaand viruses. The term pesticide is a general one which encompasses individual producttypes i.e. herbicides (including plant growth regulators), fungicides, microbiocides, rodenticidesand various other substances used to control pests. Agriculture has become both moreproductive and intensive. High-yielding crop varieties are often more prone to diseases and pest attack and the manner in which they are grown (e.g. large areas of monocultures)can exacerbate this. In addition greater productivity also requires weed control to preventyield losses. This has led to the extensive use of pesticides. All approved pesticides are tested using a stringent risk assessment process which includes independent scientificscrutiny to determine safe thresholds of application. The effect of pesticides on the environment can be through long-term persistence in the soil or by affecting aquatic systems if the pesticide is highly mobile. For some pesticides their concentration in thefood chain is magnified at each trophic level: a process called biological magnification.
Processes
Pesticide and fertiliser emissions to land are produced by deposition of these substances on farmland.
Sectors
For more information please refer to Figure 4.

Chapter 4
46
Calculation or measurement procedures
The amount of pesticides and fertilisers applied to land in a given accounting year should be measured.
Reporting guidance
Pesticide or fertiliser emissions to land should be measured in terms of the total weightapplied (kilograms). Companies could also report the total area treated (hectares). If an estimation method has been used this should also be reported.
KPI 10 Metal Emissions to Land
Definition
Emissions of metals to land by business processes can have a serious impact on the localenvironment. All metals can have adverse effects on natural habitats depending on theamount emitted and the acceptable biological limit. In particular, metals such as mercury,cadmium, arsenic, chromium, copper, zinc and lead, can be extremely toxic. Elevated concentrations of certain metals in soil impede, for example, the ability of micro-organismsto break down plant matter, hindering the release of nutrients.
Processes
Metals are emitted directly to land by a number of industrial processes or by heavy metalleaching from mineral wastes at mining facilities. Metals can also be found in sewagesludge used as fertiliser.
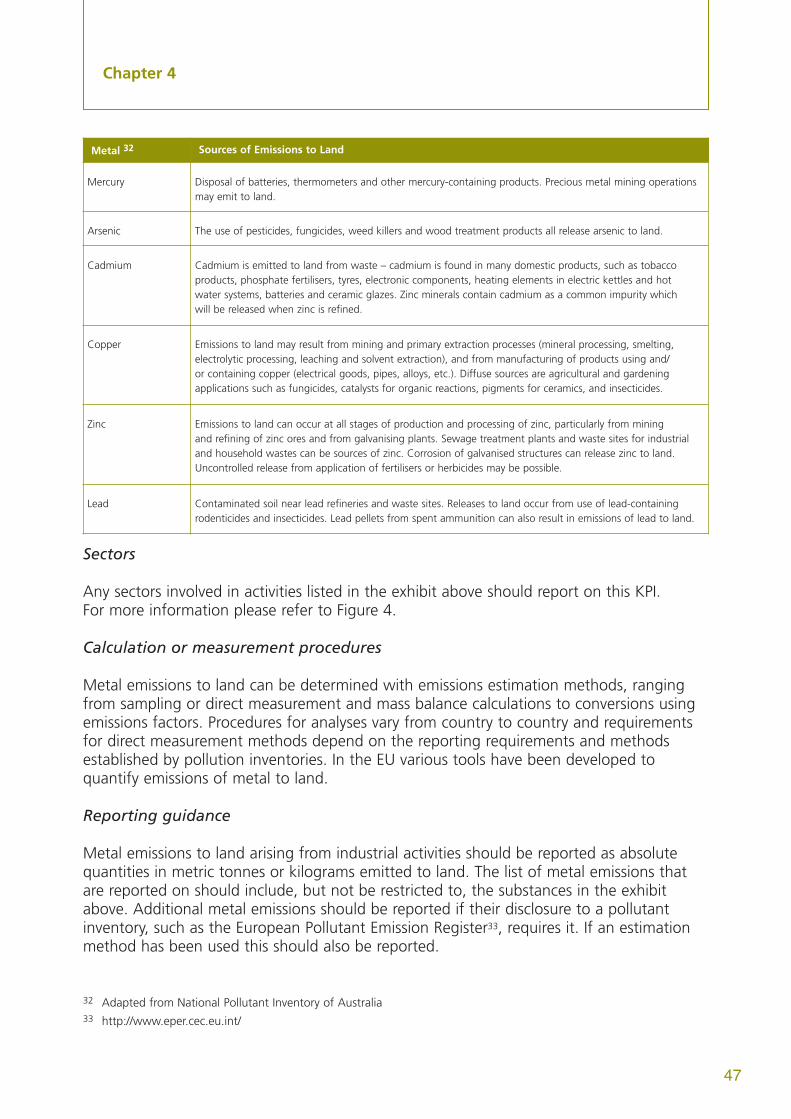
Chapter 4
47
Sectors
Any sectors involved in activities listed in the exhibit above should report on this KPI. For more information please refer to Figure 4.
Calculation or measurement procedures
Metal emissions to land can be determined with emissions estimation methods, rangingfrom sampling or direct measurement and mass balance calculations to conversions usingemissions factors. Procedures for analyses vary from country to country and requirementsfor direct measurement methods depend on the reporting requirements and methodsestablished by pollution inventories. In the EU various tools have been developed to quantify emissions of metal to land.
Reporting guidance
Metal emissions to land arising from industrial activities should be reported as absolutequantities in metric tonnes or kilograms emitted to land. The list of metal emissions thatare reported on should include, but not be restricted to, the substances in the exhibitabove. Additional metal emissions should be reported if their disclosure to a pollutantinventory, such as the European Pollutant Emission Register33, requires it. If an estimationmethod has been used this should also be reported.
Metal 32 Sources of Emissions to Land
Mercury Disposal of batteries, thermometers and other mercury-containing products. Precious metal mining operationsmay emit to land.
Arsenic The use of pesticides, fungicides, weed killers and wood treatment products all release arsenic to land.
Cadmium Cadmium is emitted to land from waste – cadmium is found in many domestic products, such as tobacco products, phosphate fertilisers, tyres, electronic components, heating elements in electric kettles and hot water systems, batteries and ceramic glazes. Zinc minerals contain cadmium as a common impurity which will be released when zinc is refined.
Copper Emissions to land may result from mining and primary extraction processes (mineral processing, smelting, electrolytic processing, leaching and solvent extraction), and from manufacturing of products using and/or containing copper (electrical goods, pipes, alloys, etc.). Diffuse sources are agricultural and gardening applications such as fungicides, catalysts for organic reactions, pigments for ceramics, and insecticides.
Zinc Emissions to land can occur at all stages of production and processing of zinc, particularly from mining and refining of zinc ores and from galvanising plants. Sewage treatment plants and waste sites for industrialand household wastes can be sources of zinc. Corrosion of galvanised structures can release zinc to land.Uncontrolled release from application of fertilisers or herbicides may be possible.
Lead Contaminated soil near lead refineries and waste sites. Releases to land occur from use of lead-containingrodenticides and insecticides. Lead pellets from spent ammunition can also result in emissions of lead to land.
32 Adapted from National Pollutant Inventory of Australia33 http://www.eper.cec.eu.int/

Chapter 4
48
KPI 11 Acids and Organic Pollutant Emissions to Land
Definition
There is a wide range of organic chemicals that can be emitted to land – for example, long chain hydrocarbons (from oil, petrol or diesel) and organic chemicals from industrialprocesses (e.g. solvents such as formaldehyde and alcohols). Organic and inorganic acidsare also used in many industrial processes and can be emitted to land. These emissions are usually caused by accidental spillage. The effects are varied: some chemicals bind tosoil and act as long term contaminants, whilst others will leach into local water sourcesand contaminate water supplies. Acids can concentrate in soil (and bodies of water) andcan have highly detrimental effects on the local flora and fauna, as they are often highlysensitive to changes in pH.
Processes
Any process using either oil-based fuels or lubricants can give rise to these emissions, as can accidental spillages. Similarly any process using large amounts of industrial acids or organic chemicals may also give rise to this impact.
Sectors
For more information please refer to Figure 4.
Calculation or measurement procedures
Spillages can be estimated by comparing the volume/mass of a substance before and after a production process. If the spillage occurs at the end of a pipe or hose then the emission can be estimated by monitoring the flow rate and duration of spill.
Reporting guidance
This KPI should be reported by type of emission and total mass of product spilled. The total amount emitted in tonnes per annum of each type of chemical should bereported. The absolute number of spills should be reported, and the volume of individualspills if they are significant. If an estimation method has been used this should also be reported.
Note that any contaminated land disposed of should also be reported according to the criteria set out in KPI 12 – Waste.
Chapter 4
49
KPI 12 Waste (Recycling, Recovery and Landfill)
Definition
In the UK waste now has to be disposed of and treated according to the type of waste – co-disposal of hazardous (non municipal) and non- hazardous waste is no longer permitted. Non-hazardous waste includes municipal (e.g. household) waste and officewaste such as paper, cardboard, plastic and metal packaging and organic materials.
http://www.defra.gov.uk/environment/waste/index.htm
Probable sources of hazardous waste are covered in greater detail in other KPIs, includingpesticides and fertiliser, metal emissions to land and acids and organic pollutants.
There are four main routes for the management of waste:
Landfill (and Hazardous Landfill)
A significant proportion of waste is sent to landfill sites, which are closely regulated by the Environment Agency in the UK. Waste material is contained in specific cells whereemissions such as methane, a greenhouse gas and leachate are carefully monitored.Methane released at landfill sites can be captured and flared off, or fed into biogasengines to generate power.
Recovery – Energy from Waste (EfW)
Waste is combusted at very high temperatures under controlled conditions, monitored bythe Environment Agency. Waste incineration can be a significant source of renewable energy.Incineration releases large amounts of Carbon Dioxide. Incineration also results in otheremissions such as Nitrogen Oxides (NOx), Sulphur Dioxide SO2 and ash, although theseemissions can be reduced by physical processes. Ash can contains concentrated amountsof heavy metals and can be difficult to dispose of. The application of sewage sludge toagricultural land can be considered a recovery operation.

Chapter 4
50
Recycling
Once waste is sorted and processed it is then sent on to a recycling facility. Recycling wasteis more energy efficient than extracting virgin materials. Recycling aluminium is 95 per centmore energy efficient than producing virgin aluminium, recycling glass is 50 per cent moreenergy efficient that producing virgin glass and recycling paper is 60 per cent more energyefficient than producing virgin paper. For waste to be recycled it must be sorted and sentto an appropriate recycling facility.
Re-use
Reusing waste is an area where community groups have led the way: they have beeninstrumental in promoting the reuse of items which would otherwise end up as waste,through activities as far-ranging as re-distribution of unwanted furniture and computers, to community composting; all of which are helping to reduce the amount of waste goingto landfill.
Processes
Non-hazardous waste arises from day-to-day activities in all businesses. Any office will generate waste paper, packaging, glass and other waste. Increased amounts of organicwaste will be generated by businesses that produce foodstuffs (or even just have a canteen).Many businesses have recycling bins in their offices, which mean that some sorting can be carried out prior to the waste leaving company premises.
Sectors
All sectors produce waste to some extent. For more information please refer to Figure 4.
Calculation or measurement procedures
Waste can be measured by estimating the number and weight of waste containers thatleave the business over a set period of time. If the waste is sorted prior to recycling, e.g. to comply with the Producer Responsibility Obligations (Packaging Waste) Regulations200534 then more detailed measurement of specific waste (e.g. tonnes of glass) can betaken. Further guidance on how to measure waste is available on Defra’s website, at:http://www.defra.gov.uk/environment/business/envrp/
34 http://www.defra.gov.uk/environment/waste/topics/packaging/index.htm

Chapter 4
51
Reporting guidance
Waste should be reported in metric tonnes per annum. In the UK many companies willalready be recording levels of waste sent to landfill, as the UK landfill tax is charged pertonne. Where possible, waste materials should be broken down into types (e.g. paper,glass, aluminium). Companies obligated under the packaging Regulations should haverecords of the amount, and different types of packaging waste they send to a recycler, inorder to demonstrate that they have met their recovery and recycling obligations. The finalwaste management route should be also reported (e.g. 50 per cent to landfill, 20 per centincinerated, 20 per cent recycled, 10 per cent re-used). If an estimation method has beenused this should be reported.
KPI 13 Radioactive Waste
Definition
Radioactive waste is a by-product of the manufacture of nuclear fuel and also results fromthe production of electricity and from the use of radioactive materials. Radioactive wastecan be classified into three main categories:
• High Level Waste (HLW) is heat-generating waste produced by the reprocessing of spent nuclear fuel.
• Intermediate Level Waste (ILW) arises from the dismantling and reprocessing of spent fuel and from the general operation of nuclear plants.
• Low Level Waste (LLW) contains radioactive materials but those which do not exceed certain defined activity levels.
Radioactive waste in the UK is highly regulated. Companies must have authorisation from the environmental regulators under the Radioactive Substances Act 1993 (RSA93) to accumulate or dispose of radioactive waste and strict limits are imposed. There are alsovarious EU Directives and international conventions covering the safety of nuclear facilitiesand disposal of radioactive waste. In 2006 the Committee on Radioactive WasteManagement (CoRWM)35, a Government appointed body, will make recommendations to Ministers on the long-term management of higher activity radioactive waste. A separatereview of Government policy on Low Level Radioactive Waste is also due to end with the production of a new policy statement in summer 2006.
Processes
Radioactive waste is produced by a number of industrial and medical processes. The majorityof such waste, however, arises from the production of nuclear fuel, the use of nuclear fuel to generate electricity and the reprocessing of spent fuel from both UK and foreignelectricity generators.
35 http://www.corwm.org.uk/
Chapter 4
52
Sectors
The two sectors from which the majority of radioactive waste arises are the “Electricity,gas, steam, and hot water supply” sector, and the “Manufacture of coke, refined petroleumand nuclear fuel” sector. Many other industries, such as the medical sector and researchestablishments, also produce radioactive waste but in much lower quantities. For moreinformation please refer to Figure 4.
Calculation or measurement procedures
Companies measuring radioactive waste should follow guidelines from the environmentalregulators. More information can be found at:http://www.defra.gov.uk/environment/radioactivity/waste/index.htm
Companies that produce electricity from nuclear power should measure spent fuel. The weight of spent rods should be recorded by the company’s management system and then totalled for the year in order to report in metric tonnes per annum.
Reporting guidance
Solid radioactive waste should be reported at the company level on an annual basis in kg or metric tonnes of HLW, ILW and LLW.
For LLW it is normal practice to report on disposals or transfers as a proxy for LLW generation. Where this is done, the information provided to the Environment Agency (for the purpose of monitoring compliance with the relevant transfer or disposal authorisation under RSA 93) should be reported.
For HLW and ILW, it is normal practice to use estimates based on the informationwhich the company has reported to Nirex for inclusion in the National Radioactive Waste Inventory.
Nuclear power generators should report on the quantity of spent fuel used in power stations, in metric tonnes of uranium (teU) per annum. In addition, electricity producersshould report the amount of electricity produced each year using nuclear energy in TWh.
If an estimation method has been used this should also be reported.

Chapter 4
53
4.4 Resource Use
KPI 14 Water Abstraction
Definition
Water is an essential resource that is required for a healthy environment and is used in the production and provision of numerous goods and services, such as electricity. In the UK approximately a third of drinking water is abstracted from groundwater, whilst theremainder comes from surface water.
Abstraction of water can have significant local, or more widespread, impacts on the environment. The threat of climate change, resulting in severe droughts, floods andstorms, also constitutes a challenge for water resources management. Countries aroundthe world are aware of the need to use water resources more efficiently and reduce wastein order to ensure availability of the resource in the long term. To achieve this goal variousmarket and financial instruments have been put in place, such as abstraction charges,effluent consents and pricing mechanisms.
Processes
Water can be abstracted for public water supply to produce drinking water following treatment. It can also be abstracted directly for use by businesses for a wide variety of usesincluding irrigation and for industrial processes (e.g. coolant, carrier or solvent purposes).
Sectors
Water is abstracted by various companies including water and sewerage companies,industrial and chemical companies, and power companies. Many sectors rely heavily on supplied water, although this impact should be reported as a supply chain impact and not a direct KPI. For more information please refer to Figure 4 and to the section on supply chains (Section 4.5) .
Calculation or measurement procedures
For abstracted water, the majority of charges are levied according to the licensed volume,but actual volumes abstracted are reported to the Environment Agency. It is the actual volumes abstracted that should be measured.
Reporting guidance
The table overleaf illustrates the scope of measures that should be reported. In most casesreporting will be much simpler, as most companies focus on a specific type of abstraction.

Chapter 4
54
The most appropriate way of reporting abstracted water should be in cubic metres. If an estimation method has been used this should also be reported. Compliance with anyabstraction consents, such as those provided by the Environment Agency in the UK, shouldalso be reported. Companies should also discuss whether water has been re-used orreturned to source (e.g. cooling water). Direct abstraction should be reported as the volume taken, not the licensed volume.
Water use
It is important to distinguish water abstraction from the use of supplied water.The environmental impacts associated with supplied water use are indirect and more guidance on how these can be reported can be found in section 4.5 – Supply Chains.
KPI 15 Natural Gas
Definition
Natural gas is a fossil fuel resource that is necessary for many economic activities, includingelectricity production. Natural gas is a combustible mixture of hydrocarbon gases. Whilenatural gas is primarily comprised of methane, it can also include ethane, propane, butaneand pentane. Found in reservoirs underneath the earth, natural gas is commonly associatedwith oil deposits. After refining, the clean natural gas is transported through a network of pipelines or compressed into Liquid Natural Gas (LNG).
Natural gas is a finite resource and as such its continued extraction and use will eventually lead to depletion. In addition, every mining aspect of gas extraction has associated environmental impacts: the natural habitat is usually disrupted, and otherextraction processes and by-products can have serious environmental consequences.Storage of natural gas is an environmental issue as leakages and explosions may occur.
Substitution of natural gas with renewable energy sources (such as wind energy or solarpower) where technically and economically feasible can also reduce the demand for theplanet’s resources.
Note that emissions caused by the combustion of natural gas, such as greenhouse gases,are covered by other KPIs.
Tidal (Saline) Water Non-Tidal (Fresh) Water
GroundwaterRiver or ReservoirWater
Recovered Water (eg rainwater, recycled water)
Abstracted Water(m3/year)

Chapter 4
55
Processes
Resource depletion of natural gas arises as a result of extraction of natural gas.
Sectors
Every mining operation that extracts natural gas (the primary ISIC sector type is “Extractionof crude petroleum and natural gas”). For more information please refer to Figure 4.
Calculation or measurement procedures
Extraction of natural gas is commonly measured at source.
Reporting guidance
Reporting of natural gas quantities should be in cubic metres or barrels of oil equivalentextracted per annum.
KPI 16 Oil
Definition
Oil is a fossil fuel resource that is a necessary energy provider for many economic activities,including a significant proportion of the UK’s energy needs.
Crude oil mainly consists of hydrocarbons. A comparatively volatile liquid, bitumen is composed principally of hydrocarbon with traces of sulphur, nitrogen or oxygen compounds and can be removed from the earth in a liquid state.
Oil is a finite resource and as such its continued extraction and use will eventually lead to depletion. In addition, every aspect of oil extraction has associated environmentalimpacts: the natural habitat is usually disrupted, and extraction processes and by-products can have serious environmental consequences.
Spills that occur during transport are covered by Acids and Organic Pollutant Emissions to Land (KPI 11) and Water KPIs (KPI 14). Emissions caused by the combustion of oil, suchas greenhouse gases (KPI 1) and dust and particles (KPI 3), are also covered by other KPIs.
Substitution of oil with renewable energy sources (such as wind energy or solar power)where technically and economically feasible can also reduce the demand for the planet’s resources.
Processes
Resource depletion of oil arises as a result of extraction of oil.

Chapter 4
56
Sectors
Every mining operation that extracts oil (the primary ISIC sector type is “Extraction of crude petroleum and natural gas”). For more information please refer to Figure 4.
Calculation or measurement procedures
Extraction of crude oil is commonly measured at source.
Reporting guidance
Crude oil should be reported in cubic metres or barrels of oil equivalent extracted per annum.
KPI 17 Metals
Definition
Metals are non-renewable resources and are necessary raw materials for many economicactivities. The most commonly used metallic resources are iron, aluminium (bauxite), copper, lead, nickel, zinc, gold and silver.
Metal resources are non-renewable resources and as such their continued extraction and use will eventually lead to their depletion. Higher-grade metal deposits are beingincreasingly depleted, requiring the mining companies to move towards less economicaldeposits, such as lower-grade deposits or deposits that are harder to exploit. In addition,every aspect of mining has environmental impacts: the natural habitat is usually disrupted,and mining processes and by-products can have serious environmental consequences.
Where technically and economically feasible, recycling, covered in a separate KPI (KPI 12),ensures that resources, such as metals are put back into productive use. This alleviates thedemand for the planet’s metal resources and avoids the need to extract virgin materials.
Processes
Metals are extracted through mining (surface or underground). This indicator only includes metal commodities that are extracted rather than those that are recoveredthrough recycling.
Sectors
Every mining operation that mines metals (the primary ISIC sector type is “Mining of metal ores”). For more information please refer to Figure 4.
Chapter 4
57
Calculation or measurement procedures
Extraction of metals is commonly measured at source.
Reporting guidance
Metals extracted should be reported in metric tonnes extracted per annum, broken down by type of metal.
KPI 18 Coal
Definition
Coal is a fossil fuel resource that is a necessary energy provider for many economic activities, including a significant proportion of the UK’s energy needs.
Coal resources are non-renewable resources and as such their continued extraction anduse will eventually lead to their depletion. Better-quality coal deposits are being increasinglydepleted, requiring mining companies to move towards less economical deposits, such aslower-quality deposits or deposits that are harder to exploit. In addition, every aspect ofmining has environmental impacts: the natural habitat is usually disrupted, and miningprocesses and by-products can have serious environmental consequences.
Substitution of coal with renewable energy sources (such as wind energy or solar power)where technically and economically feasible can reduce the demand for the planet’s coalresources.
Emissions caused by the combustion of coal, such as greenhouse gases and dust and particles, are covered by other KPIs.
Processes
Coal is extracted by quarrying and mining operations (surface or underground).
Sectors
Every mining operation that mines coal (the primary ISIC sector type is “Mining of coal and lignite; extraction of peat”). For more information please refer to Figure 4.
Calculation or measurement procedures
Extraction of coal is commonly measured at source.
Reporting guidance
Coal should be reported in metric tonnes extracted per annum, broken down by type of coal (such as lignite or hard coal) and extraction (deep or open cast).

Chapter 4
58
KPI 19 Minerals
Definition
Minerals are naturally occurring inorganic substances which have a characteristic andhomogeneous chemical composition, definite physical properties and, usually, a definitecrystalline form. Minerals include asbestos, barite, boron, diamonds, diatomite, feldspar,flurospar, graphite, gypsum, guano, mangnesite, perlite, phosphate, potash, salt sulphur,talc, vermiculite and zirconium. Metal extraction is covered by the Metals KPI. Aggregatesare covered by the Aggregates KPI.
Mineral resources are considered non-renewable resources and as such their continuedextraction and use will eventually lead to their depletion. In addition, every mining activityhas environmental impacts: the natural habitat is usually disrupted, and other miningprocesses and by-products can have serious environmental consequences. Some mineralsare often not destroyed in use and therefore can be recycled. However, other minerals arenon-recyclable and thus their finite nature becomes even more important. Waste mineralsare covered in KPI 12 (waste)
There are many different uses for minerals. For example gypsum is one of the most widelyused minerals in the world and has a multitude of uses. The most recognised use of gypsumis for the wallboard found in most homes and buildings. A typical new home containsmore than seven metric tonnes of gypsum alone.
Processes
Minerals are extracted by quarrying and mining operations. This indicator includes onlyminerals that are extracted rather than those that are recovered through recycling.
Sectors
Every mining operation that extracts minerals (the primary ISIC sector type is “Other mining and quarrying”). For more information please refer to Figure 4.
Calculation or measurement procedures
Extraction of mineral material is commonly measured at source. Companies should measure the quantity of mineral (not ore) that is extracted.
Reporting guidance
Minerals extracted should be reported in metric tonnes extracted per annum, broken down by type of mineral.
Chapter 4
59
KPI 20 Aggregates
Definition
Natural aggregates, which consist of crushed stone, sand and gravel, are natural resourcesused as a basic raw material by many industries including construction, agriculture andindustries employing complex chemical and metallurgical processes. Despite the low valueof the basic products, aggregates mining is one of the most important mining industries in the world in terms of production volume (15,000 Mtpa), second only to fossil fuels in terms of production value (US$62,000 Mtpa)36.
Natural aggregates are finite resources and as such their continued extraction and use will eventually lead to their depletion. In addition, every mining activity has environmentalimpacts: the natural habitat is usually disrupted, and other mining processes and by-productscan have serious environmental consequences.
Other sources of aggregates, such as secondary and recycled aggregates, including inertconstruction and demolition waste, further reduce the impact on natural resources.
Processes
Aggregates are extracted by quarrying and mining operations. This indicator only includesaggregates that are extracted from a primary source, rather than those that arise from secondary sources e.g. demolition waste.
Sectors
Every mining operation that extracts aggregates (the primary ISIC sector type is “Other mining and quarrying”). For more information please refer to Figure 4.
Calculation or measurement procedures
Extraction of aggregate material is commonly measured at source.
Reporting guidance
Aggregates should be reported in metric tonnes extracted per annum, broken down bytype of aggregate.
36 http://www.eurogeosurveys.org/foregs/groups/group_2_raport_2001_a1.htm

Chapter 4
60
KPI 21 Forestry
Definition
This KPI focuses on timber and the harvesting of various wood products. Although forestryand wood are often considered renewable resources over-exploitation of these resources,especially from plantations which are not sustainably managed, threatens the environmentas a whole and in particular biodiversity. Although many governments have taken measuresto encourage sustainable forest management and tackle illegal logging, including supportingcertification schemes and reducing the exploitation of forests, illegal logging continues tobe a problem in many timber-producing countries particularly in the developing world. Theecological functions of forests are highly valuable (genetic, species and ecosystem diversity)and should be maintained. Harvesting and appropriate use of timber from legal or sustainablymanaged forests may be a positive indicator of environmental performance.
Processes
Resource depletion of forestry arises as a result of the unsustainable harvesting of forests.
Sectors
Every operation that harvests wood, including operations that clear forests to change the land use (the primary ISIC sector type is “Forestry, logging and related activities”). For more information please refer to Figure 4.
Calculation or measurement procedures
Forest management operations should monitor the environmental impacts of their operationson a regular basis and should measure the volume of wood harvested, including waste andresidues. The frequency and intensity of monitoring will depend on the scale and intensityof the operation.
Reporting guidance
Harvested timbers and other wood products, as well as residues of harvesting, should be reported in absolute cubic metres per annum by type of wood (prior to any dryingprocess). The geographical area that the wood was sourced from (check whether felling is permitted in that area and if there are any restrictions on felling), and any evidence of whether the wood was sourced from legal or sustainably managed forests, should alsobe reported.
Reporters may also find it useful to state whether the species harvested is listed on theConvention on International Trade in Endangered Species of Wild Fauna and Flora (CITES).

Chapter 4
61
KPI 22 Agricultural Produce
Definition
Agricultural produce37 includes a wide variety of products including foodstuffs such as meatand fish, tobacco, rubber and other crops that form the raw materials of many products.Harvesting of wood is not addressed here as it is covered by the Forestry KPI (KPI 21).
Over-exploitation of environmental resources can have a negative environmental impactand can lead to depletion of resources in the long term. For example, open access fishingzones, where property rights are not specifically assigned to any organisation, often resultin a race to harvest the resource, which can significantly reduce the fishing stock. As aresult, many fish stocks in EU waters are severely depleted and appear to be outside safebiological limits38. When a property right is exercised on animal or fish farms, however, the owner’s preference is usually to extract the resource with restraint. Companies thatharvest crops, botanical and zoological resources are encouraged to report on their use ofthe natural resources and often do so. Consuming resources at a sustainable rate ensuresthat stocks do not decline, and therefore continue to provide food and other amenities.
Processes
There are many types of fishing carried out on a large scale, harvesting a huge variety of fish and aquatic mammals. On land, there are many different ways of growing and harvesting agricultural and animal produce, from intensive farming techniques to freerange and organic methods. These different ways of growing and harvesting will have very different impacts on the environment, including on local biodiversity.
Sectors
Every operation that harvests agricultural produce (the primary ISIC sector types are “Fishing,aquaculture and service activities incidental to fishing, growing of crops, market gardeningand horticulture, farming of Animals”). For more information please refer to Figure 4.
Calculation or measurement procedures
Sellers of agricultural resources are likely to collect data on the types and amounts of resources its company produces or extracts and should therefore be able to measure the overall quantities produced on a yearly basis. Crops, botanical and zoological resourcesshould be regularly weighed as this will provide clear and reliable data on agriculturalresource use.
37 For the purposes of these Guidelines, agricultural produce includes any product harvested from land or water, excluding wood which is captured by a separate Forestry KPI.
38 Please refer to the European Environment Agency website for further information:http://themes.eea.eu.int/Sectors_and_activities/fishery/
Chapter 4
62
Reporting guidance
Extracted or sold agricultural resources should be reported in metric tonnes extracted perannum, and broken down into type of resource or species. The wet weight of the resourceshould be reported, prior to any drying process.
4.5 Supply Chains
Most business will have supply chain impacts that they should understand and considerreporting. There is no single, quantifiable measure that companies can use as a KPI for the effect of their upstream supply chain on the environment. Businesses can, however, use the environmental information that suppliers report in order to make better procurement decisions.
Many businesses have significant supply chain impacts and will wish to engage with theirsuppliers to reduce their environmental impacts. The following is an example of a strategicprocess that can be used to determine the impacts upstream in the supply chain. This is:
1. Determine which companies your business spends its money with. This informationshould be contained within the company’s purchase ledger.
2. Categorise your expenditure into sector groupings by ISIC code where possible (see Figure 4).
3. Assess the typical environmental impacts and risks each supplier sector has. Refer to Figure 4 for a list of KPIs by sector.
4. Determine where to focus your efforts. Clearly some suppliers, even suppliers in thesame sector, have more significant environmental impacts than others. It is important to prioritise your suppliers in a way that takes into account both the amount of moneyyou spend with them and the relative environmental impact they have. This is especiallyimportant for companies with a significant number of suppliers.
5. Engage with your suppliers. Encourage your suppliers to report on the environmentalKPIs relevant to their sector.
6. Establish a process enabling suppliers to record, measure and report back on their environmental impact.
7. Influence purchasing decisions with the information gathered. Improvements in your suppliers’ environmental performance will be more likely if they know that their environmental performance is a factor in your company’s buying decisions.
8. Consider post-contract supplier development to focus on engaging suppliers in continuous improvement in environmental management.

Chapter 4
63
These Guidelines highlight which supplier sectors have the most significant environmentalimpact for a given buyer sector. This can provide valuable information to inform a strategicassessment of where, in a company’s supply chain, the most significant environmentalimpacts are occurring (See Figure 4, Significant Supplier Industries column).
These supplier sectors have been determined by assessing which supplier industries arelikely to have a significant environmental impact given the typical amount of products or services that a given sector buys39. Organisations can consider whether environmentally significant suppliers have also measured and reported relevant environmental KPIs. This willhelp ensure that the environmental performance of the supply chain as a whole is understoodand improved and that environmental impacts are not simply displaced elsewhere.
Energy and water use
Some companies will wish to report their indirect energy and water use impacts as part of their supply chain performance. As described in KPIs 1 and 14, these should be reportedseparately from direct impacts.
For example, over 70 per cent of UK electricity is generated from fossil fuels40. Businessesthat consume a large amount of electricity will be indirectly responsible for significant GHGemissions. These emissions should be reported separately from the GHG that companiesemit directly as described in KPI 1. Greenhouse gas emissions from electricity consumptioncan be calculated in two ways: asking the supplier of the electricity or calculating the emissions based on the standard factor for UK grid electricity.
Businesses that have been supplied by an electricity company that has an atypical generation mix, or has been supplied with a renewables tariff, can engage the supplier (or suppliers) so that indirect greenhouse emissions can be accurately estimated.
If you have not defined any special requirements with regard to your electricity supply (i.e. you are supplied standard grid electricity) it may be more appropriate and easier to useDefra’s standard electricity generation factor to estimate emissions from kWh of electricityconsumed. More guidance on standard conversion factors can be found on Defra’s website,in the annex sections of Defra’s Guidelines for Company Reporting on Greenhouse GasEmissions, at: http://www.defra.gov.uk/environment/business/reporting/conversion-factors.htm
If you have operations outside of the UK that are supplied electricity, you can apply theappropriate conversion factor for each country, as different countries have different generation mixes. The United Nations Conference on Trade and Development (UNCTAD)has published guidance on standard emission factors for each country, which is availablefrom their website41.
39 This analysis makes use of Government Input-Output tables, and enabled an assessment of the typical purchases a given sector makes.
40 http://www.dti.gov.uk/energy/inform/energy/stats/electricity/index.shtml41 A Manual for the Preparers and Users of Eco-efficiency Indicators. UNCTAD, 2004. http://www.unctad.org

Chapter 4
64
Nearly every business is supplied water, and water use can be relatively easily measured.Measurements can be obtained by automatic meter readings or by periodically reviewingbills provided by water suppliers. Alternatively, companies can contact their water supplierdirectly if this information is not readily available.
4.6 Products
These Guidelines do not attempt to suggest KPIs for the downstream impacts of products– the individual product streams are too numerous and the impacts too diverse to offersolutions that can sensibly fit all these different circumstances. The techniques of assessinglife cycle impacts of products and subsequent eco-design solutions for more sustainableproducts, are not as well established as in other disciplines of environmental performance – though the Government will be consulting on ways in which these product-related disciplines could be embedded more strongly in business, professions and policy-making.
Meanwhile, however, there is a great deal that individual sectors or businesses can do toidentify the key performance issues for their downstream impacts.
1. First, the assessment of relevant impacts need not involve complicated life-cycle analysesof a particular product. Often there is much that can be done by a common-sense lookat key phases of the product’s life, including end-of-life impacts. Impacts can be calculated by multiplying impacts per unit, multiplied up by the number of units sold:
• The distribution phase. Is there a significant amount of energy involved in getting the product to its markets – either because of its volume, or weight or distances covered?
• The use phase. Does the product consume energy or water when operated by theconsumer? Does the product (or materials that may be used with it) give rise toemissions to land, air or water?
• The end-of-life phase. Is the product routinely re-used, recovered or recycled? Or if the product enters the waste stream (which generally means going to landfill), willthe product continue to have negative environmental impacts i.e. is the productbiodegradable or does the product have the potential to be hazardous?
2. Secondly, in the light of the indicators suggested by this kind of assessment, performance measures can be developed as goals for future product design. For example:
Can the material inputs to the product be further reduced?
• Can the product be designed to use less energy and water when is use. Can theproduct be designed to produce less waste? Can any other impacts associated with the product’s use by the consumer be reduced, through design features of better information?
Chapter 4
65
• Can the product be readily recovered and recycled as things stand, or are theredesign or business practice changes which would enable easier disassembly, or higherrates of recycling, or lower hazards in the waste stream?
An increasing amount of Governmental effort is being applied in this latter area of frameworks and incentives, so the expectations for a business response are bound to rise.Chapter 3 of the Government’s Sustainable Development Strategy, Securing the Future,outlines the actions that will be required – from Government, business and consumers – to make the consumption and production of goods and services more sustainable. As a member of the European Single Market, the UK is restricted in the actions it can takeunilaterally to establish environmental standards for products, where these might create a barrier to trade. However, it is increasingly clear that EU environmental policy and regulations are focusing on manufacturers and the products they make. Already Directiveson packaging, on the Restriction of Hazardous Substances (RoHS) in electrical and electronic equipment on Waste Electrical and Electronic Equipment (WEEE), and on End-of-Life Vehicles (ELV) all seek to return responsibility for the environmental impacts of products to manufacturers. These are powerful incentives for manufacturers to engagewith their supply chains, to ensure that components and materials do not contain hazardous substances above permitted levels. In future, it is inevitable that more manufacturers will need to develop closer working relationships with their suppliers to ensure that they meet mandatory requirements.
Looking ahead, the European Commission’s Communication on Integrated Product Policy(IPP) sets out the ways in which voluntary and mandatory measures might be used toimprove the environmental profile of products. This overarching strategy, together withspecific new measures such as the framework Directive on the Eco-design of Energy-usingProducts (EuP), will encourage new products to be developed which have less impact onthe environment.

Chapter 4
66
ISIC
Sect
or
42Si
gn
ific
ant
Dir
ect
Key
Perf
orm
ance
Ind
icat
ors
43
12
34
5
Oth
erD
irec
tK
eyPe
rfo
rman
ceIn
dic
ato
rs
Sig
nif
ican
tSu
pp
lier
Ind
ust
ries
Pag
eN
um
ber
(s)
Page
num
bers
corr
espo
ndto
the
orde
rK
PIs
appe
arin
the
colu
mns
Act
iviti
esau
xilia
ryto
finan
cial
inte
rmed
iatio
n
Gre
enho
use
Gas
esEl
ectr
icity
,ga
s,st
eam
and
hot
wat
ersu
pply
;A
irtr
ansp
ort;
Col
lect
ion,
purif
icat
ion
and
dist
ribut
ion
ofw
ater
28
Act
iviti
esof
mem
bers
hip
orga
nisa
tions
Gre
enho
use
Gas
esEl
ectr
icity
,ga
s,st
eam
and
hot
wat
ersu
pply
;Pu
blis
hing
,pr
intin
gan
dre
prod
uctio
nof
reco
rded
med
ia;
Sew
age
and
refu
sedi
spos
al,
sani
tatio
nan
dsi
mila
rac
tiviti
es
28
Agr
icul
tura
land
anim
alhu
sban
dry
serv
ice
activ
ities
,ex
cept
vete
rinar
yac
tiviti
es
Gre
enho
use
Gas
esA
cid
Rain
&Sm
ogPr
ecur
sors
Farm
ing
ofA
nim
als;
Man
ufac
ture
ofch
emic
als
and
chem
ical
prod
ucts
;G
row
ing
ofcr
ops,
mar
ket
gard
enin
g&
hort
icul
ture
28,
33
Air
tran
spor
tG
reen
hous
eG
ases
Aci
dRa
in&
Smog
Prec
urso
rs
Was
teM
anuf
actu
reof
coke
,re
fined
petr
oleu
mpr
oduc
tsan
dnu
clea
rfu
el;
Elec
tric
ity,
gas,
stea
man
dho
tw
ater
supp
ly;
Supp
ortin
gan
dau
xilia
rytr
ansp
ort
activ
ities
;ac
tiviti
esof
trav
elag
enci
es
28,
33,
49
Col
lect
ion,
purif
icat
ion
and
dist
ribut
ion
ofw
ater
Wat
erA
bstr
actio
nG
reen
hous
eG
ases
Aci
dRa
in&
Smog
Prec
urso
rs
Nut
rient
s&
Org
anic
Pollu
tant
s
Elec
tric
ity,
gas,
stea
man
dho
tw
ater
supp
ly;
Man
ufac
ture
ofco
ke,
refin
edpe
trol
eum
prod
ucts
and
nucl
ear
fuel
;M
anuf
actu
reof
chem
ical
san
dch
emic
alpr
oduc
ts
53,
28,
33,
40
Com
pute
ran
dre
late
dac
tiviti
esG
reen
hous
eG
ases
Aci
dRa
in&
Smog
Prec
urso
rs
Elec
tric
ity,
gas,
stea
man
dho
tw
ater
supp
ly;
Air
tran
spor
t;Pu
blis
hing
,pr
intin
gan
dre
prod
uctio
nof
reco
rded
med
ia
28,
33
Fig
ure
4:D
irec
tK
eyPe
rfo
rman
ceIn
dic
ato
rsb
ySe
cto
rTy
pe
42In
tern
atio
nalS
tand
ard
Indu
stria
lCla
ssifi
catio
nC
ode.
43To
pfiv
edi
rect
Key
Perf
orm
ance
Indi
cato
rs.

Chapter 4
67
ISIC
Sect
or
42Si
gn
ific
ant
Dir
ect
Key
Perf
orm
ance
Ind
icat
ors
43
12
34
5
Oth
erD
irec
tK
eyPe
rfo
rman
ceIn
dic
ato
rs
Sig
nif
ican
tSu
pp
lier
Ind
ust
ries
Pag
eN
um
ber
(s)
Page
num
bers
corr
espo
ndto
the
orde
rK
PIs
appe
arin
the
colu
mns
Con
stru
ctio
nG
reen
hous
eG
ases
Wat
erA
bstr
actio
nA
cid
Rain
&Sm
ogPr
ecur
sors
Was
teM
anuf
actu
reof
coke
,re
fined
petr
oleu
mpr
oduc
tsan
dnu
clea
rfu
el;
Elec
tric
ity,
gas,
stea
man
dho
tw
ater
supp
ly;
Man
ufac
ture
ofot
her
non-
met
allic
min
eral
prod
ucts
28,
53,
33,
49
Educ
atio
nG
reen
hous
eG
ases
Was
teA
cid
Rain
&Sm
ogPr
ecur
sors
Elec
tric
ity,
gas,
stea
man
dho
tw
ater
supp
ly;
Col
lect
ion,
purif
icat
ion
and
dist
ribut
ion
ofw
ater
;A
irtr
ansp
ort
28,
49,
33
Elec
tric
ity,
gas,
stea
man
dho
tw
ater
supp
ly
Gre
enho
use
Gas
esW
aste
Aci
dRa
in&
Smog
Prec
urso
rs
Radi
oact
ive
Was
teW
ater
Abs
trac
tion
Met
alEm
issi
ons
toLa
ndM
etal
Emis
sion
sto
Air
Met
alEm
issi
ons
toW
ater
Min
ing
ofco
alan
dlig
nite
;ex
trac
tion
ofpe
at;
Extr
actio
nof
crud
epe
trol
eum
and
natu
ralg
as;
Man
ufac
ture
ofco
ke,
refin
edpe
trol
eum
prod
ucts
and
nucl
ear
fuel
28,
49,
33,
51,
53,
46,
39,
42
Extr
actio
nof
crud
epe
trol
eum
and
natu
ralg
as
Gre
enho
use
Gas
esW
ater
Abs
trac
tion
Aci
dRa
in&
Smog
Prec
urso
rs
Oil
Nat
ural
Gas
Was
teEl
ectr
icity
,ga
s,st
eam
and
hot
wat
ersu
pply
;M
anuf
actu
reof
coke
,re
fined
petr
oleu
mpr
oduc
tsan
dnu
clea
rfu
el;
Con
stru
ctio
n
28,
53,
33,
55,
54,
49
Farm
ing
ofA
nim
als
Wat
erA
bstr
actio
nPe
stic
ides
&Fe
rtili
sers
Gre
enho
use
Gas
esA
cid
Rain
&Sm
ogPr
ecur
sors
Agr
icul
tura
lPr
oduc
eG
row
ing
ofcr
ops,
mar
ket
gard
enin
g&
hort
icul
ture
;El
ectr
icity
,ga
s,st
eam
and
hot
wat
ersu
pply
;M
anuf
actu
reof
food
prod
ucts
and
beve
rage
s
53,
45,
28,
33,
61
Fina
ncia
lin
term
edia
tion,
exce
ptin
sura
nce
and
pens
ion
fund
ing
Gre
enho
use
Gas
esW
aste
Elec
tric
ity,
gas,
stea
man
dho
tw
ater
supp
ly;
Col
lect
ion,
purif
icat
ion
and
dist
ribut
ion
ofw
ater
;Pu
blis
hing
,pr
intin
gan
dre
prod
uctio
nof
reco
rded
med
ia
28,
49
Fish
ing,
aqua
cultu
rean
dse
rvic
eac
tiviti
esin
cide
ntal
tofis
hing
Gre
enho
use
Gas
esA
cid
Rain
&Sm
ogPr
ecur
sors
Agr
icul
tura
lPr
oduc
eFa
rmin
gof
anim
als;
Agr
icul
tura
land
anim
alhu
sban
dry
serv
ice
activ
ities
,ex
cept
vete
rinar
yac
tiviti
es;
Gro
win
gof
crop
s,m
arke
tga
rden
ing
&ho
rtic
ultu
re
28,
33,
61
42In
tern
atio
nalS
tand
ard
Indu
stria
lCla
ssifi
catio
nC
ode.
43To
pfiv
edi
rect
Key
Perf
orm
ance
Indi
cato
rs.

Chapter 4
68
ISIC
Sect
or
42Si
gn
ific
ant
Dir
ect
Key
Perf
orm
ance
Ind
icat
ors
43
12
34
5
Oth
erD
irec
tK
eyPe
rfo
rman
ceIn
dic
ato
rs
Sig
nif
ican
tSu
pp
lier
Ind
ust
ries
Pag
eN
um
ber
(s)
Page
num
bers
corr
espo
ndto
the
orde
rK
PIs
appe
arin
the
colu
mns
Fore
stry
,lo
ggin
gan
dre
late
dse
rvic
eac
tiviti
es
Fore
stry
Gre
enho
use
Gas
esFa
rmin
gof
anim
als;
Gro
win
gof
crop
s,m
arke
tga
rden
ing
&ho
rtic
ultu
re;
Agr
icul
tura
lan
dan
imal
husb
andr
yse
rvic
eac
tiviti
es,
exce
ptve
terin
ary
activ
ities
60,
28
Gro
win
gof
crop
s,m
arke
tga
rden
ing
and
hort
icul
ture
Wat
erA
bstr
actio
nG
reen
hous
eG
ases
Pest
icid
es&
Fert
ilise
rsA
gric
ultu
ral
Prod
uce
Aci
dRa
in&
Smog
Prec
urso
rs
Man
ufac
ture
ofch
emic
als
and
chem
ical
prod
ucts
;C
olle
ctio
n,pu
rific
atio
nan
ddi
strib
utio
nof
wat
er;
Elec
tric
ity,
gas,
stea
man
dho
tw
ater
supp
ly
53,
28,
45,
61,
33
Hea
lthan
dso
cial
wor
kG
reen
hous
eG
ases
Was
teEl
ectr
icity
,ga
s,st
eam
and
hot
wat
ersu
pply
;M
anuf
actu
reof
chem
ical
san
dch
emic
alpr
oduc
ts;
Publ
ishi
ng,
prin
ting
and
repr
oduc
tion
ofre
cord
edm
edia
28,
49
Hot
els
and
rest
aura
nts
Gre
enho
use
Gas
esW
aste
Elec
tric
ity,
gas,
stea
man
dho
tw
ater
supp
ly;
Col
lect
ion,
purif
icat
ion
and
dist
ribut
ion
ofw
ater
;G
row
ing
ofcr
ops,
mar
ket
gard
enin
g&
hort
icul
ture
28,
49
Insu
ranc
ean
dpe
nsio
nfu
ndin
g,ex
cept
com
puls
ory
soci
alse
curit
y
Gre
enho
use
Gas
esA
irtr
ansp
ort;
Publ
ishi
ng,
prin
ting
and
repr
oduc
tion
ofre
cord
edm
edia
;El
ectr
icity
,ga
s,st
eam
and
hot
wat
ersu
pply
28
Land
tran
spor
tan
dtr
ansp
ort
via
pipe
lines
Gre
enho
use
Gas
esA
cid
Rain
&Sm
ogPr
ecur
sors
Was
teM
anuf
actu
reof
coke
,re
fined
petr
oleu
mpr
oduc
tsan
dnu
clea
rfu
el;
Extr
actio
nof
crud
epe
trol
eum
and
natu
ralg
as;
Elec
tric
ity,
gas,
stea
man
dho
tw
ater
supp
ly
28,
33,
49
Man
ufac
ture
ofba
sic
met
als
Wat
erA
bstr
actio
nM
etal
Emis
sion
sto
Land
Gre
enho
use
Gas
esW
aste
Met
alEm
issi
ons
toA
ir
Aci
dRa
in&
Smog
Prec
urso
rs
Elec
tric
ity,
gas,
stea
man
dho
tw
ater
supp
ly;
Min
ing
ofm
etal
ores
;M
anuf
actu
reof
coke
,re
fined
petr
oleu
mpr
oduc
tsan
dnu
clea
rfu
el
53,
46,
28,
49,
39,
33
42In
tern
atio
nalS
tand
ard
Indu
stria
lCla
ssifi
catio
nC
ode.
43To
pfiv
edi
rect
Key
Perf
orm
ance
Indi
cato
rs.

Chapter 4
69
ISIC
Sect
or
42Si
gn
ific
ant
Dir
ect
Key
Perf
orm
ance
Ind
icat
ors
43
12
34
5
Oth
erD
irec
tK
eyPe
rfo
rman
ceIn
dic
ato
rsSi
gn
ific
ant
Sup
plie
rIn
du
stri
esPa
ge
Nu
mb
er(s
)Pa
genu
mbe
rsco
rres
pond
toth
eor
der
KPI
sap
pear
inth
eco
lum
ns
Man
ufac
ture
ofch
emic
als
and
chem
ical
prod
ucts
Wat
erA
bstr
actio
nG
reen
hous
eG
ases
Met
alEm
issi
ons
toLa
nd
Was
teVo
latil
eO
rgan
icC
ompo
unds
Met
alEm
issi
ons
toA
ir
Ozo
neD
eple
ting
Subs
tanc
es
Nut
rient
s&
Org
anic
Pollu
tant
s
Aci
dRa
in&
Smog
Prec
urso
rs
Elec
tric
ity,
gas,
stea
man
dho
tw
ater
supp
ly;
Man
ufac
ture
ofco
ke,
refin
edpe
trol
eum
prod
ucts
and
nucl
ear
fuel
;La
ndtr
ansp
ort
&tr
ansp
ort
via
pipe
lines
53,
28,
46,
49,
38,
39,
37,
40,
33
Man
ufac
ture
ofco
ke,
refin
edpe
trol
eum
prod
ucts
and
nucl
ear
fuel
Gre
enho
use
Gas
esW
ater
Abs
trac
tion
Met
alEm
issi
ons
toLa
nd
Aci
dRa
in&
Smog
Prec
urso
rsW
aste
Met
alEm
issi
ons
toA
irRa
dioa
ctiv
eW
aste
Man
ufac
ture
ofba
sic
met
als;
Elec
tric
ity,
gas,
stea
man
dho
tw
ater
supp
ly;
Man
ufac
ture
ofch
emic
als
and
chem
ical
prod
ucts
28,
53,
46,
33,
49,
39,
51
Man
ufac
ture
ofel
ectr
ical
mac
hine
ryan
dap
para
tus
Wat
erA
bstr
actio
nG
reen
hous
eG
ases
Met
alEm
issi
ons
toLa
nd
Man
ufac
ture
ofco
ke,
refin
edpe
trol
eum
prod
ucts
and
nucl
ear
fuel
;M
anuf
actu
reof
basi
cm
etal
s;El
ectr
icity
,ga
s,st
eam
and
hot
wat
ersu
pply
53,
28,
46
Man
ufac
ture
offa
bric
ated
met
alpr
oduc
ts,
exce
ptm
achi
nery
and
equi
pmen
t
Gre
enho
use
Gas
esW
ater
Abs
trac
tion
Was
teA
cid
Rain
&Sm
ogPr
ecur
sors
Man
ufac
ture
ofco
ke,
refin
edpe
trol
eum
prod
ucts
and
nucl
ear
fuel
;M
anuf
actu
reof
basi
cm
etal
s;El
ectr
icity
,ga
s,st
eam
and
hot
wat
ersu
pply
28,
53,
49,
33
Man
ufac
ture
offo
odpr
oduc
tsan
dbe
vera
ges
Wat
erA
bstr
actio
nG
reen
hous
eG
ases
Was
teA
cid
Rain
&Sm
ogPr
ecur
sors
Nut
rient
s&
Org
anic
Pollu
tant
s
Farm
ing
ofan
imal
s;G
row
ing
ofcr
ops,
mar
ket
gard
enin
g&
hort
icul
ture
;El
ectr
icity
,ga
s,st
eam
and
hot
wat
ersu
pply
53,
28,
49,
33,
40
Man
ufac
ture
offu
rnitu
re;
Man
ufac
turin
g
Gre
enho
use
Gas
esW
aste
Wat
erA
bstr
actio
nA
cid
Rain
&Sm
ogPr
ecur
sors
Man
ufac
ture
ofco
ke,
refin
edpe
trol
eum
prod
ucts
and
nucl
ear
fuel
;M
anuf
actu
reof
text
iles;
Elec
tric
ity,
gas,
stea
man
dho
tw
ater
supp
ly
28,
49,
53,
33
42In
tern
atio
nalS
tand
ard
Indu
stria
lCla
ssifi
catio
nC
ode.
43To
pfiv
edi
rect
Key
Perf
orm
ance
Indi
cato
rs.

Chapter 4
70
ISIC
Sect
or
42Si
gn
ific
ant
Dir
ect
Key
Perf
orm
ance
Ind
icat
ors
43
12
34
5
Oth
erD
irec
tK
eyPe
rfo
rman
ceIn
dic
ato
rs
Sig
nif
ican
tSu
pp
lier
Ind
ust
ries
Pag
eN
um
ber
(s)
Page
num
bers
corr
espo
ndto
the
orde
rK
PIs
appe
arin
the
colu
mns
Man
ufac
ture
ofm
achi
nery
and
equi
pmen
t
Gre
enho
use
Gas
esW
ater
Abs
trac
tion
Was
teM
etal
Emis
sion
sto
Land
Man
ufac
ture
ofco
ke,
refin
edpe
trol
eum
prod
ucts
and
nucl
ear
fuel
;El
ectr
icity
,ga
s,st
eam
and
hot
wat
ersu
pply
;M
anuf
actu
reof
chem
ical
san
dch
emic
alpr
oduc
ts
28,
53,
49,
46
Man
ufac
ture
ofm
edic
al,p
reci
sion
and
optic
alin
stru
men
ts,
wat
ches
and
cloc
ks
Gre
enho
use
Gas
esA
cid
Rain
&Sm
ogPr
ecur
sors
Wat
erA
bstr
actio
nW
aste
Elec
tric
ity,
gas,
stea
man
dho
tw
ater
supp
ly;
Man
ufac
ture
ofco
ke,
refin
edpe
trol
eum
prod
ucts
and
nucl
ear
fuel
;M
anuf
actu
reof
basi
cm
etal
s
28,
33,
53,
49
Man
ufac
ture
ofm
otor
vehi
cles
,tr
aile
rsan
dse
mi-t
raile
rs
Gre
enho
use
Gas
esW
ater
Abs
trac
tion
Was
teM
anuf
actu
reof
coke
,re
fined
petr
oleu
mpr
oduc
tsan
dnu
clea
rfu
el;
Man
ufac
ture
ofba
sic
met
als;
Elec
tric
ity,
gas,
stea
man
dho
tw
ater
supp
ly
28,
53,
49
Man
ufac
ture
ofof
fice,
acco
untin
gan
dco
mpu
ting
mac
hine
ry
Gre
enho
use
Gas
esW
ater
Abs
trac
tion
Was
teM
etal
Emis
sion
sto
Land
Man
ufac
ture
ofco
ke,
refin
edpe
trol
eum
prod
ucts
and
nucl
ear
fuel
;El
ectr
icity
,ga
s,st
eam
and
hot
wat
ersu
pply
;M
anuf
actu
reof
othe
rno
n-m
etal
licm
iner
alpr
oduc
ts
28,
53,
49,
46
Man
ufac
ture
ofot
her
non-
met
allic
min
eral
prod
ucts
Gre
enho
use
Gas
esA
cid
Rain
&Sm
ogPr
ecur
sors
Was
teM
etal
Emis
sion
sto
Air
Met
alEm
issi
ons
toLa
nd
Wat
erA
bstr
actio
nEl
ectr
icity
,ga
s,st
eam
and
hot
wat
ersu
pply
;M
inin
gof
coal
and
ligni
te;
extr
actio
nof
peat
;O
ther
min
ing
and
quar
ryin
g
28,
33,
49,
39,
46,
53
Man
ufac
ture
ofot
her
tran
spor
teq
uipm
ent
Gre
enho
use
Gas
esW
ater
Abs
trac
tion
Was
teM
anuf
actu
reof
coke
,re
fined
petr
oleu
mpr
oduc
tsan
dnu
clea
rfu
el;
Elec
tric
ity,
gas,
stea
man
dho
tw
ater
supp
ly;
Man
ufac
ture
ofba
sic
met
als
28,
53,
49
Man
ufac
ture
ofpa
per
and
pape
rpr
oduc
ts
Wat
erA
bstr
actio
nG
reen
hous
eG
ases
Was
teVo
latil
eO
rgan
icC
ompo
unds
Aci
dRa
in&
Smog
Prec
urso
rs
Met
alEm
issi
ons
toLa
nd
Met
alEm
issi
ons
toW
ater
Nut
rient
s&
Org
anic
Pollu
tant
s
Elec
tric
ity,
gas,
stea
man
dho
tw
ater
supp
ly;
Min
ing
ofco
alan
dlig
nite
;ex
trac
tion
ofpe
at;
Man
ufac
ture
ofch
emic
als
and
chem
ical
prod
ucts
53,
28,
49,
38,
33,
46,
42,
40
42In
tern
atio
nalS
tand
ard
Indu
stria
lCla
ssifi
catio
nC
ode.
43To
pfiv
edi
rect
Key
Perf
orm
ance
Indi
cato
rs.

Chapter 4
71
ISIC
Sect
or
42Si
gn
ific
ant
Dir
ect
Key
Perf
orm
ance
Ind
icat
ors
43
12
34
5
Oth
erD
irec
tK
eyPe
rfo
rman
ceIn
dic
ato
rs
Sig
nif
ican
tSu
pp
lier
Ind
ust
ries
Pag
eN
um
ber
(s)
Page
num
bers
corr
espo
ndto
the
orde
rK
PIs
appe
arin
the
colu
mns
Man
ufac
ture
ofra
dio,
tele
visi
onan
dco
mm
unic
atio
neq
uipm
ent
and
appa
ratu
s
Gre
enho
use
Gas
esW
ater
Abs
trac
tion
Met
alEm
issi
ons
toLa
nd
Was
teEl
ectr
icity
,ga
s,st
eam
and
hot
wat
ersu
pply
;M
anuf
actu
reof
chem
ical
san
dch
emic
alpr
oduc
ts;
Man
ufac
ture
ofba
sic
met
als
28,
53,
46,
49
Man
ufac
ture
ofte
xtile
sW
ater
Abs
trac
tion
Gre
enho
use
Gas
esA
cid
Rain
&Sm
ogPr
ecur
sors
Was
teN
utrie
nts
&O
rgan
icPo
lluta
nts
Elec
tric
ity,
gas,
stea
man
dho
tw
ater
supp
ly;
Gro
win
gof
crop
s,m
arke
tga
rden
ing
&ho
rtic
ultu
re;
Farm
ing
ofA
nim
als
53,
28,
33,
49,
40
Man
ufac
ture
ofto
bacc
opr
oduc
tsW
ater
Abs
trac
tion
Was
teG
reen
hous
eG
ases
Gro
win
gof
crop
s,m
arke
tga
rden
ing
&ho
rtic
ultu
re;
Min
ing
ofco
alan
dlig
nite
;ex
trac
tion
ofpe
at;
Elec
tric
ity,
gas,
stea
man
dho
tw
ater
supp
ly
53,
49,
28
Man
ufac
ture
ofw
ood
and
ofpr
oduc
tsof
woo
dan
dco
rk,
exce
ptfu
rnitu
re;
Man
ufac
ture
ofar
ticle
sof
stra
wan
dpl
aitin
gm
ater
ials
Gre
enho
use
Gas
esW
aste
Aci
dRa
in&
Smog
Prec
urso
rs
Vola
tile
Org
anic
Com
poun
ds
Elec
tric
ity,
gas,
stea
man
dho
tw
ater
supp
ly;
Fore
stry
,lo
ggin
gan
dre
late
dse
rvic
eac
tiviti
es;
Land
tran
spor
t&
tran
spor
tvi
api
pelin
es
28,
49,
33,
38
Min
ing
ofco
alan
dlig
nite
;Ex
trac
tion
ofpe
at
Coa
lG
reen
hous
eG
ases
Wat
erA
bstr
actio
nM
etal
Emis
sion
sto
Land
Aci
dRa
in&
Smog
Prec
urso
rs
Was
teEl
ectr
icity
,ga
s,st
eam
and
hot
wat
ersu
pply
;O
ther
min
ing
and
quar
ryin
g;M
anuf
actu
reof
coke
,re
fined
petr
oleu
mpr
oduc
tsan
dnu
clea
rfu
el
57,
28,
53,
46,
33,
49
Min
ing
ofm
etal
ores
Met
als
Wat
erA
bstr
actio
nM
etal
Emis
sion
sto
Air
Gre
enho
use
Gas
esM
etal
Emis
sion
sto
Wat
er
Aci
dRa
in&
Smog
Prec
urso
rs
Met
alEm
issi
ons
toLa
nd
Was
te
Pest
icid
es&
Fert
ilise
rs
Elec
tric
ity,
gas,
stea
man
dho
tw
ater
supp
ly;
Man
ufac
ture
ofco
ke,
refin
edpe
trol
eum
prod
ucts
and
nucl
ear
fuel
;M
anuf
actu
reof
coke
,re
fined
petr
oleu
mpr
oduc
tsan
dnu
clea
rfu
el
56,
53,
39,
28,
42,
33,
46,
49,
45
42In
tern
atio
nalS
tand
ard
Indu
stria
lCla
ssifi
catio
nC
ode.
43To
pfiv
edi
rect
Key
Perf
orm
ance
Indi
cato
rs.

Chapter 4
72
ISIC
Sect
or
42Si
gn
ific
ant
Dir
ect
Key
Perf
orm
ance
Ind
icat
ors
43
12
34
5
Oth
erD
irec
tK
eyPe
rfo
rman
ceIn
dic
ato
rs
Sig
nif
ican
tSu
pp
lier
Ind
ust
ries
Pag
eN
um
ber
(s)
Page
num
bers
corr
espo
ndto
the
orde
rK
PIs
appe
arin
the
colu
mns
Oth
erbu
sine
ssac
tiviti
es(le
gal,
acco
untin
g,m
anag
emen
tco
nsul
ting,
adm
inis
trat
ive
etc)
Gre
enho
use
Gas
esW
aste
Elec
tric
ity,
gas,
stea
man
dho
tw
ater
supp
ly;
Air
tran
spor
t;C
olle
ctio
n,pu
rific
atio
nan
ddi
strib
utio
nof
wat
er
28,
49
Oth
erm
inin
gan
dqu
arry
ing
Agg
rega
tes
Wat
erA
bstr
actio
nM
iner
als
Gre
enho
use
Gas
esA
cid
Rain
&Sm
ogPr
ecur
sors
Dus
tan
dPa
rtic
les
Was
te
Elec
tric
ity,
gas,
stea
man
dho
tw
ater
supp
ly;
Min
ing
ofco
alan
dlig
nite
;ex
trac
tion
ofpe
at;
Man
ufac
ture
ofco
ke,
refin
edpe
trol
eum
prod
ucts
and
nucl
ear
fuel
59,
53,
58,
28,
33,
35,
49
Oth
erse
rvic
eac
tiviti
es(la
undr
y,ha
irdre
ssin
gfu
nera
lse
rvic
eset
c)
Gre
enho
use
Gas
esEl
ectr
icity
,ga
s,st
eam
and
hot
wat
ersu
pply
;C
olle
ctio
n,pu
rific
atio
nan
ddi
strib
utio
nof
wat
er;
Farm
ing
ofA
nim
als
28
Post
and
cour
ier
activ
ities
Gre
enho
use
Gas
esW
aste
Man
ufac
ture
ofco
ke,
refin
edpe
trol
eum
prod
ucts
and
nucl
ear
fuel
;Se
wag
ean
dre
fuse
disp
osal
,sa
nita
tion
and
sim
ilar
activ
ities
;La
ndtr
ansp
ort
&tr
ansp
ort
via
pipe
lines
28,
49
Publ
icad
min
istr
atio
nan
dde
fenc
e;co
mpu
lsor
yso
cial
secu
rity
Gre
enho
use
Gas
esA
cid
Rain
&Sm
ogPr
ecur
sors
Elec
tric
ity,
gas,
stea
man
dho
tw
ater
supp
ly;
Col
lect
ion,
purif
icat
ion
and
dist
ribut
ion
ofw
ater
;A
irtr
ansp
ort
28,
33
Publ
ishi
ng,
prin
ting
and
repr
oduc
tion
ofre
cord
edm
edia
Gre
enho
use
Gas
esW
aste
Wat
erA
bstr
actio
nM
etal
Emis
sion
sto
Land
Aci
dRa
in&
Smog
Prec
urso
rs
Vola
tile
Org
anic
Com
poun
dsM
anuf
actu
reof
pape
ran
dpa
per
prod
ucts
;El
ectr
icity
,ga
s,st
eam
and
hot
wat
ersu
pply
;M
anuf
actu
reof
chem
ical
san
dch
emic
alpr
oduc
ts
28,
49,
53,
46,
33,
38
42In
tern
atio
nalS
tand
ard
Indu
stria
lCla
ssifi
catio
nC
ode.
43To
pfiv
edi
rect
Key
Perf
orm
ance
Indi
cato
rs.

Chapter 4
73
ISIC
Sect
or
42Si
gn
ific
ant
Dir
ect
Key
Perf
orm
ance
Ind
icat
ors
43
12
34
5
Oth
erD
irec
tK
eyPe
rfo
rman
ceIn
dic
ato
rs
Sig
nif
ican
tSu
pp
lier
Ind
ust
ries
Pag
eN
um
ber
(s)
Page
num
bers
corr
espo
ndto
the
orde
rK
PIs
appe
arin
the
colu
mns
Real
esta
teac
tiviti
esG
reen
hous
eG
ases
Was
teEl
ectr
icity
,ga
s,st
eam
and
hot
wat
ersu
pply
;C
olle
ctio
n,pu
rific
atio
nan
ddi
strib
utio
nof
wat
er;
Sew
age
and
refu
sedi
spos
al,
sani
tatio
nan
dsi
mila
rac
tiviti
es
28,
49
Recr
eatio
nal,
cultu
rala
ndsp
ortin
gac
tiviti
es
Gre
enho
use
Gas
esA
cid
Rain
&Sm
ogPr
ecur
sors
Was
teEl
ectr
icity
,ga
s,st
eam
and
hot
wat
ersu
pply
;C
olle
ctio
n,pu
rific
atio
nan
ddi
strib
utio
nof
wat
er;
Farm
ing
ofan
imal
s
28,
33,
49
Rent
ing
ofm
achi
nery
and
equi
pmen
tw
ith-
out
oper
ator
and
ofpe
rson
alan
dho
useh
old
good
s
Gre
enho
use
Gas
esA
cid
Rain
&Sm
ogPr
ecur
sors
Was
teM
anuf
actu
reof
coke
,re
fined
petr
oleu
mpr
oduc
tsan
dnu
clea
rfu
el;
Elec
tric
ity,
gas,
stea
man
dho
tw
ater
supp
ly;
Col
lect
ion,
purif
icat
ion
and
dist
ribut
ion
ofw
ater
28,
33,
49
Rese
arch
and
deve
lopm
ent
Gre
enho
use
Gas
esW
aste
Elec
tric
ity,
gas,
stea
man
dho
tw
ater
supp
ly;
Man
ufac
ture
ofot
her
non-
met
allic
min
eral
prod
ucts
;M
anuf
actu
reof
chem
ical
san
dch
emic
alpr
oduc
ts
28,
49
Reta
iltr
ade,
exce
ptof
mot
orve
hicl
esan
dm
otor
cycl
es;
Repa
irof
pers
onal
and
hous
ehol
dgo
ods
Gre
enho
use
Gas
esW
aste
Elec
tric
ity,
gas,
stea
man
dho
tw
ater
supp
ly;
Col
lect
ion,
purif
icat
ion
and
dist
ribut
ion
ofw
ater
;Se
wag
ean
dre
fuse
disp
osal
,sa
nita
tion
and
sim
ilar
activ
ities
28,
49
Sale
,m
aint
enan
cean
dre
pair
ofm
otor
vehi
cles
and
mot
orcy
cles
;Re
tail
sale
ofau
tom
otiv
efu
el
Gre
enho
use
Gas
esW
aste
Aci
dRa
in&
Smog
Prec
urso
rs
Elec
tric
ity,
gas,
stea
man
dho
tw
ater
supp
ly;
Col
lect
ion,
purif
icat
ion
and
dist
ribut
ion
ofw
ater
;M
anuf
actu
reof
mot
orve
hicl
es,
trai
lers
and
sem
i-tra
ilers
28,
49,
33
42In
tern
atio
nalS
tand
ard
Indu
stria
lCla
ssifi
catio
nC
ode.
43To
pfiv
edi
rect
Key
Perf
orm
ance
Indi
cato
rs.

Chapter 4
74
ISIC
Sect
or
42Si
gn
ific
ant
Dir
ect
Key
Perf
orm
ance
Ind
icat
ors
43
12
34
5
Oth
erD
irec
tK
eyPe
rfo
rman
ceIn
dic
ato
rs
Sig
nif
ican
tSu
pp
lier
Ind
ust
ries
Pag
eN
um
ber
(s)
Page
num
bers
corr
espo
ndto
the
orde
rK
PIs
appe
arin
the
colu
mns
Sew
age
and
refu
sedi
spos
al,
sani
tatio
nan
dsi
mila
rac
tiviti
es
Gre
enho
use
Gas
esM
etal
Emis
sion
sto
Land
Wat
erA
bstr
actio
nA
cid
Rain
&Sm
ogPr
ecur
sors
Nut
rient
s&
Org
anic
Pollu
tant
s
Met
alEm
issi
ons
toA
ir
Was
te
Elec
tric
ity,
gas,
stea
man
dho
tw
ater
supp
ly;
Col
lect
ion,
purif
icat
ion
and
dist
ribut
ion
ofw
ater
;M
anuf
actu
reof
chem
ical
san
dch
emic
alpr
oduc
ts
28,
46,
53,
33,
40,
39,
49
Supp
ortin
gan
dau
xilia
rytr
ansp
ort
activ
ities
;A
ctiv
ities
oftr
avel
agen
cies
Gre
enho
use
Gas
esA
cid
Rain
&Sm
ogPr
ecur
sors
Was
teEl
ectr
icity
,ga
s,st
eam
and
hot
wat
ersu
pply
;C
olle
ctio
n,pu
rific
atio
nan
ddi
strib
utio
nof
wat
er;
Publ
ishi
ng,
prin
ting
and
repr
oduc
tion
ofre
cord
edm
edia
28,
33,
49
Tann
ing
and
dres
sing
ofle
athe
r;M
anuf
actu
reof
lugg
age,
hand
bags
,sa
ddle
ry,
harn
ess
and
foot
wea
r
Gre
enho
use
Gas
esW
aste
Aci
dRa
in&
Smog
Prec
urso
rs
Nut
rient
s&
Org
anic
Pollu
tant
s
Man
ufac
ture
ofte
xtile
s;El
ectr
icity
,ga
s,st
eam
and
hot
wat
ersu
pply
;M
anuf
actu
reof
food
prod
ucts
and
beve
rage
s
28,
49,
33,
40
Tele
com
mun
icat
ions
Gre
enho
use
Gas
esA
cid
Rain
&Sm
ogPr
ecur
sors
Was
teEl
ectr
icity
,ga
s,st
eam
and
hot
wat
ersu
pply
;C
olle
ctio
n,pu
rific
atio
nan
ddi
strib
utio
nof
wat
er;P
ublis
hing
,prin
ting
and
repr
oduc
tion
ofre
cord
edm
edia
28,
33,
49
Wat
ertr
ansp
ort
Gre
enho
use
Gas
esA
cid
Rain
&Sm
ogPr
ecur
sors
Was
teM
anuf
actu
reof
coke
,re
fined
petr
oleu
mpr
oduc
tsan
dnu
clea
rfu
el;
Land
tran
spor
t&
tran
spor
tvi
api
pelin
es;
Elec
tric
ity,
gas,
stea
man
dho
tw
ater
supp
ly
28,
33,
49
42In
tern
atio
nalS
tand
ard
Indu
stria
lCla
ssifi
catio
nC
ode.
43To
pfiv
edi
rect
Key
Perf
orm
ance
Indi
cato
rs.

PB 11321
Nobel House, 17 Smith Square, London SW1P 3JR
www.defra.gov.uk