Embed Size (px)
Citation preview

ENVIRONMENT-BASED DESIGN (EBD) AND QUALITY FUNCTION
DEPLOYMENT (QFD) COMPARISON
Ronaldo Gutierrez
A Thesis
in
The Department
of
Concordia Institute for Information Systems Engineering
Presented in Partial Fulfillment of the Requirements
for the Degree of Master of Applied Science (Quality System Engineering) at
Concordia Institute for Information System Engineering
Montreal, Quebec, Canada
August 2012
© Ronaldo Gutierrez, 2012

CONCORDIA UNIVERSITY
School of Graduate Studies
This is to certify that the thesis prepared
By: Ronaldo Gutierrez
Entitled: Environment-Based Design (EBD) and Quality
Function Deployment (QFD) comparison
and submitted in partial fulfillment of the requirements for the degree of
Master of Applied Science (Quality System Engineering)
complies with the regulations of the University and meets the accepted standards with
respect to originality and quality.
Signed by the final committee
Dr. C. Wang Chair
Dr. Z. Tian Supervisor
Dr. Y. Zeng Supervisor
Dr. A. Awasthi Internal Examiner
Dr. Z. Chen External Examiner (BCEE)
Approved by
Chair of the Department of Graduate Program Director
13 August 2012
Dr. Robin Drew, Dean
Faculty of Engineering and Computer Science

iii
ABSTRACT
ENVIRONMENT-BASED DESIGN (EBD) AND QUALITY FUNCTION
DEPLOYMENT (QFD) COMPARISON
Ronaldo Gutierrez
Design is an important area to study because there is a continuous need to develop new,
cost-effective, and high-quality products. Customers and management always want that
the product to be designed is cheaper, better, and launched faster than previous ones. As a
result, product cost, quality, and time to market are three measures to determine the
effectiveness of the design process, and decisions made during the design process have a
great effect on them.
The previous facts besides the fact that many engineering students lack of the vast
experience required in the competitive labor market lead to the need of learning an
appropriate design methodology since the beginning of their studies in order to assist
them during the design process and to control design quality. The focus and scope of this
thesis is to compare two design methodologies, EBD (Environment-Based Design) and
QFD (Quality Function Deployment), covering from identifying customers’ requirements
until generating engineering requirements that satisfy the customer’s requirements of a
design problems. QFD is one of the most common used methodologies to support the
design process, and it is applied in a wide variety of services, consumer products, military
needs, emerging technology products, and for identifying and documenting competitive
marketing strategies and tactics. The motivation of the present thesis is to prove that
EBD, which is emerging and promising, can also be used to support the product
iv
definition process in addition to helping inexperience designers to cope with the
difficulties encountered in it, and to providing more complete results than by using QFD.
In order to evaluate and validate the previous hypothesis, a set of criteria are developed to
compare EBD and QFD, considering some of the parameters that show success in a
designed product such as quality, product life cycle and viability. A case study that
includes three different design problems is solved by using EBD and QFD, and the
obtained results are analyzed by three different evaluators in order to achieve reliable
results. Finally, after analyzing the experimental results of the case study, it is
preliminarily concluded that the thesis hypothesis cannot be rejected. EBD performs
better than QFD in overcoming the design difficulties, and achieving complete results
defining a new product.

v
ACKNOWLEDGEMENTS
I would like to thank my supervisors Dr. Yong Zeng and Dr. Zhigang Tian for their
support, knowledge, and patience that helped me to complete my thesis. Besides that, I
want to thank them for giving me the opportunity to collaborate in their research projects
and for believing in me.
I also want to express my gratitude to my colleagues who made this research possible due
to their collaboration and time dedication in this thesis.
I thank God who gave me strength and guided me during my thesis and studies.
I want to thank my lovely wife who helped me and dedicated her time in order to be able
to finish my Master program on time; I also want to thank her because she always pushes
me to continue and believes in me.
Last but not least, I want to thank my parents who supported me throughout my career,
and because with their effort I have been able to complete this important step in my life.

vi
Table of Contents
Table of Contents ............................................................................................................... vi
List of Figures .................................................................................................................... ix
List of Tables ................................................................................................................... xiv
Chapter 1: Introduction ................................................................................................... 1
1.1 Background .......................................................................................................... 1
1.2 Motivation ............................................................................................................ 4
1.3 Contribution ......................................................................................................... 5
1.4 Thesis Organization.............................................................................................. 6
Chapter 2: Literature review ........................................................................................... 7
2.1 Environment-Based Design (EBD) ...................................................................... 7
2.1.1 Recursive object model (ROM) ............................................................................. 11
2.1.2 Environment analysis ............................................................................................. 17
2.1.3 Conflict identification ............................................................................................ 23
2.1.4 Solution generation ................................................................................................ 24
2.2 Quality Function Deployment (QFD) ................................................................ 26
2.2.1 Identify the customers (who) ................................................................................. 29
2.2.2 Determine the customer’s requirements (What) .................................................... 30

vii
2.2.3 Determine relative importance of the requirements (who vs. what) ...................... 39
2.2.4 Identify and evaluate the competition (Now)......................................................... 40
2.2.5 Generate engineering specifications (how) ............................................................ 41
2.2.6 Relate customers’ requirements to engineering specifications (what vs. how) ..... 41
2.2.7 Set engineering targets (how much) ....................................................................... 42
2.2.8 Identify relationships between engineering requirements (how vs. how) .............. 43
2.2.9 Absolute importance .............................................................................................. 44
2.2.10 Further comments about QFD ................................................................................ 44
Chapter 3: EBD and QFD comparison ......................................................................... 46
3.1 EBD and QFD general comparison .................................................................... 46
3.2 EBD and QDF experimental comparison .......................................................... 49
3.2.1 Design problem descriptions .................................................................................. 50
3.2.2 Criteria of evaluation ............................................................................................. 60
3.2.3 Experiment analysis ............................................................................................... 62
3.2.4 Evaluation and summary of the analyzed results ................................................... 73
Chapter 4: Conclusions and Future Work .................................................................... 86
4.1 Conclusions ........................................................................................................ 86
4.2 Future work ........................................................................................................ 87

viii
Appendix ........................................................................................................................... 88
Appendix A ................................................................................................................... 88
Appendix B ................................................................................................................. 102
Appendix C ................................................................................................................. 106
Appendix D ................................................................................................................. 109
Bibliography ................................................................................................................... 125

ix
List of Figures
Figure 1: The Design Process (Ullman, 2010).................................................................... 1
Figure 2: Hierarchical object representation (Zeng, 2002) ................................................. 8
Figure 3: Product and its environment (Tan, et al., 2011) ................................................ 10
Figure 4: EBD process flow (Tan, et al., 2011) ................................................................ 10
Figure 5: Graphic symbol for object (Zeng, 2008) ........................................................... 11
Figure 6: Graphic symbol for a compound object (Zeng, 2008) ...................................... 12
Figure 7: Constraint relation (Zeng, 2008) ....................................................................... 12
Figure 8: Examples of constraint relation (Zeng, 2008) ................................................... 13
Figure 9: Connection relation (Zeng, 2008) ..................................................................... 13
Figure 10: Examples of connection relation (Zeng, 2008) ............................................... 14
Figure 11: Predicate relation (Zeng, 2008) ....................................................................... 14
Figure 12: Examples of predicate relation (Zeng, 2008) .................................................. 15
Figure 13: Elements of recursive object model (ROM) (Zeng, 2008) .............................. 16
Figure 14: Generic inquiry process for requirements elicitation (Wang & Zeng, 2009) .. 18
Figure 15: Seven events in a product life cycle (Chen & Zeng, 2006) ............................. 21
Figure 16: Eight level of requirements (Chen & Zeng, 2006) .......................................... 21

x
Figure 17: Three forms of existing conflicts in a ROM diagram (Tan, et al., 2011) ........ 24
Figure 18: Directed graph (Zeng, 2012) ........................................................................... 25
Figure 19: Adjacency matrix (Zeng, 2012)....................................................................... 26
Figure 20: QFD Steps (Ullman, 2003) .............................................................................. 27
Figure 21: The house of quality (HOQ) (Ullman, 2003) .................................................. 29
Figure 22: The Kano Model (Mazur, 1996)...................................................................... 31
Figure 23: Product life-cycle (Ullman, 2003) ................................................................... 37
Figure 24: Engineering specifications and customer’s requirements type of relationships
(Ullman, 2003) .................................................................................................................. 42
Figure 25: Engineering specifications type of relationships (Ullman, 2003) ................... 43
Figure 26: Overhead ventilation system ........................................................................... 53
Figure 27: Mixing dilution ventilation (left), and traditional ventilation duct systems
(right) ................................................................................................................................ 53
Figure 28: Mechanical structure of flooring system ......................................................... 55
Figure 29: Air circulation in hollow-cores and in walls. .................................................. 56
Figure 30: EBD solution for design problem 2 ................................................................. 64
Figure 31: QFD solution for design problem 2 (page 1) .................................................. 65
Figure 32: QFD solution for design problem 2 (page 2) .................................................. 66

xi
Figure 33: QFD solution for design problem 2 (page 3) .................................................. 67
Figure 35: EBD example, ROM of requirements description (Sun, et al., 2011) ............. 89
Figure 36: EBD example, Generic and domain specific questions (City of Edmonton,
Asset Management and Public Works, Drainage Services, 2004) .................................... 91
Figure 37: EBD example, Requirement classification (City of Edmonton, Asset
Management and Public Works, Drainage Services, 2004) ............................................. 92
Figure 38: EBD example, Updated ROM diagram (City of Edmonton, Asset Management
and Public Works, Drainage Services, 2004) ................................................................... 93
Figure 39: EBD example, Conflicts (Sun, et al., 2011) .................................................... 94
Figure 40: EBD example, Directed graph – Dependencies among conflicts (Sun, et al.,
2011) ................................................................................................................................. 95
Figure 41: EBD example, Adjacency matrix (Sun, et al., 2011) ...................................... 95
Figure 42: EBD example, Environment components in the monitoring system (Sun, et al.,
2011) ................................................................................................................................. 97
Figure 43: EBD example, Relations between environment components (Sun, et al., 2011)
........................................................................................................................................... 98
Figure 44: EBD example, Sequence of Monitoring Activities (Sun, et al., 2011) ......... 100
Figure 45: EBD example, Sample manual – manual for quality assurance (Sun, et al.,
2011) ............................................................................................................................... 101

xii
Figure 46: List of customer’s requirements for the BikeE suspension system (Ullman,
2003) ............................................................................................................................... 102
Figure 47: HOQ BikeE suspension system (Ullman, 2003) ........................................... 103
Figure 48: QFD solution for design problem 1 (page 1) ................................................ 109
Figure 49: QFD solution for design problem 1 (page 2) ................................................ 110
Figure 50: QFD solution for design problem 1 (page 2) ................................................ 111
Figure 51: QFD solution for design problem 3 (page 1) ................................................ 112
Figure 52: QFD solution for design problem 3 (page 2) ................................................ 113
Figure 53: QFD solution for design problem 3 (page 3) ................................................ 114
Figure 54: QFD solution for design problem 3 (page 4) ................................................ 115
Figure 55: QFD solution for design problem 3 (page 5) ................................................ 116
Figure 56: EBD solution for design problem 1 (page 1) ................................................ 117
Figure 57: EBD solution for design problem 1 (page 2) ................................................ 118
Figure 58: EBD solution for design problem 1 (page 3) ................................................ 119
Figure 59: EBD solution for design problem 1 (page 4) ................................................ 120
Figure 60: EBD solution for design problem 3 (page 1) ................................................ 121
Figure 61: EBD solution for design problem 3 (page 2) ................................................ 122

xiii
Figure 62: EBD solution for design problem 3 (page 3) ................................................ 123
Figure 63: EBD solution for design problem 3 (page 4) ................................................ 124
xiv
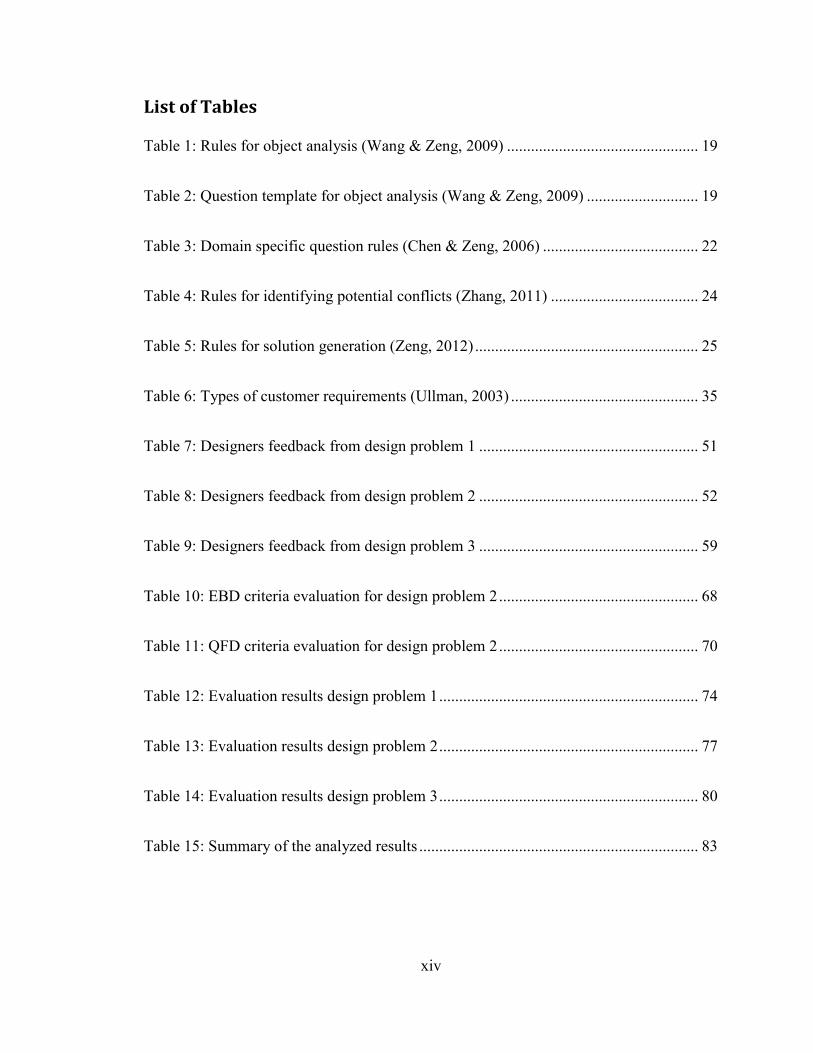
List of Tables
Table 1: Rules for object analysis (Wang & Zeng, 2009) ................................................ 19
Table 2: Question template for object analysis (Wang & Zeng, 2009) ............................ 19
Table 3: Domain specific question rules (Chen & Zeng, 2006) ....................................... 22
Table 4: Rules for identifying potential conflicts (Zhang, 2011) ..................................... 24
Table 5: Rules for solution generation (Zeng, 2012) ........................................................ 25
Table 6: Types of customer requirements (Ullman, 2003) ............................................... 35
Table 7: Designers feedback from design problem 1 ....................................................... 51
Table 8: Designers feedback from design problem 2 ....................................................... 52
Table 9: Designers feedback from design problem 3 ....................................................... 59
Table 10: EBD criteria evaluation for design problem 2 .................................................. 68
Table 11: QFD criteria evaluation for design problem 2 .................................................. 70
Table 12: Evaluation results design problem 1 ................................................................. 74
Table 13: Evaluation results design problem 2 ................................................................. 77
Table 14: Evaluation results design problem 3 ................................................................. 80
Table 15: Summary of the analyzed results ...................................................................... 83

1
Chapter 1: Introduction
1.1 Background
Design is an important area to study because there is a continuous need to develop new,
cost-effective, and high-quality products (Ullman, 2003). Furthermore, design of new
products has become more complex, and the need to develop them at a very rapid and
accelerating pace has been fostered by the global marketplace (Ullman, 2003). As result,
a company must be efficient in designing and developing its new products in order to
succeed in the market.
Customers and managements always want that the product to be designed is cheaper,
better, and launched faster than previous ones; therefore, product cost, quality and time to
market are the three measures of the effectiveness of the design process (Ullman, 2003).
Additionally, a product is often judged by its appearance (surface finish, coating, trim)
and how well it performs its designated function (Sule, 2009).
Even though the design process may vary from product to product, the diagram in Figure
1 can be used as a general process in design projects, and the description of each stage is
done as follows (Ullman, 2010):
Figure 1: The Design Process (Ullman, 2010)
Product Discovery
Project Planning
Product Definition
Conceptual Design
Product Development
Product Support

2
Product Discovery: Design projects are initiated by either a market requirement,
the development of a new technology, or the desire to improve an existing product
(Forbes, 2009; Info entrepreneurs, 2009; Ullman, 2003). About 80 percent of new
product development is market driven (Ullman, 2003). New products must
contain the latest technology if they want to be perceived as high quality ones
even though they are market driven (Ullman, 2003). On the other hand,
companies usually want to develop a new product without market demand based
on new technologies; however, these products are useless unless they can be
matched to a market need or a new market can be developed for them (Beard &
Easingwood, 1996; Ullman, 2003). Finally, the third way to discover a new
product is by the desire to redesign existing ones. Usually the redesign of a
product is market driven, and it is initiated to fix a problem with an existing
product, include a new technology in an existing product, reduce the product cost,
simplify manufacturing, respond to a required change of materials, or for many
other reasons (Khodadadeh & Mohammadpur, 2009; Ullman, 2003).
Project Planning: a set of tasks to perform the design project is developed, and
they are also sequenced. After that, resources (time, money, labour force, and
equipment) are allocated and accounted for. The last step is to develop a schedule
and estimate the cost of the project.
Product Definition: the goal of this step is to understand the design problem and
to generate customers’s requirements in order to lay the foundation for the
remainder of the design process.

3
Conceptual Design: the goal of this step is to generate and evaluate concepts for
the product or product changes. After that, the generated concepts are compared
to the developed requirements in the previous step, and a decision is made about
which concept is the best one.
Product Development: in this step, the product is released for production. At this
point, the technical documentation defining manufacturing, assembly, and quality
control instructions must be completed and ready for the purchase, manufacture,
and assembly of components.
Product Support: in this step we encounter manufacturing and assembly support,
support for vendors, and help in introducing the product to the customer is
completed. Besides that, this is the process where changes made to the product are
managed and documented.
The actual cost of design is usually a small part of the manufacturing cost of a product;
however, the decisions made during the design process have a great effect on the cost of a
product but cost very little (Ullman, 2003). Design decisions directly determine the
product’ components such as material, manufacturing process, machines, labor force and
so forth that affects the cost of a product. Besides that, the design process also affects the
quality of the product and the time it takes to produce a new product.
It is a fact that early design changes require more engineering time and effort; however, it
does not require changes in hardware or documentation.
“A change that would cost $1 thousand in engineering time if made early in
the design process may cost $10 thousand later during product refinement

4
and $1 million or more in tooling, sales, and goodwill expenses if made after
production has begun (Ullman, 2003)”.
1.2 Motivation
As can be seen from the previous background section, the design process has a great
impact in the cost, quality, and time to launch a new product to the market. Moreover, to
find the right problem to solve is not an easy task. As result, the previous reasons and the
following statement by Ullman influenced me to focus my thesis in the design area:
“A lot of time and money can be wasted designing the wrong product.
Surveys show that poor product definition is a factor in 80 percent of all time-
to-market delays. Further, getting a product to market late is more costly to a
company than being over cost or having less than optimal performance.
Finding the “right” problem to be solved may seem a simple task;
unfortunately, often it is not”(Ullman, 2003).
In addition to finding the right problem to solve, creeping specifications are a difficult
and expensive problem for most companies because they change during the design
process. There are three factors occasioning creeping specifications, and they are
described as follows (Ullman, 2003):
More is learned about the product as the design progresses, so more features can
be added.
New technologies and competitive products become available during the design
process because the design takes time.
5
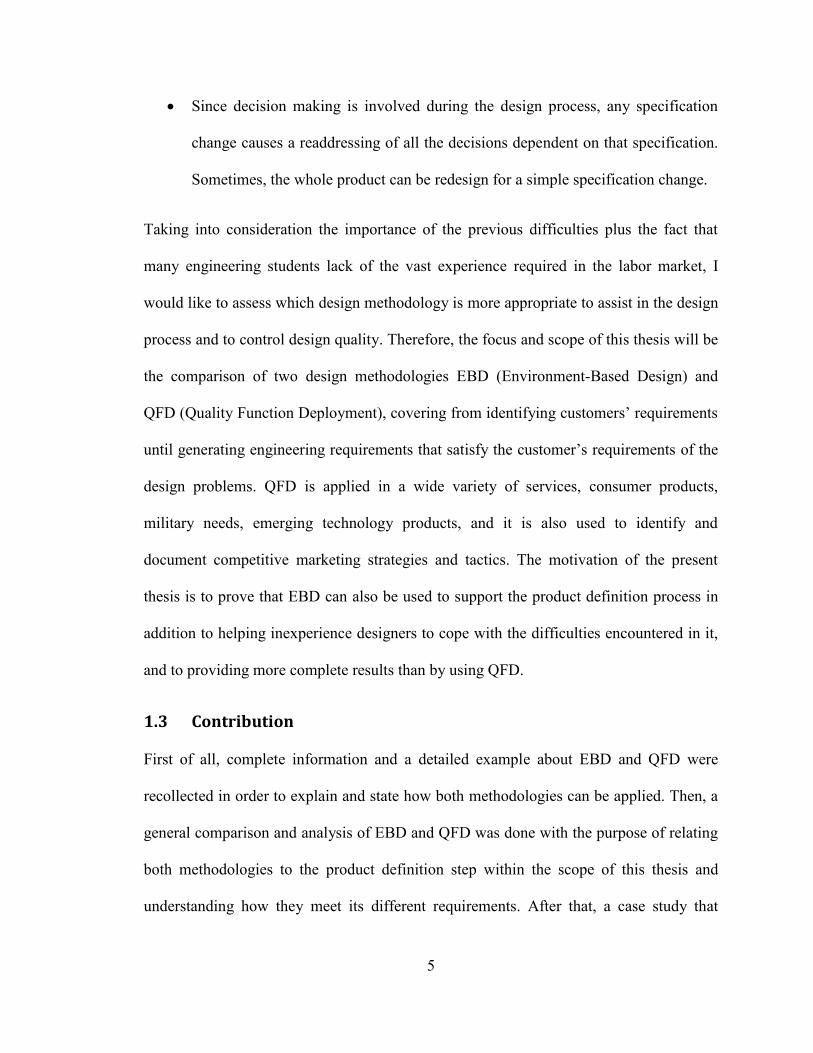
Since decision making is involved during the design process, any specification
change causes a readdressing of all the decisions dependent on that specification.
Sometimes, the whole product can be redesign for a simple specification change.
Taking into consideration the importance of the previous difficulties plus the fact that
many engineering students lack of the vast experience required in the labor market, I
would like to assess which design methodology is more appropriate to assist in the design
process and to control design quality. Therefore, the focus and scope of this thesis will be
the comparison of two design methodologies EBD (Environment-Based Design) and
QFD (Quality Function Deployment), covering from identifying customers’ requirements
until generating engineering requirements that satisfy the customer’s requirements of the
design problems. QFD is applied in a wide variety of services, consumer products,
military needs, emerging technology products, and it is also used to identify and
document competitive marketing strategies and tactics. The motivation of the present
thesis is to prove that EBD can also be used to support the product definition process in
addition to helping inexperience designers to cope with the difficulties encountered in it,
and to providing more complete results than by using QFD.
1.3 Contribution
First of all, complete information and a detailed example about EBD and QFD were
recollected in order to explain and state how both methodologies can be applied. Then, a
general comparison and analysis of EBD and QFD was done with the purpose of relating
both methodologies to the product definition step within the scope of this thesis and
understanding how they meet its different requirements. After that, a case study that

6
includes 3 design experiments was solved by using EBD and QFD for comparison
purposes. When the designers were solving the problems, the design process was
recorded and that information will be also useful to other research purposes. Besides that,
the detail design results of the problems can also be found in the present thesis.
The main contribution was to create a set of criteria to compare the two design
methodologies and to develop preliminary conclusions that EBD helps inexperience
designers such as students to cope the difficulties encountered in the product definition
process in addition to providing more complete results than by using QFD. The created
set of criteria can be used in the future in order to associate other design methodologies.
1.4 Thesis Organization
The rest of the present thesis is organized as follows:
Chapter 2: Literature review, a complete review about EBD and QFD design
methodologies is presented in this chapter.
Chapter 3: EBD and QFD comparison, a general and an experimental comparison
of EBD and QFD is illustrated in this chapter. Furthermore, the criteria of
evaluation are developed and the design problems are solved and analyzed. At the
end of the chapter, a summary and evaluation of the analyzed results is displayed.
Chapter 4: Conclusions and Future Work. This chapter summarizes the work done
in the current thesis and brings out important remarks from the results analyzed in
Chapter 3. Moreover, this chapter provides thoughts on the future work.

7
Chapter 2: Literature review
2.1 Environment-Based Design (EBD)
Environment-Based Design (EBD) is a step-by-step design methodology to solve poorly
defined design problems by finally delivering creative and innovative design solutions
(Wang & Zeng, 2009) . EBD was introduced by (Zeng & Cheng, 1991), and it is derived
from the Axiomatic Theory of Design Modeling (Zeng, 2002) based on the recursive
logic of design.
Axiomatic theory of design modelling is a logical tool for representing and reasoning
about object structures, and it provides a formal approach that allows the development of
design theories following logical steps based on mathematical concepts and axioms
(Zeng, 2008). Universe, object, and relation are used as primitive concepts in two axioms
that conform the axiomatic theory of design modelling (Zeng, 2008). The two axioms are
defined as:
1. Everything in the universe is an object, and
2. There are relations between objects.
Complex object structures are modeled by structure operations ( ) developed in the
axiomatic theory of design modelling. Structure operations are defined by the union ( )
of an object and intersection ( ) of the object with itself. The structure operation of an
object is represented by equation 1:
1

8
where ( ) is the structure of an object ( ) (Zhang, 2011). The union and the interaction
are specific relations between objects.
An object ( ) can be composed of other objects. Therefore, equation 1 indeed is a
recursive representation of an object (Zeng, 2008). Assuming that the object ( ) includes
m sub-objects , equation 2 shows the object recursion:
2
where m is a finite natural number. As result, the structure ( ) of the object ( ), can be
expanded as equation 3 which provides the structure of a recursive and hierarchical
object (Zeng, 2008).
3
Additionally, Figure 2 graphically displays a hierarchical objects representation.
Figure 2: Hierarchical object representation (Zeng, 2002)

9
In the hierarchical structure, according to (Zeng, 2008), the node at the ikth position in the
kth layer with a parent node at the j(k-1)th position in the (k-1)th layer is represented by
, where each node can be an object or a relation between objects.
A primitive object is defined by an object that cannot be or does not need to be
further decomposed, refer to equation 4:
4
Due to the human cognition capacity and the scope of an application, a group of primitive
objects is defined as equation 5, and the condition of a primitive object has to be hold.
5
The core of the EBD methodology is that a product system implies a design problem, and
that the product system is composed of three parts: the environment, the requirements on
product structure, and the requirement on performances of the designed product (Tan,
Zeng, & Montazami, 2011; Zeng, 2004). The environment which can be natural, built,
and human; is where the product is expected to work and it is related to the requirements
on product structure and performance (Zeng, 2004). Refer to Figure 3.

10
Figure 3: Product and its environment (Tan, et al., 2011)
Moreover, according to the EBD methodology, environment analysis, conflict
identification, and solution generation in Figure 4 are the three main activities always
present in a design process. These activities are interdependent and they work together to
generate and refine the design specifications and the design solutions. A detailed
demonstration of the logical steps based on mathematical concepts and axioms about the
theory of EBD can be found in (Zeng, 2004).
Figure 4: EBD process flow (Tan, et al., 2011)
EBD’s main activities (environment analysis, conflict identification, and solution
generation) are further discussed in the next subsections. Additionally, a detailed example

11
using EBD design methodology can be found in Appendix A, which refers to
“Developing a Quality Manual for Environment Monitoring System in a City” by (Sun,
Zeng, & Zhou, 2011). However, before starting discussing the main activities of EBD, a
subsection about the recursive object model (ROM) will be first introduced.
2.1.1 Recursive object model (ROM)
The purpose of discussing ROM at this point is because it is the foundation for
environment analysis. Therefore, the objective of this subsection is to introduce what
ROM is, and how to use it. The why of using ROM will be discussed in the environment
analysis subsection.
ROM is a graphical representation of a linguistic structure used as an intermediate
medium between natural language and structured modeling language (Zeng, 2004,
2008).
Recalling the axiomatic theory of design modelling, there are two axioms. The first
axiom refers to “everything in the universe is an object”. Hence, a solid box as in Figure
5 is an object that denotes the ROM’s basic unit.
Figure 5: Graphic symbol for object (Zeng, 2008)
At least two objects form a compound object (Figure 6), and it used to represent more
complex object such as .

12
Figure 6: Graphic symbol for a compound object (Zeng, 2008)
The second axiom in the axiomatic theory of design modelling is that “there are relations
between objects”. Therefore, ROM uses the relations of constraints, connection and
predicate.
A constrain is shown by an arrow with a dotted head (Figure 7) that always points to
the object to be constrained.
Figure 7: Constraint relation (Zeng, 2008)
Additionally, a constraint describes, limits, or particularizes a relation of one object to
another; and it can be mathematically expressed as in equation 6 by an interaction from
the constraining object to the constrained object
6
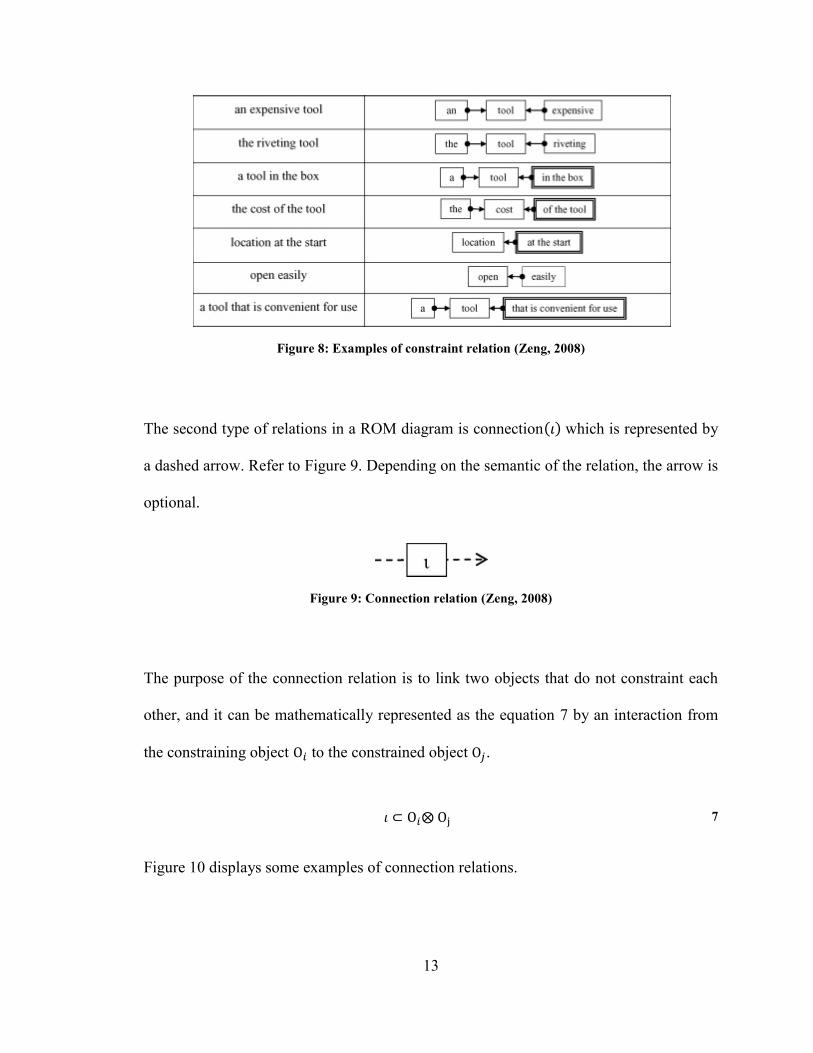
Figure 8 displays some examples of constraint relations.
13
Figure 8: Examples of constraint relation (Zeng, 2008)
The second type of relations in a ROM diagram is connection which is represented by
a dashed arrow. Refer to Figure 9. Depending on the semantic of the relation, the arrow is
optional.
Figure 9: Connection relation (Zeng, 2008)
The purpose of the connection relation is to link two objects that do not constraint each
other, and it can be mathematically represented as the equation 7 by an interaction from
the constraining object to the constrained object .
7
Figure 10 displays some examples of connection relations.

14
Figure 10: Examples of connection relation (Zeng, 2008)
Predicate is the final type of relation in a ROM diagram, and it is represented by a
solid arrow. Refer to Figure 11.
Figure 11: Predicate relation (Zeng, 2008)
Predicate relations describe an act of an object on another or they describe the state of an
object. Many specific forms, for instance action and statement, are included in predicate
relations that can be mathematically expressed as equation 8 by an interaction of one
object with another .
8
Figure 12 displays some examples of connection relations.

15
Figure 12: Examples of predicate relation (Zeng, 2008)
Figure 13 summarizes the types of objects and relations in a ROM diagram. In addition, it
is important to mention that a software (ROMA) has been developed to transform
technical English text into ROM diagrams (Zeng, 2008).

16
Figure 13: Elements of recursive object model (ROM) (Zeng, 2008)
The ROM has been tested in and applied to different problems. Some examples of
ROM’s applications are as follows:
Embedded product design (Zhang, 2011).
Iterative and automatic generation of questions to elicit product requirements
(Wang & Zeng, 2009).
Quantification of designers’ mental stress during the conceptual design process
(Zhu, Yao, & Zeng, 2007).
Agile software design (Moroz, 2011).
Now that the ROM has been introduced, the following subsections will describe
environment analysis, conflict identification, and solution generation; the three main
activities in a design process according to EBD.

17
2.1.2 Environment analysis
Most of the time, designers face the difficulty that design problems are described in an
informal plain language whereas any scientific method usually is based on certain formal
structure (Tan, et al., 2011). As consequence, there is a gap between the plain language
and formal structures used in scientific methods that have to be bridged. Having the
previous limitation, Zeng found the need and tries to overcome it by using ROM and
transforming a design problem into a ROM representation that can be further analyzed
(Tan, et al., 2011; Wang & Zeng, 2009).
The approach proposed by Zeng aims to identify the customer’s real intent and to collect
the complete product requirements. Therefore, Zeng claims that how to ask proper
questions is critical for collecting right product requirements (Wang & Zeng, 2009), and
he and Wang propose the generic inquiry process for obtaining product requirements
(Wang & Zeng, 2007). Figure 14 shows the generic inquiry process and it can be divided
in the following 8 steps (Wang & Zeng, 2009):

18
Figure 14: Generic inquiry process for requirements elicitation (Wang & Zeng, 2009)
1. Create a ROM diagram: in this step, the design problem is translated into a ROM
diagram, and it is achieved by following the rules in the ROM subsection. The
objective of creating a ROM is to enable the designer to understand more clearly
the design problem.
2. Generate generic questions: in this step, the objects that need to be further
clarified or analyzed are discovered. After that, based on a set of predefined rules

19
(Table 1) and the questions template in Table 2, some questions are generated in
order to help the customers to understand and clarify their real intent. The rules in
Table 1 help to determine which objects should be extended first, whereas the
template questions in Table 2 are used to select the candidate questions based on
the designer knowledge.
Table 1: Rules for object analysis (Wang & Zeng, 2009)
Rules Analysis
1 Before an object can be further defined, the objects constraining them should be
refined.
2 An object with the most undefined constraints should be considered first.
Table 2: Question template for object analysis (Wang & Zeng, 2009)
Case Template question
1 For a concrete, proper or abstract noun N What is N?
2 For a noun naming a quantity Q of an object N,
such as height, width, length, capacity, and level How many / much / long / big / …
is the Q of N?
3 For a verb V How to V? Or why V?
4 For a modifier M of a verb V How to V M?
5 For an adjective or an adverb A What do you mean by A?
6 For a relation R that misses related objects What (who) R (the given object)?
Or (the given object) R what
(whom)?

20
3. Collect answer: by consulting a dictionary or knowledge base, by searching on
the internet, or by collecting information from the customer; the designer answers
the questions generated in step 2.
4. Repeat steps 1 to 4 until no more generic questions can be asked: in this step, the
ROM that was created in step 1 is updated with the answers collected in step 3.
Then, if there are unclear objects in the updated ROM, the previous steps are
followed iteratively until the customer’s real intent is understood, and all the
objects in the ROM diagram are clear.
5. Generate domain specific questions: the objective of this step is to analyze the
relationships between the objects in the updated ROM diagram. Firstly, a question
about the product life cycle is asked to determine the stages in which the product
is involved, and secondly, questions are generated in terms of environment
components on their requirement levels for the identified stages (Chen & Zeng,
2006). Figure 15 displays the 7 events involved in a product life cycle, while
Figure 16 shows the eight levels of product requirements and their relation to the
product environments.

21
Figure 15: Seven events in a product life cycle (Chen & Zeng, 2006)
Figure 16: Eight level of requirements (Chen & Zeng, 2006)

22
The pyramid shape in Figure 16 means that the product requirements at the lowest
level have higher priority in developing a design solution than those at the highest
level. Additionally, the lower four level requirements are considered non-
functional requirements while the four ones on top are considered functional
requirements.
The relation of the eight levels of product requirements to the product
environments is also shown in Figure 16. The highest four levels come from the
human environment, while the lowest one comes from the natural environment
and the rest belongs to the built environment. Those products meeting the
requirements at the highest level are called high usability products. For further
information and details about the product life cycle events and the level of
requirements refer to (Chen & Zeng, 2006).
The sequence to ask the domain specific question is based on the rules in Table 3:
Table 3: Domain specific question rules (Chen & Zeng, 2006)
Rules Analysis
3 What is the life cycle of the product to be designed?
4 Ask questions about the natural, built, and human environments for the
identified stages of the product life cycle.
5
The sequence for asking questions is determined by the levels of requirements
in Figure 16 so that those requirements at the lower levels have higher
priority and can be asked earlier.
6 Ask questions about the answers from rule 1 and rule 2 by applying the rules
related to step 2.

23
6. Collect answer to the questions generated in step 5: the actions taken in this step
are similar to the ones in step 3.
7. Repeat steps 1 to 7 until no more domain questions can be asked: the objective of
this step is to follow iteratively from step 1 to 7 until the domain-dependent
product requirements are elicited accurately.
8. Output the updated design problem description: in this step a final ROM diagram
is updated with the information collected in step 7.
2.1.3 Conflict identification
The objective of the conflict identification phase is to identify undesired conflicts
between environment components, and they arise from three elements: two competing
objects and one resource object which the former two objects contend for (Yan & Zeng,
2009). In the EBD process, conflicts are viewed as the driving force (Moroz, 2011).
Zeng claims that based on a ROM diagram is much easier for identifying conflicts than
finding them from the natural language description (Tan, et al., 2011). According to
Zeng, three kinds of conflicts can be found in a ROM diagram:
1. Conflict between two objects
2. Conflict between two constraint relations, and
3. Conflict between two predicate relation
Figure 17 displays the three kinds of conflicts in a ROM diagram, and they are
represented from left to right respectively.

24
Figure 17: Three forms of existing conflicts in a ROM diagram (Tan, et al., 2011)
Potential conflicts can be identified from a ROM diagram by following the rules in Table
4. The rules are not inclusive and are complete (Zhang, 2011).
Table 4: Rules for identifying potential conflicts (Zhang, 2011)
Rules Analysis
1 If an object has multiple constraints, then potential conflict exists between any pair
of constraining objects.
2 If an object has multiple predicate relations from other objects, then potential
conflict exists between a pair of those predicate relations.
3 If an object has multiple predicate relations to other objects, then a potential conflict
exists between a pair of those predicate relations.
2.1.4 Solution generation
Before generating solutions to the identified conflicts, first they should be analyzed.
According to Zeng, the principle is to discover the dependences among the conflicts
because one conflict may be arisen from another (Tan, et al., 2011). Hence, the rules in
Table 5 can be used for generating solutions.

25
Table 5: Rules for solution generation (Zeng, 2012)
Rules Analysis
1 Root conflict should be resolved first.
2 Conflict from natural environment should be resolved first, then built, and human
lastly.
3 If a conflict is too general or too complex, decompose it.
4 Give a solution that introduces as few potential extra conflicts as possible.
Conflict dependencies can be represented by using directed graph or adjacency matrix.
Directed graph are one-way connection from one conflict to another, see Figure 18.
Figure 18: Directed graph (Zeng, 2012)
Adjacency matrix represents the dependency with n vertices using n*n matrix, where the
entry value at (i,j) is ‘1’ if there is an edge from vertex i to vertex j; otherwise the entry is
‘0’(Zeng, 2012). Every entry value (i,nj) at column nj shows whether conflict nj can be
resulted from conflict ci(Zeng, 2012). Figure 19 is an adjacency matrix that shows the same
dependency as Figure 18. Additionally, c1 is the root conflict for both c2 and c3.

26
Figure 19: Adjacency matrix (Zeng, 2012)
The purpose of handling root causes firsts is that by solving them other subsequent
conflicts depending on the root conflicts will be eliminated. Therefore, effective solutions
can be generated in this way.
After solutions have been generated for the identified conflicts, the ROM diagram is
updated with them. The solution generation process is followed until no more undesired
conflicts exist (Tan, et al., 2011).
2.2 Quality Function Deployment (QFD)
Quality function deployment (QFD) is one of the best and currently most popular
techniques used to generate engineering specifications. QFD is an organized method, and
it helps to develop necessary information to understand a problem such as (Ullman,
2003):
The specifications or goals for the product
How the competition meets the goals
What is important from customer’s viewpoints
Numerical targets to work toward

27
In the mid-1970s, QFD was developed in Japan, and in the late 1980s, it was introduced
in the US (Creative Industries Research Institute, 2007; Evans & Lindsay, 2005; Ullman,
2003). Toyota was able to reduce 60 percent of the costs of bringing a new car to market
and to decrease one-third of the time required for its development by using QFD
(Ullman, 2003). An important fact about QFD is that this methodology is used with
cross-functional teams.
Engineering specifications that are needed in the product development phase of the
design process are generated by using QFD. Figure 20 shows the main steps of the QFD
methodology.
Identify customers
Generate customers’
requirements
Set targets
Generate
engineering
specifications
Evaluate competition
Figure 20: QFD Steps (Ullman, 2003)

28
The house of quality (HOQ) in Figure 21 is built by applying the QFD steps. The HOQ
has many rooms and each one contains important information. The numbers in the HOQ
represent the steps to follow for filling it. Before starting a detailed description of how to
fill the HOQ, the following brief explanation of the steps in Figure 21 is helpful (Ullman,
2003):
Step 1: identify who the customers are in order to start developing information.
Step 2: discover what the customers want the product to do.
Step 3: determine to whom the what is important (who vs. what).
Step 4: identify how the problem is solved now by the competition, and compare
this information to the customer desires (now vs. what). It will provide
opportunities for product improvements.
Step 5: determine how (engineering specifications) to measure the product’s
ability to satisfy the customer’s requirements.
Step 6: correlate the customer’s requirements to the engineering specifications
(what vs. how).
Step 7: develop target information (how much).
Step 8: interrelate the engineering specifications (how vs. how).

29
How (5)
What vs. How (6)Now vs.
What (4)
Now (4)
How Much (7)
What (2)
Who
vs.
What
(3)
Who
(1)
How vs. How (8)
Figure 21: The house of quality (HOQ) (Ullman, 2003)
In order to explain the HOQ, a detailed example of a bicycle suspension system by
(Ullman, 2003) is shown in Appendix B. The numbers in the parenthesis in Figure 21
will refer to a sub-heading in the subsequent subsections.
2.2.1 Identify the customers (who)
In a design problem, the first to do is to identify the customers. For many products the
most important customers are the consumers (final user of the product); nonetheless, it is
also important to consider the customers such as the designer’s management,
manufacturing and assembling personnel, sales staff, distribution employees, and service
and support staff (Ullman, 2003). Standard organizations, environmental entities, and

30
other associations may also set requirements for the products; therefore, they also should
be considered as customers (Ullman, 2003). (Terninko, 1997) thinks that considering the
stakeholders, anyone who can influence the decision to buy or use the product and
anyone who is impacted by the product, is important to collect a complete list of
requirements.
2.2.2 Determine the customer’s requirements (What)
Since the customers were identified in the previous step, to determine what the customers
want to be designed is the goal of QFD in this step. According to (Ullman, 2003), some
common requirements depending on the type of customers are as follows:
Consumer: a product should work as expected, last a long time, be easy to
maintain, look attractive, incorporate the latest technology, and have many
features. The previous requirements can be comparable to the dimensions of
quality in a product (performance, features, reliability, conformance, durability,
serviceability, and aesthetics) or a service (reliability, assurance, tangibles,
empathy, and responsiveness) used in (Evans & Lindsay, 2005).
Production customer: a product should be easy to produce (both manufacture and
assemble), use available resources (human skills, equipment, and raw materials),
use standard parts and methods, use existing facilities, and produce a minimum of
scraps and rejected parts.
Marketing/sales customer: a product should meet consumer’s requirements; be
easy to package, store and transport; be attractive; and be suitable for display.

31
The Kano model (iF Design, 2010; Mazur, 1996, 1997; Ullman, 2003; Verschuren &
Hartog, 2005) of customer satisfaction also gives some important background to collect
other customer’s requirements. The Kano model goal is to excite the customers not only
satisfy them in order they want to buy the product and recommend it to others. According
to (Mazur, 1996), the Kano model considers three types of customer’s requirements (refer
to Figure 22):
Figure 22: The Kano Model (Mazur, 1996)
Revealed requirements: they are typically gotten by just asking customers what
they want. The revealed requirements presence or absence in the product or
service satisfy or dissatisfy the customers. An example of this requirement is fast
delivery. The faster or slower the delivery, the more the customers like or dislike
it.
Expected requirements: these requirements are so basic that customers may fail to
mention them until they are not performed. The absence of these requirements
causes great dissatisfaction. For instance, if coffee is served hot, customers barely

32
notice it; however, if it is served cold or too hot, dissatisfaction occurs. These
requirements must be fulfilled.
Exciting requirements: they are difficult to discover because they are beyond the
customer’s expectations. Exciting requirements absence does not dissatisfy while
their presence excites. An example of exciting requirements cited by (Mazur,
1996) is that if caviar and champagne are served on a flight from Montreal to
Toronto, it would be exciting; nonetheless, if they are not, customers would
hardly complaint. Exciting requirements “wow” the customers and bring them
back. It is responsibility of the organizations to explore customers and
opportunities to uncover such unspoken requirements because customers are
usually not apt to voice them.
In the literature, the previous requirements may be found with different terminologies.
For instance, (Ullman, 2003) refers to the revealed, expected and exciting requirements
as performance, basic, and excitement features respectively. (Evans & Lindsay, 2005)
refer to the revealed, expected and exciting requirements as satisfiers, dissatisfiers, and
exciters/delighters respectively.
(Mazur, 1997) also refers to Kano’s model as dynamic in that what excites customers
today is expected tomorrow. It means that once that the exciting features are introduced,
they will be imitated by the competition and customers will come to expect them from
everybody.
The Kano model has an additional dimension which is customer segments that the target
market includes (Mazur, 1997). For instance, considering again the previous flight

33
example, the caviar and champagne that is exciting in the domestic flight might be
expected for a first class passenger travelling from Montreal to London. Understanding
the customer requirements may be achieved by knowing the customer segments that are
intended to be served.
Observations, surveys, focus groups, complaint analysis and internet monitoring are
common methods used for collecting the customer’s information (Evans & Lindsay,
2005; Ullman, 2003). However, (Daikin, 2011; iF Design, 2010; Japan Institute of
Design Promotion, 2005; Mazur, 1996, 1997; Verschuren & Hartog, 2005; Yin, Qin, &
Holland, 2008) recommend “Going to the Gemba”, a different and powerful method for
collecting customer’s requirements. For (Mazur, 1997),
“The gemba is where the product or service becomes of value to the
customers, that is, where the product actually gets used. It is in the gemba
that we actually see who our customers are, what their problems are, how the
product will be used by them, etc. We go the gemba in QFD to see our
customer’s problems and opportunities as they happen”.
According to Ullman, the following steps help the design team to develop useful data
(Ullman, 2003):
Specify the information needed: a problem can be reduced in a single statement
describing the information needed. If it is not possible to represent the problem in
a single statement, it warrants more than one data collection effort.
Determine the type of data collection method to be used based on the type of
information being collected.

34
Determine the content of individual questions: each question should have a clear
and single goal of the expected result.
Design the questions: unbiased, unambiguous, clear, and brief information should
be sought. For this step, (Ullman, 2003) provides the following useful guidelines
to follow:
o Do not assume the customers have more than common knowledge.
o Do not use jargon.
o Do not lead the customers toward the answer is wanted.
o Do not tangle two questions together.
o Do use complete sentences.
Order the questions to give context.
Take data: usually the data collection process is done in several applications of
the questions until usable information is obtained. The first application of the
questions is used as a test or verification experiment.
Reduce data: after the information is collected, a list of customer’s requirements
should be made using the customers’ words such as easy, fast, natural, and other
abstract terms and using positive terms; for instance, what the customers want, not
what they do not want.
Ullman thinks that the major types of customer’s requirements are given in Table 6. The
list of requirements provides a roadmap to follow when the customer’s requirements are
being collected. The table is composed for the major requirement categories on the left
and they have more specific requirements on the right side. The major requirement
categories are detailed next.

35
Table 6: Types of customer requirements (Ullman, 2003)
Functional performance
Flow of energy, information, and materials
Operational steps
Operation sequence
Human factors
Appearance
Force and motion control
Ease of controlling and sensing state
Physical requirements Available spatial envelope
Physical properties
Reliability Mean time between failures
Safety (hazard assessment)
Life-cycle concerns
Distribution (shipping)
Maintainability
Diagnosability
Testability
Repairability
Cleanability
Installability
Retirement
Resources concerns
Time
Cost
Capital
Unit
Equipment
Standards

36
Environment
Manufacturing requirements
Materials
Quantity
Company capabilities
Functional performance requirements describe the product’s desired behavior.
The flow of energy, information, and materials or the information about the
operational steps and their sequence usually express the function of a product;
however, customers may not use such technical language. QDF will be use at this
point with the purpose of translating the customer’s requirements to the technical
language needed to describe the product’s function.
Human factors requirements are present in any product that is seen, touched,
heard, tasted, smelled, or controlled by a person; therefore, almost every product
has these requirements. Some examples of human factors requirements are that a
product looks good, has a certain function. Other human factors requirements are
based on the flow of energy and information between the product and an
individual usually expressed in terms of force and motion for easy controlling and
sensing the state of the product.
Physical requirements refer to physical properties such as weight, density and
conductivity of light, heat or electricity; and to spatial restrictions such as how the
product fits with other existing object.
Reliability requirements are really important for the customers because they
usually expect that a product lasts a long time. One measure of reliability is the

37
mean time between failures. The following questions help also to understand what
acceptable reliability means to the customers: What happens when the product
does fail? What are the safety implications? Is it a disposable product?
Life-cycle requirements come from Figure 23. For instance, for the example in
Appendix B, the sales/marketing department set the requirement that the bicycle
had to be shipped by a commercial parcel service; therefore, it limited the weight
and size of the product. In order to collect the requirements concerning to the life
cycle of the product, the design team has to involve in the design process
personnel from the different areas of the life cycle of the product.
Figure 23: Product life-cycle (Ullman, 2003)

38
Resources requirements refer to time, cost, capital, unit, equipment, standards,
and environment.
o Usually time is a limited resource in design, and it can be originated from
the consumers, the market, and contracts.
o Cost requirements concern both the capital costs and the costs per unit of
production.
o Standards (codes) are good sources of information; hence, knowledge of
which standards apply to the current situation is important to requirements
and must be noted since the beginning of the project. Generally standards
fall within three categories: performance, test methods, and codes of
practice (Ullman, 2003).
o Environmental requirements are important and it is responsibility of the
designer to consider the damage that the product can cause on the
environment during production, operation and retirement.
Manufacturing requirements depend on the quantity and type of the design to be
produced.
Since the previous list of requirements is more focused to develop a product, the
dimensions of quality in a service can be used to obtained requirements for services.
(Evans & Lindsay, 2005) refer to service quality dimensions to reliability, assurance,
tangibles, empathy, and responsiveness; and as follows is the description for each of
them:
39
Reliability: it is the ability to provide what was promised, dependably and
accurately.
Assurance: it is the knowledge and courtesy of the employees, and their ability to
convey trust and confidence.
Tangibles: it refers to the physical facilities and equipment, and the appearance of
personnel.
Empathy: it means the degree of caring and individual attention provided to the
customers.
Responsiveness: it is the willingness to help customers and provide quick service.
2.2.3 Determine relative importance of the requirements (who vs. what)
In QFD, this step refers to evaluate the importance of the customer’s requirements. A
weighting factor is generated for each requirement, and it will give an idea of the effort,
time, and money to be invested to achieve each requirement. In addition, customer
importance ratings represent the areas of greatest interest and highest expectations for the
customers (Evans & Lindsay, 2005). (Ullman, 2003) suggests that at this point is
important to address the questions: to whom is the requirement important? How is a
measure of importance developed for this diverse group of requirements? Sometimes
there are discrepancies between the customer’s desires and they have to be resolved at the
beginning of the design process. The analytic hierarchy process (AHP) (Terninko, 1997)
can be used in this part to prioritize whom to please.
There are different methods to weight different factors. A traditional method is to rate the
requirements on scale of 1 to 10 where 10 represents the most important and 1 the least

40
important; unfortunately, often this method results in everything important for the
customers (Ullman, 2003). For that reason, the fixed sum method is better (Ullman,
2003). In the fixed sum method, each customer has 100 points to distribute among the
requirements. Since the customers have limited points, they are forced to rank some
requirements low if they want others high. Refer to Figure 46 in Appendix B to see how
the customer’s requirements were ranked for the BikeE suspension system.
2.2.4 Identify and evaluate the competition (Now)
In this step, the main objective is to identify how the customers see that the competition
is meeting the requirements. The purpose of the previous task is to benchmark the market
and to create awareness of what already exists and what are the opportunities for
improvements (Ullman, 2003). Even though a product is new, there is always
competition. This step is really important to understand the competitors and to highlight
their strengths and weaknesses in competing products (Evans & Lindsay, 2005) which
leads to a tremendous competitive advantage (Creative Industries Research Institute,
2007).
Once the competing products are identified, they are compared to the customer’s
requirements usually using a scale from 1 to 5 where 1 represents that the product does
not meet the requirement at all, and 5 means that the product completely fulfills the
requirement. For instance, if a customer ranked a requirement as high importance and the
competitors are slightly meeting the requirements, it represents an opportunity for
improvement. On the other hand, if the competitors are completely fulfilling a high

41
ranked requirement, their products should be studied and good ideas can extracted from
it. However, it is always important to pay attention to patents and copy right implications.
2.2.5 Generate engineering specifications (how)
As it is stated in the sub-heading, the goal of this step is to develop engineering
specifications for the customer’s requirements. The engineering specifications are
basically translations of the customer’s requirements to terms of measurable parameters
of how the customer’s requirements can be met (Evans & Lindsay, 2005). It is important
to state that the parameters have to be measurable because the objective is to set target
values in the future for each specification. The focus for this step is to set the parameters
whereas the targets will be set in the subsection 2.2.7. For the requirements that are
directly measurable, for instance the cost and weight in Figure 45 in Appendix B, this
step does not apply. Effort must be done in this step in order to find many possible ways
to measure the customer’s requirements that are not measurable in the customer words. It
is also important to develop for each engineering specification a unit of measure
(percentage, minutes, inches, lbs, kg, etc.) and the direction of improvements: more is
better (), less is better (), or nominal is best which means that a specific target is
known(Ullman, 2003).
2.2.6 Relate customers’ requirements to engineering specifications (what vs. how)
In this step the center portion (what vs. how) in the Figure 21 is filled. Each cell will
contain the relationship between the engineering specification and the customer’s
requirements. A customer’s requirement can be related to one or more engineering
specification; however, the strength of the relationships can vary. An engineering

42
specification can provide a strong relationship to a customer requirement while it is not
related at all to other customer requirements. Usually the symbols in Figure 24 are used
to express the relationships:
Figure 24: Engineering specifications and customer’s requirements type of relationships (Ullman,
2003)
In the literature, some design teams give a weight of 1, 3 or 9 to the type of relationships
depending on if it is weak, medium, or strong respectively (Creative Industries Research
Institute, 2007). If there is no relationship at all the given weight is 0.
2.2.7 Set engineering targets (how much)
In this step the goal is to set targets (how much) for the engineering specifications
(Creative Industries Research Institute, 2007). The targets are used to evaluate how the
product to be designed meets the customer’s requirements. In order to set the targets, the
competition is evaluated on how they meet the engineering specifications, and then, the
design team establishes the targets for the product (Evans & Lindsay, 2005). It is
important to set the targets early in the design process.
Most QFD literature suggests a single value as a target (Creative Industries Research
Institute, 2007; Evans & Lindsay, 2005; Terninko, 1997); however, when the design is in
process, it is often not possible to meet the exact targets. As result, a more robust method

43
for setting the targets consists in establishing the levels at which the customers will be
delighted and disgusted (Ullman, 2003).
2.2.8 Identify relationships between engineering requirements (how vs. how)
The goal of this step is to identify the dependencies between the engineering
specifications. It is important to know the dependencies since early stages of the design
process because when the design team wants to meet one engineering specification, they
can affect negatively or positively other specification (Ullman, 2003). The roof of the
HOQ is used to display the relationships between the engineering specifications. If there
is a negative or strongly negative relationship, the design must be compromised unless
the negative impact is designed out (Terninko, 1997). The theory of Inventive Problem
Solving (TRIZ) is an approach used to solve technical contradictions of negative
relationships.
The symbols in Figure 25 are the most common used to represent the dependencies
between the engineering specifications. If there is relationship between two engineering
specification, the cell crossing the two specifications in the roof of the HOQ is marked
with the symbol in Figure 25 that better represents the type of relationship.
Figure 25: Engineering specifications type of relationships (Ullman, 2003)

44
2.2.9 Absolute importance
The goal of this step is to identify which engineering specifications of the product matters
the most to the customers. The most important engineering specifications are identified
by using the relative importance of each of them, and the relative importance is obtained
based on the absolute importance. The greater the relative importance of the engineering
specification, the more important it is.
The absolute importance for each engineering specification is calculated by multiplying
the weight of the type of relationship set in step 6 for each engineering specification to
the respective customer rating for the related customer requirement. If for an engineering
specification there is more than one relationship, all the results of the previous
multiplications are added up. The sum results are the absolute importance for each
engineering specification. After that, the relative importance is calculated by finding first
the total of the addition of all the absolute importance of each engineering specifications,
and then each absolute importance is divided by the total of the absolute importance
addition.
This step is not covered in the example in Appendix B. Nonetheless, detail examples of
this step can be found on the references (Creative Industries Research Institute, 2007;
Terninko, 1997).
2.2.10 Further comments about QFD
The QFD can be applied during later phases in the design process. In that case, QFD can
be used to develop better measures for functions, assemblies, or components in terms of
costs, failure modes, or other characteristics (Ullman, 2003). For the previous purpose,

45
the customer’s requirements should be replaced with what is to be measured and the
engineering specifications with any other measuring criteria. Other literatures (Creative
Industries Research Institute, 2007; Evans & Lindsay, 2005) refer to 4 different HOQs to
relate the customer’s requirements to technical requirements, component requirements,
process control plans, and manufacturing operations.

46
Chapter 3: EBD and QFD comparison
In the previous chapter, EBD and QFD were introduced. In this chapter, a general and an
experimental comparison are presented.
3.1 EBD and QFD general comparison
In this section, a general analysis of the methodologies is done by following the design
process step involved within the scope of the thesis. Recalling the design process
introduced in the background section in Chapter 1, the main steps in a design process are
Product discovery, Project planning, Product definition, Conceptual design, Product
development and Product support. Hence, the step involved within the scope is product
definition, and EBD and QFD will be analyzed on how they achieved its requirements.
Product definition: this phase is the main contribution of this thesis. The goal
here is to understand the design problem and to generate customer’s
requirements in order to lay the foundation for the remainder of the design
process. A lot of time and money is wasted designing wrong products due to the
difficulty of finding the right problems. Moreover, after finding the right
problem, understanding what is really needed to be designed is not an easy task
either.
From my experience, finding the right problem and understanding it is a big leap
in the design process; hence, EBD becomes powerful in this phase because with
the help of ROM diagrams and the rules to ask generic and domain specific
questions, the real intention of the customers is found and the product definition

47
process becomes natural. Furthermore, ROM diagrams and the rules to ask
generic and domain specific questions help to clarify unclear requirements and
to uncover hidden requirements.
On the other hand, QFD is vaguer than EBD in this step. In the literature review
about QFD, (Ullman, 2003, 2010) is the only one who extends more about how
to collect the customers’ requirements; however, the roadmap to follow is based
more on experience and it is not ensured that the designers understand the real
problem and that all the customers (stakeholders) and their requirements are
identified.
The next step of this stage is to transform the immeasurable customers’
requirements into measurable engineering specifications. Some requirements are
already measurable since they are in the voice of the customers, for instance cost
or time to develop a product. EBD and QFD achieve similarly the task of
transforming the immeasurable customers’ requirements into measurable ones.
Other step in this stage is to analyze the competitors. It is important to know that
even though the designed product meets all the expected and revealed
customers’ requirements, other products in the market may have higher
customers’ satisfaction due to the fact that they may be achieving exciting
requirements in addition to the expected and revealed requirements in the
Kano’s model. Furthermore, analyzing the market helps to know how

48
competitors are achieving certain requirements that may be causing problems to
the company for which the product is being designed; therefore, some
knowledge can be gained by analyzing similar products. Both methodologies are
aware of analyzing competitors; however, I think QFD is more precise in this
step than EBD because the latter has this task too implicit human environment.
The last but not the least step of this stage is to prioritize the customers’
requirements. EBD does not consider directly this task while QFD does;
however, the final output of both methodologies provides solution to all the
customers’ requirements. The prioritization becomes important when there are
contradictions that cannot be met at the same time in a design solution, and a
decision has to be made about which requirement is more important to the
customers in order to satisfy and delight them.
Further comments about EBD and QFD
EBD and QFD methodologies automatically document the product definition process and
facilitate the communication and teamwork between the different areas in the
organization (Evans & Lindsay, 2005; Ullman, 2003). For instance, the final updated
ROM obtained after the conflict identification process for EBD and the HOQ for QFD
are already design records of the product definition process and it makes it easier to
explain to others what is needed in the product to be designed.

49
EBD and QFD can be applied during later phases in the design process to develop
component requirements, process control plans, and manufacturing, assembly, and
distribution operations.
Finally, since the design process is dynamic and more knowledge is gotten during the
process, EBD and QFD are flexible to be reviewed and updated as needed. However,
when a change is done, it is important to consider how it affects the relationships between
the components in the ROM diagrams or HOQs.
3.2 EBD and QDF experimental comparison
In order to compare experimentally EBD and QFD in this thesis, a case study that
includes three different design problems was solved with each methodology. The three
design problems that were solved with EBD were the same solved with QFD. The design
problems were categorized in accordance with the grade of complexity, and after
studying them; 1, 2 and 3 hours were assigned respectively to solve them.
Two inexperience designers were volunteers to solve the design problems. The designer
that solved the problems using EBD only needed to know about EBD, and the designer
who worked with QFD only needed to know about QFD. The purpose of the previous
constraint was to avoid that there was a mixed of both methodologies while solving the
problems affecting the results. The designers were used to the design methodologies;
however, training was provided for the designers and they have time to prepare
themselves as well.
The designers did not know and did not have any clue about the design experiments until
the time to solve them. Additionally, it was ensured that the designers had similar

50
background to work on the design problems, which ranged from different fields and
topics.
The designers signed a consent form before solving every design problem where they
agreed to participate in this research. The reason of the concern forms was to let the
participants know five main points. The first point was to let them know the purpose of
the experiments. Then, the second point was to introduce the procedure to follow during
the tests, and the third one was to describe them the devices that will be used during the
experiments. For instance, devices such as video cameras and screen recorders were used
during the experiments in order to record the design process. The fourth point was to state
the volunteer participation of the designers and that the collected data would be stored,
analyzed and possibly published; and the fifth one was to declare that their personal
information will be kept confidential. A sample of the concern form can be found in
Appendix C.
In the following section the three design problems will be presented and also the
information related to them.
3.2.1 Design problem descriptions
As it was mentioned previously, three design problems were solved with EBD and QFD.
The experiments were carried out at Concordia University, in the Design Lab, EV-9.235.
The designers were able to use a computer with internet to look for any kind of
information related to the design experiments, and after each experiment they were asked
for feedback. As follows each design problem will be described:

51
(1) Design a spray nozzle for a perfume bottle that helps blind people to control the
flow of the liquid.
For solving the first design problem, one hour was assigned to the designers, and the
first experiment’s feedback can be found in Table 7. The difficulty and knowledge
related to the problem categories in Table 7 where measured in a scale from 1 to 10.
For the difficulty category, 1 represents not to too difficult and 10 very difficult while
for the knowledge related to the problem, 1 shows not too much knowledge and 10
lots knowledge.
Table 7: Designers feedback from design problem 1
EBD QFD
Time Ok Short
Difficulty 7 7
Knowledge related to the
problem
4 4
(2) Design a system for video recording surgical procedures.
For the second design problem, in addition to the main statement of the problem,
further description was available, and it is shown as follows:
“You have been hired to improve a system for video recording surgical
procedures. The desire is to capture the use of various surgical instruments
during operations with an aim to identify shortcomings of current tools and
to develop new surgical devices. The current video system uses a camera

52
mounted to a moveable light fixture and records images to a networked
computer, but the quality of the images is too low and may not capture the
relevant area. The proposed system should be unobtrusive and be able to
record the images with a minimum of user input during the operation; i.e., the
doctors and nurses should not have to stop what they are doing to position
the camera”.
For solving this problem, two hours were assigned to the designers, and its respective
feedback can be found in Table 8. The difficulty and knowledge related to the
problem categories in Table 8 were measured in the same scale as in the design
problem 1.
Table 8: Designers feedback from design problem 2
EBD QFD
Time Ok Ok
Difficulty 3 3
Knowledge related to the
problem
5 6
(3) Design a ventilation system for a thin flooring system.
The third design problem was the most complex and it has more information that the
previous two problems. For the third problem 3 hours were assigned to the designers.
As the second design problem, additional information besides to the main statement
was provided, and it is shown as follows:

53
a. Detailed description of the current systems
Description of a regular overhead ventilation system
Figure 26: Overhead ventilation system
The overhead ventilation system in Figure 26 includes:
A mechanical ventilation (motor to move the air)
A heating or cooling system of the air (depending on the season)
A plenum that contains air ducts and various electrical wires network
Figure 27: Mixing dilution ventilation (left), and traditional ventilation duct systems (right)

54
Mixing ventilation systems in Figure 27 generally supply air in such a manner that the
entire room volume is fully mixed. The cool supply air exits the outlet at a high
velocity, inducing room air to provide mixing and temperature equalization. Since the
entire room is fully mixed, temperature variations throughout the space are small
while the contaminant concentration is uniform throughout the zone.
A variant exists in which the new (sane) air is mixed with recycled air coming from
the room inside the plenum, so as to reduce discomfort linked with high temperature
gap between entering air and required average temperature of the room.
Description of the mechanical structure of flooring system:
The structural part of the flooring system in Figure 28 is constituted of:
Hollow-core slabs. Compared to regular concrete slabs, those slabs enable to
reduce the weight of the building, hence the cost. Those elements should be
prefabricated in a factory and then transported on site by heavy trucks.
Beams that support the hollow-core slabs

55
Figure 28: Mechanical structure of flooring system
b. Description of the problem:
In order to benefit from thermal inertia provided by the hollow-core slab (additional
comfort and energy savings) and to reduce the thickness of flooring systems (so as to
reduce cost of the building), it is proposed to suppress the plenum. The electrical
wires are then introduced in the hollows of hollow-core slab.
Two unsatisfying solutions to deal with the ventilation system (Figure 29) are
proposed:

56
Circulation of air in the adjacent walls
Circulation or air in hollows of hollow-core slab
This is unsatisfying because:
A high flow is required if we want the air to enter the room at a comfortable
temperature, which leads
o either to too big ducts compared to the size of hollows or walls
o or to too high pressure loss in ducts
Otherwise, uncomfortable temperature, too hot or too cold (depending on the need
of heating or cooling) may enter the room in order to keep the homogenized
temperature of the room at the required value.
Air circulation in hollow-core
Air circulation in wall
Figure 29: Air circulation in hollow-cores and in walls.

57
Additional requirements concerning the expected solution:
Product manufacturing and in situ implementation should require only tools
that already exist.
Implementation should not require a multitude of small steps.
There should be a restricted number of workers to implement the solution (not
various skills in various domains).
The solution should be implemented without much attention on details and
finish (idiot proof…).
Annex: Some technical data about air circulating in a duct:
Required flow rate
Flow rate required for heating and cooling may depends on the energy demand of the
building. A reference climate needs to be fixed for calculating the maximal
instantaneous energy demand.
Flow rate required for sanitary reasons depends on the type of building (dwelling,
office, school, etc…). It is most of the time inferior to the flow rate required for
heating or cooling the building.
Pressure loss
The basic pressure loss of airflow is in function:
Of the leakage rate of air estimated in the ductworks
The temperature of the air conveyed

58
The level of altitude where is located the installation
The nature of the various types of materials used (steel ductwork, copper, PVC,
built walls, etc)
o Indices of surface roughness.
The geometrical shapes of ductworks (circular, quadrangular, oblong)
The various types of pressure loss coefficients depending on
o The air density.
o The dynamic viscosity of the air.
o The Reynolds number.
It should be added a coefficient of safety margin:
The assemblies are often badly carried out, blocking partially the passage of the
fluid.
An estimated dusty ductwork can be considered.
With the ageing of the ductwork, a possible corrosion can increase the pressure
losses by friction.
The real speed of the airflow in the ductwork is carried out from the corrected
airflow.
Air speeds recommended

59
The air velocity in the ducts cannot exceed a certain value. It results a minimal
section of ducts below from which it is misadvised going down for following reasons:
Increase the noise of rustle of the air in the strait ducts and especially on the level
of the deviations.
Increase the pressure losses and the energy consumed by the ventilator.
Example: a reduction in half of the section doubles the air velocity increases the
pressure losses and the absorptive power by the ventilator by a factor 4.
After the designers solved this design problem, the feedback can be found in Table 9.
The difficulty and knowledge related to the problem categories in Table 9 were
measured in the same scale as in the design problem 1.
Table 9: Designers feedback from design problem 3
EBD QFD
Time Ok Ok
Difficulty 10 10
Knowledge related to the
problem
2 2
At this point, from the designer feedbacks can be concluded that they had the same
perception about the design problems respect to the time to solve them, the degree of
difficulty, and the knowledge they had related to the problem. The purpose of this
information is to show that the designers had similar abilities and capacities; therefore,
the final results will not be biased for the knowledge of the designers.

60
3.2.2 Criteria of evaluation
In order to compare EBD and QFD methodologies, and to test the thesis hypothesis,
evaluation criterions are needed. In the literature review, papers about software
comparisons (Osterweil & Song, 1996; Song & Osterweil, 1991; Song & Osterweil,
1994) have been found; however the association is based on the software architecture and
its components which are different from this thesis area. Daniel Frey from MIT has been
also working on comparing design methodologies based on analogies, and quantitative
methods such as robust parameters design, design of experiments (DOE) and hierarchical
probability model (Frey & Dym, 2006; Frey & Li, 2004, 2005; Frey & Wang, 2006;
Milani, Wang, Frey, & Abeyaratne, 2008). Nevertheless, for this thesis in order to
associate EBD and QFD, from our knowledge and research, it would be better and more
effective to do the evaluation by using qualitative (Verschuren & Hartog, 2005) and
quantitative methods instead of only the quantitative ones used by Daniel Frey. Some
helpful qualitative criteria were found and used in some design competitions (Daikin,
2011; iF Design, 2010; Japan Institute of Design Promotion, 2005; Yin, Qin, & Holland,
2008). So, the set of criteria that will be employed will have qualitative characteristics
that will be quantified by using a scoring model. In the subsequent section more
information about the evaluation process will be provided.
After reviewing the design literature, the following criterions were identified to compare
objectively and impartially EBD and QFD methodologies:
(1) Viability: Is it possible to implement the design solution? Can the functional
requirements be achieved?

61
(2) Product life cycle consideration: Do the designers consider and identify the
life cycle involved in the product development when generating the
engineering specifications?
(3) Customers’ identification: Do the designers consider and identify all the
stakeholders when working on the design problems?
(4) Customers’ requirements identification: Do the designers identify all the
customers’ requirements related to the design problem?
(5) Customer requirements prioritization: Do the designers consider if there are
some requirements that are more important for the customers?
(6) Conflict identification / functional requirements relationship: Do the designers
identify if there are functional/technical contradictions?
(7) Conformance / completeness of the generated results: Do the generated results
satisfy the customer’s requirements? Do the designers understand the real
customer’s intentions?
(8) Ease to understand the results: are the designed results clear and easy to
understand?
(9) Performance / measurability of functional requirements: Can the developed
engineering specification be clearly measured?
It is important to recall that in this thesis the scope of comparison of EBD and QFD is
done covering from identifying customers’ requirements until generating engineering
requirements that satisfy the customer’s requirements of the design problems. In the
following section, the design problem 2 that was introduced previously will be
completely analyzed.

62
3.2.3 Experiment analysis
Before starting analyzing the results of the second design problem, some comments about
the experiment analysis are clarified:
Each design problem will be analyzed following the process that will be
introduced promptly.
Additionally, each design problem will be assessed by three different
evaluators in order to provide a more objective analysis.
A summary of the analyzed results will be shown in the next section.
Recalling the second design problem, a system for recording surgical procedures had to
be designed. Besides that, the following problem description was provided:
“You have been hired to improve a system for video recording surgical
procedures. The desire is to capture the use of various surgical instruments
during operations with an aim to identify shortcomings of current tools and
to develop new surgical devices. The current video system uses a camera
mounted to a moveable light fixture and records images to a networked
computer, but the quality of the images is too low and may not capture the
relevant area. The proposed system should be unobtrusive and be able to
record the images with a minimum of user input during the operation; i.e., the
doctors and nurses should not have to stop what they are doing to position
the camera”.

63
The designers had two hours for solving this problem, and the results for both EBD and
QFD are shown as follows:
EBD results: the designer applied the EBD methodology to solve the design
problem. First, the designer tried to understand the problem by building and using
the ROM diagram in Figure 30. After that, the environment components were
analyzed, and the conflicts were identified also in Figure 30.

64
Figure 30: EBD solution for design problem 2

65
QFD results: the designer applied the QFD methodology to solve the design
problem. First, the designer collected the customer requirements in Figure 31.
After, the house of quality (HOQ) was built, refer to Figure 32 and Figure 33.
From the HOQ can be seen that the customers’ requirements were translated to
functional requirements. Additionally, the relationships between the customers’
requirements and functional requirements, and the relationships between the
functional requirements were identified and analyzed. Other QFD components as
customers’ requirements prioritization was also carried out.
Figure 31: QFD solution for design problem 2 (page 1)

66
Figure 32: QFD solution for design problem 2 (page 2)

67
Figure 33: QFD solution for design problem 2 (page 3)
In order to analyze the generated results, the criterions introduced in the previous section
will be used. Table 10 contains the criteria to compare EBD and QFD results that will be
applied to evaluate them. Moreover, a scale of 1 to 10 will be used to fill out the table
where 1 means that the criterion is poorly met and 10 is that the criterion was
successfully achieved. Furthermore, if the criterions are not applicable for the design

68
results, N/A (equal to 0) will be used. At the end, the results will be added up, and the
design methodology that has the greatest score will be considered the best one.
The following comments are also important and they should be taken into consideration:
As it was mentioned before, each criterion will be assessed by three different
evaluators. For the purpose of demonstrating how the evaluators will assess each
design solution, Table 10 and Table 11 show how one evaluator gave points to the
criterions. In order to give the points, the evaluator asked the questions that
belong to each criterion. If mark deductions exist, they are explained after Table
10 and Table 11. The same work was exercised by every evaluator, and in the
next section all the results will be shown and summarized.
The criterions will be considered to have the same importance for this thesis;
however, they can be weighted for future use depending on how important they
are in the developed design.
Table 10: EBD criteria evaluation for design problem 2
Criteria EBD
1 Viability 7
2 Product life cycle consideration 8
3 Customers' identification 8
4 Customers' requirements identification 7
5 Customers' requirements prioritization 10
6 Conflict identification / functional
requirements relationships 7

69
Criteria EBD
7 Conformance / completeness of the concept
generated 8
8 Ease to understand the results 10
9 Performance / measurability of functional
requirements N/A
EBD results evaluation:
(1) Viability: 3 marks were deducted because it is not mentioned how to connect the
cameras to some surgery devices such as the camera in the doctor’s glasses to the
network computer. Additionally, the camera in the doctor’s glasses can be
blocked with the patient blood or doctors’ sweat, and it is not mentioned how to
do in these cases.
(2) Product life cycle consideration: 2 marks were deducted because the designer
only took into account from collecting the images until analyzing the results. The
designer did not consider the cleaning procedure post surgery.
(3) Customers’ identification: 2 marks were deducted because the designer identified
the stakeholders (patients, doctors, nurses, technical staff, and video analysts), but
the cleaning/maintainability staff was not considered.
(4) Customers’ requirements identification: 3 marks were deducted because in the
design solution there is not enough information about the network computer or
server capacity in order to store the video records. Additionally,
cleaning/maintainability staff may have some requirements such as disposable or
washable cameras adapted to some surgery instruments.
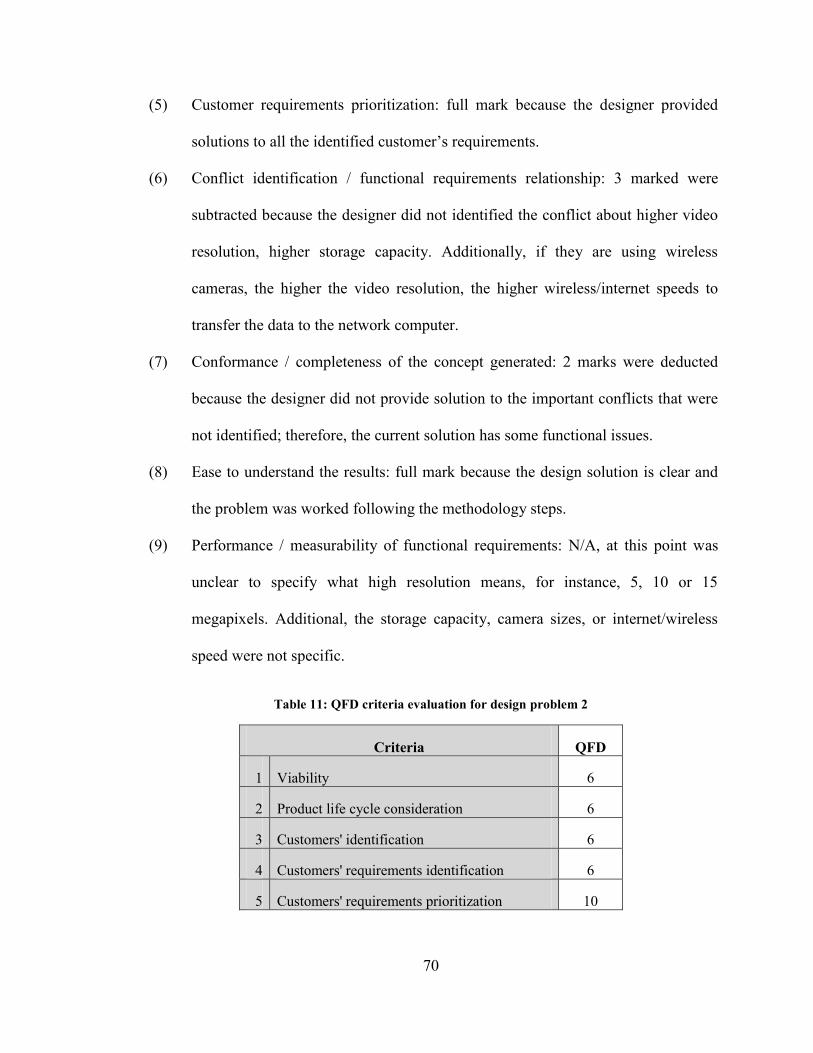
70
(5) Customer requirements prioritization: full mark because the designer provided
solutions to all the identified customer’s requirements.
(6) Conflict identification / functional requirements relationship: 3 marked were
subtracted because the designer did not identified the conflict about higher video
resolution, higher storage capacity. Additionally, if they are using wireless
cameras, the higher the video resolution, the higher wireless/internet speeds to
transfer the data to the network computer.
(7) Conformance / completeness of the concept generated: 2 marks were deducted
because the designer did not provide solution to the important conflicts that were
not identified; therefore, the current solution has some functional issues.
(8) Ease to understand the results: full mark because the design solution is clear and
the problem was worked following the methodology steps.
(9) Performance / measurability of functional requirements: N/A, at this point was
unclear to specify what high resolution means, for instance, 5, 10 or 15
megapixels. Additional, the storage capacity, camera sizes, or internet/wireless
speed were not specific.
Table 11: QFD criteria evaluation for design problem 2
Criteria QFD
1 Viability 6
2 Product life cycle consideration 6
3 Customers' identification 6
4 Customers' requirements identification 6
5 Customers' requirements prioritization 10

71
Criteria QFD
6 Conflict identification / functional
requirements relationships 6
7 Conformance / completeness of the concept
generated 6
8 Ease to understand the results 10
9 Performance / measurability of functional
requirements 4
QFD results evaluation:
(1) Viability: 4 points were deducted because it is not mentioned how collect the
information from the cameras in order to analyze it. Additionally, the video
records storage is not considered by the designer.
(2) Product life cycle consideration: 4 marks were deducted because the designer did
not consider the cleaning post surgery and the video storage.
(3) Customers’ identification: 4 marks were deducted because the designer did not
identify the cleaning/maintenance staff of the surgery rooms and devices involved
in the solution, and technical staff that will store and analyze the videos
information.
(4) Customers’ requirements identification: 4 marks were deducted because in the
design solution there is not enough information about how to transfer the
information from the cameras to a server. Additionally, the technical staff may
have some requirements about video storage capacity.

72
(5) Customer requirements prioritization: full mark was assigned because the
designer prioritized the requirements according to how important they are to the
customers.
(6) Conflict identification / functional requirements relationship: 4 marked were
deducted because the designer did not identify the conflict about higher video
resolution, higher storage capacity. Furthermore, the designer did not consider the
possible technical conflict to transfer the data from the cameras to a server.
(7) Conformance / completeness of the concept generated: 4 marks were deducted
because neither the transmission of the videos from the cameras to a server nor
the server storage capacity was considered.
(8) Ease to understand the results: full mark because the designer follows QFD
methodologies procedures and the results are clear.
(9) Performance / measurability of functional requirements: 6 marks were deducted
because the technical requirements do not have established performance;
however, the designer gained 4 marks because for some technical requirements
the unit of measure is given as well as the direction of improvement.
Other two evaluators analyzed the results of the design problem 2 in order that the
comparison is more objective. The results can be found in the next section. Besides that,
the other two design problems were assessed in the same way as the second design
problem, and the evaluation and summary of the analyzed results are also shown in the
next section. Refer to Appendix D for the design results of the problems 1 and 3.
73
3.2.4 Evaluation and summary of the analyzed results
3.2.4.1 Evaluation of the analyzed results
The design results were analyzed by each evaluator one by one, and the evaluation results
are displayed in Table 12, Table 13, and Table 14 for the design problems 1, 2 and 3
respectively. Each one of the previous tables contains the punctuation given by the
evaluators to each criterion for EBD and QFD design methodologies. Then, the evaluator
punctuations were subtracted (EBD – QFD) for each evaluator respectively in order to
quantify the evaluators’ perception compared to the criterions’ requirements.
Since EBD – QFD was used:
1. If the result is positive, EBD was better for the perception of the evaluator.
2. If the result is negative, QFD was better for the perception of the evaluator.
3. If the result is 0, EBD and QFD were tied for the perception of the evaluator.
A total score for each criterion was calculated by adding up the three evaluator’s
perceptions. Besides that, a total score for each evaluator was obtained by adding up their
respective punctuations for each criterion. Finally, a total score for the design problems
was calculated by summing the total scores per criterion or the total scores per evaluator.
The score results can be analyzed following the three previous considerations.
It is important to recall the thesis hypothesis in order to assess and validate it:
EBD helps inexperience designers such as students to cope the difficulties
encountered in the product definition process in addition to providing more
complete results than by using QFD.
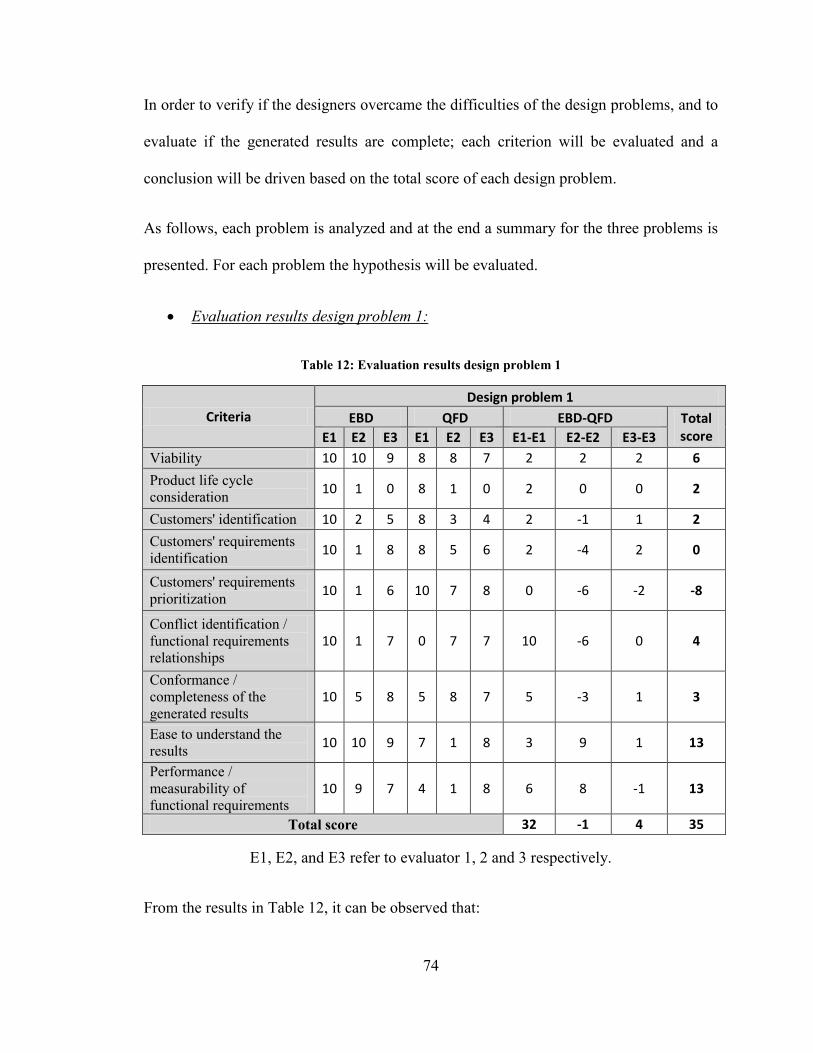
74
In order to verify if the designers overcame the difficulties of the design problems, and to
evaluate if the generated results are complete; each criterion will be evaluated and a
conclusion will be driven based on the total score of each design problem.
As follows, each problem is analyzed and at the end a summary for the three problems is
presented. For each problem the hypothesis will be evaluated.
Evaluation results design problem 1:
Table 12: Evaluation results design problem 1
Criteria Design problem 1
EBD QFD EBD-QFD Total score E1 E2 E3 E1 E2 E3 E1-E1 E2-E2 E3-E3
Viability 10 10 9 8 8 7 2 2 2 6
Product life cycle
consideration 10 1 0 8 1 0 2 0 0 2
Customers' identification 10 2 5 8 3 4 2 -1 1 2
Customers' requirements
identification 10 1 8 8 5 6 2 -4 2 0
Customers' requirements
prioritization 10 1 6 10 7 8 0 -6 -2 -8
Conflict identification /
functional requirements
relationships 10 1 7 0 7 7 10 -6 0 4
Conformance /
completeness of the
generated results 10 5 8 5 8 7 5 -3 1 3
Ease to understand the
results 10 10 9 7 1 8 3 9 1 13
Performance /
measurability of
functional requirements 10 9 7 4 1 8 6 8 -1 13
Total score 32 -1 4 35
E1, E2, and E3 refer to evaluator 1, 2 and 3 respectively.
From the results in Table 12, it can be observed that:

75
(1) Viability: the three evaluators think that EBD generated more viable results
than QFD, having a total score of 6.
(2) Product life cycle consideration: evaluator 1 thinks that the EBD generated
results have a greater consideration of the product life cycle while the other
two evaluators think that both methodologies were tied and had a poor
consideration of the product life cycle. The final score of the criterion is 2,
being EBD better than QFD.
(3) Customers’ identification: evaluators 1 and 3 think that the EBD generated
results identify more customers than the QFD one. Evaluator 2 thinks that
both methodologies were poor identifying the customers, and that QFD
slightly identified more customers with -1. The final score of the criterion is 2,
being EBD better than QFD.
(4) Customers’ requirements identification: two evaluators think that EBD
identified more customers’ requirements than QFD while one evaluator
considers the opposite. The final score of the criterion is 0, being a draw for
EBD and QFD.
(5) Customer requirements prioritization: two evaluators think that QFD
customer’s requirements prioritization was better than EBD. The other
evaluator thinks that EBD and QFD were tied. The final score of the criterion
is -8, being QFD better than EBD.
(6) Conflict identification / functional requirements relationship: evaluator 1
thinks that EBD identified more conflicts than QFD while evaluator 2
considers the opposite. Evaluator 3 believes that there was a draw between

76
EBD and QFD. The final score of the criterion is 4, being EBD better than
QFD.
(7) Conformance / completeness of the generated results: two evaluators think
that EBD was better than QFD while the other one considers the opposite. The
final score of the criterion is 3, being EBD better than QFD.
(8) Ease to understand the results: the three evaluators believe that results
generated by EBD were clearer and easier to understand than the ones
generated by QFD. The final score of the criterion is 13, being EBD better
than QFD.
(9) Performance / measurability of functional requirements: two evaluators think
that the engineering requirements developed by EBD are more measurable
than the ones generated by QFD; the other evaluator believes the opposite.
The final score of the criterion is 13, being EBD better than QFD.
Overall EBD performed better in all the comparison parameters than QFD except for
customer’s requirements prioritization. The final score for the design problem was 35;
therefore, the hypothesis cannot be rejected.
Evaluation results design problem 2:
The second design problem will be analyzed using the same direction as for the
evaluation of the design problem 1.

77
Table 13: Evaluation results design problem 2
Criteria
Design problem 2
EBD QFD EBD-QFD Total score E1 E2 E3 E1 E2 E3 E1-E1 E2-E2 E3-E3
Viability 7 9 8 6 10 6 1 -1 2 2
Product life cycle
consideration 8 1 0 6 1 0 2 0 0 2
Customers' identification 8 2 7 6 2 3 2 0 4 6
Customers' requirements
identification 7 5 8 6 9 6 1 -4 2 -1
Customers' requirements
prioritization 10
1 0 10 5 7 0 -4 -7 -11
Conflict identification /
functional requirements
relationships 7 9 6 6 10 6 1 -1 0 0
Conformance /
completeness of the
generated results 8 2 8 6 3 6 2 -1 2 3
Ease to understand the
results 10
9 9 10 4 7 0 5 2 7
Performance /
measurability of functional
requirements 0 5 5 4 4 6 -4 1 -1 -4
Total score 5 -5 4 4
E1, E2, and E3 refer to evaluator 1, 2 and 3 respectively.
From the results in Table 13, it can be observed that:
(1) Viability: two evaluators think that EBD generated more viable results than
QFD, while the other evaluator considers the opposite. The final score of the
criterion is 2, being EBD better than QFD.
(2) Product life cycle consideration: evaluator 1 thinks that the EBD generated
results have a greater consideration of the product life cycle while the other
two evaluators think that both methodologies were tied and had a poor

78
consideration of the product life cycle. The final score of the criterion is 2,
being EBD better than QFD.
(3) Customers’ identification: evaluators 1 and 3 think that the EBD generated
results identify more customers than the QFD one. Evaluator 2 believes that
both methodologies were tied and poor identifying the customers. The final
score of the criterion is 6, being EBD better than QFD.
(4) Customers’ requirements identification: two evaluators think that EBD
identified more customers’ requirements than QFD while one evaluator
considers the opposite. The final score of the criterion is -1, being QFD better
that EBD because evaluator 2 ranked higher score for QFD than the one
assigned for the other 2 evaluators for EBD.
(5) Customer requirements prioritization: two evaluators think that QFD
customer’s requirements prioritization was better than EBD. The other
evaluator thinks that EBD and QFD were tied. The final score of the criterion
is -11, being QFD better than EBD.
(6) Conflict identification / functional requirements relationship: evaluator 1
thinks that EBD identified more conflicts than QFD while evaluator 2
considers the opposite. Evaluator 3 believes that there was a draw between
EBD and QFD. The final score of the criterion is 0; hence, EBD and QFD are
tied.
(7) Conformance / completeness of the generated results: two evaluators think
that EBD was better than QFD while the other one considers the opposite. The
final score of the criterion is 3, being EBD better than QFD.

79
(8) Ease to understand the results: two evaluators believe that results generated by
EBD were clearer and easier to understand than the ones generated by QFD.
The other evaluator thinks that both methodologies generated similar outputs.
The final score of the criterion is 7, being EBD better than QFD.
(9) Performance / measurability of functional requirements: two evaluators think
that the engineering requirements developed by QFD are more measurable
than the ones generated by EBD; the other evaluator believes the opposite.
The final score of the criterion is -4, being QFD better than EBD.
Overall EBD performed better in 5 criterions which are viability, product life cycle
consideration, customer’s identification, conformance/completeness of the generated
results, and ease to understand the results than QFD while they tied in the conflict
identification/functional requirements relationships one. QFD performed better than EBD
in the remaining criterions. The final score for the design problem was 4; therefore, the
hypothesis cannot be rejected.
Evaluation results design problem 3:
The third design problem will be analyzed using the same direction as the previous ones.

80
Table 14: Evaluation results design problem 3
Criteria
Design problem 3
EBD QFD EBD-QFD Total score E1 E2 E3 E1 E2 E3 E1-E1 E2-E2 E3-E3
Viability 8 6 7 8 4 5 0 2 2 4
Product life cycle
consideration 7 1 0 7 1 0 0 0 0 0
Customers' identification 7 1 6 7 1 3 0 0 3 3
Customers' requirements
identification 7 8 8 7 9 7 0 -1 1 0
Customers' requirements
prioritization 7 9 6 10 1 7 -3 8 -1 4
Conflict identification /
functional requirements
relationships 7 9 7 10 8 5 -3 1 2 0
Conformance /
completeness of the
generated results 7 9 8 8 2 6 -1 7 2 8
Ease to understand the
results 8 8 9 8 5 5 0 3 4 7
Performance /
measurability of
functional requirements 0 1 8 5 5 4 -5 -4 4 -5
Total score -12 16 17 21
E1, E2, and E3 refer to evaluator 1, 2 and 3 respectively.
From the results in Table 14, it can be observed that:
(1) Viability: two evaluators think that EBD generated more viable results than
QFD, while the other evaluator considers a draw. The final score of the
criterion is 4, being EBD better than QFD.
(2) Product life cycle consideration: the three evaluators think that there is a draw
for this criterion. Two evaluators think that both methodologies had a poor
consideration of the product life cycle. The final score of the criterion is 0;
hence, EBD and QFD are tied.

81
(3) Customers’ identification: evaluator 3 thinks that the EBD generated results
identify more customers than the QFD one. Evaluators 1 and 2 believe that
both methodologies were tied identifying the customers. The final score of the
criterion is 3, being EBD better than QFD.
(4) Customers’ requirements identification: evaluator 3 thinks that EBD identified
more customers’ requirements than QFD while evaluator 2 considers the
opposite. Evaluator 1 believes that EBD and QFD were tied. The final score
of the criterion is 0; hence, EBD and QFD are tied.
(5) Customer requirements prioritization: two evaluators think that QFD
customer’s requirements prioritization was better than EBD while the other
evaluator thinks the opposite. The final score of the criterion is 4, being EBD
better than QFD because evaluator 2 ranked higher score for EBD than the
one assigned for the other 2 evaluators for QFD.
(6) Conflict identification / functional requirements relationship: evaluators 2 and
3 think that EBD identified more conflicts than QFD while evaluator 1
considers the opposite. The final score of the criterion is 0; hence, EBD and
QFD are tied.
(7) Conformance / completeness of the generated results: two evaluators think
that EBD was better than QFD while the other one considers the opposite. The
final score of the criterion is 8, being EBD better than QFD.
(8) Ease to understand the results: two evaluators believe that results generated by
EBD were clearer and easier to understand than the ones generated by QFD.

82
The other evaluator thinks that both methodologies generated similar outputs.
The final score of the criterion is 7, being EBD better than QFD.
(9) Performance / measurability of functional requirements: two evaluators think
that the engineering requirements developed by QFD are more measurable
than the ones generated by EBD; the other evaluator believes the opposite.
The final score of the criterion is -5, being QFD better than EBD.
Overall EBD performed better in 5 criterions which are viability, customer’s
identification, customer’s requirements prioritization, conformance/completeness of the
generated results, and ease to understand the results than QFD while they tied in the
product life cycle consideration, customer’s requirements identification, and conflict
identification/functional requirements relationships ones. QFD achieved better results
than EBD in the performance/measurability of functional requirements criterion. The
final score for the design problem was 21; therefore, the hypothesis cannot be rejected.
3.2.4.2 Analyzed results summary
In this summary, the total score for each design problem were summed up per criteria in
order to obtain a final total score for the case study. After that, the following three
possible scenarios were able to happened, and based on each of them, also the following
could be concluded:
1. If the result is positive, EBD was better for the perception of the evaluator.
2. If the result is negative, QFD was better for the perception of the evaluator.
3. If the result is 0, EBD and QFD were tied for the perception of the evaluator.

83
In order to verify if the designers overcame the difficulties of the design problems, and to
evaluate if the generated results are complete; each criterion will be evaluated and a
conclusion will be driven based on the total final score of the design problems.
Table 15: Summary of the analyzed results
Criteria
Analyzed results summary
Design problems scores Total final score DP1 DP2 DP3
Viability 6 2 4 12
Product life cycle consideration 2 2 0 4
Customers' identification 2 6 3 11
Customers' requirements
identification 0 -1 0 -1
Customers' requirements
prioritization -8 -11 4 -15
Conflict identification /
functional requirements
relationships 4 0 0 4
Conformance / completeness of
the generated results 3 3 8 14
Ease to understand the results 13 7 7 27
Performance / measurability of
functional requirements 13 -4 -5 4
Total score/design problem 35 4 21 60
DP1, DP2, and DP3 refer to design problem 1, 2 and 3 respectively.
From the results in Table 15 can be concluded that:
(1) Viability: EBD generated more viable results than QFD for the three design
problems. The final score of the criterion is 12, being EBD better than QFD.

84
(2) Product life cycle consideration: EBD had greater life cycle consideration in
the design problems 1 and 2 than QFD while they tied for the design problem
3. The final score of the criterion is 4, being EBD better than QFD.
(3) Customers’ identification: EBD performed better than QFD identifying the
different customers in the three design problems. The final score of the
criterion is 11, being EBD better than QFD.
(4) Customers’ requirements identification: QFD identified more customers’
requirements than EBD for the second design problem while they tied in the
other two design problems. The final score of the criterion is -1, being QFD
better than EBD.
(5) Customer requirements prioritization: QFD performed better than EBD
prioritizing the customers’ requirements for two design problems while EBD
was better for the third design problem. The final score of the criterion is -15,
being QFD better than EBD.
(6) Conflict identification / functional requirements relationship: EBD identified
more conflicts than QFD for the design problem 1 while they tied for the other
two design problems. The final score of the criterion is 4, being EBD better
than QFD.
(7) Conformance / completeness of the generated results: EBD generated more
complete results than QFD for the three design problems. The final score of
the criterion is 14, being EBD better than QFD.

85
(8) Ease to understand the results: EBD results were clearer and easier to
understand than the QFD ones for the three design problems. The final score
of the criterion is 27, being EBD better than QFD.
(9) Performance / measurability of functional requirements: EBD generated more
measurable functional requirements than QFD for the design problem 1 while
QFD was better for the other two design problems. The final score of the
criterion is 4, being EBD better than QFD because the results for the design
problem 1 were greater than the results of the other two design problems
together.
Overall EBD performed better than QFD in 7 criterions which are viability, product life
cycle consideration, customer’s identification, conflict identification/functional
requirements relationships, conformance/completeness of the generated results, ease to
understand the results, and performance/measurability of functional requirements. QFD
achieved better results than EBD in the customer’s requirements identification, and
customer’s requirements prioritization criterions. The total final score for the case study
was 60; therefore, the hypothesis cannot be rejected.

86
Chapter 4: Conclusions and Future Work
In the present thesis, EBD and QFD design methodologies were compared in order to
have preliminary conclusions for the hypothesis that EBD helps inexperience designers to
cope the difficulties encountered in the product definition process in addition to providing
more complete results than by using QFD. EBD and QFD were also compared to the
product definition process in order to understand how both methodologies meet the
requirements involved in it. After that, a case study of three design problems was solved
using each methodology, and a set of criteria was created with the purpose of being able
to compare the results generated by EBD and QFD. Furthermore, the results evaluation
was done by three different evaluators for the comparison to be more objective.
4.1 Conclusions
The design process has a great impact in the cost, quality and time to launch a new
product to the market plus the fact that many engineering students lack of the vast
experience required in the labour market; with the current thesis is preliminary shown
that EBD is a promising design methodology that should be learnt and taught in design
courses in order to help inexperience designers (students) to overcome the design
difficulties for defining a new product.
The set of criteria used in the current thesis in order to compare EBD and QFD was
developed taking into consideration some of the main parameters that show success in a
designed product such as quality, product life cycle, and viability.
After evaluating the results generated by using EBD and QFD, the following can be
preliminarily concluded:

87
The thesis hypothesis cannot be rejected. Therefore, EBD helps inexperience
designers to overcome the difficulties encountered in the product definition
process and provide more complete results than by using QFD.
From Table 15, EBD has a greater total final score (60) than QFD, being
unquestionably better in the three design problems.
Since EBD did preliminarily better than QFD, I would highly recommend to learn
and use EBD in order to be able to meet all the important requirements present in
the product definition process.
4.2 Future work
In the future, some work can be done in different directions such as:
Since the results that were obtained are preliminary, more research can be
performed to fully validate this study.
The developed set of criteria can be used to compare any other design
methodologies; so, in the journey of helping inexperience designers, EBD can be
compared to any other design methodology.
Some research can be performed in order to study the possibility that EBD can be
merged or associated with other design methodologies such as Design For Six
Sigma (DFSS), Systematic Design Methodology, Axiomatic Design, Decision-
Based Design Theory, or AI-Based Design Theory. Besides that, other tools such
as Design of Experiments (DOE), Failure Mode and Effect Analysis (FMEA) and
Optimization can be incorporated when designing a product using EBD.

88
Appendix
Appendix A
EBD Example: Developing a Quality Manual for Environment Monitoring System
in a City” by Sun and Zeng (Sun, et al., 2011)
The background information is that:
“City of Edmonton, Alberta, Canada, runs a monitoring program to monitor
and report the performance of the city’s drainage system (City of Edmonton,
Asset Management and Public Works, Drainage Services, 2004). Under the
obligation of ISO 9001 and ISO 14001, the city’s monitoring group (the
customer, hereafter) decided to develop and implement a quality management
manual to provide higher quality and more efficient services with current
available resources (Sun, et al., 2011)”.
The objective of the design problem in example is summarized as follows: “Develop a
quality manual for current monitoring system to meet quality requirements and to provide
efficient services” (Sun, et al., 2011).
Hence, since the design problem is already described, the first step is to create a ROM
diagram, and it can be found in Figure 34.

89
Figure 34: EBD example, ROM of requirements description (Sun, et al., 2011)
After the ROM diagram is drawn, the second, third and fourth steps are done iteratively.
From the ROM diagram, the component manual is the most important because it has the
most undefined constraint relations. Therefore, generic questions should be asked firsts
about objects constraining it such as “monitoring system”, “quality requirements”,
“efficient service”, and “quality manual”. For instance, a generic question is “what kinds
of quality requirements should be met?”, and its respective answer is ISO 9001 and ISO
24511. After, more questions can be asked about ISO 9001 and ISO 24511 such as “what
is the related information in ISO 24511?” and so on. Based on the answers, the ROM
diagram can be updated.
Questions about the relation objects “meet” and “provide” should be asked when the
questions about the environment components are finished. Using “meet” as example,
“how to meet?” can be asked. The quality requirements content should be analyzed to

90
answer the previous question. Steps 2, 3, and 4 continue until there are no more unclear
objects and relationships between them in the updated ROM and the customer’s real
intent is understood.
The fifth, sixth and seventh steps start when the conditions in the fourth step are met.
Domain specific questions are asked concerning to the life cycle of the product to be
designed. For instance, the first domain specific question to ask is: “what is the life cycle
of the manual?” and its respective answer is design, communication, use and maintenance
because the quality manual is specialized for the monitoring group.

91
Figure 35: EBD example, Generic and domain specific questions (City of Edmonton, Asset
Management and Public Works, Drainage Services, 2004)
Refer to Figure 35 to see the complete set of generic and domain specific questions asked
in the example by Sun and Zeng.
For each stage of the life cycle identified, the related components and requirements are
further classified into built, human, and natural environment. After that, the component
relationships are analyzed. Refer to Figure 36.

92
Figure 36: EBD example, Requirement classification (City of Edmonton, Asset Management and
Public Works, Drainage Services, 2004)
After the previous steps are completed, the final step of environment analysis is done by
updating the ROM (Figure 37) with the previous answers. Figure 37 also provides a clear
map of the quality management manual to be designed.

93
Figure 37: EBD example, Updated ROM diagram (City of Edmonton, Asset Management and Public
Works, Drainage Services, 2004)
The updated ROM in Figure 37 is the basis for the conflict identification phase, and from
it, it is evident that there interdependent relations between the environment components
meaning that that there are conflicts. The found conflicts are listed in Figure 38.

94
Figure 38: EBD example, Conflicts (Sun, et al., 2011)
For instance, conflict 3 (c3) in Figure 38 comes from that technologists complain that
their workload is too heavy while the city of Edmonton wants that the new monitoring
system is economical to use.
After the conflicts have been identified in Figure 38, the rules for solution generation are
followed. Figure 39 and Figure 40 show the directed graph and adjacency matrix
respectively of the conflicts identified in Figure 38.

95
Figure 39: EBD example, Directed graph – Dependencies among conflicts (Sun, et al., 2011)
Figure 40: EBD example, Adjacency matrix (Sun, et al., 2011)
From Figure 40, since all the entry values for the columns c5, c8, c9, and 10 are zero;
they are the root conflicts for the monitoring system. Therefore, once these conflicts are
solved, the other ones will be removed or changed.

96
According to (Sun, et al., 2011), at this point, based on the previous analysis, it is known
what should be included in the manual, and they claim that the manual should focus on
“solving the problems caused by human operations, eliminating unnecessary human
operations, defining the efficient sequence of monitoring operations, developing
improvement activities and managing documents efficiently”. The current monitoring
system is analyzed again with EBD in order to get the final quality manual.
In this case, the monitoring system gives information for assessment and control of the
existing drainage system performance besides the monitoring report the requirements of
City Environment Department and agreements with organizations outside of the city
(City of Edmonton, Asset Management and Public Works, Drainage Services, 2004). The
environment components are detailed in Figure 41.

97
Figure 41: EBD example, Environment components in the monitoring system (Sun, et al., 2011)
Therefore, after analyzing all the important components, Figure 42 displays the relations
between them.

98
Figure 42: EBD example, Relations between environment components (Sun, et al., 2011)
From Figure 42 and the operation process analysis, (Sun, et al., 2011) state that in data
quality assurance and control (QA/QC) process, a critical conflict was found about
human operations. Hence, human operations in QA/QC are the key to solve the conflicts
related to human operations.
QA/QC is carried out manually and based on experience in the current monitoring system
occasioning two main human errors. The first one is related to the manual checking
Natural
Eq
uip
men
t
Transfer
information
through
N/A Measure Selected &
Used by N/A
Installed
by Stay in
WIS
KI
Sy
stem
Transfer &
Save data
of
Transfer &
Save data
of
Transfer &
Save data
of
Transfer
information
to
Transfer
information
to
Transfer
information
to
N/A
GIS
Sy
stem
N/A
Transfer
information
through
N/A Used by N/A N/A
Guide the
selection
of
Dra
ina
ge
Sy
stem
Measured
by
Transfer
information
through
N/A
Monitored
by/Working
place
Managed
by
Working
place Offers
Em
plo
yee
Select &
Use
Transfer
information
through
Use Monitor &
Work in Work for Request Select
Cu
sto
mer
N/A
Transfer
information
through
N/A Manage Request N/A N/A
Co
ntr
acto
r
Install
Transfer
information
through
N/A Work in Obey N/A Work in
Na
tura
l
Sit
e
Hold N/A Selected
based on Belong to Selected by N/A
Working
place
Site
Bu
ilt
Hu
ma
n
GIS
System
Monitoring
program
Built Human
Equipment WISKI
System
Drainage
System Employee Customer Contractor

99
process that overloads the technologists leading to poor data quality. The second one is
concern to data problems that cannot be identified without comprehensive data analysis.
Hence, the human errors can be solved and data quality can be improved by
implementing new technologies/techniques that replace human operations and eliminate
unnecessary operations in the QA/QC process.
Due to the property of the conflicts, a computer program instead of human beings can be
used for the QA/QC process. The program should deal with data rationality and
effectiveness check, data drifting check, and data sudden change check. (Sun, et al.,
2011) think that the advantages of automating the QA/QC process are to enhance quality
and accuracy of data, assurance, improve the efficiency of data quality assurance and to
avoid human errors by relieving technologists overload.
(Sun, et al., 2011) state that the correct sequence of all monitoring performance is shown
in Figure 43, and it come from checking each monitoring activity and analyzing the
relations the performances in Figure 42. Also, with the sequence in Figure 43, the
monitoring technologists and contractors are informed about what to do first and after
some specific tasks. As result, a standard operation is constructed ensuring the
effectiveness and efficiency of the monitoring operation.

100
Figure 43: EBD example, Sequence of Monitoring Activities (Sun, et al., 2011)
With the correct sequence of working activities and the ideal template of quality
requirements in (Sun, Feng, & Zeng, 2010), the quality manual can be improved.
Therefore, on the one hand, the operation instructions can be improved by comparing the
quality requirements to the current operation state. On the other hand, proper items from
the quality requirement template can be chosen and followed in the quality manual
ensuring it meets the quality requirements besides having enough information to support
the operation instructions. An example showing the main contents of the developed
quality manual is displayed in Figure 44.

101
Figure 44: EBD example, Sample manual – manual for quality assurance (Sun, et al., 2011)
(Sun, et al., 2011) conclude that the content of the manual was not precisely defined in
the beginning; however, by using EBD, they were able to clarify the goals of the project
step by step and to guide the project members to follow the right path. Additionally, they
found out that that two main deliverables were needed, a quality manual and data
processing tool.

102
Appendix B
QFD Example: BikeE suspension system by (Ullman, 2003)
Based on the example used by (Ullman, 2003), the main customers for the BikeE
suspension system are the bicycle riders, and they can be of two types. The first type uses
the bicycles solely on streets while the second one rides on rough roads or trails.
However, there are also other customers to consider such as manufacturing, assembly,
shipping personnel, bicycle shops and mechanics. The last two customers are often the
same people. However, for further QFD explanation, only street rider and bike shop
sales-repair customers will be considered. Refer to the complete HOQ of the BikeE
suspension system in Figure 46.
The design team used surveys and interviews to collect the requirements in Figure 45.
Figure 45: List of customer’s requirements for the BikeE suspension system (Ullman, 2003)

103
Figure 46: HOQ BikeE suspension system (Ullman, 2003)
It is important that the customer’s requirement list is made of what is needed in the
product not how it will look or work. After the list has been developed, the requirements

104
are compared to the list of requirements in Table 6. The objective is to group the
requirements using the major categories shown Table 6 and to revise the completeness of
the list. After the revision is done, requirement additions and omissions can be done.
When the customer’s requirements are complete, the place of the “what” in the HOQ
(Figure 21) is filled. However, only the customer’s requirements that are related to
function and are not directly measurable in the customer requirements list are included in
the HOQ with the purpose of translating them to measurable technical requirements in
the next steps. For that reason, the cost and weight requirements listed in Figure 45 are
not included in Figure 46.
In the next step, the customer’s requirements were ranked. Refer to Figure 46 to see how
it was done.
After ranking the customers’ requirements, three competitors where benchmarked (refer
to Figure 46). In the place of “now vs. what” in Figure 21, the average results from street
riders are shown in Figure 46.
The engineering specifications are shown in Figure 46 in the corresponding place of the
“how” in Figure 21. It is important to pay attention to the units of measures and the
directions of improvements provided by the arrows in Figure 46.
The next step was to relate the customer’s requirements to engineering specifications,
refer to Figure 46 which displays the relations.
The bottom of the HOQ in Figure 46 contains the information of the target. For instance,
for the engineering specification “Rider weight range”, the unit of measure is “lbs” and

105
the improvement direction is more is better (). The competitors were evaluated to
measure how they meet the engineering specifications and BikeE CT is the best now with
100 lbs, while Mountain Bike is the worst with 20 lbs. Therefore, since more is better and
with the competitor’s evaluation information, the design team decided to establish as
delighting target 100 lbs and as disgusting target 50 lbs for this engineering specification.
The roof of the HOQ in Figure 46 shows the type of engineering specification
relationships. The types of relationships are described in Figure 25.

106
Appendix C
CONSENT FORM TO PARTICIPATE IN RESEARCH
This is to state that I agree to participate voluntarily in a program of research being
conducted by the student Ronaldo Gutierrez under the supervision of Dr. Yong Zeng of
Concordia University. Two copies of consent form will be given to the participant – one
to keep and one to sign and return to the researcher.
Contact information:
Ronaldo Gutierrez
Office: 1455 de Maisonneuve West, EV.S2.314, Montreal, Quebec, Canada, H3G 1M8
Tel.: +1-514-848-2424 ext. 7050 , e-mail: [email protected]
Dr. Yong Zeng
Office: 1455 de Maisonneuve West, EV.07.633, Montreal, Quebec, Canada, H3G 1M8
Tel.: +1-514-848-2424 ext. 5801, e-mail: [email protected]
A. PURPOSE
The main purpose of the research is to develop designer’s cognitive model during the
design process by using the following devices:
1) Video cameras
2) Screen recorders
3) EEG system
4) Eye movement tracking system

107
5) Heart rate variability recorder
The result of this research will be used to guide the improvements of product
development through new design methodology and new computer aided design tools.
To achieve the above objective, the research is divided into sub-goals. For this particular
work, the goal is to compare two design methods: Quality Function Deployment (QFD)
and Environment-Based Design (EBD). The following devices will be used:
1. Video cameras
2. Screen recorders
B. PROCEDURES
The experiments will take place in the lab at EV.9.235 at Concordia University. The
participator will work on 3 different design problems that will be distributed one at a
time. The time to solve the design problems will be 1, 2 and 3 hours respectively.
C. RISKS AND BENEFITS
Risks: There will be no risks in this experiment.
Benefits: Participant helps contribute to the development of design research field.
D. CONDITIONS FOR PARTICIPATION
Your participation in this research is voluntary. If you decide not to take part in the
project you are free to discontinue at any time. Your personal information will be kept
confidential. If we publish article on this research project, your identity will be protected.
I consent that my data will be collected, stored and analyzed. Yes No

108
I understand that the data from this study may be published. Yes No
I HAVE CAREFULLY STUDIED THE ABOVE AND UNDERSTAND THIS
AGREEMENT. I FREELY CONSENT AND VOLUNTARILY AGREE TO
PARTICIPATE IN THIS STUDY.
NAME (please print)
SIGNATURE
WITNESS SIGNATURE
DATE
If at any time you have questions about your rights as a research participant, please
contact Adela Reid, Research Ethics and Compliance Officer, Concordia University, at
(514) 848-7481 or by email at [email protected]

109
Appendix D
The results of the design problems 1 and 3 can be found in Appendix D. The QFD results
for the design problems 1 and 3 are displayed first, and the EBD results after.
QFD results design problem 1:
Figure 47: QFD solution for design problem 1 (page 1)

110
Figure 48: QFD solution for design problem 1 (page 2)

111
Figure 49: QFD solution for design problem 1 (page 2)

112
QFD results design problem 3:
Figure 50: QFD solution for design problem 3 (page 1)

113
Figure 51: QFD solution for design problem 3 (page 2)

114
Figure 52: QFD solution for design problem 3 (page 3)

115
Figure 53: QFD solution for design problem 3 (page 4)

116
Figure 54: QFD solution for design problem 3 (page 5)

117
EBD results design problem 1:
Figure 55: EBD solution for design problem 1 (page 1)

118
Figure 56: EBD solution for design problem 1 (page 2)

119
Figure 57: EBD solution for design problem 1 (page 3)

120
Figure 58: EBD solution for design problem 1 (page 4)
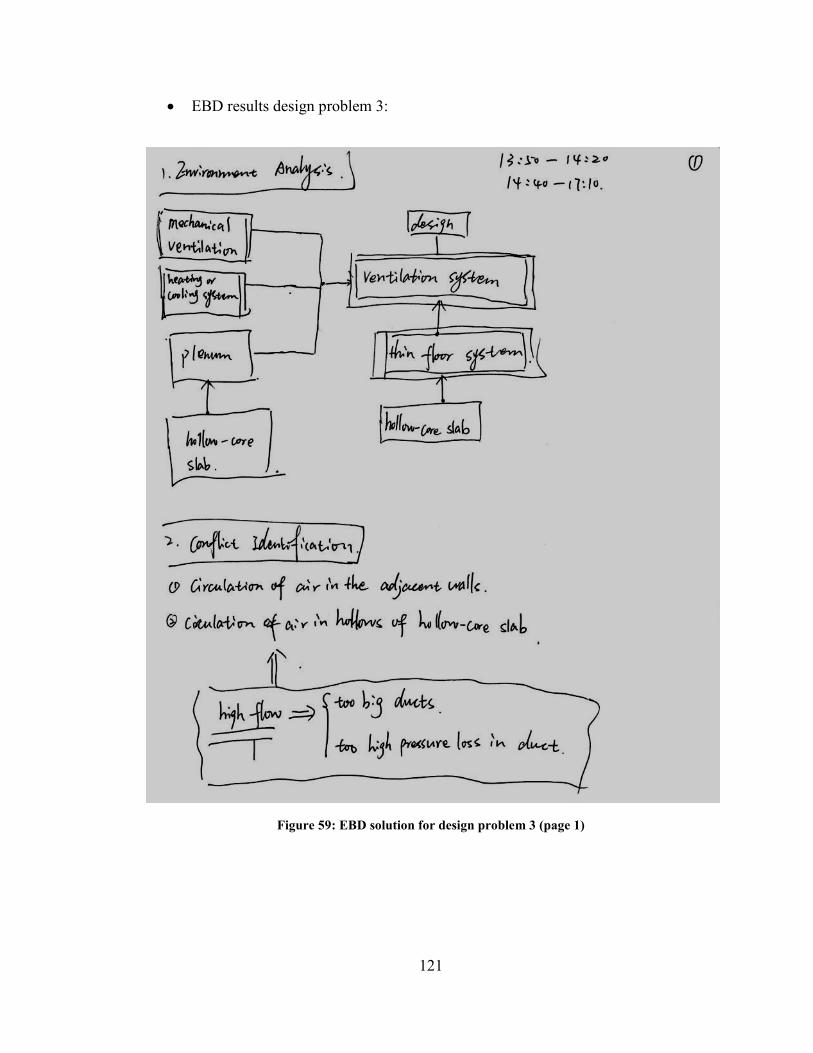
121
EBD results design problem 3:
Figure 59: EBD solution for design problem 3 (page 1)

122
Figure 60: EBD solution for design problem 3 (page 2)

123
Figure 61: EBD solution for design problem 3 (page 3)

124
Figure 62: EBD solution for design problem 3 (page 4)

125
Bibliography
Beard, C., & Easingwood, C. (1996). New product launch: Marketing action and launch
tactics for high-technology products. Industrial Marketing Management, 25(2),
87-103.
Chen, Z. Y., & Zeng, Y. (2006). Classification of Product Requirements Based on
Product Environment. Concurrent engineering: Research and Application, 14(3),
219-230.
City of Edmonton, Asset Management and Public Works, Drainage Services. (2004). The
city of Edmonton, drainage services master plan, 2004-2014, implementation and
strategies. Edmonton: City of Edmonton.
Creative Industries Research Institute. (2007). Quality Function Deployment. Retrieved
from AUT University: http://www.ciri.org.nz/resources.html
Daikin. (2011). Daikin Altherma Flex Type triple award win. (Daikin) Retrieved from
http://www.daikin.eu/corporate-home/innovation-and-quality/development-
awards/da-flex-type-awards/index.jsp
Evans, J. R., & Lindsay, W. M. (2005). An Introduction to Six Sigma & Process
Improvement. Mason: South-Western, a part of Cengage Learning.
Forbes. (2009). How Entrepreneurs Identify New Opportunities. (Forbes) Retrieved from
http://www.forbes.com/2009/11/11/identify-new-opportunities-entrepreneurs-
wharton.html

126
Frey, D. D., & Dym, C. L. (2006). Validation of design methods: lessons from medicine.
Research in Engineering Design, 17, 45-57.
Frey, D. D., & Li, X. (2004). Validating robust-parameter-design methods. Design
Engineering Technical Conferences and Computers and Information in
Engineering Conference. Salt Lake.
Frey, D. D., & Li, X. (2005). Using hierarchical probability models to evaluate robust
parameter design methods. Retrieved from
http://meche.mit.edu/documents/danfrey/danfrey_using.pdf
Frey, D. D., & Wang, H. (2006). Adaptive One-Factor-at-a-Time Experimentation and
Expected Value of Improvement. Technometrics, 48(3), 418-431.
Hearon, H., & Mazur, G. (2002). Using QFD to Improve Technical Support to Make
Commodity Products More Competitive. 14th Symposium on QFD. San Diego.
Huber, C., & Mazur, G. (2002). QFD and Design for Six Sigma. 14th Symposium on
QFD. San Diego.
iF Design. (2010). iF Design Talents. (iF Design) Retrieved from
http://www.ifdesign.de/talents_concept_design_award_kriterien_e
Info entrepreneurs. (2009). Develop new products and services. (Info entrepreneurs)
Retrieved from http://www.infoentrepreneurs.org/en/trouver-nos-guides-de-
gestion/-/asset_publisher/wXA6/content/view_maximized/developper-de-
nouveaux-produits-et-services
127
Japan Institute of Design Promotion. (2005). 2005 Outline Criteria. (Good Desing
Award) Retrieved from http://www.g-
mark.org/english/archive/2005/kijun.html#top
Khodadadeh, Y., & Mohammadpur, N. (2009, October). Redesigning a product based on
Voice of Customer. International Association of Societies of Design Research
2009. Seoul, Korea. Retrieved 05 20, 2012
LePrevost, J., & Mazur, G. (2003). Quality Infrastructure Improvement: Using QFD to
Manage Project Priorities and Project Management Resources. 15th
Symposium/9th International Symposium on QFD. Orlando.
Mazur, G. (1996). Doubling sales with Quality Function Deployment. 5th Annual Service
Quality Conference. Las Vegas.
Mazur, G. (1997). Close Encounters of the QFD Kind. 6th Annual Service Quality
Conference. Colorado Springs.
Mazur, G. (1997). Voice of customer analysis: a modern system of front-end-QFD tools,
with case studies. AQC 1997. Orlando.
Mazur, G. (2003). Voice of the customer (define): QFD to define value. 57th American
Quality Congress. Kansas.
Milani, A. S., Wang, H., Frey, D. D., & Abeyaratne, R. C. (2008). Evaluating Three DOE
Methodologies: Optimization of a Composite Laminate under Fabrication Error.
Quality Engineering, 21(1), 96–110.

128
Moroz, A. (2011). Thesis: Environment-Based Design of Software: an Agile Software
Design Method. Montreal: Concordia University.
Osterweil, L. J., & Song, X. (1996). Assuring Accuracy and Impartiality in Software
Desing Methodology Comparison. 8th International Workshop on Software
Specification and Design (IWSSD '96). USA.
Rings, C. M., Barton, B. W., & Mazur, G. (1998). Consumer Encounters: Improving Idea
Development and Concept Optimization. 10th Symposium on QFD. Novi.
Song, X., & Osterweil, L. (1994). Experience with an approach to comparing software
design methodologies. IEEE Transaction on Software Engineering, 20(5), 364-
384.
Song, X., & Osterweil, L. J. (1991). Comparing Design Methodologies Through Process
Modeling. First Internation Conference on the Software Process. Irvine,
California.
Sule, D. R. (2009). Manufacturing facilities; Location, Planning, and Design. Boca
Raton, Florida: CRC Press, Taylor and Francis Group.
Sun, X., Feng, D., & Zeng, Y. (2010). Edmonton Report. Montreal: CIISE, Concordia
University.
Sun, X., Zeng, Y., & Zhou, F. (2011). Environment-based design (EBD) approach to
developing quality management systems: a case study. Society of Design and
Process Science, 15(2), 53-70.

129
Tan, S., Zeng, Y., & Montazami, A. (2011). Medical devices design based on EBD: a
case study. In Biomedical Engineering (pp. 3-15). New York: Springer.
Terninko, J. (1997). Step-by-step QFD: Customer - Driven Product Design (2 ed.). Boca
Raton: CRC Press.
Ullman, D. G. (2003). The Mechanical Design Process. New York: McGraw-Hill Higher
Education.
Ullman, D. G. (2010). The Mechanical Design Process. New York: Mcgraw-Hill.
Verschuren, P., & Hartog, R. (2005). Evaluation in Design-Oriented Research. Quality
and Quantity, 39(6), 733-762.
Wang, M., & Zeng, Y. (2007). Gathering of product requirements based on linguistic
analysis. 17th International Conference on Flexible Automation and Intelligent
manufacturing, (pp. 250-257). Philadelphia.
Wang, M., & Zeng, Y. (2009). Asking the right questions to elicit product requirements.
International Journal of Computer Integrated Manufacturing, 22(4), 283-298.
Yan, B., & Zeng, Y. (2009). The structure of design conflicts. The 12th World
Conference on Integrated Design & Process Technology, (pp. 1-5). Alabama.
Yin, Y., Qin, S., & Holland, R. (2008, June). A 3D design performance matrix for
product design and development. 5th International Forum on Knowledge Asset
Dynamics (IKFAD 2008), pp. 221-228.

130
Zeng, Y. (2002). Axiomatic theory of design modeling. Society for Design and Process
Science, 6(3), 1-28.
Zeng, Y. (2004). Environment-based formulation of design problem. Society for Design
and Process Science, 8(4), 45-63.
Zeng, Y. (2008). Recursive object model (ROM)—Modelling of linguistic information in
engineering design. Computers in Industry, 59(6), 612-625.
Zeng, Y. (2012). Lecture notes: EBD – Solution Generation. Montreal: Yong Zeng,
Concordia University.
Zeng, Y., & Cheng, G. D. (1991). On the logic of design. Design Study, 12(3), 137-141.
Zhang, J. (2011). Thesis: An EBD approach to embedded product design. Montreal:
Concordia University.
Zhu, S., Yao, S., & Zeng, Y. (2007). A novel approach to quantifying designer's mental
stress in the conceptual design process. ASME International Design Engineering
Technical and Computers and Information in Engineering. Las Vegas.