Embed Size (px)
Citation preview

Portfolio Budget Statements 2017-18
Budget Related Paper No. 1.7
Environment and Energy Portfolio
Budget Initiatives and Explanations of Appropriations Specified by Outcomes
and Programs by Entity

ii
© Commonwealth of Australia 2017
ISBN 978-1-921069-06-2
This publication is available for your use under a Creative Commons BY Attribution 3.0
Australia licence, with the exception of the Commonwealth Coat of Arms, the Department of the
Environment and Energy logo, photographs, images, signatures and where otherwise stated.
The full licence terms are available from
http://creativecommons.org/licenses/by/3.0/au/legalcode.
Use of Department of the Environment and Energy material under a Creative Commons BY
Attribution 3.0 Australia licence requires you to attribute the work (but not in any way that
suggests that the Department of the Environment and Energy endorses you or your use of the
work).
Department of the Environment and Energy material used 'as supplied'
Provided you have not modified or transformed Department of the Environment and Energy
material in any way including, for example, by changing the Department of the Environment
and Energy text, calculating percentage changes, graphing or charting data, or deriving new
statistics from published Department of the Environment and Energy statistics – then the
Department of the Environment and Energy prefers the following attribution:
Source: The Australian Government Department of the Environment and Energy
Derivative material
If you have modified or transformed Department of the Environment and Energy material, or
derived new material from those of the Department of the Environment and Energy in any way,
then the Department of the Environment and Energy prefers the following attribution:
Based on the Australian Government Department of the Environment and Energy data
Use of the Coat of Arms
The terms under which the Coat of Arms can be used are set out on the It’s an Honour website
(see www.itsanhonour.gov.au)
Other uses
Enquiries regarding this licence and any other use of this document are welcome at:
First Assistant Secretary, Policy Analysis and Implementation Division, Department of the
Environment and Energy on 02 6274 1590.

iii
THE HON JOSH FRYDENBERG MP MINISTER FOR THE ENVIRONMENT AND ENERGY
PARLIAMENT HOUSE
CANBERRA 2600
President of the Senate
Australian Senate
Parliament House
CANBERRA ACT 2600
Speaker
House of Representatives
Parliament House
CANBERRA ACT 2600
Dear Mr President
Dear Mr Speaker
I hereby submit Portfolio Budget Statements in support of the 2017-18 Budget for the
Environment and Energy Portfolio.
These statements have been developed, and are submitted to the Parliament, as a
statement on the outcomes for the Portfolio.
I present these statements to provide accountability to the Parliament and, through it,
the public.
Yours sincerely
Josh Frydenberg

iv
Abbreviations and conventions
The following notation may be used:
NEC/nec not elsewhere classified
- nil
.. not zero, but rounded to zero
na not applicable (unless otherwise specified)
nfp not for publication
$m $ million
$b $ billion
Figures in tables and in the text may be rounded. Figures in text are generally rounded
to one decimal place, whereas figures in tables are generally rounded to the nearest
thousand. Discrepancies in tables between totals and sums of components are due to
rounding.
Enquiries
Should you have any enquiries regarding this publication please contact, Chief
Financial Officer, Department of the Environment and Energy on (02) 6274 2203.
Links to Portfolio Budget Statements (including Portfolio Additional Estimates
Statements and Portfolio Supplementary Additional Statements) can be located on the
Australian Government Budget website at: www.budget.gov.au.

v
USER GUIDE TO THE
PORTFOLIO BUDGET STATEMENTS

vi
USER GUIDE
The purpose of the 2017-18 Portfolio Budget Statements (PB Statements) is to inform
Senators and Members of Parliament of the proposed allocation of resources to
government outcomes by entities within the portfolio. Entities receive resources from
the annual appropriations acts, special appropriations (including standing
appropriations and special accounts), and revenue from other sources.
A key role of the PB Statements is to facilitate the understanding of proposed annual
appropriations in Appropriation Bills (No. 1 and No. 2) 2017-18 (or Appropriation
(Parliamentary Departments) Bill (No. 1) 2017-18 for the parliamentary departments).
In this sense, the PB Statements are Budget related papers and are declared by the
Appropriation Acts to be ‘relevant documents’ to the interpretation of the Acts
according to section 15AB of the Acts Interpretation Act 1901.
The PB Statements provide information, explanation and justification to enable
Parliament to understand the purpose of each outcome proposed in the Bills.
As required under section 12 of the Charter of Budget Honesty Act 1998, only entities
within the general government sector are included as part of the Commonwealth
general government sector fiscal estimates and produce PB Statements where they
receive funding (either directly or via portfolio departments) through the annual
appropriation acts.
The Enhanced Commonwealth Performance Framework.
The following diagram outlines the key components of the enhanced Commonwealth
performance framework. The diagram identifies the content of each of the publications
and the relationship between them. Links to the publications for each entity within the
Portfolio can be found in the introduction to Section 2: Outcomes and planned
performance.

vii


ix
CONTENTS
PORTFOLIO OVERVIEW ............................................................................................... 1
Environment and Energy Portfolio overview ................................................................... 3
ENTITY RESOURCES AND PLANNED PERFORMANCE ........................................... 9
Department of the Environment and Energy ................................................................. 11
Australian Renewable Energy Agency .......................................................................... 91
Bureau of Meteorology ................................................................................................ 111
Clean Energy Finance Corporation ............................................................................. 135
Clean Energy Regulator .............................................................................................. 163
Climate Change Authority ........................................................................................... 189
Director of National Parks ........................................................................................... 209
Great Barrier Reef Marine Park Authority ................................................................... 231
Sydney Harbour Federation Trust ............................................................................... 261


1
PORTFOLIO OVERVIEW


3
ENVIRONMENT AND ENERGY PORTFOLIO OVERVIEW
Minister and Portfolio responsibilities
The Environment and Energy Portfolio is led by the Minister for the Environment and
Energy and comprises the Department of the Environment and Energy and eight other
entities.
Department of the Environment and Energy
The Department of the Environment and Energy advises on, and implements,
environment and energy policy to support the Government in achieving a healthy
environment, strong economy and thriving community now and into the future. The
Department of the Environment and Energy is responsible for the following outcomes:
Outcome 1: Conserve, protect and sustainably manage Australia’s biodiversity,
ecosystems, environment and heritage through research, information
management, supporting natural resource management, establishing and
managing Commonwealth protected areas, and reducing and regulating the use of
pollutants and hazardous substances.
Outcome 2: Reduce Australia’s greenhouse gas emissions, adapt to the impacts of
climate change, contribute to effective global action on climate change, and
support technological innovation in clean and renewable energy, through
developing and implementing a national response to climate change.
Outcome 3: Advance Australia’s strategic, scientific, environmental and economic
interests in the Antarctic region by protecting, administering and researching the
region.
Outcome 4: Support the reliable, sustainable and secure operations of energy
markets through improving Australia's energy efficiency, performance and
productivity for the community.
Australian Renewable Energy Agency
The Australian Renewable Energy Agency is a Corporate Commonwealth Entity1
established under the Australian Renewable Energy Agency Act 2011. The Australian
Renewable Energy Agency is responsible for the Outcome:
1 ‘Corporate Commonwealth Entity’ as defined under the Public Governance, Performance and Accountability Act 2013.

Portfolio overview
4
Support improvements in the competitiveness of renewable energy and related
technologies and the supply of renewable energy by administering financial
assistance, developing analysis and advice about, and sharing information and
knowledge with regard to, renewable energy and related technologies.
The Australian Renewable Energy Agency’s key objectives are to improve the
competitiveness of renewable energy technologies and increase the supply of
renewable energy. Its responsibilities include providing financial assistance for the
research, development, demonstration, deployment and commercialisation of
renewable energy and related technologies, and the storage and sharing of knowledge
and information about renewable energy technologies. The Agency jointly manages
the Clean Energy Innovation Fund with the Clean Energy Finance Corporation. The
Australian Renewable Energy Agency collects, analyses, interprets and disseminates
information and knowledge relating to renewable energy and related technologies and
provides advice to the Minister for the Environment and Energy about these
technologies and the renewable energy industry in Australia.
Bureau of Meteorology
The Bureau of Meteorology is a Non-corporate Commonwealth Entity2 and an
Executive Agency3 operating under the Meteorology Act 1955 and the Water Act 2007.
The Bureau of Meteorology is responsible for the Outcome:
Informed safety, security and economic decisions by governments, industry and
the community through the provision of information, forecasts, services and
research relating to weather, climate and water.
The Bureau of Meteorology is Australia’s national meteorological authority. Its
products and services include a dynamic range of observations, forecasts, warnings,
analysis and advice covering Australia’s atmosphere, water, oceans and space
environments. The Bureau of Meteorology’s work supports all Australians, including
the Australian Defence Force and key sectors such as emergency management,
aviation, transport, water management, agriculture and environmental management.
Clean Energy Finance Corporation
The Clean Energy Finance Corporation is a Corporate Commonwealth Entity
established under the Clean Energy Finance Corporation Act 2012. The Clean Energy
Finance Corporation is responsible for the Outcome:
2 ‘Non-corporate Commonwealth Entity’ as defined under the Public Governance, Performance and Accountability Act 2013. 3 ‘Executive Agency’ as defined under the Public Service Act 1999.

Portfolio overview
5
Facilitate increased flows of finance into Australia's clean energy sector, applying
commercial rigour to investing in renewable energy, low-emissions and energy
efficiency technologies, building industry capacity, and disseminating information
to industry stakeholders.
The Clean Energy Finance Corporation seeks to mobilise capital investment in
renewable energy, low-emissions technology and energy efficiency in Australia
through commercial loans, equity investments and in limited circumstances, loan
guarantees. This includes three funding programs as directed by the Government
through its Investment Mandate. One of these funding programs is the Clean Energy
Innovation Fund which is a joint arrangement between the Clean Energy Finance
Corporation and the Australian Renewable Energy Agency.
Clean Energy Regulator
The Clean Energy Regulator is a Non-corporate Commonwealth Entity established
under the Clean Energy Regulator Act 2011. The Clean Energy Regulator is responsible
for the Outcome:
Contribute to a reduction in Australia's net greenhouse gas emissions, including
through the administration of market based mechanisms that incentivise reduction
in emissions and the promotion of additional renewable electricity generation.
The Clean Energy Regulator provides data and information to Commonwealth
organisations for policy development and to meet international reporting obligations.
In addition, this information and data is provided to state and territory organisations
to reduce their need to duplicate emissions and energy reporting.
Climate Change Authority
The Climate Change Authority is a Non-corporate Commonwealth Entity and a
Statutory Agency4 operating under the Climate Change Authority Act 2011. The Climate
Change Authority is responsible for the Outcome:
Provide expert advice to the Australian Government on climate change mitigation
initiatives, including through conducting regular and specifically commissioned
reviews and through undertaking climate change research.
Director of National Parks
The Director of National Parks is a Corporate Commonwealth Entity operating under
the Environment Protection and Biodiversity Conservation Act 1999. The Director of
National Parks is responsible for the Outcome:
4 ‘Statutory Agency’ as defined under the Public Service Act 1999.

Portfolio overview
6
Management of Commonwealth reserves as outstanding natural places that
enhance Australia’s well-being through the protection and conservation of their
natural and cultural values, supporting the aspirations of Aboriginal and Torres
Strait Islander people in managing their traditional land and sea country, and
offering world class natural and cultural visitor experiences.
The Director of National Parks manages the Commonwealth’s terrestrial and marine
reserves and conservation zones and provides national leadership in protected area
management.
Great Barrier Reef Marine Park Authority
The Great Barrier Reef Marine Park Authority is a Non-corporate Commonwealth
Entity and is a Statutory Agency operating under the Great Barrier Reef Marine Park
Act 1975. The Great Barrier Reef Marine Park Authority is responsible for the Outcome:
The long-term protection, ecologically sustainable use, understanding and
enjoyment of the Great Barrier Reef for all Australians and the international
community, through the care and development of the Marine Park.
The Great Barrier Reef Marine Park Authority works to protect and conserve the
World Heritage values of the Great Barrier Reef.
Sydney Harbour Federation Trust
The Sydney Harbour Federation Trust is a Corporate Commonwealth Entity and
operates under the Sydney Harbour Federation Trust Act 2001. The Sydney Harbour
Federation Trust is responsible for the Outcome:
Enhanced appreciation and understanding of the natural and cultural values of
Sydney for all visitors, through the remediation, conservation and adaptive re-use
of, and access to, Trust lands on Sydney Harbour.
The Sydney Harbour Federation Trust is responsible for conserving and planning the
future uses of former military bases and other Commonwealth land around Sydney
Harbour.
For information on resourcing across the Portfolio, please refer to Part 1: Agency
Financial Resourcing in Budget Paper No. 4: Agency Resourcing.

Portfolio overview
7
Figure 1: Environment and Energy Portfolio structure and outcomes
Clean Energy Finance CorporationActing Chief Executive Officer - Mr Andrew Powell
Outcome: Facilitate increased flows of finance into Australia's clean energy sector, applying commercial rigour to investing in renewable energy, low-emissions and energy efficiency technologies, building industry
capacity, and disseminating information to industry stakeholders.
Bureau of MeteorologyDirector - Dr Andrew Johnson
Outcome: Informed safety, security and economic decisions by governments, industry and the community through the provision of information, forecasts, services and research relating to weather, climate and water.
Department of the Environment and EnergyPortfolio Secretary - Dr Gordon de Brouwer
Outcome 1: Conserve, protect and sustainably manage Australia’s biodiversity, ecosystems, environment and heritage through research, information management, supporting natural resource management, establishing and managing Commonwealth protected areas, and reducing and regulating the use of
pollutants and hazardous substances.
Outcome 2: Reduce Australia’s greenhouse gas emissions, adapt to the impacts of climate change, contribute to effective global action on climate change, and support technological innovation in clean and
renewable energy, through developing and implementing a national response to climate change.Outcome 3: Advance Australia’s strategic, scientific, environmental and economic interests in the Antarctic
region by protecting, administering and researching the region.Outcome 4: Support the reliable, sustainable and secure operations of energy markets through improving
Australia's energy efficiency, performance and productivity for the community.
Minister for the Environment and Energy The Honourable Josh Frydenberg MP
Clean Energy RegulatorActing Chief Executive Officer - Ms Jody Swirepik
Outcome: Contribute to a reduction in Australia's net greenhouse gas emissions, including through the administration of market based mechanisms that incentivise reduction in emissions and the promotion of
additional renewable electricity generation.
Sydney Harbour Federation TrustExecutive Director - Ms Mary Darwell
Outcome: Enhanced appreciation and understanding of the natural and cultural values of Sydney for all visitors, through the remediation, conservation and adaptive re-use of, and access to, Trust lands on Sydney
Harbour.
Great Barrier Reef Marine Park AuthorityChairperson - Dr Russell Reichelt
Outcome: The long-term protection, ecologically sustainable use, understanding and enjoyment of the Great Barrier Reef for all Australians and the international community, through the care and development of the
Marine Park.
Director of National ParkesDirector - Ms Sally Barnes
Outcome: Management of Commonwealth reserves as outstanding natural places that enhance Australia's well-being through the protection and conservation of their natural and cultural values, supporting the
aspirations of Aboriginal and Torres Strait Islander people in managing their traditional land and sea country, and offering world class natural and cultural visitor experiences.
Climate Change Authority Acting Chief Executive Officer - Ms Shayleen Thompson
Outcome: Provide expert advice to the Australian Government on climate change mitigation initiatives, including through conducting regular and specifically commissioned reviews and through undertaking
climate change research.
Australian Renewable Energy AgencyChief Executive Officer - Mr Ivor Frischknecht
Outcome: Support improvements in the competitiveness of renewable energy and related technologies and the supply of renewable energy by administering financial assistance, developing analysis and advice about, and sharing information and knowledge with regard to, renewable energy and related technologies.


9
ENTITY RESOURCES AND PLANNED PERFORMANCE
DEPARTMENT OF THE ENVIRONMENT AND ENERGY .......................................... 11
AUSTRALIAN RENEWABLE ENERGY AGENCY ...................................................... 91
BUREAU OF METEOROLOGY ................................................................................. 111
CLEAN ENERGY FINANCE CORPORATION .......................................................... 135
CLEAN ENERGY REGULATOR ................................................................................ 163
CLIMATE CHANGE AUTHORITY .............................................................................. 189
DIRECTOR OF NATIONAL PARKS .......................................................................... 209
GREAT BARRIER REEF MARINE PARK AUTHORITY ........................................... 231
SYDNEY HARBOUR FEDERATION TRUST ............................................................ 261


11
DEPARTMENT OF THE
ENVIRONMENT AND ENERGY
ENTITY RESOURCES AND PLANNED
PERFORMANCE


13
DEPARTMENT OF THE ENVIRONMENT AND ENERGY
SECTION 1: ENTITY OVERVIEW AND RESOURCES ............................................... 15
1.1 Strategic direction statement .......................................................................... 15
1.2 Entity resource statement ............................................................................... 23
1.3 Budget measures ............................................................................................ 26
SECTION 2: OUTCOMES AND PLANNED PERFORMANCE ................................... 29
2.1 Budgeted expenses and performance for Outcome 1 .................................... 30
2.2 Budgeted expenses and performance for Outcome 2 .................................... 53
2.3 Budgeted expenses and performance for Outcome 3 .................................... 64
2.4 Budgeted expenses and performance for Outcome 4 .................................... 69
SECTION 3: BUDGETED FINANCIAL STATEMENTS ............................................... 77
3.1 Budgeted financial statements........................................................................ 77
3.2 Budgeted financial statements tables ............................................................. 79


15
DEPARTMENT OF THE ENVIRONMENT AND ENERGY
Section 1: Entity overview and resources
1.1 STRATEGIC DIRECTION STATEMENT
The Department of the Environment and Energy advises on and implements,
environment and energy policy to support the Australian Government achieving a
healthy environment, strong economy and thriving community now and into the
future.
Outcome 1: Conserve, protect and sustainably manage Australia’s biodiversity,
ecosystems, environment and heritage through research, information management,
supporting natural resource management, establishing and managing
Commonwealth protected areas, and reducing and regulating the use of pollutants
and hazardous substances.
The Department is delivering policies, programs, information and research that enable
the conservation, protection and sustainable management of Australia’s natural
environment and heritage places.
The Australian Government has extended the National Landcare Program, investing a
further $1.1 billion from the Natural Heritage Trust over seven years from 2016-17. The
National Landcare Program is the primary funding mechanism for Australian
Government investment in environmental conservation and protection and sustainable
land management, and implementation of Australia’s obligations under international
conventions. The Department is working with other government agencies on the next
phase of the program which will deliver long-term improvements to Australia’s
biodiversity and natural resource condition and expand the Indigenous Protected
Areas program. The Department does this by supporting communities to address
national environmental, agricultural and indigenous priorities that provide economic
and social benefits locally and regionally. The next phase of the program includes the
additional $100.0 million directed to the National Landcare Program announced as
part of the 2016-17 Mid-Year Economic and Fiscal Outlook.
The Department is continuing to implement the Reef 2050 Long-Term Sustainability
Plan and progressing actions to protect and manage the Great Barrier Reef while
allowing ecologically sustainable development. In 2017-18, the Australian Government
will continue to contribute to priority actions across the whole Reef 2050 Plan -
ecosystem health, biodiversity, heritage, water quality, community benefits, economic
benefits and governance. Further, the Department works with the Clean Energy
Finance Corporation to deliver the $1.0 billion Reef Funding Program.

Department of the Environment and Energy Budget Statements
16
The Department is leading the implementation of the Government’s Threatened
Species Strategy, through pursuing science-based approaches, shaping policy and
programs and building partnerships to ensure threatened species are protected. The
Threatened Species Strategy sets out a road map to achieve the long-term goal of
reversing species decline and supporting species recovery, including through the
activities of the Threatened Species Commissioner. Australian Government investment
through the National Environmental Science Program and the National Landcare
Program, including the 20 Million Trees program, is assisting to deliver the ambitious
one, three and five year targets in the strategy.
The Government is investing an additional $5.0 million under the National Landcare
Program from 2016-17 to 2018-19 in the Threatened Species Recovery Fund to support
community-led threatened species projects aligned with the targets of Australia’s
Threatened Species Strategy. The Government has released Australia’s first Threatened
Species Prospectus to grow private sector interest and investment in threatened species
recovery.
The Department is working with other government agencies to deliver the
Government’s $30.0 million Support Your Local Parks and Environment election
commitment. This commitment includes the Improving Your Local Parks and
Environment Program, which supports communities to revitalise, maintain and
improve local parks, nature reserves, rivers, coastal areas and community facilities,
ensuring better and more accessible green spaces. The program will provide
$22.8 million over four years from 2016-17 to 2019-20. A second part of this
commitment is the $1.0 million Surf Life Saving Cleaner Outboard Engines Scheme
that provides grants to surf lifesaving clubs to upgrade outboard engines and will
reduce air pollution. The remaining funding of $6.2 million is supporting the Solar
Communities program which is described in Outcome 2.
The Department will work closely with the Director of National Parks to finalise new
management plans and implement management arrangements for Commonwealth
Marine Reserves. The Government is providing $56.1 million to the Department and
the Director of National Parks over four years from 2016-17 to 2019-20, including
funding for fisheries adjustment assistance and marine user engagement. This funding
will enable the Director of National Parks to transition to managing a marine protected
areas estate six times larger than the current estate.
In partnership with heritage managers, organisations and the community, the
Department is implementing the Australian Heritage Strategy. The strategy is a ten
year action based framework under which Australia’s natural, historic and Indigenous
heritage places are valued, protected for future generations and cared for by the
community.
The Department administers legislation to give effect to our international obligations
and implement specific national priorities in relation to environmental protection and
environmental health. The Department regulates to protect the environment by

Department of the Environment and Energy Budget Statements
17
supporting and promoting ecologically sustainable development through the effective
regulation of matters of national environmental significant Commonwealth areas and
activities under the Environment Protection and Biodiversity Conservation Act 1999. The
Department supports environmental health through pursuing national approaches to
effectively and efficiently manage hazardous wastes, substances and pollutants.
The Department is implementing the Government’s new national emission standards
for non-road spark ignition engines and equipment through the introduction of new
legislation. The new product emission standards cover a range of petrol powered
equipment, including garden engines like leaf blowers and outboard motors. Through
the implementation of these standards, Australians will be assured they are getting
high quality low-emitting engines and equipment, and air pollution harmful to both
human health and the environment will be reduced. This initiative is an important
element of the National Clean Air Agreement.
Through the Environment Protection and Biodiversity Conservation Act 1999, the
Department is supporting the assessment and listing of threatened species and
ecological communities and heritage places, and the protection of internationally
traded flora and fauna. The Department will continue to work closely with states and
territories to implement the Memorandum of Understanding on a Common
Assessment Method for Listing of Threatened Species. The reform will deliver a
nationally consistent approach to assessing threatened species, removing ambiguity,
and reducing uncertainty for business and community conservation groups.
Australia is committed to the protection of whales and dolphins, continues its work to
bring about a permanent end to all forms of commercial whaling and is a strong
supporter of the global moratorium on commercial whaling. The Department is
focusing on implementation of two Australian-led resolutions agreed at the 2016
International Whaling Commission meeting – on special permit whaling, and
governance reform. The Department will continue to subject the design and
implementation of Japan’s whaling research to robust scientific scrutiny, and actively
support and promote non-lethal research.
The Department is continuing to strengthen the information and research evidence
base to underpin environmental policy and decision-making, including through
delivery of the National Environmental Science Program and by making the
Department’s environmental data open access on data.gov.au.
Building on the release of the 2016 Australia State of the Environment digital platform,
the Department will work with other jurisdictions to develop a national approach to
environmental economic accounting in 2017, and with relevant sectors to further
improve the evidence base for future reporting on the condition of Australia’s
environment and its interaction with economic activity.
The Department will continue the work of the Supervising Scientist to ensure the
environment in the Alligator Rivers Region, including Kakadu National park, remains

Department of the Environment and Energy Budget Statements
18
protected from the potential impacts of uranium mining, with a focus on the successful
rehabilitation of the Ranger uranium mine.
The Department, through the Commonwealth Environmental Water Holder, manages
Commonwealth environmental water holdings acquired by the Government to protect
and restore environmental assets in the Murray-Darling Basin, including rivers, lakes,
floodplains, wetlands and aquifers. The Department will continue to manage the water
holdings and undertake research, monitoring and evaluation activities so as to give
effect to the objects of the Water Act 2007, the Basin Plan 2012 and relevant
international agreements.
The Department supports the management and protection of Australia's Ramsar
wetlands. The Department will conduct assessments on the ecological character of
wetlands to meet international obligations under the Ramsar Convention, and provide
advice on the significant impacts of developments on Ramsar wetlands under the
Environment Protection and Biodiversity Conservation Act 1999.
The Department will continue to support the Independent Expert Scientific Committee
on Coal Seam Gas and Large Coal Mining Development in providing advice to
Australian governments on the water-related impacts of coal seam gas and large coal
mining development proposals, to strengthen the science underpinning regulatory
decisions. In 2017-18 the Department will complete the delivery of targeted bioregional
(regional scale) assessments of the impacts of coal seam gas and large coal mining
development on water resources and water-dependent assets in selected regions across
Queensland, New South Wales, Victoria and South Australia.
In addition, in 2017-18 the Department will commence new combined geological and
bioregional resource assessments in three onshore areas that are underexplored but
prospective for unconventional gas, and where commercial production to supply the
East Coast Energy Market could commence in the medium term, through the
Government’s Energy for the Future package. This new work will leverage off the
nearly completed program of bioregional assessments. The scope for these new
bioregional assessments will be extended to shale and tight gas resources.
Outcome 2: Reduce Australia’s greenhouse gas emissions, adapt to the impacts of
climate change, contribute to effective global action on climate change, and support
technological innovation in clean and renewable energy, through developing and
implementing a national response to climate change.
The Department develops and implements policies and programs that reduce
Australia’s greenhouse gas emissions and enable the consideration of climate change
in the decisions taken by governments, business and individuals. The Portfolio
contributes to the ongoing effort to understand the impacts of climate change so that
responses are based on the best available science.

Department of the Environment and Energy Budget Statements
19
The 2017 review of climate change policies will ensure the Government’s climate
change policies remain effective in achieving Australia’s 2030 emissions reduction
target and Paris Agreement commitments, while maintaining affordable, reliable and
secure energy.
The Emissions Reduction Fund supports practical actions by businesses and
communities to achieve real reductions in emissions, lower their energy costs, increase
their productivity and deliver valuable co-benefits to the environment, economy and
society. The Fund’s Safeguard Mechanism ensures emissions reductions purchased by
the Government are not offset by a significant increase in emissions above business as
usual elsewhere in the economy. The National Carbon Offset Standard and carbon
neutral certification framework enable businesses to undertake voluntary climate
action. Growth in renewable and low emissions energy technologies is facilitated
through the Renewable Energy Target and support for technology innovation and
deployment through the Australian Renewable Energy Agency and the Clean Energy
Finance Corporation.
The Department provides information to support governments, business and the
community to prepare for and respond to the effects of the changing climate, including
through the National Climate Resilience and Adaptation Strategy. The Government is
providing new funding of $550,000 in 2017-18 to establish an Adaptation Partnership
to bring together Australia’s core national expertise on climate resilience and
adaptation research: the National Climate Change Adaptation Research Facility and
the CSIRO. The Department provides support for the National Climate Science
Advisory Committee. The Committee’s role is to advise the Australian Government on
a nationally aligned and integrated approach to climate science.
Internationally, the Department contributes to an effective global response to climate
change through the negotiation and implementation of obligations under the United
Nations Framework Convention on Climate Change, its Kyoto Protocol and the Paris
Agreement. This includes estimating and reporting Australia’s emissions and progress
towards targets. Following ratification of the Paris Agreement on 4 November 2016,
the Department, together with the Department of Foreign Affairs and Trade, will work
with other countries to establish the Paris Agreement ‘rulebook’ ahead of 2018. The
Portfolio, through the Department and the Clean Energy Regulator, is supporting
Australia’s contribution to developing the rules for the International Civil Aviation
Organisation’s carbon offsetting scheme. The Department provides support to other
countries for emission measurement and reporting, and support for international
partnerships that promote climate change action through protection of our natural
carbon sinks including rainforests and ‘blue carbon’ (mangroves, tidal marshes and
seagrasses).
The Department is working with other government agencies to deliver the $6.2 million
Solar Communities program which supports community groups and food rescue
charities to install rooftop solar photovoltaic, solar hot water and battery systems to
reduce their electricity costs and reduce emissions.

Department of the Environment and Energy Budget Statements
20
Outcome 3: Advance Australia’s strategic, scientific, environmental and economic
interests in the Antarctic region by protecting, administering and researching the
region.
The Department leads a whole of government approach to Antarctic and sub-Antarctic
policy development and operations, and contributes to advancing Australia’s Antarctic
interests within the Antarctic Treaty system. The Department conducts, leads and
facilitates research relevant to national policy objectives in high priority areas of
Antarctic and Southern Ocean science, particularly in protecting the Antarctic
environment and understanding its role in the global climate system. The Department
supports Antarctic and sub-Antarctic research by other institutions, including through
logistics support.
The Australian Antarctic Strategy and 20 Year Action Plan set out the Government’s
national interests in Antarctica and actions to support these interests over the next
20 years. The Australian Government is progressing implementation of key priorities
identified under Year Two of the 20 Year Action Plan. This includes the investigation
of options to deliver year-round aviation access between Hobart and Antarctica,
augmenting science research funding through the establishment of an Antarctic
Foundation and the development of over snow traverse capability enabling access to
the interior of the Australian Antarctic Territory. This capability will build Australia’s
scientific leadership in Antarctica, including by involvement in major international
scientific research undertaking to retrieve a million-year old ice core.
The Australian Government has confirmed its commitment to continuing year-round
access to Macquarie Island, with funding of $49.8 million over 11 years from 2016-17.
Macquarie Island is located in the Southern Ocean around 1,500 kilometres southeast
of Tasmania. The Island’s location makes it important for Australia’s contribution to a
range of international scientific monitoring and Southern Ocean research programs.
The Australian Government’s continued operation of a year-round research station
will ensure that high priority scientific research and monitoring programs conducted
on Macquarie Island continue. This includes continuing meteorological observations at
the island which contribute to weather forecasting and international climate science
programs.
The Department is procuring a new icebreaker which represents the single biggest
investment in the history of Australia’s Antarctic Program. The design of, and
preparation for, construction of a new world-class icebreaker to support the Australian
Antarctic Program has commenced and will continue during 2017-18. The new
icebreaker is expected to be commissioned in 2020-21 and will have its home-port in
Hobart.

Department of the Environment and Energy Budget Statements
21
Outcome 4: Support the reliable, sustainable and secure operations of energy
markets through improving Australia's energy efficiency, performance and
productivity for the community.
The Australian Government is committed to maintaining a competitive and reliable
energy system as we transition to a lower emissions future. In 2017-18, the
Environment and Energy Portfolio will work with the Industry, Innovation and
Science Portfolio to roll out the Government’s new Energy for the Future package. This
package will deliver important reforms across Australia’s energy markets to address
immediate challenges while laying the foundations for long term reforms to maintain
the security and affordability of the energy market. The package includes:
$19.6 million to accelerate reform through the Gas Market Reform Group to
improve transparency and access to gas markets.
$30.4 million over four years from 2017-18 for new combined geological and
bioregional resource assessments to assess the potential impacts on waterways and
aquifers in three onshore areas that are underexplored but prospective for
unconventional gas.
$13.4 million over five years to support an Energy Use Data Model to improve
forecasting and planning for energy markets – a critical measure to ensure the
future energy market is more responsive to the needs of all consumers.
$5.2 million to examine the costs and benefits of constructing pipelines to link
Northern and Western Australia gas reserves to the east coast, through Moomba in
South Australia.
$0.5 million in 2017-18 to examine the constraints impinging on increased gas
supply on the east coast of Australia including regulatory barriers and inconsistent
policies.
$2.0 million to allow the Australian Energy Market Operator to improve
publication of real time assessment of gas flows and market analysis, to make it
easier for the market operator, businesses and investors to make informed
decisions about gas market operations.
Through the Council of Australian Governments’ Energy Council, the Department is
helping implement various changes including increasing gas market transparency,
ensuring better regulation for competitive gas transport prices, improving affordability
of electricity by reforming the Limited Merits Review Regime, and improving energy
market governance. It will also assist the Government to respond to the Independent
Review into the reliability and stability of the National Electricity Market (the Finkel
Review).

Department of the Environment and Energy Budget Statements
22
The Department is implementing Australia’s plan to return to compliance with the
International Energy Agency’s oil stockholding obligations, including the introduction
of mandatory reporting of Australia’s stocks of petroleum and other fuels from
1 January 2018.
The Department will continue to implement the National Energy Productivity Plan
which aims to deliver a 40 per cent improvement in Australia’s energy productivity by
2030. The economy-wide work plan aims to improve energy productivity through
more productive consumer and business choices, and more productive energy
services.

Department of the Environment and Energy Budget Statements
23
1.2 ENTITY RESOURCE STATEMENT
Table 1.1 shows the total funding from all sources available to the entity for its
operations and to deliver programs and services on behalf of the Government.
The table summarises how resources will be applied by outcome (government strategic
policy objectives) and by administered (on behalf of the Government or the public) and
departmental (for the entity’s operations) classification.
For more detailed information on special accounts and special appropriations, please
refer to Budget Paper No. 4 – Agency Resourcing.
Information in this table is presented on a resourcing (that is, appropriations/cash
available) basis, whilst the ‘Budgeted expenses by Outcome’ tables in Section 2 and the
financial statements in Section 3 are presented on an accrual basis.

Department of the Environment and Energy Budget Statements
24
Table 1.1: Department of the Environment and Energy resource statement — Budget estimates for 2017-18 as at Budget May 2017
2016-17 Estimated
actual $'000
2017-18 Estimate
$'000
Departmental
Annual appropriations - ordinary annual services (a)
Prior year appropriations available 73,860 74,679
Departmental appropriation 365,998 396,929
Payments to corporate entities (b, c) 42,829 46,548
s74 retained revenue receipts (d) 38,327 34,348
Departmental capital budget (e) 24,937 24,592
Annual appropriations - other services - non-operating (f)
Equity injection 144,782 146,656
Total departmental annual appropriations 690,733 723,752
Special accounts (g)
Opening balance - 8,411
s75 transfer from Industry (h) 14,663 -
Non-appropriation receipts 3,986 -
Total special accounts 18,649 8,411
Total departmental resourcing 709,382 732,163
Administered
Annual appropriations - ordinary annual services (a)
Outcome 1 426,045 401,078
Outcome 2 5,608 3,678
Outcome 4 6,312 6,452
Payments to corporate entities (c) 1,221 2,073
Annual appropriations - other services - non-operating (f)
Payments to corporate entities (c) 619 376
Total administered annual appropriations 439,805 413,657
Administered special appropriations (g) 2,189,157 2,257,925
Special accounts (g)
Opening balance 5,471,743 6,435,319
Appropriation receipts (i) 2,257,032 2,289,196
Non-appropriation receipts 23,418 39,666
Total special account receipts 7,752,193 8,764,181
less administered appropriations drawn from annual/special
appropriations and credited to special accounts (2,257,032) (2,289,196)
less payments to corporate entities from annual/special
appropriations (300,033) (260,374)
less special account balances for corporate entities (6,979,000) (7,979,000)
Total administered resourcing 845,090 907,193
Total resourcing for the Department of the Environment and Energy 1,554,472 1,639,356
2016-17 2017-18
Average staffing level (number) 1,947 1,972

Department of the Environment and Energy Budget Statements
25
Table 1.1: Department of the Environment and Energy resource statement — Budget estimates for 2017-18 as at Budget May 2017 (continued)
Third party payments from and on behalf of other entities
2016-17 Estimated
actual $'000
2017-18 Estimate
$'000
Payments made to other entities for the provision of services 7,742 6,770
Receipts received from other entities for the provision of services
(disclosed in s74 Retained revenue receipts section above) 483 -
Payments made to corporate entities within the Portfolio
Australian Renewable Energy Agency (Appropriation
Bill (No. 1) 2017-2018) 1,221 2,073
Australian Renewable Energy Agency (Australian Renewable
Energy Agency Act 2011) 298,193 257,925
Clean Energy Finance Corporation (Clean Energy Finance
Corporation Act 2012) 1,000,000 550,000
Director of National Parks (Appropriation Bill (No. 1) 2017-2018) 42,829 46,548
Director of National Parks (Appropriation Bill (No. 2) 2017-2018) 619 376
Prepared on a resourcing (i.e. appropriations available) basis. Please note: All figures shown above are GST exclusive - these may not match figures in the cash flow statement.
(a) Appropriation Bill (No. 1) 2017-18. (b) Following the Environment Protection and Biodiversity Conservation Act 1999 section 514S,
the Department of the Environment and Energy is directly appropriated the Director of National Parks' appropriations, which is then allocated to the Director of National Parks by the Secretary.
(c) 'Corporate entities' are Corporate Commonwealth Entities and Commonwealth Companies as defined under the Public Governance, Performance and Accountability (PGPA) Act 2013.
(d) Estimated retained revenue receipts under section 74 of the Public Governance, Performance and Accountability (PGPA) Act 2013.
(e) Departmental capital budgets are not separately identified in Appropriation Bill (No.1) and form part of ordinary annual services items. Please refer to Table 3.5 for further details. For accounting purposes, this amount has been designated as a 'contribution by owner'.
(f) Appropriation Bill (No. 2) 2017-18.
(g) Excludes 'Special Public Money' held in accounts such as Services for Other Entities and Trust Moneys accounts (SOETM). For further information on special appropriations and special accounts, please refer to Budget Paper No. 4 - Agency Resourcing. Please also see Section 2: Outcomes and Planned Performance for further information on outcome and program expenses broken down by various funding sources, e.g. annual appropriations, special appropriations and special accounts.
(h) The responsibility for Energy functions transferred from the Department of Industry, Innovation and Science as a result of the Administrative Arrangements Orders dated 19 July 2016 and 1 September 2016.
(i) Amounts credited to the special accounts from the Department of the Environment and Energy's annual and special appropriations.

Department of the Environment and Energy Budget Statements
26
1.3 BUDGET MEASURES
Budget measures in Part 1 relating to the Department of the Environment and Energy
are detailed in Budget Paper No. 2 and are summarised below.
Table 1.2: Department of the Environment and Energy 2017-18 Budget measures
Part 1: Measures announced since the 2016-17 Mid-Year Economic and Fiscal Outlook (MYEFO)
Program 2016-17
$'000 2017-18
$'000 2018-19
$'000 2019-20
$'000 2020-21
$'000
Revenue measures
National Emissions Standards for Non-Road Spark Ignition Engines and Equipment – cost recovery 1.6
Administered revenues
- 429 2,658 2,658 2,658 Total
- 429 2,658 2,658 2,658
Total revenue measures
Administered
- 429 2,658 2,658 2,658
Total
- 429 2,658 2,658 2,658
Expense measures
National Landcare Programme – continuation (a) 1.1
Administered expenses
- - - - -
Total
- - - - - National Emissions Standards for Non-Road Spark Ignition Engines and Equipment – cost recovery 1.6
Departmental expenses
- 1,734 1,818 1,818 1,818
Total
- 1,734 1,818 1,818 1,818
Adaptation Partnership (b) 1.1, 2.2 Administered expenses
(550) - - - -
Departmental expenses
- 550 - - -
Total
(550) 550 - - - Energy for the Future – gas supply and affordability (c) 1.2, 4.1
Departmental expenses
- 25,914 9,595 11,673 10,386 Total
- 25,914 9,595 11,673 10,386
Energy for the Future – energy use data model for better forecasting (d) 4.1
Administered expenses
- - 2,500 2,500 2,500 Departmental expenses
- 687 666 666 677
Total
- 687 3,166 3,166 3,177
Energy for the Future –solar thermal in Port Augusta (e) 4.1
Administered expenses
- - - - - Departmental expenses
- - - - -
Total
- - - - -

Department of the Environment and Energy Budget Statements
27
Part 1: Measures announced since the 2016-17 Mid-Year Economic and Fiscal Outlook (MYEFO) (continued)
Program
2016-17 $'000
2017-18 $'000
2018-19 $'000
2019-20 $'000
2020-21 $'000
Overseas Allowances for Australian Government Employees - efficiencies 4.1
Departmental expenses
- - 11 11 11 Total
- - 11 11 11
Public Service Modernisation Fund - transformation and innovation stream (f) All
Departmental expenses
- - - - -
Total
- - - - -
Total expense measures
Administered
(550) - 2,500 2,500 2,500 Departmental
- 28,885 12,090 14,168 12,892
Total
(550) 28,885 14,590 16,668 15,392
Capital measures
National Emissions Standards for Non-Road Spark Ignition Engines and Equipment – cost recovery 1.6
Departmental capital
- 1,108 - - -
Total
- 1,108 - - -
Total capital measures
Administered
- - - - -
Departmental
- 1,108 - - -
Total - 1,108 - - -
Prepared on a Government Finance Statistics (fiscal) basis. Figures displayed brackets represent a decrease in funds. (a) This measure allocates funding of $1.1 billion in the Natural Heritage Trust from 2016-17 to 2022-23
to support the protection, conservation and rehabilitation of Australia’s natural environment and encourage sustainable land management practices.
(b) Funding for this measure will be offset from elsewhere in the Portfolio in 2016-17.
(c) Funding will commence in 2017-18, although the Department will incur expenses in 2016-17 for this measure.
(d) This measure includes funding of $3.2 million in 2021-22.
(e) Funding of $110.0 million has been included in the Contingency Reserve for this measure, to be accessed if required to secure the delivery of a new solar thermal power generation facility in Port Augusta, South Australia.
(f) This measure includes funding of $0.7 million in 2019-20.

Department of the Environment and Energy Budget Statements
28
Figure 2: Changes to the outcome and program structures since the last portfolio statement
New Outcome 4
Support the reliable, sustainable and secure operations of energy markets through improving Australia's energy efficiency, performance and productivity for the community.
Description of change:
Previously reported in 2016-17 Portfolio Additional Estimates Statements as Outcome 5.
Program changes
Program No.
Program title Description of change
1.1 Sustainable Management of Natural Resources and the Environment
Includes previous Program 1.3 Land Sector Initiatives.
1.2 Environmental Information and Research
Includes coal seam gas and large coal mining development elements of previous Program 4.1.
1.3 Commonwealth Environmental Water
Includes Ramsar Convention elements from previous Program 4.1 and all elements previous Program 4.2.
4.1 Water Science and Wetlands Program moved to Outcome 1 now reported under Programs 1.2 and 1.3.
4.2 Commonwealth Environmental Water
Program moved to Outcome 1 now reported under Program 1.3.
5.1 Energy Program 5.1 moved to Outcome 4 now reported under Program 4.1.

Department of the Environment and Energy Budget Statements
29
Section 2: Outcomes and planned performance
Government outcomes are the intended results, impacts or consequences of actions by
the Government on the Australian community. Commonwealth programs are the
primary vehicle by which government entities achieve the intended results of their
outcome statements. Entities are required to identify the programs which contribute to
government outcomes over the Budget and forward years.
Each outcome is described below together with its related programs. The following
provides detailed information on expenses for each outcome and program, further
broken down by funding source.
Note:
Performance reporting requirements in the Portfolio Budget Statements are part of the
enhanced Commonwealth performance framework established by the Public
Governance, Performance and Accountability Act 2013. It is anticipated that the
performance criteria described in Portfolio Budget Statements will be read with
broader information provided in an entity’s corporate plans and annual performance
statements – included in Annual Reports - to provide an entity’s complete performance
story.
The most recent corporate plan for the Department of the Environment and Energy can
be found at:
http://environment.gov.au/about-us/publications/corporate-plan-2016-17.
The most recent annual performance statement can be found at:
http://environment.gov.au/annual-report-2015-16/performance-statements.

Department of the Environment and Energy Budget Statements
30
2.1 BUDGETED EXPENSES AND PERFORMANCE FOR OUTCOME 1
Outcome 1: Conserve, protect and sustainably manage Australia’s biodiversity, ecosystems, environment and heritage through research, information management, supporting natural resource management, establishing and managing Commonwealth protected areas, and reducing and regulating the use of pollutants and hazardous substances.
Linked programs
Australian Fisheries Management Authority
Programs
Program 1.1 – Australian Fisheries Management Authority
Contribution to Outcome 1 made by linked programs
The Department of the Environment and Energy and Australian Fisheries Management Authority engage on sustainable management of Commonwealth fisheries.
Australian Institute of Marine Science
Programs
Program 1.1 – Marine Research
Contribution to Outcome 1 made by linked programs
The Department of the Environment and Energy and the Australian Institute of Marine Science work together on implementation of the Reef 2050 Plan to protect and conserve the Great Barrier Reef.
Australian Pesticides and Veterinary Medicines Authority
Programs
Program 1.1 – Australian Pesticides and Veterinary Medicines Authority
Contribution to Outcome 1 made by linked programs
The Department of the Environment and Energy and the Australian Pesticides and Veterinary Medicines Authority work together to ensure regulation of pesticide and veterinary medicines protects Australia’s environment and our environmental health.

Department of the Environment and Energy Budget Statements
31
Australian Taxation Office
Programs
Program 1.12 – Product Stewardship for Oil program
Contribution to Outcome 1 made by linked programs
The Department of the Environment and Energy works with the Australian Taxation Office, which administers financial aspects of the Product Stewardship for Oil program, pays the benefits on recycled motor oil and collects the levy on new oil entering the market from domestic sources.
Bureau of Meteorology
Programs
Program 1.1 – Bureau of Meteorology
Contribution to Outcome 1 made by linked programs
The Bureau of Meteorology is a partner in the Earth Systems and Climate Change Hub in the National Environmental Science Program.
The Bureau of Meteorology is a collaborator in the delivery of the Bioregional Assessment program, managing and leading the technical component. The Bureau of Meteorology provides experience in building and maintaining environmental information systems, and sourcing and storing environmental information such as data, models and reports.
In addition, the Bureau of Meteorology’s water information services inform Commonwealth environmental water planning and decision making in relation to water resource availability and environmental water requirements.
Clean Energy Finance Corporation
Programs
Program 1.1 – Clean Energy Finance Corporation
Contribution to Outcome 1 made by linked programs
The Department of the Environment and Energy has responsibility for policies that reduce Australia’s greenhouse gas emissions. The Clean Energy Finance Corporation contributes to these programs by facilitating increased flows of finance into the clean energy sector, including through the funding it makes available to the Clean Energy Innovation Fund and Reef Funding Program.

Department of the Environment and Energy Budget Statements
32
Commonwealth Scientific and Industrial Research Organisation
Programs
Program 1.1 – Research – Science, Services and Innovation Fund
Contribution to Outcome 1 made by linked programs
The Commonwealth Scientific and Industrial Research Organisation contributes to Outcome 1 through the delivery of research to support the implementation of the Reef 2050 Plan to protect and conserve the Great Barrier Reef.
The Commonwealth Scientific and Industrial Research Organisation is a lead organisation in the Earth Systems and Climate Change Hub in the National Environmental Science Program.
The Commonwealth Scientific and Industrial Research Organisation is also a collaborator in the delivery of the bioregional assessments, contributing expertise in ecology, hydrology, hydrogeology, informatics and risk analysis.
Department of Agriculture and Water Resources
Programs
Program 1.1 – Agricultural Adaptation
Program 1.2 – Sustainable Management - Natural Resources
Program 1.4 – Fishing Industry
Program 2.1 – Biosecurity and Export Services
Program 2.2 – Plant and Animal Health
Program 3.1 – Water Reform
Contribution to Outcome 1 made by linked programs
The Departments of the Environment and Energy and Agriculture and Water Resources work together under a memorandum of understanding to deliver the National Landcare program and work collaboratively to implement the Murray-Darling Basin Plan and the Commonwealth’s water reform policy agenda.
The Departments of the Environment and Energy and Agriculture and Water Resources engage on biosecurity, wildlife trade and fisheries policy.
The Departments of the Environment and Energy, Agriculture and Water Resources, and Industry, Innovation and Science work collaboratively in the planning phase of the National Carp Control Plan.

Department of the Environment and Energy Budget Statements
33
Department of Foreign Affairs and Trade
Programs
Program 1.1 – Foreign Affairs and Trade Operations
Program 1.2 – Official Development Assistance
Contribution to Outcome 1 made by linked programs
The Department of Foreign Affairs and Trade provides support to the Department of the Environment and Energy on matters relating to the implementation of the Reef 2050 Plan to protect and conserve the Great Barrier Reef.
The Department of the Environment and Energy receives funding from the Department of Foreign Affairs and Trade for a number of engagement activities in the Pacific and South-East Asia.
Department of Health
Programs
Program 5.1 – Protect the Health and Safety of the Community through Regulation
Contribution to Outcome 1 made by linked programs
The Department of the Environment and Energy and the Department of Health work together to manage policy and regulatory issues that have combined human and environmental health implications.
Department of Human Services
Programs
Program 1.1 – Services to the Community – Social Security and Welfare
Contribution to Outcome 1 made by linked programs
The Department of Human Services contributes to Outcome 1 through the provision of advice to some Green Army participants on the interaction between the Green Army allowance and income support payments.
Department of Immigration and Border Protection
Programs
Program 1.1 – Border Enforcement
Program 1.2 – Border Management
Contribution to Outcome 1 made by linked programs
The Departments of the Environment and Energy and Immigration and Border Protection work together to prevent illegal wildlife trade and control transboundary movements of hazardous wastes and their disposal.

Department of the Environment and Energy Budget Statements
34
Department of the Prime Minister and Cabinet
Programs
Program 1.1 – Prime Minister and Cabinet
Program 1.1 – Indigenous Advancement - Jobs, Land and Economy Program
Contribution to Outcome 1 made by linked programs
The Departments of the Environment and Energy, the Prime Minister and Cabinet, and Agriculture and Water Resources work together to provide opportunities for indigenous communities and land managers to engage with the National Landcare Program. The Departments of the Environment and Energy and the Prime Minister and Cabinet work cooperatively on the Indigenous Protected Areas program and elements of the Indigenous Rangers program through the National Landcare Program.
The Department of the Environment and Energy is supporting the Government's Cities agenda, through the delivery of the National Landcare Program, including the 20 Million Trees program, the use of strategic assessments under the Environment Protection and Biodiversity Conservation Act 1999 and national approaches to managing wastes and hazardous substances and air quality in cities.
Department of the Treasury
Programs
Program 1.9 – National Partnership Payments to the States
Contribution to Outcome 1 made by linked programs
The Department of the Treasury contributes to Outcome 1 by making payments on behalf of the Department of the Environment and Energy. A number of payments are made to States and territories for heritage management and species conservation.
Director of National Parks
Programs
Program 1.1 – Parks and Reserves
Contribution to Outcome 1 made by linked programs
The Department of the Environment and Energy and the Director of National Parks work together through engagement on policy direction, science, heritage management and species conservation within Commonwealth managed marine and terrestrial reserves.

Department of the Environment and Energy Budget Statements
35
Great Barrier Reef Marine Park Authority
Programs
Program 1.1 – Improving the outlook for the Great Barrier Reef
Contribution to Outcome 1 made by linked programs
The Department of the Environment and Energy and the Great Barrier Reef Marine Park Authority work together on heritage management, environment health, species conservation and fisheries management as well as joint implementation of the Reef 2050 Plan to protect and conserve the Great Barrier Reef.
Murray-Darling Basin Authority
Programs
Program 1.1 – Equitable and Sustainable Use of the Murray-Darling Basin
Contribution to Outcome 1 made by linked programs
The Department of the Environment and Energy and the Murray Darling Basin Authority work together on implementation of the Basin Plan, operation of the River Murray System, shared natural resource management programs, research, information, advice and Basin Plan reporting obligations, all of which contribute to the management of Commonwealth environmental water.
National Offshore Petroleum Safety and Environmental Management Authority
Programs
Program 1 – Regulatory oversight of Safety Cases, Well Operations Management Plans and Environment Plans coupled with effective monitoring, investigation and enforcement.
Contribution to Outcome 1 made by linked programs
The National Offshore Petroleum Safety and Environmental Management Authority contributes to the work of the Department of the Environment and Energy through its policies and program relating to the effective management and administration of the Offshore Petroleum and Greenhouse Gas Storage Act 2006 and environment associated regulations.
Sydney Harbour Federation Trust
Programs Program 1.1 – Sydney Harbour Federation Trust
Contribution to Outcome 1 made by linked programs
The Department of the Environment and Energy and the Sydney Harbour
Federation Trust work together through engagement on policy direction and site
management to preserve the natural and cultural heritage of Sydney Harbour
Federation Trust land and maximise public access.

Department of the Environment and Energy Budget Statements
36
Budgeted expenses for Outcome 1
This table shows how much the entity intends to spend (on an accrual basis) on
achieving the outcome, broken down by program, as well as by Administered and
Departmental funding sources.
Table 2.1.1: Budgeted expenses for Outcome 1
Outcome 1: Conserve, protect and sustainably manage Australia's biodiversity, ecosystems, environment and heritage through research, information management, supporting natural resource management, establishing and managing Commonwealth protected areas, and reducing and regulating the use of pollutants and hazardous substances.
2016-17 Estimated
actual $'000
2017-18 Budget
$'000
2018-19 Forward estimate
$'000
2019-20 Forward estimate
$'000
2020-21 Forward estimate
$'000
Program 1.1: Sustainable Management of Natural Resources and the Environment
Administered expenses
Ordinary annual services
(Appropriation Bill No. 1)
National Landcare Program:
Natural Heritage Trust 229,163 256,847 223,244 227,026 196,708
Less special account (229,163) (256,847) (223,244) (227,026) (196,708)
Environmental Stewardship
Program 9,945 9,918 9,980 9,713 9,179
Green Army 74,014 21,283 - - -
Reef 2050 Plan 34,124 39,419 39,461 40,000 15,000
Less special account (34,038) (39,333) (39,375) (40,000) (15,000)
Great Barrier Reef Foundation -
contribution 3,125 - - - -
Commonwealth Marine Reserves - 10,575 10,262 7,496 -
Improving your Local Parks and
Environment 1,140 6,265 5,436 2,073 -
Biodiversity Fund 42,423 1,997 - - -
Special accounts
Natural Heritage Trust of Australia
Account 227,163 258,584 224,744 227,526 196,708
Reef Trust Special Account 41,534 41,621 42,983 43,242 16,947
Administered total 399,430 350,329 293,491 290,050 222,834
Departmental expenses
Departmental appropriation (a, b) 29,079 25,477 18,631 18,780 18,550
Payments to corporate entities (c) 42,829 46,548 47,397 45,802 44,129
Expenses not requiring appropriation
in the Budget year (d) 7,737 8,610 11,345 11,002 10,171
Departmental total 79,645 80,635 77,373 75,584 72,850
Total expenses for Program 1.1 479,075 430,964 370,864 365,634 295,684

Department of the Environment and Energy Budget Statements
37
Table 2.1.1: Budgeted expenses for Outcome 1 (continued)
Outcome 1: Conserve, protect and sustainably manage Australia's biodiversity, ecosystems, environment and heritage through research, information management, supporting natural resource management, establishing and managing Commonwealth protected areas, and reducing and regulating the use of pollutants and hazardous substances.
2016-17 Estimated
actual $'000
2017-18 Budget
$'000
2018-19 Forward estimate
$'000
2019-20 Forward estimate
$'000
2020-21 Forward estimate
$'000
Program 1.2: Environmental Information and Research
Administered expenses
Ordinary annual services
(Appropriation Bill No. 1)
National Environmental Science
Program 25,520 25,520 25,520 25,520 25,520 Australian Biological Resources
Study 2,030 2,030 2,030 2,030 2,030
Independent Expert Scientific
Committee on Coal Seam Gas
and Large Coal Mining 1,035 1,035 1,035 1,035 1,035
Administered total 28,585 28,585 28,585 28,585 28,585
Departmental expenses
Departmental appropriation (a, b) 18,807 32,681 27,645 28,873 27,733
Expenses not requiring appropriation
in the Budget year (d) 37 39 39 39 39
Departmental total 18,844 32,720 27,684 28,912 27,772
Total expenses for Program 1.2 47,429 61,305 56,269 57,497 56,357
Program 1.3: Commonwealth Environmental Water
Administered expenses
Ordinary annual services
(Appropriation Bill No. 1)
Commonwealth Environmental
Water Office 141 16,568 33,292 41,216 43,142
Less special account (141) (16,568) (33,292) (41,216) (43,142)
MDB Environmental Knowledge
and Research 1,900 1,900 1,900 1,900 2,500
Water Resources Assessment and
Research Grant 175 - - - -
Special accounts
Environmental Water Holdings
Special Account 32,607 44,561 38,045 43,722 43,142
Administered total 34,682 46,461 39,945 45,622 45,642
Departmental expenses
Departmental appropriation (a, b) 17,475 17,686 17,570 17,793 17,848
Expenses not requiring appropriation
in the Budget year (d) 37 42 42 42 42
Departmental total 17,512 17,728 17,612 17,835 17,890
Total expenses for Program 1.3 52,194 64,189 57,557 63,457 63,532

Department of the Environment and Energy Budget Statements
38
Table 2.1.1: Budgeted expenses for Outcome 1 (continued)
Outcome 1: Conserve, protect and sustainably manage Australia's biodiversity, ecosystems, environment and heritage through research, information management, supporting natural resource management, establishing and managing Commonwealth protected areas, and reducing and regulating the use of pollutants and hazardous substances.
2016-17 Estimated
actual $'000
2017-18 Budget
$'000
2018-19 Forward estimate
$'000
2019-20 Forward estimate
$'000
2020-21 Forward estimate
$'000
Program 1.4: Conservation of Australia's Heritage and Environment
Administered expenses
Ordinary annual services
(Appropriation Bill No. 1)
Protecting National Historic Sites (e) 4,420 4,420 4,420 4,420 4,420
National Trusts Partnership Program 927 927 927 927 927 Community Heritage and Icons
Grants Program 467 - - - -
Giant Pandas 1,402 1,308 1,308 - -
Administered total 7,216 6,655 6,655 5,347 5,347
Departmental expenses
Departmental appropriation (a, b) 30,391 28,885 29,784 29,884 29,464
Expenses not requiring appropriation
in the Budget year (d) 4,997 2,248 494 68 68
Departmental total 35,388 31,133 30,278 29,952 29,532
Total expenses for Program 1.4 42,604 37,788 36,933 35,299 34,879
Program 1.5: Environmental Regulation
Administered expenses
Ordinary annual services
(Appropriation Bill No. 1)
Environment Protection and
Biodiversity Conservation Act -
Water Resources Amendment 259 259 259 259 259
Administered total 259 259 259 259 259
Departmental expenses
Departmental appropriation (a, b) 51,923 49,487 49,193 50,623 52,390
Expenses not requiring appropriation
in the Budget year (d) 935 850 796 745 696
Departmental total 52,858 50,337 49,989 51,368 53,086
Total expenses for Program 1.5 53,117 50,596 50,248 51,627 53,345

Department of the Environment and Energy Budget Statements
39
Table 2.1.1: Budgeted expenses for Outcome 1 (continued)
Outcome 1: Conserve, protect and sustainably manage Australia's biodiversity, ecosystems, environment and heritage through research, information management, supporting natural resource management, establishing and managing Commonwealth protected areas, and reducing and regulating the use of pollutants and hazardous substances.
2016-17 Estimated
actual $'000
2017-18 Budget
$'000
2018-19 Forward estimate
$'000
2019-20 Forward estimate
$'000
2020-21 Forward estimate
$'000
Program 1.6: Management of Hazardous Wastes, Substances and Pollutants
Administered expenses
Ordinary annual services
(Appropriation Bill No. 1)
National Environment Protection
Council 518 502 429 429 429
Less special account (518) (502) (429) (429) (429)
Biofuels - Monitoring, Compliance and
Enforcement of Fuel Quality 100 100 100 100 100
Surf Life Saving Cleaner Outboard
Engines Scheme 45 205 375 375 -
Special accounts
Ozone Protection & Synthetic Greenhouse
Gas Account 13,586 13,763 13,969 14,193 14,405
National Environment Protection
Council Special Account 1,984 1,865 680 680 680
Administered total 15,715 15,933 15,124 15,348 15,185
Departmental expenses
Departmental appropriation (a, b) 45,509 46,379 45,845 46,518 46,309
Expenses not requiring appropriation
in the Budget year (d) 552 443 664 584 581
Departmental total 46,061 46,822 46,509 47,102 46,890
Total expenses for Program 1.6 61,776 62,755 61,633 62,450 62,075
Outcome 1 Totals by appropriation type
Administered expenses
Ordinary annual services
(Appropriation Bill No. 1) 169,013 87,828 63,638 55,848 45,970
Special accounts 316,874 360,394 320,421 329,363 271,882
Administered total 485,887 448,222 384,059 385,211 317,852
Departmental expenses
Departmental appropriation (a, b) 193,184 200,595 188,668 192,471 192,294
Payments to corporate entities (c) 42,829 46,548 47,397 45,802 44,129
Expenses not requiring appropriation
in the Budget year (d) 14,295 12,232 13,380 12,480 11,597
Departmental total 250,308 259,375 249,445 250,753 248,020
Total expenses for Outcome 1 736,195 707,597 633,504 635,964 565,872

Department of the Environment and Energy Budget Statements
40
Table 2.1.1: Budgeted expenses for Outcome 1 (continued)
Movement of administered funds between years (f)
2016-17 Estimated
actual $'000
2017-18 Budget
$'000
2018-19 Forward estimate
$'000
2019-20 Forward estimate
$'000
2020-21 Forward estimate
$'000
Outcome 1:
Environmental Water Holdings
Special Account (1,029) 10,093 353 291 -
Natural Heritage Trust of Australia
Account (2,000) - 1,500 500 -
Total movement of administered funds (3,029) 10,093 1,853 791 -
2016-17 2017-18
Average staffing level (number) 1,091 1,090
(a) Outcome 1 also has a departmental capital budget of $11.128 million in 2017-18.
(b) Includes retained revenue receipts under section 74 of the Public Governance, Performance and Accountability (PGPA) Act 2013.
(c) Further information on payments to corporate entities can be found in the "Third Party Payments" section of Table 1.1: Department of the Environment and Energy Resource Statement.
(d) Expenses not requiring appropriation comprise depreciation expenses, amortisation expenses, audit fees and an approved operating loss.
(e) The Protecting National Historic Sites program was previously reported under the title Heritage Grants. This change aligns the title with the current program name.
(f) Figures displayed in brackets represent a decrease in funding.
Note: Departmental appropriation splits and totals are indicative estimates and may change in the course of the budget year as government priorities change.

Department of the Environment and Energy Budget Statements
41
Table 2.1.2: Performance criteria for Outcome 1
Table 2.1.2 below details the performance criteria for each program associated with
Outcome 1. It summarises how each program is delivered and where 2017-18 Budget
measures have created new programs or materially changed existing programs.
Outcome 1 – Conserve, protect and sustainably manage Australia’s biodiversity, ecosystems, environment and heritage through research, information management, supporting natural resource management, establishing and managing Commonwealth protected areas, and reducing and regulating the use of pollutants and hazardous substances.
Program 1.1 – Sustainable Management of Natural Resources and the Environment
The objective of this program is to improve the extent, condition and connectivity of Australia’s unique biodiversity and natural resources, including the Great Barrier Reef, through protection of habitats and mitigation of threats to threatened species and ecological communities.
Delivery Program 1.1 will be delivered by:
Delivering biodiversity conservation and natural resource management programs, including the Reef Trust, 20 Million Trees, the National Landcare Program and Improving Your Local Parks and Environment Program
Implementing initiatives to improve the health of the Great Barrier Reef, including the Reef 2050 Plan and Reef Water Quality Protection Plan
Implementing the Threatened Species Strategy and the Threatened Species Recovery Fund
Representing Australia’s interests at international forums on biodiversity matters and meeting obligations under international agreements.
Performance information
Year Performance criteria Targets
2016–17 Australia meets its obligations under international environmental agreements.
On track
Continued implementation of the Reef 2050 Plan focused on the 97 actions identified as immediate priorities in the Reef 2050 Plan implementation strategy, including development of the Indigenous implementation plan, the guidelines for decision makers, the investment framework and key reporting requirements. Continued stakeholder engagement through the Reef 2050 governance structure, including the reef advisory committee and independent scientific expert panel.
On track
Reef Trust continues investment through phase IV and V investment strategies to deliver projects that address key threats, with a focus on improving water quality and coastal habitats, and protecting biodiversity. Reef Trust continues to pursue options for investment diversification, including through private and philanthropic investment, innovative financial mechanisms and offset delivery.
On track

Department of the Environment and Energy Budget Statements
42
Program 1.1 – Sustainable Management of Natural Resources and the Environment
The objective of this program is to improve the extent, condition and connectivity of Australia’s unique biodiversity and natural resources, including the Great Barrier Reef, through protection of habitats and mitigation of threats to threatened species and ecological communities.
Year Performance criteria Targets
Australia’s biodiversity, including threatened species, ecological communities and migratory species, and significant heritage places, are identified, conserved and protected.
On track
Contracted projects to plant 20 million trees in place by June 2020.
On track
Threatened Species Strategy targets are met.
On track—Of the strategy’s 26 year one targets, 21 were met, four have made good progress and one will not be achieved. The target that will not be achieved relates to all culled feral cats being reported in the Feral Cat Scan phone app. Due to limited ability to drive uptake, not all cats culled are reported in the app.
56 Regional natural resource management organisations have delivered against National Landcare Program objectives.
On track
Improving Your Local Parks and Environment Program projects deliver against program objectives.
Data/information not available—This was a new measure announced in the Mid-year Economic and Fiscal Outlook 2016–17 and the program is in its early stages. No delivery data are available.
On average 500 Green Army Projects commenced and up to 5,000 participants engaged annually.
On track
90 per cent of Biodiversity Fund projects substantially complete, delivering 50,000 ha of revegetation to improve vegetation condition and/or increase extent.
On track
2017–18 Australia meets its obligations under international environmental agreements.
In collaboration with the Queensland Government, by June 2018, improve the quality of water entering the Great Barrier Reef from broad scale land use by reducing pollutant loads in priority areas, relative to 2008–09 baseline levels.5
5 Moved from 2016–17 to reflect June 2018 timeframe

Department of the Environment and Energy Budget Statements
43
Program 1.1 – Sustainable Management of Natural Resources and the Environment
The objective of this program is to improve the extent, condition and connectivity of Australia’s unique biodiversity and natural resources, including the Great Barrier Reef, through protection of habitats and mitigation of threats to threatened species and ecological communities.
Year Performance criteria (a) Targets (a)
Continued implementation of the Reef 2050 Plan. Continued stakeholder engagement through the Reef 2050 Plan governance structures, including the Reef 2050 Advisory Committee and Independent Expert Panel.
Reef Trust continues investment through phased investment strategies to deliver projects that address key threats to the Great Barrier Reef, with a focus on improving water quality and coastal habitats, and protecting biodiversity.
Australia’s biodiversity, including priority threatened species, ecological communities, cetaceans and migratory species, and significant heritage places, are identified, conserved and protected.
Contracted projects to plant 20 million trees in place by June 2020.
Threatened Species Strategy targets are met.
56 Regional natural resource management organisations have delivered against National Landcare Program objectives.
Improving Your Local Parks and Environment Program projects deliver against program objectives.
Green Army program objectives delivered.
95 per cent of Biodiversity Fund projects substantially complete, delivering 53,800 ha of revegetation to improve vegetation condition and/or increase extent.
2018–19 and beyond
As for 2017–18 National Landcare Program delivers against program objectives and contracts are in place.
As for 2017–18 with the exception of concluding programs
Purposes Conserve, protect and sustainably manage Australia’s biodiversity and heritage.
Material changes to Program 1.1 resulting from the following measures:
Measure title – National Landcare Programme – continuation
(a) New or modified performance criteria and/or targets that reflect new or materially changed programs are shown in italics.

Department of the Environment and Energy Budget Statements
44
Program 1.2 - Environmental Information and Research
The objective of this program is to improve understanding of Australia’s environment and inform environmental decision-making through collaborative research and enhanced discovery, access and use of environmental information; improve the knowledge of, and inform decision-making on, the water-related impacts of coal seam gas and coal mining development.
Delivery Program 1.2 will be delivered by:
Providing information to assist decision-makers to understand, manage and conserve Australia’s environment, including under the Environment Protection and Biodiversity Conservation Act 1999
Supporting the discovery and classification of Australia’s plants, animals and other organisms by providing taxonomic information to the public, funding taxonomic research and building Australia’s taxonomic capacity
Collating, managing and making fundamental biodiversity information openly accessible to the public, science, industry and government, to assist decision-makers to understand, manage and conserve Australia’s environment
Providing data and information to decision-makers and the community that addresses critical gaps in the scientific understanding of the water-related impacts of coal seam gas and large coal mining development
Providing technical and secretariat support to the Independent Expert Scientific Committee on Coal Seam Gas and Large Coal Mining Development (IESC) to ensure delivery of timely and robust advice on the water-related impacts of coal seam gas and large coal mining development to government regulators.
Performance information
Year Performance criteria Targets
2016–17
Data and information generated by the Department are used by stakeholders and/or supports evidence based decision-making.
On Track
All environmental datasets owned by the Department are published under Creative Commons.
On track
All advice provided to regulators by the IESC is delivered within statutory timeframes and made publicly available.
On track
Completion and release of bioregional assessments for all 13 bioregions by 30 June 2017 to assess the potential water-related impacts of coal and coal seam gas.
Not on track—The six remaining reports will be delivered in early 2017–18. Delays are due to the complexity of the research and ensuring scientific rigor.
200 taxa revised or newly described under the Australian Biological Resources Study.
Achieved
At least 64 researchers, including early career researchers, supported under the Australian Biological Resources Study.
Achieved

Department of the Environment and Energy Budget Statements
45
Program 1.2 - Environmental Information and Research
The objective of this program is to improve understanding of Australia’s environment and inform environmental decision-making through collaborative research and enhanced discovery, access and use of environmental information; improve the knowledge of, and inform decision-making on, the water-related impacts of coal seam gas and coal mining development.
Performance information
Year Performance criteria (a) Targets (a)
2017–18 Data and information generated by the Department are used by stakeholders and/or supports evidence based decision-making.
All environmental datasets owned by the Department are published under Creative Commons and in accordance with the Australian Government Public Data Policy.
A national approach to environment economic accounts is developed with jurisdictions by December 2017.
All advice provided to regulators by the IESC is delivered within statutory timeframes and made publicly available.
The bioregional assessments of the potential water-related impacts of coal and coal seam gas for all 13 bioregions are completed by 30 September 2017.
Priority regions are identified and work is underway for new combined geological and bioregional assessments of the impacts of unconventional gas extraction, including shale and tight gas.
650 taxa revised or newly described under the Australian Biological Resources Study.
At least 100 researchers, including early career researchers, supported under the Australian Biological Resources Study.
2018–19 and beyond As for 2017–18 As for 2017–18 except for bioregional assessment and environment economic accounts targets above.
Purposes Relates to ‘Environment and Heritage’ and supports all other purposes.
Material changes to Program 1.2 resulting from the following measures:
Measure title – Energy for the Future – gas supply and affordability
(a) New or modified performance criteria and/or targets that reflect new or materially changed programs are shown in italics.

Department of the Environment and Energy Budget Statements
46
Program 1.3 – Commonwealth Environmental Water
The objective of the program is to: protect and restore water-dependent ecosystems in the Murray–Darling Basin through the management and use of Commonwealth environmental water and manage Australia’s obligations under the Ramsar Convention; and improve the knowledge of, and inform decision-making on, the impacts to and management of water-dependent ecosystems consistent with international and national obligations.
Delivery Program 1.3 will be delivered by:
Planning for the use, carryover and trade of Commonwealth environmental water (integrated portfolio management plans)
Managing, delivering, monitoring and reporting on Commonwealth environmental water
Engaging Murray–Darling Basin communities, Indigenous groups, irrigation industries and others to incorporate local experience and knowledge in the management of Commonwealth environmental water
Contributing to the development of the National Carp Control Plan
Undertaking research, conducting assessments, compiling information and providing advice to improve the management of water-dependent ecosystems, including Ramsar wetlands
Representing Australia and the Oceania region at Ramsar Conference of Contracting Parties meetings, and undertaking the role of Vice Chair of the Ramsar Standing Committee.
Performance information
Year Performance criteria Targets
2016–17 Australia meets its obligations under international environmental agreements.
On track
All required assessments under Article 3.2 of the Ramsar Convention (change in the ecological character description of Ramsar wetlands) are completed consistent with obligations under the Convention.
On track
Environmental watering improves the condition of water-dependent ecosystems in the Murray–Darling Basin.
On track
All Commonwealth environmental water is actively and adaptively managed, including through use, trade, and carry over
On track
Intervention monitoring demonstrates that Commonwealth environmental water contributes to the achievement of Basin Plan targets and the Basin-wide environmental watering strategy.
On track
Support the multi agency project team led by the Department of Agriculture and Water Resources to develop the National Carp Control Plan.
On track
2017–18 Environmental watering improves the condition of water-dependent ecosystems in the Murray–Darling Basin, contributing to achievement of targets in the Basin-wide environment watering strategy.
All Commonwealth environmental water is actively and adaptively managed, including through use, trade, and carry over.

Department of the Environment and Energy Budget Statements
47
Program 1.3 – Commonwealth Environmental Water
The objective of the program is to: protect and restore water-dependent ecosystems in the Murray–Darling Basin through the management and use of Commonwealth environmental water and manage Australia’s obligations under the Ramsar Convention; and improve the knowledge of, and inform decision-making on, the impacts to and management of water-dependent ecosystems consistent with international and national obligations.
Year Performance criteria Targets
Australia meets its obligations under international environmental agreements.
All required assessments under Article 3.2 of the Ramsar Convention (change in the ecological character of Ramsar wetlands) are completed consistent with obligations under the Convention.
Support the Department of Agriculture and Water Resources to develop a National Carp Control Plan by 2018.
2018–19 and beyond
As for 2017–18 As for 2017–18
Purposes Conserve, protect and sustainably manage Australia’s biodiversity and heritage.
Program 1.4 – Conservation of Australia’s Heritage and Environment
The objective of this program is to: (a) identify and protect world and nationally significant natural, Indigenous and historic heritage places; (b) identify, protect and conserve Australia’s threatened species, ecological communities, cetaceans and migratory species; and (c) protect internationally traded flora and fauna consistent with national and international obligations.
Delivery Program 1.4 will be delivered by:
Administering regulation and providing advice on the delivery of funding programs to support the identification and protection of threatened species and ecological communities and significant natural, Indigenous and historic heritage places
Regulating wildlife trade (imports and exports) to protect Australia’s biodiversity and CITES species and allowing sustainable use of wildlife resources
Providing advice and representing Australia’s interests on heritage, wildlife and biodiversity matters and meeting obligations under international agreements.
Performance information
Year Performance criteria Targets
2016–17 Australia’s biodiversity, including threatened species, ecological communities, cetaceans and migratory species, and significant heritage places, are identified, conserved and protected.
On track
All activities required by legislation are conducted within statutory timeframes.
Not on track—The majority of activities have been met on time. Those that have been delayed are due to increased complexity of projects and stakeholder negotiations and resource constraints, including staff turnover.

Department of the Environment and Energy Budget Statements
48
Program 1.4 – Conservation of Australia’s Heritage and Environment
The objective of this program is to: (a) identify and protect world and nationally significant natural, Indigenous and historic heritage places; (b) identify, protect and conserve Australia’s threatened species, ecological communities, cetaceans and migratory species; and (c) protect internationally traded flora and fauna consistent with national and international obligations.
Year Performance criteria Targets
Overdue referrals and assessments are, on average, only eight days late.
Data and information generated or commissioned by the Department are used by stakeholders and/or support evidence based decision-making.
On track
All guidance documents, including conservation advices, recovery plans, wildlife conservation plans and threat abatement plans are developed and published within statutory timeframes.
Not on track—Limited capacity has delayed preparation of recovery plans and conservation advices for some species and ecological communities. The Department is directing effort to developing documents for identified high priority species and ecological communities.
Australia meets its obligations under international environmental agreements.
On track
All Australian property included on the list of World Heritage is well managed.
On track
2017–18 Australia’s biodiversity, including priority threatened species, ecological communities, cetaceans and migratory species, and significant heritage places, are identified, conserved and protected.
Activities required by legislation are conducted within statutory timeframes.
Data and information generated or commissioned by the Department are used by stakeholders and/or support evidence based decision-making.
Australia meets its obligations under international environmental agreements.
All Australian property included on the list of World Heritage is well managed.
2018–19 and beyond
As for 2017–18 As for 2017–18
Purposes Conserve, protect and sustainably manage Australia’s biodiversity and heritage.

Department of the Environment and Energy Budget Statements
49
Program 1.5 – Environmental Regulation
The objective of this program is to support sustainable development outcomes by delivering efficient and effective regulation of matters of national environmental significance.
Delivery Program 1.5 will be delivered by:
Undertaking individual and strategic environmental assessments and approvals an implementing a risk based approach to compliance and enforcement activities under the Environment Protection and Biodiversity Conservation Act 1999 and Environment Protection (Sea Dumping) Act 1981
Significant progress on implementing government reforms and effective and efficient delivery of government policies, programs and priorities in relation to environmental protection
Overseeing, and participating in, arrangements for the regulation of uranium mining in the Alligator Rivers Region to ensure regulation is adequate, effective and consistent with statutory requirements under the Environment Protection (Alligator Rivers Region) Act 1978
Undertake annual scientific research and monitoring programs into the environmental effects of uranium mining to address key knowledge needs and contribute to the development of scientifically rigorous environmental performance criteria for the operational, rehabilitation and closure phases of mining under the Environment Protection (Alligator Rivers Region) Act 1978.
Performance information
Year Performance criteria Targets
2016–17 Australia’s biodiversity, including threatened species, ecological communities, and migratory species, and significant heritage places, are identified, conserved and protected.
On track
All activities required by legislation are conducted within statutory timeframes.
Not on track—The majority of activities have been met on time. Those that have been delayed are due to increased complexity of projects and stakeholder negotiations and resource constraints, including staff turnover. Overdue referrals and assessments are, on average, only eight days late.
The number of hectares of habitat protected by offsets6 is equal to or greater than the area impacted7 for approved projects.
Data/information not available—Time lags, inability to factor in habitat quality and inadequate IT support systems prevent full reporting against this target at this time.
6 Location data available is only for those offsets that have been secured, noting there is often a lag once an
offset has been approved as a condition to the actual securing of the offset. This dataset will mature over time and is indicative only. 7 Project footprint.

Department of the Environment and Energy Budget Statements
50
Program 1.5 – Environmental Regulation
The objective of this program is to support sustainable development outcomes by delivering efficient and effective regulation of matters of national environmental significance.
Year Performance criteria Targets
Increase in the use of strategic approaches to environmental assessments and approvals.
On track
Increase in the proportion of approved assessments that apply streamlining policy initiatives, including outcomes based conditions, conditions setting policy, and bilateral assessment agreements.
On track
Data and information generated or commissioned by the Department are used by stakeholders and/or support evidence based decision-making.
On track
Improved compliance with national environmental legislation.
Achieved
The Alligator Rivers Region environment remains protected from uranium mining effects consistent with statutory requirements.
On track
Ensure the concentrations of mine derived contaminants in surface water downstream of Ranger Mine do not exceed statutory water quality objectives.
Achieved
Annual research and monitoring programs are endorsed by the Alligator Rivers Region Technical Committee.
Achieved
2017–18 Australia’s biodiversity, including priority threatened species, ecological communities, cetaceans and migratory species, and significant heritage places, are identified, conserved and protected.
Activities required by legislation are conducted within statutory timeframes.
The number of hectares of habitat protected by offsets8 is equal to or greater than the area impacted9 for approved projects.
8 Location data available is only for those offsets that have been secured, noting there is often a lag once an
offset has been approved as a condition to the actual securing of the offset. This dataset will mature over time and is indicative only. 9 Project footprint.

Department of the Environment and Energy Budget Statements
51
Program 1.5 – Environmental Regulation
The objective of this program is to support sustainable development outcomes by delivering efficient and effective regulation of matters of national environmental significance.
Year Performance criteria Targets
Increase in the use of strategic assessments for environmental assessments and approvals.
Increase in the proportion of approved assessments that apply streamlining policy initiatives, including outcomes based conditions, conditions setting policy, and bilateral assessment agreements.
Data and information generated or commissioned by the Department are used by stakeholders and/or support evidence based decision-making.
Improved compliance with national environmental legislation.
The Alligator Rivers Region environment remains protected from uranium mining impacts consistent with statutory requirements.
Ensure the concentrations of mine derived contaminants in surface water downstream of Ranger Mine do not exceed statutory water quality objectives.
Annual research and monitoring programs are endorsed by the Alligator Rivers Region Technical Committee.
2018–19 and beyond
As for 2017–18 As for 2017–18
Purpose Conserve, protect and sustainably manage Australia’s biodiversity and heritage.

Department of the Environment and Energy Budget Statements
52
Program 1.6 – Management of Hazardous Wastes, Substances and Pollutants
The objective of this program is to protect the environment through national approaches to effectively and efficiently manage hazardous wastes, substances and pollutants.
Delivery Program 1.6 will be delivered by:
Discharge of legislative and regulatory functions and effective and efficient delivery of government policies, programs and priorities in relation to environmental health
Significant progress on implementing government reforms in relation to environmental health
Implementing a risk based approach to compliance and enforcement activities to support regulation under the Fuel Quality Standards Act 2000 and the Ozone Protection and Synthetic Greenhouse Gas Management Act 1989.
Performance information
Year Performance criteria (a) Targets
2016–17 Australia meets its obligations under international environmental agreements.
On track
All activities required by legislation are conducted within statutory timeframes.
Achieved
Data and information generated or commissioned by the Department are used by stakeholders and/or support evidence based decision-making.
On track
Improved compliance with national environmental legislation.
On track
2017–18 Australia meets its obligations under international environmental agreements.
Activities required by legislation are conducted within statutory timeframes.
Data and information generated or commissioned by the Department are used by stakeholders and/or support evidence based decision-making.
Improved compliance with national environmental legislation.
2018–19 and beyond
As for 2017–18 As for 2017–18
Purposes Conserve, protect and sustainably manage Australia’s biodiversity and heritage.
Material changes to Program 1.6 resulting from the following measures:
Measure title –National Emissions Standards for Non-road Spark Ignition Engines and Equipment – cost recovery
(a) New or modified performance criteria that reflect new or materially changed programs are shown in italics.

Department of the Environment and Energy Budget Statements
53
2.2 BUDGETED EXPENSES AND PERFORMANCE FOR OUTCOME 2
Outcome 2: Reduce Australia’s greenhouse gas emissions, adapt to the impacts of climate change, contribute to effective global action on climate change, and support technological innovation in clean and renewable energy, through developing and implementing a national response to climate change.
Linked programs
Attorney-General’s Department
Programs
Program 1.2 – National Security and Criminal Justice
Contribution to Outcome 2 made by linked programs
The Attorney-General's Department provides joint secretariat support with the Department of the Environment and Energy for the Australian Government Disaster and Climate Resilience Reference Group. The Group is a senior forum to progress policy on disaster and climate resilience.
Australian Renewable Energy Agency
Programs
Program 1.1 – Australian Renewable Energy Agency
Contribution to Outcome 2 made by linked programs
The Department of the Environment and Energy has responsibility for developing and implementing policies that reduce Australia's greenhouse gas emissions. The Australian Renewable Energy Agency contributes to implementing these policies by providing financial assistance for the research, development, demonstration, deployment and commercialisation of clean energy technologies. This provides options to meet future emission reduction targets at lower cost.
Australian Taxation Office
Programs
Program 1.1 – Australian Taxation Office
Contribution to Outcome 2 made by linked programs
The Department of the Environment and Energy shares information on Emissions Reduction Fund tree planting projects with the Australian Taxation Office which administers the Carbon Sink Forest Tax measure, a tax deduction available to these projects.

Department of the Environment and Energy Budget Statements
54
Bureau of Meteorology
Programs
Program 1.1 – Bureau of Meteorology
Contribution to Outcome 2 made by linked programs
The Bureau of Meteorology works collaboratively with the Department of the Environment and Energy to provide weather/climate information and to engage with other climate science providers to identify priority investment areas and research needs.
Clean Energy Finance Corporation
Programs
Program 1.1 – Clean Energy Finance Corporation
Contribution to Outcome 2 made by linked programs
The Department of the Environment and Energy has responsibility for policies that reduce Australia’s greenhouse gas emissions. The Clean Energy Finance Corporation contributes to these programs by facilitating increased flows of finance into the clean energy sector.
Clean Energy Regulator
Programs
Program 1.1 – Clean Energy Regulator
Contribution to Outcome 2 made by linked programs
The Department of the Environment and Energy has policy responsibility for the Emissions Reduction Fund and the Renewable Energy Target. The Clean Energy Regulator works collaboratively with the Department as the delivery agency and regulator for these schemes.
Climate Change Authority
Programs
Program 1.1 – Reviewing climate change mitigation policies
Contribution to Outcome 2 made by linked programs
The Climate Change Authority supports the Department of the Environment and Energy in reducing Australia's greenhouse gas emissions by providing independent climate change mitigation policy advice to the Government.

Department of the Environment and Energy Budget Statements
55
Commonwealth Scientific and Industrial Research Organisation
Programs
Program 1.1 – Research – Science, Services and Innovation Fund
Contribution to Outcome 2 made by linked programs
The Department of the Environment and Energy is collaborating with the Commonwealth Scientific and Industrial Research Organisation on climate science research needs through the Climate Science Centre.
Department of Foreign Affairs and Trade
Programs
Program 1.1 – Foreign Affairs and Trade Operations
Contribution to Outcome 2 made by linked programs
The Department of Foreign Affairs and Trade leads for the Government on
international climate change negotiations under the United Nations Framework
Convention on Climate Change (UNFCCC). The Department of the Environment
and Energy works with DFAT in formulating advice to Government on these
matters and representing Australia at UNFCCC meetings.
The Department of the Environment and Energy also delivers a number of
Australian Government funded projects that support climate change capacity
development projects in developing countries.
Department of Industry, Innovation and Science
Programs
Program 3 – Program Support
Contribution to Outcome 2 made by linked programs
The Department of the Environment and Energy provides joint secretariat support for the National Climate Science Advisory Committee. The Committee advises the Australian Government on a nationally integrated approach to climate change impacts and inform the direction and sustainability of Australia's climate science capacity and research priorities.

Department of the Environment and Energy Budget Statements
56
Department of Infrastructure and Regional Development
Programs
Program 2.2 – Infrastructure and Regional Development
Contribution to Outcome 2 made by linked programs
The Department of Infrastructure and Regional Development is consulting on a proposal to implement fuel efficiency standards for light vehicles. Fuel efficiency standards would contribute to reducing Australia’s greenhouse gas emissions by reducing emissions from light vehicles.
Department of the Prime Minister and Cabinet
Programs
Program 1.1 – Prime Minister and Cabinet
Contribution to Outcome 2 made by linked programs
The Department of the Environment and Energy supports the Government's agenda to improve results for Indigenous Australians by offering opportunities to work on country and generate income through projects that reduce Australia's greenhouse gas emissions under the Emissions Reduction Fund.
Great Barrier Reef Marine Park Authority
Programs
Program 1.1 – Improving the outlook for the Great Barrier Reef
Contribution to Outcome 2 made by linked programs
Climate Change is the most significant threat to the Great Barrier Reef. The
Department of the Environment and Energy is responsible for policy to support an
effective global response to climate change and for adapting to climate change.

Department of the Environment and Energy Budget Statements
57
Budgeted expenses for Outcome 2
This table shows how much the entity intends to spend (on an accrual basis) on
achieving the outcome, broken down by program, as well as by Administered and
Departmental funding sources.
Table 2.2.1: Budgeted expenses for Outcome 2
Outcome 2: Reduce Australia's greenhouse gas emissions, adapt to the impacts of climate change, contribute to effective global action on climate change, and support technological innovation in clean and renewable energy, through developing and implementing a national response to climate change.
2016-17 Estimated
actual $'000
2017-18 Budget
$'000
2018-19 Forward estimate
$'000
2019-20 Forward estimate
$'000
2020-21 Forward estimate
$'000
Program 2.1: Reducing Australia's Greenhouse Gas Emissions
Administered expenses
Ordinary annual services
(Appropriation Bill No. 1)
Extending the benefits of the
Carbon Farming initiative 428 - - - -
Solar Towns 321 - - - - Independent Scientific Committee
on Wind Turbines 29 29 15 - -
Solar Programs 2,100 3,649 423 - -
Administered total 2,878 3,678 438 - -
Departmental expenses
Departmental appropriation (a, b) 42,217 41,504 39,939 39,611 40,804
Expenses not requiring appropriation
in the Budget year (c) 6,761 5,433 1,392 84 84
Departmental total 48,978 46,937 41,331 39,695 40,888
Total expenses for Program 2.1 51,856 50,615 41,769 39,695 40,888
Program 2.2: Adapting to Climate Change
Administered expenses
Ordinary annual services
(Appropriation Bill No. 1)
National Climate Change
Adaptation Research Facility 2,730 - - - -
Administered total 2,730 - - - -
Departmental expenses
Departmental appropriation (a, b) 2,439 2,849 2,256 2,257 2,315
Expenses not requiring appropriation
in the Budget year (c) 5 5 5 5 5
Departmental total 2,444 2,854 2,261 2,262 2,320
Total expenses for Program 2.2 5,174 2,854 2,261 2,262 2,320

Department of the Environment and Energy Budget Statements
58
Table 2.2.1: Budgeted expenses for Outcome 2 (continued)
Outcome 2: Reduce Australia's greenhouse gas emissions, adapt to the impacts of climate change, contribute to effective global action on climate change, and support technological innovation in clean and renewable energy, through developing and implementing a national response to climate change.
2016-17 Estimated
actual $'000
2017-18 Budget
$'000
2018-19 Forward estimate
$'000
2019-20 Forward estimate
$'000
2020-21 Forward estimate
$'000
Program 2.3: Renewable Energy Technology Development
Administered expenses
Special appropriations
Australian Renewable Energy
Agency Act 2011 189,037 257,925 235,296 254,704 134,035
Less payments to corporate
entities (d) (189,037) (257,925) (235,296) (254,704) (134,035)
Payments to corporate entities (d) 299,414 259,998 237,759 257,572 137,041
Administered total 299,414 259,998 237,759 257,572 137,041
Departmental expenses
Departmental appropriation (a) 7,179 6,640 5,976 4,012 4,018
Departmental total 7,179 6,640 5,976 4,012 4,018
Total expenses for Program 2.3 306,593 266,638 243,735 261,584 141,059
Outcome 2 Totals by appropriation type
Administered expenses
Ordinary annual services
(Appropriation Bill No. 1) 5,608 3,678 438 - -
Payments to corporate entities (d) 299,414 259,998 237,759 257,572 137,041
Administered total 305,022 263,676 238,197 257,572 137,041
Departmental expenses
Departmental appropriation (a, b) 51,835 50,993 48,171 45,880 47,137
Expenses not requiring appropriation
in the Budget year (c) 6,766 5,438 1,397 89 89
Departmental total 58,601 56,431 49,568 45,969 47,226
Total expenses for Outcome 2 363,623 320,107 287,765 303,541 184,267

Department of the Environment and Energy Budget Statements
59
Table 2.2.1: Budgeted expenses for Outcome 2 (continued)
Movement of administered funds between years (e)
2016-17 Estimated
actual $'000
2017-18 Budget
$'000
2018-19 Forward estimate
$'000
2019-20 Forward estimate
$'000
2020-21 Forward estimate
$'000
Outcome 2:
Solar Towns (f) 321 - - - -
Total movement of administered funds 321 - - - -
2016-17 2017-18
Average staffing level (number) 288 284
(a) Outcome 2 also has a departmental capital budget of $0.450 million in 2017-18.
(b) Includes retained revenue receipts under section 74 of the Public Governance, Performance and Accountability (PGPA) Act 2013.
(c) Expenses not requiring appropriation comprise depreciation expenses, amortisation expenses, audit fees and an approved operating loss.
(d) Further information on payments to corporate entities can be found in the "Third Party Payments" section of Table 1.1: Department of the Environment and Energy resource statement.
(e) Figures displayed in brackets represent a decrease in funds.
(f) This movement was from 2015-16.
Note: Departmental appropriation splits and totals are indicative estimates and may change in the course of the budget year as government priorities change.

Department of the Environment and Energy Budget Statements
60
Table 2.2.2: Performance criteria for Outcome 2
Table 2.2.2 below details the performance criteria for each program associated with
Outcome 2. It summarises how each program is delivered and where 2017–18 Budget
measures have created new programs or materially changed existing programs.
Outcome 2 – Reduce Australia’s greenhouse gas emissions, adapt to the impacts of climate change, contribute to effective global action on climate change, and support technological innovation in clean and renewable energy, through developing and implementing a national response to climate change.
Program 2.1 – Reducing Australia’s Greenhouse Gas Emissions
The objective of this program is to shape the global response to climate change and achieve Australia’s greenhouse gas emissions reduction targets through effective emissions reduction mechanisms, including the Emissions Reduction Fund, Carbon Neutral Program and the Renewable Energy Target.
Delivery Program 2.1 will be delivered by:
Implementing the Emissions Reduction Fund components (crediting, purchasing and safeguard) and the Carbon Neutral Program
Encouraging the uptake of additional renewable energy and energy innovation through the Renewable Energy Target, the Solar Communities program and collaborating with the Australian Renewable Energy Agency and the Clean Energy Finance Corporation.
Performance information
Year Performance criteria Targets
2016–17 Australia meets its obligations under international climate change agreements.
On track
Australia meets its 2020 emissions reduction target.
On track
Electricity generation from eligible large scale sources reaches the legislated target of 33,000 GWh in 2020. With support from small scale and other renewable energy generation, such as the Small-scale Renewable Energy Scheme and the Solar programs, this delivers 23.5 per cent from renewable sources in 2020.
On track
A doubling of Australian Government expenditure on clean energy research and development on 2015 levels by 2020 consistent with Australia’s Mission Innovation pledge.
On track

Department of the Environment and Energy Budget Statements
61
Program 2.1 – Reducing Australia’s Greenhouse Gas Emissions
The objective of this program is to shape the global response to climate change and achieve Australia’s greenhouse gas emissions reduction targets through effective emissions reduction mechanisms, including the Emissions Reduction Fund, Carbon Neutral Program and the Renewable Energy Target.
Year Performance criteria Targets
2017–18 Australia meets its obligations under international climate change agreements.
Australia meets its 2020 emissions reduction target.
Electricity generation from eligible large scale sources reaches the legislated target of 33,000 GWh in 2020. With support from small scale and other renewable energy generation, such as the Small-scale Renewable Energy Scheme and the Solar programs, this delivers 23.5 per cent from renewable sources in 2020.
A doubling of Australian Government expenditure on clean energy research and development on 2015 levels by 2020 consistent with Australia’s Mission Innovation pledge.
2018–19 and beyond
As for 2017–18 As for 2017–18
Purposes Develop and implement a national response to climate change.

Department of the Environment and Energy Budget Statements
62
Program 2.2 – Adapting to Climate Change
The objective of this program is to provide the guidance, information and national coordination needed to ensure that Australian Government operations and activities are resilient to climate change impacts, and that businesses and communities are better placed to manage their own risks.
Delivery Program 2.2 will be delivered by:
Working with Australian Government agencies to improve understanding and consideration of climate risk to Government operations, program, and policies
Guiding development of public good climate science, and adaptation information and guidance, to improve understanding of climate change impacts, build capacity, and inform decision-making.
Performance information
Year Performance criteria (a) Targets
2016–17
Data and information generated or commissioned by the Department are used by stakeholders and/or support evidence based decision-making.
On track
The Department supports capability development across Government in adaptation and understanding climate risk.
On track
National coordination, including collaboration with jurisdictions, leading to identification of cross-cutting climate risks and development of future national climate change adaptation priorities and resilience measures.
On track
2017–18 Data and information generated or commissioned by the Department are used by stakeholders and/or support evidence based decision-making.
The Department supports capability development across Government in adapting to and understanding climate risk.
National coordination, including collaboration with jurisdictions, leading to identification of cross-cutting climate risks and development of future national climate change adaptation priorities and resilience measures.
2018–19 and beyond
As for 2017–18 As for 2017–18
Purposes Develop and implement a national response to climate change.
Material changes to Program 2.2 resulting from the following measures:
Measure title – Adaptation Partnership
(a) New or modified performance criteria that reflect new or materially changed programs are shown in italics.

Department of the Environment and Energy Budget Statements
63
Program 2.3 – Renewable Energy Technology Development
The objective of this program is to support the Australian Renewable Energy Agency and the Clean Energy Finance Corporation.
Delivery Program 2.3 will be delivered by providing support for Australian Renewable Energy Agency and Clean Energy Finance Corporation to encourage the uptake of additional renewable energy and energy innovation.
Performance information
Year Performance criteria Targets
2016–17 Support ARENA and the CEFC to increase the investment of funds into the Australian economy supporting clean energy technologies, including the number of projects progressing beyond the research and development phase of the innovation chain.
On track
2017–18 Support ARENA and the CEFC to increase the investment of funds into the Australian economy supporting clean energy technologies, including the number of projects progressing beyond the research and development phase of the innovation chain.
2018–19 and beyond
As for 2017–18 As for 2017–18
Purposes Develop and implement a national response to climate change.

Department of the Environment and Energy Budget Statements
64
2.3 BUDGETED EXPENSES AND PERFORMANCE FOR OUTCOME 3
Outcome 3: Advance Australia’s strategic, scientific, environmental and economic interests in the Antarctic region by protecting, administering and researching the region.
Linked programs
Bureau of Meteorology
Programs
Program 1.1 – Bureau of Meteorology
Contribution to Outcome 3 made by linked programs
The Bureau of Meteorology provides meteorological and related services in support of the Australian Antarctic program under a Memorandum of Understanding.
Commonwealth Scientific and Industrial Research Organisation
Programs
Program 1.1 – Research – Science, Services and Innovation Fund
Contribution to Outcome 3 made by linked programs
The Commonwealth Scientific and Industrial Research Organisation undertakes scientific research and monitoring in the Southern Ocean and at Australia’s Antarctic Stations, as part of the Australian Antarctic program.
Department of Defence
Programs
Program 2.3 – Chief Finance Officer
Contribution to Outcome 3 made by linked programs
The Department of Defence provides a range of logistics support services and advice to the Australian Antarctic program, including hydrographic mapping services and heavy lift capability to supplement existing flights in the delivery of cargo and contributing to emergency responses in the region.

Department of the Environment and Energy Budget Statements
65
Department of Foreign Affairs and Trade
Programs
Program 1.1 – Foreign Affairs and Trade Operations
Contribution to Outcome 3 made by linked programs
The Department of Foreign Affairs and Trade, in cooperation with the Department of the Environment and Energy, leads a whole of government approach to Antarctic policy development and international relations, including through the Antarctic Treaty System.

Department of the Environment and Energy Budget Statements
66
Budgeted expenses for Outcome 3
This table shows how much the entity intends to spend (on an accrual basis) on
achieving the outcome, broken down by program, as well as by Administered and
Departmental funding sources.
Table 2.3.1: Budgeted expenses for Outcome 3
Outcome 3: Advance Australia's strategic, scientific, environmental and economic interests in the Antarctic region by protecting, administering and researching the region.
2016-17 Estimated
actual $'000
2017-18 Budget
$'000
2018-19 Forward estimate
$'000
2019-20 Forward estimate
$'000
2020-21 Forward estimate
$'000
Program 3.1: Antarctica: Science, Policy and Presence
Administered expenses
Expenses not requiring appropriation
in the Budget year (a) 12 12 12 12 12
Administered total 12 12 12 12 12
Departmental expenses
Departmental appropriation (b, c) 125,475 120,932 109,811 121,731 133,162
Expenses not requiring appropriation
in the Budget year (a) 53,972 56,028 55,073 50,945 78,566
Departmental total 179,447 176,960 164,884 172,676 211,728
Total expenses for Program 3.1 179,459 176,972 164,896 172,688 211,740
Outcome 3 Totals by appropriation type
Administered expenses
Expenses not requiring appropriation in
the Budget year (a) 12 12 12 12 12
Administered total 12 12 12 12 12
Departmental expenses
Departmental appropriation (b, c) 125,475 120,932 109,811 121,731 133,162
Expenses not requiring appropriation
in the Budget year (a) 53,972 56,028 55,073 50,945 78,566
Departmental total 179,447 176,960 164,884 172,676 211,728
Total expenses for Outcome 3 179,459 176,972 164,896 172,688 211,740
2016-17 2017-18
Average staffing level (number) 383 378
(a) Expenses not requiring appropriation in the Budget year comprise depreciation expenses, amortisation expenses, audit fees and an approved operating loss.
(b) Outcome 3 also has a departmental capital budget of $13.014 million in 2017-18. (c) Includes retained revenue receipts under section 74 of the Public Governance, Performance and
Accountability (PGPA) Act 2013.
Note: Departmental appropriation splits and totals are indicative estimates and may change in the course of the budget year as government priorities change.

Department of the Environment and Energy Budget Statements
67
Table 2.3.2: Performance criteria for Outcome 3
Table 2.3.2 below details the performance criteria for each program associated with
Outcome 3. It summarises how each program is delivered and where 2017–18 Budget
measures have created new programs or materially changed existing programs.
Outcome 3 – Advance Australia’s strategic, scientific, environmental and economic interests in the Antarctic region by protecting, administering and researching the region.
Program 3.1 – Antarctica: Science, Policy and Presence
The objective of this program is to conduct scientific research in Antarctica and the Southern Ocean that supports Australian Government policy and environmental management priorities.
Delivery Program 3.1 will be delivered by:
Implementing the Australian Antarctic Strategy and 20 Year Action Plan
Delivering the 2017–18 Australian Antarctic program including high priority Australian Antarctic scientific research in accordance with the goals of the Australian Antarctic Science Strategic Plan 2011–12 to 2020–21, the safe operation of four Antarctic and sub-Antarctic stations and an associated logistical network
Administering and protecting the Antarctic environment by undertaking practical work of economic and international significance including compliance with all Australian Antarctic environmental legislation.
Performance information
Year Performance criteria Targets
2016–17 The Antarctic Treaty system remains in force under sound governance and its values are understood and supported.
On track
Implementation of year one of the Australian Antarctic Strategy and 20 Year Action Plan.
On track
Antarctica and the Southern Ocean are protected, valued and understood.
On track
Australian Antarctic program complies with relevant environmental legislation.
On track
Australia leads Antarctic science and operations in the Australian Antarctic Territory and consolidates Hobart as the premier Antarctic gateway city for east Antarctica.
On track
Scientific research conducted in Antarctica and the Southern Ocean is consistent with the Australian Antarctic Science Strategic Plan and internationally recognised – At least 100 international institutions collaborating in the Australian Antarctic program during 2016–17 including collaborative agreements or logistics with three or more Antarctic programs of other nations.
– At least 100 scientific publications published in peer reviewed journals.
On track

Department of the Environment and Energy Budget Statements
68
Program 3.1 – Antarctica: Science, Policy and Presence
The objective of this program is to conduct scientific research in Antarctica and the Southern Ocean that supports Australian Government policy and environmental management priorities.
Year Performance criteria Targets
2017–18 The Antarctic Treaty system remains in force under sound governance and its values are understood and supported.
Implementation of the Australian Antarctic Strategy and 20 Year Action Plan.
Antarctica and the Southern Ocean are protected, valued and understood.
Australian Antarctic program complies with relevant environmental legislation.
Australia leads Antarctic science and operations in the Australian Antarctic Territory and consolidates Hobart as the premier Antarctic gateway city for east Antarctica.
Scientific research conducted in Antarctica and the Southern Ocean is consistent with the Australian Antarctic Science Strategic Plan and internationally recognised. – At least 100 international institutions collaborating in the Australian Antarctic program including collaborative agreements or logistics with three-four Antarctic programs of other nations.
– At least 100 scientific publications published in peer reviewed journals.
2018–19 and beyond
As for 2017–18 As for 2017–18
Purposes Advance Australia’s strategic, scientific and environmental interests in the Antarctic.

Department of the Environment and Energy Budget Statements
69
2.4 BUDGETED EXPENSES AND PERFORMANCE FOR OUTCOME 4
Outcome 4: Support the reliable, sustainable and secure operations of energy markets through improving Australia's energy efficiency, performance and productivity for the community.
Linked programs
Attorney-General's Department
Programs
Program 1.7 – National Security and Criminal Justice
Contribution to Outcome 4 made by linked programs
The Attorney-General's Department provides policy advice and support to the Department of the Environment and Energy in relation to the Critical Infrastructure Resilience Strategy and its application for critical energy infrastructure assets. The Attorney-General's Department also provides funding to the Department of the Environment and Energy for secretariat services to support the Energy Sector Group under the Trusted Information Sharing Network.
Australian Competition and Consumer Commission
Programs
Program 1.2 – Australian Energy Regulator
Contribution to Outcome 4 made by linked programs
The Department of the Environment and Energy works with the Australian Energy Regulator by promoting efficient investment in, and efficient operation and use of, energy services for the long term interests of end users of energy with respect to price, quality, safety, reliability and security. The Department facilitates the work streams of the COAG Energy Council in developing electricity and gas rules which the Australian Energy Regulator is responsible for enforcing.
Australian Renewable Energy Agency
Programs
Program 1.1 – Australian Renewable Energy Agency
Contribution to Outcome 4 made by linked programs
The Australian Renewable Energy Agency’s financial assistance for clean energy technologies includes support for projects and research on energy market security and reliability matters, such as the integration of variable renewable energy into the electricity system and the role of energy storage technologies. The Department of the Environment and Energy works with the Australian Renewable Energy Agency in formulating advice to the Government on these matters.

Department of the Environment and Energy Budget Statements
70
Clean Energy Finance Corporation
Programs
Program 1.1 – Clean Energy Finance Corporation
Contribution to Outcome 4 made by linked programs
The Clean Energy Finance Corporation contributes to the reliable, sustainable and secure operations of energy markets by facilitating increased flows of finance into the clean energy sector, including finance for energy efficiency projects. The Department of the Environment and Energy works with the Clean Energy Finance Corporation in formulating advice to the Government on these matters.
Clean Energy Regulator
Programs
Program 1.1 – Clean Energy Regulator
Contribution to Outcome 4 made by linked programs
The Department of the Environment and Energy has policy responsibility for the Emissions Reduction Fund and the Renewable Energy Target. The Clean Energy Regulator works collaboratively with the Department as the delivery agency and regulator for these schemes. The Department is responsible for energy policy and the Clean Energy Regulator works collaboratively with the Department to understand the impacts of its regulatory activity on the market.
Climate Change Authority
Programs
Program 1.1 – Reviewing Climate Change Mitigation Policies
Contribution to Outcome 4 made by linked programs
The Climate Change Authority supports the Department of the Environment and
Energy in reducing Australia’s greenhouse gas emissions by providing independent
climate change mitigation policy advice to the Government, including in relation to
the energy sector.
Department of Foreign Affairs and Trade
Programs
Program 1.1 – Foreign Affairs and Trade Operations
Contribution to Outcome 4 made by linked programs
The Department of Foreign Affairs and Trade provides diplomatic support to the Department of the Environment and Energy on matters relating to compliance with the International Energy Agency treaty.

Department of the Environment and Energy Budget Statements
71
Department of Industry, Innovation and Science
Programs
Program 2 – Growing Business Investment and Improving Business Capability
Contribution to Outcome 4 made by linked programs
The Department of Industry, Innovation and Science contributes to the reliable, sustainable and secure operations of domestic energy markets by working with the Department of the Environment and Energy to deliver more sustainable and competitive gas markets, and more gas supply, through the Domestic Gas Strategy, advancing low emissions fossil fuels technology, including carbon capture and storage, having joint authorship of key government reports on energy and resources data and administering oil and gas operations in Commonwealth waters. The Departments work collaboratively on international engagement with Australia’s key energy resource markets.
National Offshore Petroleum Safety and Environmental Management Authority
Programs
Program 1 – Regulatory oversight of Safety Cases, Well Operations Management Plans and Environment Plans coupled with effective monitoring, investigation and enforcement.
Contribution to Outcome 4 made by linked programs
The National Offshore Petroleum Safety and Environmental Management Authority contributes to the work of the Department of the Environment and Energy through its policies and program relating to the effective management and administration of Australia’s offshore energy resources through the Offshore Petroleum and Greenhouse Gas Storage Act 2006.

Department of the Environment and Energy Budget Statements
72
Budgeted expenses for Outcome 4
This table shows how much the entity intends to spend (on an accrual basis) on
achieving the outcome, broken down by program, as well as by Administered and
Departmental funding sources.
Table 2.4.1: Budgeted expenses for Outcome 4
Outcome 4: Support the reliable, sustainable and secure operations of energy markets through improving Australia's energy efficiency, performance and productivity for the community.
2016-17 Estimated
actual $'000
2017-18 Budget
$'000
2018-19 Forward estimate
$'000
2019-20 Forward estimate
$'000
2020-21 Forward estimate
$'000
Program 4.1: Energy (a)
Administered expenses
Ordinary annual services
(Appropriation Bill No. 1)
Energy Efficiency Programs 590 620 620 620 620
GEMS National Legislative Framework 5,722 5,832 5,832 5,832 5,832 International Energy Agency Compliance
- Collective Action Response - - 7,192 7,318 -
Energy Use Data Model for Better
Forecasting - - 2,500 2,500 2,500
Administered total 6,312 6,452 16,144 16,270 8,952
Departmental expenses
Departmental appropriation (b) 35,363 57,224 47,163 47,458 45,443
Special account
Energy Special Account 2015 10,238 - - - -
Expenses not requiring appropriation
in the Budget year (c) 66 94 94 94 94
Departmental total 45,667 57,318 47,257 47,552 45,537
Total expenses for Program 4.1 51,979 63,770 63,401 63,822 54,489
Outcome 4 Totals by appropriation type
Administered expenses
Ordinary annual services
(Appropriation Bill No. 1) 6,312 6,452 16,144 16,270 8,952
Administered total 6,312 6,452 16,144 16,270 8,952
Departmental expenses
Departmental appropriation (b) 35,363 57,224 47,163 47,458 45,443
Special account 10,238 - - - -
Expenses not requiring appropriation
in the Budget year (c) 66 94 94 94 94
Departmental total 45,667 57,318 47,257 47,552 45,537
Total expenses for Outcome 4 51,979 63,770 63,401 63,822 54,489
2016-17 2017-18
Average staffing level (number) 185 220 (a) The responsibility for Energy functions transferred from the Department of Industry, Innovation and
Science as a result of the Administrative Arrangements Orders dated 19 July 2016 and 1 September 2016.
(b) Includes retained revenue receipts under section 74 of the Public Governance, Performance and Accountability (PGPA) Act 2013.
(c) Expenses not requiring appropriation in the Budget year represent audit fees.
Note: Departmental appropriation splits and totals are indicative estimates and may change in the course of the budget year as government priorities change.

Department of the Environment and Energy Budget Statements
73
Table 2.4.2: Performance criteria for Outcome 4
Table 2.4.2 below details the performance criteria for each program associated with
Outcome 4. It summarises how each program is delivered and where 2017–18 Budget
measures have created new programs or materially changed existing programs.
Outcome 4 – Support the reliable, sustainable and secure operations of energy markets through improving Australia’s energy efficiency, performance and productivity for the community.
Program 4.1 – Energy
The objective of this program is to: lead energy market reform to support investment and market outcomes in the long-term interests of consumers through a national approach to the integration of renewable energy and technology into the National Electricity Market, improving the governance of energy markets and implementation of the Gas Market Reform Package; increase national energy productivity and energy efficiency performance; and support the security of domestic and international electricity, gas and liquid fuel supply chains.
Delivery Program 4.1 will be delivered by:
Delivering national energy market reforms for the long-term interests of consumers by working with states and territories through the COAG Energy Council’s national reform agenda
Accelerating development of a wholesale gas market that provides improved signals for investment and supply, while ensuring efficient transportation of gas supply
Implementing the National Energy Productivity Plan 2015–2030
Implementing a series of agreed reforms to the Limited Merits Review regime to ensure better price outcomes for energy customers
Administering regulatory responsibilities under the Greenhouse and Energy Minimum Standards Act 2012, the Building Energy Efficiency Disclosure Act 2010 and the Nationwide House Energy Rating Scheme
Analysing Australia’s electricity, gas and liquid fuels systems and critical infrastructure to identify, monitor and inform responses to domestic energy security challenges
Developing a robust mandatory reporting regime for petroleum statistics that minimises the regulatory burden on industry
Implementing Australia’s plan to return to compliance with our International Energy Agency oil stockholding obligations.
Performance information
Year Performance criteria Targets
2016–17 Well-functioning energy markets and a robust governance structure that provides efficient price and investment signals and reliable and secure supply to consumers.
On track
Obtain COAG Energy Council’s agreement to the gas market reform package.
Achieved
Implementation of the 2016–17 COAG Energy Council energy market reforms as a matter of priority.
On track
Sound policy advice to support the safe and sustainable operations of energy markets to provide reliable and competitive outcomes for consumers.
Achieved
Review the Limited Merits Review Regime.
Achieved
Support the independent feasibility study of a second Tasmanian interconnector.
On track

Department of the Environment and Energy Budget Statements
74
Program 4.1 – Energy
The objective of this program is to: lead energy market reform to support investment and market outcomes in the long-term interests of consumers through a national approach to the integration of renewable energy and technology into the National Electricity Market, improving the governance of energy markets and implementation of the Gas Market Reform Package; increase national energy productivity and energy efficiency performance; and support the security of domestic and international electricity, gas and liquid fuel supply chains.
Year Performance criteria Targets
Implementation of key elements of the National Energy Productivity Plan 2015–2030 including development of a Government Energy Productivity Plan to improve government building operations.
On track
Energy cost and use data used by stakeholders and/or supports evidence based decision-making.
On track
Energy Efficiency Programs:
Effective delivery of activities to support improved energy productivity of Australia's residential and commercial building stock.
Maintaining Commonwealth contribution to the ongoing development and improvement of the National Australian Built Environment Rating System which underpins the Commercial Building Disclosure Program.
On track
Greenhouse and Energy Minimum Standards National Legislative Framework:
2016 –17
2017 –18
2018 –19
2019 –20
New consultation Regulatory Impact Statements published
5 3 3 3
Number of new products registered under the Greenhouse and Energy Minimum Standards (GEMS) Act 2012
4500 4500 4500 4500

Department of the Environment and Energy Budget Statements
75
Program 4.1 – Energy
The objective of this program is to: lead energy market reform to support investment and market outcomes in the long-term interests of consumers through a national approach to the integration of renewable energy and technology into the National Electricity Market, improving the governance of energy markets and implementation of the Gas Market Reform Package; increase national energy productivity and energy efficiency performance; and support the security of domestic and international electricity, gas and liquid fuel supply chains.
Year Performance criteria (a) Targets
Effective implementation of the Equipment Energy Efficiency Program under the Greenhouse and Energy Minimum Standards Act 2012
On track
Australia meets its emissions reduction targets.
This target duplicates a target under Outcome 2, Program 2.1. Refer to Outcome 2.
Timely, comprehensive and accurate analysis is provided that informs government decisions in relation to energy security.
On track
Amendments to the Liquid Fuel Emergency Act 1984 introduced to Parliament by February 2017.
Not on track—Amendments are drafted and were listed for the Autumn sitting period but were not introduced to Parliament by February 2017. Amendments may be introduced in Winter 2017 sitting period.
Stand-alone legislation to deliver mandatory reporting of petroleum statistics introduced by March 2017.
On track
The third National Energy Security Assessment used by stakeholders and/or supports evidence based decision-making.
Not applicable—The third National Energy Security Assessment has been deferred until later in 2017.
Australia progresses towards compliance with its International Energy Agency stockholding obligation.
On track
Energy Counsellor to progress Australia’s interests in the International Energy Agency in place in early 2017.
Achieved
2017–18 Well-functioning energy markets and a robust governance structure that provides efficient price and investment signals and reliable and secure supply to consumers.
Implement energy market reforms.
Implement gas market reforms.
Implement governance reforms.
Improve national energy productivity and energy efficiency performance.
Increase energy productivity by 40 per cent by 2030 from 2015 level.

Department of the Environment and Energy Budget Statements
76
Program 4.1 – Energy
The objective of this program is to: lead energy market reform to support investment and market outcomes in the long-term interests of consumers through a national approach to the integration of renewable energy and technology into the National Electricity Market, improving the governance of energy markets and implementation of the Gas Market Reform Package; increase national energy productivity and energy efficiency performance; and support the security of domestic and international electricity, gas and liquid fuel supply chains.
Year Performance criteria (a) Targets
Implement the Building Energy Efficiency Disclosure Act 2010 to create a more informed commercial property market and demonstrate improvements in energy efficiency of commercial buildings.
Implement the Minimum Energy Performance Standards and Energy Rating Labelling requirements under the Greenhouse and Energy Minimum Standards (GEMS) Act 2012 to improve the energy efficiency of appliances and equipment sold in Australia.
Data and information generated or commissioned by the Department are used by stakeholders and/or support evidence based decision-making.
Timely, comprehensive and accurate analysis is provided that informs government decisions in relation to energy security.
Implement the annual work programs of the National Gas Emergency Response Advisory Committee and the National Oil Supplies Emergency Committee, and represent the Commonwealth in the National Electricity Market Emergency Management Forum.
Australia progresses towards compliance with its International Energy Agency stockholding obligation.
Procurement framework for oil stock tickets developed for Australia to participate in an International Energy Agency collective action.
Mandatory reporting of statistics on petroleum and other fuels to commence in January 2018.
Influence the reform and modernisation agenda of the International Energy Agency.
2018–19 and beyond
As for 2017–18 Manage contracts for oil stock tickets in 2018–19 and 2019–20.
In 2019–20, prepare the second phase of Australia’s return to full compliance with its International Energy Agency oil stockholding obligation.
As for 2017–18 for remaining nine targets.
Purposes Support the reliable, sustainable and secure operations of energy markets through improving Australia’s energy efficiency, performance and productivity for the community.
Material changes to Program 4.1 resulting from the following measures:
Measure title – Energy for the Future – energy use data model for better forecasting
Measure title – Energy for the Future – gas supply and affordability
(a) New or modified performance criteria that reflect new or materially changed programs are shown in italics.

Department of the Environment and Energy Budget Statements
77
Section 3: Budgeted financial statements
Section 3 presents budgeted financial statements which provide a comprehensive
snapshot of entity finances for the 2017-18 budget year, including the impact of budget
measures and resourcing on financial statements.
3.1 BUDGETED FINANCIAL STATEMENTS
3.1.1 Differences between entity resourcing and financial statements
Departmental
The Agency Resource Statement (Table 1.1) is prepared on a cash basis and provides a
consolidated view of all the cash resources available to the Department of the
Environment and Energy in 2017-18. For departmental items this includes equity
injections and appropriation receivable that is yet to be drawn down to cover payables
and provisions on the Departmental Balance Sheet (Table 3.2). The Comprehensive
Income Statement (Table 3.1) shows only the operating appropriation provided each
year and excludes the appropriation shown in the Departmental capital budget
statement (Table 3.5).
Administered
The resourcing provided to the Clean Energy Finance Corporation Special Account in
Table 1.1 is accounted for as equity funding and there is no impact on the Schedule of
Budgeted Income and Expenses Administered on Behalf of Government (Table 3.7).
The draw downs from the Special Account result in a corresponding increase to
Administered Investments in the Schedule of Budgeted Assets and Liabilities
Administered on Behalf of Government (Table 3.8).
3.1.2 Explanatory notes and analysis of budgeted financial statements
Departmental
Comprehensive Income Statement
The Revenue from Government estimate for 2017-18 of $441.9 million includes
$27.4 million in funding for the new measures outlined in Table 1.2. The Department’s
funding has also increased by $39.9 million across the forward estimates period due to
the measures outlined in Table 1.2.
In relation to expenses, the new funding is predominately directed towards suppliers’
expenditure with a modest increase in ASL and employee benefits expenditure.
Overall total expenses continue to exceed total revenues in each period and the
department has approval to budget for an operating loss in 2017-18 and the forward
estimates period. Expenses not requiring appropriation are a significant component of
the loss and result from maintaining a make-good provision for the Antarctic. The

Department of the Environment and Energy Budget Statements
78
expenditure of prior year appropriation provided by the Department of Foreign
Affairs and Trade also contribute to the loss in 2017-18 and 2018-19.
Budgeted Departmental Balance Sheet
The Department’s net assets position improves in 2017-18 to 2019-20 due to the
injection of equity funding by the Government for Antarctic operations to build a new
icebreaker and a new research station on Macquarie Island. The forward estimates also
include funding to purchase additional plant and equipment for the Antarctic.
Administered
Schedule of Budgeted Income and Expenses Administered on Behalf of Government
Budgeted administered expenses for 2017-18 total $718.4 million and the Department
will pay grants of $291.4 million and $260.0 million of payments to corporate entities in
2017-18. The corporate entity payments are to the Australian Renewable Energy
Agency and primarily sourced from the Special Appropriation received by the
Department for this purpose.
Administered income from gains in 2017-18 of $498.3 million and $1.1 billion over the
forward estimates period is due to water entitlements transferred from the Department
of Agriculture and Water Resources. The water entitlements are a non-cash adjustment
and the transfer is required to the Commonwealth Environmental Water Holder in the
Department.
Schedule of Budgeted Assets and Liabilities Administered on Behalf of Government
The budgeted administered net assets position increases from $6.7 billion in 2016-17 to
$10.7 billion in 2020-21. The increase is driven by the drawdown of CEFC Special
Account funds, which are invested in CEFC for the purpose of making new loans and
equity investments in the renewable energy sector. The recognition of water
entitlements transferred from the Department of Agriculture and Water Resources is
also a significant factor.

Department of the Environment and Energy Budget Statements
79
3.2 BUDGETED FINANCIAL STATEMENTS TABLES
Table 3.1: Comprehensive income statement (showing net cost of services) for the period ended 30 June
2016-17 Estimated
actual $'000
2017-18 Budget
$'000
2018-19 Forward estimate
$'000
2019-20 Forward estimate
$'000
2020-21 Forward estimate
$'000
EXPENSES
Employee benefits 215,857 227,986 227,230 230,180 242,684
Suppliers 205,780 206,289 167,487 176,668 174,660
Grants 4,148 1,100 1,100 1,050 1,050
Payments to the Director of National
Parks 42,829 46,548 47,397 45,802 44,129
Depreciation and amortisation 47,248 49,205 50,440 45,750 72,488
Finance costs 17,100 17,100 17,100 17,100 17,100
Other expenses 1,061 1,856 400 400 400
Total expenses 534,023 550,084 511,154 516,950 552,511
LESS:
OWN-SOURCE INCOME
Own-source revenue
Sale of goods and rendering of services 38,327 34,348 24,242 24,242 24,242
Other revenue 4,757 723 723 723 723
Total own-source revenue 43,084 35,071 24,965 24,965 24,965
Total own-source income 43,084 35,071 24,965 24,965 24,965
Net (cost of)/contribution by
services (490,939) (515,013) (486,189) (491,985) (527,546)
Revenue from Government 410,359 441,944 416,968 429,100 437,923
Surplus/(deficit) attributable to the
Australian Government (80,580) (73,069) (69,221) (62,885) (89,623)
Total comprehensive income/(loss) (80,580) (73,069) (69,221) (62,885) (89,623)
Total comprehensive income/(loss)
attributable to the Australian
Government (80,580) (73,069) (69,221) (62,885) (89,623)

Department of the Environment and Energy Budget Statements
80
Table 3.1: Comprehensive income statement (showing net cost of services) for the period ended 30 June (continued)
Note: Impact of net cash appropriation arrangements
2016-17 2017-18 2018-19 2019-20 2020-21
$'000 $'000 $'000 $'000 $'000
Total comprehensive income/(loss)
excluding depreciation/
amortisation expenses previously
funded through revenue
appropriations (33,332) (23,864) (18,781) (17,135) (17,135)
less depreciation/amortisation expenses
previously funded through revenue
appropriations (a) 47,248 49,205 50,440 45,750 72,488
Total comprehensive income/(loss)
- as per the statement of
comprehensive income (80,580) (73,069) (69,221) (62,885) (89,623)
Prepared on Australian Accounting Standards basis. (a) From 2010-11, the Government introduced net cash appropriation arrangements where Appropriation
Bill (No. 1) revenue for the depreciation/amortisation expenses of non-corporate Commonwealth entities (and select corporate Commonwealth entities) were replaced with a separate capital budget (the Departmental Capital Budget, or DCB) provided through Appropriation Bill (No. 1) equity appropriations. For information regarding Departmental Capital Budgets, please refer to Table 3.5 Departmental Capital Budget Statement.

Department of the Environment and Energy Budget Statements
81
Table 3.2: Budgeted departmental balance sheet (as at 30 June)
2016-17 Estimated
actual $'000
2017-18 Budget
$'000
2018-19 Forward estimate
$'000
2019-20 Forward estimate
$'000
2020-21 Forward estimate
$'000
ASSETS
Financial assets
Cash and cash equivalents 1,259 1,259 1,259 1,259 1,259
Trade and other receivables 136,589 70,808 69,127 69,092 69,057
Total financial assets 137,848 72,067 70,386 70,351 70,316
Non-financial assets
Buildings 244,578 234,237 230,323 226,839 222,083
Property, plant and equipment 260,535 448,078 512,174 607,463 575,955
Intangibles 16,769 20,627 20,721 21,991 23,638
Inventories 8,777 8,777 8,777 8,777 8,777
Prepayments 4,687 4,687 4,687 4,687 4,687
Total non-financial assets 535,346 716,406 776,682 869,757 835,140
Total assets 673,194 788,473 847,068 940,108 905,456
LIABILITIES
Payables
Suppliers 14,239 14,239 14,239 14,239 14,239
Grants 1,108 1,108 1,108 1,108 1,108
Other payables 5,659 5,659 5,659 5,659 5,659
Total payables 21,006 21,006 21,006 21,006 21,006
Provisions
Employee provisions 70,214 70,214 70,214 70,214 70,214
Antarctic make good provisions (a) 570,415 587,515 604,615 621,715 638,815
Other provisions 8,438 8,438 8,438 8,438 8,438
Total provisions 649,067 666,167 683,267 700,367 717,467
Total liabilities 670,073 687,173 704,273 721,373 738,473
Net assets 3,121 101,300 142,795 218,735 166,983
EQUITY (b)
Parent entity interest
Contributed equity 440,201 611,449 722,165 860,990 898,861
Reserves 288,488 288,488 288,488 288,488 288,488
Accumulated deficit (725,568) (798,637) (867,858) (930,743) (1,020,366)
Total parent entity interest 3,121 101,300 142,795 218,735 166,983
Total equity 3,121 101,300 142,795 218,735 166,983
Prepared on Australian Accounting Standards basis.
(a) The Department has a "make good" obligation for: the removal and site restoration of buildings and infrastructure located in Antarctica and on sub-Antarctic Macquarie Island; and remediation of past waste disposal sites and areas of ground contamination in Antarctica for which Australia is responsible. These make good provisions are calculated using a net present value methodology. This requires that each year the provision increases by the value of unwinding a discount on the future value of the provisions. This increase results in liabilities that are not covered by assets for the Department. Funding will not be provided to the Department until such time as payments are required to be made, which is beyond the forward estimates.
(b) Equity is the residual interest in assets after the deduction of liabilities.

Department of the Environment and Energy Budget Statements
82
Table 3.3: Departmental statement of changes in equity — summary of movement (Budget year 2017-18)
Retained earnings
$'000
Asset revaluation
reserve $'000
Contributed equity/ capital $'000
Total equity
$'000
Opening balance as at 1 July 2017 Balance carried forward from previous period (725,568) 288,488 440,201 3,121
Adjusted opening balance (725,568) 288,488 440,201 3,121
Comprehensive income Deficit for the period (73,069) - - (73,069)
Total comprehensive income (73,069) - - (73,069)
of which: Attributable to the Australian Government (73,069) - - (73,069)
Transactions with owners Contributions by owners Equity Injection - Appropriations - - 146,656 146,656
Departmental Capital Budget - - 24,592 24,592
Sub-total transactions with owners - - 171,248 171,248
Estimated closing balance as at 30 June 2018 (798,637) 288,488 611,449 101,300
Closing balance attributable to the Australian Government (798,637) 288,488 611,449 101,300
Prepared on Australian Accounting Standards basis.

Department of the Environment and Energy Budget Statements
83
Table 3.4: Budgeted departmental statement of cash flows (for the period ended 30 June)
2016-17 Estimated
actual $’000
2017-18 Budget
$’000
2018-19 Forward estimate
$’000
2019-20 Forward estimate
$’000
2020-21 Forward estimate
$’000
OPERATING ACTIVITIES
Cash received
Appropriations 384,215 542,073 442,891 453,377 462,200
Sale of goods and rendering of
services 38,327 34,348 24,242 24,242 24,242
Other 18,649 - - - -
Total cash received 441,191 576,421 467,133 477,619 486,442
Cash used
Employees 207,707 227,986 227,230 230,180 242,684
Suppliers 205,009 205,566 166,764 175,945 173,937
Grants 4,148 1,100 1,100 1,050 1,050
Payments to Director of National Parks 42,829 46,548 47,397 45,802 44,129
s74 Receipts transferred to OPA 38,327 34,348 24,242 24,242 24,242
Other 1,061 1,856 400 400 400
Total cash used 499,081 517,404 467,133 477,619 486,442
Net cash used by operating activities (57,890) 59,017 - - -
INVESTING ACTIVITIES
Cash used
Purchase of property, plant and
equipment and intangibles 113,918 230,265 110,716 138,825 37,871
Total cash used 113,918 230,265 110,716 138,825 37,871
Net cash used by investing activities (113,918) (230,265) (110,716) (138,825) (37,871)
FINANCING ACTIVITIES
Cash received
Contributed equity 144,782 146,656 86,249 114,263 13,160
Departmental capital budget 27,026 24,592 24,467 24,562 24,711
Total cash received 171,808 171,248 110,716 138,825 37,871
Net cash from financing activities 171,808 171,248 110,716 138,825 37,871
Net increase (decrease)
in cash held - - - - -
Cash and cash equivalents at the
beginning of the reporting period 1,259 1,259 1,259 1,259 1,259
Cash and cash equivalents at the
end of the reporting period 1,259 1,259 1,259 1,259 1,259
Prepared on Australian Accounting Standards basis.

Department of the Environment and Energy Budget Statements
84
Table 3.5: Departmental capital budget statement (for the period ended 30 June)
2016-17 Estimated
actual $’000
2017-18 Budget
$’000
2018-19 Forward estimate
$’000
2019-20 Forward estimate
$’000
2020-21 Forward estimate
$’000
NEW CAPITAL APPROPRIATIONS
Capital budget – Bill 1 (DCB) 24,937 24,592 24,467 24,562 24,711
Equity injections – Bill 2 144,782 146,656 86,249 114,263 13,160
Total new capital appropriations 169,719 171,248 110,716 138,825 37,871
Provided for:
Purchase of non-financial assets 169,719 171,248 110,716 138,825 37,871
Total Items 169,719 171,248 110,716 138,825 37,871
PURCHASE OF NON-FINANCIAL
ASSETS
Funded by capital appropriation (a,b) 86,892 205,673 86,249 114,263 13,160
Funded by capital appropriation -
DCB (c) 27,026 24,592 24,467 24,562 24,711
TOTAL 113,918 230,265 110,716 138,825 37,871
RECONCILIATION OF CASH
USED TO ACQUIRE ASSETS
TO ASSET MOVEMENT TABLE
Total purchases 113,918 230,265 110,716 138,825 37,871
Total cash used to acquire assets 113,918 230,265 110,716 138,825 37,871
Prepared on Australian Accounting Standards basis. (a) Includes both current Appropriation Bill (No. 2) and prior Appropriations Act (No. 2/4/6)
appropriations.
(b) Assets funded by capital appropriation in 2016-17 and 2017-18 differ from the amounts included in the resource statement at Table 1.1 due to an approved Bill (No. 2) – Non Operating Movement of Funds for the acquisition of a new Antarctic Icebreaker.
(c) Includes purchases funded by current and previous years’ Departmental Capital Budgets.

Department of the Environment and Energy Budget Statements
85
Table 3.6: Statement of departmental asset movements (Budget year 2017-18)
Buildings
$’000
Other property, plant and
equipment $’000
Computer software
and intangibles
$’000
Total
$’000
As at 1 July 2017 Gross book value 320,338 313,675 79,393 713,406
Accumulated depreciation/amortisation and impairment (75,760) (53,140) (62,624) (191,524)
Opening net book balance 244,578 260,535 16,769 521,882
Capital asset additions Estimated expenditure on new or replacement assets By purchase – appropriation equity (a) 5,018 141,238 400 146,656
By purchase – non operating (b) - 59,017 - 59,017
By purchase – appropriation ordinary annual services (c) 8,393 4,996 11,203 24,592
Total additions 13,411 205,251 11,603 230,265
Other movements Depreciation/amortisation expense (23,752) (17,708) (7,745) (49,205)
Total other movements (23,752) (17,708) (7,745) (49,205)
As at 30 June 2018 Gross book value 333,749 518,926 90,996 943,671
Accumulated depreciation/amortisation and impairment (99,512) (70,848) (70,369) (240,729)
Closing net book balance 234,237 448,078 20,627 702,942
Prepared on Australian Accounting Standards basis.
(a) ‘Appropriation equity’ refers to equity injections appropriations provided through Appropriation Bill (No. 2) 2017-18.
(b) Includes an approved Bill 2 – Non Operating Movement of Funds for the acquisition of a new Antarctic Icebreaker.
(c) ‘Appropriation ordinary annual services’ refers to funding provided through Appropriation Bill (No.1) 2017-18 for depreciation/amortisation expenses, Departmental Capital Budgets or other operational expenses.

Department of the Environment and Energy Budget Statements
86
Table 3.7: Schedule of budgeted income and expenses administered on behalf of Government (for the period ended 30 June)
2016-17 Estimated
actual $’000
2017-18 Budget
$’000
2018-19 Forward estimate
$’000
2019-20 Forward estimate
$’000
2020-21 Forward estimate
$’000
EXPENSES
Suppliers 190,437 165,690 130,271 95,281 69,451
Grants 305,968 291,354 269,062 306,200 257,353
Depreciation and amortisation 12 12 12 12 12
Payments to corporate entities 299,414 259,998 237,759 257,572 137,041
Other expenses 1,402 1,308 1,308 - -
Total expenses administered on
behalf of Government 797,233 718,362 638,412 659,065 463,857
LESS:
OWN-SOURCE INCOME
Own-source revenue
Taxation revenue
Other taxes 171 171 171 171 171
Total taxation revenue 171 171 171 171 171
Non-taxation revenue
Fees and fines 19,223 20,304 22,951 23,227 23,255
Interest – state and territory
government loans 38 14 3 - -
Dividends 19,500 20,800 22,100 23,400 24,700
Other revenue 3,996 4,319 716 5,148 1,307
Total non-taxation revenue 42,757 45,437 45,770 51,775 49,262
Total own-source revenue
administered on behalf of
Government 42,928 45,608 45,941 51,946 49,433
Gains
Other gains 405,296 498,261 655,407 250,000 235,000
Total gains administered on behalf
of Government 405,296 498,261 655,407 250,000 235,000
Total own-sourced income administered
on behalf of Government 448,224 543,869 701,348 301,946 284,433
Net (cost of)/contribution by services (349,009) (174,493) 62,936 (357,119) (179,424)
Total comprehensive income/(loss) (349,009) (174,493) 62,936 (357,119) (179,424)
Prepared on Australian Accounting Standards basis.

Department of the Environment and Energy Budget Statements
87
Table 3.8: Schedule of budgeted assets and liabilities administered on behalf of Government (as at 30 June)
2016-17 Estimated
actual $'000
2017-18 Budget
$'000
2018-19 Forward estimate
$'000
2019-20 Forward estimate
$'000
2020-21 Forward estimate
$'000
ASSETS
Financial assets
Taxation receivables 78 78 78 78 78
Trade and other receivables 5,523 5,355 5,295 5,295 5,295
Other investments 3,350,782 3,901,158 4,431,339 5,051,694 5,701,694
Total financial assets 3,356,383 3,906,591 4,436,712 5,057,067 5,707,067
Non-financial assets
Heritage and cultural assets 1,025 1,013 1,001 989 977
Water assets 3,316,727 3,814,988 4,470,395 4,720,395 4,955,395
Computer software 5 5 5 5 5
Inventories 12,000 12,000 12,000 12,000 12,000
Prepayments 1,169 1,169 1,169 1,169 1,169
Total non-financial assets 3,330,926 3,829,175 4,484,570 4,734,558 4,969,546
Total assets administered on
behalf of Government 6,687,309 7,735,766 8,921,282 9,791,625 10,676,613
LIABILITIES
Payables
Suppliers 11,014 11,014 11,014 11,014 11,014
Grants 2,375 2,375 2,375 2,375 2,375
Total payables 13,389 13,389 13,389 13,389 13,389
Total liabilities administered on
behalf of Government 13,389 13,389 13,389 13,389 13,389
Net assets 6,673,920 7,722,377 8,907,893 9,778,236 10,663,224
Prepared on Australian Accounting Standards basis.

Department of the Environment and Energy Budget Statements
88
Table 3.9: Schedule of budgeted administered cash flows (for the period ended 30 June)
2016-17 Estimated
actual $'000
2017-18 Budget
$'000
2018-19 Forward estimate
$'000
2019-20 Forward estimate
$'000
2020-21 Forward estimate
$'000
OPERATING ACTIVITIES
Cash received
Interest 38 14 3 - -
Taxes 171 171 171 171 171
Dividends 19,500 20,800 22,100 23,400 24,700
Fees and fines 19,223 20,304 22,951 23,227 23,255
Other 3,996 4,319 716 5,148 1,307
Total cash received 42,928 45,608 45,941 51,946 49,433
Cash used
Suppliers 190,437 165,690 130,271 95,281 69,451
Grants 305,968 291,354 269,062 306,200 257,353
Payments to corporate entities 299,414 259,998 237,759 257,572 137,041
Other 1,402 1,308 1,308 - -
Total cash used 797,221 718,350 638,400 659,053 463,845
Net cash used by operating
activities (754,293) (672,742) (592,459) (607,107) (414,412)
INVESTING ACTIVITIES
Cash received
Repayments of advances and loans 340 168 60 - -
Total cash received 340 168 60 - -
Cash used
Corporate entity investments 1,000,619 550,376 530,181 620,355 650,000
Total cash used 1,000,619 550,376 530,181 620,355 650,000
Net cash from/(used by) investing
activities (1,000,279) (550,208) (530,121) (620,355) (650,000)
Net increase/(decrease) in cash held (1,754,572) (1,222,950) (1,122,580) (1,227,462) (1,064,412)
Cash and cash equivalents at
beginning of reporting period - - - - -
Cash from Official Public Account for:
- Appropriations 406,223 358,332 318,160 330,045 191,963
- Special Accounts 3,263,860 2,863,250 838,383 932,866 909,192
Total cash from Official Public
Account 3,670,083 3,221,582 1,156,543 1,262,911 1,101,155
Cash to Official Public Account for:
- Appropriations (26,798) (30,164) (33,963) (35,449) (36,743)
- Special Accounts (1,888,713) (1,968,468) - - -
Total cash to Official Public Account (1,915,511) (1,998,632) (33,963) (35,449) (36,743)
Cash and cash equivalents at end
of reporting period - - - - -
Prepared on Australian Accounting Standards basis.

Department of the Environment and Energy Budget Statements
89
Table 3.10: Statement of administered asset movements (Budget year 2017-18)
Heritage and
cultural assets
Water assets
Computer software
Total
$'000 $'000 $'000 $'000
As at 1 July 2017
Gross book value 1,060 3,442,853 2,870 3,446,783
Accumulated depreciation,
amortisation and impairment (35) (126,127) (2,865) (129,027)
Opening net book balance 1,025 3,316,726 5 3,317,756
CAPITAL ASSET ADDITIONS
Other movements
Assets received free of charge (a) - 498,261 - 498,261
Depreciation/amortisation expense (12) - - (12)
Total other movements (12) 498,261 - 498,249
As at 30 June 2018
Gross book value 1,060 3,941,114 2,870 3,945,044
Accumulated depreciation,
amortisation and impairment (47) (126,127) (2,865) (129,039)
Closing net book balance 1,013 3,814,987 5 3,816,005
Prepared on Australian Accounting Standards basis. (a) Water assets received from the Department of Agriculture and Water Resources.


91
AUSTRALIAN RENEWABLE ENERGY
AGENCY
ENTITY RESOURCES AND PLANNED
PERFORMANCE


93
AUSTRALIAN RENEWABLE ENERGY AGENCY
SECTION 1: ENTITY OVERVIEW AND RESOURCES ............................................... 95
1.1 Strategic direction statement .......................................................................... 95
1.2 Entity resource statement ............................................................................... 96
1.3 Budget measures ............................................................................................ 98
SECTION 2: OUTCOMES AND PLANNED PERFORMANCE ................................... 99
2.1 Budgeted expenses and performance for Outcome 1 .................................. 100
SECTION 3: BUDGETED FINANCIAL STATEMENTS ............................................. 104
3.1 Budgeted financial statements...................................................................... 104
3.2 Budgeted financial statements tables ........................................................... 105

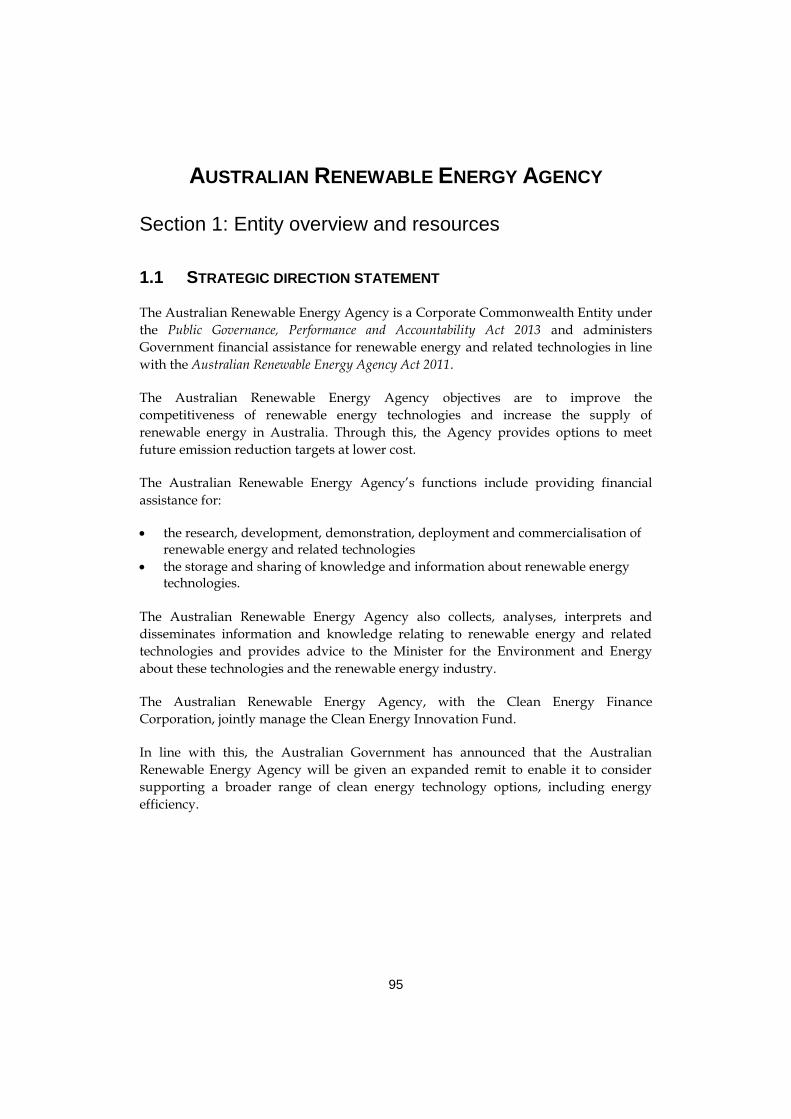
95
AUSTRALIAN RENEWABLE ENERGY AGENCY
Section 1: Entity overview and resources
1.1 STRATEGIC DIRECTION STATEMENT
The Australian Renewable Energy Agency is a Corporate Commonwealth Entity under
the Public Governance, Performance and Accountability Act 2013 and administers
Government financial assistance for renewable energy and related technologies in line
with the Australian Renewable Energy Agency Act 2011.
The Australian Renewable Energy Agency objectives are to improve the
competitiveness of renewable energy technologies and increase the supply of
renewable energy in Australia. Through this, the Agency provides options to meet
future emission reduction targets at lower cost.
The Australian Renewable Energy Agency’s functions include providing financial
assistance for:
the research, development, demonstration, deployment and commercialisation of renewable energy and related technologies
the storage and sharing of knowledge and information about renewable energy technologies.
The Australian Renewable Energy Agency also collects, analyses, interprets and
disseminates information and knowledge relating to renewable energy and related
technologies and provides advice to the Minister for the Environment and Energy
about these technologies and the renewable energy industry.
The Australian Renewable Energy Agency, with the Clean Energy Finance
Corporation, jointly manage the Clean Energy Innovation Fund.
In line with this, the Australian Government has announced that the Australian
Renewable Energy Agency will be given an expanded remit to enable it to consider
supporting a broader range of clean energy technology options, including energy
efficiency.

Australian Renewable Energy Agency Budget Statements
96
1.2 ENTITY RESOURCE STATEMENT
Table 1.1 shows the total funding from all sources available to the entity for its
operations and to deliver programs and services on behalf of the government.
The table summarises how resources will be applied by outcome (government strategic
policy objectives) and by administered (on behalf of the government or the public) and
departmental (for the entity’s operations) classification.
For more detailed information on special appropriations, please refer to Budget Paper
No. 4 – Agency Resourcing.
Information in this table is presented on a resourcing (i.e. appropriations/cash
available) basis, while the ‘Budgeted expenses by Outcome’ tables in Section 2 and the
financial statements in Section 3 are presented on an accrual basis.

Australian Renewable Energy Agency Budget Statements
97
Table 1.1: Australian Renewable Energy Agency resource statement — Budget estimates for 2017-18 as at Budget May 2017
2016-17 estimated
actual $'000
2017-18 estimate
$'000
Opening balance/cash reserves at 1 July 41,660 56,692
Funds from Government
Annual appropriations - ordinary annual services (a)
Outcome 1 1,221 2,073
Total annual appropriations 1,221 2,073
Amounts received from related entities
Amounts from Portfolio Department (b) 298,193 257,925
Total amounts received from related entities 298,193 257,925
Total funds from Government 299,414 259,998
Funds from other sources
Interest 1,144 1,000
Other 12,700 -
Total funds from other sources 13,844 1,000
Total net resourcing for Australian Renewable Energy Agency 354,918 317,690
2016-17 2017-18
Average staffing level (number) (c) 2 2
Available appropriations according to the ARENA Act 299,414 259,998
Less: estimated actual expenses (299,414) (259,998)
Available appropriations carried forward (d) - -
Prepared on a resourcing (i.e. appropriations available) basis.
Please note: All figures shown above are GST exclusive - these may not match figures in the cash flow statement.
(a) Appropriation Bill (No. 1) 2017-18.
(b) Funding provided by the Portfolio Department that is not specified within the Annual Appropriation Bills as a payment to that corporate entity (for example, a grant awarded to a corporate entity from one of its Portfolio Department's administered programs).
(c) The Agency only has two employees, the CEO and CFO. Under section 62 of the Australian Renewable Energy Agency Act 2011 all other staff necessary to assist the Agency must be persons employed under the Public Services Act 1999 who are employed by the Department and made available to the Agency by the Secretary of the Department.
(d) Funding provided by the Portfolio Department reflects the Agency’s Special Appropriation under section 64 of the Australian Renewable Energy Agency Act 2011.

Australian Renewable Energy Agency Budget Statements
98
1.3 BUDGET MEASURES
Budget measures in Part 1 relating to the Australian Renewable Energy Agency are
detailed in Budget Paper No. 2 and are summarised below.
Table 1.2: Australian Renewable Energy Agency 2017-18 Budget measures
Part 1: Measures announced since the 2016-17 Mid-Year Economic and Fiscal Outlook (MYEFO)
There are no 2017-18 Budget measures relating to the Australian Renewable Energy
Agency.
Part 2: Other measures not previously reported in a portfolio statement
Program 2016-17
$'000 2017-18
$'000 2018-19
$'000 2019-20
$'000 2020-21
$'000
Measures
Budget Savings (Omnibus) Bill – amendments (a) 1.1
Departmental expenses
- 150,000 168,000 235,000 122,000
Total
- 150,000 168,000 235,000 122,000
Total measures
Departmental
- 150,000 168,000 235,000 122,000
Total - 150,000 168,000 235,000 122,000
Prepared on a Government Finance Statistics (fiscal) basis.
(a) The lead entity for measure Budget Savings (Omnibus) Bill – amendments is the Department of Social Services.

Australian Renewable Energy Agency Budget Statements
99
Section 2: Outcomes and planned performance
Government outcomes are the intended results, impacts or consequences of actions by
the Government on the Australian community. Commonwealth programs are the
primary vehicle by which government entities achieve the intended results of their
outcome statements. Entities are required to identify the programs which contribute to
government outcomes over the Budget and forward years.
Each outcome is described below together with its related programs. The following
provides detailed information on expenses for each outcome and program, further
broken down by funding source.
Note:
Performance reporting requirements in the Portfolio Budget Statements are part of the
enhanced Commonwealth performance framework established by the Public
Governance, Performance and Accountability Act 2013. It is anticipated that the
performance criteria described in Portfolio Budget Statements will be read with
broader information provided in an entity’s corporate plans and annual performance
statements – included in Annual Reports - to provide an entity’s complete performance
story.
The most recent corporate plan and annual performance statement for the Australian
Renewable Energy Agency can be found at https://arena.gov.au/about-
arena/corporate-publications/

Australian Renewable Energy Agency Budget Statements
100
2.1 BUDGETED EXPENSES AND PERFORMANCE FOR OUTCOME 1
Outcome 1: Support improvements in the competitiveness of renewable energy and related technologies and the supply of renewable energy by administering financial assistance, developing analysis and advice about, and sharing information and knowledge with regard to, renewable energy and related technologies.
Linked programs
Clean Energy Finance Corporation
Program 1.1 – Clean Energy Finance Corporation
Contribution to Outcome 1 made by linked programs
The Clean Energy Innovation Fund is jointly managed by the Agency and the Clean
Energy Finance Corporation, drawing on their complementary experience and
expertise. The Clean Energy Innovation Fund has up to $200 million available for
debt and equity investments in emerging clean energy projects and businesses, that
should allow projects at the later end of the innovation chain to deliver a financial
return to taxpayers, in addition to the public good return of improving
competitiveness of renewable energy and related technologies.
Department of the Environment and Energy
Program 2.1 – Reducing Australia’s Greenhouse Gas Emissions
Program 2.3 – Renewable Energy Technology Development
Contribution to Outcome 1 made by linked programs
The Australian Renewable Energy Agency contributes to implementing policies for
the research, development, demonstration, deployment and commercialisation of
clean energy technologies. These policies are developed by the Department of the
Environment and Energy.

Australian Renewable Energy Agency Budget Statements
101
Budgeted expenses for Outcome 1
This table shows how much the entity intends to spend (on an accrual basis) on
achieving the outcome, broken down by program, as well as by Administered and
Departmental funding sources.
Table 2.1.1: Budgeted expenses for Outcome 1
Outcome 1: Support improvements in the competitiveness of renewable energy and related technologies and the supply of renewable energy by administering financial assistance, developing analysis and advice about, and sharing information and knowledge with regard to, renewable energy and related technologies.
2016-17 Estimated
actual $'000
2017-18 Budget
$'000
2018-19 Forward estimate
$'000
2019-20 Forward estimate
$'000
2020-21 Forward estimate
$'000
Program 1.1: Australian Renewable Energy Agency
Revenue from Government
Ordinary annual services (Appropriation Bill No. 1) 1,221 2,073 2,463 2,868 3,006
Payment from related entities 281,267 257,407 227,677 248,579 130,640
Expenses not requiring appropriation in the budget year 7,354 41,215 6,894 4,826 4,846
Revenues from other independent sources 3,844 1,000 200 200 200
Total expenses for Program 1.1 293,686 301,695 237,234 256,473 138,692
Outcome 1 totals by resource type
Revenue from Government
Ordinary annual services (Appropriation Bill No. 1) 1,221 2,073 2,463 2,868 3,006
Payment from related entities 281,267 257,407 227,677 248,579 130,640
Expenses not requiring appropriation in the budget year 7,354 41,215 6,894 4,826 4,846
Revenues from other independent sources 3,844 1,000 200 200 200
Total expenses for Outcome 1 293,686 301,695 237,234 256,473 138,692
2016-17 2017-18
Average staffing level (number) (a) 2 2
(a) The Department provides staff resources to the Agency free of charge under section 62 of the Australian Renewable Energy Agency Act 2011. This table does not include these staff resources. Budgeted expenses for staff made available to the Agency by the Secretary of the Department are included in Program 2.3 of the Department.

Australian Renewable Energy Agency Budget Statements
102
Table 2.1.2: Performance criteria for Outcome 1
Table 2.1.2 details the performance criteria for each program associated with
Outcome 1. It summarises how each program is delivered and where 2017-18 Budget
measures have created new programs or materially changed existing programs.
Outcome 1 – Support improvements in the competitiveness of renewable energy and related technologies and the supply of renewable energy by administering financial assistance, developing analysis and advice about, and sharing information and knowledge with regard to, renewable energy and related technologies.
Program 1.1 – Australian Renewable Energy Agency – to provide funding for research, development and pre-commercial deployment projects that have the potential to lead to the commercialisation of new renewable energy products or services; and to build and support networks, and share the knowledge, insights and data from our funded projects to help participants in Australia’s energy market learn from each other’s experiences.
Delivery To deliver this outcome, the Agency:
Provides financial assistance for the research, development, demonstration, deployment and commercialisation of renewable energy and related technologies
Provides financial assistance for, and undertakes, the collection, storage, analysis and sharing of knowledge and information about renewable energy and related technologies
Provides advice to the Minister for the Environment and Energy about renewable energy and related technologies and the renewable energy industry
Jointly administers the Clean Energy Innovation Fund with the Clean Energy Finance Corporation
The Agency’s financial assistance goes primarily to activities that are expected to advance renewable energy technologies towards commercial readiness, improve business models, or reduce overall industry costs. Organisations developing, testing or deploying innovative renewable energy solutions are the immediate beneficiaries of much of the Agency’s activity. In the long term it is Australian energy users who will benefit from the availability of more competitive renewable energy.
Performance information
Year Performance criteria Targets
2016-17 Strategic Investment: Provide financial assistance to new projects in accordance with the principles and priorities outlined in the Agency’s General Funding Strategy and Investment Plan.
Target: Provide financial assistance to one or more new projects in each of the Agency’s priority areas, including, for 2016-17, conclusion and contracting of large-scale solar projects in accordance with ARENA’s $100 million competitive round.
- for 2016-17 and future years,
other research, development
and demonstration projects in
accordance with the Agency’s
Investment plan.
Forecast: On track

Australian Renewable Energy Agency Budget Statements
103
Program 1.1 – Australian Renewable Energy Agency – to provide funding for research, development and pre-commercial deployment projects that have the potential to lead to the commercialisation of new renewable energy products or services; and to build and support networks, and share the knowledge, insights and data from our funded projects to help participants in Australia’s energy market learn from each other’s experiences.
Year Performance criteria Targets
Strategic Investment: Jointly manage the Clean Energy Innovation Fund
Target: Clean Energy Innovation Fund jointly managed in accordance with arrangements established between the Agency and the Clean Energy Finance Corporation.
Forecast: Achieved
Strong Project Assessment, Negotiation Delivery and Knowledge Sharing: Effectively manage projects in accordance with agreement terms to deliver intended outcomes, learn and improve.
Target: Significant project outcomes and lessons learned disseminated.
Forecast: On Track
2017-18 Strategic Investment: Provide financial assistance to new projects in accordance with the principles and priorities outlined in the Agency’s General Funding Strategy and Investment Plan. 10
Provide financial assistance to one or more new projects in each of the Agency’s priority areas.
Strong Project Assessment, Negotiation Delivery and Knowledge Sharing: Effectively manage projects in accordance with agreement terms to deliver intended outcomes, learn and improve.
Significant project outcomes and lessons learned disseminated.
2018-19 and future years
As for 2017-18 As for 2017-18
Purpose To accelerate Australia’s shift to an affordable and reliable renewable energy future.11
10 The Agency’s General Funding Strategy is produced annually, to cover the following three years, and is provided to the Minister for the Environment and Energy for approval by the end of June each year. The Agency’s Investment Plan is prepared in accordance with the General Funding Strategy, and is updated from time to time. The current documents are available at www.arena.gov.au
11 Refers to updated purpose that will be reflected in the 2017-18 Corporate Plan.

Australian Renewable Energy Agency Budget Statements
104
Section 3: Budgeted financial statements
Section 3 presents budgeted financial statements which provide a comprehensive
snapshot of entity finances for the 2017-18 budget year, including the impact of budget
measures and resourcing on financial statements.
3.1 BUDGETED FINANCIAL STATEMENTS
3.1.1 Differences between entity resourcing and financial statements
The Australian Renewable Energy Agency’s resourcing statement Table 1.1 is directly
comparable to the budgeted financial statements.
3.1.2 Explanatory notes and analysis of budgeted financial statements
Since the publication of the 2016-17 Portfolio Budget Statements, the Parliament passed
the Budget Savings (Omnibus) Bill 2016, which saw $800 million of funding under the
Australian Renewable Energy Agency Act 2011 restored to the Australian Renewable
Energy Agency over five financial years between 2017-18 and 2021-22.
The budgeted financial statements for 2017-18 and forward years reflect the restored
level of the Australian Renewable Energy Agency’s legislated funding. In order to
have all available funds utilised in the next five years, the Australian Renewable
Energy Agency will need to commit the funds to projects in the next three years.
Accordingly, the Agency has budgeted for increased level of activity between 2017-18
and 2019-20, as reflected in increased operating expenses.
The Australian Renewable Energy Agency is budgeting for a deficit in 2017-18 due to
an expected outlay of $41 million in grant expenditure which will not require any
drawdown from its appropriation funding. This amount was returned to the Agency
from a grant project in 2015-16 and the funds were retained and invested by the
Agency for project funding in 2017-18.
All forward years are expected to provide a small surplus. The surplus primarily
represents the investment calls on the Australian Renewable Energy Agency made by
the Renewable Energy Venture Capital Fund. The Agency does not have a capital
appropriation, therefore runs at a surplus when calls are required.
Resources received free of charge represents the cost associated with the resources
made available to the Australian Renewable Energy Agency by the Secretary of the
Department under s62 of the Australian Renewable Energy Agency Act 2011.
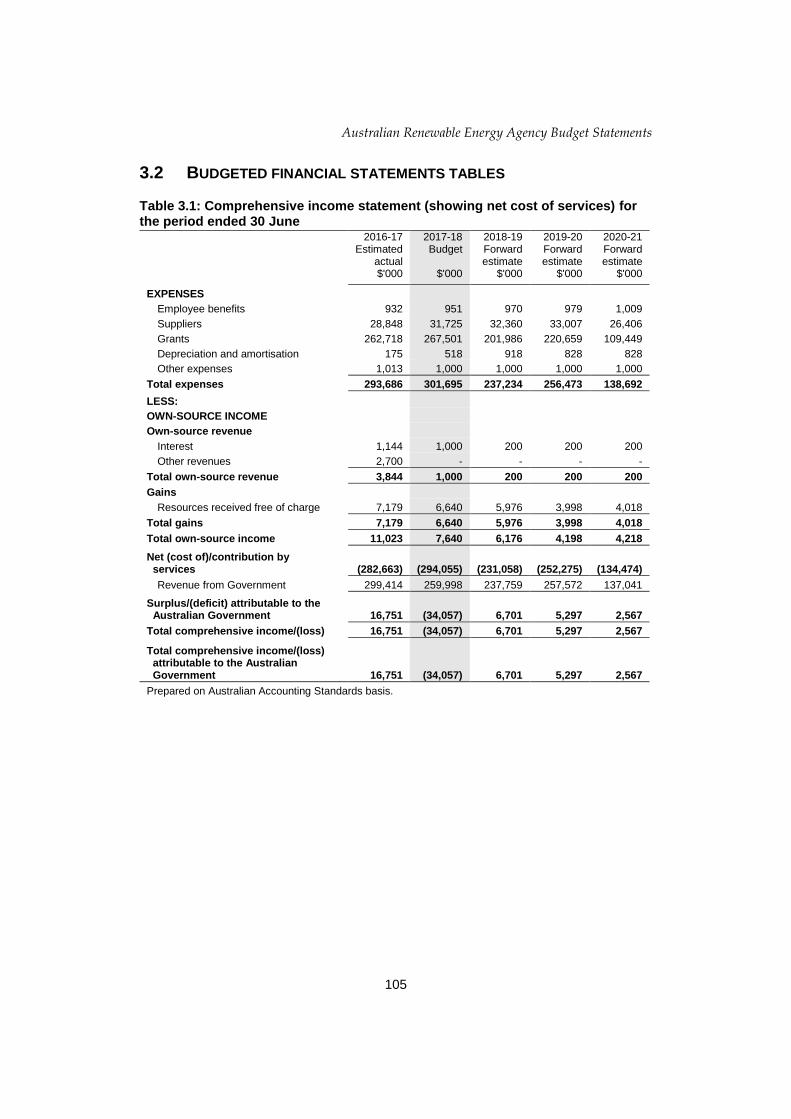
Australian Renewable Energy Agency Budget Statements
105
3.2 BUDGETED FINANCIAL STATEMENTS TABLES
Table 3.1: Comprehensive income statement (showing net cost of services) for the period ended 30 June
2016-17 Estimated
actual $'000
2017-18 Budget
$'000
2018-19 Forward estimate
$'000
2019-20 Forward estimate
$'000
2020-21 Forward estimate
$'000
EXPENSES
Employee benefits 932 951 970 979 1,009
Suppliers 28,848 31,725 32,360 33,007 26,406
Grants 262,718 267,501 201,986 220,659 109,449
Depreciation and amortisation 175 518 918 828 828
Other expenses 1,013 1,000 1,000 1,000 1,000
Total expenses 293,686 301,695 237,234 256,473 138,692
LESS:
OWN-SOURCE INCOME
Own-source revenue
Interest 1,144 1,000 200 200 200
Other revenues 2,700 - - - -
Total own-source revenue 3,844 1,000 200 200 200
Gains
Resources received free of charge 7,179 6,640 5,976 3,998 4,018
Total gains 7,179 6,640 5,976 3,998 4,018
Total own-source income 11,023 7,640 6,176 4,198 4,218
Net (cost of)/contribution by services (282,663) (294,055) (231,058) (252,275) (134,474)
Revenue from Government 299,414 259,998 237,759 257,572 137,041
Surplus/(deficit) attributable to the Australian Government 16,751 (34,057) 6,701 5,297 2,567
Total comprehensive income/(loss) 16,751 (34,057) 6,701 5,297 2,567
Total comprehensive income/(loss) attributable to the Australian Government 16,751 (34,057) 6,701 5,297 2,567
Prepared on Australian Accounting Standards basis.

Australian Renewable Energy Agency Budget Statements
106
Table 3.2: Budgeted departmental balance sheet (as at 30 June)
2016-17 Estimated
actual $'000
2017-18 Budget
$'000
2018-19 Forward estimate
$'000
2019-20 Forward estimate
$'000
2020-21 Forward estimate
$'000
ASSETS
Financial assets
Cash and cash equivalents 56,692 13,976 16,094 18,122 20,150
Trade and other receivables 1,676 1,676 1,676 1,676 1,676
Other investments 30,553 37,496 42,369 45,966 47,333
Total financial assets 88,921 53,148 60,139 65,764 69,159
Non-financial assets
Property, plant and equipment 1,180 890 600 400 200
Intangibles 451 2,457 2,457 2,329 1,701
Other non-financial assets 174 174 174 174 174
Total non-financial assets 1,805 3,521 3,231 2,903 2,075
Total assets 90,726 56,669 63,370 68,667 71,234
LIABILITIES
Payables
Suppliers 2,208 2,208 2,208 2,208 2,208
Grants 2,979 2,979 2,979 2,979 2,979
Total payables 5,187 5,187 5,187 5,187 5,187
Provisions
Employee provisions 160 160 160 160 160
Total provisions 160 160 160 160 160
Total liabilities 5,347 5,347 5,347 5,347 5,347
Net assets 85,379 51,322 58,023 63,320 65,887
EQUITY*
Parent entity interest
Retained surplus (accumulated deficit) 85,379 51,322 58,023 63,320 65,887
Total parent entity interest 85,379 51,322 58,023 63,320 65,887
Total equity 85,379 51,322 58,023 63,320 65,887
Prepared on Australian Accounting Standards basis. *Equity is the residual interest in assets after the deduction of liabilities.

Australian Renewable Energy Agency Budget Statements
107
Table 3.3: Departmental statement of changes in equity — summary of movement (Budget year 2017-18)
Retained earnings
$'000
Total equity
$'000
Opening balance as at 1 July 2017
Balance carried forward from previous period 85,379 85,379
Adjusted opening balance 85,379 85,379
Comprehensive income Surplus/(deficit) for the period (34,057) (34,057)
Total comprehensive income (34,057) (34,057)
of which: Attributable to the Australian Government 51,322 51,322
Estimated closing balance as at 30 June 2018 51,322 51,322
Closing balance attributable to the Australian Government 51,322 51,322
Prepared on Australian Accounting Standards basis.

Australian Renewable Energy Agency Budget Statements
108
Table 3.4: Budgeted departmental statement of cash flows (for the period ended 30 June)
2016-17 Estimated
actual $'000
2017-18 Budget
$'000
2018-19 Forward estimate
$'000
2019-20 Forward estimate
$'000
2020-21 Forward estimate
$'000
OPERATING ACTIVITIES
Cash received
Receipts from Government 299,414 259,998 237,759 257,572 137,041
Return of grants 12,700 - - - -
Interest 1,144 1,000 200 200 200
Total cash received 313,258 260,998 237,959 257,772 137,241
Cash used
Employees 932 951 970 979 1,009
Suppliers 21,669 25,085 26,384 29,009 22,388
Grants 262,718 267,501 201,986 220,659 109,449
Total cash used 285,319 293,537 229,340 250,647 132,846
Net cash from/(used by) operating activities 27,939 (32,539) 8,619 7,125 4,395
INVESTING ACTIVITIES
Cash used
Purchase of property, plant and
equipment and intangibles 1,270 2,234 628 500 -
Investments 11,637 7,943 5,873 4,597 2,367
Total cash used 12,907 10,177 6,501 5,097 2,367
Net cash from/(used by) investing activities (12,907) (10,177) (6,501) (5,097) (2,367)
Net increase/(decrease) in cash held 15,032 (42,716) 2,118 2,028 2,028
Cash and cash equivalents at the beginning of the reporting period 41,660 56,692 13,976 16,094 18,122
Cash and cash equivalents at the end of the reporting period 56,692 13,976 16,094 18,122 20,150
Prepared on Australian Accounting Standards basis.

Australian Renewable Energy Agency Budget Statements
109
Table 3.5: Departmental capital budget statement (for the period ended 30 June)
2016-17 Estimated
actual $'000
2017-18 Budget
$'000
2018-19 Forward estimate
$'000
2019-20 Forward estimate
$'000
2020-21 Forward estimate
$'000
PURCHASE OF NON-FINANCIAL ASSETS
Funded internally from
departmental resources (a) 1,270 2,234 628 500 -
TOTAL 1,270 2,234 628 500 -
RECONCILIATION OF CASH USED TO ACQUIRE ASSETS TO ASSET MOVEMENT TABLE
Total purchases 1,270 2,234 628 500 -
Total cash used to acquire assets 1,270 2,234 628 500 -
Prepared on Australian Accounting Standards basis.
(a) Includes the following sources of funding:
funding provided by the Portfolio Department reflecting the Agency’s Special Appropriation under section 64 of the Australian Renewable Energy Agency Act 2011, including rollover of unspent funds; and
internally developed assets.

Australian Renewable Energy Agency Budget Statements
110
Table 3.6: Statement of departmental asset movements (Budget year 2017-18)
Other property, plant and
equipment $'000
Computer software and
intangibles $'000
Total
$'000
As at 1 July 2017 Gross book value 1,270 854 2,124
Accumulated depreciation/ amortisation and impairment (90) (403) (493)
Opening net book balance 1,180 451 1,631 Capital asset additions
Estimated expenditure on new or replacement assets
By purchase - other - 2,234 2,234 Total additions - 2,234 2,234 Other movements Depreciation/amortisation expense (290) (228) (518) Total other movements (290) (228) (518) As at 30 June 2018
Gross book value 1,270 3,088 4,358 Accumulated depreciation/
amortisation and impairment (380) (631) (1,011) Closing net book balance 890 2,457 3,347
Prepared on Australian Accounting Standards basis.

111
BUREAU OF METEOROLOGY
ENTITY RESOURCES AND PLANNED
PERFORMANCE


113
BUREAU OF METEOROLOGY
SECTION 1: ENTITY OVERVIEW AND RESOURCES ............................................. 115
1.1 Strategic direction statement ........................................................................ 115
1.2 Entity resource statement ............................................................................. 117
1.3 Budget measures .......................................................................................... 119
SECTION 2: OUTCOMES AND PLANNED PERFORMANCE ................................. 120
2.1 Budgeted expenses and performance for Outcome 1 .................................. 121
SECTION 3: BUDGETED FINANCIAL STATEMENTS ............................................. 125
3.1 Budgeted financial statements...................................................................... 125
3.2 Budgeted financial statements tables ........................................................... 126


115
BUREAU OF METEOROLOGY
Section 1: Entity overview and resources
1.1 STRATEGIC DIRECTION STATEMENT
The Bureau of Meteorology provides trusted, reliable and responsive weather, water,
climate and ocean services for Australia—all day, every day. The Bureau of
Meteorology’s work directly informs decisions by governments, industry and the
community and supports all Australians, the Australian Defence Force and key sectors
such as emergency management, aviation, transport, water management, agriculture
and environmental management.
To achieve this, across the domains of weather, water, climate and oceans, the Bureau
of Meteorology:
monitors and reports on current conditions
provides forecasts, warnings and long-term outlooks
analyses and explains trends
fosters greater public understanding and use of information, and
extends its understanding of, and ability to forecast, Australian conditions.
To drive competitive advantage for Australian businesses and industries, and
accumulate significant benefits for the wider community, the Bureau of Meteorology
will continue to pursue the outcome of informed safety, security and economic
decisions by governments, industry and the community through the provision of
information, forecasts, services and research relating to weather, climate and water.
To achieve this outcome in an intensely dynamic environment, the Bureau of
Meteorology has developed a new strategy that augments its strong science and
technology foundations with new skills and new ways of doing things to consistently
provide customers with an outstanding service experience. Taking effect at the start of
the 2017–18 financial year, the new Strategic Plan 2017–2022 will have four key areas of
focus:
Impact and Value - products and services that benefit the Australian community
and drive competitive advantage for businesses and industries.
Operational Excellence - outstanding people, science, systems, infrastructure and
partnerships working together for maximum simplicity, productivity and agility.

Bureau of Meteorology Budget Statements
116
Insight and Innovation - deep understanding and creative thinking that generates
novel solutions for our customers and our organisation.
The Bureau Way - one enterprise, that is safe and diverse, where our people grow
and are empowered to excel, and where our customers come first, trust us and
consider that we are a pleasure to work with.
During 2017–18, the Bureau of Meteorology will continue to implement the Water
Information Program, which received ongoing funding in the 2016–17 Mid-Year
Economic and Fiscal Outlook. Under this program, the Bureau will continue to provide
farmers, irrigators and rural water agencies with essential information and services
that are critical to the profitability and productivity of Australian agriculture and that
support our international competitiveness and community well-being.
Under the Stronger Farmers, Stronger Economy—new drought management
framework measure from 2015-16, the Bureau of Meteorology is continuing to improve
its seasonal climate forecast service for the Australian agricultural sector. Under this
initiative the Bureau is developing more regular, detailed and accurate climate
forecasts to support farmers in managing Australia’s highly-variable weather and
climate for increased competitive advantage.
Following the successful commissioning of the Bureau of Meteorology’s new
supercomputer in June 2016, the Bureau of Meteorology will continue to undertake a
program of improvements to enhance the frequency, accuracy and certainty of
forecasts in the coming years. Funded for seven years in the 2014–15 Budget, the
increased computing power will allow the Bureau to enhance its forecast services to
meet the growing needs of stakeholders into the future.
Under the measure Bureau of Meteorology — improved security and resilience, the
Bureau will improve the security and resilience of its Information Communications
Technology systems and business processes. This will assist the Bureau to continue to
provide reliable, ongoing access to weather, climate, water and oceans information.
The Bureau of Meteorology remains committed to increasing the efficient use of our
resources, investing in the skills and capabilities of our staff, and evaluating
opportunities to increase impact and revenue consistent with the Australian
Government Charging Framework.

Bureau of Meteorology Budget Statements
117
1.2 ENTITY RESOURCE STATEMENT
Table 1.1 shows the total funding from all sources available to the entity for its
operations and to deliver programs and services on behalf of the Government.
The table summarises how resources will be applied by outcome (government strategic
policy objectives) and by administered (on behalf of the Government or the public) and
departmental (for the entity’s operations) classification.
For more detailed information on special accounts and special appropriations, please
refer to Budget Paper No. 4 – Agency Resourcing.
Information in this table is presented on a resourcing (that is, appropriations/cash
available) basis, whilst the ‘Budgeted expenses by Outcome’ tables in Section 2 and the
financial statements in Section 3 are presented on an accrual basis.

Bureau of Meteorology Budget Statements
118
Table 1.1: Bureau of Meteorology resource statement — Budget estimates for 2017-18 as at Budget May 2017
2016-17 Estimated
actual $'000
2017-18 Estimate
$'000
Departmental
Annual appropriations - ordinary annual services (a)
Prior year appropriations available (b) 101,252 106,519
Departmental appropriation (c) 228,407 229,757
s 74 retained revenue receipts (d) 71,363 79,522
Departmental capital budget (e) 42,125 48,111
Annual appropriations - other services - non-operating (f)
Prior year appropriations available (b) 6,554 -
Equity injection 28,781 40,217
Total departmental annual appropriations 478,482 504,126
Total departmental resourcing 478,482 504,126
Total resourcing for the Bureau of Meteorology 478,482 504,126
2016-17 2017-18
Average staffing level (number) 1,602 1,565
Third party payments from and on behalf of other entities
2016-17 Estimated
actual $'000
2017-18 Estimate
$'000
Payments made to other entities for the provision of services (disclosed above) 28,636 28,929 Receipts received from other entities for the provision of services (disclosed above in s74 Retained revenue receipts section above) 6,461 7,344
Prepared on a resourcing (i.e. appropriations available) basis.
Please note: All figures shown above are GST exclusive - these may not match figures in the cash flow statement.
(a) Appropriation Bill (No. 1) 2017-18.
(b) Excludes $3.9 million subject to administrative quarantine by Finance or withheld under section 51 of the Public Governance, Performance and Accountability Act 2013 (PGPA Act).
(c) Excludes departmental capital budget (DCB).
(d) Estimated retained revenue receipts under section 74 of the Public Governance, Performance and Accountability Act 2013 (PGPA Act).
(e) Departmental capital budgets are not separately identified in Appropriation Bill (No.1) and form part of ordinary annual services items. Please refer to Table 3.5 for further details. For accounting purposes, this amount has been designated as a 'contribution by owner'.
(f) Appropriation Bill (No. 2) 2017-18.

Bureau of Meteorology Budget Statements
119
1.3 BUDGET MEASURES
Budget measures in Part 1 relating to the Bureau of Meteorology are detailed in Budget
Paper No. 2 and are summarised below.
Table 1.2: Bureau of Meteorology 2017-18 Budget measures
Part 1: Measures announced since the 2016-17 Mid-Year Economic and Fiscal Outlook (MYEFO)
Program 2016-17
$'000 2017-18
$'000 2018-19
$'000 2019-20
$'000 2020-21
$'000
Expense measures
Public Service Modernisation Fund – transformation and innovation stream (a) 1.1
Departmental expenses
- - - - -
Total
- - - - - Bureau of Meteorology – improved security and resilience 1.1
Departmental expenses
- nfp nfp nfp nfp
Total
- nfp nfp nfp nfp
Total expense measures
Departmental
- nfp nfp nfp nfp
Total
- nfp nfp nfp nfp
Capital measures
Bureau of Meteorology – improved security and resilience 1.1
Departmental capital
- nfp nfp nfp nfp
Total
- nfp nfp nfp nfp
Total capital measures
Departmental
- nfp nfp nfp nfp
Total - nfp nfp nfp nfp
Prepared on a Government Finance Statistics (fiscal) basis.
(a) This measure includes funding of $0.7 million in 2019-20.

Bureau of Meteorology Budget Statements
120
Section 2: Outcomes and planned performance
Government outcomes are the intended results, impacts or consequences of actions by
the Government on the Australian community. Commonwealth programs are the
primary vehicle by which government entities achieve the intended results of their
outcome statements. Entities are required to identify the programs which contribute to
government outcomes over the Budget and forward years.
Each outcome is described below together with its related programs. The following
provides detailed information on expenses for each outcome and program, further
broken down by funding source.
Note:
Performance reporting requirements in the Portfolio Budget Statements are part of the
enhanced Commonwealth performance framework established by the Public
Governance, Performance and Accountability Act 2013. It is anticipated that the
performance criteria described in Portfolio Budget Statements will be read with
broader information provided in an entity’s corporate plans and annual performance
statements – included in Annual Reports - to provide an entity’s complete performance
story.
The most recent corporate plan for Bureau of Meteorology can be found at:
http://www.bom.gov.au/inside/Bureau-of-Meteorology-Corporate-Plan-2016-17.pdf.
The most recent annual performance statement can be found at:
http://www.bom.gov.au/inside/eiab/reports/ar15-16/doc/2.2-Bureau-of-
Meteorology-Annual-Performance-Statement.pdf.

Bureau of Meteorology Budget Statements
121
2.1 BUDGETED EXPENSES AND PERFORMANCE FOR OUTCOME 1
Outcome 1: Informed safety, security and economic decisions by governments, industry and the community through the provision of information, forecasts, services and research relating to weather, climate and water.
Linked programs
The outcomes of Program 1.1 Bureau of Meteorology contribute to meeting the objectives of a number of programs delivered by other Commonwealth entities, including the Department of the Environment and Energy, the Department of Agriculture and Water Resources, the Attorney-General's Department, the Department of Health, and the Department of Defence.

Bureau of Meteorology Budget Statements
122
Budgeted expenses for Outcome 1
This table shows how much the entity intends to spend (on an accrual basis) on
achieving the outcome, broken down by program, as well as by Administered and
Departmental funding sources.
Table 2.1.1: Budgeted expenses for Outcome 1
Outcome 1: Informed safety, security and economic decisions by governments, industry and the community through the provision of information, forecasts, services and research relating to weather, climate and water.
2016-17 Estimated
actual $'000
2017-18 Budget
$'000
2018-19 Forward estimate
$'000
2019-20 Forward estimate
$'000
2020-21 Forward estimate
$'000
Program 1.1: Bureau of Meteorology
Departmental expenses
Departmental appropriation 228,407 229,757 221,752 219,107 217,366
s 74 Retained revenue receipts (a) 69,538 74,161 69,284 61,758 61,758 Expenses not requiring appropriation in the Budget year (b) 73,228 73,228 73,228 73,228 73,228
Departmental total 371,173 377,146 364,264 354,093 352,352
Total expenses for program 1.1 371,173 377,146 364,264 354,093 352,352
Outcome 1 Totals by appropriation type
Departmental expenses
Departmental appropriation 228,407 229,757 221,752 219,107 217,366
s74 Retained revenue receipts (a) 69,538 74,161 69,284 61,758 61,758 Expenses not requiring appropriation in the Budget year (b) 73,228 73,228 73,228 73,228 73,228
Departmental total 371,173 377,146 364,264 354,093 352,352
Total expenses for Outcome 1 371,173 377,146 364,264 354,093 352,352
2016-17 2017-18
Average staffing level (number) (c) 1,602 1,565 (a) Estimated expenses incurred in relation to receipts retained under section 74 of the Public
Governance, Performance and Accountability Act 2013. (b) Expenses not requiring appropriation in the Budget year are made up of depreciation expenses,
amortisation expenses, make good expenses and audit fees.
(c) ASL numbers include staff used for the purpose of asset construction (capitalised staff).

Bureau of Meteorology Budget Statements
123
Table 2.1.2: Performance criteria for Outcome 1
Table 2.1.2 below details the performance criteria for each program associated with
Outcome 1. It summarises how each program is delivered and where 2017-18 Budget
measures have created new programs or materially changed existing programs.
Outcome 1 – Informed safety, security and economic decisions by governments, industry and the community through the provision of information, forecasts, services and research relating to weather, climate and water.
Program 1.1 – Bureau of Meteorology
Provides Australians with the environmental intelligence they need to manage and live within their natural environment, encompassing the atmosphere, oceans, water and land.
Delivery Program 1.1 will be delivered by:
Weather, water, climate and ocean products and services that benefit the Australian community and drive competitive advantage for businesses and industries.
Outstanding people, science, systems, infrastructure and partnerships working together for maximum simplicity, productivity and agility.
Deep understanding and creative thinking that generates novel solutions for our customers and our organisation.
One enterprise, that is safe and diverse, where our people grow and are empowered to excel, and where our customers come first, trust us and consider that we are a pleasure to work with.
Performance information
Year Performance criteria Targets
2016-17 Observations meet accuracy, timeliness, completeness, coverage and accessibility specifications.
Forecasts meet accuracy, coverage and timeliness specifications, and are used extensively, and satisfy users.
Warnings meet accuracy, timeliness and coverage specifications, and are effective in influencing responses to impending critical events.
Data and information meet accuracy, timeliness and coverage specifications and satisfy users.
Accurate and timely advice effectively informs decision-making and satisfies the needs of stakeholders and users.
Increased accuracy and capacity of the Bureau’s products and services, and increased levels of stakeholder satisfaction.
Australia’s interests are protected and advanced through effective engagement and the maintenance and development of international agreements that deliver improved outcomes for Australia.
The Bureau is on track to meet the 2016-17 key performance indicators.
Evidence of achievement will be described in the Bureau's Annual Performance Statement 2016-17 in line with the evidence targets described in the 2016-17 Corporate Plan.

Bureau of Meteorology Budget Statements
124
Program 1.1 – Bureau of Meteorology
Provides Australians with the environmental intelligence they need to manage and live within their natural environment, encompassing the atmosphere, oceans, water and land.
Year Performance criteria (a) Targets
2017-18 Financial and social value is delivered to Government, industry and the Australian community.
Delivery of products and services that meet customer requirements, are delivered to budget, meet quality and security specifications and benchmark well in relation to international standards and peer organisations.
The speed, maturity and quality of innovation and novel solutions meets customer needs or enhances internal capability.
Feedback from staff, customers and partners demonstrates alignment of our actual behaviours with our stated intent to create a safe, diverse and empowered enterprise that puts customers first, and provides an outstanding experience every time that they engage with us.
The Bureau’s enterprise level performance criteria have broad relevance across the agency as a whole. Both quantitative and qualitative targets that collectively demonstrate the achievement of the Bureau’s enterprise level performance criteria will be set in the Bureau’s Corporate Plan 2017-18 and reported in the Bureau’s Annual Performance Statement 2017-18.
2018-19 and beyond As for 2017-18 As for 2017-18
Purposes (b) To provide trusted, reliable and responsive weather, water, climate and ocean services for Australia—all day, every day.
Material changes to Program 1.1 resulting from the following measure:
Bureau of Meteorology – improved security and resilience
(a) New or modified performance criteria and/or targets that reflect new or materially changed programs are shown in italics.
(b) Refers to updated purposes that will be reflected in the 2017-18 Corporate Plan.

Bureau of Meteorology Budget Statements
125
Section 3: Budgeted financial statements
Section 3 presents budgeted financial statements which provide a comprehensive
snapshot of entity finances for the 2017-18 budget year, including the impact of budget
measures and resourcing on financial statements.
3.1 BUDGETED FINANCIAL STATEMENTS
3.1.1 Explanatory notes and analysis of budgeted financial statements
An analysis of the Bureau of Meteorology’s budgeted financial statements, as reflected
in the Bureau’s budgeted departmental financial statements and administered
schedules for the 2017–18 Budget, is provided below:
Total revised revenue to the Bureau in 2017–18 is estimated to be $308.1 million, an
increase of $9.5 million from the 2016–17 Budget estimated actual. The movement in
funding is the result of:
funding associated with the Budget measure Stronger farmers, Stronger Economy
– new drought management framework
funding associated with the 2016-17 Additional estimates Budget measure –
Essential Commonwealth Water Functions
funding associated with the 2017-18 Budget measure – Improved security and
resilience
increased funding associated with cost recoverable projects and services, and
reduced funding as a result of the increase in the Efficiency Dividend.
Total expenses are estimated to be $377.1 million, an increase of $6.0 million from the
2016–17 estimated actual. Whilst the Bureau is no longer funded for Depreciation
through Appropriation Bill 1 the expenditure is still recognised on the Income
Statement.

Bureau of Meteorology Budget Statements
126
3.2 BUDGETED FINANCIAL STATEMENTS TABLES
Table 3.1: Comprehensive income statement (showing net cost of services) for the period ended 30 June
2016-17 Estimated
actual $'000
2017-18 Budget
$'000
2018-19 Forward estimate
$'000
2019-20 Forward estimate
$'000
2020-21 Forward estimate
$'000
EXPENSES
Employee benefits 184,390 174,826 172,705 172,659 173,317
Suppliers 109,625 125,183 114,429 104,301 101,901
Depreciation and amortisation 75,189 75,189 75,189 75,189 75,189
Losses from asset sales 1 1 1 1 1
Other expenses 1,968 1,947 1,940 1,943 1,944
Total expenses 371,173 377,146 364,264 354,093 352,352
LESS:
OWN-SOURCE INCOME
Own-source revenue
Sale of goods and rendering of
services 70,138 78,297 71,551 62,358 62,358
Total own-source revenue 70,138 78,297 71,551 62,358 62,358
Total own-source income 70,138 78,297 71,551 62,358 62,358
Net (cost of)/contribution by services (301,035) (298,849) (292,713) (291,735) (289,994)
Revenue from Government 228,407 229,757 221,752 219,107 217,366
Surplus/(deficit) attributable to the Australian Government (72,628) (69,092) (70,961) (72,628) (72,628)
Total comprehensive income/(loss) (72,628) (69,092) (70,961) (72,628) (72,628)
Total comprehensive income/(loss) attributable to the Australian Government (72,628) (69,092) (70,961) (72,628) (72,628)
Note: Impact of net cash appropriation arrangements
2016-17
$'000 2017-18
$'000 2018-19
$'000 2019-20
$'000 2020-21
$'000
Total comprehensive income/(loss) excluding depreciation/ amortisation expenses previously funded through revenue appropriations 600 4,136 2,267 600 600
less depreciation/amortisation expenses previously funded through revenue appropriations (a) 73,228 73,228 73,228 73,228 73,228
Total comprehensive income/(loss) - as per the statement of comprehensive income (72,628) (69,092) (70,961) (72,628) (72,628)
Prepared on Australian Accounting Standards basis.
(a) From 2010-11, the Government introduced net cash appropriation arrangements where Appropriation Bill (No. 1) revenue for the depreciation/amortisation expenses of non-corporate Commonwealth entities (and select corporate Commonwealth entities) were replaced with a separate capital budget (the Departmental Capital Budget, or DCB) provided through Appropriation (Bill No. 1) equity appropriations. For information regarding Department Capital Budgets, please refer to Table 3.5 Departmental Capital Budget Statement.
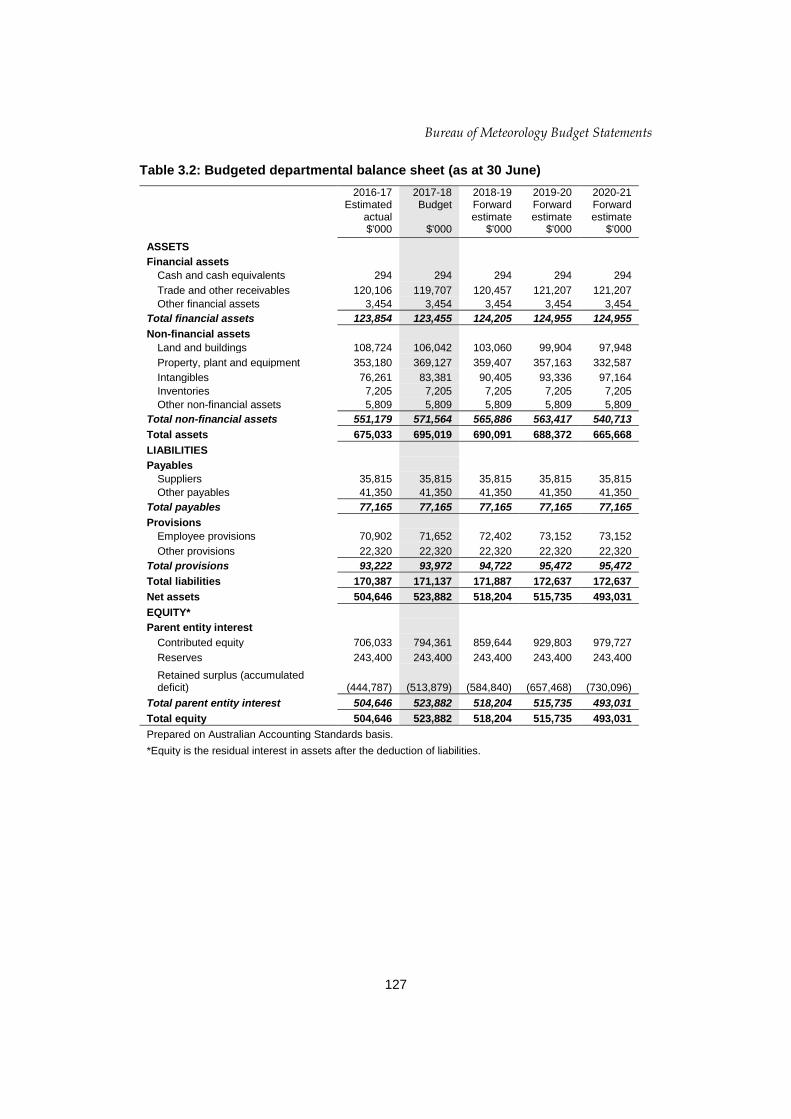
Bureau of Meteorology Budget Statements
127
Table 3.2: Budgeted departmental balance sheet (as at 30 June)
2016-17 Estimated
actual $'000
2017-18 Budget
$'000
2018-19 Forward estimate
$'000
2019-20 Forward estimate
$'000
2020-21 Forward estimate
$'000
ASSETS
Financial assets
Cash and cash equivalents 294 294 294 294 294
Trade and other receivables 120,106 119,707 120,457 121,207 121,207
Other financial assets 3,454 3,454 3,454 3,454 3,454
Total financial assets 123,854 123,455 124,205 124,955 124,955
Non-financial assets
Land and buildings 108,724 106,042 103,060 99,904 97,948
Property, plant and equipment 353,180 369,127 359,407 357,163 332,587
Intangibles 76,261 83,381 90,405 93,336 97,164
Inventories 7,205 7,205 7,205 7,205 7,205
Other non-financial assets 5,809 5,809 5,809 5,809 5,809
Total non-financial assets 551,179 571,564 565,886 563,417 540,713
Total assets 675,033 695,019 690,091 688,372 665,668
LIABILITIES
Payables
Suppliers 35,815 35,815 35,815 35,815 35,815
Other payables 41,350 41,350 41,350 41,350 41,350
Total payables 77,165 77,165 77,165 77,165 77,165
Provisions
Employee provisions 70,902 71,652 72,402 73,152 73,152
Other provisions 22,320 22,320 22,320 22,320 22,320
Total provisions 93,222 93,972 94,722 95,472 95,472
Total liabilities 170,387 171,137 171,887 172,637 172,637
Net assets 504,646 523,882 518,204 515,735 493,031
EQUITY*
Parent entity interest
Contributed equity 706,033 794,361 859,644 929,803 979,727
Reserves 243,400 243,400 243,400 243,400 243,400
Retained surplus (accumulated deficit) (444,787) (513,879) (584,840) (657,468) (730,096)
Total parent entity interest 504,646 523,882 518,204 515,735 493,031
Total equity 504,646 523,882 518,204 515,735 493,031
Prepared on Australian Accounting Standards basis. *Equity is the residual interest in assets after the deduction of liabilities.

Bureau of Meteorology Budget Statements
128
Table 3.3: Departmental statement of changes in equity — summary of movement (Budget year 2017-18)
Retained earnings
$'000
Asset revaluation
reserve $'000
Contributed equity/ capital $'000
Total equity
$'000
Opening balance as at 1 July 2017 Balance carried forward from previous period (444,787) 243,400 706,033 504,646
Adjusted opening balance (444,787) 243,400 706,033 504,646
Comprehensive income Surplus/(deficit) for the period (69,092) - - (69,092)
Total comprehensive income (69,092) - - (69,092)
Transactions with owners Contributions by owners Equity injection - - 40,217 40,217
Departmental capital budget (DCB) - - 48,111 48,111
Sub-total transactions with owners - - 88,328 88,328
Estimated closing balance as at 30 June 2018 (513,879) 243,400 794,361 523,882
Closing balance attributable to the Australian Government (513,879) 243,400 794,361 523,882
Prepared on Australian Accounting Standards basis.

Bureau of Meteorology Budget Statements
129
Table 3.4: Budgeted departmental statement of cash flows (for the period ended 30 June)
2016-17 Estimated
actual $'000
2017-18 Budget
$'000
2018-19 Forward estimate
$'000
2019-20 Forward estimate
$'000
2020-21 Forward estimate
$'000
OPERATING ACTIVITIES
Cash received
Appropriations 303,762 294,506 283,520 280,715 279,724
Sale of goods and rendering of services 70,138 78,297 71,551 62,358 62,358
Net GST received 8,310 8,310 8,310 8,310 8,310
Total cash received 382,210 381,113 363,381 351,383 350,392
Cash used
Employees 183,640 174,076 171,955 171,909 173,317
Suppliers 111,593 127,130 116,369 106,244 103,845
Net GST paid 4,560 4,560 4,560 4,560 4,560
s74 Retained revenue receipts transferred to OPA 70,138 64,350 62,518 62,358 62,358
Total cash used 369,931 370,116 355,402 345,071 344,080
Net cash from/(used by) operating activities 12,279 10,997 7,979 6,312 6,312
INVESTING ACTIVITIES
Cash received
Proceeds from sales of property, plant and equipment 1,225 1,225 1,225 1,225 1,225
Total cash received 1,225 1,225 1,225 1,225 1,225
Cash used
Purchase of property, plant and
equipment and intangibles 80,659 96,799 70,736 73,945 53,710
Other 3,751 3,751 3,751 3,751 3,751
Total cash used 84,410 100,550 74,487 77,696 57,461
Net cash from/(used by) investing activities (83,185) (99,325) (73,262) (76,471) (56,236)
FINANCING ACTIVITIES
Cash received
Contributed equity 70,906 88,328 65,283 70,159 49,924
Total cash received 70,906 88,328 65,283 70,159 49,924
Net cash from/(used by) financing activities 70,906 88,328 65,283 70,159 49,924
Net increase/(decrease) in cash held - - - - -
Cash and cash equivalents at the beginning of the reporting period 294 294 294 294 294
Cash and cash equivalents at the end of the reporting period 294 294 294 294 294
Prepared on Australian Accounting Standards basis.

Bureau of Meteorology Budget Statements
130
Table 3.5: Departmental capital budget statement (for the period ended 30 June) 2016-17
Estimated actual $'000
2017-18 Budget
$'000
2018-19 Forward estimate
$'000
2019-20 Forward estimate
$'000
2020-21 Forward estimate
$'000
NEW CAPITAL APPROPRIATIONS
Capital budget - Bill 1 (DCB) 42,125 48,111 48,155 44,381 45,475
Equity injections - Bill 2 28,781 40,217 17,128 25,778 4,449
Total new capital appropriations 70,906 88,328 65,283 70,159 49,924
Provided for:
Purchase of non-financial assets 70,906 88,328 65,283 70,159 49,924
Total items 70,906 88,328 65,283 70,159 49,924
PURCHASE OF NON-FINANCIAL ASSETS
Funded by capital appropriations (a) 34,748 41,366 17,128 25,778 4,449
Funded by capital appropriation - DCB (b) 42,125 48,111 48,155 44,381 45,475 Funded internally from departmental resources (c) 3,786 7,322 5,453 3,786 3,786
TOTAL 80,659 96,799 70,736 73,945 53,710
RECONCILIATION OF CASH USED TO ACQUIRE ASSETS TO ASSET MOVEMENT TABLE
Total purchases 80,659 96,799 70,736 73,945 53,710
Total cash used to acquire assets 80,659 96,799 70,736 73,945 53,710
Prepared on Australian Accounting Standards basis.
(a) Includes both current Appropriation Bill (No. 2) and prior Act No. 2/4 appropriations. (b) Does not include annual finance lease costs. Includes purchases from current and previous years'
Departmental Capital Budgets (DCBs). (c) Includes the following sources of funding:
- s 74 Retained revenue receipts; - proceeds from the sale of assets.

Bureau of Meteorology Budget Statements
131
Table 3.6: Statement of departmental asset movements (Budget year 2017-18)
Land
$'000
Buildings
$'000
Other property, plant and
equipment $'000
Computer software
and intangibles
$'000
Other
$'000
Total
$'000
As at 1 July 2017 Gross book value 16,759 108,050 524,139 201,275 50 850,273
Accumulated depreciation/ amortisation and impairment - (16,085) (170,959) (125,027) (37) (312,108)
Opening net book balance 16,759 91,965 353,180 76,248 13 538,165
Capital asset additions Estimated expenditure on new
or replacement assets By purchase - appropriation equity (a) - - 41,084 282 - 41,366
By purchase - appropriation ordinary annual services (b) - 1,544 22,836 23,731 - 48,111
By purchase - other - 1,200 6,122 - - 7,322
Total additions - 2,744 70,042 24,013 - 96,799
Other movements
Depreciation/amortisation expense - (4,226) (54,070) (16,893) - (75,189)
Disposals (c) - (1,200) (25) - - (1,225)
Total other movements - (5,426) (54,095) (16,893) - (76,414)
As at 30 June 2018 Gross book value 16,759 109,594 594,156 225,288 50 945,847
Accumulated depreciation/ amortisation and impairment - (20,311) (225,029) (141,920) (37) (387,297)
Closing net book balance 16,759 89,283 369,127 83,368 13 558,550
Prepared on Australian Accounting Standards basis.
(a) 'Appropriation equity' refers to equity injections appropriations provided through Appropriation Bill (No. 2) 2017-18.
(b) 'Appropriation ordinary annual services' refers to funding provided through Appropriation Bill (No.1) 2017-18 for depreciation/amortisation expenses, DCBs or other operational expenses.
(c) Net proceeds may be returned to the OPA.

Bureau of Meteorology Budget Statements
132
Table 3.7: Schedule of budgeted income and expenses administered on behalf of Government (for the period ended 30 June)
2016-17 Estimated
actual $'000
2017-18 Budget
$'000
2018-19 Forward estimate
$'000
2019-20 Forward estimate
$'000
2020-21 Forward estimate
$'000
OWN-SOURCE INCOME
Own-source revenue
Non-taxation revenue
Sale of goods and rendering of
services nfp nfp nfp nfp nfp
Total non-taxation revenue nfp nfp nfp nfp nfp
Total own-source revenue administered on behalf of Government nfp nfp nfp nfp nfp
Total own-sourced income administered on behalf of Government nfp nfp nfp nfp nfp
Net (cost of)/contribution by services nfp nfp nfp nfp nfp
Total comprehensive income/(loss) nfp nfp nfp nfp nfp
Prepared on Australian Accounting Standards basis.

Bureau of Meteorology Budget Statements
133
Table 3.8: Schedule of budgeted administered cash flows (for the period ended 30 June)
2016-17 Estimated
actual $'000
2017-18 Budget
$'000
2018-19 Forward estimate
$'000
2019-20 Forward estimate
$'000
2020-21 Forward estimate
$'000
OPERATING ACTIVITIES
Cash received
Sales of goods and rendering of services nfp nfp nfp nfp nfp
Total cash received nfp nfp nfp nfp nfp
Net cash from/(used by) operating activities nfp nfp nfp nfp nfp
Net increase/(decrease) in cash held nfp nfp nfp nfp nfp
Cash and cash equivalents at beginning of reporting period
Cash to Official Public Account for:
- Appropriations nfp nfp nfp nfp nfp
Total cash to Official Public Account nfp nfp nfp nfp nfp
Cash and cash equivalents at end of reporting period nfp nfp nfp nfp nfp
Prepared on Australian Accounting Standards basis.


135
CLEAN ENERGY FINANCE
CORPORATION
ENTITY RESOURCES AND PLANNED
PERFORMANCE


137
CLEAN ENERGY FINANCE CORPORATION
SECTION 1: ENTITY OVERVIEW AND RESOURCES ............................................. 139
1.1 Strategic direction statement ........................................................................ 139
1.2 Entity resource statement ............................................................................. 142
1.3 Budget measures .......................................................................................... 143
SECTION 2: OUTCOMES AND PLANNED PERFORMANCE ................................. 144
2.1 Budgeted expenses and performance for Outcome 1 .................................. 145
SECTION 3: BUDGETED FINANCIAL STATEMENTS ............................................. 152
3.1 Budgeted financial statements...................................................................... 152
3.2 Budgeted financial statements tables ........................................................... 155


139
CLEAN ENERGY FINANCE CORPORATION
Section 1: Entity overview and resources
1.1 STRATEGIC DIRECTION STATEMENT
The Clean Energy Finance Corporation was established to facilitate increased flows of
finance into the clean energy sector. The Corporation invests in accordance with its
legislation, the Clean Energy Finance Corporation Act 2012 and the Clean Energy Finance
Corporation Investment Mandate Direction 2016 (No.2) [Investment Mandate 2016 (No.2)],
as made by the Minister for the Environment and Energy and the Minister for Finance
which took effect on 11 January 2017.
The Clean Energy Finance Corporation is an independent statutory authority - defined
as a corporate Commonwealth entity under the Public Governance, Performance and
Accountability Act 2013. The Corporation has access to $10 billion in appropriations via
the Clean Energy Finance Corporation Special Account (credited with $2 billion every
1 July from 2013 to 2017 inclusive, in accordance with section 46 of the Clean Energy
Finance Corporation Act 2012).
The Clean Energy Finance Corporation is governed by an independent Board which
has statutory responsibility for decision-making, performance of the Corporation’s
functions and managing the Corporation’s investments, and a Chief Executive Officer
who is responsible for the day to day administration of the Corporation. Staff are non-
APS and are employed under the Clean Energy Finance Corporation Act 2012. The Board
reports to Parliament through its responsible Ministers.
The Clean Energy Finance Corporation’s investment objectives are to catalyse and
leverage an increased flow of funds for the commercialisation and deployment of
Australian based renewable energy, energy efficiency and low-emissions technologies.
The Clean Energy Finance Corporation seeks diversity of technology and sector
exposure. All sectors of the economy can undertake investments which contribute to
emissions reduction and projects are drawn widely. The Corporation’s portfolio is
expected to evolve over time, noting the Clean Energy Finance Corporation Act 2012
requirement that on or after 1 July 2018, at least half of the funds invested must be
invested in renewable energy.
The Clean Energy Finance Corporation applies commercial rigour to investment
decisions and seeks to develop a portfolio across the spectrum of clean energy
technologies that, in aggregate, must have an acceptable but not excessive level of risk
relative to the sector. The Corporation applies a commercial filter when making its
investment decisions, focussing on projects and technologies at the later stages of
development. The filter is not as stringent as the private sector equivalent, as the

Clean Energy Finance Corporation Budget Statements
140
Corporation has a public policy purpose and values any positive externalities being
generated. The Corporation considers the positive externalities and public policy
outcomes when making investment decisions and when determining the extent of any
concessionality to be provided for an investment.
In the Investment Mandate 2016 (No.2) the responsible Ministers have directed the
Board to target an average return of at least the five–year Australian Government bond
rate, +3 to +4 per cent per annum as the benchmark return of the core portfolio and the
five–year Australian Government bond rate, +1 per cent per annum as the benchmark
return of the Clean Energy Innovation Fund portfolio. Performance against these
benchmarks is measured before operating expenses. The Portfolio benchmark returns
are medium-term targets and expected to be earned across the portfolios and over a
period of time. In targeting these benchmark returns:
The Australian Government is conscious of the risks inherent in investing in a
large portfolio of financial assets. It acknowledges that in practice this will involve
some short-term volatility in the Corporation’s returns, including the possibility
of losses in some years.
The Corporation undertakes rigorous due diligence and financial modelling
analysis along with assessments of other key investment risks, including credit
risk, to determine appropriate investment structures, financial covenants and the
required legal undertakings for an intended investment, all designed to enhance
and protect the Corporation’s position.
In the Investment Mandate 2016 (No.2) the responsible Ministers have also directed the
Board to make available up to:
$1 billion of investment finance over 10 years for a Reef Funding Program
$1 billion of investment finance over 10 years for a Sustainable Cities Investment
Program
$200 million for debt and equity investment through the Clean Energy Innovation
Fund.
The ways in which the Corporation addresses financial barriers include:
• attracting finance to the Australian market to improve the flow and diversification
of funds for investment into the sector
• assisting project proponents as an arranger, helping to develop the business case
and introduce the proponents to other financiers to seek transaction close
• building knowledge and capacity within the finance sector by participating in
transactions to de-risk the investment, familiarising financiers with new asset
types or through reducing their size of exposure

Clean Energy Finance Corporation Budget Statements
141
• working with the finance sector to develop and deliver new financial products to
the market, tailored to the needs, attributes and emerging delivery models for
new technologies, which in turn enables small and mid-sized businesses to access
finance for energy productivity enhancing capital investment
• building knowledge and capacity within industry through demonstration and
case studies to promote successful models and opportunities in energy
productivity and clean energy investment
• providing loans at commercial and concessional rates. Where it is necessary and
justified, the Corporation may choose to deploy concessional finance to assist in
overcoming financial impediments and facilitate realisation of the project.

Clean Energy Finance Corporation Budget Statements
142
1.2 ENTITY RESOURCE STATEMENT
Table 1.1 shows the total funding from all sources available to the entity for its
operations and to deliver programs and services on behalf of the Government.
The table summarises how resources will be applied by outcome (government strategic
policy objectives) and by administered (on behalf of the Government or the public) and
departmental (for the entity’s operations) classification.
For more detailed information on special accounts and special appropriations, please
refer to Budget Paper No. 4 – Agency Resourcing.
Information in this table is presented on a resourcing (that is, appropriations/cash
available) basis, whilst the ‘Budgeted expenses by Outcome’ tables in Section 2 and the
financial statements in Section 3 are presented on an accrual basis.
Table 1.1: Clean Energy Finance Corporation resource statement — Budget estimates for 2017-18 as at Budget May 2017
2016-17 estimated
actual $'000
2017-18 estimate
$'000
Opening balance/cash reserves at 1 July (a, b) 232,778 300,733
Funds from other sources
Interest and fees 61,657 84,299
Total funds from other sources 61,657 84,299
Total net resourcing for Clean Energy Finance Corporation 294,435 385,032
2016-17 2017-18
Average staffing level (number) 80 101
Prepared on a resourcing (i.e. appropriations available) basis.
Please note: All figures shown above are GST exclusive - these may not match figures in the cash flow statement.
(a) The Corporation is not directly appropriated as it is a corporate Commonwealth entity as defined under the Public Governance, Performance and Accountability Act 2013.
(b) The Corporation does not hold the Special Account itself and therefore does not have a balance carried forward from earlier years. Under the Clean Energy Finance Corporation Act 2012, the Corporation is able to draw on the cumulative funds available in the Special Account, which are estimated to be $7.979 billion at 1 July 2017.

Clean Energy Finance Corporation Budget Statements
143
1.3 BUDGET MEASURES
There are no 2017-18 Budget measures relating to the Clean Energy Finance
Corporation.

Clean Energy Finance Corporation Budget Statements
144
Section 2: Outcomes and planned performance
Government outcomes are the intended results, impacts or consequences of actions by
the Government on the Australian community. Commonwealth programs are the
primary vehicle by which government entities achieve the intended results of their
outcome statements. Entities are required to identify the programs which contribute to
government outcomes over the Budget and forward years.
Each outcome is described below together with its related programs. The following
provides detailed information on expenses for each outcome and program, further
broken down by funding source.
Note:
Performance reporting requirements in the Portfolio Budget Statements are part of the
enhanced Commonwealth performance framework established by the Public
Governance, Performance and Accountability Act 2013. It is anticipated that the
performance criteria described in Portfolio Budget Statements will be read with
broader information provided in an entity’s corporate plans and annual performance
statements – included in Annual Reports - to provide an entity’s complete performance
story.
The most recent corporate plan for the Clean Energy Finance Corporation can be found
at: http://www.cleanenergyfinancecorp.com.au/publications/corporate-plan.aspx.
The most recent annual performance statement can be found at:
http://annualreport2016.cleanenergyfinancecorp.com.au/performance/annual-
performance-statement/.

Clean Energy Finance Corporation Budget Statements
145
2.1 BUDGETED EXPENSES AND PERFORMANCE FOR OUTCOME 1
Outcome 1: Facilitate increased flows of finance into Australia’s clean energy sector, applying commercial rigour to investing in renewable energy, low-emissions and energy efficiency technologies, building industry capacity, and disseminating information to industry stakeholders.
Linked programs
Australian Renewable Energy Agency
Programs
Program 1.1 – Australian Renewable Energy Agency
Contribution to Outcome 1 made by linked programs
The Clean Energy Innovation Fund is jointly managed by the Corporation and the Australian Renewable Energy Agency, drawing on their complementary experience and expertise. The Clean Energy Innovation Fund has up to $200 million available for debt and equity investments in emerging clean energy projects and businesses, that should allow projects at the later end of the innovation chain to deliver a financial return to taxpayers, in addition to the public good return of improving competitiveness of renewable energy and related technologies.
Department of the Environment and Energy
Programs
Program 1.1 – Sustainable Management of Natural Resources and the Environment
Program 2.1 – Reducing Australia's Greenhouse Gas Emissions
Program 2.3 – Renewable Energy Technology Development
Program 4.1 – Energy
Contribution to Outcome 1 made by linked programs
The Department of the Environment and Energy has responsibility for policies that reduce Australia’s greenhouse gas emissions. The Clean Energy Finance Corporation contributes to these programs by facilitating increased flows of finance into the clean energy sector, including through the funding it makes available to the Clean Energy Innovation Fund and Reef Funding Program.

Clean Energy Finance Corporation Budget Statements
146
Department of the Prime Minister and Cabinet
Programs
Program 1.1 – Prime Minister and Cabinet
Contribution to Outcome 1 made by linked programs
The Corporation is working with the Department of the Prime Minister and Cabinet, state and local governments and other stakeholders to support the Government's Smart Cities Plan, by making up to $1.0 billion of investment finance available over 10 years for clean energy projects that improve the productivity and liveability of cities.
Great Barrier Reef Marine Park Authority
Programs
Program 1.1 – Improving the outlook for the Great Barrier Reef
Contribution to Outcome 1 made by linked programs
The Clean Energy Finance Corporation is providing a $1.0 billion investment over
10 years for the Reef Funding Program. The Program will deliver financial
investment in clean energy projects delivered in the Great Barrier Reef catchment
region. In targeting clean energy projects and businesses in the region the Reef
Funding Program supports delivery of the Government’s Reef 2050 plan.

Clean Energy Finance Corporation Budget Statements
147
Budgeted expenses for Outcome 1
This table shows how much the entity intends to spend (on an accrual basis) on
achieving the outcome, broken down by program, as well as by Administered and
Departmental funding sources.
Table 2.1.1: Budgeted expenses for Outcome 1
Outcome 1: Facilitate increased flows of finance into Australia's clean energy sector, applying commercial rigour to investing in renewable energy, low-emissions and energy efficiency technologies, building industry capacity, and disseminating information to industry stakeholders.
2016-17 Estimated
actual $'000
2017-18 Budget
$'000
2018-19 Forward estimate
$'000
2019-20 Forward estimate
$'000
2020-21 Forward estimate
$'000
Program 1.1: Clean Energy Finance Corporation
Expenses not requiring appropriation in the Budget year (a) 24,048 36,472 39,719 47,007 51,646 Revenues from other independent sources 29,652 39,187 43,628 48,154 52,161
Total expenses for Program 1.1 53,700 75,659 83,347 95,161 103,807
Outcome 1 Totals by appropriation type
Expenses not requiring appropriation in the Budget year (a) 24,048 36,472 39,719 47,007 51,646 Revenues from other independent sources 29,652 39,187 43,628 48,154 52,161
Total expenses for Outcome 1 53,700 75,659 83,347 95,161 103,807
2016-17 2017-18
Average staffing level (number) 80 101
(a) Expenses not requiring appropriation in the Budget year are non-cash charges largely in relation to concessional loan charges, write-down and impairment of assets, any losses on disposal of investments and depreciation and amortisation.

Clean Energy Finance Corporation Budget Statements
148
Table 2.1.2: Performance criteria for Outcome 1
Table 2.1.2 below details the performance criteria for each program associated with
Outcome 1. It summarises how each program is delivered and where 2017-18 Budget
measures have created new programs or materially changed existing programs.
Outcome 1 – Facilitate increased flows of finance into Australia’s clean energy sector, applying commercial rigour to investing in renewable energy, low-emissions and energy efficiency technologies, building industry capacity, and disseminating information to industry stakeholders.
Program 1.1 – Clean Energy Finance Corporation. The Clean Energy Finance Corporation’s mission is: “To accelerate Australia’s transformation towards a more competitive economy in a carbon constrained world, by acting as a catalyst to increase investment in emissions reduction” through:
• investing directly and indirectly, while also attracting private sector investment into clean energy technologies and projects, and
• applying commercial rigour and using financial products and structures to address the barriers inhibiting private sector investment in the sector.
Delivery The Corporation helps mobilise investment in renewable energy, low emissions and energy efficiency projects and technologies in Australia, as well as into manufacturing businesses and services that produce the required inputs. It uses financial products and structures to address the barriers inhibiting investment at the demonstration, commercialisation and deployment stages of innovation.
The Corporation works with private sector financiers and project sponsors, to facilitate and leverage increased flows of finance into the clean energy sector. In undertaking its investment activities, the Corporation must consider the potential effect on other market participants and the efficient operation of the Australian financial and energy markets.
The Corporation shares knowledge and expertise with project sponsors, lenders and the broader industry, helping build capacity within the private sector.
The Corporation is being directed to focus particular attention on investing debt and equity in:
emerging clean energy projects and businesses that involve technologies that have passed beyond the research and development stages but are not yet established or of sufficient maturity, size or otherwise commercially ready to attract sufficient private sector investment
renewable energy, low emissions and energy efficiency projects and businesses that improve liveability, accessibility and productivity of our Cities while reducing congestion and air pollution
supporting emerging and innovative renewable technologies and energy efficiency, such as large scale solar, storage associated with large and small-scale solar, offshore wind technologies, and energy efficiency technologies for the built environment.
The Corporation can also provide up to $300m per annum of concessionality in relation to loans issued at below market interest rates, and guarantees where appropriate and unavoidable. The Corporation must ensure the total value of guarantees at any time does not exceed 5% of the total amount that has been credited to the Special Account under section 46 of the Act.
The Corporation is not a grants making organisation. It seeks to generate positive financial returns and this is expressed in the Investment Mandate as a target portfolio benchmark rate of return. The Corporation therefore makes investments with a commercial approach, based on careful risk assessment and appropriate terms, with an expectation that such investments will be repaid. The Corporation undertakes its investment activity responsibly and manages risk to minimise the likelihood of losses.

Clean Energy Finance Corporation Budget Statements
149
Program 1.1 – Clean Energy Finance Corporation. The Clean Energy Finance Corporation’s mission is: “To accelerate Australia’s transformation towards a more competitive economy in a carbon constrained world, by acting as a catalyst to increase investment in emissions reduction” through:
• investing directly and indirectly, while also attracting private sector investment into clean energy technologies and projects, and
• applying commercial rigour and using financial products and structures to address the barriers inhibiting private sector investment in the sector.
Performance information
Year Performance criteria Targets
2016-17 Investment in renewable energy, low emissions and energy efficiency technologies.
Forecast is to exceed the target $800m to $1bn of new contracted investments during the year.
Placement of funds into Australia’s clean energy sector.
Forecast is to exceed the deployment target of $450m.
Carbon abatement from committed projects at ‘cost’ to the Corporation of < $0 is in line with target.
On target to achieve financial leverage better than 1:1.
Performance against portfolio benchmark return set by the government.
The Corporation has taken all reasonable steps to achieve portfolio benchmark return target of the five–year Australian Government bond rate + 3 to + 4 per cent per annum, however portfolio returns are heavily influenced by the Corporation’s public policy purpose and are currently forecast to be in excess of relevant five–year Australian Government bond rate but less than the target portfolio benchmark return.
Operating expenditure before concession and impairment is forecast to be less than the target $31.3m or 4.0% of funds contracted.
Dissemination of information to industry stakeholders and building industry capacity.
Increase in value and diversity of tangible pipeline opportunities is reflected in the above target level of commitments and deployment.
The Corporation has participated in significant marketing and communications activity, media reach, conferences, events, symposiums and industry events and made a number of submissions to industry and government inquiries.

Clean Energy Finance Corporation Budget Statements
150
Program 1.1 – Clean Energy Finance Corporation. The Clean Energy Finance Corporation’s mission is: “To accelerate Australia’s transformation towards a more competitive economy in a carbon constrained world, by acting as a catalyst to increase investment in emissions reduction” through:
• investing directly and indirectly, while also attracting private sector investment into clean energy technologies and projects, and
• applying commercial rigour and using financial products and structures to address the barriers inhibiting private sector investment in the sector.
Year Performance criteria Targets
The Corporation has engaged in positive stakeholder awareness and knowledge including running board meetings followed by stakeholder events in Brisbane, Adelaide, and Melbourne in addition to the usual meetings in Sydney.
2017-18 Investment in renewable energy, low emissions and energy efficiency technologies.
Funds contracted during the year > $900m to $1.1bn
Placement of funds into Australia’s clean energy sector.
Funds Deployed > $650m.
Expected carbon abatement from committed projects at ‘cost’ to the Corporation of < $0.
Financial leverage in projects financed >1:1.
Performance against portfolio benchmark return set by the government in the 2016 Investment Mandate No. 2.
Optimise portfolio returns while recognising the Corporation’s public policy purpose, and taking all reasonable steps to achieve portfolio benchmark return targets of the five–year Australian Government bond rate + 3 to + 4 per cent per annum for the core portfolio and the five–year Australian Government bond rate + 1 per cent per annum for the Clean Energy Innovation Fund portfolio.
Operating expenditure before concession and impairment < $40m or 4% of funds contracted.
Dissemination of information to industry stakeholders and building industry capacity.
Increase the value and diversity of the investment pipeline.
Significant marketing and communications activity, including media outreach and targeted participation in conferences and industry events.
Positive stakeholder awareness and knowledge.

Clean Energy Finance Corporation Budget Statements
151
Program 1.1 – Clean Energy Finance Corporation. The Clean Energy Finance Corporation’s mission is: “To accelerate Australia’s transformation towards a more competitive economy in a carbon constrained world, by acting as a catalyst to increase investment in emissions reduction” through:
• investing directly and indirectly, while also attracting private sector investment into clean energy technologies and project,; and
• applying commercial rigour and using financial products and structures to address the barriers inhibiting private sector investment in the sector.
Year Performance criteria Targets
2018-19 and beyond As for 2017-18, other than specific measures set out below:
Investment in renewable energy, low emissions and energy efficiency technologies.
Funds contracted during the year > $1bn to $1.2bn
Placement of funds into Australia’s clean energy sector.
Funds deployed > $650m
Performance against portfolio benchmark return set by the government.
Operating expenditure before concession and impairment < $45m or 4% of funds contracted.
Purposes The Corporation was established by the Clean Energy Finance Corporation Act 2012 with the stated and legislated objective: “…to facilitate increased flows of finance into the clean energy sector.”

Clean Energy Finance Corporation Budget Statements
152
Section 3: Budgeted financial statements
Section 3 presents budgeted financial statements which provide a comprehensive
snapshot of entity finances for the 2017-18 budget year, including the impact of budget
measures and resourcing on financial statements.
3.1 BUDGETED FINANCIAL STATEMENTS
3.1.1 Differences between entity resourcing and financial statements
The Corporation incurs significant non-cash expenses and income which give rise to a
significant difference between the financial information presented in the budgeted
financial statements and the underlying cash impact of its operations.
Table 3.1 Comprehensive income statement (showing net cost of services) includes a
reconciliation of the impact of the non-cash income and charges.
3.1.2 Explanatory notes and analysis of budgeted financial statements
Basis of accounting
The financial statements, included in Tables 3.1 to 3.6 have been prepared in
accordance with the requirements of the Public Governance, Performance and
Accountability Act 2013, the Public Governance, Performance and Accountability (Financial
Reporting) Rule 2015, Australian Accounting Standards issued by the Australian
Accounting Standards Board and the Department of Finance guidance for the
preparation of financial statements. Noting additional disclosure of the reconciliation
of the impact of the significant non-cash income and charges is not required by
Australian Accounting Standards.
Forward estimates are prepared on the basis of accounting standards currently in
force. Adoption of new accounting standards such as AASB16 - Leases and AASB9 –
Financial Instruments will impact the measurement and classification of certain assets,
liabilities, revenues and expenses in future periods.
The financial report has been prepared on an accrual basis and is prepared in
accordance with the historical cost convention.
Notes to the budgeted financial statements
The budget statements and estimated forward years should be read taking into
account the following matters:

Clean Energy Finance Corporation Budget Statements
153
Concession loan discount
The Corporation is in the business of making loans, some of which may be at a
discount to the prevailing market equivalent rates or terms. For each investment, the
Corporation attempts to maximise its return and provide only the level of discount
from market rates/terms that is required to ensure the project proceeds. This may
involve the Corporation taking a position that is not generally offered by other market
participants (for example, longer term fixed-rate debt or subordinated debt) at rates
that may be below those that an equivalent market participant would demand if it
were to participate in this market.
The Corporation is required to record a non-cash charge referred to as a concessional
loan discount in relation to any such loans and it is a matter of judgment as to the
market equivalent rate used to ascertain the extent of the implicit discount attached to
the loan.
Concessionality is made available on an individual transaction basis through longer
tenor or lower cost of finance or by absorbing additional risk. The Corporation sets
terms on a case by case basis, lending at the rate that is commercially reasonable and
on the least generous terms possible for the project to proceed (that is, as close to
market terms as possible).
Impairment of loans
The Corporation is required to ascertain the extent to which its portfolio of loans is
likely to be recoverable. Given the Corporation is in the business of lending and
earning a margin it takes credit risk and it is appropriate to provision for expected
credit losses. As the Corporation’s portfolio is mainly senior secured debt and secured
project finance facilities, and there have been no specific impairments identified to
date, a statistical probability of default must be used to determine the level of
appropriate provisioning. The forecast impairment charge is a provision determined as
reasonable and appropriate when looking at the risks within the Corporation’s current
loans and in particular the current environment faced by the borrowers.
Variability in forecasts
The responsible Ministers give guidance to the Board in relation to the performance of
the Corporation’s investment function in the form of an Investment Mandate issued
under subsection 64(1) of the CEFC Act. The current Investment Mandate, the Clean
Energy Finance Corporation Investment Mandate Direction 2016 (No.2), was issued on
11 January 2017 by the Hon Josh Frydenberg MP, Minister for the Environment and
Energy, and Senator the Hon Mathias Cormann, Minister for Finance. The Investment
Mandate has a direct implication on the likely rate of return that is achievable in the
portfolio, the amount of risk that the Corporation will be incurring across its portfolio
and the variability of earnings from period to period.
For example, the Clean Energy Innovation Fund will likely result in a greater
proportion of equity investments than the Corporation’s existing portfolio. Similarly,

Clean Energy Finance Corporation Budget Statements
154
the focus on emerging clean energy projects and businesses that involve technologies
that have passed beyond the research and development stages, but are not yet
established or of sufficient maturity, size or otherwise commercially ready to attract
sufficient private sector investment, will expose the Corporation to a greater risk of
loss on individual investments and is likely to result in a greater variability in returns
between reporting periods. The Australian Government is conscious of the risks
inherent in investing in earlier stage technologies and acknowledges that in practice
this will involve some short-term volatility in the Corporation’s returns, including the
possibility of losses in some years.
In each of the areas of particular notional allocation for deployment:
emerging clean energy projects and businesses,
clean energy projects that improve the productivity and liveability of cities, and
clean energy projects and businesses that support delivery of the Government’s
Reef 2050 plan,
there is likely to be greater variability of earnings and less certainty when forecasting
as:
a) it may take longer than anticipated to scale up the portfolios with new
investments,
b) the size of individual investments may be smaller than is optimal resulting in a
lower net return with higher costs per transaction, and
c) it may require a larger than forecast use of (non-cash) concessionality in order
to incentivise a change from “business as usual”.
The budget and forecasts have been prepared on the basis of the best available
estimates as well as an assumption of stability in and continuity of the policy
environment.
The private sector has been able to refinance certain of the Corporation’s investments
once they have been de-risked and the commercial sector is able to confidently invest.
Given the current low interest rate environment in particular, there have been a
number of the Corporation’s investments that, for example having completed
construction, or obtained contractual certainty or operated successfully for a period,
are then sufficiently de-risked and able to be financed by the commercial banks. This
has resulted in some of the Corporation’s most profitable loans having been given up
to the private sector.

Clean Energy Finance Corporation Budget Statements
155
3.2 BUDGETED FINANCIAL STATEMENTS TABLES
Table 3.1: Comprehensive income statement (showing net cost of services) for the period ended 30 June
2016-17 Estimated
actual $'000
2017-18 Budget
$'000
2018-19 Forward estimate
$'000
2019-20 Forward estimate
$'000
2020-21 Forward estimate
$'000
EXPENSES
Employee benefits 22,097 29,321 33,536 37,593 41,078
Suppliers 7,555 9,866 10,092 10,561 11,083
Depreciation and amortisation 767 776 829 884 927
Write-down and impairment of assets 3,640 7,896 9,890 15,623 19,219
Losses from asset sales 92 - - - -
Concessional loan charges 19,549 27,800 29,000 30,500 31,500
Total expenses 53,700 75,659 83,347 95,161 103,807
LESS:
OWN-SOURCE INCOME
Own-source revenue
Interest and fees 52,796 72,326 82,153 106,318 136,667
Dividend and other equity distributions 3,263 9,003 9,461 10,310 10,610
Unwind of concessional loan discount 2,356 3,634 5,538 9,792 15,008
Total own-source revenue 58,415 84,963 97,152 126,420 162,285
Total own-source income 58,415 84,963 97,152 126,420 162,285
Net (cost of)/contribution by services 4,715 9,304 13,805 31,259 58,478
Surplus/(deficit) attributable to the Australian Government 4,715 9,304 13,805 31,259 58,478
OTHER COMPREHENSIVE INCOME
Changes in asset revaluation surplus (3,892) (626) (626) (627) (626)
Total other comprehensive income (3,892) (626) (626) (627) (626)
Total comprehensive income/(loss) 823 8,678 13,179 30,632 57,852
Total comprehensive income/(loss) attributable to the Australian Government 823 8,678 13,179 30,632 57,852

Clean Energy Finance Corporation Budget Statements
156
Table 3.1: Comprehensive income statement (showing net cost of services) for the period ended 30 June (continued)
Reconciliation of the impact of significant non-cash income and charges
2016-17 Estimated
actual $'000
2017-18 Budget
$'000
2018-19 Forward estimate
$'000
2019-20 Forward estimate
$'000
2020-21 Forward estimate
$'000
ADD SIGNIFICANT NON-CASH CHARGES
Concessional loan charge 19,549 27,800 29,000 30,500 31,500
Provision for asset impairment 3,640 7,896 9,890 15,623 19,219
Total significant non-cash charges 23,189 35,696 38,890 46,123 50,719
LESS SIGNIFICANT NON-CASH REVENUE
Unwind of concessional loan charge (2,356) (3,634) (5,538) (9,792) (15,008)
Changes in asset revaluation surplus 3,892 626 626 627 626
Total non-cash revenue 1,536 (3,008) (4,912) (9,165) (14,382)
Total comprehensive income attributable to the Australian Government after eliminating significant non-cash adjustments 25,548 41,366 47,157 67,590 94,189
Prepared on Australian Accounting Standards basis.

Clean Energy Finance Corporation Budget Statements
157
Table 3.2: Budgeted departmental balance sheet (as at 30 June)
2016-17 Estimated
actual $'000
2017-18 Budget
$'000
2018-19 Forward estimate
$'000
2019-20 Forward estimate
$'000
2020-21 Forward estimate
$'000
ASSETS
Financial assets
Cash and cash equivalents 300,733 300,128 302,456 304,302 300,305
Advances and loans 1,086,422 1,374,565 1,626,353 1,971,935 2,484,012
Available for sale financial assets 749,744 912,833 1,119,935 1,402,705 1,655,022
Interest and other receivables 4,300 2,331 2,417 2,417 2,147
Other investments 77,232 190,132 277,382 303,132 255,494
Total financial assets 2,218,431 2,779,989 3,328,543 3,984,491 4,696,980
Non-financial assets
Property, plant and equipment 954 1,083 1,189 1,270 1,338
Intangibles 324 424 494 544 585
Other non-financial assets 562 562 562 562 562
Total non-financial assets 1,840 2,069 2,245 2,376 2,485
Total assets 2,220,271 2,782,058 3,330,788 3,986,867 4,699,465
LIABILITIES
Payables
Suppliers 1,533 1,534 1,532 1,532 1,531
Unearned income 12,227 14,421 18,912 23,175 26,632
Other payables 497 497 497 497 497
Total payables 14,257 16,452 20,941 25,204 28,660
Provisions
Employee provisions 5,403 6,317 7,379 8,563 9,853
Provision for impairment on irrevocable undrawn commitments 528 528 528 528 528
Provision for restoration 129 129 129 129 129
Total provisions 6,060 6,974 8,036 9,220 10,510
Total liabilities 20,317 23,426 28,977 34,424 39,170
Net assets 2,199,954 2,758,632 3,301,811 3,952,443 4,660,295
EQUITY*
Parent entity interest
Contributed equity 2,108,363 2,658,363 3,188,363 3,808,363 4,458,363
Reserves 3,131 2,505 1,879 1,252 626 Retained surplus (accumulated
deficit) 88,460 97,764 111,569 142,828 201,306
Total parent entity interest 2,199,954 2,758,632 3,301,811 3,952,443 4,660,295
Total equity 2,199,954 2,758,632 3,301,811 3,952,443 4,660,295
Prepared on Australian Accounting Standards basis.
*Equity is the residual interest in assets after the deduction of liabilities.

Clean Energy Finance Corporation Budget Statements
158
Table 3.3: Departmental statement of changes in equity — summary of movement (Budget year 2017-18)
Retained earnings
$'000
Asset revaluation
reserve $'000
Contributed equity/ capital $'000
Total equity
$'000
Opening balance as at 1 July 2017 Balance carried forward from previous period 88,460 3,131 2,108,363 2,199,954
Adjusted opening balance 88,460 3,131 2,108,363 2,199,954
Comprehensive income Other comprehensive income - (626) - (626)
Surplus/(deficit) for the period 9,304 - - 9,304
Total comprehensive income 9,304 (626) - 8,678
of which: Attributable to the Australian Government 9,304 (626) - 8,678
Transactions with owners
Contributions by owners Equity injection - - 550,000 550,000
Sub-total transactions with owners - - 550,000 550,000
Estimated closing balance as at 30 June 2018 97,764 2,505 2,658,363 2,758,632
Closing balance attributable to the Australian Government 97,764 2,505 2,658,363 2,758,632
Prepared on Australian Accounting Standards basis.

Clean Energy Finance Corporation Budget Statements
159
Table 3.4: Budgeted departmental statement of cash flows (for the period ended 30 June)
2016-17 Estimated
actual $'000
2017-18 Budget
$'000
2018-19 Forward estimate
$'000
2019-20 Forward estimate
$'000
2020-21 Forward estimate
$'000
OPERATING ACTIVITIES
Cash received
Interest and fees 58,413 75,296 86,224 110,324 140,318 Dividends and other equity distributions 3,244 9,003 9,460 10,310 10,610
Total cash received 61,657 84,299 95,684 120,634 150,928
Cash used
Employees 21,921 28,406 32,475 36,409 39,789
Suppliers 7,357 9,866 10,092 10,562 11,083
Total cash used 29,278 38,272 42,567 46,971 50,872
Net cash from/(used by) operating activities 32,379 46,027 53,117 73,663 100,056
INVESTING ACTIVITIES
Cash received
Loans and advances 79,781 179,612 196,604 192,981 309,148
Sale of investments 51,713 12,622 45,605 93,230 222,265
Other investing activities 284,200 295,098 143,712 150,000 169,400
Total cash received 415,694 487,332 385,921 436,211 700,813
Cash used
Purchase of property, plant and
equipment and intangibles 515 1,005 1,005 1,015 1,036
Loans and advances 524,020 643,122 475,129 572,888 873,372
Purchase of Investments 606,905 289,837 340,583 404,125 430,458
Other investing activities 248,678 150,000 149,993 150,000 150,000
Total cash used 1,380,118 1,083,964 966,710 1,128,028 1,454,866
Net cash from/(used by) investing activities (964,424) (596,632) (580,789) (691,817) (754,053)
FINANCING ACTIVITIES
Cash received
Contributed equity 1,000,000 550,000 530,000 620,000 650,000
Total cash received 1,000,000 550,000 530,000 620,000 650,000
Net cash from/(used by) financing activities 1,000,000 550,000 530,000 620,000 650,000
Net increase/(decrease) in cash held 67,955 (605) 2,328 1,846 (3,997)
Cash and cash equivalents at the beginning of the reporting period 232,778 300,733 300,128 302,456 304,302
Cash and cash equivalents at the end of the reporting period 300,733 300,128 302,456 304,302 300,305
Prepared on Australian Accounting Standards basis.

Clean Energy Finance Corporation Budget Statements
160
Table 3.5: Departmental capital budget statement (for the period ended 30 June)
2016-17 Estimated
actual $'000
2017-18 Budget
$'000
2018-19 Forward estimate
$'000
2019-20 Forward estimate
$'000
2020-21 Forward estimate
$'000
PURCHASE OF NON-FINANCIAL ASSETS
Funded internally from departmental resources 515 1,005 1,005 1,015 1,036
TOTAL 515 1,005 1,005 1,015 1,036
RECONCILIATION OF CASH USED TO ACQUIRE ASSETS TO ASSET MOVEMENT TABLE
Total purchases 515 1,005 1,005 1,015 1,036
Total cash used to acquire assets 515 1,005 1,005 1,015 1,036
Prepared on Australian Accounting Standards basis.

Clean Energy Finance Corporation Budget Statements
161
Table 3.6: Statement of departmental asset movements (Budget year 2017-18)
Other property, plant and
equipment $'000
Computer software and
intangibles $'000
Total
$'000
As at 1 July 2017 Gross book value 2,578 986 3,564
Accumulated depreciation (1,624) (662) (2,286)
Opening net book balance 954 324 1,278
Capital asset additions Estimated expenditure on new
or replacement assets By purchase - other 500 505 1,005
Total additions 500 505 1,005
Other movements
Depreciation/amortisation expense (371) (405) (776)
Total other movements (371) (405) (776)
As at 30 June 2018 Gross book value 3,078 1,491 4,569
Accumulated depreciation/ amortisation and impairment (1,995) (1,067) (3,062)
Closing net book balance 1,083 424 1,507
Prepared on Australian Accounting Standards basis.


163
CLEAN ENERGY REGULATOR
ENTITY RESOURCES AND PLANNED
PERFORMANCE


165
CLEAN ENERGY REGULATOR
SECTION 1: ENTITY OVERVIEW AND RESOURCES ............................................. 167
1.1 Strategic direction statement ........................................................................ 167
1.2 Entity resource statement ............................................................................. 169
1.3 Budget measures .......................................................................................... 171
SECTION 2: OUTCOMES AND PLANNED PERFORMANCE ................................. 172
2.1 Budgeted expenses and performance for Outcome 1 .................................. 173
SECTION 3: BUDGETED FINANCIAL STATEMENTS ............................................. 178
3.1 Budgeted financial statements...................................................................... 178
3.2 Budgeted financial statements tables ........................................................... 179


167
CLEAN ENERGY REGULATOR
Section 1: Entity overview and resources
1.1 STRATEGIC DIRECTION STATEMENT
The Clean Energy Regulator is a Non-corporate Commonwealth Entity established
under the Clean Energy Regulator Act 2011. The Clean Energy Regulator is responsible
for the Outcome:
Contribute to a reduction in Australia's net greenhouse gas emissions, including
through the administration of market based mechanisms that incentivise reduction
in emissions and the promotion of additional renewable electricity generation.
The following schemes administered by the Clean Energy Regulator work together to
provide economic incentives, backed up by robust data, to reduce greenhouse gas
emissions and increase the use of renewable energy to achieve the agency’s purpose of
‘accelerating carbon abatement for Australia.’ In administering its schemes, the Clean
Energy Regulator is actively supporting the Australian Government’s commitment to
addressing climate change while maintaining energy security and affordability.
The Emissions Reduction Fund, established under the Carbon Credits
(Carbon Farming Initiative) Act 2011, provides incentives for a range of
organisations and individuals to adopt new practices and technologies to
reduce their emissions. The safeguard mechanism ensures that emissions
reductions purchased by the Government are not offset by significant
increases in emissions above business-as-usual levels elsewhere in the
economy.
The National Greenhouse and Energy Reporting Scheme, established by
the National Greenhouse and Energy Reporting Act 2007, is a single national
framework for reporting and disseminating company information about
greenhouse gas emissions, energy production, energy consumption and
other information specified under the legislation.
The Renewable Energy Target, established by the Renewable Energy
(Electricity) Act 2000, encourages the additional generation of electricity
from renewable sources, reduces emissions of greenhouse gases in the
electricity sector and ensures that renewable energy sources are
ecologically sustainable.

Clean Energy Regulator Budget Statements
168
The Australian National Registry of Emissions Units, established by the
Australian National Registry of Emissions Units Act 2011, is a secure electronic
registry system that tracks the location and ownership of units issued
under the Kyoto Protocol and the Emissions Reduction Fund.
The Clean Energy Regulator’s strategies for delivering this outcome and achieving its
purpose are to:
Invest in knowing our clients and communicating with them in a way
which meets their needs. Use client education and guidance materials to
help potential clients understand how to participate in and comply with
our schemes. Use targeted enforcements to act as a deterrent to non-
compliance. Ensure our activities assist our clients to decide whether to
participate in our schemes based on their own assessment of whether they
have adequate capacity and capability to meet the requirements and
achieve the anticipated results.
Use risk-based and continuous improvement approaches to deploy agency
resources to best effect. Maintain and enhance the skills and expertise of
our people and encourage innovation.
Build and sustain the Clean Energy Regulator’s reputation and impact
through sound stakeholder and client relationships and partnerships with
other relevant institutions and regulatory bodies. Promote the value of our
assets, the quality of our results, the strength of our capabilities and the
importance of our data.
Ensure our regulatory infrastructure is reliable, resilient and able to be
reused in response to policy change. Protect the integrity and utility of the
core elements of our schemes, including greenhouse and energy data,
contracts, units and certificates.
Further information on the Clean Energy Regulator’s objectives, annual priorities and
key performance indicators is detailed in the Clean Energy Regulator Corporate Plan
on the Regulator’s website at www.cleanenergyregulator.gov.au.

Clean Energy Regulator Budget Statements
169
1.2 ENTITY RESOURCE STATEMENT
Table 1.1 shows the total funding from all sources available to the entity for its
operations and to deliver programs and services on behalf of the Government.
The table summarises how resources will be applied by outcome (government strategic
policy objectives) and by administered (on behalf of the Government or the public) and
departmental (for the entity’s operations) classification.
For more detailed information on special accounts and special appropriations, please
refer to Budget Paper No. 4 – Agency Resourcing.
Information in this table is presented on a resourcing (that is, appropriations/cash
available) basis, whilst the ‘Budgeted expenses by Outcome’ tables in Section 2 and the
financial statements in Section 3 are presented on an accrual basis.

Clean Energy Regulator Budget Statements
170
Table 1.1: Clean Energy Regulator resource statement — Budget estimates for 2017-18 as at Budget May 2017
2016-17 Estimated
actual $'000
2017-18 Estimate
$'000
Departmental
Annual appropriations - ordinary annual services (a) Prior year appropriations available (b) 18,367 16,789
Departmental appropriation (c) 70,974 69,969
Departmental capital budget (d) 1,183 1,167
Annual appropriations - other services - non-operating (e)
Prior year appropriations available (b) 1,500 -
Equity injection 150 -
Total departmental annual appropriations 92,174 87,925
Total departmental resourcing 92,174 87,925
Administered
Annual appropriations - ordinary annual services (a)
Prior year appropriations available (b) 38,233 30
Outcome 1 191,011 218,662
Total administered annual appropriations 229,244 218,692
Total administered special appropriations (f) 14,184 291
Special accounts (f) Opening balance 77,388 77,388 Non-appropriation receipts 623,000 560,000
Total special account receipts 700,388 637,388
Total administered resourcing 943,816 856,371
Total resourcing for Clean Energy Regulator 1,035,990 944,296
2016-17 2017-18
Average staffing level (number) 324 323
Prepared on a resourcing (i.e. appropriations available) basis.
Please note: All figures shown above are GST exclusive - these may not match figures in the cash flow statement.
(a) Appropriation Bill (No. 1) 2017-18.
(b) Excludes $6.596 million subject to administrative quarantine by Finance or withheld under section 51 of the Public Governance, Performance and Accountability Act 2013 (PGPA Act)
(c) Excludes departmental capital budget (DCB).
(d) Departmental capital budgets are not separately identified in Appropriation Bill (No.1) and form part of ordinary annual services items. Please refer to Table 3.5 for further details. For accounting purposes, this amount has been designated as a 'contribution by owner'.
(e) Appropriation Bill (No. 2) 2017-18.
(f) For further information on special appropriations and special accounts, please refer to Budget Paper No. 4 - Agency Resourcing. Please also see Table 2.1 for further information on outcome and program expenses broken down by various funding sources, e.g. annual appropriations, special appropriations and special accounts.

Clean Energy Regulator Budget Statements
171
1.3 BUDGET MEASURES
There are no 2017-18 Budget measures relating to the Clean Energy Regulator.

Clean Energy Regulator Budget Statements
172
Section 2: Outcomes and planned performance
Government outcomes are the intended results, impacts or consequences of actions by
the Government on the Australian community. Commonwealth programs are the
primary vehicle by which government entities achieve the intended results of their
outcome statements. Entities are required to identify the programs which contribute to
government outcomes over the Budget and forward years.
Each outcome is described below together with its related programs. The following
provides detailed information on expenses for each outcome and program, further
broken down by funding source.
Note:
Performance reporting requirements in the Portfolio Budget Statements are part of the
enhanced Commonwealth performance framework established by the Public
Governance, Performance and Accountability Act 2013. It is anticipated that the
performance criteria described in Portfolio Budget Statements will be read with
broader information provided in an entity’s corporate plans and annual performance
statements – included in Annual Reports - to provide an entity’s complete performance
story.
The most recent corporate plan for the Clean Energy Regulator can be found at:
www.cleanenergyregulator.gov.au/About/Accountability-and-reporting/Corporate-
plans.
The most recent annual performance statement can be found at:
www.cleanenergyregulator.gov.au/About/Accountability-and-reporting/Annual-
Reports.

Clean Energy Regulator Budget Statements
173
2.1 BUDGETED EXPENSES AND PERFORMANCE FOR OUTCOME 1
Outcome 1: Contribute to a reduction in Australia's net greenhouse gas emissions, including through the administration of market based mechanisms that incentivise reduction in emissions and the promotion of additional renewable electricity generation.
Linked programs
Department of the Environment and Energy
Programs
Program 2.1 – Reducing Australia’s Greenhouse Gas Emissions
Program 4.1 – Energy
Contribution to Outcome 1 made by linked programs
The Department of the Environment and Energy has policy responsibility for the Emissions Reduction Fund and the Renewable Energy Target. The Clean Energy Regulator works collaboratively with the Department as the delivery agency and regulator for these schemes. The Department is responsible for energy policy and the Clean Energy Regulator works collaboratively with the Department to understand the impacts of its regulatory activity on the market.

Clean Energy Regulator Budget Statements
174
Budgeted expenses for Outcome 1
This table shows how much the entity intends to spend (on an accrual basis) on
achieving the outcome, broken down by program, as well as by Administered and
Departmental funding sources.
Table 2.1.1: Budgeted expenses for Outcome 1
Outcome 1: Contribute to a reduction in Australia's net greenhouse gas emissions, including through the administration of market based mechanisms that incentivise reduction in emissions and the promotion of additional renewable electricity generation.
2016-17 Estimated
actual $'000
2017-18 Budget
$'000
2018-19 Forward estimate
$'000
2019-20 Forward estimate
$'000
2020-21 Forward estimate
$'000
Program 1.1: Clean Energy Regulator
Administered expenses Ordinary annual services
(Appropriation Bill No. 1) (a) 191,011 218,662 214,225 228,226 247,854
Special appropriations
Public Governance,
Performance & Accountability Act 2013 2,935 - - - -
Renewable Energy (Electricity) Act 2000 262 291 330 402 442
Clean Energy Act 2011 10,987 - - - -
Administered total 205,195 218,953 214,555 228,628 248,296
Departmental expenses
Departmental appropriation 70,974 69,969 69,811 70,093 70,415
Expenses not requiring appropriation in the Budget year (b) 13,714 8,289 6,391 4,266 3,764
Departmental total 84,688 78,258 76,202 74,359 74,179
Total expenses for program 1.1 289,883 297,211 290,757 302,987 322,475
Outcome 1 Totals by appropriation type
Administered expenses
Ordinary annual services (Appropriation Bill No. 1) (a) 191,011 218,662 214,225 228,226 247,854 Special appropriations 14,184 291 330 402 442
Administered total 205,195 218,953 214,555 228,628 248,296
Departmental expenses
Departmental appropriation 70,974 69,969 69,811 70,093 70,415
Expenses not requiring appropriation in the Budget year (b) 13,714 8,289 6,391 4,266 3,764
Departmental total 84,688 78,258 76,202 74,359 74,179
Total expenses for Outcome 1 289,883 297,211 290,757 302,987 322,475

Clean Energy Regulator Budget Statements
175
Table 2.1.1: Budgeted expenses for Outcome 1 (continued)
Movement of administered funds between years (c)
2016-17 Estimated
actual $'000
2017-18 Budget
$'000
2018-19 Forward estimate
$'000
2019-20 Forward estimate
$'000
2020-21 Forward estimate
$'000
Outcome 1:
Program 1.1: Clean Energy
Regulator (88,394) (45,182) (53,487) (40,565) (18,303)
Total movement of administered funds (88,394) (45,182) (53,487) (40,565) (18,303)
2016-17 2017-18
Average staffing level (number) 324 323
(a) This includes funding for the Emissions Reduction Fund. Following a number of Emissions
Reduction Fund auctions and the significant volume of contracts that have been entered into, there has been a movement of funds between years to better reflect known and anticipated Emissions Reduction Fund contractual commitments across the forward estimates. This has not change the total appropriation of $2.55 billion. The Clean Energy Regulator is able to commit the full level of remaining uncontracted funds at any time.
(b) Expenses not requiring appropriation in the Budget year are made up of depreciation expenses, amortisation expenses, make good expenses, and audit fees.
(c) Figures displayed in brackets represent a decrease in funds.
Note: Departmental appropriation splits and totals are indicative estimates and may change in the course of the budget year as government priorities change.

Clean Energy Regulator Budget Statements
176
Table 2.1.2: Performance criteria for Outcome 1
Table 2.1.2 below details the performance criteria for each program associated with
Outcome 1. It summarises how each program is delivered and where 2017-18 Budget
measures have created new programs or materially changed existing programs.
Outcome 1 – Contribute to a reduction in Australia's net greenhouse gas emissions, including through the administration of market based mechanisms that incentivise reduction in emissions and the promotion of additional renewable electricity generation.
Program 1.1 – Effective and efficient regulation of greenhouse and energy reporting and market based schemes that contribute to a reduction in Australia’s net greenhouse gas emissions and promote investment in renewable energy.
Delivery The Clean Energy Regulator delivers Program 1.1 by:
administering our schemes including the Emissions Reduction Fund, the Renewable Energy Target and the National Greenhouse and Energy Reporting Scheme
collecting, analysing, assessing and publishing emissions and energy data, to inform government policy and the Australian public, and support Australia’s emissions and energy data needs including data and registries to meet international reporting commitments
operating the Australian National Registry of Emissions Units and the Renewable Energy Certificate Registry for market participants, and manage the Emissions and Energy Reporting System
monitoring, facilitating and enforcing compliance by its clients for the schemes it administers
issuing Australian carbon credit units to organisations and individuals for approved projects that reduce greenhouse gas emissions
conducting auctions and managing contracts
accrediting greenhouse and energy auditors to undertake audit activities under its schemes
working with other Commonwealth, state and territory law enforcement and regulatory bodies
providing education and information to current and potential scheme participants on the schemes it administers and how they work.
Performance information
Year Performance criteria (a) Targets
2016-17 Proportion of contracted abatement delivered.
Expected achievement against criterion:
The delivery of abatement contracted through the Emissions Reduction Fund results in emissions reductions and contributes to meeting Australia’s emissions reduction targets.
On track.
Against a target of: ≥ 80% of contracted abatement is delivered on time.

Clean Energy Regulator Budget Statements
177
Program 1.1 – Effective and efficient regulation of greenhouse and energy reporting and market based schemes that contribute to a reduction in Australia’s net greenhouse gas emissions and promote investment in renewable energy.
Year Performance criteria (a) Targets
Compliance levels by regulated and liable entities.
Expected achievement against criterion:
Regulated entities comply with the National Greenhouse and Energy Reporting Scheme by reporting emissions and energy data which underpins the reduction of net greenhouse gas emissions and supports Australia’s emissions and energy data needs. Liable entities support achieving the Renewable Energy Target through compliance with their obligations by surrendering renewable energy certificates, which represent the generation of renewable energy.
On track.
Against a target of: ≥ 95% of regulated entities are materially compliant with their statutory obligations.
2017-18 Proportion of contracted abatement delivered. ≥ 80% of contracted abatement is delivered on time.
Compliance levels by regulated entities. ≥ 95% of regulated entities are materially compliant with their statutory obligations.
2018–19 and beyond
As for 2017–18. As for 2017–18.
Purposes Accelerating carbon abatement for Australia.
(a) Performance criteria for Outcome 1 are derived from the key performance indicators identified in the Clean Energy Regulator Corporate Plan 2016–20.

Clean Energy Regulator Budget Statements
178
Section 3: Budgeted financial statements
Section 3 presents budgeted financial statements which provide a comprehensive
snapshot of entity finances for the 2017-18 budget year, including the impact of budget
measures and resourcing on financial statements.
3.1 BUDGETED FINANCIAL STATEMENTS
3.1.1 Differences between entity resourcing and financial statements
The Clean Energy Regulator has no significant differences between the resource
information presented in the Budget Papers and the Portfolio Budget Statements.
3.1.2 Explanatory notes and analysis of budgeted financial statements
The Clean Energy Regulator is budgeting to incur departmental expenses of $78.3 million in 2017-18.
The Clean Energy Regulator is budgeting for a break-even position in 2017-18, excluding non-appropriated expenses relating to depreciation and amortisation.
3.1.3 Movement of Funds
The Clean Energy Regulator received approval for a movement of administered funds
related to the Emissions Reduction Fund. The movement of funds was requested to
better reflect known and anticipated Emissions Reduction Fund contractual
commitments across the forward estimates. The movement of administered funds has
not changed the total appropriation of $2.55 billion or the ability of the Clean Energy
Regulator to commit remaining uncontracted funds at any time.
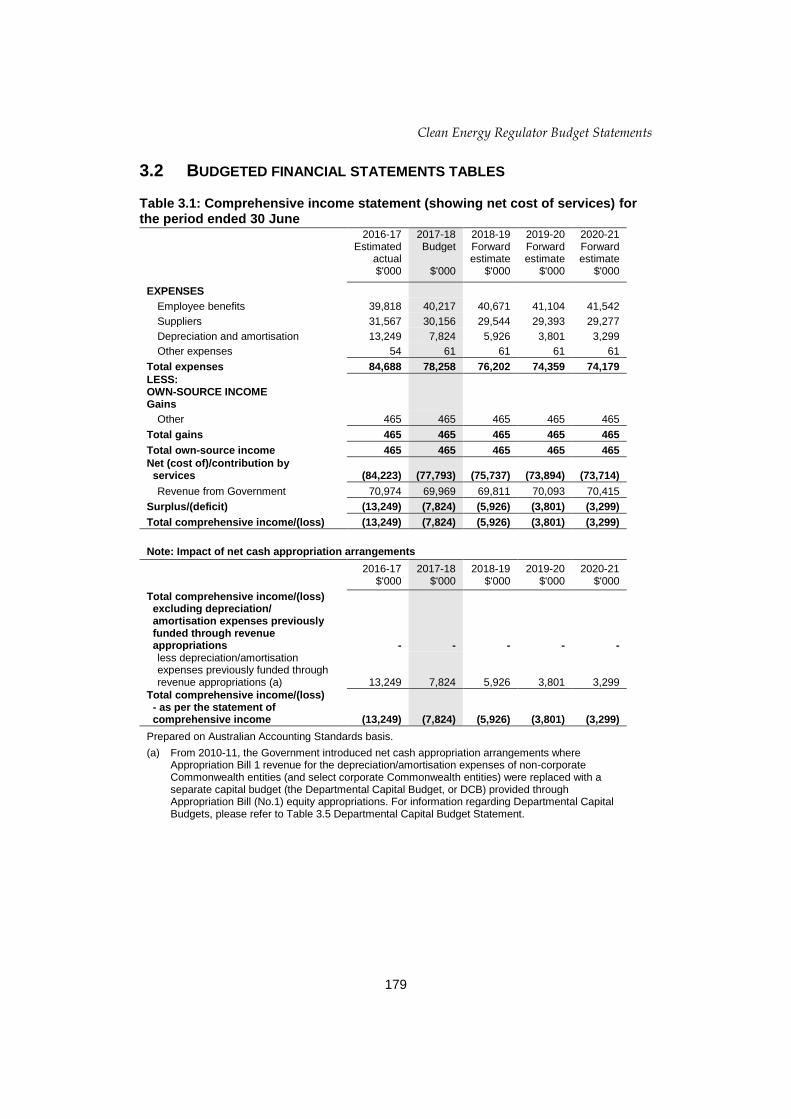
Clean Energy Regulator Budget Statements
179
3.2 BUDGETED FINANCIAL STATEMENTS TABLES
Table 3.1: Comprehensive income statement (showing net cost of services) for the period ended 30 June
2016-17 Estimated
actual $'000
2017-18 Budget
$'000
2018-19 Forward estimate
$'000
2019-20 Forward estimate
$'000
2020-21 Forward estimate
$'000
EXPENSES
Employee benefits 39,818 40,217 40,671 41,104 41,542
Suppliers 31,567 30,156 29,544 29,393 29,277
Depreciation and amortisation 13,249 7,824 5,926 3,801 3,299
Other expenses 54 61 61 61 61
Total expenses 84,688 78,258 76,202 74,359 74,179
LESS: OWN-SOURCE INCOME Gains
Other 465 465 465 465 465
Total gains 465 465 465 465 465
Total own-source income 465 465 465 465 465
Net (cost of)/contribution by services (84,223) (77,793) (75,737) (73,894) (73,714)
Revenue from Government 70,974 69,969 69,811 70,093 70,415
Surplus/(deficit) (13,249) (7,824) (5,926) (3,801) (3,299)
Total comprehensive income/(loss) (13,249) (7,824) (5,926) (3,801) (3,299)
Note: Impact of net cash appropriation arrangements
2016-17 $'000
2017-18 $'000
2018-19 $'000
2019-20 $'000
2020-21 $'000
Total comprehensive income/(loss) excluding depreciation/ amortisation expenses previously funded through revenue appropriations - - - - -
less depreciation/amortisation expenses previously funded through revenue appropriations (a) 13,249 7,824 5,926 3,801 3,299
Total comprehensive income/(loss) - as per the statement of comprehensive income (13,249) (7,824) (5,926) (3,801) (3,299)
Prepared on Australian Accounting Standards basis.
(a) From 2010-11, the Government introduced net cash appropriation arrangements where Appropriation Bill 1 revenue for the depreciation/amortisation expenses of non-corporate Commonwealth entities (and select corporate Commonwealth entities) were replaced with a separate capital budget (the Departmental Capital Budget, or DCB) provided through Appropriation Bill (No.1) equity appropriations. For information regarding Departmental Capital Budgets, please refer to Table 3.5 Departmental Capital Budget Statement.

Clean Energy Regulator Budget Statements
180
Table 3.2: Budgeted departmental balance sheet (as at 30 June)
2016-17 Estimated
actual $'000
2017-18 Budget
$'000
2018-19 Forward estimate
$'000
2019-20 Forward estimate
$'000
2020-21 Forward estimate
$'000
ASSETS
Financial assets
Cash and cash equivalents 282 282 282 282 282
Trade and other receivables 23,952 24,589 25,244 25,244 25,244
Total financial assets 24,234 24,871 25,526 25,526 25,526
Non-financial assets
Land and buildings 3,000 2,400 1,800 1,200 600
Property, plant and equipment 1,423 1,203 993 885 794
Intangibles 13,257 7,420 3,464 1,532 90
Other non-financial assets 1,130 1,130 1,130 1,130 1,130
Total non-financial assets 18,810 12,153 7,387 4,747 2,614
Total assets 43,044 37,024 32,913 30,273 28,140
LIABILITIES
Payables
Suppliers 4,943 4,936 4,929 4,868 4,807
Total payables 4,943 4,936 4,929 4,868 4,807
Provisions
Employee provisions 12,177 12,760 13,361 13,361 13,361
Other provisions 1,890 1,951 2,012 2,073 2,134
Total provisions 14,067 14,711 15,373 15,434 15,495
Total liabilities 19,010 19,647 20,302 20,302 20,302
Net assets 24,034 17,377 12,611 9,971 7,838
EQUITY*
Parent entity interest
Contributed equity 85,058 86,225 87,385 88,546 89,712
Reserves 7,078 7,078 7,078 7,078 7,078 Retained surplus (accumulated deficit) (68,102) (75,926) (81,852) (85,653) (88,952)
Total parent entity interest 24,034 17,377 12,611 9,971 7,838
Total equity 24,034 17,377 12,611 9,971 7,838
Prepared on Australian Accounting Standards basis.
*Equity is the residual interest in assets after the deduction of liabilities.

Clean Energy Regulator Budget Statements
181
Table 3.3: Departmental statement of changes in equity — summary of movement (Budget year 2017-18)
Retained earnings
$'000
Asset revaluation
reserve $'000
Contributed equity/ capital $'000
Total equity
$'000
Opening balance as at 1 July 2017 Balance carried forward from previous period (68,102) 7,078 85,058 24,034
Adjusted opening balance (68,102) 7,078 85,058 24,034
Comprehensive income Surplus/(deficit) for the period (7,824) - - (7,824)
Total comprehensive income (7,824) - - (7,824)
Transactions with owners Contributions by owners Departmental capital budget (DCB) - - 1,167 1,167
Sub-total transactions with owners - - 1,167 1,167
Estimated closing balance as at 30 June 2018 (75,926) 7,078 86,225 17,377
Closing balance attributable to the Australian Government (75,926) 7,078 86,225 17,377
Prepared on Australian Accounting Standards basis.

Clean Energy Regulator Budget Statements
182
Table 3.4: Budgeted departmental statement of cash flows (for the period ended 30 June)
2016-17 Estimated
actual $'000
2017-18 Budget
$'000
2018-19 Forward estimate
$'000
2019-20 Forward estimate
$'000
2020-21 Forward estimate
$'000
OPERATING ACTIVITIES
Cash received
Appropriations 70,494 69,260 69,156 70,290 70,415
Total cash received 70,494 69,260 69,156 70,290 70,415
Cash used
Employees 39,234 39,580 40,016 41,304 41,542
Suppliers 31,260 29,680 29,140 28,986 28,873
Total cash used 70,494 69,260 69,156 70,290 70,415
Net cash from/(used by) operating activities - - - - -
INVESTING ACTIVITIES
Cash used
Purchase of property, plant and equipment and intangibles 2,833 1,167 1,160 1,161 1,166
Total cash used 2,833 1,167 1,160 1,161 1,166
Net cash from/(used by) investing activities (2,833) (1,167) (1,160) (1,161) (1,166)
FINANCING ACTIVITIES
Cash received
Contributed equity 2,833 1,167 1,160 1,161 1,166
Total cash received 2,833 1,167 1,160 1,161 1,166
Net cash from/(used by) financing activities 2,833 1,167 1,160 1,161 1,166
Net increase/(decrease) in cash held - - - - -
Cash and cash equivalents at the beginning of the reporting period 282 282 282 282 282
Cash and cash equivalents at the end of the reporting period 282 282 282 282 282
Prepared on Australian Accounting Standards basis.

Clean Energy Regulator Budget Statements
183
Table 3.5: Departmental capital budget statement (for the period ended 30 June)
2016-17 Estimated
actual $'000
2017-18 Budget
$'000
2018-19 Forward estimate
$'000
2019-20 Forward estimate
$'000
2020-21 Forward estimate
$'000
NEW CAPITAL APPROPRIATIONS
Capital budget - Bill 1 (DCB) 1,183 1,167 1,160 1,161 1,166
Equity injections - Bill 2 150 - - - -
Total new capital appropriations 1,333 1,167 1,160 1,161 1,166
Provided for:
Purchase of non-financial assets 1,333 1,167 1,160 1,161 1,166
Total items 1,333 1,167 1,160 1,161 1,166
PURCHASE OF NON-FINANCIAL ASSETS
Funded by capital appropriations (a) 1,650 - - - - Funded by capital appropriation DCB (b) 1,183 1,167 1,160 1,161 1,166
TOTAL 2,833 1,167 1,160 1,161 1,166
RECONCILIATION OF CASH USED TO ACQUIRE ASSETS TO ASSET MOVEMENT TABLE
Total purchases 2,833 1,167 1,160 1,161 1,166
Total cash used to acquire assets 2,833 1,167 1,160 1,161 1,166
Prepared on Australian Accounting Standards basis.
(a) Includes both current Appropriation Bill (No. 2) and prior Appropriation Act (No. 2) appropriations.
(b) Includes purchases from current and previous years' Departmental Capital Budgets (DCBs).

Clean Energy Regulator Budget Statements
184
Table 3.6: Statement of departmental asset movements (Budget year 2017-18)
Buildings
$'000
Other property, plant and
equipment $'000
Computer software
and intangibles
$'000
Total
$'000
As at 1 July 2017 Gross book value 9,743 2,362 57,976 70,081
Accumulated depreciation/ amortisation and impairment (6,743) (939) (44,719) (52,401)
Opening net book balance 3,000 1,423 13,257 17,680
Capital asset additions Estimated expenditure on new
or replacement assets By purchase - appropriation ordinary
annual services (a) - - 1,167 1,167
Total additions - - 1,167 1,167
Other movements
Depreciation/amortisation expense (600) (220) (7,004) (7,824)
Total other movements (600) (220) (7,004) (7,824)
As at 30 June 2018 Gross book value 9,743 2,362 59,143 71,248
Accumulated depreciation/ amortisation and impairment (7,343) (1,159) (51,723) (60,225)
Closing net book balance 2,400 1,203 7,420 11,023
Prepared on Australian Accounting Standards basis.
(a) 'Appropriation ordinary annual services' refers to funding provided through Appropriation Bill (No.1) 2017-18 for depreciation/amortisation expenses, Departmental Capital Budgets or other operational expenses.

Clean Energy Regulator Budget Statements
185
Table 3.7: Schedule of budgeted income and expenses administered on behalf of Government (for the period ended 30 June)
2016-17 Estimated
actual $'000
2017-18 Budget
$'000
2018-19 Forward estimate
$'000
2019-20 Forward estimate
$'000
2020-21 Forward estimate
$'000
EXPENSES
Suppliers 4,079 4,108 4,148 4,219 4,259
Other expenses 201,116 214,845 210,407 224,409 244,037
Total expenses administered on behalf of Government 205,195 218,953 214,555 228,628 248,296
LESS:
OWN-SOURCE INCOME
Own-source revenue
Taxation revenue
Other taxes 143,883 607 664 706 749
Total taxation revenue 143,883 607 664 706 749
Non-taxation revenue
Sale of goods and rendering of
services 12,436 12,122 12,430 12,862 13,148
Total non-taxation revenue 12,436 12,122 12,430 12,862 13,148
Total own-source revenue administered on behalf of Government 156,319 12,729 13,094 13,568 13,897
Net (cost of)/contribution by services (48,876) (206,224) (201,461) (215,060) (234,399)
Total comprehensive income/(loss) (48,876) (206,224) (201,461) (215,060) (234,399)
Prepared on Australian Accounting Standards basis.

Clean Energy Regulator Budget Statements
186
Table 3.8: Schedule of budgeted assets and liabilities administered on behalf of Government (as at 30 June)
2016-17 Estimated
actual $'000
2017-18 Budget
$'000
2018-19 Forward estimate
$'000
2019-20 Forward estimate
$'000
2020-21 Forward estimate
$'000
ASSETS
Financial assets
Cash and cash equivalents 85,416 85,416 85,416 85,416 85,416
Trade and other receivables 5,045 5,045 5,045 5,045 5,045
Total financial assets 90,461 90,461 90,461 90,461 90,461
Total assets administered on behalf of Government 90,461 90,461 90,461 90,461 90,461
LIABILITIES
Payables
Suppliers 3,050 3,050 3,050 3,050 3,050
Other payables 111,538 111,538 111,539 111,539 111,539
Total payables 114,588 114,588 114,589 114,589 114,589
Total liabilities administered on behalf of Government 114,588 114,588 114,589 114,589 114,589
Net assets/(liabilities) (24,127) (24,127) (24,128) (24,128) (24,128)
Prepared on Australian Accounting Standards basis.

Clean Energy Regulator Budget Statements
187
Table 3.9: Schedule of budgeted administered cash flows (for the period ended 30 June)
2016-17 Estimated
actual $'000
2017-18 Budget
$'000
2018-19 Forward estimate
$'000
2019-20 Forward estimate
$'000
2020-21 Forward estimate
$'000
OPERATING ACTIVITIES
Cash received
Sales of goods and rendering of services 11,732 12,332 12,632 13,064 13,148
Taxes 144,696 607 664 706 749
Total cash received 156,428 12,939 13,296 13,770 13,897
Cash used
Suppliers 4,341 4,399 4,479 4,621 4,259
Other 200,854 214,554 210,075 224,007 244,037
Total cash used 205,195 218,953 214,554 228,628 248,296
Net cash from/(used by) operating activities (48,767) (206,014) (201,258) (214,858) (234,399)
FINANCING ACTIVITIES
Cash received
Special Account 623,000 560,000 560,000 560,000 560,000
Total cash received 623,000 560,000 560,000 560,000 560,000
Cash used
Special Account 623,000 560,000 560,000 560,000 560,000
Total cash used 623,000 560,000 560,000 560,000 560,000
Net cash from/(used by) financing activities - - - - -
Net increase/(decrease) in cash held (48,767) (206,014) (201,258) (214,858) (234,399)
Cash and cash equivalents at beginning of reporting period 85,416 85,416 85,416 85,416 85,416
Cash from Official Public Account for:
- Appropriations 204,930 218,953 214,554 228,628 248,296
Total cash from Official Public Account 204,930 218,953 214,554 228,628 248,296
Cash to Official Public Account for: - Appropriations (156,163) (12,939) (13,296) (13,770) (13,897)
Total cash to Official Public Account (156,163) (12,939) (13,296) (13,770) (13,897)
Cash and cash equivalents at end of reporting period 85,416 85,416 85,416 85,416 85,416
Prepared on Australian Accounting Standards basis.


189
CLIMATE CHANGE AUTHORITY
ENTITY RESOURCES AND PLANNED
PERFORMANCE


191
CLIMATE CHANGE AUTHORITY
SECTION 1: ENTITY OVERVIEW AND RESOURCES ............................................. 193
1.1 Strategic direction statement ........................................................................ 193
1.2 Entity resource statement ............................................................................. 194
1.3 Budget measures .......................................................................................... 196
SECTION 2: OUTCOMES AND PLANNED PERFORMANCE ................................. 197
2.1 Budgeted expenses and performance for Outcome 1 .................................. 198
SECTION 3: BUDGETED FINANCIAL STATEMENTS ............................................. 202
3.1 Budgeted financial statements...................................................................... 202
3.2 Budgeted financial statements tables ........................................................... 203


193
CLIMATE CHANGE AUTHORITY
Section 1: Entity overview and resources
1.1 STRATEGIC DIRECTION STATEMENT
The Climate Change Authority is a Non-corporate Commonwealth Entity and a
statutory agency operating under the Climate Change Authority Act 2011. The Authority
is responsible for the Outcome:
Provide expert advice to the Australian Government on climate change mitigation
initiatives, including through conducting regular and specifically commissioned
reviews and undertaking climate change research.
The specific functions of the Authority are set out in the Climate Change Authority
Act 2011. These include conducting statutory reviews of climate change policies,
special reviews and research about matters relating to climate change.
In 2017-18, the Authority will complete (by 31 December 2017) its second review of the
Carbon Credits (Carbon Farming Initiative) Act 2011. The Authority will also begin work
on its review of the National Greenhouse and Energy Reporting Act 2007, which is due to
be completed by 31 December 2018.
Government policy is that the Climate Change Authority will be wound up within the
life of the current Parliament.

Climate Change Authority Budget Statements
194
1.2 ENTITY RESOURCE STATEMENT
Table 1.1 shows the total funding from all sources available to the Authority for its
operations and to deliver services on behalf of the Government.
The table summarises how resources will be applied by outcome (government strategic
policy objectives) and by administered (on behalf of the Government or the public) and
departmental classification for the Authority’s operations.
Information in this table is presented on a resourcing (that is, appropriations/cash
available) basis, whilst the Budgeted expenses by Outcome tables in Section 2 and the
financial statements in Section 3 are presented on an accrual basis.

Climate Change Authority Budget Statements
195
Table 1.1: Climate Change Authority resource statement — Budget estimates for 2017-18 as at Budget May 2017
2016-17 Estimated
actual $'000
2017-18 Estimate
$'000
Departmental
Annual appropriations - ordinary annual services (a)
Prior year appropriations available 1,000 -
Departmental appropriation 2,563 -
s 74 retained revenue receipts (b) 662 1,456
Total departmental annual appropriations 4,225 1,456
Total departmental resourcing 4,225 1,456
Total resourcing for Climate Change Authority 4,225 1,456
2016-17 2017-18
Average staffing level (number) 9 9
Prepared on a resourcing (i.e. appropriations available) basis.
Please note: All figures shown above are GST exclusive - these may not match figures in the cash flow statement.
(a) Appropriation Bill (No. 1) 2017-18. (b) Estimated retained revenue receipts under section 74 of the Public Governance,
Performance and Accountability Act 2013.

Climate Change Authority Budget Statements
196
1.3 BUDGET MEASURES
There are no 2017-18 Budget measures relating to the Climate Change Authority.

Climate Change Authority Budget Statements
197
Section 2: Outcomes and planned performance
Government outcomes are the intended results, impacts or consequences of actions by
the Government on the Australian community. Commonwealth programs are the
primary vehicle by which government entities achieve the intended results of their
outcome statements. Entities are required to identify the programs which contribute to
government outcomes over the Budget and forward years.
Each outcome is described below together with its related programs. The following
provides detailed information on expenses for each outcome and program, further
broken down by funding source.
Note:
Performance reporting requirements in the Portfolio Budget Statements are part of the
enhanced Commonwealth performance framework established by the Public
Governance, Performance and Accountability Act 2013. It is anticipated that the
performance criteria described in Portfolio Budget Statements will be read with
broader information provided in an entity’s corporate plans and annual performance
statements – included in Annual Reports - to provide an entity’s complete performance
story.
The most recent corporate plan for the Climate Change Authority can be found at:
http://climatechangeauthority.gov.au.
The most recent annual performance statement can be found in the Authority’s annual
report for 2015-16 at http://climatechangeauthority.gov.au/about-cca.

Climate Change Authority Budget Statements
198
2.1 BUDGETED EXPENSES AND PERFORMANCE FOR OUTCOME 1
Outcome 1 – Provide expert advice to the Australian Government on climate change mitigation initiatives, including through conducting regular and specifically commissioned reviews and through undertaking climate change research.
Linked programs
Department of the Environment and Energy
Programs
Program 2.1 – Reducing Australia's Greenhouse Gas Emissions
Program 4.1 – Energy
Contribution to Outcome 1 made by linked programs
The Climate Change Authority supports the Department of the Environment and
Energy in reducing Australia’s greenhouse gas emissions by providing independent
climate change mitigation policy advice to the Government, including in relation to
the energy sector.

Climate Change Authority Budget Statements
199
Budgeted expenses for Outcome 1
This table shows how much the entity intends to spend (on an accrual basis) on
achieving the outcome, broken down by program, as well as by Administered and
Departmental funding sources.
Table 2.1.1: Budgeted expenses for Outcome 1
Outcome 1: Provide expert advice to the Australian Government on climate change mitigation initiatives, including through conducting regular and specifically commissioned reviews and through undertaking climate change research.
2016-17 Estimated
actual $'000
2017-18 Budget
$'000
2018-19 Forward estimate
$'000
2019-20 Forward estimate
$'000
2020-21 Forward estimate
$'000
Program 1.1: Reviewing Climate Change Mitigation Policies
Departmental expenses
Departmental appropriation 2,563 - - - -
s74 Retained revenue receipts (a) 662 1,456 - - -
Expenses not requiring appropriation in the Budget year (b) 304 9 - - -
Departmental total 3,529 1,465 - - -
Total expenses for program 1.1 3,529 1,465 - - -
Outcome 1 Totals by appropriation type
Departmental expenses
Departmental appropriation 2,563 - - - -
s74 Retained revenue receipts (a) 662 1,456 - - -
Expenses not requiring appropriation
in the Budget year (b) 304 9 - - -
Departmental total 3,529 1,465 - - -
Total expenses for Outcome 1 3,529 1,465 - - -
2016-17 2017-18
Average staffing level (number) 9 9
(a) Estimated expenses incurred in relation to receipts retained under section 74 of the Public
Governance, Performance and Accountability Act 2013. (b) Expenses not requiring appropriation in the Budget year are made up of depreciation and
amortisation expenses.

Climate Change Authority Budget Statements
200
Table 2.1.2: Performance criteria for Outcome 1
Table 2.1.2 below details the performance criteria for each program associated with
Outcome 1. It summarises how each program is delivered and where 2017-18 Budget
measures have created new programs or materially changed existing programs.
Outcome 1 – Provide expert advice to the Australian Government on climate change mitigation initiatives, including through conducting regular and specifically commissioned reviews and through undertaking climate change research.
Program 1.1 – Reviewing climate change mitigation policies
The Climate Change Authority’s objective is to provide rigorous, independent and balanced advice to the Minister for the Environment and Energy, to assist the Department and the Australian Parliament with climate change policy, in order to improve the quality of life for all Australians.
Delivery The Authority will conduct regular legislative reviews, and undertake climate change research by:
performing desktop and in-depth research and analysis
commissioning external resources to do analytic work where needed
conducting meaningful and transparent consultation with experts and stakeholders including business, industry, environment and other community groups
monitoring developments in climate change policy by reviewing publicly available resources and building networks with expert, local and international organisations.
The Authority secretariat will assist Authority decision making by:
providing briefing, draft reports and other supporting documents that are fit for purpose and of a high quality.
Performance information
Year Performance criteria Targets
2016–17 Reviews and reports from research conducted by the Authority are high quality, well-received by stakeholders and used in public policy forums and discussions.
Research reports on recommendations on further work resulting from the Special Review into climate change policies and the second review of the Carbon Farming Initiative Act 2011 are of high quality, well-received by stakeholders and used in public policy forums and discussions.
Forecast: On track
Public consultation processes are transparent, accessible and are highly regarded by stakeholders. The Authority’s decision-making in conducting and completing reviews is independent and is perceived as independent by stakeholders.
Stakeholders express the view that consultation has been meaningful and transparent.
Forecast: On track
Economic modelling, submissions and review reports are accessible on the Authority’s website.
Forecast: On track

Climate Change Authority Budget Statements
201
Program 1.1 – Reviewing climate change mitigation policies
The Climate Change Authority’s objective is to provide rigorous, independent and balanced advice to the Minister for the Environment and Energy, to assist the Department and the Australian Parliament with climate change policy, in order to improve the quality of life for all Australians.
Year Performance criteria Targets
2017–18 Legislative reviews and research reports conducted by the Authority are timely, high quality, well-received by stakeholders, and inform or influence public policy forums and discussions.
Statutory deadlines for legislative reviews are met.
Stakeholders express the view that reports are of high quality and influential.
Public consultation processes are transparent, accessible and facilitate meaningful engagement with stakeholders.
Stakeholders express the view that consultation has been meaningful and transparent.
Issues papers, public submissions research reports and review reports are accessible on the Authority’s website.
The Authority secretariat’s work supports effective decision making by the Authority.
Authority members express satisfaction with the work of the secretariat.
2018–19 and beyond
As for 2017–18 As for 2017–18
Purposes (a) The Climate Change Authority’s objective is to provide rigorous, independent and balanced advice to the Minister for the Environment and Energy and the Australian Parliament on climate change policy, in order to improve the quality of life for all Australians.
The Authority will do this by conducting regular and specifically commissioned reviews, and undertaking climate change research published as issues papers, research and review reports.
(a) Refers to updated purposes that will be reflected in the 2017-18 Corporate Plan.

Climate Change Authority Budget Statements
202
Section 3: Budgeted financial statements
Section 3 presents budgeted financial statements which provide a comprehensive
snapshot of entity finances for the 2017-18 budget year, including the impact of budget
measures and resourcing on financial statements.
3.1 BUDGETED FINANCIAL STATEMENTS
3.1.1 Explanatory notes and analysis of budgeted financial statements
The financial statements reflect the Climate Change Authority’s operations to
30 June 2018, which include research reports on further work recommended by the
Climate Change Authority’s special review into climate goals and policies, and initial
work on the Carbon Farming Initiative legislative review.

Climate Change Authority Budget Statements
203
3.2 BUDGETED FINANCIAL STATEMENTS TABLES
Table 3.1: Comprehensive income statement (showing net cost of services) for the period ended 30 June
2016-17 Estimated
actual $'000
2017-18 Budget
$'000
2018-19 Forward estimate
$'000
2019-20 Forward estimate
$'000
2020-21 Forward estimate
$'000
EXPENSES
Employee benefits 2,781 977 - - -
Suppliers 444 479 - - -
Depreciation and amortisation 304 9 - - -
Total expenses 3,529 1,465 - - -
LESS:
OWN-SOURCE INCOME
Own-source revenue
Other 662 1,456 - - -
Total own-source revenue 662 1,456 - - -
Total own-source income 662 1,456 - - -
Net cost of services (2,867) (9) - - -
Revenue from Government 2,563 - - - -
Surplus/(deficit) attributable to the Australian Government (304) (9) - - -
Total comprehensive income/(loss) (304) (9) - - -
Total comprehensive income/(loss) attributable to the Australian Government (304) (9) - - -
Note: Impact of net cash appropriation arrangements
2016-17 $'000
2017-18 $'000
2018-19 $'000
2019-20 $'000
2020-21 $'000
Total comprehensive income/(loss) excluding depreciation/amortisation expenses previously funded through revenue appropriations - - - - -
less depreciation/amortisation expenses previously funded through revenue appropriations (a) 304 9 - - -
Total comprehensive income/(loss) - as per the statement of comprehensive income (304) (9) - - -
Prepared on Australian Accounting Standards basis.
(a) From 2010-11, the Government introduced net cash appropriation arrangements where Appropriation Bill (No. 1) revenue for the depreciation/amortisation expenses of non-corporate Commonwealth entities (and select corporate Commonwealth entities) were replaced with a separate capital budget (the Departmental Capital Budget, or DCB) provided through Appropriation Bill (No. 1) equity.

Climate Change Authority Budget Statements
204
Table 3.2: Budgeted departmental balance sheet (as at 30 June)
2016-17 Estimated
actual $'000
2017-18 Budget
$'000
2018-19 Forward estimate
$'000
2019-20 Forward estimate
$'000
2020-21 Forward estimate
$'000
ASSETS
Financial assets
Cash and cash equivalents 271 - - - -
Trade and other receivables 1,022 - - - -
Total financial assets 1,293 - - - -
Non-financial assets
Land and buildings 9 - - - -
Total non-financial assets 9 - - - -
Total assets 1,302 - - - -
LIABILITIES
Payables
Suppliers 125 - - - -
Total payables 125 - - - -
Provisions
Employee provisions 521 - - - -
Other provisions 120 - - - -
Total provisions 641 - - - -
Total liabilities 766 - - - -
Net assets 536 - - - -
EQUITY*
Parent entity interest
Retained surplus (accumulated deficit) 536 - - - -
Total parent entity interest 536 - - - -
Total equity 536 - - - -
Prepared on Australian Accounting Standards basis.
*Equity is the residual interest in assets after the deduction of liabilities.

Climate Change Authority Budget Statements
205
Table 3.3: Departmental statement of changes in equity — summary of movement (Budget year 2017-18)
Retained earnings
$'000
Total equity
$'000
Opening balance as at 1 July 2017 Balance carried forward from previous period 536 536
Adjusted opening balance 536 536
Comprehensive income Surplus/(deficit) for the period (9) (9)
Total comprehensive income (9) (9)
of which:
Attributable to the Australian Government (9) (9)
Transactions with owners
Distributions to owners Returns of capital: Distribution of equity (527) (527)
Sub-total transactions with owners (527) (527)
Estimated closing balance as at 30 June 2018 - -
Closing balance attributable to the Australian Government - -
Prepared on Australian Accounting Standards basis.

Climate Change Authority Budget Statements
206
Table 3.4: Budgeted departmental statement of cash flows (for the period ended 30 June)
2016-17 Estimated
actual $'000
2017-18 Budget
$'000
2018-19 Forward estimate
$'000
2019-20 Forward estimate
$'000
2020-21 Forward estimate
$'000
OPERATING ACTIVITIES
Cash received
Appropriations 2,563 1,000 - - -
Net GST received - 22 - - -
Other 662 1,456 - - -
Total cash received 3,225 2,478 - - -
Cash used
Employees 2,781 1,498 - - -
Suppliers 444 604 - - -
Cash transferred to OPA - 647 - - -
Total cash used 3,225 2,749 - - -
Net cash used by operating activities - (271) - - -
Net increase/(decrease) in cash held - (271) - - -
Cash and cash equivalents at the
beginning of the reporting period 271 271 - - -
Cash and cash equivalents at the
end of the reporting period 271 - - - -
Prepared on Australian Accounting Standards basis.

Climate Change Authority Budget Statements
207
Table 3.5: Statement of departmental asset movements (Budget year 2017-18)
Buildings
$'000
Other property, plant and
equipment $'000
Computer software
$'000
Total
$'000
As at 1 July 2017
Gross book value 1,224 55 113 1,392
Accumulated depreciation/
amortisation and impairment (1,215) (55) (113) (1,383)
Opening net book balance 9 - - 9
Other movements
Depreciation/amortisation expense (9) - - (9)
Total other movements (9) - - (9)
As at 30 June 2018
Gross book value 1,224 55 113 1,392
Accumulated depreciation/
amortisation and impairment (1,224) (55) (113) (1,392)
Closing net book balance - - - -
Prepared on Australian Accounting Standards basis.


209
DIRECTOR OF NATIONAL PARKS
ENTITY RESOURCES AND PLANNED
PERFORMANCE


211
DIRECTOR OF NATIONAL PARKS
SECTION 1: ENTITY OVERVIEW AND RESOURCES ............................................. 213
1.1 Strategic direction statement ........................................................................ 213
1.2 Entity resource statement ............................................................................. 215
1.3 Budget measures .......................................................................................... 217
SECTION 2: OUTCOMES AND PLANNED PERFORMANCE ................................. 219
2.1 Budgeted expenses and performance for Outcome 1 .................................. 220
SECTION 3: BUDGETED FINANCIAL STATEMENTS ............................................. 224
3.1 Budgeted financial statements...................................................................... 224
3.2 Budgeted financial statements tables ........................................................... 225


213
DIRECTOR OF NATIONAL PARKS
Section 1: Entity overview and resources
1.1 STRATEGIC DIRECTION STATEMENT
The Director of National Parks is a Corporate Commonwealth Entity, operating under
the Environment Protection and Biodiversity Conservation Act 1999 to administer and
manage Commonwealth reserves (national parks, botanic gardens, marine and
terrestrial reserves). These reserves include:
Booderee, Kakadu and Uluru-Kata Tjuta National Parks, which are each jointly
managed with their Aboriginal Traditional Owners. Kakadu and Uluru-Kata Tjuta
National Parks are World Heritage listed
national parks in the Australian territories of Norfolk, Christmas and Cocos
(Keeling) Islands
the Australian National Botanic Gardens, which is a major national institution for
the study of Australian plants
the 59 marine reserves in the South East, South West, North West, North and
Temperate East marine regions and the Coral Sea which comprise the
Commonwealth waters component of the National Representative System of
Marine Protected Areas.
The Director of National Parks’ goals and objectives are to deliver:
resilient places and ecosystems: to protect and conserve the natural and cultural
values of Commonwealth reserves
multiple benefits to traditional owners: to support the aspirations of traditional
owners in managing their land and sea country
amazing destinations: to offer world class natural and cultural experiences,
enhancing Australia’s visitor economy.
To deliver these priorities within the Government’s fiscal strategy, the Director of
National Parks will continue to look to diversify and increase external revenue and
partnerships, seek further improvements in the efficient use of our resources and
continue to invest in the skills and capabilities of our staff.

Director of National Parks Budget Statements
214
Diagram 1: Location of Commonwealth Parks and Reserves

Director of National Parks Budget Statements
215
1.2 ENTITY RESOURCE STATEMENT
Table 1.1 shows the total funding from all sources available to the entity for its
operations and to deliver programs and services on behalf of the Government.
The table summarises how resources will be applied by outcome (government strategic
policy objectives) and by administered (on behalf of the Government or the public) and
departmental (for the entity’s operations) classification.
For more detailed information on special accounts and special appropriations, please
refer to Budget Paper No. 4 – Agency Resourcing.
Information in this table is presented on a resourcing (that is, appropriations/cash
available) basis, whilst the ‘Budgeted expenses by Outcome’ tables in Section 2 and the
financial statements in Section 3 are presented on an accrual basis.

Director of National Parks Budget Statements
216
Table 1.1: Director of National Parks resource statement — Budget estimates for 2017-18 as at Budget May 2017
2016-17 estimated
actual $'000
2017-18 estimate
$'000
Opening balance/cash reserves at 1 July 46,564 46,564
Funds from Government Annual appropriations - other services (a)
Equity injection – transferred by Portfolio Department 619 376
Total annual appropriations 619 376
Amounts received from related entities Amounts from Portfolio Department (b) 42,829 46,548
Total amounts received from related entities 42,829 46,548
Total funds from Government 43,448 46,924
Funds from other sources Interest 1,291 1,200 Sale of goods and services 25,840 23,252 Other 653 926
Total funds from other sources 27,784 25,378
Total net resourcing for Director of National Parks 117,796 118,866
2016-17 2017-18
Average staffing level (number) 321 326
Prepared on a resourcing (i.e. appropriations available) basis.
Please note: All figures shown above are GST exclusive - these may not match figures in the cash flow statement.
(a) Appropriation Bill (No. 2) 2017-18.
(b) Funding provided by the Portfolio Department that is not specified within the Annual Appropriation Bills as a payment to the Director of National Parks.

Director of National Parks Budget Statements
217
1.3 BUDGET MEASURES
There are no 2017-18 Budget measures relating to the Director of National Parks.

Director of National Parks Budget Statements
218
Figure 3: Changes to the outcome and program structures since the last portfolio statement
New Outcome 1
Management of Commonwealth reserves as outstanding natural places that enhance Australia's well-being through the protection and conservation of their natural and cultural values, supporting the aspirations of Aboriginal and Torres Strait Islander people in managing their traditional land and sea country, and offering world class natural and cultural visitor experiences.
Description of change:
Previously reported in 2016-17 Portfolio Additional Estimates Statements as Outcome 1.
Old statement:
Conservation and appreciation of Commonwealth reserves through the provision of safe visitor access, the control of invasive species and working with stakeholders and neighbours.

Director of National Parks Budget Statements
219
Section 2: Outcomes and planned performance
Government outcomes are the intended results, impacts or consequences of actions by
the Government on the Australian community. Commonwealth programs are the
primary vehicle by which government entities achieve the intended results of their
outcome statements. Entities are required to identify the programs which contribute to
government outcomes over the Budget and forward years.
Each outcome is described below together with its related programs. The following
provides detailed information on expenses for each outcome and program, further
broken down by funding source.
Note:
Performance reporting requirements in the Portfolio Budget Statements are part of the
enhanced Commonwealth performance framework established by the Public
Governance, Performance and Accountability Act 2013. It is anticipated that the
performance criteria described in Portfolio Budget Statements will be read with
broader information provided in an entity’s corporate plans and annual performance
statements – included in Annual Reports - to provide an entity’s complete performance
story.
The most recent corporate plan for the Director of National Parks can be found at:
http://www.environment.gov.au/resource/corporate-plan-2016-20-director-national-
parks.
The most recent annual performance statement can be found at:
http://www.environment.gov.au/resource/annual-report-2015-16-director-national-
parks.

Director of National Parks Budget Statements
220
2.1 BUDGETED EXPENSES AND PERFORMANCE FOR OUTCOME 1
Outcome 1: Management of Commonwealth reserves as outstanding natural places that enhance Australia’s well-being through the protection and conservation of their natural and cultural values, supporting the aspirations of Aboriginal and Torres Strait Islander people in managing their traditional land and sea country, and offering world class natural and cultural visitor experiences.
Linked programs
Department of the Environment and Energy
Programs
Program 1.1 – Sustainable Management of Natural Resources and the Environment
Program 1.2 – Environmental Information and Research
Program 1.4 – Conservation of Australia’s Heritage and Environment
Contribution to Outcome 1 made by linked programs
The Department of the Environment and Energy and Director of National Parks work together through engagement on policy direction, heritage management and species conservation within Commonwealth-managed marine and terrestrial reserves.
Great Barrier Reef Marine Park Authority
Programs
Program 1.1 – Improving the Outlook for the Great Barrier Reef
Contribution to Outcome 1 made by linked programs
The Coral Sea Commonwealth Marine Reserve managed by the Director of National Parks adjoins the Great Barrier Reef Marine Park and provides complementary protection for ecosystems and biodiversity in the region.

Director of National Parks Budget Statements
221
Budgeted expenses for Outcome 1
This table shows how much the entity intends to spend (on an accrual basis) on
achieving the outcome, broken down by program, as well as by Administered and
Departmental funding sources.
Table 2.1.1: Budgeted expenses for Outcome 1
Outcome 1: Management of Commonwealth reserves as outstanding natural places that enhance Australia's well-being through the protection and conservation of their natural and cultural values, supporting the aspirations of Aboriginal and Torres Strait Islander people in managing their traditional land and sea country, and offering world class natural and cultural visitor experiences.
2016-17 Estimated
actual $'000
2017-18 Budget
$'000
2018-19 Forward estimate
$'000
2019-20 Forward estimate
$'000
2020-21 Forward estimate
$'000
Program 1.1: Parks and Reserves
Revenue from Government
Payment from related entities 42,829 46,548 47,397 45,802 44,129
Expenses not requiring appropriation in the Budget year (a)
5,269 4,262 3,067 2,698 1,071
Revenues from other independent sources
31,918 29,498 28,599 28,722 28,743
Total expenses for Program 1.1 80,016 80,308 79,063 77,222 73,943
Outcome 1 Totals by appropriation type
Revenue from Government
Payment from related entities 42,829 46,548 47,397 45,802 44,129
Expenses not requiring appropriation in the Budget year (a)
5,269 4,262 3,067 2,698 1,071
Revenues from other independent sources
31,918 29,498 28,599 28,722 28,743
Total expenses for Outcome 1 80,016 80,308 79,063 77,222 73,943
2016-17 2017-18
Average staffing level (number) 321 326
(a) Expenses not requiring appropriation in the Budget year comprise depreciation and amortisation
expenses.

Director of National Parks Budget Statements
222
Table 2.1.2: Performance criteria for Outcome 1
Table 2.1.2 below details the performance criteria for each program associated with
Outcome 1. It summarises how each program is delivered and where 2017-18 Budget
measures have created new programs or materially changed existing programs.
Outcome 1 – Management of Commonwealth reserves as outstanding natural places that enhance Australia’s well-being through the protection and conservation of their natural and cultural values, supporting the aspirations of Aboriginal and Torres Strait Islander people in managing their traditional land and sea country, and offering world class natural and cultural visitor experiences.
Program 1.1 – Parks and Reserves: healthy and resilient parks, gardens and marine reserves, protecting nature and culture and valued by the community now and into the future.
Delivery With traditional owners and stakeholders, develop and implement management plans for Commonwealth reserves.
Performance information
Year Performance criteria Targets
2016–17 Populations of threatened and significant species are increasing.
On track - forecast increase in populations of prioritised threatened and significant species.
Populations of priority invasive species are reduced.
On track - forecast decrease in size of populations of prioritised invasive species.
Increase in numbers of Indigenous staff and/or contractors directly or indirectly providing park services.
On track - forecast increase in numbers of Indigenous staff, with value of services provided by Indigenous providers steady.
Maintain or improve the level of visitor satisfaction and number of visitors.
On track - forecast to maintain high levels of visitor satisfaction.
Forecast to exceed 5 per cent increase in visitor numbers.
Enhance level of active management of marine reserves and engagement of users and stakeholders.
Not achieved - new management plans for Commonwealth marine reserves forecast to be in effect and implemented in the next financial year.
Increase the knowledge base for long term adaptive management of the marine reserves.
On track - forecast increase in the number of marine reserves long-term monitoring sites.
2017–18 Populations of threatened and significant species are increasing.
Increase in populations of prioritised threatened and significant species.
Populations of priority invasive species are reduced.
Decrease in size of populations of prioritised invasive species.

Director of National Parks Budget Statements
223
Program 1.1 – Parks and Reserves: healthy and resilient parks, gardens and marine reserves, protecting nature and culture and valued by the community now and into the future.
Year Performance criteria Targets
Increase in numbers of Indigenous staff and/or contractors directly or indirectly providing park services.
Increase in numbers of Indigenous staff.
Increase in value of services provided by Indigenous providers.
Maintain or improve the level of visitor satisfaction and number of visitors.
Maintain or improve levels of visitor satisfaction.
5 per cent increase in visitor numbers.
Enhance level of active management of marine reserves and engagement of users and stakeholders.
New management plans for Commonwealth marine reserves forecast to be in effect and implemented.
Increase the knowledge base for long term adaptive management of the marine reserves.
Increase in the number of marine reserves long-term monitoring sites.
2018–19 and beyond
As for 2017–18 As for 2017–18
Purposes (a) Resilient places and ecosystems: to protect and conserve the natural and
cultural values of Commonwealth reserves
Multiple benefits to traditional owners: to support the aspirations of traditional
owners in managing their land and sea country
Amazing destinations: to offer world class natural and cultural experiences,
enhancing Australia’s visitor economy
(a) Refers to updated purposes that will be reflected in the 2017-18 Corporate Plan.

Director of National Parks Budget Statements
224
Section 3: Budgeted financial statements
Section 3 presents budgeted financial statements which provide a comprehensive
snapshot of entity finances for the 2017-18 budget year, including the impact of budget
measures and resourcing on financial statements.
3.1 BUDGETED FINANCIAL STATEMENTS
3.1.1 Explanatory notes and analysis of budgeted financial statements
Estimates for the Director of National Parks have increased primarily as a result of the
measure supporting the Commonwealth Marine Reserves network.
Changes over the forward estimates for sale of goods and services represent
movements in delivery of Memorandum of Understanding activities, in particular and
Bush Blitz II reducing its program expeditions in 2017-18.
Other gains of $4.12 million relate to the estimate of the cost of corporate services
provided by the Department of the Environment and Energy free of charge under a
Service Delivery Agreement with the Director of National Parks.
The Director of National Parks received approval from the Minister for Finance for an
operating loss of $1.1 million in 2020-21 for depreciation of the entity’s asset base.

Director of National Parks Budget Statements
225
3.2 BUDGETED FINANCIAL STATEMENTS TABLES
Table 3.1: Comprehensive income statement (showing net cost of services) for the period ended 30 June 2016-17
Estimated actual $'000
2017-18 Budget
$'000
2018-19 Forward estimate
$'000
2019-20 Forward estimate
$'000
2020-21 Forward estimate
$'000
EXPENSES
Employee benefits 34,802 33,356 32,045 30,535 29,870
Suppliers 31,176 33,974 35,236 35,273 34,287
Grants 54 - - - -
Depreciation and amortisation 13,984 12,977 11,782 11,413 9,786
Other expenses - 1 - 1 -
Total expenses 80,016 80,308 79,063 77,222 73,943
LESS:
OWN-SOURCE INCOME
Own-source revenue
Sale of goods and rendering of services 25,840 23,252 22,376 22,490 22,507
Interest 1,291 1,200 1,200 1,200 1,200
Other 653 926 903 912 916
Total own-source revenue 27,784 25,378 24,479 24,602 24,623
Gains
Sale of assets 14 - - - -
Other 4,120 4,120 4,120 4,120 4,120
Total gains 4,134 4,120 4,120 4,120 4,120
Total own-source income 31,918 29,498 28,599 28,722 28,743
Net (cost of)/contribution by services (48,098) (50,810) (50,464) (48,500) (45,200)
Revenue from Government 42,829 46,548 47,397 45,802 44,129
Surplus/(deficit) attributable to the Australian Government (5,269) (4,262) (3,067) (2,698) (1,071)
Total comprehensive income/(loss) (5,269) (4,262) (3,067) (2,698) (1,071)
Total comprehensive income/(loss) attributable to the Australian Government (5,269) (4,262) (3,067) (2,698) (1,071)
Prepared on Australian Accounting Standards basis.

Director of National Parks Budget Statements
226
Table 3.2: Budgeted departmental balance sheet (as at 30 June)
2016-17 Estimated
actual $'000
2017-18 Budget
$'000
2018-19 Forward estimate
$'000
2019-20 Forward estimate
$'000
2020-21 Forward estimate
$'000
ASSETS
Financial assets
Cash and cash equivalents 20,442 20,442 20,442 20,442 20,442
Trade and other receivables 1,527 1,527 1,527 1,527 1,527
Other investments 26,122 26,122 26,122 26,122 26,122
Other financial assets 211 211 211 211 211
Total financial assets 48,302 48,302 48,302 48,302 48,302
Non-financial assets
Land and buildings 65,434 63,814 63,000 62,190 61,846
Property, plant and equipment 145,931 143,665 141,593 140,060 139,333
Intangibles 815 815 815 815 815
Other non-financial assets 552 552 552 552 552
Total non-financial assets 212,732 208,846 205,960 203,617 202,546
Total assets 261,034 257,148 254,262 251,919 250,848
LIABILITIES
Payables
Suppliers 2,796 2,796 2,796 2,796 2,796
Other payables 4,334 4,334 4,334 4,334 4,334
Total payables 7,130 7,130 7,130 7,130 7,130
Provisions
Employee provisions 8,433 8,433 8,433 8,433 8,433
Other provisions 31 31 31 31 31
Total provisions 8,464 8,464 8,464 8,464 8,464
Total liabilities 15,594 15,594 15,594 15,594 15,594
Net assets 245,440 241,554 238,668 236,325 235,254
EQUITY*
Parent entity interest
Contributed equity 37,064 37,440 37,621 37,976 37,976
Reserves 172,562 172,562 172,562 172,562 172,562
Retained surplus (accumulated deficit) 35,814 31,552 28,485 25,787 24,716
Total parent entity interest 245,440 241,554 238,668 236,325 235,254
Total equity 245,440 241,554 238,668 236,325 235,254
Prepared on Australian Accounting Standards basis.
*Equity is the residual interest in assets after the deduction of liabilities.

Director of National Parks Budget Statements
227
Table 3.3: Departmental statement of changes in equity — summary of movement (Budget year 2017-18)
Retained earnings
$'000
Asset revaluation
reserve $'000
Contributed equity/ capital $'000
Total equity
$'000
Opening balance as at 1 July 2017
Balance carried forward from previous period 35,814 172,562 37,064 245,440
Adjusted opening balance 35,814 172,562 37,064 245,440
Comprehensive income Surplus/(deficit) for the period (4,262) - - (4,262)
Total comprehensive income (4,262) - - (4,262)
of which: Attributable to the Australian Government (4,262) - - (4,262)
Transactions with owners Contributions by owners Equity injection - transferred by
Portfolio Department - - 376 376
Sub-total transactions with owners - - 376 376
Estimated closing balance as at 30 June 2018 31,552 172,562 37,440 241,554
Closing balance attributable to the Australian Government 31,552 172,562 37,440 241,554
Prepared on Australian Accounting Standards basis.

Director of National Parks Budget Statements
228
Table 3.4: Budgeted departmental statement of cash flows (for the period ended 30 June)
2016-17 Estimated
actual $'000
2017-18 Budget
$'000
2018-19 Forward estimate
$'000
2019-20 Forward estimate
$'000
2020-21 Forward estimate
$'000
OPERATING ACTIVITIES
Cash received
Receipts from Government 43,085 46,548 47,396 45,802 44,129 Sale of goods and rendering of services 25,840 23,252 22,376 22,490 22,507 Interest 1,291 1,200 1,200 1,200 1,200
Other 653 926 903 912 916
Total cash received 70,869 71,926 71,875 70,404 68,752
Cash used
Employees 35,058 33,356 32,044 30,535 29,870
Suppliers 27,057 29,854 31,116 31,153 30,167
Other 53 1 - 1 -
Total cash used 62,168 63,211 63,160 61,689 60,037
Net cash from/(used by) operating activities 8,701 8,715 8,715 8,715 8,715
INVESTING ACTIVITIES
Cash received
Proceeds from sales of property, plant and equipment 14 - - - -
Total cash received 14 - - - -
Cash used
Purchase of property, plant and
equipment and intangibles 9,334 9,091 8,896 9,070 8,715
Total cash used 9,334 9,091 8,896 9,070 8,715
Net cash from/(used by) investing activities (9,320) (9,091) (8,896) (9,070) (8,715)
FINANCING ACTIVITIES
Cash received
Equity injection - transferred by Portfolio Department 619 376 181 355 -
Total cash received 619 376 181 355 -
Net cash from/(used by) financing activities 619 376 181 355 -
Net increase/(decrease) in cash held - - - - -
Cash and cash equivalents at the beginning of the reporting period 20,442 20,442 20,442 20,442 20,442
Cash and cash equivalents at the end of the reporting period 20,442 20,442 20,442 20,442 20,442
Prepared on Australian Accounting Standards basis.

Director of National Parks Budget Statements
229
Table 3.5: Departmental capital budget statement (for the period ended 30 June)
2016-17 Estimated
actual $'000
2017-18 Budget
$'000
2018-19 Forward estimate
$'000
2019-20 Forward estimate
$'000
2020-21 Forward estimate
$'000
NEW CAPITAL APPROPRIATIONS
Equity injection - transferred by
Portfolio Department 619 376 181 355 -
Total new capital appropriations 619 376 181 355 -
Provided for:
Purchase of non-financial assets 619 376 181 355 -
Total items 619 376 181 355 -
PURCHASE OF NON-FINANCIAL ASSETS
Funded by capital appropriations (a) 619 376 181 355 -
Funded internally from departmental resources (b) 8,715 8,715 8,715 8,715 8,715
TOTAL 9,334 9,091 8,896 9,070 8,715
Prepared on Australian Accounting Standards basis.
(a) Includes current Appropriation Bill (No.2) appropriations. (b) Includes the following sources of funding:
- current Appropriation Bill (No. 1) and prior year Act (No. 1) appropriations; - donations and contributions; - internally developed assets; - proceeds from the sale of assets.

Director of National Parks Budget Statements
230
Table 3.6: Statement of departmental asset movements (Budget year 2017-18)
Land
$'000
Buildings
$'000
Other property, plant and
equipment
$'000
Computer software
and intangibles
$'000
Total
$'000
As at 1 July 2017 Gross book value 5,690 71,193 178,626 1,094 256,603
Accumulated depreciation/ amortisation and impairment - (11,449) (32,695) (279) (44,423)
Opening net book balance 5,690 59,744 145,931 815 212,180
Capital asset additions Estimated expenditure on new
or replacement assets By purchase - appropriation equity (a) - - 376 - 376
By purchase - appropriation ordinary annual services (b) - 2,500 6,215 - 8,715
Total additions - 2,500 6,591 - 9,091
Other movements
Depreciation/amortisation expense - (4,120) (8,857) - (12,977)
Total other movements - (4,120) (8,857) - (12,977)
As at 30 June 2018 Gross book value 5,690 73,693 185,217 1,094 265,694
Accumulated depreciation/ amortisation and impairment - (15,569) (41,552) (279) (57,400)
Closing net book balance 5,690 58,124 143,665 815 208,294
Prepared on Australian Accounting Standards basis.
(a) 'Appropriation equity' refers to equity injections appropriations provided through Appropriation Bill (No. 2) 2017-18.
(b) 'Appropriation ordinary annual services' refers to funding provided through Appropriation Bill (No.1) 2017-18 for depreciation/amortisation expenses, Departmental Capital Budgets or other operational expenses.

231
GREAT BARRIER REEF MARINE
PARK AUTHORITY
ENTITY RESOURCES AND PLANNED
PERFORMANCE


233
GREAT BARRIER REEF MARINE PARK AUTHORITY
SECTION 1: ENTITY OVERVIEW AND RESOURCES ............................................. 235
1.1 Strategic direction statement ........................................................................ 235
1.2 Entity resource statement ............................................................................. 238
1.3 Budget measures .......................................................................................... 240
SECTION 2: OUTCOMES AND PLANNED PERFORMANCE ................................. 241
2.1 Budgeted expenses and performance for Outcome 1 .................................. 242
SECTION 3: BUDGETED FINANCIAL STATEMENTS ............................................. 248
3.1 Budgeted financial statements...................................................................... 248
3.2 Budgeted financial statements tables ........................................................... 249


235
GREAT BARRIER REEF MARINE PARK AUTHORITY
Section 1: Entity overview and resources
1.1 STRATEGIC DIRECTION STATEMENT
The Great Barrier Reef Marine Park Authority is Australia’s principal adviser for the
Great Barrier Reef, one of the world’s most valued natural wonders renowned for its
stunning beauty and diversity of marine life and habitats. The Great Barrier Reef
Marine Park Authority exists to protect the Great Barrier Reef Marine Park and the
World Heritage Area for current and future generations. This legislative responsibility
is established under the Great Barrier Reef Marine Park Act 1975.
The Great Barrier Reef Marine Park Act 1975 requires the Great Barrier Reef Marine Park
Authority to ensure the long-term protection, ecologically sustainable use,
understanding and enjoyment of the Great Barrier Reef for all Australians and the
international community through the care and development of the Marine Park.
To achieve this primary outcome the Great Barrier Reef Marine Park Authority
delivers its work under the Improving the Outlook of the Great Barrier Reef Program
with an emphasis on protecting, managing and restoring the Great Barrier Reef’s
ecosystem health, biodiversity, and heritage values. The Authority strives to achieve
this by:
Providing expert knowledge to influence and advise key decision makers on
managing, reducing or avoiding significant threats to the Reef
Regulating and ensuring Marine Park user compliance
Educating and fostering stewardship to enhance protection of the Reef
Enhancing reef resilience through continuous improvement and new initiatives
across all aspects of management.
The Great Barrier Reef has experienced two significant extreme weather events during
2017 — its second consecutive year of mass coral bleaching and the category 4 tropical
cyclone Debbie which crossed reefs in the Whitsundays region of the Marine Park.
The Great Barrier Reef Marine Park Authority is working with partners and
stakeholders to identify and implement actions to increase Reef resilience in response
to these major environmental disturbances, while continuing to focus on its essential
foundational management tools.
Great Barrier Reef Marine Park Authority Budget Statements
236
These tools include the Field Management Program, which the Authority implements
in close collaboration with the Queensland Government, a partnership which is
critically important for effectively managing such a large, diverse and complex marine
World Heritage Area.
These joint arrangements — which operate across the Commonwealth Marine Park
and the Queensland Great Barrier Reef Coast Marine Park — also underpin the
operation of a Reef-wide zoning plan and permitting system which regulates where
uses may occur, the types of activities allowed and the conditions under which these
may proceed.
Under the Field Management Program, the Great Barrier Reef Marine Park Authority
is purchasing a second state-of-the art patrol vessel to boost field capacity in the
southern region of the Great Barrier Reef, enabling improved policing of the Marine
Park, particularly against illegal fishing.
In carrying out its work, the Great Barrier Reef Marine Park Authority maintains
strong relationships with Traditional Owners who are the traditional custodians of the
Great Barrier Reef with connections to the area dating back more than 60,000 years.
The Authority also works with a wide range of agencies, Reef users, stakeholders, and
community members with an interest in the long-term protection, ecologically
sustainable use, understanding and enjoyment of the Great Barrier Reef.
The Great Barrier Reef Marine Park Authority continues to lead over 70 actions in the
Reef 2050 Plan for the Australian Government, including the implementation of the
Reef 2050 Integrated Monitoring and Reporting Program. The program will ensure the
Plan’s effectiveness is monitored in a scientifically sound and publicly transparent
manner. Implementation of this initiative will inform the development of the 2019
Great Barrier Reef Outlook Report.
The Great Barrier Reef Marine Park Authority is continuing to work in conjunction
with the Reef and Rainforest Research Centre and the Association of Marine Park
Tourism Operators, with funding from the $211.8 million Reef Trust, to protect coral
cover at key tourism and high value conservation sites by culling the crown-of-thorns
starfish. This critical work is part of the Authority’s work to reduce cumulative
impacts and boost Reef resilience.
The Australian Government’s Reef Program is aimed at addressing the threats of
declining water quality to the Great Barrier Reef World Heritage Area with the aim of
meeting the Authority’s Reef Water Quality Guidelines. The Reef Program also aims to
enhance the Reef’s resilience to climate change by minimising other pressures on the
Reef. The Authority assists in delivering components of the Reef Program, including:
Marine monitoring and reporting of the long-term health of the Reef

Great Barrier Reef Marine Park Authority Budget Statements
237
Land and sea country partnerships to strengthen communication between local
communities, managers and Reef stakeholders and to build a better understanding
of Traditional Owner issues relevant to managing the Marine Park, including the
sustainable use of traditional marine resources
Stewardship programs including the highly successful Reef Guardian initiative to
improve community, local government and industry capacity and facilitate the
adoption of environmentally sustainable best practices to achieve environmental
outcomes for the Great Barrier Reef.
The Great Barrier Reef Marine Park Authority is updating infrastructure and exhibits
associated with its award-winning national education centre for the Great Barrier Reef,
Reef HQ Aquarium, in Townsville. The aquarium fosters community and stakeholder
participation in actions to address threats to the Reef by ensuring they have a clear
understanding of the value of the Great Barrier Reef, the threats to its sustainable
future and the actions they can take to protect it.
Climate change remains the most significant threat to the Great Barrier Reef. Global
action on climate change, including effective implementation of the Paris Agreement to
reduce greenhouse gas emissions, is essential to avoid extreme weather events, such as
mass coral bleaching and severe tropical cyclones, becoming a more frequent
occurrence.
Other key issues for the Reef are declining water quality, commercial and recreational
fishing pressures, crown-of-thorns starfish outbreaks and coastal development.
Our challenge is to maintain the Great Barrier Reef Marine Park Authority’s role as
best practice marine park managers while also ensuring stakeholders are aware of the
impacts the cumulative pressures from outside of the Authority’s jurisdiction are
having on the Great Barrier Reef’s long-term health.
The impact is not just on the Reef ecosystem, it affects the cultural values of Traditional
Owners, tourism and fishing industries which rely on a healthy Reef, the communities
along the coast who have strong connections with the Reef, as well as the broader
Australian and international community who consider it to be ‘our Reef’.

Great Barrier Reef Marine Park Authority Budget Statements
238
1.2 ENTITY RESOURCE STATEMENT
Table 1.1 shows the total funding from all sources available to the entity for its
operations and to deliver programs and services on behalf of the Government.
The table summarises how resources will be applied by outcome (government strategic
policy objectives) and by administered (on behalf of the Government or the public) and
departmental (for the entity’s operations) classification.
For more detailed information on special accounts and special appropriations, please
refer to Budget Paper No. 4 – Agency Resourcing.
Information in this table is presented on a resourcing (that is, appropriations/cash
available) basis, whilst the ‘Budgeted expenses by Outcome’ tables in Section 2 and the
financial statements in Section 3 are presented on an accrual basis.

Great Barrier Reef Marine Park Authority Budget Statements
239
Table 1.1: Great Barrier Reef Marine Park Authority resource statement — Budget estimates for 2017-18 as at Budget May 2017
2016-17 Estimated
actual $'000
2017-18 Estimate
$'000
Departmental
Annual appropriations - ordinary annual services (a)
Prior year appropriations available 9,969 7,969
Departmental appropriation (b) 20,031 25,019
s 74 retained revenue receipts (c) 20,296 25,825
Departmental capital budget (d) 772 762
Annual appropriations - other services - non-operating (e)
Equity injection 467 1,016
Total departmental annual appropriations 51,535 60,591
Total departmental special appropriations (f) 11,000 11,000
Special accounts (f)
Opening balance 1,224 36,224
Appropriation receipts (g) 9,682 13,177
Non-appropriation receipts 43,731 10,000
Total special accounts 54,637 59,401
less departmental appropriations drawn from annual/special appropriations and credited to special accounts (9,682) (13,177)
Total departmental resourcing 107,490 117,815
Total resourcing for the Great Barrier Reef Marine Park Authority 107,490 117,815
2016-17 2017-18
Average staffing level (number) 210 210
Prepared on a resourcing (i.e. appropriations available) basis.
Please note: All figures shown above are GST exclusive - these may not match figures in the cash flow statement.
(a) Appropriation Bill (No. 1) 2017-18.
(b) Excludes departmental capital budget (DCB).
(c) Estimated retained revenue receipts under section 74 of the Public Governance, Performance and Accountability Act 2013.
(d) Departmental capital budgets are not separately identified in Appropriation Bill (No.1) and form part of ordinary annual services items. Please refer to Table 3.5 for further details. For accounting purposes, this amount has been designated as a 'contribution by owner'.
(e) Appropriation Bill (No. 2) 2017-18.
(f) Excludes 'Special Public Money' held in accounts like Other Trust Monies accounts (OTM), Services for Other Government and Non-agency Bodies accounts (SOG) or Services for Other Entities and Trust Moneys accounts (SOETM)). For further information on special appropriations and special accounts, please refer to Budget Paper No. 4 - Agency Resourcing. Please also see Table 2.1 for further information on outcome and program expenses broken down by various funding sources, e.g. annual appropriations, special appropriations and special accounts.
(g) Amounts credited to the special account(s) from Great Barrier Reef Marine Park Authority annual and special appropriations.

Great Barrier Reef Marine Park Authority Budget Statements
240
1.3 BUDGET MEASURES
There are no 2017-18 Budget measures relating to the Great Barrier Reef Marine Park
Authority.
Great Barrier Reef Marine Park Authority Budget Statements
241
Section 2: Outcomes and planned performance
Government outcomes are the intended results, impacts or consequences of actions by
the Government on the Australian community. Commonwealth programs are the
primary vehicle by which government entities achieve the intended results of their
outcome statements. Entities are required to identify the programs which contribute to
government outcomes over the Budget and forward years.
Each outcome is described below together with its related programs. The following
provides detailed information on expenses for each outcome and program, further
broken down by funding source.
Note:
Performance reporting requirements in the Portfolio Budget Statements are part of the
enhanced Commonwealth performance framework established by the Public
Governance, Performance and Accountability Act 2013. It is anticipated that the
performance criteria described in Portfolio Budget Statements will be read with
broader information provided in an entity’s corporate plans and annual performance
statements – included in Annual Reports - to provide an entity’s complete performance
story.
The most recent corporate plan for the Great Barrier Reef Marine Park Authority can
be found at: http://elibrary.gbrmpa.gov.au/jspui/handle/11017/3034
The most recent annual performance statement can be found at:
http://elibrary.gbrmpa.gov.au/jspui/handle/11017/3059

Great Barrier Reef Marine Park Authority Budget Statements
242
2.1 BUDGETED EXPENSES AND PERFORMANCE FOR OUTCOME 1
Outcome 1: The long-term protection, ecologically sustainable use, understanding and enjoyment of the Great Barrier Reef for all Australians and the international community through the care and development of the Marine Park.
Linked programs
Department of the Environment and Energy
Programs
Program 1.1 – Sustainable Management of Natural Resources and the Environment
Program 1.4 – Conservation of Australia’s Heritage and Environment
Program 1.5 – Environmental Regulation
Program 2.1 – Reducing Australia’s Greenhouse Gas Emissions
Program 2.2 – Adapting to Climate Change
Contribution to Outcome 1 made by linked programs
The Department of the Environment and Energy and the Great Barrier Reef Marine
Park Authority work together on heritage management, environment health, species
conservation and fisheries management as well as joint implementation of the Reef
2050 Plan to protect and conserve the Great Barrier Reef. Climate Change is the most
significant threat to the Great Barrier Reef. The Department of the Environment and
Energy is responsible for policy to support an effective global response to climate
change and for adapting to climate change.
Clean Energy Finance Corporation
Programs
Program 1.1 – Clean Energy Finance Corporation
Contribution to Outcome 1 made by linked programs
The Clean Energy Finance Corporation is providing a $1 billion investment over 10 years for the Reef Funding Program. The Program will deliver financial investment in clean energy projects delivered in the Great Barrier Reef catchment region. The Program is targeting clean energy projects and businesses in the region that support delivery of the Government’s Reef 2050 plan.

Great Barrier Reef Marine Park Authority Budget Statements
243
Director of National Parks
Programs
Program 1.1 – Parks and Reserves: healthy and resilient parks, gardens and marine reserves, protecting nature and culture and valued by the community now and into the future
Contribution to Outcome 1 made by linked programs
The Coral Sea Commonwealth Marine Reserve managed by the Director of National Parks adjoins the Great Barrier Reef Marine Park and provides complementary protection for ecosystems and biodiversity in the region.

Great Barrier Reef Marine Park Authority Budget Statements
244
Budgeted expenses for Outcome 1
This table shows how much the entity intends to spend (on an accrual basis) on
achieving the outcome, broken down by program, as well as by Administered and
Departmental funding sources.
Table 2.1.1: Budgeted expenses for Outcome 1
Outcome 1: The long-term protection, ecologically sustainable use, understanding and enjoyment of the Great Barrier Reef for all Australians and the international community, through the care and development of the Marine Park.
2016-17 Estimated
actual $'000
2017-18 Budget
$'000
2018-19 Forward estimate
$'000
2019-20 Forward estimate
$'000
2020-21 Forward estimate
$'000
Program 1.1: Improving the Outlook for the Great Barrier Reef
Departmental expenses
Departmental appropriation 11,659 16,646 20,806 22,509 22,741
s 74 Retained revenue receipts (a) 19,776 19,425 8,800 5,622 4,927 Special appropriations
Great Barrier Reef Marine Park Act 1975 11,000 11,000 11,000 11,000 11,000
Special accounts
Great Barrier Reef Field
Management Special Account 16,784 16,784 16,784 16,784 16,784 Expenses not requiring appropriation in the Budget year (b) 3,955 1,955 1,955 1,955 1,955
Departmental total 63,174 65,810 59,345 57,870 57,407
Total expenses for program 1.1 63,174 65,810 59,345 57,870 57,407
Outcome 1 Totals by appropriation type
Departmental expenses Departmental appropriation 11,659 16,646 20,806 22,509 22,741 s74 Retained revenue receipts (a) 19,776 19,425 8,800 5,622 4,927 Special appropriations 11,000 11,000 11,000 11,000 11,000 Special accounts 16,784 16,784 16,784 16,784 16,784 Expenses not requiring appropriation in the Budget year (b) 3,955 1,955 1,955 1,955 1,955
Departmental total 63,174 65,810 59,345 57,870 57,407
Total expenses for Outcome 1 63,174 65,810 59,345 57,870 57,407
2016-17 2017-18
Average staffing level (number) 210 210 (a) Estimated expenses incurred in relation to receipts retained under section 74 of the Public
Governance, Performance and Accountability Act 2013. (b) Expenses not requiring appropriation in the Budget year are made up of depreciation expenses,
amortisation expenses and audit fees. Note: Departmental appropriation splits and totals are indicative estimates and may change in the course of the budget year as government priorities change.

Great Barrier Reef Marine Park Authority Budget Statements
245
Table 2.1.2: Performance criteria for Outcome 1
Table 2.1.2 below details the performance criteria for each program associated with
Outcome 1. It summarises how each program is delivered and where 2017-18 Budget
measures have created new programs or materially changed existing programs.
Outcome 1 – The long-term protection, ecologically sustainable use,
understanding and enjoyment of the Great Barrier Reef for all Australians and
the international community through the care and development of the Marine
Park.
Program 1.1 – Improving the outlook for the Great Barrier Reef
This program contributes to the outcome through the implementation of actions which aim to protect, manage and restore the Great Barrier Reef’s ecosystem health, biodiversity and heritage values — ensuring use of the Marine Park is ecologically sustainable and benefits current and future generations.
Delivery Program 1.1 will be delivered by:
Providing expert knowledge to influence and advise key decision makers on managing, reducing or avoiding significant threats to the Reef
Regulating, and ensuring Marine Park user compliance
Educating and fostering stewardship to enhance protection of the Reef
Enhancing reef resilience through continuous improvement and new initiatives across all aspects of management.
Performance information
Year Performance criteria Targets
2016-17 Authority decisions and actions are informed by the best available knowledge and information, and contribute to the attainment of outcomes for the Reef’s values.
On track
75% of the Authority’s science needs to inform management decisions and actions are being addressed.
On track
The impacts of human activity on the Great Barrier Reef are reduced through effective environmental regulation.
On track
Action taken on 85% of reported permissions non-compliance related offences.
On track
740 dedicated compliance vessel patrol days funded or partially funded by the Field Management Program are undertaken in the World Heritage Area.
On track
23% of the Marine Park is managed in accordance with an accredited Traditional Use of Marine Resources Agreement or an Indigenous Land Use Agreement.
On track

Great Barrier Reef Marine Park Authority Budget Statements
246
Program 1.1 – Improving the outlook for the Great Barrier Reef
This program contributes to the outcome through the implementation of actions which aim to protect, manage and restore the Great Barrier Reef’s ecosystem health, biodiversity and heritage values — ensuring use of the Marine Park is ecologically sustainable and benefits current and future generations.
Year Performance criteria Targets
Environmental outcomes for the Great Barrier Reef are improved through the communication and adoption of sustainable best practices.
On track
Increase in the number of participants within Great Barrier Reef Marine Park Authority stewardship programs (e.g. High Standard Tourism, Eye on the Reef, Reef Guardians, Sea Country Indigenous Partnerships).
On track
55% of visitors to the Great Barrier Reef use tourism operators which have been accredited as ‘high standard operators’.
On track
70% of visitors to Reef HQ Aquarium participate in talks and tours that deliver key messages about risks to the Great Barrier Reef.
On track
2017-18 Key threats to the Great Barrier Reef are identified, and either addressed or, where external, acknowledged through the provision of authoritative and trusted advice.
Entities and peak bodies we work with acknowledge the:
quality of the Authority’s advice
professionalism and expertise of Authority staff.
100% of very high or high risks to the Reef are identified in or have effective actions against them identified in the Reef 2050 Plan or other plans and strategies.
The impacts of human activity on the Great Barrier Reef are reduced through effective and efficient regulation and compliance.
Whitsundays Plan of Management finalised and in force.
New permit guidelines finalised and existing ones reviewed to improve transparency and consistency in permit decisions.
Spatial planning tools identified and priority sites determined for improved protection.

Great Barrier Reef Marine Park Authority Budget Statements
247
Program 1.1 – Improving the outlook for the Great Barrier Reef
This program contributes to the outcome through the implementation of actions which aim to protect, manage and restore the Great Barrier Reef’s ecosystem health, biodiversity and heritage values — ensuring use of the Marine Park is ecologically sustainable and benefits current and future generations.
Year Performance criteria Targets
24% of the Marine Park coastline is managed in accordance with an accredited Traditional Use of Marine Resources Agreement or Indigenous Land Use Agreement.
740 compliance patrol days funded through the joint field management program.
New compliance tools are identified, trialled and reviewed for effectiveness to address key risks.
Improved awareness and adoption of sustainable best practices through education and stewardship programs.
Participants of stewardship and education programs, including ReefHQ programs, report:
improved awareness of the Great Barrier Reef’s values and threats
changed practice and behaviour to protect and enhance the Reef’s values.
Enhanced coral reef resilience through identifying and working with partners to implement adaptive management intervention.
Develop and release a Position Statement on potential interventions to enhance Reef resilience.
Management intervention options to support resilience are identified and prioritised.
A number of new interventions that are prioritised progress to piloting and evaluation.
2018-19 and beyond As for 2017-18
As for 2017-18 with the exception of the Whitsundays Plan of Management and Position Statement on potential interventions targets identified above.
Purposes (a) Our Purpose is to ensure the long-term protection, ecologically sustainable use, understanding and enjoyment of the Great Barrier Reef for all Australians and the international community through the care and development of the Marine Park.
(a) Refers to updated purposes that will be reflected in the 2017-18 Corporate Plan.

Great Barrier Reef Marine Park Authority Budget Statements
248
Section 3: Budgeted financial statements
Section 3 presents budgeted financial statements which provide a comprehensive
snapshot of entity finances for the 2017-18 budget year, including the impact of budget
measures and resourcing on financial statements.
3.1 BUDGETED FINANCIAL STATEMENTS
3.1.1 Differences between entity resourcing and financial statements
There are no differences between the resource information presented in the Budget
Papers and the Portfolio Budget Statements.
3.1.2 Analysis of budgeted financial statements
Changes in appropriation from 2016-17 to 2017-18 are the result of the funding
received at MYEFO in 2016-17.
The operating loss in 2016-17 reflects additional legal costs and depreciation expenses.

Great Barrier Reef Marine Park Authority Budget Statements
249
3.2 BUDGETED FINANCIAL STATEMENTS TABLES
Table 3.1: Comprehensive income statement (showing net cost of services) for the period ended 30 June
2016-17 Estimated
actual $'000
2017-18 Budget
$'000
2018-19 Forward estimate
$'000
2019-20 Forward estimate
$'000
2020-21 Forward estimate
$'000
EXPENSES
Employee benefits 21,762 21,457 23,140 22,387 23,320
Suppliers 26,061 29,902 21,954 21,232 19,836
Grants 1,110 210 10 10 10
Depreciation and amortisation 1,900 1,900 1,900 1,900 1,900 Payments to Queensland Government for Field Management Program 12,341 12,341 12,341 12,341 12,341
Total expenses 63,174 65,810 59,345 57,870 57,407
LESS:
OWN-SOURCE INCOME
Own-source revenue
Permit Assessment Fees 340 340 340 340 340
Reef HQ Aquarium 2,630 2,630 2,630 2,630 2,630
Grants received from Government 17,116 16,965 5,820 2,642 1,947 Receipts from Queensland Government for Field Management Program 8,372 8,372 8,372 8,372 8,372
Other 250 6,450 50 50 50
Total own-source revenue 28,708 34,757 17,212 14,034 13,339
Gains
Other 55 55 55 55 55
Total gains 55 55 55 55 55
Total own-source income 28,763 34,812 17,267 14,089 13,394
Net (cost of)/contribution by services (34,411) (30,998) (42,078) (43,781) (44,013)
Revenue from Government 31,031 36,018 40,178 41,881 42,113
Surplus/(deficit) attributable to the Australian Government (3,380) 5,020 (1,900) (1,900) (1,900)
Total comprehensive income/(loss) (3,380) 5,020 (1,900) (1,900) (1,900)
Total comprehensive income/(loss) attributable to the Australian Government (3,380) 5,020 (1,900) (1,900) (1,900)

Great Barrier Reef Marine Park Authority Budget Statements
250
Table 3.1: Comprehensive income statement (showing net cost of services) for the period ended 30 June (continued)
Note: Impact of net cash appropriation arrangements
2016-17 $'000
2017-18 $'000
2018-19 $'000
2019-20 $'000
2020-21 $'000
Total comprehensive income/(loss) excluding depreciation/ amortisation expenses previously funded through revenue appropriations (1,480) 6,920 - - -
less depreciation/amortisation expenses previously funded through revenue appropriations (a) 1,900 1,900 1,900 1,900 1,900
Total comprehensive income/(loss) - as per the statement of comprehensive income (3,380) 5,020 (1,900) (1,900) (1,900)
Prepared on Australian Accounting Standards basis.
(a) From 2010-11, the Government introduced net cash appropriation arrangements where Appropriation Bill (No. 1) revenue for the depreciation/amortisation expenses of non-corporate Commonwealth entities (and select corporate Commonwealth entities) were replaced with a separate capital budget (the Departmental Capital Budget, or DCB) provided through Appropriation Bill (No. 1) equity appropriations. For information regarding Department Capital Budgets, please refer to Table 3.5 Departmental Capital Budget Statement.

Great Barrier Reef Marine Park Authority Budget Statements
251
Table 3.2: Budgeted departmental balance sheet (as at 30 June) 2016-17
Estimated actual $'000
2017-18 Budget
$'000
2018-19 Forward estimate
$'000
2019-20 Forward estimate
$'000
2020-21 Forward estimate
$'000
ASSETS
Financial assets
Cash and cash equivalents 489 489 489 489 489 Closing balance of Field Management Special Account 36,224 36,224 36,224 36,224 36,224
Trade and other receivables 60 60 60 60 60
Appropriation receivable 7,969 14,369 14,369 14,369 14,369
GST receivable 353 353 353 353 353
Other financial assets 21 21 21 21 21
Total financial assets 45,116 51,516 51,516 51,516 51,516
Non-financial assets
Land and buildings 16,329 15,917 15,496 15,020 14,523
Property, plant and equipment 2,420 3,340 4,249 4,932 5,376
Intangibles 2,258 2,148 1,838 1,488 1,168
Inventories 73 73 73 73 73
Other non-financial assets 290 290 290 290 290
Total non-financial assets 21,370 21,768 21,946 21,803 21,430
Total assets 66,486 73,284 73,462 73,319 72,946
LIABILITIES
Payables
Suppliers 4,451 4,451 4,451 4,451 4,451
Other payables 258 258 258 258 258
Total payables 4,709 4,709 4,709 4,709 4,709
Provisions
Employee provisions 6,133 6,133 6,133 6,133 6,133
Provision for remediation of Douglas Shoal (a) 35,000 35,000 35,000 35,000 35,000
Total provisions 41,133 41,133 41,133 41,133 41,133
Total liabilities 45,842 45,842 45,842 45,842 45,842
Net assets 20,644 27,442 27,620 27,477 27,104
EQUITY*
Parent entity interest
Contributed equity 24,384 26,162 28,240 29,997 31,524
Reserves 13,168 13,168 13,168 13,168 13,168 Retained surplus (accumulated deficit) (16,908) (11,888) (13,788) (15,688) (17,588)
Total parent entity interest 20,644 27,442 27,620 27,477 27,104
Total equity 20,644 27,442 27,620 27,477 27,104
Prepared on Australian Accounting Standards basis.
*Equity is the residual interest in assets after the deduction of liabilities.
(a) Settlement for remediation of Douglas Shoal from Shen Neng 1 ship grounding in 2010. A plan of expenditure of the settlement funds over future years is in preparation. Held as a Provision under AASB137.

Great Barrier Reef Marine Park Authority Budget Statements
252
Table 3.3: Departmental statement of changes in equity — summary of movement (Budget year 2017-18)
Retained earnings
$'000
Asset revaluation
reserve $'000
Contributed equity/ capital $'000
Total equity
$'000
Opening balance as at 1 July 2017
Balance carried forward from previous period (16,908) 13,168 24,384 20,644
Adjusted opening balance (16,908) 13,168 24,384 20,644
Comprehensive income Surplus/(deficit) for the period 5,020 - - 5,020
Total comprehensive income 5,020 - - 5,020
of which:
Attributable to the Australian Government 5,020 - - 5,020
Transactions with owners Contributions by owners Equity injection - Appropriation - - 1,016 1,016
Departmental capital budget (DCB) - - 762 762
Sub-total transactions with owners - - 1,778 1,778
Estimated closing balance as at 30 June 2018 (11,888) 13,168 26,162 27,442
Closing balance attributable to the Australian Government (11,888) 13,168 26,162 27,442
Prepared on Australian Accounting Standards basis.

Great Barrier Reef Marine Park Authority Budget Statements
253
Table 3.4: Budgeted departmental statement of cash flows (for the period ended 30 June)
2016-17 Estimated
actual $'000
2017-18 Budget
$'000
2018-19 Forward estimate
$'000
2019-20 Forward estimate
$'000
2020-21 Forward estimate
$'000
OPERATING ACTIVITIES
Cash received
Appropriations 33,031 30,138 40,178 41,881 42,113
Receipts from Government 17,116 16,445 5,820 2,642 1,947
Reef HQ aquarium revenue 2,630 2,630 2,630 2,630 2,630
Permit assessment fees 340 340 340 340 340 Receipts from Queensland Government for Field Management Program 8,372 8,372 8,372 8,372 8,372
GST received 120 120 100 100 100
Litigation settlement to Field Management Special Account 35,000 - - - -
Other 370 6,570 50 50 50
Total cash received 96,979 64,615 57,490 56,015 55,552
Cash used
Employees 21,467 21,162 23,140 22,387 23,320
Suppliers 24,626 22,067 20,999 20,277 18,881
Payments to Queensland Government for Field Management Program 12,341 12,341 12,341 12,341 12,341
GST paid 1,620 1,620 1,000 1,000 1,000
Transfer to OPA - 6,400 - - -
Grants 1,110 210 10 10 10
Other 295 295 - - -
Total cash used 61,459 64,095 57,490 56,015 55,552
Net cash from/(used by) operating activities 35,520 520 - - -
INVESTING ACTIVITIES
Cash used
Purchase of property, plant and equipment and intangibles 1,759 2,298 2,078 1,757 1,527
Total cash used 1,759 2,298 2,078 1,757 1,527
Net cash from/(used by) investing activities (1,759) (2,298) (2,078) (1,757) (1,527)
FINANCING ACTIVITIES
Cash received
Contributed equity 1,239 1,778 2,078 1,757 1,527
Total cash received 1,239 1,778 2,078 1,757 1,527
Net cash from/(used by) financing activities 1,239 1,778 2,078 1,757 1,527
Net increase/(decrease) in cash held 35,000 - - - -
Cash and cash equivalents at the beginning of the reporting period 489 35,489 35,489 35,489 35,489
Cash and cash equivalents at the end of the reporting period 35,489 35,489 35,489 35,489 35,489
Prepared on Australian Accounting Standards basis.

Great Barrier Reef Marine Park Authority Budget Statements
254
Table 3.5: Departmental capital budget statement (for the period ended 30 June)
2016-17 Estimated
actual $'000
2017-18 Budget
$'000
2018-19 Forward estimate
$'000
2019-20 Forward estimate
$'000
2020-21 Forward estimate
$'000
NEW CAPITAL APPROPRIATIONS
Capital budget - Bill 1 (DCB) 772 762 757 757 762
Equity injections - Bill 2 467 1,016 1,321 1,000 765
Total new capital appropriations 1,239 1,778 2,078 1,757 1,527
Provided for:
Purchase of non-financial assets 1,239 1,777 2,078 1,757 1,527
Total items 1,239 1,777 2,078 1,757 1,527
PURCHASE OF NON-FINANCIAL ASSETS
Funded by capital appropriations (a) 467 1,016 1,321 1,000 765 Funded by capital appropriation - DCB (b) 772 762 757 757 762 Funded internally from departmental resources (c) 520 520 - - -
TOTAL 1,759 2,298 2,078 1,757 1,527
Prepared on Australian Accounting Standards basis.
(a) Includes both current Appropriation Bill (No. 2) and prior Act (No. 2/4/6) appropriations.
(b) Does not include annual finance lease costs. Include purchases from current and previous years' Departmental Capital Budgets (DCBs).
(c) Includes s 74 retained revenue receipts.

Great Barrier Reef Marine Park Authority Budget Statements
255
Table 3.6: Statement of departmental asset movements (Budget year 2017-18)
Buildings
$'000
Other property, plant and
equipment $'000
Computer software
and intangibles
$'000
Total
$'000
As at 1 July 2017 Gross book value 18,054 3,633 5,491 27,178
Accumulated depreciation/ amortisation and impairment (1,725) (1,213) (3,233) (6,171)
Opening net book balance 16,329 2,420 2,258 21,007
Capital asset additions Estimated expenditure on new
or replacement assets By purchase - appropriation equity (a) - 1,016 - 1,016
By purchase - appropriation ordinary annual services (b) 433 549 300 1,282
Total additions 433 1,565 300 2,298
Other movements
Depreciation/amortisation expense (845) (645) (410) (1,900)
Total other movements (845) (645) (410) (1,900)
As at 30 June 2018 Gross book value 18,487 5,198 5,791 29,476
Accumulated depreciation/ amortisation and impairment (2,570) (1,858) (3,643) (8,071)
Closing net book balance 15,917 3,340 2,148 21,405
Prepared on Australian Accounting Standards basis.
(a) 'Appropriation equity' refers to equity injections appropriations provided through Appropriation Bill (No. 2) 2017-18, including Collection Development Acquisition Budgets.
(b) 'Appropriation ordinary annual services' refers to funding provided through Appropriation Bill (No.1) 2017-18 for depreciation/amortisation expenses, Departmental Capital Budgets or other operational expenses.

Great Barrier Reef Marine Park Authority Budget Statements
256
Table 3.7: Schedule of budgeted income and expenses administered on behalf of Government (for the period ended 30 June)
2016-17 Estimated
actual $'000
2017-18 Budget
$'000
2018-19 Forward estimate
$'000
2019-20 Forward estimate
$'000
2020-21 Forward estimate
$'000
OWN-SOURCE INCOME
Own-source revenue
Non-taxation revenue
Environmental Management Charge 11,000 11,000 11,000 11,000 11,000
Infringement Notices 105 80 80 80 80
Rental income 345 345 345 345 345
Total non-taxation revenue 11,450 11,425 11,425 11,425 11,425
Total own-source revenue administered on behalf of Government 11,450 11,425 11,425 11,425 11,425
Total own-sourced income administered on behalf of Government 11,450 11,425 11,425 11,425 11,425
Net (cost of)/contribution by services 11,450 11,425 11,425 11,425 11,425
Total comprehensive income/(loss) 11,450 11,425 11,425 11,425 11,425
Prepared on Australian Accounting Standards basis.

Great Barrier Reef Marine Park Authority Budget Statements
257
Table 3.8: Schedule of budgeted assets and liabilities administered on behalf of Government (as at 30 June)
2016-17 Estimated
actual $'000
2017-18 Budget
$'000
2018-19 Forward estimate
$'000
2019-20 Forward estimate
$'000
2020-21 Forward estimate
$'000
ASSETS
Financial assets
Trade and other receivables 3,057 3,057 3,057 3,057 3,057
Total financial assets 3,057 3,057 3,057 3,057 3,057
Non-financial assets
Land and buildings 3,982 3,982 3,982 3,982 3,982
Total non-financial assets 3,982 3,982 3,982 3,982 3,982
Total assets administered on behalf of Government 7,039 7,039 7,039 7,039 7,039
LIABILITIES
Payables
Other payables 3,057 3,057 3,057 3,057 3,057
Total payables 3,057 3,057 3,057 3,057 3,057
Total liabilities administered on behalf of Government 3,057 3,057 3,057 3,057 3,057
Net assets/(liabilities) 3,982 3,982 3,982 3,982 3,982
Prepared on Australian Accounting Standards basis.

Great Barrier Reef Marine Park Authority Budget Statements
258
Table 3.9: Schedule of budgeted administered cash flows (for the period ended 30 June)
2016-17 Estimated
actual $'000
2017-18 Budget
$'000
2018-19 Forward estimate
$'000
2019-20 Forward estimate
$'000
2020-21 Forward estimate
$'000
OPERATING ACTIVITIES
Cash received
Environmental Management Charge 11,000 11,000 11,000 11,000 11,000
Infringement Notices 105 80 80 80 80
Rental Income 345 345 345 345 345
Total cash received 11,450 11,425 11,425 11,425 11,425
Net cash from/(used by) operating activities 11,450 11,425 11,425 11,425 11,425
Net increase/(decrease) in cash held 11,450 11,425 11,425 11,425 11,425
Cash and cash equivalents at beginning of reporting period - - - - -
Cash to Official Public Account for:
- Special Appropriations (11,000) (11,000) (11,000) (11,000) (11,000)
- Other (450) (425) (425) (425) (425)
Total cash to Official Public Account (11,450) (11,425) (11,425) (11,425) (11,425)
Cash and cash equivalents at end of reporting period - - - - -
Prepared on Australian Accounting Standards basis.

Great Barrier Reef Marine Park Authority Budget Statements
259
Table 3.10: Statement of administered asset movements (Budget year 2017-18)
Land
$'000
Total
$'000
As at 1 July 2017 Gross book value 3,982 3,982
Accumulated depreciation/amortisation and impairment - -
Opening net book balance 3,982 3,982
CAPITAL ASSET ADDITIONS Estimated expenditure on new or
replacement assets By purchase - appropriation equity (a) - -
Total additions - -
Other movements
Depreciation/amortisation expense - -
Total other movements - -
As at 30 June 2018 Gross book value 3,982 3,982
Accumulated depreciation/amortisation and impairment - -
Closing net book balance 3,982 3,982
Prepared on Australian Accounting Standards basis.
(a) 'Appropriation equity' refers to Administered Assets and Liabilities appropriations provided through Appropriation Bill (No.2) 2017-18, including Collection Development Acquisition Budgets.


261
SYDNEY HARBOUR FEDERATION
TRUST
ENTITY RESOURCES AND PLANNED
PERFORMANCE


263
SYDNEY HARBOUR FEDERATION TRUST
SECTION 1: ENTITY OVERVIEW AND RESOURCES ............................................. 265
1.1 Strategic direction statement ........................................................................ 265
1.2 Entity resource statement ............................................................................. 267
1.3 Budget measures .......................................................................................... 269
SECTION 2: OUTCOMES AND PLANNED PERFORMANCE ................................. 270
2.1 Budgeted expenses and performance for Outcome 1 .................................. 271
SECTION 3: BUDGETED FINANCIAL STATEMENTS ............................................. 275
3.1 Budgeted financial statements...................................................................... 275
3.2 Budgeted financial statements tables ........................................................... 276


265
SYDNEY HARBOUR FEDERATION TRUST
Section 1: Entity overview and resources
1.1 STRATEGIC DIRECTION STATEMENT
The Sydney Harbour Federation Trust manages some of Sydney’s most renowned and
prominent foreshore lands on Sydney Harbour. These sites are the former Defence
lands at Middle Head–Georges Heights and Chowder Bay in Mosman, the North Head
former School of Artillery, Macquarie Lightstation near South Head, Woolwich Dock
and Parklands, Cockatoo and Snapper Islands, the former Marine Biological Station at
Watsons Bay and the former HMAS Platypus site at Neutral Bay.
The Sydney Harbour Federation Trust is adapting and reusing heritage buildings to
bring life and activity to these harbour foreshores and, at the same time, generating
revenue for operating and maintaining the sites. Its overarching objective is to
transform its sites into precincts and parklands that will enhance the cultural and
historical values of the city, whilst conserving the environmental integrity and unique
heritage of the sites.
Over its life, the Sydney Harbour Federation Trust’s focus has moved from
predominantly community consultation and planning to rehabilitation of lands and
buildings, leasing and public programs. As decontamination, conservation,
refurbishment and rehabilitation of sites is completed, the emphasis of the Trust’s
activities is moving increasingly towards management and maintenance, increasing
visitation and enhancing the visitor and tenant experience. The extension of the life of
the Trust in 2007 to 2033 has influenced the way the organisation views itself and its
operations, with a renewed emphasis on its long-term financial sustainability.
The Sydney Harbour Federation Trust’s objective in 2017–18 and the forward estimates
will be to continue to focus on the sustainability of all of our precincts to ensure we
leave them preserved for future generations. The Trust will undertake a new
interpretive strategy and plan with NSW National Parks for Middle Head, Mosman, to
improve public awareness and appreciation of the natural and cultural values of the
former Aboriginal and military significant site. It will continue to improve visitor
services, amenities and accommodation integrated with event/conferencing use at
Cockatoo Island. The Trust will continue to pursue partnerships with both cultural and
corporate organisations to improve the Trust’s capacity to implement its charter.
Following decontamination of HMAS Platypus, North Sydney, the Sydney Harbour
Federation Trust has completed site planning for the next stage of rehabilitating
HMAS Platypus for public use. This stage includes public domain, access and
selective building refurbishment works. Detailed design development and

Sydney Harbour Federation Trust Budget Statements
266
construction programming is currently being finalised, with construction being
undertaken through 2017-18. Programmed completion is December 2018.
Apart from specific funding measures such as for the HMAS Platypus Stage 1
Rehabilitation, the Sydney Harbour Federation Trust does not receive a
Commonwealth appropriation. Accordingly, the Trust is committed to improving
existing revenue streams and identifying new revenue sources to enable the Trust to
achieve its objects under its enabling legislation.

Sydney Harbour Federation Trust Budget Statements
267
1.2 ENTITY RESOURCE STATEMENT
Table 1.1 shows the total funding from all sources available to the entity for its
operations and to deliver programs and services on behalf of the Government.
The table summarises how resources will be applied by outcome (government strategic
policy objectives) and by administered (on behalf of the Government or the public) and
departmental (for the entity’s operations) classification.
For more detailed information on special accounts and special appropriations, please
refer to Budget Paper No. 4 – Agency Resourcing.
Information in this table is presented on a resourcing (that is, appropriations/cash
available) basis, whilst the ‘Budgeted expenses by Outcome’ tables in Section 2 and the
financial statements in Section 3 are presented on an accrual basis.

Sydney Harbour Federation Trust Budget Statements
268
Table 1.1: Sydney Harbour Federation Trust resource statement — Budget estimates for 2017-18 as at Budget May 2017
2016-17 estimated
actual $'000
2017-18 estimate
$'000
Opening balance/cash reserves at 1 July 59,414 54,510
Funds from other sources
Interest 60 60
Sale of goods and services 3,871 3,706
Other 13,903 13,907
Total funds from other sources 17,834 17,673
Total net resourcing for Sydney Harbour Federation Trust 77,248 72,183
2016-17 2017-18
Average staffing level (number) 62 63
Prepared on a resourcing (i.e. appropriations available) basis.
Please note: All figures shown above are GST exclusive - these may not match figures in the cash flow statement.

Sydney Harbour Federation Trust Budget Statements
269
1.3 BUDGET MEASURES
There are no 2017-18 Budget measures relating to the Sydney Harbour Federation Trust.

Sydney Harbour Federation Trust Budget Statements
270
Section 2: Outcomes and planned performance
Government outcomes are the intended results, impacts or consequences of actions by
the Government on the Australian community. Commonwealth programs are the
primary vehicle by which government entities achieve the intended results of their
outcome statements. Entities are required to identify the programs which contribute to
government outcomes over the Budget and forward years.
Each outcome is described below together with its related programs. The following
provides detailed information on expenses for each outcome and program, further
broken down by funding source.
Note:
Performance reporting requirements in the Portfolio Budget Statements are part of the
enhanced Commonwealth performance framework established by the Public
Governance, Performance and Accountability Act 2013. It is anticipated that the
performance criteria described in Portfolio Budget Statements will be read with
broader information provided in an entity’s corporate plans and annual performance
statements – included in Annual Reports - to provide an entity’s complete performance
story.
The most recent corporate plan for the Sydney Harbour Federation Trust can be found
at: http://harbourtrust.gov.au/about
The most recent annual performance statement can be found at:
http://www.harbourtrust.gov.au/publication/sydney-harbour-federation-trust-
annual-report-2015-2016

Sydney Harbour Federation Trust Budget Statements
271
2.1 BUDGETED EXPENSES AND PERFORMANCE FOR OUTCOME 1
Outcome 1: Enhanced appreciation and understanding of the natural and cultural values of Sydney for all visitors, through the remediation, conservation and adaptive re-use of, and access to, Trust lands on Sydney Harbour.
Department of the Environment and Energy
Programs
Program 1.4 - Conservation of Australia’s Heritage and Environment
Contribution to Outcome 1 made by linked programs
The Department of the Environment and Energy and the Sydney Harbour
Federation Trust work together through engagement on policy direction and site
management to preserve the natural and cultural heritage of Sydney Harbour
Federation Trust land and maximise public access.

Sydney Harbour Federation Trust Budget Statements
272
Budgeted expenses for Outcome 1
This table shows how much the entity intends to spend (on an accrual basis) on
achieving the outcome, broken down by program, as well as by Administered and
Departmental funding sources.
Table 2.1.1: Budgeted expenses for Outcome 1
Outcome 1: Enhanced appreciation and understanding of the natural and cultural values of Sydney for all visitors, through the remediation, conservation and adaptive re-use of, and access to, Trust lands on Sydney Harbour.
2016-17 Estimated
actual $'000
2017-18 Budget
$'000
2018-19 Forward estimate
$'000
2019-20 Forward estimate
$'000
2020-21 Forward estimate
$'000
Program 1.1: Sydney Harbour Federation Trust
Revenues from other independent sources 18,318 18,463 19,689 20,719 21,645
Total expenses for Program 1.1 18,318 18,463 19,689 20,719 21,645
Outcome 1 totals by resource type
Revenues from other independent sources 18,318 18,463 19,689 20,719 21,645
Total expenses for Outcome 1 18,318 18,463 19,689 20,719 21,645
2016-17 2017-18 Average staffing level (number) 62 63

Sydney Harbour Federation Trust Budget Statements
273
Table 2.1.2: Performance criteria for Outcome 1
Table 2.1.2 below details the performance criteria for each program associated with
Outcome 1. It summarises how each program is delivered and where 2017-18 Budget
measures have created new programs or materially changed existing programs.
Outcome 1 – Enhanced appreciation and understanding of the natural and cultural values of Sydney for all visitors, through the remediation, conservation and adaptive re-use of, and access to, Trust lands on Sydney Harbour.
Program 1.1 – Sydney Harbour Federation Trust
To manage emblematic lands around Sydney Harbour, preserve their natural and cultural heritage and foster and promote them as places of leisure, enjoyment and interest for all Australians.
Delivery Undertake works and develop programs and facilities to ensure the Trust sites are progressively rehabilitated, conserved and made available for public use and enjoyment.
Performance information
Year Performance criteria Targets
2016-17 Urban Parklands - to preserve, enhance and promote the rich historical, cultural and natural values embodied in the Harbour Trust’s lands.
Management Plans for Cockatoo Island, Platypus and Middle Head are completed or on target for completion.
Growth and Enterprise – grow and diversify our revenue and funding streams to support the preservation, enhancement and operation of the Harbour Trust’s sites.
North Head and HMAS Platypus commercial and public use strategy implemented.
Engagement – extend public engagement and affinity with the Trust’s lands.
Strategic Marketing Plan for accommodation and venue hire on target for completion.
Innovation – achieve operational and business efficiencies.
Implementation of Customer Relations Management leasing module to be implemented during 2017-18.
Asset Management – operate, maintain and upgrade the Harbour Trust’s facilities and infrastructure in an efficient and sustainable manner.
Condition based asset survey completed for all infrastructure and parkland assets.
Commence rehabilitation of HMAS Platypus.
2017-18 Urban Parklands - to preserve, enhance and promote the rich historical, cultural and natural values embodied in the Harbour Trust’s lands.
5% decrease in Work Health Safety incidents based on 2015-16 levels.
Renewal and redevelopment of priority assets as per works program.
Growth & Enterprise – grow and diversify our revenue and funding streams to support the preservation, enhancement and operation of the Harbour Trust’s sites.
Public/Private investment partner identified.
Lease vacancies less than 4%.
Leasing and licensing income increasing by 6% based on 2015-16 levels.
Platypus commercial and public use strategy being implemented.

Sydney Harbour Federation Trust Budget Statements
274
Program 1.1 – Sydney Harbour Federation Trust
To manage emblematic lands around Sydney Harbour, preserve their natural and cultural heritage and foster and promote them as places of leisure, enjoyment and interest for all Australians.
Year Performance criteria Targets
Engagement – extend public engagement and affinity with the Trust’s lands.
Five cultural/heritage partnerships undertaken.
Headland Park interpretation plan in place and implementation commenced.
Visitation numbers collection methods implemented at North Head and Headland Park.
Innovation – achieve operational and business efficiencies.
Property Management system deployed and integrated.
Asset Management – operate, maintain and upgrade the Harbour Trust’s facilities and infrastructure in an efficient and sustainable manner.
Asset Maintenance Plan in place with updated condition based assessment information for each Trust asset.
Platypus stage 1a completed and stage 1b 50% complete.
2018-19 and beyond As for 2017-18 Approved and revised site plans guiding Harbour Trust decision making.
Asset Management Plan guides the priority of work projects in line with site plans.
17% increase in total independent revenue from leasing and accommodation business based on 2015-16 levels.
Platypus commercial and public use strategy implemented.
Site interpretation completed for major sites.
Visitation increase by 2% to 5% based on 2015-16 levels.
Enterprise Resource Planning system implemented. Reduction in regretted staff turnover to < 5%
Majority of capital projects completed as per program and on budget.
Platypus stage 1 capital refurbishment completed with site activated.
Purposes To manage emblematic lands around Sydney Harbour, preserve their natural and cultural heritage and foster and promote them as places of leisure, enjoyment and interest for all Australians.

Sydney Harbour Federation Trust Budget Statements
275
Section 3: Budgeted financial statements
Section 3 presents budgeted financial statements which provide a comprehensive
snapshot of entity finances for the 2017-18 budget year, including the impact of budget
measures and resourcing on financial statements.
3.1 BUDGETED FINANCIAL STATEMENTS
3.1.1 Explanatory notes and analysis of budgeted financial statements
Income Statement
The Sydney Harbour Federation Trust has budgeted for a small operating surplus of
$0.08 million in 2017–18.
Operating surpluses are maintained in forward years with an increasing trend in
profitability as new income streams are realised. The Trust receives no operating
funding from the Government, with its final operating appropriation received in
2009–10. The majority of the Trust’s income comes from the leasing of its rehabilitated
heritage buildings. Property leasing and licensing revenue is estimated to grow by
6 per cent in 2017–18, with continued growth in the out-years as new leasing
opportunities are made available through the capital works program funded by capital
renewal reserves and HMAS Platypus capital appropriation. Overall expenditure
forecasts for the 2017–18 financial year is $18.5 million, which reflects additional funds
allocated for site interpretation projects and the Trust’s planned asset maintenance
program. Resources will be focused on the continued preservation and conservation of
our aging assets and the capture of asset condition information to assist in forward
resource allocation decision making. The Trust will continue to improve tenant and
visitor experiences at our sites. Improved agency efficiencies will be realised with the
implementation of an integrated property management system, which will enable the
redirection of limited resources to the ongoing management and maintenance of Trust
sites as capital works are completed.
Balance Sheet
The Trust’s major assets are its lands and buildings, which it holds on behalf of the
Commonwealth. In 2017–18, the value of the Trust’s non-financial assets is estimated
to increase to $348.0 million as a result of major building and infrastructure asset
upgrades on the former HMAS Platypus site.
An additional $20.0 million equity injection from Government for the rehabilitation of
the former HMAS Platypus site was allocated to the Trust as a new measure at the
2015-16 Additional Estimates. The community planning and consultation stage of
these works are now complete with the major construction works due to commence in
August 2017 and to be completed in December 2018.

Sydney Harbour Federation Trust Budget Statements
276
3.2 BUDGETED FINANCIAL STATEMENTS TABLES
Table 3.1: Comprehensive income statement (showing net cost of services) for the period ended 30 June
2016-17 Estimated
actual $'000
2017-18 Budget
$'000
2018-19 Forward estimate
$'000
2019-20 Forward estimate
$'000
2020-21 Forward estimate
$'000
EXPENSES
Employee benefits 6,948 7,229 7,338 7,595 7,860
Suppliers 8,681 8,593 9,336 9,884 10,420
Depreciation and amortisation 2,484 2,570 2,930 3,150 3,270
Write-down and impairment of assets 205 71 85 90 95
Total expenses 18,318 18,463 19,689 20,719 21,645
LESS:
OWN-SOURCE INCOME
Own-source revenue
Sale of goods and rendering of
services 2,538 2,268 2,316 2,371 2,429
Fees and fines 360 360 360 360 360 Interest 1,544 1,215 1,031 991 924
Rental income 12,821 13,585 16,116 17,025 18,014
Grants 798 - - - -
Other 1,057 1,118 1,119 1,192 1,193
Total own-source revenue 19,118 18,546 20,942 21,939 22,920
Total own-source income 19,118 18,546 20,942 21,939 22,920
Net (cost of)/contribution by services 800 83 1,253 1,220 1,275
Surplus/(deficit) attributable to the Australian Government 800 83 1,253 1,220 1,275
Total comprehensive income/(loss) 800 83 1,253 1,220 1,275
Total comprehensive income/(loss) attributable to the Australian Government 800 83 1,253 1,220 1,275
Prepared on Australian Accounting Standards basis.

Sydney Harbour Federation Trust Budget Statements
277
Table 3.2: Budgeted departmental balance sheet (as at 30 June)
2016-17 Estimated
actual $'000
2017-18 Budget
$'000
2018-19 Forward estimate
$'000
2019-20 Forward estimate
$'000
2020-21 Forward estimate
$'000
ASSETS
Financial assets
Cash and cash equivalents 849 1,052 848 677 1,032
Trade and other receivables 1,041 759 729 709 729
Other investments 53,661 40,061 35,461 33,361 30,761
Total financial assets 55,551 41,872 37,038 34,747 32,522
Non-financial assets
Land and buildings 274,553 286,456 292,056 295,630 299,136
Property, plant and equipment 31,635 32,964 32,582 32,113 31,598
Heritage and collections 27,439 27,939 28,364 28,789 29,214
Intangibles 249 359 402 340 267
Inventories 156 126 156 126 156
Other non-financial assets 125 112 97 81 65
Total non-financial assets 334,157 347,956 353,657 357,079 360,436
Total assets 389,708 389,828 390,695 391,826 392,958
LIABILITIES
Payables
Suppliers 825 850 575 584 593
Other payables 3,534 3,448 3,294 3,089 2,945
Total payables 4,359 4,298 3,869 3,673 3,538
Provisions
Employee provisions 1,546 1,643 1,686 1,793 1,785
Total provisions 1,546 1,643 1,686 1,793 1,785
Total liabilities 5,905 5,941 5,555 5,466 5,323
Net assets 383,803 383,887 385,140 386,360 387,635
EQUITY*
Parent entity interest
Contributed equity 277,735 277,735 277,735 277,735 277,735
Reserves 98,617 98,617 98,617 98,617 98,617
Retained surplus (accumulated deficit) 7,451 7,535 8,788 10,008 11,283
Total parent entity interest 383,803 383,887 385,140 386,360 387,635
Total equity 383,803 383,887 385,140 386,360 387,635
Prepared on Australian Accounting Standards basis.
*Equity is the residual interest in assets after the deduction of liabilities.

Sydney Harbour Federation Trust Budget Statements
278
Table 3.3: Departmental statement of changes in equity — summary of movement (Budget year 2017-18)
Retained earnings
$'000
Asset revaluation
reserve $'000
Other reserves
$'000
Contributed equity/ capital $'000
Total equity
$'000
Opening balance as at 1 July 2017 Balance carried forward from previous period 7,451 90,171 8,446 277,735 383,803 Adjustment for changes in accounting policies 1 - - - 1
Adjusted opening balance 7,452 90,171 8,446 277,735 383,804
Comprehensive income Surplus/(deficit) for the period 83 - - - 83
Total comprehensive income 83 - - - 83
of which: Attributable to the Australian Government 83 - - - 83
Estimated closing balance as at 30 June 2018 7,535 90,171 8,446 277,735 383,887
Closing balance attributable to the Australian Government 7,535 90,171 8,446 277,735 383,887
Prepared on Australian Accounting Standards basis.

Sydney Harbour Federation Trust Budget Statements
279
Table 3.4: Budgeted departmental statement of cash flows (for the period ended 30 June)
2016-17 Estimated
actual $'000
2017-18 Budget
$'000
2018-19 Forward estimate
$'000
2019-20 Forward estimate
$'000
2020-21 Forward estimate
$'000
OPERATING ACTIVITIES
Cash received
Sale of goods and rendering of services 3,871 3,706 3,752 3,880 3,939
Interest 60 60 60 60 60
Net GST received (40) 10 - - -
Other 13,943 13,897 16,188 17,088 18,039
Total cash received 17,834 17,673 20,000 21,028 22,038
Cash used
Employees 6,909 7,179 7,248 7,535 7,821
Suppliers 9,878 8,676 9,898 10,126 10,696
Total cash used 16,787 15,855 17,146 17,661 18,517
Net cash from/(used by) operating activities 1,047 1,818 2,854 3,367 3,521
INVESTING ACTIVITIES
Cash received
Investments 90,084 79,755 69,571 70,531 70,464
Total cash received 90,084 79,755 69,571 70,531 70,464
Cash used
Purchase of property, plant and
equipment and intangibles 7,434 16,370 8,630 6,570 6,630
Investments 84,200 65,000 64,000 67,500 67,000
Total cash used 91,634 81,370 72,630 74,070 73,630
Net cash from/(used by) investing activities (1,550) (1,615) (3,059) (3,539) (3,166)
Net increase/(decrease) in cash held (503) 203 (205) (172) 355
Cash and cash equivalents at the beginning of the reporting period 1,353 850 1,053 848 676
Cash and cash equivalents at the end of the reporting period 850 1,053 848 676 1,031
Prepared on Australian Accounting Standards basis.

Sydney Harbour Federation Trust Budget Statements
280
Table 3.5: Departmental capital budget statement (for the period ended 30 June) 2016-17
Estimated actual $'000
2017-18 Budget
$'000
2018-19 Forward estimate
$'000
2019-20 Forward estimate
$'000
2020-21 Forward estimate
$'000
PURCHASE OF NON-FINANCIAL ASSETS
Funded internally from departmental resources (a) 7,434 16,370 8,630 6,570 6,630
TOTAL 7,434 16,370 8,630 6,570 6,630
RECONCILIATION OF CASH USED TO ACQUIRE ASSETS TO ASSET MOVEMENT TABLE
Total purchases 7,434 16,370 8,630 6,570 6,630
Total cash used to acquire assets 7,434 16,370 8,630 6,570 6,630
Prepared on Australian Accounting Standards basis.
(a) Includes the following sources of funding: - current Appropriation Bill (No. 1) and prior year Act (No. 1/3/5) appropriations (excluding amounts from the Department Capital Budget); - donations and contributions; - gifts; - internally developed assets; - s 74 Retained revenue receipts; and - proceeds from the sale of assets.

Sydney Harbour Federation Trust Budget Statements
281
Table 3.6: Statement of departmental asset movements (Budget year 2017-18)
Land
$'000
Buildings
$'000
Other property, plant and
equipment $'000
Heritage and
cultural
$'000
Computer software
and intangibles
$'000
Total
$'000
As at 1 July 2017 Gross book value 197,693 79,468 36,315 27,439 665 341,580
Accumulated depreciation/ amortisation and impairment - (2,608) (4,681) - (416) (7,705)
Opening net book balance 197,693 76,860 31,634 27,439 249 333,875
Capital asset additions Estimated expenditure on new
or replacement assets By purchase - appropriation equity (a) 946 12,306 2,461 500 200 16,413
Total additions 946 12,306 2,461 500 200 16,413
Other movements
Depreciation/amortisation expense - (1,349) (1,131) - (90) (2,570)
Total other movements - (1,349) (1,131) - (90) (2,570)
As at 30 June 2018 Gross book value 198,639 91,774 38,776 27,939 865 357,993
Accumulated depreciation/ amortisation and impairment - (3,957) (5,812) - (506) (10,275)
Closing net book balance 198,639 87,817 32,964 27,939 359 347,718
Prepared on Australian Accounting Standards basis.
(a) 'Appropriation equity' refers to equity injections appropriations provided through Appropriation Bill (No. 2) 2017-18, including Collection Development Acquisition Budgets.