Embed Size (px)
Citation preview

ENTREPRENEURSHIP
South-west University "Neofit Rilski"
Faculty of Economics
Issue 2, Volume VIII, 2020

VIII, 2020
ENTREPRENEURSHIP
Academic edition for scientific research
South-west University “Neofit Rilski” Faculty of Economics

2
CHIEF EDITOR
Assoc. Рrof. Vyara Kyurova, Ph.D. South-West University “Neofit Rilski”, Bulgaria
DEPUTY CHIEF EDITOR
Prof. Milena Filipova, Ph.D. South-West University “Neofit Rilski”, Bulgaria
EDITORIAL BOARD
Prof. Raya Madgerova, Ph.D. South-West University “Neofit Rilski”, Bulgaria
Assoc. Рrof. Mariana Kuzmanova, Ph.D.
University of National and World Economy, Bulgaria
Prof. Dr. of Economic Scienses Olga Prokopenko
Sumy State University, Ukraine
Assoc. Рrof. Dr. of Sc. Elena Sadchenko
Wyzsza Szkola Ekonomiczno-Humanistyczna, Bielsko-Biala, Poland
Dr. of Sc. Ievgen Khlobystov Wyzsza Szkola Ekonomiczno-Humanistyczna, Bielsko-Biala, Poland
Prof. Dr. of Economic Scienses Liubov Zharova
Wyzsza Szkola Ekonomiczno-Humanistyczna, Bielsko-Biala, Poland
Prof. Izumi Masashi Tokai University, School of Tourism, Japan
Assoc. Prof. Ilinka Terziyska, Ph.D. South-West University “Neofit Rilski”, Bulgaria
Prof. Georgi L. Georgiev, Ph.D. South-West University “Neofit Rilski”, Bulgaria
Dr. Juan Guillermo Estay Sepúlveda Universidad Catolica de Temuco, Chile
Prof. Lalka Borisova, PhD International Business School, Botevgrad
Assoc. Prof. Kiril Paleshutski, Ph.D. South-West University “Neofit Rilski”, Bulgaria
Рrof. Preslav Dimitrov, Ph.D. South-West University “Neofit Rilski”, Bulgaria
Рrof. Mariya Stankova, Ph.D. South-West University “Neofit Rilski”, Bulgaria

3
Prof. Ihor Halytsia, Ph.D. University of Economics and Law "KROK", Ukraine
Prof. Dr. Bojan Krstic University of Nis, Faculty of Economics, Serbia
Prof. Aleksa Stamenkovski, Ph.D. European Univerrsity Republic of Macedonia, Skopje
Prof. Dr. Daniela Zirra Romanian American University, Economic Research Center, Bucharest, Romania
Assoc. Prof. Andreea - Clara Munteanu, Ph.D.
Romanian Academy, Institute of National Economy, Romania
Assoc. Professor Dr. Antoniade - Ciprian Alexandru
Faculty of Economic, Ecological University of Bucharest, Rumania
Adam Pawlicz, Ph.D. Universitet Szczeciсski, Poland
Chief Assist. Prof. Dinka Zlateva, PhD. South-West University “Neofit Rilski”, Bulgaria
Chief Assist. Prof. Dilyana Yaneva, PhD.
South-West University “Neofit Rilski”, Bulgaria
Chief Assist. Prof. Ani Atanasova, PhD.
South-West University “Neofit Rilski”, Bulgaria
Chief Assist. Prof. Vladislav Krustev, PhD.
South-West University “Neofit Rilski”, Bulgaria
Assoc. Prof. Rayna Dimitrova, Ph.D. South-West University “Neofit Rilski”, Bulgaria
Chief Assist. Prof. Teodora Kiryakova-Dineva., Ph.D.
South-West University “Neofit Rilski”, Bulgaria
Assoc. Prof. Mariana Usheva, Ph.D. South-West University “Neofit Rilski”, Bulgaria
Assoc. Prof. Dimitris Folinas, Ph.D. Technological Educational Institute of Central Macedonia at Seres
Assoc. Prof. Almaz Kadyraliev, Ph.D. Musa Ruskulbekov Kyrgyz Economic University
Assos. Prof. Dr of Economic Sc. Bakas Bakhtiyar uulu
Musa Ruskulbekov Kyrgyz Economic University

4
Assoc.Prof. Tran Van Hoa, Ph.D. Hue University, Vietnam Assoc. Prof. Truong Tan Quan, Ph.D. Hue University, Vietnam
Pham Xuan Hung, Ph.D. Hue University, Vietnam
Prof. Farhad Sariev, Ph.D. K.Tynystanov Issyk-Kul State University, Kyrgyzstan
Prof. Maksat Erkimbaev, Ph.D. K.Tynystanov Issyk-Kul State University, Kyrgyzstan
Assoc. Prof. Svetlana Sirmbard, Ph.D. Adam University, Kyrgyzstan Prof. Dr of Technical Sc. Abdyrakhman Subankulovich Mavlyanov
Adam University, Kyrgyzstan
Prof. Dr of Economic Sc. Almakuchukov Keneshbek Mukashevich
Adam University, Kyrgyzstan
Assoc. Prof. Tsvetana Aleksandrova Stoyanova, Ph.D.
University of National and World Economy, Bulgaria
Assoc. Prof. Stoyan Ognyanov Kirov, Ph.D.
College of Tourism - Blagoevgrad
PRODUCTION EDITORS
Chief Assist. Prof. Dilyana Yaneva, Ph.D.
South-West University “Neofit Rilski”, Bulgaria
Chief Assist. Prof. Ani Atanasova, Ph.D.
South-West University “Neofit Rilski”, Bulgaria
Chief Assist. Prof. Vladislav Krustev, Ph.D.
South-West University “Neofit Rilski”, Bulgaria
PRODUCTION SECRETARY
Chief Assist. Prof. Dinka Zlateva, Ph.D.
South-West University “Neofit Rilski”, Bulgaria
ISSN (online) 2738-7402 University publishing house „Neofit Rilski“ Blagoevgrad, 2020

5
All rights to published articles are reserved.
South-west University “Neofit Rilski” Faculty of Economics Year VIII, 2020 Issue 2, DOI: 10.37708/ep.swu.v8i2

6
CONTENTS POSSIBLE THREATS, OBSTACLES AND LIMITATIONS IN IMPLEMENTATION OF BUSINESS INTELLIGENT IN BULGARIAN SMALL AND MEDIUM-SIZED ENTERPRISES Melina Neykova .....................................................................................7 CORPORATE GOVERNANCE OF STATE-OWNED ENTERPRISES: NATIONAL PRACTICES OF THE BOARD Spartak Keremidchiev Miroslav Nedelchev ............... 16 STATE AND DEVELOPMENT OF INDUSTRIAL AND PUBLIC SECTOR IN COMPARISON OF GREECE WITH THE REST OF THE WORLD Kyriaki Papadopoulou1 ................................................................................................................ 27 STRATEGIC SUSTAINABILITY OF THE ORGANIZATION. STRATEGIC CUBE OR STRATEGIC STATUS MODEL OF THE ORGANIZATION Temenuzhka Karolova Chromy –Zhigalova ........................................................................................ 35 ELEMENTS OF THE MANAGEMENT CULTURE DERIVING FROM THE CORPORATE CULTURE Emiliya Duneva .................................................................. 43 LEGAL AND ECONOMIC ASPECTS OF THE INTRODUCTION OF EDUCATIONAL CENSUS WHEN VOTING IN THE REPUBLIC OF BULGARIA Ekaterina Bogomilova .................................................................................................... 63 INNOVATION IN MANAGING EDUCATIONAL SERVICES Lykopoulou Zacharoula
........................................................................................................................................ 71 DEVELOPMENT OF MARKETING STRATEGIES IN BULGARIAN ENTERPRISES Dilyana Yaneva .............................................................................................................. 86 MARKET POSITIONING AND INFLUENCE OF TOURIST DESTINATIONS DEVELOPING EDUCATIONAL TOURISM Iveta Voleva-Petrova ............................ 93 SURVEY OF THE ATTITUDES OF BULGARIAN CONSUMERS TO WINE CONSUMPTION Nikolay V. Logodashki ................................................................... 104 ESTABLISHING THE ABILITIES OF EMPLOYEES TO MANAGE WORKING TIME IN VARIOUS ASPECTS OF THE WORK PROCESS Emiliya Duneva ......... 119 HOW HR PRACTICES AFFECT ORGANIZATIONAL COMMITMENT AND ORGANIZATIONAL CITIZENSHIP BEHAVIOR Majida Jrad ................................ 130 QUALITY PASSENGER SERVICE IN AIR TRANSPORT AS A FOUNDATION FOR BUILDING LOYALTY TO AIR COMPANIES Svetla Tzvetkova ............................ 161 RISK MANAGEMENT IN THE DEVELOPMENT OF TRANSPORT PROJECTS Svetla Tzvetkova .......................................................................................................... 173 EDUCATION MANAGEMENT AND THE IMPACT OF INNOVATION Lykopoulou Zacharoula ................................................................................................................... 183 STRATEGIC MARKETING PLANNING IN THE PRESENT-DAY ORGANIZATION Dilyana Yaneva ............................................................................................................ 197 SCORE CARDS FOR EVALUATION OF RFI AND RFP PROCESSES WITHIN ONE OF THE BULGARIAN TELECOMMUNICATION OPERATORS Avgustin Milanov ...................................................................................................................................... 206

7
Entrepreneurship ISSN: 2738-7402
DOI: 10.37708/ep.swu.v8i2.1 Volume: VІII, Issue: 2, Year: 2020, pp. 7-15
POSSIBLE THREATS, OBSTACLES AND LIMITATIONS IN IMPLEMENTATION OF BUSINESS INTELLIGENT IN
BULGARIAN SMALL AND MEDIUM-SIZED ENTERPRISES Melina Neykova1
Received: 03.09.2020, Accepted: 09.09.2020
Abstract Intelligent information systems for business analysis are a strategic tool that
enables different sized organizations to analyze and manage huge amounts of business information. Therefore, in recent years, the information and communication technology industry continuously generates intelligent solutions that perform fast retrieval, transformation, organization, analysis and summarization of large amounts of data. Simultaneously the type and number of business intelligent solutions on the market is steadily growing, which in turn can affect the possibility of failure in the process of perception and implementation of the chosen solution in Bulgarian small and medium-sized enterprises. In this sense, the analysis performed in the presented article is valuable for Bulgarian managers, as it is aimed at studying the factors - the most common threats, obstacles and limitations that affect the process of introducing modern business intelligent systems as part of the policy for improvement of the existing information and communication system in Bulgarian small and medium-sized enterprises.
Keywords: information and communication technologies (ICT), business intelligence systems (BIS), small and medium-sized enterprises (SMEs),
JEL Codes: C80, C88, L86, M10, M15
1. Introduction
Well-established good practices among organizations worldwide show that the successful management of the business community increasingly depends on the adoption of effective strategies related to the improvement of the implemented and functioning information and communication infrastructure (ICT), as well as the integration of innovative, adaptive, flexible and adaptable platforms and solutions (Neykova & Miltchev, 2019). Unfortunately, in practice, as a result of the growing mobility of enterprises and the automated activities performed on the Internet or the intranet/extranet, large generated data flows are
1 University of Forestry, Department of Computer Systems and Informatics, Researcher, e-mail: [email protected], ORCID ID: https://orcid.org/0000-0003-1016-962X

8
often not processed efficiently, so that their analysis can lead to a clear assessment of the situation and the priorities for the development of the organization, as well as to the planning and extrapolation of the data. In response to this, in recent decades the industry of information and communication technologies (ICT) continuously generates applications and technological tools that can be used for data management, for studying models and trends in data and information, and for business intelligence (BI). In order to meet the set of consumer needs for business analysis of organizations, BI software companies in the market develop different products, each of which is designed to support one of the five categories shown in Figure no. 1. (MicroStrategy, 2013)
Figure no. 1. The categories of BI applications
Source: MicroStrategy, 2013
Numerous reports and academic studies have examined a trend showing business intelligence solutions (BIS) as an important element present in the list of priority technologies of different sized organizations. This is because company managers, as well as lower-level employees in organizations, need accurate information, analysis and visualization through various real-time business analysis software tools to properly assess the state and priorities for the development of the company and to make effective management decisions. BIS provide the management of the companies with an effective way of presenting a multidimensional description of data through tools for quick extraction,
9
transformation, organization, analysis and summary of a large amount of business information (Shariat & Hightower, 2007; Watson & Wixom, 2007; Yeoh & Koronios, 2010; UL-Ain et al., 2019).
In addition, the business intelligence systems support decision-making processes, they are applicable in all small and medium-sized enterprises (SMEs) and will contribute to increasing their competitiveness. Moreover, business intelligence technologies will help to create a more complete picture of the organization's development at the particular time of analysis, as well as to integrate data generated from different sources, which will help support the process of rethinking and future planning of the vision and development of the business structure. At the same time, however, this strategic tool must be coordinated and integrated with the business space and the decision-making environment used in the organization and it is exactly this proportion that is the key to the success of business intelligence (Clark at al., 2007). Therefore, the implementation of such a system will lead to the transformation of business data into valuable information and knowledge which will help the management team of professionals to take timely, informed, well-founded management decisions and actions in the context of the rapidly changing business environment worldwide. As the main purpose of business intelligence systems (BIS) is to support decision-making processes, they are applicable in all small and medium-sized enterprises (SMEs) and will contribute to increasing their competitiveness.
Given that intelligent information systems for business analysis can be considered a strategic tool for improving the ICT of the enterprise (Watson & Wixom, 2007), which increases the innovation capacity of the organization and helps to improve the business activity, the type and number of BI solutions on the market has been constantly growing in recent years, and this affects the challenges in the process of perception and implementation of the chosen solution, as well as increases the risk of failure. This is because the development of BIS is a long process and requires serious analysis, large investments and constant changes in the functioning and adjustment of the generated results, as well as in the flexibility and perception of management teams. The good global practices show that the successful implementation of a BI system implementation project provides many advantages and opportunities for experts and company managers to make more effective timely management decisions. However, according to Farrokhi and Pokoràdi (2012), the risk of failure in the implementation of BI projects is high. In this sense, the presented analysis seeks to examine the factors - the most common threats, obstacles and constraints that affect the process of introducing modern business intelligent systems as part of

10
the policy to improve the existing information and communication system of Bulgarian small and medium-sized enterprises. Such an analysis is especially valuable for Bulgarian managers, whose companies participate in the implementation of BI projects and are faced with assessing the readiness of their organizations before launching the implementation phase of the project.
2. Possible threats, obstacles and limitations in the process of BI implementation in Bulgarian SMEs
Defining the main factors that influence the process of implementation and use of BIS in Bulgarian small and medium-sized enterprises will allow the management units to look for ways to overcome them. In this sense, the managers of small and medium-sized enterprises should be aware of the pros and cons of the decision that the company will use and based on that to develop their strategy on how the implemented solution can allow them to be more flexible in managing and analyzing large amounts of data and making effective management decisions. Therefore, the creation of a comprehensive management strategy for the adoption of BIS is particularly important in the process of introducing intelligent business systems in Bulgarian SMEs. To build such a strategy it is recommended that the managers of SMEs take into account the most common threats, obstacles and limitations that may have a significant impact on the failure and/or dissatisfaction with the implementation process, as well as the actions needed to address and overcome them (Table no. 1).
Table no. 1 – Possible threats, obstacles and limitations in the process of BI
implementation in Bulgarian SMEs Possible threats, obstacles and limitations Actions needed to address them
Underestimation of BIS by senior management
Raising their awareness of the advantages of BIS and good practices worldwide in order to understand the specific advantages and the necessary change. Adopting and developing a strategy by the senior management for the implementation and investment in the process of BIS integration.
Insufficient awareness of modern BIS
Carrying out information research on the products offered on the market. Performing an analysis of good practices. Benchmarking (analysis and comparison with the experience of leading and related organizations).

11
Lack of strategy for the introduction of BIS
Raising the awareness of the fact that the implementation of BIS for the specific organization is a unique process and it is necessary to adopt a comprehensive approach for adaptation and integration of BIS to the existing ICT system of the enterprise.
Ignorance and underestimation of possible threats, obstacles and restrictions for BIS implementation
Getting acquainted with performed analyses, research and statistics on the issue. Comparing the experience of related organizations. Incorporating the information received into the BIS strategy in order to minimize costs and overcome the risk of failure.
Managers’ insufficient knowledge of the processes of BIS implementation
Searching for comprehensive sources, getting acquainted with and analyzing individual verified, reliable and quality sources.
Lack of suitable consultants for BIS implementation
Contacting recommended appropriate external consultants. Training their own in-house staff.
Too expensive consulting services
Minimizing the time and increasing the efficiency of the consultations. Training their own in-house staff and maintaining their high qualification with periodic training.
Insufficient staff for the introduction and maintenance of BIS
Recruiting qualified IT staff. Contacting recommended appropriate external consultants.
Insufficient competence and qualification of the staff
Organizing participations and appropriate forms of training (specialized courses, master classes, workshops, business games, simulations, etc.). Conducting staff certification.
Too expensive staff training and certification
Certifying a small number of specialists to train other employees and to participate in all stages of project development and implementation.
Lack of support from functional units
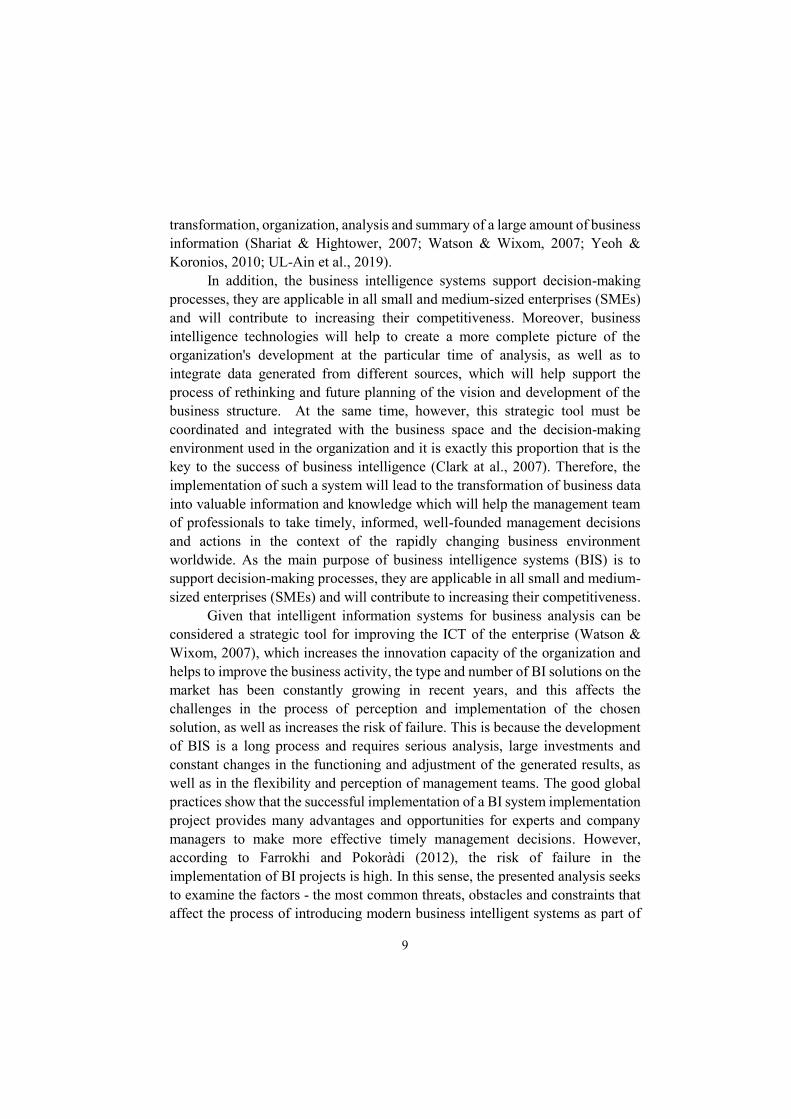
Mandatory involvement of appropriate employees from all functional departments in the discussion of the concepts, formation and implementation of the BIS strategy. Overcoming the internal resistance of employees by jointly discussing and explaining the
12
concepts, goals, processes, activities, roles and responsibilities.
Internal resistance of IT employees
Explaining the benefits of the implementation of BDS, as well as the possible harms of its non-implementation. Stimulating and motivating employees for the process of implementation, use and development of BIS. Proper distribution of roles among employees. Creating a BIS culture in the IT department.
Lack of a balanced and skillful project team
The composition and skills of the BI team have a great influence on the success of the BIS implementation project and the satisfaction with its use. Selecting team members so that they will work together in the most effective way possible.
Lack of trust between the employees in the separate functional divisions and the managing units
Joint discussion and explanation of concepts, goals, processes, activities, roles and responsibilities. Explaining the benefits of implementing BIS. Demonstrating a specific application in a selected functional unit.
Lack of a suitable ICT system in the enterprise
The overall strategy for BDS implementation should also include the construction of basic IC facilities necessary for the proper functioning of BIS.
Lack of analysis of the state of an existing ICT system
Performing an IT analysis showing the current state of the ICT system - its capabilities and disadvantages, such as: ease of use, functionality, reliability, flexibility, and response time. Possibility for integration with the BIS selected for implementation.
Badly supported ICT system
Consulting an IT specialist on the adoption of measures for the appropriate renewal of the existing ICT in order to ensure the proper functioning of BIS.
Too expensive implementation
Gradual implementation. Creating a long-term program of projects. Proper definition of the scope, processes, activities, elements and priorities of the system. Allocating time, human and financial resources.

13
Too much complexity of the processes related to the implementation of BIS
Creating and maintaining a multi-layered model for managing the BI system, consisting of its description on a conceptual, logical and physical level. Ways to overcome the complexity - breaking it down, setting priorities, phasing in funding and implementation.
Expensive ready effective solutions
Assessing their own possibilities for acquiring a ready solution. Calculating the return on investment indicators. Evaluating the effectiveness of the ready solution and analyzing the feedback for its practical use. Purchasing parts of individual modules according to the established strategy.
Too long implementation period
Systematizing the individual units responsible for the implementation and compliance with the strategy for BIS integration. Managing the awareness of individual units and the subsequent implementation. Creating a program of projects, synchronizing the activities at the different stages of implementation and elements of BIS.
Providing support / service of the implemented BIS
Providing support for the implemented BIS by qualified employees. Creating a service culture in the organization. If necessary, using external consultants.
However, despite the problems and challenges discussed above, the author
agrees with Jones and Van (2010), who emphasized that the benefits of BI for the business far outweigh the costs, stating that BI can be the differentiating factor in the market during periods of poor economy, can facilitate marketing communication plans, and aid in pre-selling an idea to the target customers. In this sense, the statement that "strategic leaders are known for thinking ahead, preparing for succession and implementing strategy" (Stamevska & Stamevski, 2020) suggests that Bulgarian SME managers need to rethink and adopt a comprehensive strategy for the application of intelligent technologies for business analysis. Such a strategy can be considered to be the key to improving the ICT of the enterprise. It can become a source of innovative growth and give a strong impetus to the development of organizations, giving them priorities for positioning and expanding the market of manufactured goods and services, as well as for achieving higher competitiveness.
14
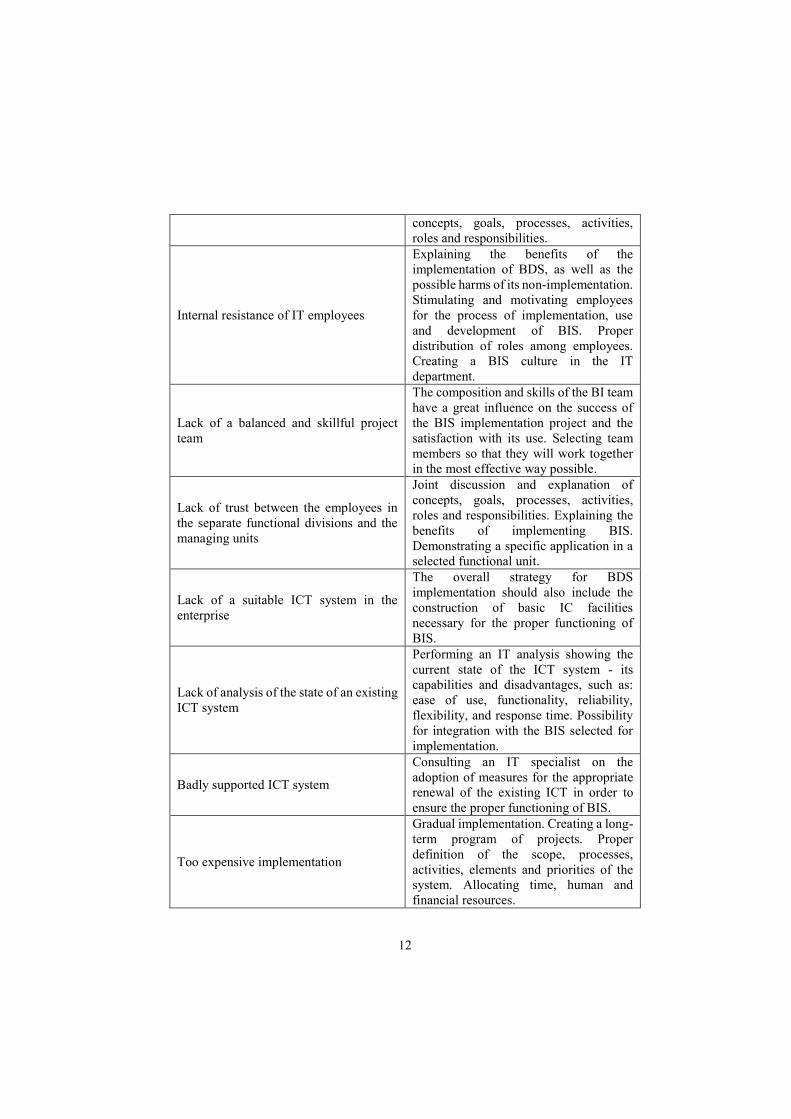
3. Conclusion
BIS can be considered to be a key approach for modern Bulgarian small and medium-sized enterprises, which with proper implementation will inevitably lead to sustainable development in the process of monitoring and control of processes related to the processing of large data sets, the extraction of valuable information, and making timely management decisions. Undoubtedly, the implementation of BDS can be seen as a tool for improving the ICT of the enterprise, improving the quality of products and services, reducing costs and increasing the efficiency and effectiveness of the entire organization.
Therefore, the creation of a comprehensive management strategy for the adoption of BIS is of particular importance for Bulgarian small and medium-sized enterprises. It can be seen as a source of innovative growth and can give a strong impetus to the development of the organization. Therefore, it is necessary for SME managers to rethink and adopt a comprehensive strategy for the implementation of BDS, taking into account the most common threats, obstacles and constraints that may have a significant impact on the failure and/or dissatisfaction with the implementation process. An example of this is the difficult choice between the great variety of new platforms and the high dynamics of their generation on the world market, which requires high professional competence and in-depth knowledge of the ICT specifics of the particular enterprise, as well as the willingness of the staff to cooperate in carrying out innovation activities. In addition, the process of BIS implementation is directly related to the existing and operating ICT system in the enterprise. Also, SMEs may face the issue of financial insufficiency for the implementation of BIS and their maintenance. At the same time, with the introduction of BIS, modern companies increasingly tend to look for qualified specialists who have the skills and knowledge to work with software platforms and technologies for in-depth multi-dimensional analysis, but they are difficult to find on the market.
4. Future Studies
The performed analysis is a logical basis for а future in-depth study of the current state of the BDS used in Bulgarian small and medium-sized enterprises.

15
REFERENCES
Clark, T. D., Jones, M. C., Armstrong, C. P. (2007). The Dynamic Structure of Management Support Systems: Theory development, research focus and directions. MIS Quarterly.
Farrokhi, V., Pokorádi, L. (2012). The necessities for building a model to evaluate Business Intelligence projects- Literature Review. International Journal of Computer Science & Engineering Survey (IJCSES), vol. 3, pp. 1-10, 2012.
Johns, P., Van, D. (2010). Business intelligence in service marketing: a new approach with practical application. Mark Intell Plan 28(5):551–570.
MicroStrategy. (2013). Architecture for Enterprise Business Intelligence. Available at: https://www.microstrategy.com/Strategy/media/downloads/white-papers/MicroStrategy-Architecture-for-Enterprice.pdf
Neykova, M., & Miltchev, R. (2019) Conceptual approach to introduce an integrated model improving SMEs e-business technologies. Management Theory and Studies for Rural Business and Infrastruc-ture Development, 41(3), 381–399, https://doi.org/10.15544/mts.2019.31
Shariat, M., & Hightower Jr, R. (2007). Conceptualizing business intelligence architecture. Marketing Management Journal, 17(2), 40-46.
Stamevska, Е., Stamevski, V. (2020) Decisions and skills of the strategic leaders. Economics and Management, Volume: XVІІ, Issue: 1, pp. 140-146. ISSN: 2367-7600. Available at: http://em.swu.bg/images/SpisanieIkonomikaupload/SpisanieIkonomika2020/_vol.XVII_issue_1_2020-140-146.pdf
UL-Ain, N., Giovanni, V. & DeLone, W. (2019). Business intelligence system adoption, utilization and success – A systematic literature review, Proceedings of the 52nd Hawaii International Conference on System Sciences, January 8 – January 11, 2019, Grand Wailea, Maui.
Watson, H. J., & Wixom, B. H. (2007). The current state of business intelligence. Computer, 40(9), 96-99.
Yeoh, W., & Koronios, A. (2010). Critical success factors for business intelligence systems. Journal of computer information systems, 50(3), 23-32.

16
Entrepreneurship ISSN: 2738-7402
DOI: 10.37708/ep.swu.v8i2.2 Volume: VІII, Issue: 2, Year: 2020, pp. 16-26
CORPORATE GOVERNANCE OF STATE-OWNED ENTERPRISES: NATIONAL PRACTICES OF THE BOARD
Spartak Keremidchiev2 Miroslav Nedelchev3
Received: 09.07.2020, Accepted: 11.08.2020
Abstract
The purpose of this article is to present good practices, experience and ideas related to the organization and functioning of the board of state-owned enterprises. Corporate governance practices are represented by three characteristics of the board: nomination, composition and remuneration.
The results of the article reveal a wide variety of board practices in different countries. They are determined by the state ownership policy of the respective country. Various practices and experiences are presented, which can be included in a kind of menu for selecting appropriate tools to promote and strengthen the boards, and thus the corporate governance of state-owned enterprises in Bulgaria.
Keywords: nomination, composition, remuneration
JEL Codes: D23, D86, G34, M12, P51
Introduction
In theory, the board of state-owned enterprises is viewed through the prism of the debate on the need for state ownership and the efficiency of state-owned enterprises. Researches on good practices on board builds on perceptions of the need for state-owned enterprises (Kim & Chung, 2008). In parallel, there are strong arguments for the innate inefficiency of state-owned enterprises compared to the private sector (Alchian, 1965). The foundations of state-owned enterprises and their role in the efficient allocation of public resources have been criticized, which cannot be achieved given the lack of a motive for profit and incentives for managers whose income is not related to the performance of the enterprise (Domberger & Piggott, 1994). Other arguments are directed at the state as a
2 Economic Research Institute, Bulgarian Academy of Sciences, Prof., PhD, [email protected], ORCID ID: https://orcid.org/0000-0003-1482-7546 3 Economic Research Institute, Bulgarian Academy of Sciences, Chief Assist., PhD, [email protected], ORCID ID: https://orcid.org/0000-0003-2372-1049

17
principal and the impossibility for it to withdraw from ownership if the goals of the enterprise are not achieved (Florio, 2004). Exercising control over state-owned enterprises solely through the budgetary framework is also considered a weakness in their governance (Chang, 2007). There is an understanding of the lack of corporate control and the impossibility of acquiring and buying a state-owned enterprise with low performance (Vickers & Yarrow, 1988). These criticisms require answers both theoretical and practical aspect. Here are the answers that good practices provide.
Practices of board of state-owned enterprises Modern reform in the field of state-owned enterprises is based on the triad
related to the understanding of the nature of the state, the board and managers (OECD, 2013). The trend is to provide real decision-making powers and division of responsibilities for the decision taken. The ultimate goal of the reform is to avoid conflicts of interest and demotivating factors.
In the 1990s, the state acted as a passive shareholder and rarely used the board as a mechanism to exercise control over the management of the company (Grosman et al., 2016). At the beginning of the 21st century, the state is more active in exercising its functions as a shareholder by nominating its senior officials to the boards of state-owned enterprises.
The widespread “commercialization” of state-owned enterprises in recent decades has prompted governments to take action to professionalize boards and give them greater powers and autonomy (OECD, 2013). This includes protecting boards from political interference and ensuring independence in decision-making. Another important step is to pay more attention to the composition of the board to ensure the right combination of skills and experience to achieve the goals of the state-owned enterprise.
Nomination of board members
An empirical study of the boards of state-owned enterprises defines the composition as a characteristic feature of the board together with its role and dynamics (Chambers & Cornforth, 2010). Research on the composition of the board of state-owned enterprises is rare in the specialized literature.
In most countries, there are no standard procedures and criteria for nominating board members of state-owned enterprises, unlike in the private sector. In most cases, line ministries nominate board members through shareholders' meetings. This is the challenge of corporate governance of state-owned enterprises - to find a balance between the responsibilities of the state to
18
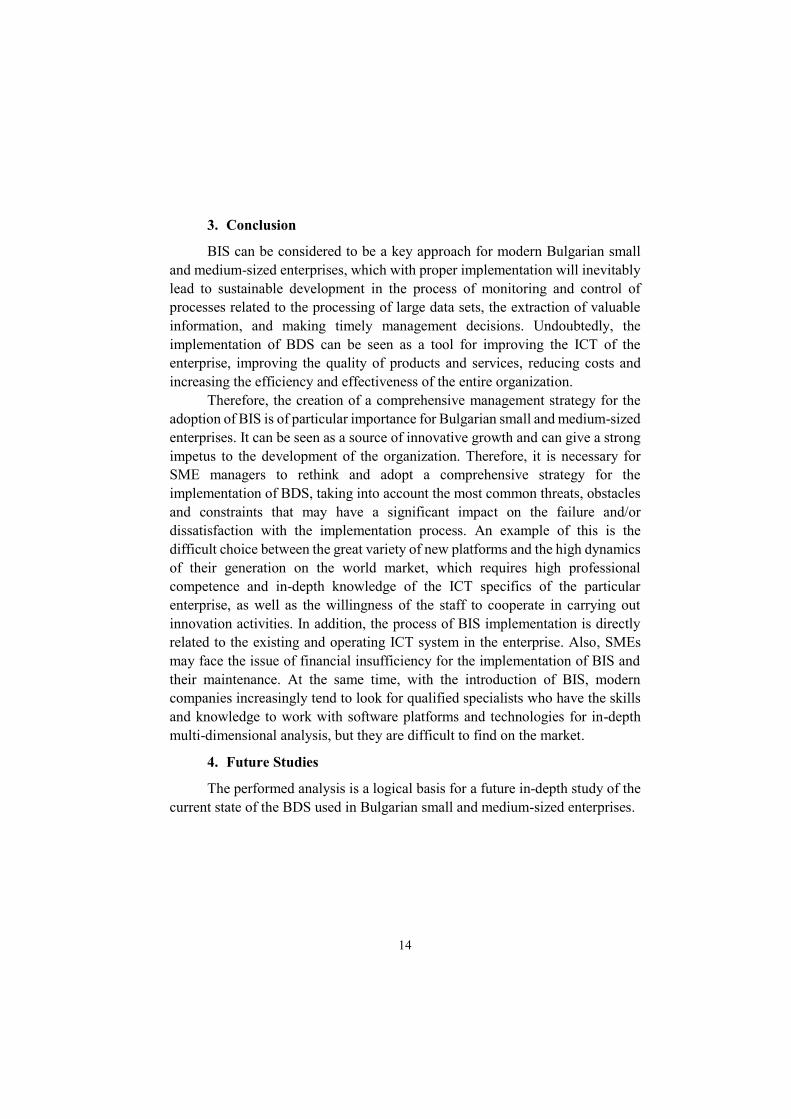
actively perform its functions as owner in the nomination of board members, and at the same time to refrain from political interference in the enterprise (Erić & Stošić, 2011). Improper state policy in the nomination of the board leads to public distrust due to the transformation of state-owned enterprises into an “extension of the ministry” (OECD, 2015c).
The quantitative composition of the board is easier to analyze and compare. Increased board composition does not necessarily mean better corporate governance (Chen, 2016). The first version of the 2005 OECD Guidelines for Corporate Governance of State-Owned Enterprises states that "determining the correct board size is an important issue in promoting the efficiency of boards", although there is no universal approach. The OECD's conclusions are aimed at increasing the number of board members in state-owned enterprises, although there has been a downward trend in recent years. At a later stage, the OECD noted that the optimal board size was between five and eight members (OECD, 2013).
The large number of board members leads to "clumsiness" (Robinett, 2006). The tendency to expand the composition leads to the board being considered as a kind of "parliament" in which a number of groups are represented, and not as a governing body of the enterprise. In certain cases, unique situations arise in which the number of board members is greater than the number of employees in the company (European Commission, 2016).
In determining the composition of the boards, the commitment of each of the nominees should be taken into account and the possibility for each member to pay due attention to the state-owned enterprise should be provided for. While in the private sector there is a restriction for one person not to hold positions on more than four boards, in the public sector there are paradoxical cases - only eight people hold positions on the boards of each of the 42 state forest enterprises in Lithuania (OECD, 2015c ). The situation is similar in the Lithuanian road maintenance sector, where five identical civil servants collectively manage the 11 state-owned enterprises in the sector.
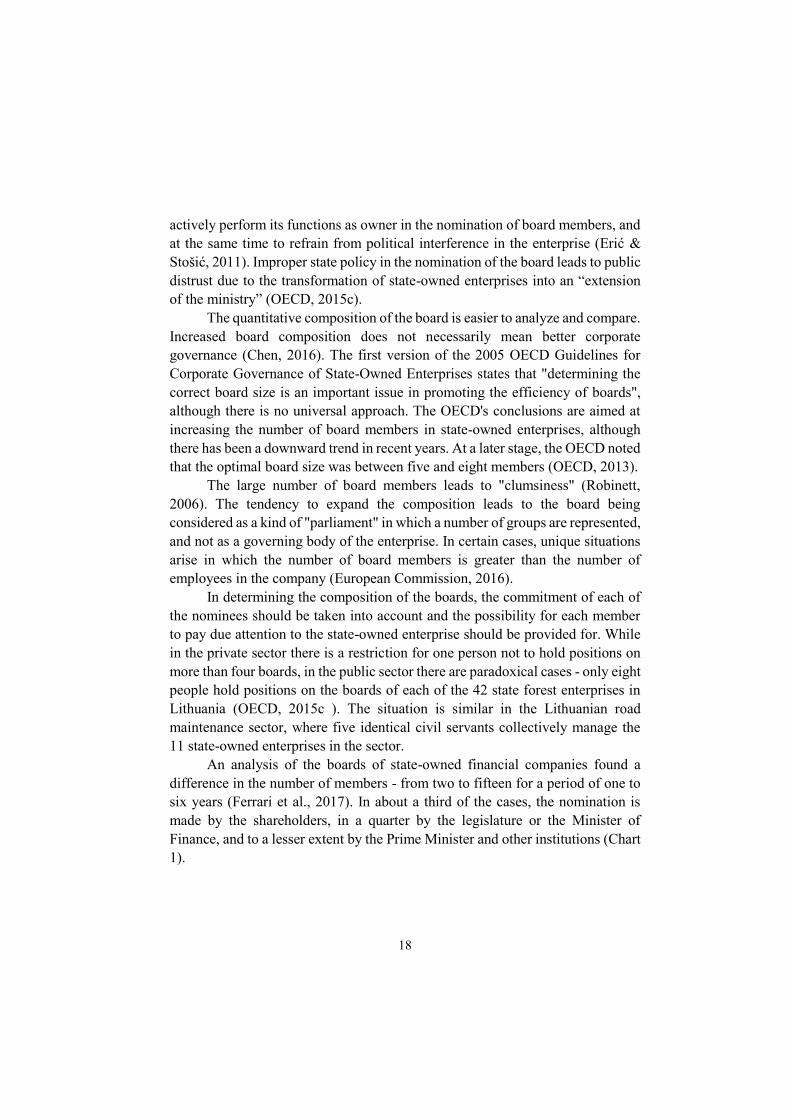
An analysis of the boards of state-owned financial companies found a difference in the number of members - from two to fifteen for a period of one to six years (Ferrari et al., 2017). In about a third of the cases, the nomination is made by the shareholders, in a quarter by the legislature or the Minister of Finance, and to a lesser extent by the Prime Minister and other institutions (Chart 1).

19
Chart 1. Leading authority in nomination of board members
Source: Ferrari et al., 2017 The quality composition of the board reflects its professionalism.
Minimum requirements are set for education and experience, and skills in finance, business, law and corporate governance have more weight in the nomination process. It is common practice for board members to be civil servants with no experience in running companies and to be nominated for political reasons rather than on the basis of their technical and financial expertise (World Bank, 2014b). In most countries, a combination of education and experience is used in board nomination (Table 1). It is recommended that private sector practices be applied in state-owned enterprises, such as the use of external consultants to recruit candidates and create databases for directors (OECD, 2013).
0
10
20
30
40
50
shareholders legislative body Minister of Finance Prime Minister others
nomination of board members nomination of board chairman

20
Table 1. Regulatory framework for board nomination for OECD member countries
Source: OECD, 2013. In rare cases, such as in Argentina, there are no requirements for board
skills and experience (OECD, 2018). In Lithuania, there is an inter-ministerial commission for the nomination of the board of large state-owned enterprises, which is guided by criteria such as financial expertise, experience in strategic planning and sector-specific knowledge and experience (OECD, 2015c). Boards in Colombia include ministers, and in some cases, executive directors are nominated directly by the president of the republic (OECD, 2015b).
States shall take steps to limit the nomination of government representatives on the boards of state-owned enterprises and, when nominated, to ensure that they meet the necessary qualifications and have the same duties and roles as any other member of the board. The steps in this direction are (World Bank, 2014b):
– Limiting the number of government representatives on the boards, while increasing the share of private sector members. For example, in Indian state-owned enterprises, a maximum of two government representatives can be nominated on the board, usually government officials from the relevant ministry.
– Prohibition of civil servants who have a regulatory function from nomination in boards. The practice in Malaysia in recent years has been related to the removal from the boards of government officials with a regulatory function
Responsibility for nomination
Qualification required Guidelines / restrictions on members'
characteristics
Public, private and independent
Austria
The right to nominate is exercised by the ultimate owner, ie. the ministry that administers the state-owned enterprise
Supervisory board members must have "the necessary qualifications and experience"
There is a quota for women's representation
Both public and independent
Belgium
Nomination by decree of the King after consultation with the Cabinet of Ministers
There are no formal requirements
Board members have limits on the number of directorships they can hold
Both public and independent
Brazil
One member is nominated by the Ministry of Planning, Budget and Management. The other members are nominated by the line ministry
University degree required. Other requirements are set out in the company's articles of association
There are usually restrictions only for Brazilian citizens
Mostly from the public sector
Canada Nomination by the relevant minister
There are no formal requirements
There are no formal requirements
Mostly independent
ChileNomination by a centralized ownership system
There are no formal requirements
The maximum number of nomination per director is five
Independent

21
for independent policy and increasing the business orientation of state-owned enterprises.
– In limited cases, in the nomination process, the government and each board agree annually for detailed financial objectives, based on the results of internationally competitors (World Bank, 2014a). In New Zealand, the expected dividends and other financial ratios are negotiated on a three-year basis as a result of the activities of state-owned enterprises.
Independent directors and board committees
The main mechanism for preventing conflicts of interest is the nomination of independent directors on the boards of state-owned enterprises (OECD, 2015c). In the practice of individual countries, their independence is often questioned (World Bank, 2014a). Current views on the number of independent directors are related to the ability and capacity of the board to make independent decisions (Chen, 2016).
Independent board members are primarily in charge of overseeing the state-owned enterprise and, to a lesser extent, a source of expertise (Robinett, 2006). Given the nature of independent directors, it is understandable that their market is limited in emerging market economies for both private and state-owned enterprises. In Colombia, the laws on state-owned enterprises, which are listed on the stock exchange, provide for a quota of at least 25% for independent directors. Lithuanian state-owned enterprises do not offer liability insurance to board members, which is an obstacle to attracting independent board members (OECD, 2015c).
The presence of board committees can reduce the negative influence of the state on the corporate governance practices of state-owned enterprises (Krause, 2013). Country practices converge on the existence of audit committees:
– In Argentina, there are legal requirements for the establishment of audit committees for registered companies, banks, stock exchanges and some state-owned enterprises (OECD, 2018). The Code of the National Securities Commission recommends the establishment of committees on remuneration, nominations, corporate governance and finance for listed companies. In practice, audit committees have the function of overseeing internal and external audits and risk management policies. The members of the audit committees must be trained to ensure the management of the company. The Banco de Inversión y Comercio Exterior SA has the largest number of committees: 1) audit committee, 2) credit and operations committee, 3) management committee, 4) money laundering
22
prevention committee, 5) management committee risk, 6) Committee on Trust Funds and Infrastructure Projects, 7) Debt Recovery Committee.
– In Colombia, the establishment of an audit committee is mandatory for all state-owned enterprises (OECD, 2015b).
– In Latvia, the establishment of specialized committees on the board is voluntary and they serve as a useful means of communication between shareholders and the board (OECD, 2015a). Audit committees are most widespread. The telecommunications company Lattelecom has the most committees - a remuneration committee, a business planning and financing committee and an audit committee. The rules of procedure of these committees shall be mutually agreed by the members of the committees.
– In Lithuania, state-owned enterprises listed on stock exchange are required to establish audit committees (OECD, 2015c). For large state-owned enterprises, the establishment of an internal control committee and a remuneration committee is required.
– The situation is similar in Slovenia, where audit committees are mandatory for boards of state-owned enterprises (OECD, 2011).
Remuneration of managers and executive directors
Despite the differences in nature between the boards of public and private sector enterprises, there is a common feature related to agency conflict (Menozzi & Urtiaga, 2008). One of the tools for reducing agency conflict is the remuneration mechanism. There are various practices for determining remuneration in different countries:
– Since 2010, in the Czech Republic was adopted principles for the remuneration of managers of state-owned enterprises. The principles apply good remuneration practices through standard structures and increase transparency. On an annual basis, principals inform the government of remuneration practices.
– In Finland, guidelines on management fees and pension benefits were adopted in 2009. Remuneration schemes are the responsibility of the chairman of the board and possibly the remuneration committee. Only independent board members are involved in remuneration decisions.
– In Norway, guidelines for the remuneration of management in state-owned enterprises have been in force since 2006. They require state-owned enterprises not to use stock options in their management remuneration programs.
– Since 2015, Poland's remuneration policy for state-owned enterprises has been aimed at converging with that in the private sector.

23
– Since 2009, in Sweden, the remuneration of the CEO has been the responsibility of the board. The Board should ensure that the remuneration of both the Chief Executive Officer and other executives remains within the guidelines set by the annual general meeting of shareholders.
From the analysis of the literature the following specifics of the remuneration of the members of the board in the state enterprises can be determined:
– Board members nominated by ministers and employees' representatives, as well as non-executive members, shall not receive compensation other than a nominal fee (Robinett, 2006).
– For state-owned enterprises, the lack of external control, such as access to capital markets, makes it difficult to assess the effectiveness of managers (Sokol, 2009).
– Managers of state-owned enterprises have lower incentives to perform than private enterprises, as state-owned enterprises are usually subject to "soft" budgetary constraints and are protected from bankruptcy and hostile takeovers. (Pargendler, 2012).
– The practice in Serbia, aimed at fixed remuneration of executive directors of state-owned enterprises, does not link the results achieved with bonuses and sanctions. Successful and unsuccessful CEOs receive equal recognition, and attracting good CEOs is very difficult. (Mirić et al., 2018).
In most countries, the remuneration of board members of state-owned enterprises is below market levels for the necessary competencies and experience (OECD, 2013). As a general rule, governments tend to limit the remuneration and incentives of both CEOs and board members. Some countries seek to equate pay with market conditions, but not to be market leaders, while others are significantly more restrictive.
The models used are: 1) limiting the remuneration to the fee for attending a board meeting; 2) limitation of the remuneration of the directors in relation to the average salary for the state enterprises; and 3) developing a "fee policy", taking into account factors such as the size of state-owned enterprises, time requirements and formal qualifications.
Conclusion
Modern practices on board are shaped by national state ownership policy. The key trends in the development of the boards can be expressed as professionalization, depoliticization and achievement of pre-set financial goals. With regard to the size of the board, no direct relationship has been established between the number of its members and the performance of state-owned

24
enterprises. In most cases, the number of board members is between five and eight. To ensure professionalization of the board, requirements for qualification and experience in management, finance and corporate governance are applied. The participation of civil servants in the boards is limited and rules are developed to determine the remuneration of its members.
The main tools in the individual practices are the specialized committees, which in most cases are the audit committee and the risk assessment committee, as well as the nomination of independent directors on the boards of state-owned enterprises to prevent conflicts of interest. Independent board members perform primarily supervisory functions in the state-owned enterprise and are less of a source of expertise.
The study of foreign practices and experience in corporate governance of state-owned enterprises reveals a wide range of policies and tools that are applied in different countries. Most of them are based on the OECD guidelines for corporate governance of state-owned enterprises. The conclusion that can be made regarding the Bulgarian situation is that good examples and practices exist, they are constantly evolving and enriching. Their use is the result of combining centralized efforts with ingenuity and creativity at the level of a state-owned enterprise. REFERENCES
Alchian, A. (1965). Some Economics of Property Rights. Il Politico, 30, 816–829.
Chambers, N. & Cornforth, C. (2010). The role of corporate governance and boards in organisational performance. In Walshe, K., Harvey, G. & Jas, P. (eds.) Connecting Knowledge and Performance in Public Services: From Knowing to Doing. Cambridge: Cambridge University Press.
Chang, H. (2007). State-Owned Enterprise Reform. New York: United Nations.
Chen, C. (2016). Solving the puzzle of corporate governance of state-owned enterprises: The path of Temasek model in Singapore and lessons for China. Northwestern Journal of International Law and Business, 36(2), 303–370.
Domberger, S. & Piggott, J. (1994). Privatization Policies and Public Enterprise: a Survey. In Bishop, M., Kay, J. & Mayer, C. Privatisation and Economic Performance. Oxford: Oxford University Press.
Erić, D. & Stošić, I. (2011). Upgrading corporate governance practice of state owned enterprises in processes of EU integration – comparation of Serbia and Slovenia. In Contemporary issues in the integration processes of Western Balkan countries in the European Union. International Center for Promotion of Enterprise, Ljubljana, 234–236.
25
European Commission. (2016). State-Owned Enterprises in the EU: Lessons Learnt and Ways Forward in a Post-Crisis Context. Institutional paper 031. Brussels.
Ferrari, A., Mare, D. & Skamnelos, I. (2017). State Ownership of Financial Institutions in Europe and Central Asia. Policy Research Working Paper 8288. Washington, DC: World Bank.
Florio, M. (2004). The Great Divestiture: Evaluating the Welfare Impact of the British Privatizations 1979-1997. MIT Press.
Grosman, A., Okhmatovskiy, I. & Wright, M. (2016). State Control and Corporate Governance in Transition Economies: 25 Years on from 1989. Corporate Governance: An International Review, 24(3), 200–221.
Kim, J. & Chung, H. (2008). Empirical Study on the Performance of State-owned-enterprises and the Privatizing Pressure: The Case of Korea. Seoul National University.
Krause, T. (2013). Corporate Governance of Corporate Government: A Literature Review on the Relationship between Internal Corporate Governance Practices and Performance in State Owned Enterprises. Tabled Paper prepared for the Annual Conference of the European Group for Public Administration (EGPA), 2013, Edinburgh, Scotland in the Study Group V “Regional and Local Government”.
Menozzi, A. & Urtiaga, M. (2008). Board composition and performance in State-Owned Enterprises: evidence from the Italian public utilities sector. European Financial Management Association 2008 Annual Meeting.
Mirić, A., Todorović, M. & Janićijević, N. (2018). How can the efficiency of corporate governance in Serbian state-owned enterprises be increased? Ekonomski anali, 63(216), 63–84.
OECD. (2011). State-Owned Enterprise Governance Reform. An Inventory of Recent Change. Paris: OECD Publishing.
OECD. (2013). Boards of Directors of State-Owned Enterprises: An Overview of National Practices. Paris: OECD Publishing.
OECD. (2015a). OECD Review of the Corporate Governance of State-Owned Enterprises. Latvia. Paris: OECD Publishing.
OECD. (2015b). OECD Review of the Corporate Governance of State-Owned Enterprises. Colombia. Paris: OECD Publishing.
OECD. (2015c). OECD Review of the Corporate Governance of State-Owned Enterprises. Lithuania. Paris: OECD Publishing.

26
OECD. (2018). OECD Review of the Corporate Governance of State-Owned Enterprises. Argentina. Paris: OECD Publishing.
Pargendler, M. (2012). State Ownership and Corporate Governance. Fordham Law Review, 80(6), 2917–2973.
Robinett, D. (2006). Held by the Visible Hand. The Challenge of SOE Corporate Governance for Emerging Markets. Washington, DC.: World Bank.
Sokol, D. (2009). Competition Policy and Comparative Corporate Governance of State-Owned Enterprises. Brigham Young University Law Review, Vol. 2009, No. 1713–1812. Gainesville: University of Florida Levin College of Law.
Vickers, J. & Yarrow, G. (1988). Privatization: an economic analysis. MIT Press.
World Bank. (2014a). Corporate Governance of State-Owned Enterprises in Latin America: Current Trends and Country Cases. Report No.: 89468-LAC. Washington, DC.
World Bank. (2014b). Corporate governance of state-owned enterprises: A Toolkit. Washington, DC.

27
Entrepreneurship ISSN: 2738-7402
DOI: 10.37708/ep.swu.v8i2.3 Volume: VІII, Issue: 2, Year: 2020, pp. 27-34
STATE AND DEVELOPMENT OF INDUSTRIAL AND PUBLIC SECTOR IN COMPARISON OF GREECE WITH THE REST OF
THE WORLD
Kyriaki Papadopoulou1 Received: 25.05.2020, Accepted: 11.08.2020
Abstract
The present study aims at critically accessing and comparing the state and the development of the industrial and the public sector of Greece with the rest of the world. It was found that the Greek economy has faced many ups and downs. Starting from the launch of the euro as the local currency to the massive destruction caused by the financial crisis of 2007. Public and industrial sector of Greek even after witnessing all these major events has been able to establish a good growth trajectory in comparison to the rest of the world. The economy showed strong growth in terms of its manufacturing sector. With food and beverages sector, pulp and paper sector, petroleum and refinery standing out as the major manufacturing industries. While the structural reform taken place in the public sector of Greece helped it to maintain its position in comparison with the rest of the world.
Keywords: state and development, public sector, industrial sector, Greece, Greek economy
JEL Codes: E2, F6, O11.
1. Introduction
Greece which is known as the cradle of the western civilization has witnessed a tumultuous history. The economy has survived the period of authoritarian regimes to the military regimes as well. With Greece becoming the tenth member of European community in the year 1981, it has witnessed a period of intense prosperity. The launch of the Euro as the local currency provided the passage towards the modernization of the economy. 1 Faculty of Economics, South-West University “Neofit Rilski”, 6, Ivan Mihavlov str, 2700 , Blagoevgrad, Bulgaria, PhD student, e-mail: [email protected]; ORCID ID: https://orcid.org/0000-0002-3526-4247

28
However, the financial crisis of 2007 that started from US and quickly spread globally had a profound destructive impact in Greece (Ozturk & Sozdemir, 2015). Abboushi S., in his report (Abboushi, 2011) mentioned that the financial crisis was not the only reason behind the deterioration of the Greek economy. It was majorly due the gaps in the economic and the financial structure of the economy such as financial extravagancy, insufficiency of the Greece government, unfair taxation that aggravated the situation.
The public and industrial sectors of Greece have evolved substantially under these circumstances. The public sector of Greece has conventionally followed three major goals. The first and the primary idea is to reduce the state presence in the economy through liberalizing the markets or by contraction of the public ownership. The second major objective that shapes the public sector of Greece is to reduce the excessive proximity of the public corporations with the politics. The major reason behind this is to reduce their exploitation by the political parties in the form of employment reserves. And finally, rationalization of the state activities (Spanou, 2008).
The state and development of the industrial sector of an economy plays a decisive role in the achievement of sustainable socioeconomic development (Hussin & Ching, 2013; OECD, 2008). The secondary or the industrial sector of Greek has faced a lot of revamping with its vigorous shift towards the industrialization. The major development of the Greek industrial sector can be attributed to the quantitative enlargement that has been achieved by the manufacturing sector there (Chalikias, 2017). In fact, the manufacturing sector in Greece has taken over the agricultural sector in terms of its contribution to the GDP (Linardos, 2015). The sections ahead will provide and elaborate view on the state and development in the industrial and the public sector of Greece. The aim of the study is to critically access and compare the state and the development of the industrial and the public sector of Greece with the rest of the world.
2. Literature review
The idea of state effectiveness as the key factor that encourages economic development is not new. There are various things that comes under the state work responsibilities such as providing public goods, correcting the market failures, reducing the inequality in terms of income and opportunities, stabilizing the economic fluctuations (Tabellini, 2005). However, these factors are not the only ones that makes difference between the success and the failure in the economic development. Rather what makes the real difference is the institutional and the legal infrastructure that protects the property right, enforces the rule of law that

29
affects the development (Tabellini, 2005). Thus, the state’s essential role in harnessing the national resources and further directing them appropriately by using distinctive policy making system is what affects the development of the economy (Dadzie, 2013). Moreover, the development in the form of the industrialization requires capital and coordination at different levels (Kniivilä, 2007). What is majorly required is that markets need to be harnessed so that they can act in the long-term national interest rather than for the short-term individual interest. And state stands as the only one contemporary institution that is capable of such kind of coordination (Wylde, 2017).
Lange M. in his study (Lange, 2005) mentioned the point of view of Adam Smith on the state and development. According to him states are essential for the development and the social transformation. Because the state can enable the institutions and the individuals to engage in the economic activities that can possibly bring development for the economy. States by providing the infrastructural support in term of the contracts, property law, incorporations that allows the exchange of goods and services, lending and investing so that they can proceed with certain degree of ease, security and predictability helps in bringing in development. Further (Bardhan, 2016) mentioned another important explanation provided by Adam Smith is that states are of great importance when it comes to bringing in the socioeconomic development. And provided two possible reasons for this: first is that state works towards breaking down the resistance in the market, second reason is that state through its regulations and social policies moderate the impact of the market and thus led to sustainable market economy.
The present study is based on secondary research. (Martins, Cunha, & Serra, 2018) defined secondary data as the dataset which is not obtained by researcher himself rather the data gathered by someone else. The secondary data sources for the present study includes business reports, books, publications, articles in magazines and journal articles.
3. Discussion
3.1 State and development of the industrial and public sector of Greece
The industrial sector of Greece had witnessed a lot of revamping majorly due to its shift towards industrialization. In, fact in the last few years the manufacturing sector has risen as the core segment of the Greek industrial sector with its contribution exceeding the agricultural sector in terms of its contribution towards GDP (OECD, 2012). (EU-MERCI, 2014) mentioned about the major manufacturing industries that have the major contribution in the Greek industrial

30
sector. This includes the food and beverages sector, pulp and paper sector, petroleum refineries sector.
With food and the beverages sector marked as the pillar of the Greek manufacturing industry due to its contribution in terms of turnover and increased employment. (EU-MERCI, 2018) mentioned that there is almost 15000 food and beverages firms currently operating in Greece which provides employment to around 80,000 people and had average turnover of around USD 11.66 million. Another major industry operating in Greece is the paper and pulp industry. In the year 2014 there were around 641 active paper and pulp companies in Greece. Which consisted of three major subsectors that includes manufacture of pulp, paper and paperboard, manufacturer of paper and paperboard and manufacture of pulp. The sectors combinedly provided employment to around 6.938 people (EU-MERCI, 2014).
Next is the petroleum refinery sector with its main concentration on the manufacturing of the coke and the petrol products. The industry was divided into three major subsectors with one sector focusing on the manufacturing of the coke oven products, manufacturing of coke and refined petroleum products and the other sector focusing on the manufacturing of the refined petroleum products. Further it was found that there were around 42 companies that were active manufacturers of coke and petroleum products which provided employment to around 4,000 people (Kalampalikas & Pilavachi, 2006).
The public sector of Greece, on the other hand, has had a tumultuous history. With the economy of Greece witnessing a change from an authoritarian regime to a military regime, the country’s public sector has been built under volatile circumstances. Greece technically began with its public sector reforms straight after its EU accession but came to the halt with the rise of the military power in the country (Manojlović, 2011). The first official attempt to bring in reforms was made in year 1980s. The second series of the reforms was launched in the period 1991-2000. In this time period Greece was faced many financial difficulties and thus reforms were taken in order to reduce the budget deficit. Further between the year 2001 and 2009 when Greece was economically stable some more visible reforms were carried out. And then finally after the year 2010 (Chardas, 2011).
The key idea behind the public sector reforms was based on its modernization which was necessary to ensure the high-quality provision of public goods and services. The main aim of the reforms was to unify the wage levels among the public officials, establishment of the transparent and merit based recruitment system, introduction of the mobility and the performance assessment,

31
improvement of the countries judicial system, strengthening of the tax system within the country and finally focusing on better management of the public sector entities (Centre of Planning and Economic Research, 2019). With the reforms in its public administration, judicial system and the tax collection system. The public sector of Greece has able to provide employment to around 700,000 people. Further in an report published by (OECD, 2017) it was found that Greece is spending around 54.2% of its total GDP on its public sector which however decreased in the period pertaining to 2015 to 2016 to 49%.
3.2. Rest of the world
The following section focuses on providing the brief comparison between the state and development within the Greece with the rest of the world. With the convergence of Greece with the euro zone what followed seemed to be a success story. Although the country had witnessed some major breakdowns due to the global financial crises but its public sector and the industrial sector has still managed to play well in between of all the circumstances (Neubaumer, 2015).
Figure 1: Comparison of Greek economy with the rest of the world
Source: OECD, 2017 The figure above represents the comparison of the Greek economy with
the rest of the world in terms of certain parameters such as fiscal balances, their average government spending on the public sector, the investment by the government, and the finally the gross debt faced by the government. As shown in the above figure Greece due to its reforms adopted in different time period has been able to compete with the rest the world very well. Further the economy has been able to maintain strong position in terms of their average expenditure on the

32
public sector. Since the development of the public sector plays a crucial role in the overall development of the economy.
4. Conclusion
The present study aimed at accessing and comparing the state and the development of the industrial and the public sector of Greece with the rest of the world by using secondary research approach. It was established that Greek economy had faced many ups and downs over the time period. Starting from its EU accession that the economy witnessed in the year 1981 and its convergence with the euro zone. The GDP of the economy increased by an average of 4.2 percent and what followed was the sustainable environment and intense prosperity. But soon it was established that it was just a false illusion. With the financial crisis outbreak that happened in US in the year 2007, the Greek economy faced major deterioration. The situation highlighted the various gaps in the economic and the financial structure of the economy such as financial extravagancy, insufficiency of the Greece government, unfair taxation. However, with its shift towards the industrialization the industrial sector of Greece had witnessed a lot of revamping. The economy showed strong growth in terms of its manufacturing sector. Further the structural reform taken place in the public sector of Greece helped it to maintain its position in comparison with the rest of the world. Future studies in this topic could include comparison of the Greece with the other OECD countries so that the picture regarding the current state and development of the Greece could become even clearer and could further help with the policy making decisions.
REFERENCES
Abboushi, S. (2011). Analysis and Outlook of the Greek Financial Crisis. Journal of Global Business Management, 7(1), 1–8.
Bardhan, P. (2016). State and development: The need for a reappraisal of the current literature. Journal of Economic Literature, 54(3), 862–892. https://doi.org/10.1257/jel.20151239
Centre of Planning and Economic Research. (2019). Structural reforms in Greece, 2010-2018. (April). https://doi.org/10.2873/100377
Chalikias, J. (2017). The Manufacturing Sector of Greece Before and During the financial Crisis. International Journal of Economics and Business Administration, 5(1), 3–17.
Chardas, A. (2011). How the EU affects domestic institutional capacities : the Europeanisation of Greece ’ s administrative system in the context of the EU

33
’ s Regional Policy.
Dadzie, R. B. (2013). Economic Development and the Developmental State. Journal of Developing Societies, 29(2), 123–154. https://doi.org/10.1177/0169796x13479711
EU-MERCI. (2014). Analysis of the industrial sectors in different countries: Greece. (693845), 1–36.
EU-MERCI. (2018). Analysis of the industrial sectors in different countries: Greece. (693845), 1–36.
Hussin, F., & Ching, C. W. (2013). The Contribution of Economic Sectors to Economic Growth: The Cases of Malaysia and China. International Journal of Academic Research in Economics and Management Sciences, 2(2), 36–48.
Kalampalikas, N., & Pilavachi, P. (2006). The energy policy of Greece. Thermal Science, 10(3), 7–18. https://doi.org/10.2298/tsci0603007k
Kniivilä, M. (2007). Industrial development and economic growth: Implications for poverty reduction and income inequality. In Industrial Development for the 21st Century: Sustainable Development Perspectives (pp. 295–332). New York: United Nations, Department of Social and Economic Affairs.
Lange, M. (2005). States and development.
Linardos, P. (2015). The Development of Industry in Greece 1990-2014 and possible future action for the left industrial policy by Petros Linardos – Rulmond and Savvas Robolis February 2015. (February).
Manojlović, R. (2011). Public Sector Reforms in Greece: Uncertain Outcome of 2010 Reforms. Hrvatska i Komparativna Javna Uprava, 11(2), 337–377.
Martins, F. S., Cunha, J. A. C. da, & Serra, F. A. R. (2018). Secondary Data in Research – Uses and Opportunities. Revista Ibero-Americana de Estratégia, 17(04), 01–04. https://doi.org/10.5585/ijsm.v17i4.2723
Neubaumer, R. (2015). The prologue to the greek crisis.
OECD. (2008). THE CONTRIBUTION OF SERVICES TO DEVELOPMENT AND THE ROLE OF TRADE LIBERALISATION AND REGULATION. UK.
OECD. (2012). Greece at a Glance: Policies for a Sustainable Recover. Oecd, 01–20.
OECD. (2017).Government at a Glance 2017 https://dx.doi.org/10.1787/gov_glance-2017-en
Ozturk, S., & Sozdemir, A. (2015). Effects of Global Financial Crisis on Greece

34
Economy. Procedia Economics and Finance, 23(January), 568–575. https://doi.org/10.1016/s2212-5671(15)00441-4
Spanou, C. (2008). State reform in Greece: Responding to old and new challenges. International Journal of Public Sector Management, 21(2), 150–173. https://doi.org/10.1108/09513550810855645
Tabellini, G. (2005). The role of the state in economic development. Kyklos, 58(2), 283–303. https://doi.org/10.1111/j.0023-5962.2005.00289.x
Wylde, C. (2017). Emerging Markets and the State. Emerging Markets and the State, 15–43. https://doi.org/10.1057/978-1-137-55655-4

35
Entrepreneurship ISSN: 2738-7402
DOI: 10.37708/ep.swu.v8i2.4 Volume: VІII, Issue: 2, Year: 2020, pp. 35-42
STRATEGIC SUSTAINABILITY OF THE ORGANIZATION. STRATEGIC CUBE OR STRATEGIC STATUS MODEL OF THE
ORGANIZATION
Temenuzhka Karolova Chromy –Zhigalova1 Received: 07.10.2020, Accepted: 27.10.2020
Abstract
The strategic sustainability of the organization is determined by the three main components of the strategy that characterize its activities. Three main points of the activity of the organization - economic, political and organizational are integral parts, they form the basis on which the management of the company is built in modern economic conditions. This article analyzes the first component of the organization's strategy.
What balance of political, economic and organizational aspects ensure the best conditions of the company? Revealing the meaning of each of them, it should be borne in mind that the good situation of one or two positions is not sufficient for the stability of the company: a balanced development of all aspects is needed.
Keywords: Model, strategic sustainability, efficient and strategic management, economic transformation
JEL Codes: D 210
1. Introduction
Improving the management system of the enterprise or organization can be achieved by using different approaches. One of them is the model of the strategic state of the organization or strategic cube. It can be assumed that the work of each company depends on the state of the following three components: economic, political and organizational. (Vikhanski, 2006).
1 “Neophyte Rilski” South-West University, Blagoevgrad, Bulgaria Department of Economics, Assoc. prof., PhD, e-mail: [email protected], ORCID ID: https://orcid.org/0000-0001-9436-4240;

36
2. Economic aspect of the strategic condition of the organization.
In general, the essence of the economic aspect depends on solving four main issues:
- What does the company want? - What is its current status? "What does it want to do?" "What will the company do?" These four questions, built in a logical sequence, express the way of
thinking of the decision-maker. If we consider this analytical process of economic aspect assessment in greater details, we will find out that it is comprised of the thorough identification and study of the following issues.
What does the organization want? Upon defining the strategic business zone (strategic work area), the
mission and goals of the company, developing the portfolio of types of activities, the first question can be answered: "What does it want?".
1. To determine the strategic economic zone (GCC), ie. these types of activities in terms of products - a market that coincides with the strategy point. For example, the various GCCs may be related to the production of small electrical appliances for general consumption, professional electronic equipment for TV sets or surgical products.
2. Formulating the mission of the organization, namely revealing the meaning of the existence of the organization and defining the field of activity. This means the way an enterprise defines its place in the economic, political, technological and social environment that surrounds it. For example, support for good self-esteem and health of the population.
3. Determination of quantitative and qualitative goals, which the company wants to reach for the planned period. For example, to increase turnover by 60 % in 2 years and to become a leader in the industry by developing new goods.
4. Choice of portfolio by types of activities in which the company wants to be engaged in the future. For example, to have a balanced portfolio consisting of such activities that are booming and represent industries of the future, but are based on traditional goods, providing an inflow of funds that satisfy the company.
37
What is the organization at the moment? By analyzing the external environment, deviations from the planned
indicators, the existing portfolio of activities and assessing the potential of the company, one can answer the second question: "What is the organization at the moment?".
1. Analysis of the external environment. It is a question of determining each GCC, secondly, identification of the main tendencies of development of the external environment in order to determine the probable dangers; then planning what needs to be done to succeed. For example, possibility of conquering a new market or danger of a new competitor.
2. Assessment of potential. This is an assessment of the totality of the existing funds, their advantages and disadvantages for each GCC, expert examination of each of them. For example, good production equipment, underdeveloped sales network, quality mark, competent human resources, uncertain financial condition of the company.
3. Study of the deviations from the planned indicators. There is usually a difference between what a company wants and what it actually represents which needs to be analyzed. Taking into account the development trends of the external environment and the state of the current company potential, its achievements are assessed provided nothing changes and it works as usually. For example, in three years the reached amount of BG 170 million Lev will be compared with the set target of BG 190 million Lev. The difference of BG 20 million Lev is a deviation that must be analyzed to determine the reasons.( Bankova,2019)
4. Analysis of the existing business portfolio. If the answer to the question: "What does the organization want?" - the desired portfolio by types of activities is meant, therefore the problem here is in the existing portfolio description and the analysis the differences between the desired and the actual one. For example, today's portfolio includes poorly profitable declining activities and types of activities approaching maturity but very profitable. It is necessary to change the content of the activity portfolio, namely to include new types of activities based on a previous but stable basis that corresponds to the available resources.
38
What does the organization want to do? After defining the strategic guidelines for development, the strategy
analyzes their contribution to company goal achievement and mission, and the third question can be answered: "What does the organization want to do?".
1. Determining the strategic tendencies of development. Should any activity be maintained at its current level, or is it better to gradually abandon it or should it be oriented towards a new market or a new segment? For example, for electronic business companies, it must be decided whether to maintain the leading role in the production of a system of medical equipment (in the absence of a government contract), to discontinue the production of household appliances or to switch entirely to the creation of electronic components for high-tech lines.
2. Formulation (definition) of the strategy. The organization determines the global strategy of its development (corporate strategy), i.e. the strategy of each business unit (business strategies) on the basis of which the functional and operational strategies are developed. For example, the strategy of internationalization can be defined as a corporate strategy, and the strategy of differentiation can be defined as a business strategy for one of the divisions.
3. Evaluation of strategy and policy. This assessment refers to the analysis of the contribution of the strategy in the realization of the goals and mission of the organization, taking into account the limited resources available and the trends in the development of the external environment.
What will the organization do? After choosing the strategy, developing the plan for its implementation,
evaluating the future financial results and forming an adequate strategy for the management structure, the last question of the analytical process can be answered. "What will the organization do?"
1. Choice of strategists. It is about choosing a strategy and policies that will be adopted depending on the priorities of the organization. For example, focus efforts on developing new products or new types of activities.
2. Development of programs and work plans. Who should do what first and when? The organization faces similar issues when planning its activities. For example, should it first and foremost improve its position in those strategic economic zones (GCCs) that are in decline

39
or should it focus on creating new products? Should it focus its efforts on development and at the same time prepare a marketing network for new GCCs until the results of marketing research are obtained? What action to take first?
3. Budgeting. Development of a financial plan and assessment of financial consequences of the accepted strategic choice. For example, what will be the additional income from the production of electrical components for high-tech lines and what will be the costs. What additional resources are needed to succeed in this business: production equipment, staff?
4. Search for a management system that is adequate to the strategy. What structure, what control, what planning what ways an organization must choose to give better chances for the success of the strategy? For example, will the company product structure be better than the functional structure? Will decentralized planning be preferred to centralized one? Will control have to relate only to the results, or will it also cover some tasks?
At the same time, when considering the above-listed questions, it is necessary to remember that it is more important to develop a mechanism for this process and ensure its functioning, rather than simply answering the questions raised. The simplified scheme of this process shows that it is cyclic and interactive.

40
Figure no. 1. Scheme of the process of developing economic components of strategic state of the organization
In fact, the process of developing the economic components of a company's
strategic position is not linear and cannot be. Rather, it is about interactive processes that allow a solution to be reached gradually. This decision will be the result of comparing the dangers and opportunities offered by the external environment, the development strategy and the increased competencies of the staff. Of course, this comparison does not take place in such a direct form as presented above. There are usually numerous back and forth movements between each stage (Kiyosaki, 2019).
3. Levels of strategic decision making
There are several levels of strategic decision making in an organization. Each of these levels corresponds to different characteristics of the strategies. Indeed, the development of the economic aspects of the strategy at the level of the company's divisions (business strategy). The different scale of decision-making, the degree of compliance, is specific to strategic decision-making.
The top management of the organization usually addresses several of the most important issues - the mission and general goals of the company; the global vision of the common activities of the same; i.e. the content of its investment portfolio; the use the distinctive organizational and professional abilities of the staff; the study of the long-term competitive advantages of the organization; allocation of resources and efforts for different activities according to priorities; development of specific types of activities, different from the traditional ones, to correspond to the general development strategy.
Dynamic surroundings
Company expertise
STRATEGY

41
At senior management level, some of the above- described issues may have received more attention to the detriment of others. For example, the issues of mission formulation, setting goals, choosing the content of the investment portfolio, assessing the advantages and disadvantages of the industry in which the company is located, and analysis of competitiveness, deviation of achieved results may be of particular importance for the management of the planned indicators. While resolving the last three questions, new tasks arise. On one hand, it is a matter of seeking new areas of interest to the company if guided by the previous types of activities, it cannot reach the state to which it aspires, and, on the other hand, of setting strategic priorities that are not covered by the formal decision-making process, such as the search for suitable companies for possible mergers or their transformation (Ansoff, 1979).
At the business unit level, some other issues will be more important. The search for distinctive features and competitive advantages play a major role here, as well as the manifestation of energy between the types of activities and the functions needed to implement the strategy. Under these conditions, all efforts to implement the strategy are aimed at adapting the types of activities to the characteristics of the specific external environment, to the development of these activities in the market, to the selection of product nomenclature, research guidelines or production methods. (Karolova, 2003)
At the same time, at the level of the business unit the issues that are considered concern the development of the economic aspect of the strategy, considered at the level of senior management of the company (excluding definition of the mission and strategic goal of development of the whole company), but in more details. The issues that concern the choice of strategy, work program development and evaluation of activity financial results are added to the above-listed ones.
4. Conclusion and Recommendations
The process described is aimed mainly at seeking a gradual and integrated correspondence between resources, knowledge, experience, internal capabilities of the company on one hand, and the strategies that need to be changed in order to cope with the competition on the other hand. It is a formal process, which needs to take into account the political aspects of the company's activities, i.e. the respective strength of internal and external factors, otherwise they can either help to implement the strategy or hinder it. The next publication will present and analyze the political and organizational aspect of the strategic state of the organization.

42
REFERENCES
Ansoff. I., Strategic Management. (1979). Igor Ansoff: Strategic Management. - M., 1989. // Electronic publication: Center for Humanitarian Technologies. 2012.
Bankova, I., (2019). Dissonances and potentials in conflict management in project management, VFU University Publishing House "Chernorizets Hrabar" Varna , ISBN 978 -954-715-676-0, p.137
Anderson, J. C., Hoffman Th., A Perspective on the implementation of management Sciense, Academy of Management Review, July 1978 1 p.56 5
Karolova, T., (2003) Strategic management. The ability to lead a modern business, ed. Neofit Rilski ”, Bl., p. 91-93
Karolova, T., (2003) Innovations and innovative development, published by SWU N. Rilski , Bl., p.29
Kiyosaki, R., Fleming J. & Kiyosaki K., Business of the XXI Century, ed. Popurri, 2020
Kiyosaki, R., (2019) Goals and Solutions, Popurri Publishing,
Vasilev, V., Stefanova, D. & Cherkezov, V. (2019) . Crisis Management, PROPELLER Publishing House, ISBN 978-954-392-567-4, p. 6
Vikhanski, O. S., Management, (2006) ed. Economist, M.

43
Entrepreneurship ISSN: 2738-7402
DOI: 10.37708/ep.swu.v8i2.5 Volume: VІII, Issue: 2, Year: 2020, pp. 43-62
ELEMENTS OF THE MANAGEMENT CULTURE DERIVING FROM THE CORPORATE CULTURE
Emiliya Duneva2
Received: 30.09.2020, Accepted: 20.10.2020
Abstract
Nowadays, there is a growing need for a change in response to the environment in which the objects of management operate. The change takes place in conditions characterized by lack of management skills, ignorance of the dynamic processes that influence decision-making, the use of ineffective management approaches and a way of thinking that does not change with the change of the organizational environment. In the business environment, the concept of management culture is perceived as one of the main ways to achieve success and competitiveness.The subject of this research is the management culture of the Bulgarian managers. Initially, the elements were derived from a comparative analysis of different concepts and the search for an analogy with the elements of management culture. Subsequently, after conducting the survey, the respondents will evaluate and compile a final list of elements of the management culture of managers in Bulgarian conditions. In order to achieve the goal stated in the article, we applied: a survey and a method of expert evaluations.
Keywords: management culture, corporate culture, communications, Bulgarian managers
JEL Codes: M14
1. Introduction
Dynamic development requires the high activity of the objects of management in the processes of change of the organizational reality and adaptation of their managerial culture to the cultural change in the organization, in response to the environment.
In fact, while managers test their qualifications, experience and successful management techniques, modern conditions push them to constantly change the key elements of their management in order to be able to successfully solve 2 University of National and World Economy, Sofia, Assist. Prof., PhD, e-mail: [email protected]; ORCID ID: https://orcid.org/0000-0003-4292-2989

44
problems for the organization. Distinguishing the main elements of the managerial culture of the manager and the parameters of his professional behavior are questions that still do not find an answer in current theoretical and research practice. Due to the unclear nature of the management culture, as a phenomenon, an integral part of the organizational environment, a survey will be conducted among managers in the Republic of Bulgaria to highlight the key elements that every manager must profess in their management culture. The results of the study will provide an answer to the purpose of the development, which is to identify the main elements of management culture. The main stage of the research is the establishment of the degree of validity of the derived elements from the theoretical review and the comparable analysis of the concepts for corporate culture and the documents from the public sphere. As a result of the study, a final list of important elements for the management culture, valid for the current economic situation in the country, will be compiled.
The selection of a research sample is based on the experience of the respondents as managers from different levels of management. Selection according to this criterion is key to the reliability of the results of the study. There is no information on the size of the population covering the study. According to NSI data, by 2019 there were over 320,000 (NSI, 2019) employees in the employment and official relationship, performing the profession of ‘manager’, which can be conditionally assumed for the totality of managers in the country, who may fall in the study sample. The study will involve managers who have experience in management, regardless of the hierarchical level in the organization.
The introduction of this condition is important because experienced managers will be employed by employment and service, average gross and net hourly wage and average gross hourly wage for overtime work in October 2019 by sex and occupation - total full-time and part-time time and have a well-established and established management culture, the elements of which are the subject of empirical research. Before to the actual conduct of the survey, a liaison was established with representatives of various Bulgarian companies in management positions, who were offered to participate in the survey. Respondents were pre-screened according to their managerial experience and experience.
Thirty-one of them agreed to join, which determines the size of the sample. In this way a non-random sample of respondents is formed. The non-random sample is characterized by the intervention of the researcher to one degree or another. In this case, in the preselection of possible respondents.

45
The questionnaire contains 8 questions, each of which aims to gather enough information to analyze each aspect of the research problem.
Understanding the management culture can provide important information about how managers approach dealing with various problem situations and what qualities make them good leaders. Organizational values, beliefs, and convictions are important assumptions that guide managerial thinking and action.The existence of a mismatch between organizational culture and managerial behavior can be seen as a prerequisite for the failure of strategic development goals. The challenge for today's managers is to reap the benefits of culture, while being alert to the dangers of transmitting a culture that is out of sync with the needs of business and organization. There are cultural-conditional attributes that can help or hinder the effective management of an organization. In the scientific literature, however, there is no clear categorization of the elements that a successful management culture must possess. For this reason, the topic of the article was chosen.
Management culture is very often justified and stems from the cultural differences of individual regions. There is a great variety of traditions, customs and beliefs around the world, which to a greater or lesser extent leave their mark on the culture of the leader. Elements such as ethics, values, norms of behavior, business and communication culture, are often differentiated in the personal culture of the leaders of the territorial location of their company.
2. Layout of the problem
The dynamic change and the overall transformation of the external environment and of the management objects inevitably leads to problems in the management of the organizations. The problems are related to the lack of organizational experience for working in the new conditions, ignorance of the dynamic processes that influence decision-making, irrational attitudes to copying management techniques, the tendency to apply outdated approaches to management in existing traditional organizational forms, routine, habits, management style and way of thinking that do not change in parallel with the development of the business environment. The modern management of the organization can be realized only by highly qualified management teams, which work in conditions of continuity of the organizational and managerial innovations. Determining the basic parameters of behavior in the organization depends on the management culture and the ability of the leader to navigate and adapt to the requirements and impact of the environment. Management style,

46
attitudes, appropriate behavior are factors in the culture of the manager that affect the attitude of employees and the development of organizational culture.
There is no clear categorization in the scientific literature of the elements that a successful management culture must possess. The close connection between the managerial and corporate culture gives us grounds, after analyzing the corporate-cultural elements, to draw conclusions about the elements of the management culture. The purpose of the following theoretical presentation is based on the concepts of corporate culture and its main elements to make assumptions, which should be empirically verified, about the elements that a management culture should have.
3. Literature Review
In the last few decades, the concept of “culture” has become increasingly interesting in the fields of management, business and scientific literature. Finding a generally accepted definition of the concept, however, is a difficult task. The fact that in 1952, Alfred Crowber and Clyde Kluckhohn (1952) identified 164 separate definitions of culture underscores the complexity of this issue. In their quest to find the most accurate of them, the authors emphasize that culture is an acquired pattern of behavior, overt and covert, and is conveyed through symbols that represent the distinctive achievements of human groups. They also note that the basic core of culture consists of traditional (ie historical, obtained and selected) ideas and especially their attached values. And they come to the conclusion that cultural systems can, on the one hand, be considered as products of action, on the other hand, as conditional elements of future actions. The definition given by the British anthropologist Taylor (1874) supports Crowber and Clackhoun's definition that culture is acquired, but adds that it is a whole complex, including knowledge, beliefs, art, morality, law, customs, and other abilities and habits acquired by man as a member of society. According to Taylor, the science of culture is about the very elements of culture, not human behavior, such as a social process or interaction.
The characteristics of culture are associated with certain communities of people and this gives content to concepts such as - national culture, regional culture, sectoral and organizational culture. The interest in organizational culture appeared in the XIX century in conditions of globalization of the economy. The term "organizational culture" was introduced by Andrew Pettigrew in 1978 as a consequence of recognizing the existence of symbolic aspects and processes in the life of organized communities. Today, a number of authors present their definitions and research on the issues of organizational culture.

47
Ronald Westrum warns that: “to talk about organizational culture, many problems must be taken into account. Approaches to organizational culture are different ... there seems to be no common understanding of what culture is. ”(Westrum R., 2004). Hatch agrees that organizational culture is perhaps the most difficult to define of all organizational concepts"(Hatch M., 1997). However, Belot argues that" this does not necessarily mean that organizational culture is a weakly or ill-defined concept. and this difference is indicative of the ever-increasing volume of research ”(Bellot J., 2011).
According to Paunov (Paunov.M, 1998, p.195), the interpretation of the concept of "organizational culture" requires its placement on the basis of culture in general, because the formation of organizational culture is carried out by simultaneous interaction with other cultural systems. Lyubomir Stoykov defines culture as follows: "... is really a set of values, norms, models of subordination, communication and professional behavior that are able to ensure continuity in the development of organizational structure, stability and vitality, innovation and progress." (Stoykov, L., 1995). According to N. Mironova (Mironova.N, 2007), organizational culture is a system of values and beliefs shared by all employees in the organization, predetermining their behavior and the nature of the functioning of the organization itself. Simply put, organizational culture is "the way we do things here" (Schein, 1985). It is assumed that the culture of the organization overlaps with that of the individual. Edgar Shine's definition is most often recognized in the scientific literature for defining organizational culture. The author argues that organizational culture is: “The model of shared basic assumptions - invented, discovered or developed by a group ... that work well enough to be considered valid and, therefore, to be taught to new members, for learning the right way to perceive, think and feel ”(Schein, 1985).
According to the team Harizanova and Mironova, the organizational culture is the main component in the realization of the organizational goals. It includes the following main elements: beliefs, values, norms, behavior, socio-psychological climate. (Harizanova., 2006, pp. 96-97).
Defining the management culture
Managers are not independently existing entities, they are part of the entire management system of an organization. They are the engine that helps drive the parcels in a certain direction and their main task is to serve the organization and follow its culture. Very often a sign of equality is placed between the management culture and the corporate culture, but this is not correct. They are built into each other, complement each other and help each other. The management culture

48
cannot be created without the corporate one, and the corporate one cannot grow without the support of the management one. Every element of corporate culture is built over years and then maintained with much more effort and passion. This building and maintenance are entrusted to the successful manager - shared and complemented by his personal culture. Management culture is very often justified and stems from the cultural differences of individual regions.
Elements of management culture arising from corporate culture
There is no clear categorization in the scientific literature of the elements that a successful management culture must possess. The close connection between the managerial and corporate culture gives us grounds, after analyzing the corporate-cultural elements, to draw conclusions about the elements of the management culture. The purpose of the following theoretical presentation is based on the concepts of corporate culture and its main elements to make assumptions, which should be empirically verified, about the elements that a management culture should have.
John Yantch's concept of corporate culture and how we can apply its elements to management culture.
John Jantsch (Jantsch, 2012) is convinced that a healthy culture is a shared culture created through shared stories, beliefs, goals, plans, language, results, and ownership.
Glen Teatro's concept of corporate culture and how we can apply its elements to management culture.
Glenn Teatro (Teatro.G.2013) analyzes the most admirable corporate cultures in Canada. He highlights some very successful, "living" companies, different in their business interests, but with many common features. The themes reinforce the belief that the success of any business relies on its ability to bring people together and get the best out of their work, not through rules, policies, processes and boring linear focus, but through the creation of inviting cultures to participate.Teatro extracts ten elements that he believes are an integral part of the corporate cultures of successful business organizations in their field, but at the same time emphasizes the contribution of their leaders, revealing aspects of their personal management cultures.These are the ten elements that stand out in the cultures of successful organizations: clarity of vision and values, respect and courtesy, learning and growth, service before you sell, collaboration, social responsibility, balance, simple goal setting, innovation and finding in place of failure. Diversity and inclusion, clarity of action, universal respect and cooperation, as well as growth are interrelated with the high results of modern

49
organizations. Determining the basic parameters of managerial behavior, achieving a competitive advantage in the market and solving problems of sustainable development through social responsibility depend on the management culture and the ability of management to navigate and adapt to the requirements and impact of the environment - internal and external. It is because of this fact that we highlight these elements as part of the elements of management culture. The main elements of the corporate culture indicated by Teatro will be used for the analysis and the conclusions that will be made for the elements of the management culture, based on the theoretical review.
Luke Arthur's concept of corporate culture and how we can apply its elements to management culture.
Luke Arthur (L., 2008), as part of Demand Media, reveals his point of view on the elements of a strong corporate culture in his article - "What are the elements of a strong corporate culture?". The author defines: “Corporate culture is a set of beliefs, which is owned by an organization and it affects every area of business. If you start a business with a well-established corporate culture, this is essential for the overall success of the company. Several elements contribute to a strong corporate culture.”. Arthur combines the many factors that determine any corporate culture into four main groups, which he points out as its main elements. Corporate culture, according to the author, is a set of beliefs that an organization has and it affects every area of business.If you start a business with a well-established corporate culture, it is essential for the overall success of the company. Several elements contribute to a strong corporate culture: Clean mission One of the elements of a strong corporate culture is a clear mission and goal. When a company has a clear mission statement, and everyone in the company understands it, it is a sign of a potentially strong culture. Many successful companies know this and try to achieve it by moving in a clear direction. Based on the importance of this element, we can define as one of the main tasks of the leader the setting of the corporate mission as a mission in his management culture in order to achieve synchronization between the corporate and management culture. Another sign of a strong corporate culture is the established relationships between employees. Top management should treat their lower level employees with respect and strive to make them feel happy in their work. When employees feel respected by management, they tend to perform better and remain actively involved in their work. When employees and managers do not respect each other, this can lead to a chaotic culture. The process of building trust and social climate of understanding and good professional relations is conducted and controlled by the head of the organization. The managerial
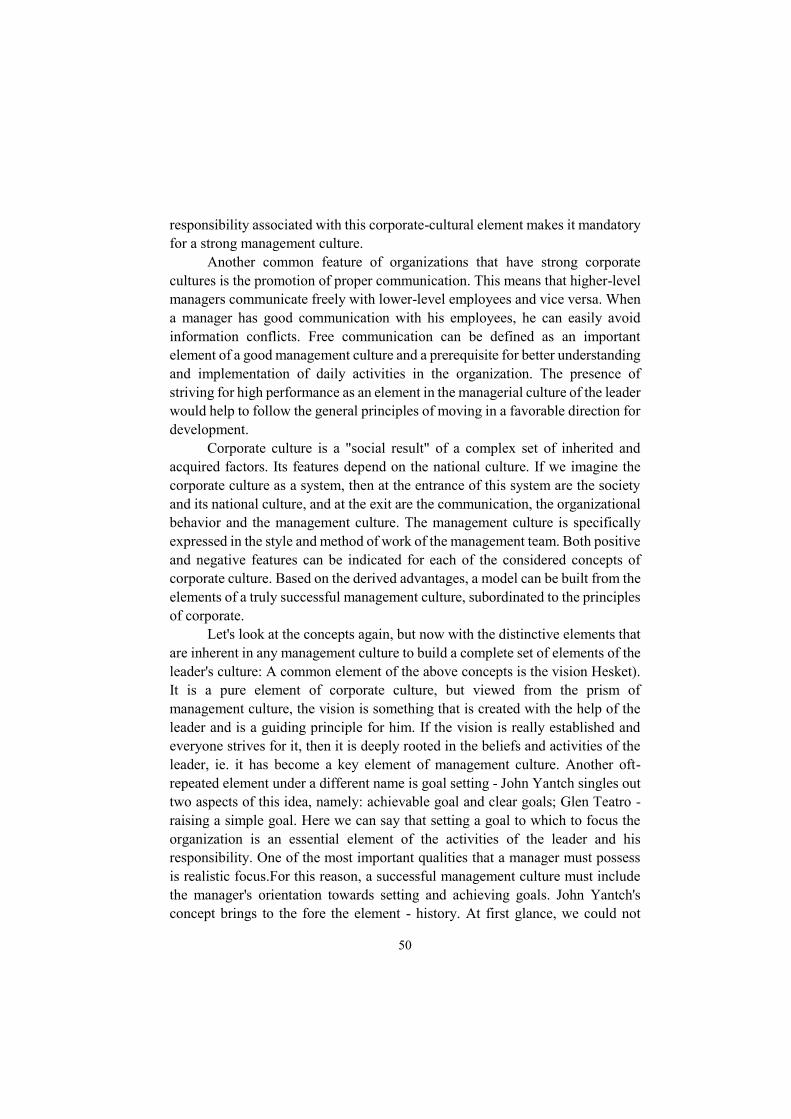
50
responsibility associated with this corporate-cultural element makes it mandatory for a strong management culture.
Another common feature of organizations that have strong corporate cultures is the promotion of proper communication. This means that higher-level managers communicate freely with lower-level employees and vice versa. When a manager has good communication with his employees, he can easily avoid information conflicts. Free communication can be defined as an important element of a good management culture and a prerequisite for better understanding and implementation of daily activities in the organization. The presence of striving for high performance as an element in the managerial culture of the leader would help to follow the general principles of moving in a favorable direction for development.
Corporate culture is a "social result" of a complex set of inherited and acquired factors. Its features depend on the national culture. If we imagine the corporate culture as a system, then at the entrance of this system are the society and its national culture, and at the exit are the communication, the organizational behavior and the management culture. The management culture is specifically expressed in the style and method of work of the management team. Both positive and negative features can be indicated for each of the considered concepts of corporate culture. Based on the derived advantages, a model can be built from the elements of a truly successful management culture, subordinated to the principles of corporate.
Let's look at the concepts again, but now with the distinctive elements that are inherent in any management culture to build a complete set of elements of the leader's culture: A common element of the above concepts is the vision Hesket). It is a pure element of corporate culture, but viewed from the prism of management culture, the vision is something that is created with the help of the leader and is a guiding principle for him. If the vision is really established and everyone strives for it, then it is deeply rooted in the beliefs and activities of the leader, ie. it has become a key element of management culture. Another oft-repeated element under a different name is goal setting - John Yantch singles out two aspects of this idea, namely: achievable goal and clear goals; Glen Teatro - raising a simple goal. Here we can say that setting a goal to which to focus the organization is an essential element of the activities of the leader and his responsibility. One of the most important qualities that a manager must possess is realistic focus.For this reason, a successful management culture must include the manager's orientation towards setting and achieving goals. John Yantch's concept brings to the fore the element - history. At first glance, we could not

51
classify this element as part of the managerial culture of the leader. But asking the question "Who is part of the history of the organization?", Then the presence of the leader is mandatory. The fact that the manager feels part of the company's history can only have favorable consequences for the organization, such as staff motivation, motivation of himself, also experience is the thing that teaches us and that builds our beliefs, values, norms of behavior and even our ethics. History may not be an element of management culture, but it is the essence of many elements of management culture.
Revisiting the concepts, it is good to pay attention to elements such as: Leader-mentor (John Yantch), Respect and courtesy (Glen Teatro), Communications (Luke Arthur). Each of these elements can be part of the management culture. The leader-mentor has the main role and it is the development of internal leaders. This is done by teaching others the culture of management, telling stories, creating shared beliefs, inspiring and attracting engagement. Respect and courtesy as an element of managerial culture accompany the manager in the implementation of his daily activities - they are necessary when negotiating, when communicating with employees, when communicating with investors, and not only in communicating with the manager, but in conducting all his communication. And so we came to the next element of management culture, namely - communication. Communication is a process in which people exchange information with each other. In modern life, where information is the most valuable resource, proper mastery of the art of communication is becoming one of the most important qualities of everyone, and what is a leader who can communicate properly - an effective leader.
In summary of the analysis made so far, for management culture, the important elements we derived from corporate concepts are: Vision as a guiding factor in the management of the leader, values, mentoring, respect, politeness and communication. Concept for the management culture, conditioned by the management practices in the public administration, in particular the European Union In the public sector there are a number of documents and regulations that regulate the duties and responsibilities of management staff at national and regional level, thus building the content and elements of their management culture. The theoretical review and analysis of these documents would help to identify elements inherent in the managerial culture of the leader in each area of action - business and public.

52
4. Research
The main stage of the research is the establishment of the degree of validity of the derived elements from the theoretical review and the comparable analysis of the concepts for corporate culture. As a result of the study, a final list of important elements for the management culture, valid for the current economic situation in the country, will be compiled.
Description of the questions included in the questionnaire
The questions in the online based questionnaire are 8 in number and are divided into three blocks, according to the information they aim to collect from the respondent. The first block of questions includes questions from № 1 to № 3, inclusive. The purpose of these questions is to gather information about the field of activity in which the organization operates, its size and the position held by the respondent.
Question 1: What field do you work in: A) Health B) Culture C) Sales D) Business E) Services F) Training G)
Other (please specify) Question 2: Size of the organization: A) Small (over 10 to 50) B) C) Medium (over 50 to 250) D) Large (over
250 people) Question 3: What is your current position: A) senior management B) middle management C) operational
management. The analysis of the results of this issue, in comparison with the issues from
block 2, will provide an opportunity to strengthen or reject the belief that leaders from different levels of government profess different cultural values. The question has only three alternatives to answer and does not make it possible to indicate an "object of management" as a possible answer. This is due to the fact that in the sample of the survey are included only 31 respondents who hold a managerial position, as the object of the survey are the elements of management culture. The second block of questions in the questionnaire covers from questions № 4 to № 6, inclusive. The purpose of this block is through three consecutive questions to reveal the elements of the three main dimensions that determine the management culture - personal qualities of the leader, professional competencies of the leader, communication culture of the leader.

53
Question 4: Indicate to what extent the following statements are important for the personal qualities of the leader:
Table 1. Sample completion of a questionnaire № 4
Elements NO Rather not In part Rather yes YES Responsibility √ Transparency √ Trust √ Loyalty √ Caring √ Frankness Innovation √ Cooperation
Question 5: Indicate to what extent the following statements are important
for the professional competencies of the manager: Table 2. Sample completion of a questionnaire № 5
Elements NO Rather not In part Rather yes YES Knowledge of the law √ Social responsibility √ Strategic orientation √ Promoting innovation √ Knowledge in the field of proper delegation
√
Administrative culture √ High level of knowledge in management
√
Management experience √
To this question, respondents must determine how important and decisive the listed elements are for the formation of their management culture. Each of these elements has been discovered and extracted from the theoretical analysis and supplemented with elements inherent in the professional competencies of a manager. Thanks to the answers of the respondents here, and to the other two questions in this second block of the questionnaire, it will be possible to make a

54
critical analysis and conclusion about the validity of the already derived elements of the management culture.
Question 6: Note the extent to which the following statements are
important for the manager's communication culture: Elements: writing correspondence, conducting online communication,
knowledge of non-verbal communication, knowledge of multinational differences, successful negotiation, knowledge of dress code, knowledge of foreign languages, keeping written correspondence.
Question 7: Gender: Male or Female Question 8: Age: 18 to 25, 25 to 35, 35 to 45, over 45 The last question from the questionnaire collects information about the age
range in which the respondents fall. The purpose of the question is again for statistical information, which may offer a different view for the analysis of the elements that the management culture has in the respondents of different ages.
After the collection of the questionnaires, the primary processing, editing, coding and input of the data was performed. The entry of the data from the questionnaires was done in a specially designed format of the software product SPSS. The coding of the questions with one answer out of two possible ones will be done by assigning values 0 and 1.
6. Results and analyzes of the research
The first block of questions includes questions from № 1 to № 3, inclusive. The purpose of these questions is to gather information about the field of activity in which the organization operates, its size and position.
The first question of the questionnaire aims to distribute the respondents according to the field of activity in which they hold managerial positions and perform managerial functions.
As can be seen from Fig.3.1. the largest group are the representatives of the production with 38%.

55
Figure 1. Distribution of respondents by areas of activity
The second question distributes the respondents according to the size of
the organization in which they work. The results of this question are presented in table.3.
Table 3. Distribution of respondents by size of the organization in which
they work Frequency Percent Valid Percent Cumulative
Percent Valid Large (over 250 people) 5 7,0 7,0 7,0 Small (from 10 to 50
people) 51 71,8 71,8 78,9
Average (50 - 250 people)
15 21,1 21,1 100,0
Total 71 100,0 100,0

56
Figure 2. Percentage distribution according to the criterion size of the organization in which the respondents work.
It is important to note that the size of the organization is determined solely
by the number of staff it has. The percentage of respondents who hold management positions in small organizations is extremely high. Apart from the random nature of the sample of respondents, the situation in the country also suggests this result. The presence of representatives of large organizations will still allow to make a comparative characteristic related to the assessment of the elements of management culture.
The next question is related to the managerial position of the respondents. The results of this question are presented in table. 4.
Table. 4. Distribution of the answers, according to the question related to the level of management occupied by the respondents (Table after processing
empirical data in SPSS software) Frequency Percent Valid
Percent Cumulative
Percent Valid Senior management 22 31,0 31,0 31,0 Operational
management level 15 21,1 21,1 52,1
Middle management level
34 47,9 47,9 100,0
Total 71 100,0 100,0

57
The largest number of respondents occupy the middle management level, respectively by 47.9%, compared to those at higher and operational level. An interesting fact is that the operational management level has the lowest percentage - 21.2%, ie. at least representatives at this management level took part in the survey.
The next three questions are organized in a separate block and aim to find out how the respondents evaluate each of the proposed elements as an element of management culture. The first question in this block assesses the elements of managerial culture arising from the personal qualities of the leader. The elements whose results will be analyzed are: responsibility, transparency, trust, loyalty, care, openness, innovation, cooperation.
Table. 5. Quality assessment responsibility
Frequency Percent Valid Percent Cumulative Percent
Valid Yes 43 60,6 60,6 60,6 In part 1 1,4 1,4 62,0 Closer to yes 27 38,0 38,0 100,0 Total 71 100,0 100,0
The last question from the second block of questions from the questionnaire is to assess the elements of the communication culture of the manager. Based on the distributions of this indicator, it can be concluded how important the individual components are and should be included in the management culture of Bulgarian managers.
Table. 6. Evaluation of the communication element keeping written correspondence
Frequency Percent Valid Percent Cumulative Percent
Valid Yes 10 14,1 14,1 14,1 No 3 4,2 4,2 18,3 In part 15 21,1 21,1 39,4 Closer to yes 23 32,4 32,4 71,8 Closer to no 20 28,2 28,2 100,0 Total 71 100,0 100,0

58
The first element of the manager's communication culture that is subject to evaluation is the keeping of written correspondence. From the distribution of the answers into pairs positive ("yes" and "rather yes") and negative ("no" and "rather no"), the percentages are 46.5% to 32.4%. Although the values are close, the ability to keep written correspondence is considered an important communication quality of the manager.
The next component is conducting online communication. This communication skill has been evaluated due to the wide spread of the new high-tech connections that are taking place between the leaders in the modern business world. The results are presented in Figure.3.
Figure 3. Evaluation of the communication element conducting online
communication.
The presence of the highest and equal percentages (35%) of the “rather
yes” and “rather no” answers, followed by “partly” by 20%, does not allow a definite conclusion to be drawn for the assessment of this communication skill. by managers. The observed multi-polar opinions are probably the result of the different areas of activity of the respondents, for some of which this skill is important, for others, not.
Knowledge of non-verbal communication was assessed as important by 16.9% of respondents who answered "yes". A categorical answer "no", assessing this knowledge as of little importance for the communication culture of the leader, is given by four respondents, or 5.6% of all respondents. The value comparison of these assessments allows to exclude this component as important and to indicate it as an element of the management culture in the conclusions of

59
the research. The question containing statistical information about the respondents is the last for the questionnaire. It distributes the respondents by age groups. The results are shown in figure 4.
Figure. 4. Distribution of respondents by age groups
The largest age group of respondents is 35 and older. 61 out of 71
respondents fall into this category. These results suggest that the respondents are managers who are in the prime of their professional growth and the analysis of their answers will show sufficiently reliable results for the subject of the study - the elements of management culture.
Conclusions from the analysis of the conducted research
The evaluation of the elements was carried out on three criteria - personal qualities of the leader, professional competencies of the leader and communication culture of the leader. The highest rated elements for each criterion can be included in a list containing characteristics that a management culture should have:
x Responsibility x Transparency x Cooperation x Loyalty x Knowledge of the law x Management experience x Strategic orientation x Promoting innovation
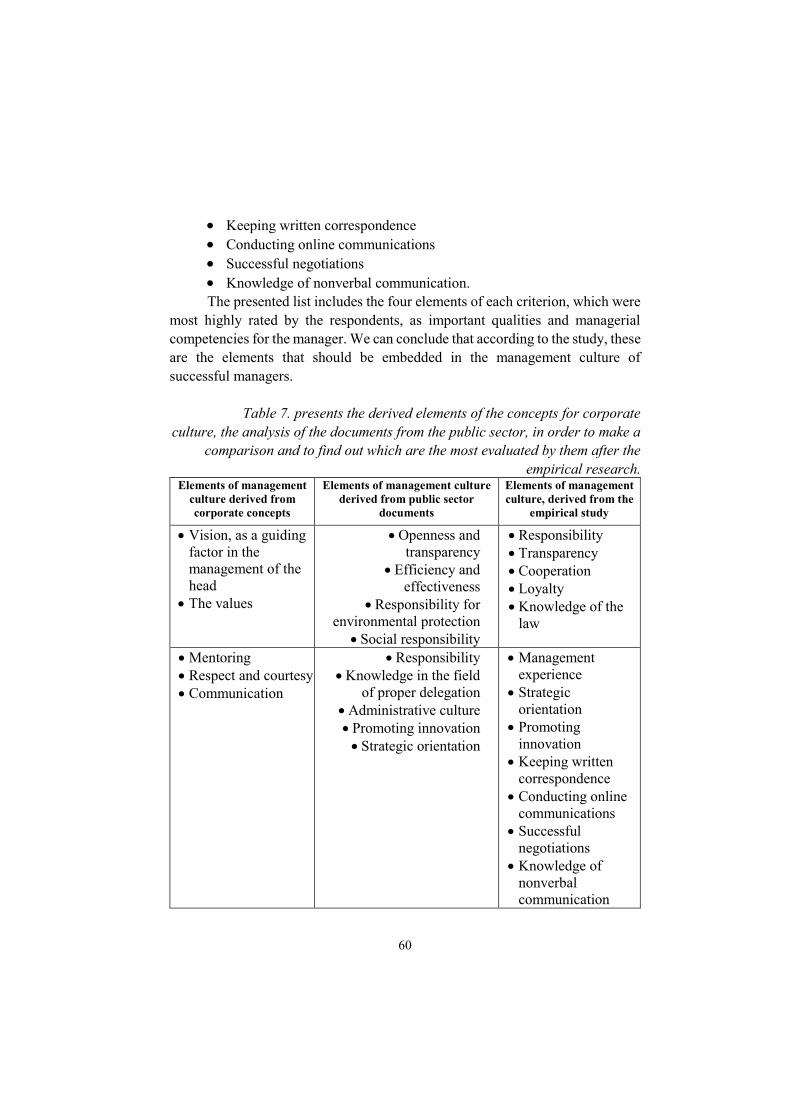
60
x Keeping written correspondence x Conducting online communications x Successful negotiations x Knowledge of nonverbal communication. The presented list includes the four elements of each criterion, which were
most highly rated by the respondents, as important qualities and managerial competencies for the manager. We can conclude that according to the study, these are the elements that should be embedded in the management culture of successful managers.
Table 7. presents the derived elements of the concepts for corporate culture, the analysis of the documents from the public sector, in order to make a
comparison and to find out which are the most evaluated by them after the empirical research.
Elements of management culture derived from corporate concepts
Elements of management culture derived from public sector
documents
Elements of management culture, derived from the
empirical study
x Vision, as a guiding factor in the management of the head
x The values
x Openness and transparency
x Efficiency and effectiveness
x Responsibility for environmental protection
x Social responsibility
x Responsibility x Transparency x Сooperation x Loyalty x Knowledge of the
law
x Mentoring x Respect and courtesy x Communication
x Responsibility x Knowledge in the field
of proper delegation x Administrative culture x Promoting innovation x Strategic orientation
x Management experience
x Strategic orientation
x Promoting innovation
x Keeping written correspondence
x Conducting online communications
x Successful negotiations
x Knowledge of nonverbal communication
61
As can be seen from Table 7, certain elements derived from the theoretical analysis were dropped after the empirical study, because they were poorly evaluated by the surveyed managers. Elements such as - efficiency and effectiveness, environmental protection and administrative culture, embedded in the culture of the manager in the public sector, are not highly valued by business managers. Communication at the corporate level, according to the respondents, should be represented in the managerial culture of the leader most strongly through the elements - written correspondence, online communication, successful negotiation and knowledge of nonverbal communication.
Thanks to the conducted empirical research, the basic goal of the research was fulfilled, namely to establish the key elements, characteristic for the managerial culture of the Bulgarian managers.
6. Conclusion
Based on the analysis of the survey and the study of working hypotheses, the highest rated elements of the manager's culture can be distinguished. The evaluation of the elements was carried out on three criteria - personal qualities of the leader, professional competencies of the leader and communication culture of the leader. The highest rated elements for each criterion can be included in a list containing characteristics that a management culture must have: √ responsibility, transparency, cooperation, loyalty, respondents over 35 years old Respondents under 35 years old, knowledge of the law, managerial experience , strategic orientation, promotion of innovations, keeping written correspondence √ conducting online communications, successful negotiations, knowledge of non-verbal communication. The presented list includes the four elements of each criterion, which were most highly rated by the respondents, as important qualities and managerial competencies for the manager.
We can conclude that according to the study, these are the elements that should be embedded in the management culture of successful managers. Table 7 presents the derived elements of the concepts for corporate culture, the analysis of the documents from the public sector, in order to make a comparison and to find out which are the most evaluated by them after the empirical research. As can be seen from Table 7, certain elements derived from the theoretical analysis were dropped after the empirical study, because they were poorly evaluated by the surveyed managers. Elements such as - efficiency and effectiveness, environmental protection and administrative culture, embedded in the culture of the manager in the public sector, are not highly valued by business managers. Communication at the corporate level, according to the respondents, should be

62
represented in the managerial culture of the leader most strongly through the elements - written correspondence, online communication, successful negotiation and knowledge of nonverbal communication. Thanks to the conducted empirical research, the basic goal of the research was fulfilled, namely to establish the key elements, characteristic for the managerial culture of the Bulgarian managers.
REFERENCES
Arthur, L., „What Are the Elements of a Strong Corporate Culture?“, Demand Media, http://smallbusiness.chron.com/elements-strong-corporate-culture-15674.html
Bellot J., (2011) Defining and assessing organizational culture, Nursing Forum Harizanova, M., N. Mironova, M. Mirchev, (2006) Management. UI Economy,
pp. 96-97 Hatch M., (1997) Organization Theory: Modern, symbolic and postmodern
perspectives, Oxford: Oxford University Press Jantsch, J., „7 Elements of a Healthy and Vibrant Business Culture“,
https://www.openforum.com/articles/7-elements-of-a-healthy-and-vibrant-business-culture/
Kroeber L, C. Kluckhohn, W. Untereiner, (1952) Culture: A Critical Review of Concepts and Definitions New York: Vintage Books
Mironova, K. Radev, (2007), Organizational behavior. Avangard Prima, Sofia Schein, EH., (1985) Organisational culture and leadership 1st Edition San
Francisco: Jossey- Bass, Stoykov, L., (1995) Company culture and communication. IM "Economy" Teatro. G., „Corporate culture: 10 elements to help drive results“, 18th of
February 2013, http://leadingcompany.smartcompany.com.au/employee-engagement/corporate-culture-10-elementsto-help-drive-results/201302183702
Tylor, Edward B., (1874), Primitive culture, researches into the development of mythology, philosophy, religion, language, art and custom. New York, H. Holt and company,
Westrum R., (2004) A typology of organisational cultures Qual Saf Health care
63
Entrepreneurship ISSN: 2738-7402
DOI: 10.37708/ep.swu.v8i2.6 Volume: VІII, Issue: 2, Year: 2020, pp. 63-70
LEGAL AND ECONOMIC ASPECTS OF THE INTRODUCTION OF EDUCATIONAL CENSUS WHEN VOTING IN THE
REPUBLIC OF BULGARIA
Ekaterina Bogomilova3
Received: 09.10.2020, Accepted: 21.10.2020
Abstract
In recent years in the Republic of Bulgaria the question on educational qualification for voting has more and more been raised. The topic is quite relevant, especially when the results of the 2019 elections for representatives of the European Parliament and those for local governments report: 1) high number of invalid ballots when choosing a preference without specifying a party, 2) the refusal of voters to vote using machines, 3) the so called "election tourism” from Turkey, and 4) the vote buying. These problems raise the relevance of the role of literacy and education of voters when exercising their constitutional rights.
Keywords: educational census, rights and obligations, voting, economic and low.
JEL Codes: K100, H52, I210
1. Introduction
The introduction of an educational qualification in voting opposes the Constitution as a basic law of the state, democracy as a form of government, the fundamental rights, and obligations of citizens. The goal of this survey is to identify the advantages and disadvantages of the issues studied and, if possible, to find the balance in the collision of rights and interests, which posse legal and socio-economic component. To achieve this goal, the following tasks are set: first to examine whether what democracy gives is understood and consumed within its borders; second, how well citizens know and exercise their rights and the attitude towards their obligations; and third, to study the social and economic effects of the relation: education, choices, and age. The research will use methods
3 National and Regional Security Department, UNWE, Sofia. Assist. Prof., PhD, e-mail: [email protected], ORCID ID: https://orcid.org/0000-0002-8662-4767
64
from different scientific approaches: legal analysis, historical review, statistical analysis, and comparative analysis.
2. Constitutional rights and obligations of Bulgarian citizens within the state
According to Prof. Rosen Tashev (2010, p. 42) in the book "General Theory of Law", the Constitution is a political and legal document. As a political document it materializes the social contract between society and the state, while as a legal one it is the supreme source of positive law for the state.
On July 13, 1991, after the fall of communism, the Seventh Grand National Assembly adopted the fourth Constitution of the Republic of Bulgaria, which is still in force today. It is the supreme law of the state, defining the basic rights and obligations of citizens and equality between them, people's sovereignty, the rule of law, the free-market economy, the separation of powers as a basis for democracy in pursuit of constitutional principles and desired prosperity.
When looking for an answer to the question of whether the educational qualification should determine the rights of citizens in voting, these rights should be analyzed as defined by the Basic Law. In Chapter Two of the Constitution of the Republic of Bulgaria in Art. 53 item 1 states that "everyone has the right for education". Art. 53 item 2, however, defines education up to 16 years of age as compulsory. It is here, where the first collision takes place having in mind the principles for guaranteeing the rights and freedoms of the citizens under the conditions of democracy.
What does it mean to be educated to vote? Is the education a factor for ability to choose a political direction in the development of the state, or the main problem of representativeness is that a certain group of people that cannot be integrated into society and do not perform their basic social obligations, has the right to set the political direction in the development of the state? The answers to these questions are determined by the form of government - democracy.
Democracy as a political system can exist only if the state bodies that exercise the three main activities - legislative, executive and judicial - are separate and independent. (Tashev, 2010, p. 44)
Constitutional democracy is a system of government based on people's sovereignty, in which the structures of government, powers of government and boundaries of government are defined in a constitution. (Roots of American Government, The Meaning of Democracy) Democracy provides opportunities for effective participation of the citizen in governance; equality of the vote and the exercise of ultimate control over governance.

65
If we go back a bit and re-read Plato's "State", considered the most utopian work, the development of the state is based on a society ruled by kings-philosophers, as Plato himself believes that philosophers are the best state leaders - any government must be built on the foundation of wisdom, education, creativity and innovation. However, it is paradoxical to demand an educational qualification from the voters when there is no such requirement for the same when electing state or local bodies. The point of view of Carl Raymond Popper, a prominent liberal and a philosopher from the English school of the 20th century, a critic of Plato's views, is different. According to him, "Open societies do not support a single view of 'truth', but rather try to establish laws and institutions that allow people with different views to live together in peace." This poses new challenges to any government seeking the right course in defining public policies.
In support of the above, Professor Balamezov raises the constitutional issue of "separation of powers." According to him, state power is a single one only (separation of powers is quite conditional), as the state power is indivisible and only a division of government functions is possible. (Valchev, D.) He also raises the issue of educational qualifications in voting, which will later be used to determine the advantages and disadvantages of the topic.
3. Suffrage - challenges and opportunities
Art. 11. Item 1 states that "political life in the Republic of Bulgaria is based on the principle of political pluralism". (Constitution of the Republic of Bulgaria, p. 9)
Electoral qualification is a normative requirement that a person must meet to have active or passive suffrage. There are different types of qualification requirements set in today’s modern countries: qualification requirement to obtain a citizenship; requirements for voting; wealth and property requirements; moral requirements; related to the payment of taxes, educational requirements; on the basis of sex; language, etc. Qualification is a restriction here that directly affects the nature of subjective rights, in this case - of suffrage.
Active suffrage consists in the possibility for a person to form his / her will and to vote for a certain candidate or party in the elections. (Drumeva, Em.)
In the elections of 1848, the right to vote was given only to the male population. Previously, there were other restrictions, such as a property qualification, which allowed only people with property to vote. This led to a government composed only of aristocrats who cared primarily for their own interests. Today it is accepted that the qualifications are inadmissible. To vote, a
66
person must meet certain criteria. There are small differences in these criteria in different modern democracies. (Suffrage and political pluralism)
The Belgian Constitution of 1831 stipulates a general property qualification to be a voter. The qualification was abolished in 1893. Universal suffrage was introduced after the end of the First World War. (Drumeva, Em.)
In compare with the developed European countries, Bulgaria introduced universal suffrage with the Tarnovo Constitution, adopted in 1879, but universal suffrage only for men. (Drumeva, Em.)
4. Legal and economic issues of the exercise of the right to vote in the Republic of Bulgaria
The economic dimensions and problems of the right to vote based on educational qualifications cannot be considered separately from the other limitations that history provides us with. No further research is needed to conclude that education, proportionately impacts the income of the population, the tax collection, the economic prosperity as a whole and the welfare of the state. As a result, the first demands for a change in the Constitution of the Republic of Bulgaria in recent years and the dispute over whether uneducated citizens have the right to elect state and local bodies arose.
According to the famous teacher and thinker Teodosii Teodosiev, “the vote of the professor and the vote of the illiterate in elections cannot be equal, they should not have the same weight. The illiterate does not read, does not know, is not interested and has no information, but decides the fate of Bulgaria." (Vevesti.bg)
Education is widely recognized as a key factor in why some people vote and others do not. But the essential reasons for this connection remain poorly understood. The benefits of educational qualifications can be seen as increasing voter turnout, which in turn leads to political efficiency. Education makes citizens more capable and motivated to participate in elections, it appears as a resource for electoral activity. In addition to being a resource for electoral activity, it is assumed that educational qualification sets a minimum of economic development and prosperity, through specific demands for future policies.
As a result of the policy of guaranteeing the principles of democracy, during the last 10 years in Bulgaria 4 regular and 3 caretaker governments ruled the state, all formed in response to protests and civil dissatisfaction with the policy related to social and economic prosperity. According to the Constitution of the Republic of Bulgaria, everyone has the right to exercise their right to vote,
67
except for persons placed under guardianship or imprisonment when they have reached 18 years of age and are Bulgarian citizens.
In addition, the last elections showed an increase in the number of invalid ballots. The calculations of the Transparency International Association, based on the official results of the local elections in all 265 municipalities, show that at the national level the number of invalid ballots for municipal councillors is a historical maximum of total 466,077, or 15.098% of the submitted bulletins. (Transparency International (TI) However, can a connection be sought between education and invalid votes?
The first challenge is the exercise of the right to vote by the Roma population in the country. In the Republic of Bulgaria in the last 30 years, the processes of integration of this group of the population is carried out at a slow pace. The education of these marginalized social groups continues to be fictitious rather than real. There are a number of policies under implementation related to compulsory education linked to the social system, but these has not worked effectively. The Roma as a community is one of the groups emotionally manipulated in voting, a “manipulation” based also on the purchase of votes is a fact, which ranks this social group among the most active groups during elections. If we look at the United States, it can be seen that over the years, their electoral system for black voters has evolved precisely on the basis of literacy, despite the adoption of this principle in different states at different times. For example, the use of a literacy test was a key part of the voter registration process. Although many jurisdictions across the country have used literacy tests, fraud has been used in this registration. Literacy tests were based on interpretations of a complex section of the state's constitution or read from a newspaper written in a foreign language. Some analysts of these texts considered this restriction as racial segregation, especially if the turnout was below 50%. In 1970, the Nixon administration proposed a suspension of literacy tests as a condition for voting. The 1970 amendments were insignificant compared to those made in 1975. First, Congress extended the provisions of the law to 1982 and permanently banned the use of literacy tests as part of the registration process throughout the country. But the most important change was when Congress put "linguistic minorities" under special protection. (Blum, Ed.) Following the example of the United States, it can be summarized that the literacy barrier is related to the increase of the voting in the country, i.e. it is growing. The main conclusion that can be made is that illiteracy can be manipulated or better known in Bulgaria as "bought" during elections.
68
Professor Balamezov also raises the issue of educational qualification when voting in Bulgaria. According to him, Bulgarian citizens should receive voting rights after reaching the age of 23. At the same time, after the age of 21, he allows every citizen to be a voter and eligible if he "marries, receives higher or special education, opens a cultural, commercial or industrial enterprise on his own." This his proposal he motivates with voting the understanding that it is "absurd" for political capacity to occur earlier, even three years earlier, then civil and commercial capacity. (Doncheva, L.) Here is the place to mention that in Bulgaria the question of the economics of voting arose as early as 1946-1947.
The second challenge is the so called "electoral tourism". The constitution of Republic of Bulgaria stipulates that political parties cannot be formed on ethnic, racial and religious grounds, but in the years of transition (1990 – 2020) we have witnessed the existence of such political parties. Voters for such parties do not even know the official language of the Republic of Bulgaria, but they are not deprived of the right to vote. The topic of Turkey and the ethnic Turks in Bulgaria is especially relevant in every Bulgarian election. The legal solution here can be sought in whether dual nationals have the right to vote for local (municipal) or even state bodies. This issue is controversial, but it has its economic justification and it can be motivated by the payment of local taxes and fees. It is fair when you exercise your right to vote in order to set a management policy, to have a relationship with the revenue side of the place (certain municipality). Legally, these voters have the full right to vote in elections, as they documented this residency. Address registration is a necessary condition, both permanent and current address on the territory of the country, as at least one of the family must be in the place of voting, on the territory of the respective municipality no less than six months before the elections. The problem is with the control of settlement. Apart from the topic of Turkey, the question of whether Bulgarians living abroad should have the right to vote for European, state and local bodies is also controversial. Again, this issue must be considered in the context of the public goods consumed. The effects of the national policy cannot be considered as benefits beyond the country's borders. But they can be explained with the following interdependencies - the influence of the political institutions on the economic policy by studying the effect of electoral rules on a particular program - for example, tax program, the social program, the educational program. This could lead to overcoming the challenge of transforming the public spending into public goods.
A third challenge faced by the electoral system and related to educational qualifications are the disadvantaged citizens (with physical and other illnesses).
69
In principle, the legislator regulates these rights of this social group of citizens and can place them under guardianship. Such cases are observed when there is a person's illness that affects his will (psyche), when this illness has affected the person's ability to be aware of his actions and will. For example, people with Down syndrome, themselves with different mental development, not always may be banned from voting nor educational requirements may be imposed here. These people are actually able to work and they are not banned from the right to vote. In the same time, people who need personal assistance shown with the respective document from the expert medical commission, their vote can be forged.
Therefore, the legislation on the electoral process should be reviewed and amended, based on the constitutionally established rights of citizens.
5. Conclusion
As the study does not seek completeness of the issues and challenges identified, the following conclusions can be made:
1. Educational qualification is relevant to the electoral process and can be encouraged with the tax policy of the state.
2. Educational qualification is a resource that has to do with economic development, which is revealed in its connection with the right to vote.
3. Education is a constitutional right and obligation, which is subject to state control and responsibility.
4. The educational qualification requires expenditures for the achievement of public goods.
The educational qualification for the exercising of the right to vote has its legal and economic tangents, but at the same time contradictions. In democracies, these contradictions can be overcome not only by sustainable economic development, but also by rethinking the principles, policies, and rules of elections.
70
REFERENCES
Blum, Ed., The Unintended Consequences of Section 5 of the Voting Rights Act, American Enterprise Institute WASHINGTON, D.C.
Constitution of the Republic of Bulgaria, Annotated with the Interpretative Practice of the Constitutional Court, Ciela Norma AD, Sofia, 2019, p. 9.
Doncheva, L., Professor Stefan Balamezov and the Constitutional Question in Bulgaria 1946-1947, http://webcache.googleusercontent.com/search?q=cache:NHV_4AZi2n0J:journals.uni-vt.bg/getarticle.aspx % 3Faid% 3D4804% 26type% 3D.pdf + & cd = 1 & hl = bg & ct = clnk & gl = bg, 18.11.2019.
Drumeva, Em., Constitutional Law, https://chitanka.info/text/29884/42
Official site of Vevesti.bg, Politics, Headlines, Teodosii Teodosiev: An educational qualification is needed for voting, otherwise illiterate people decide the fate of Bulgaria, http://vevesti.bg/216836/teodosiy-teodosiev-nuzhen-e-obrazovatelen-tsenz-za-glasuvane-inache-negramotni-reshavat-sadbata-na-balgaria/, 18.11.2019.
Roots of American Government, The Meaning of Democracy, https://dlc.dcccd.edu/usgov1-1/the-meaning-of-democracy, 18.11.2019.
Suffrage and political pluralism, https://www.ago-academy.org/statii/izbiratelno-pravo, 18.11.2019.
Tashev, R., General theory of law, basic legal concepts, Sibi, 2010ublic goods.
Transparency International (TI), News, Open letter to the CEC on the invalid votes in the local elections, http://transparency.bg/bg/%d0%bd%d0%be%d0%b2%d0%b8%d0%bd%d0%b8/%d0%be%d1%82%d0%b2%d0%be%d1%80%d0%b5%d0%bd%d0%be-%d0%bf%d0%b8%d1%81%d0%bc%d0%be-%d0%b4%d0%be-%d1%86%d0%b8%d0%ba-%d0%be%d1%82%d0%bd%d0%be%d1%81%d0%bd%d0%be-%d0%bd%d0%b5%d0%b4%d0%b5%d0%b9%d1%81%d1%82/, 18.11.2019.
Valchev, D., General Theory of the State, Theory of Separation of Powers, http://webcache.googleusercontent.com/search?q=cache:n6h0GEomFZcJ:danielvalchev.com/docs/Tema%25208-OTD18.ppt+ & cd = 6 & hl = bg & ct = clnk & gl = bg, 18.11.2019.

71
Entrepreneurship ISSN: 2738-7402
DOI: 10.37708/ep.swu.v8i2.7 Volume: VІII, Issue: 2, Year: 2020, pp. 71-85
INNOVATION IN MANAGING EDUCATIONAL SERVICES
Lykopoulou Zacharoula 1 Received: 10.10.2020, Accepted: 28.10.2020
Abstract
Instead of a common cultural perspective, university culture is experienced at three distinct levels: the enterprise, the profession and the cognate area. Each of them exerts a powerful influence on the ideology or systems of beliefs that characterize academics and academic institutions. Thus, many different dimensions should be assessed in order to indicate which of them can affect universities performance and decision-making regarding innovation. This paper concerns higher education in Greece, as applied today and in the forthcoming years and its aim is ternary; firstly, the study on the implementation of international innovation indicators in education, secondly the use of innovative teaching practices and finally the relationship between different organizations and its impact on innovative educational practices. The primary research contacted with the use of a questionnaire on a sample of 471 teachers all over Greece. The findings among others show that the higher the level of innovation regarding educational services, the higher also is the level of innovation on educational processes.
Keywords: educational innovation, organizational culture, educational services
JEL Codes: I20, M10
Introduction
Ideally, an innovation is the driving force behind the creation of a new learning cycle, the promotion of wider change and the continuous improvement of an organization. In education, although the aim is to develop students and prepare them for life, the pace of change is too slow or weak compared to other fields or systems (Thorsteinsson, 2014; Huda et al., 2019). It seems that schools, even many universities, have fundamentally changed their organization, curriculum structure, educational tools, pedagogical practices and evaluation methods. The majority of teachers are still based on traditional approaches, focusing on: a) the teaching content, where the subjects are presented to the pupils by the lecturer; b) the one-man educational manual; and c) the pupils' through
1 Kinder garden „Kalampaki“, Drama, Greece, Director. e-mail:[email protected] ; ORCID ID: https://orcid.org/0000-0001-5237-7895

72
conventional written competitions or tests. In the rapidly changing context of today's education, education is called upon to improve successful traditional practices and to bring forward new approaches that respond to today's realities of the 21st century, to the expectations and needs of students. New subjects, new educational tools and environments, new pedagogical approaches and innovative ideas seem to be very promising, for students and teachers, in terms of educational experiences and learning opportunities that they shape. In this context, the diffusion of educational innovations is now the first priority for education systems around the world (Hovne, Hovne & Schott, 2014; Huda et al., 2019). For example, Europe 2020 puts development as a top priority for turning the European Union into a competitive and cohesive society (European Commission, 2010). In addition, school environment is a bridge that helps pupils from different countries to become part of the local community (Krasteva R., Pantelis Ef., 2017). Growth should be sustainable and inclusive, inclusive. In addition, the EU aims at smart growth, based on improving performance (a) education, (b) research and innovation, and (c) digital society.
Educational dialogue is often limited to the technological characteristics of an innovation, as new-emerging technologies are shaping new directions and greatly influencing teaching and learning. There is often a misconception, which addresses Information and Communication Technologies (ICT), as such, as an innovation. This is not always expensive. Innovation only arises when teachers use the various ICT tools to organize new learning situations that do not reinforce traditional teaching practices but support open pedagogical approaches that expand and enhance learning (Barnard & Van der Merwe, 2016; Sharples et al., 2015). Innovative pedagogical practices with ICT encourage and promote participatory and student-centered approaches, exploratory learning, problem solving, collaboration and creativity, linking work to classroom with home and society, etc. For example, technologies and such as mobile learning, flipped classroom, gamification, mass-open digital lessons (MOOCs) etc., actually introduce innovative pedagogical elements and fundamentally change the wider teacher and learning environment.
In general, educational innovations are related to two axes: innovative pedagogical approaches and innovative uses of educational or technological media. In recent years, significant efforts have been made in our country to change and integrate new elements in education that have been initiated, basically, by state initiatives. Examples include recent New Study Programs (New School, 2011), the Digital School Action (2011), the National Educational Content Accumulator (Photodentro, 2012), the Teacher Training Program for the Use of ICT in Education, etc. At the same time, two major groups of innovative educational programs have been introduced in primary and secondary schools, in the form of parallel actions:

73
a) Interdisciplinary programs such as Environmental Education, Health Education, Cultural Issues, Students' Creative Games, Career Education and Young Entrepreneurship, etc.
b) European programs and partnerships supported by the European Union, such as Comenius, e-Twining, Teachers4Europe and others.
Although there are case studies showing encouraging results from the implementation of innovative programs in Greek (eg. Golikidou & Tzimogiannis, 2014, Hermans et al., 2008; Thorsteinsson, 2014), there are no systematic surveys in the literature that reflect the specific features of innovative programs, the effectiveness in learning, the changes they have brought about and their sustainability in the schools that have been implemented.
Educational innovation refers to the introduction or integration of new elements, situations, processes or persons into the educational work to modify, improve, replace or change part or all of the educational practice. The definition of Yamazumi (2008) expresses more precisely the delineation of educational innovations. Educational innovations are crucial nowadays, due to the explosion of knowledge and its devaluation in the short term. These trends require both the frequent updating and updating of school knowledge and the development of specific skills beyond traditional ones. For example, the memorandum function of the pupils and the transmission of knowledge by teachers are now considered traditional and obsolete. New skills have been proposed, such as "learning" students "how to learn", solving problematic situations, making decisions, and even more advanced cognitive and pedagogical functions. These skills have also added European Community skills related to literacy in mother tongue and foreign language, science, new technologies, and cultural awareness.
Any educational innovation, regardless of the level at which it is addressed, needs to be accepted and adopted by the teachers, but it also depends on their training and training to implement it. This position is supported by Sultana (2001), referring to case studies of twenty-four Euro-Mediterranean countries where educational innovations have been implemented at various levels (eg curriculum level, new forms of assessment, pre-school education, etc.). More specifically, it states that the implementation of educational innovation and the intended changes in national education systems require improved teacher training systems both in initial and in-service training ... but also in changing or modifying their attitudes towards sought innovation. This implies that teachers have to be properly trained during their university studies (Pigiaki, 2004; Deming et al., 2015) and that they are prepared to continue their training - pre-service, in-service - as well as their self-improvement and lifelong self-improvement. It is also known that teachers, in the context of their schooling experience, tend to "isolate" and not develop new perspectives, but to "defend the practices with which they

74
are already in operation" (Hovne, Hovne& Schott, 2014) their beliefs and attitudes act as "filters" to even control and block new ideas (Manning, 2017).What needs to be emphasized is that teachers are key persons and act as catalysts in the implementation of educational innovations. This is highlighted in many case studies on the implementation of educational innovations in the Euro-Mediterranean region, as the experts point out that "an educational innovation may be acceptable if the actors understand that they are better than previous practice" (Sultana, 2001).
It is widely supported that educational innovations cannot be realized without the consent, cooperation and even the enthusiasm of the teachers. This is because educational innovations, by definition, cause uncertainty as they project new works, question the many roles and challenge the professional identity of teachers (Sultana, 2001; Hovne, Hovne& Schott, 2014; Manning, 2017). It can also be noted that educational innovations have to adapt to the measures of teachers and the context of their work in order to be efficient and have chances of success. In fact, the chances of educational innovations being promoted when promoted by external factors are minimal. On the contrary, they will be accepted when the teachers who implement them will realize their value and the validity of the proposed idea or practice (Sultana, 2001).
These reasons make it imperative to explore the appropriate ways in which educational innovations should be channeled or promoted. According to Corlu et al. (2014) there are three ways of promoting educational innovations. One concerns the power / coercive strategies whereby educational innovations are top-down, but "pay or punishment" is provided. The second concerns "normative or re-educational strategies" that modify postures or "brainwashing" so that the people involved see the new situation differently. Finally, the third refers to "empirical - rationalist strategies" through which teachers themselves persuade themselves that they are in favor of adopting the proposed educational innovation. Typically, strategies are used in parallel ... since some of the educational innovations may be implemented with some of these strategies, while other innovations require alternative or complementary strategies.
Closely linked to education - teacher training and education is also the implementation of innovation at institutional or school level. There is a widespread view that teachers should not only have a broad understanding, positive attitude and consciousness in favor of the pursued innovation, but also have built a school culture with a common "vision" to realize the educational innovations sought at any level, particularly at institutional or school level. The common vision and cooperation between all the actors involved helps them to become aware of the "what", "how" and the "why" of school life, as well as the rationale of the applied innovation (Hovne, Hovne & Schott, 2014).

75
In order to facilitate the achievement of the goal of the common vision and the collective culture of the actors involved, the educational institutions must rebuild and reorganize the framework of their organization so as to form a learning community of all involved persons rather than being considered, as a central function, the transmission of information (Maritz et al., 2014). Wals (2014) also argues that schools have unique cultures, practices and traditions, and educational innovations or changes need to be adapted to the specific context of the school. The same view is expressed by Bradshaw and Hultquist (2016), who proposes that educational innovations should focus on the whole school unit in the context of collective decision-making and cooperative practices, harmonized by the leadership of a director. The holistic approach of the whole school approach is suggested by others, such as Riddell and Nino-Zarazua (2016), which it considers catalytic for the implementation of educational innovation by linking school practice with school improvement.
However, both classroom and school-based practices require a risk that teachers either do not want or cannot get (Corlu et al., 2014). Despite the unanimous proposals of specialists on the holistic approach of educational innovation for implementation in a particular institution or school units, there can be no concrete conclusions with universal effect that will be useful to the educators of educational policy. One factor that prevents unanimous proposals is the diversity and heterogeneity of school units. Universities are more complex than other organizations. Dill (1982) alludes to this veiled complexity in noting that academics are part of an academic community but also shape and manage academic organizations. Clarke (1983) refines this proposition of complexity by arguing that university culture is experienced at three distinct levels: the enterprise, the profession and the cognate area. Each exerts a powerful influence on the ideology or systems of beliefs that permeate academics and academic institutions. Universities also operate under a system of governance which is different and more complex than a traditional company managerial system operating under a board of directors (Corlu et al., 2014). In the latter, the lines of authority (and hence power), responsibility and accountability (control) tend to be straightforward and demand minimal interpretation, which tends not to be the case within university governance. Statutory authority within the university can reside with the Principal, the Senate and the Court. Yet policy is determined collegially and predicated upon common values and beliefs (Simoes, 2019). Power, authority and control between the Principal, the Senate and the Court will be fluid and in many cases unclear; the real challenge for the institutional leaders is in operating within such a complex context (Duong & Swierczek, 2019). In reality, universities can only work effectively if these three sources of authority recognize that ambiguities and complexities can contribute significantly to problems which can arise unless a good working relationship is negotiated between them (Sutanto, 2017). In order to get some sense of the ways in which
76
universities are distinctive, the author has in the following sections applied some of that apparatus (concepts, theories, strategies and so forth) from the general literature on organizational culture cited earlier, in order to bring some clarity to those questions which can be answered and recognize and bring to the fore those that remain unanswered.
Although organisational culture analysts have not necessarily assumed or discovered the existence of a harmonious, non-conflictual culture within industry. Manning (2017) hints at the notion of an overall university culture when she reminds us that universities are distinctive organizations, having their own set of characteristics which determine their culture. Drawing on the work of Bimbaum (1988) she acknowledges universities as heterogeneous communities with multiple objectives in terms of teaching, research, community, quality and internationalization, each co-existing in a state of mutual tension (Sutanto, 2017). They [universities] are required to meet a number of benchmarks and standards for example on quality, professional, educational and research (Bryan & Clegg, 2019; Sutanto, 2017) and they are predominately publicly funded, but increasingly less so than in previous years (Sutanto, 2017; Bryan & Clegg, 2019). In terms of classification within the sector, Sutanto (2017) points to some differences between the “two wings of higher education” - those within the “older” university sector and those in the “former polytechnic” sector - and highlights differences in staff-student ratios, decision making and management structures within each. In the current conditions of economic development, another important perspective comes to the fore - economic transformation. According to T. Karolova, economic transformation is a complex socio-economic phenomenon in which it is very difficult to identify clear and unambiguous causal links between individual phenomena, the actions of individual economic players and their results. (Karolova, 2017)
Her evidence suggests that: Structurally, universities comprise highly complex social conclaves generally based around cognate areas and are maintained and developed by the overt conduct of their members including academics, support staff and others (Hornsby & Osman, 2014). In the UK, higher education institutions typically adopt a hierarchical structure consisting of a Principal or Vice Chancellor at the head directly supported by a senior executive committee, beneath which would be Faculty Deans, Heads of School and Heads of Departments (Dill, 1982). These institutions also manifest organizational styles similar to those described by Handy (1976) in terms of power, role, task, and person raised earlier. In applying Handy’s analysis to universities, role culture is apparent in those centralized functional departments having responsibility for finance, human resource management, teaching quality, student support and so forth. Task culture can be seen in project work, for example when developing new educational courses or when preparing for external quality audits

77
on teaching or research. The traditional liberal democratic or collegiate atmosphere is representative of person culture from Handy’s model, and is particularly evident in the grouping of people into teaching or research clusters. Power is conferred on individuals who display competence in motivating, guiding, and integrating research and/or teaching teams. Due to the unique nature of the university, it is often difficult to disassociate power culture from role culture. In the former, power is derived from either expert knowledge or from status, as in the case of professorial title, and is often synonymous with leadership. In terms of this model, higher education institutions can generally be associated with the power/person hybrid culture particularly at faculty and departmental level. This is typically found where core expertise is embedded in a few key workers, as for example in legal and accounting practices. Handy maintained that these cultural forms have a significant effect on determining the environment for innovation to take place and do so in ways that influence morale, levels of motivation and propensity to adapt and change (Duong & Swierczek, 2019).
According to Bankova, a suitable innovative approach for improving the hybrid culture in educational institutions is the appropriate application of the techniques of transformational mediation. This would help to overcome contradictions of different nature and to reach agreements in a natural way and to define new models of relations, which are clear, understandable and observed by the participants in the educational process voluntarily, as they have reached their definition (Bankova, 2019).
Methodology
The appropriate research method was selected based on the literature review as well as to serve the objectives of the research. This primary research is characterized as quantitative and it is conducted using a questionnaire, a tool common to similar research efforts (Ghauri, Gronhaug& Strange, 2020). The overall aim of the research is to investigate teachers' perceptions of innovation in educational organizations. Based on the purpose of the research, the research design focused on the following research questions:
1. What are the teachers' views on innovation in educational services?
2. What are the teachers' views on innovation in the process of delivering educational services?
3. Is there a correlation between innovation levels at different levels of educational organizations?
4. Is there a correlation between the relationships of the educational organization and the levels of use of innovative practices in educational organizations?

78
The questionnaire was selected as the research data collection tool. The selection of the questionnaire was based on the advantages it can offer in terms of research compared to other options such as interviews and focus groups. Specifically, the questionnaire was selected as it can lead to fast, accurate and as low cost as possible collection of research data (Ghauri, Gronhaug & Strange, 2020). The questionnaire was based on previous research on innovative educational programs in Greece, with the necessary additions and improvements in terms of questions to meet all research objectives. In particular, the questionnaire includes 10 sections, with questions and sub-questions and with the measurement of which to be done with different scales. Categorical as demographics, but also 7-point Likert scales (where 1 = None, 7 = Extremely high) to emphasize the intensity of the choices and to be able to compare them.
In the present study, the target population is teachers in the Greek education system and the research sample was a random sample of 471 individuals. Simple random sampling was selected to collect the sample, with individuals being randomly selected from a database of the Ministry of Education, which functioned as a sampling framework. This particular sampling method has advantages and disadvantages over other ways of selecting population units. In particular, it offers random data collection as the researcher essentially randomly selects without discrimination who to ask, but instead finds it difficult to collect data quickly (Ghauri, Gronhaug & Strange, 2020). Geographically, the survey was conducted with respondents in all regions of the country and the identification of respondents was carried out via the internet. Below is the composition of the research sample. Finally, the majority of the respondents were females (61.1%), 33.8% were from 31 to 45 years old, 91% hold a PhD while 47.8%of the respondents have less than 5 years of professional experience. The analysis of the data provided by the primary data analysis was performed using the SPSS 26.0 statistical analysis program. The One-way ANOVA and Pearson correlation parametric test were selected to verify statistically significant correlations at a = 0.05 level of significance.
Findings
Regarding what are the teachers' views on innovation in educational services, the respondents state that innovative change is most important for new course formats following by new subject areas and new client groups. Moreover, 25.5% of respondents state that such innovation shave been successfully implemented and have achieved the expected benefits, 64% state that innovative educational packages are the most significant innovation concerning educational service since the last three years, following by offering collaborative programs (48%), and offering mix subject programs (40%) (Figure 1).

79
Figure № 1. Institution’s most significant innovation concerning educational services
Moreover, the concepts for the innovation on educational services have been mostly developed by the institution (73%), following by institutions in collaboration with others (56%) and finally other institutions (12%).
Figure № 2. Development of the concepts for the innovation on educational services
Regarding what are the teachers' views on innovation in the process of
delivering educational services, the respondents state that innovative change regarding educational delivery processes is most important for new learning resources or facilities (eg. virtual environments) following by new teaching and learning methods (eg. peer group reviews) and finally new approaches to student
64
25
48
40
0 10 20 30 40 50 60 70
Innovative educational packages
Multilingual educational packages
Offering of collaborative programs
Offering of mix subject programs
73
56
12
0 10 20 30 40 50 60 70 80
Mainly your institution
Your institution in collaboration with others
Mainly other institutions

80
monitoring or support (eg. measures to improve retention). Moreover, 41.4% of respondents state that such innovations have been successfully implemented and have achieved the expected benefits, while 81% state that the use of group meeting applications are the most significant innovation concerning educational delivery processes in the last three years, following by internet platforms (78%), and the use of innovative teaching software (68%) (Table 1).
Table № 1. Institution’s most significant innovation concerning educational
delivery processes in the last three years Innovation concerning educational services Percentage
Use of innovative teaching software 68
Use of internet platforms 78
Use of internet applications 53
Use of group meeting applications 81
Additionally, the concepts for the innovation on educational delivery
processes have been mostly developed by the institutions in collaboration with others (61%), following by other institutions (58%) and finally respondents’ institutions (24%).
Figure № 3. Development of the concepts for the innovation on educational delivery processes
Finally, the findings show that the higher the level of innovation regarding
educational services, the higher also is the level of innovation on educational processes (r = .890, p < 0.01). Moreover, the higher the level of innovation regarding educational services, the higher also is the level of innovation on business organization, and the higher the level of innovation regarding educational processes, the higher also is the level of innovation on business
24
61
58
0 10 20 30 40 50 60 70
Mainly your institution
Your institution in collaboration withothers
Mainly other institutions

81
organization (r = .559, p < 0.01). Moreover, the findings show that the higher the level of innovation regarding educational services, the higher also is the level of relationship with educational service providers and the level of relationship with government agencies. The level of innovation on educational processes presents a positive statistically significant relationship with the level of relationship with educational service providers (r = .393, p < 0.05) and the level of relationship with government agencies (r = .326, p < 0.01). Therefore, the higher the level of innovation regarding educational processes, the higher also is the level of relationship with educational service providers and the level of relationship with government agencies. Finally, the level of innovation on business organization presents a positive statistically significant relationship with the level of relationship with educational service providers (r = .382, p < 0.05) and the level of relationship with government agencies (r = .344, p < 0.01). Therefore, the higher the level of innovation regarding the business organization, the higher also is the level of relationship with educational service providers and the level of relationship with government agencies.
Table № 2. Correlations
1 2 3 4 5 6
1. Level of innovation on educational services
1 .890** .559** .393* .326* .016
2. Level of innovation on educational processes
1 .572** .382* .344* .033
3. Level of innovation on business organization
1 .356* .387* .062
4. Relationships with educational service providers
1 .335* .054
5. Relationships with government agencies
1 .801**
6. Relationships with professional networks
1
Note: ** Correlation is significant at the 0.01 level (2-tailed).
* Correlation is significant at the 0.05 level (2-tailed).
Conclusions
The policy that ultimately wants the promotion of the educational unit into an educational policy-making body presupposes a unified vision and goals for education, a common peer culture and a professional ethos that can emerge through decentralized administration, collective processes, school counseling

82
system in matters of planning and planning of the educational project, enrichment of the curricula and teaching methods, professional development of teachers to deal with particular social and school problems, evaluation of the implementation of changes, project report and connection of the educational unit with the local community. This policy respects the experience and knowledge of teachers and leaves them room for initiative, innovation and participation in decision-making and planning, contributing to the conscious choice of implementing change without forcibly moving away from the old methods, but also in its development. Cooperation and solidarity between them. Thus consultation, teamwork, participation and appropriate leadership guarantee productive education.
The Greek school, in order to meet the modern pedagogical and cultural requirements as well as technological developments, introduced a series of Innovative Programs / Actions, which cause cracks in the curriculum such as Environmental Education, Health Education, Student Groups in Standards and Schools. The Panhellenic student competitions, which operate optionally and outside the program schedule in secondary education. Characteristic of all Innovative Programs is the effort to approach knowledge through collaborative and experiential processes, applying alternative teaching methods and using new technologies as supervisory means, in order for the teacher to transform from a simple knowledge transponder into a knowledge-co-creator passive recipient to an active shareholder in the knowledge acquisition process, as a member of a team working collaboratively. The main reasons why these programs did not receive a wider response from teachers include their implementation after the end of the Program Schedule, students 'lack of free time due to their extracurricular obligations, teachers' reluctance to attend relevant training seminars, lack of funding and lack of appropriate equipment. In addition, the identified lack of a comprehensive evaluation and systematic investigation of the degree of achievement of the objectives of the Innovative Programs, does not allow the substantial evaluation of their role, in order to seek their wider integration in the educational process and its final quality upgrade.
However, looking for the deeper reasons that make teachers reluctant to implement innovative actions, we focus on the same structure of the Greek education system that has a highly centralized character, at least in terms of Secondary and Primary education resulting in minimal administrative responsibilities in the school unit, which assumes the role of executor of the central educational policy. As the educational unit is not involved in the process of shaping this policy, teachers are called upon in the case of introducing educational changes, which are planned and legislated centrally, to implement

83
them by adopting them largely indiscriminately and to understand them through reading circulars and attending training seminars.
The policy that ultimately wants the promotion of the educational unit into an educational policy-making body presupposes a unified vision and goals for education, a common peer culture and a professional ethos that can emerge through decentralized administration, collective processes, a school counseling system in issues of planning and scheduling of the educational project, enrichment of the curricula and teaching methods, professional development of teachers to deal with particular social and school problems, evaluation of the implementation of changes, project report and connection of the educational unit with the local community. This policy respects the experience and knowledge of teachers and leaves them room for initiative, innovation and participation in decision-making and planning, contributing to the conscious choice of implementing change without forcibly moving away from the old methods, but also in its development, cooperation and solidarity between them. Thus consultation, teamwork, participation and appropriate leadership guarantee efficient education.
REFERENCES
Bankova, I. (2019). Administrative conflictology. VFU „ChernorizetsHrabar“. Varna. P. 137-138
Barnard, Z., & Van der Merwe, D. (2016). Innovative management for organizational sustainability in higher education. International journal of sustainability in higher education, 17(2), 208-227.
Bradshaw, M., & Hultquist, B. L. (2016). Innovative teaching strategies in nursing and related health professions. Jones & Bartlett Learning.
Bryan, C., & Clegg, K. (Eds.). (2019). Innovative Assessment in Higher Education: A Handbook for Academic Practitioners. Routledge.
Bryndin, E. (2019). Creative Innovative Higher Education of Researchers with Flexible Skills and Synergy of Cooperation. Contemporary Research in Education and English Language Teaching, 1(1), 1-6.
Corlu, M. S., Capraro, R. M., &Capraro, M. M. (2014). Introducing STEM education: Implications for educating our teachers in the age of innovation.
Deming, D. J., Goldin, C., Katz, L. F., &Yuchtman, N. (2015). Can online learning bend the higher education cost curve?. American Economic Review, 105(5), 496-501.
Duong, D. H., &Swierczek, F. W. (2019). The Impact of Top Management Team and Organizational Culture on Product/Service and Process Innovation in Vietnamese Banks. Journal of Applied Finance & Banking, 9(2), 55-68.

84
Ghauri, P., Grønhaug, K., & Strange, R. (2020). Research methods in business studies. Cambridge University Press.
Golikidou, L., &Tzimoyiannis, A. (2014). Educational Innovations in Secondary Education: Design and study of an eLearning program within the Comenius project. Science and Technology Issues in Education, 7(1-2), 99-118.
Haller, J. B., Bullinger, A. C., &Moslein, K. M. (2011). Innovation contests. Business & Information Systems Engineering, 3(2), 103-106.
Hermans, R., Tondeur, J., van Braak, J., & Valcke, M. (2008). The impact of primary school teachers’ educational beliefs on the classroom use of computers. Computers & education, 51(4), 1499-1509.
Hofman, R. H., de Boom, J., Meeuwisse, M., &Hofman, W. A. (2013). Educational innovation, quality, and effects: An exploration of innovations and their effects in secondary education. Educational Policy, 27(6), 843-866.
Hornsby, D. J., & Osman, R. (2014). Massification in higher education: Large classes and student learning. Higher education, 67(6), 711-719.
Hovne, A. S., Hovne, B. S., & Schott, T. (2014). Entrepreneurs’ innovation benefitting from their education and training and from national policy and culture: A global study. International Journal of Entrepreneurship and Small Business, 23(1-2), 127-144.
Hromi-Zhigalova, T., (2017). Social economy and modern economic transformation, Collection, Social economy in the conditions of limited resources - theory and practice, SWU, p.78, ISBN 978-954-00-0147- 0
Huda, M., Jasmi, K. A., Embong, W. H. W., Safar, J., Mohamad, A. M., Mohamed, A. K., ... & Rahman, S. K. A. (2019). Nurturing compassion-based empathy: innovative approach in higher education. In Social Issues Surrounding Harassment and Assault: Breakthroughs in Research and Practice (pp. 144-163). IGI Global.
Krasteva R., Pantelis Ef. (2017) Bridging relationships between education, refugee crisis and tourism, paper in Scientific Conference “Education and New Learning Technologies”, 3-5 July 2017, Barcelona, https://library.iated.org/view/KRASTEVA2017BRI
Manning, K. (2017). Organizational theory in higher education. Routledge. Maritz, A., De Waal, A., Buse, S., Herstatt, C., Lassen, A., &Maclachlan, R.
(2014). Innovation education programs: toward a conceptual framework. European Journal of Innovation Management, 17(2), 166-182.
Porter, W. W., Graham, C. R., Spring, K. A., & Welch, K. R. (2014). Blended learning in higher education: Institutional adoption and implementation. Computers & Education, 75, 185-195.
Riddell, A., & Nino-Zarazua, M. (2016). The effectiveness of foreign aid to education: What can be learned?. International Journal of Educational Development, 48, 23-36.

85
Schoen, L., &Fusarelli, L. D. (2008). Innovation, NCLB, and the fear factor: The challenge of leading 21st-century schools in an era of accountability. Educational Policy, 22(1), 181-203.
Sharples, M., de Roock, R., Ferguson, R., Gaved, M., Herodotou, C., Koh, E., … & Weller, M. (2016). Innovating pedagogy 2016: Open University innovation report 5.
Simoes, C. (2019). Organizational culture in higher education branding. Strategic Brand Management in Higher Education.
Subramanian, A. M., Choi, Y. R., Lee, S. H., & Hang, C. C. (2016). Linking technological and educational level diversities to innovation performance. The Journal of Technology Transfer, 41(2), 182-204.
Sutanto, E. M. (2017). The influence of organizational learning capability and organizational creativity on organizational innovation of Universities in East Java, Indonesia. Asia Pacific Management Review, 22(3), 128-135.
Thorsteinsson, G. (2014). Innovation education to improve social responsibility through general education. Tiltai, 61(4), 71-78.
Yamazumi, K. (2008). A hybrid activity system as educational innovation. Journal of Educational change, 9(4), 365-373.
Wals, A. E. (2014). Sustainability in higher education in the context of the UN DESD: a review of learning and institutionalization processes. Journal of Cleaner Production, 62, 8-15.

86
Entrepreneurship ISSN: 2738-7402
DOI: 10.37708/ep.swu.v8i2.8 Volume: VІII, Issue: 1, Year: 2020, pp. 86-92
DEVELOPMENT OF MARKETING STRATEGIES IN BULGARIAN ENTERPRISES
Dilyana Yaneva 1
Received: 01.09.2020, Accepted: 01.10.2020
Abstract
The development of an effective marketing strategy is the basis for the formation of a reliable marketing policy of the organization. At the same time, the specifics of each individual marketing strategy allows making the right decisions according to the company's goals, resources and opportunities, market situation and consumer requirements. In this regard, the article aims to examine whether Bulgarian companies have developed marketing strategies and how they are perceived by company management. The results of the opinion of Bulgarian managers and business owners are presented on the basis of a survey conducted in 2019.
Keywords: marketing strategy, types, development, decision-making process
JEL Codes: М10, М30, М31
Introduction
The modern concept for managing the marketing activities of the company includes planning, organization and control of all operations to ensure the process of reliable management decision-making for company success and development. The role of marketing planning is becoming increasingly essential in the face of increasing competition and changing consumer tastes. The process consists of two phases - analytical, concerning the determination of the current state of the organization, and perspective, related to the formulation of marketing visions for the future development of the company (Mladenova, 2006, p. 32). An important element here is the development of a marketing strategy.
The purpose of the article is to reveal the extent of marketing strategies development in the enterprises and their importance for the company management.
1 South-West University “Neofit Rilski”, Blagoevgrad, Faculty of Economics, Chief assist. Prof., PhD, [email protected] ORCID ID: https://orcid.org/0000-0003-3472-4595

87
Problem statement
„In a competitive environment, the starting point is to identify the competitive position, set business objectives, which will comprise revenue, market share and profit requirements, then formulate the strategies necessary to achieve the new position. Under these conditions, marketing strategies are the centerpiece” (Brown & McDonald, 1994, p.1).
Pehlivanov and Kyurova (2013) define the marketing strategy as a way of action of the company on the market which formulates the main goals of the activity and the instrumentality for their achievement. It combines the goals of the company, its production capabilities and chances on the market (p.42). At the same time, the company's strategy must take into account changes in world conditions and emerging new opportunities (Kotler, 1996, p. 116). In a highly competitive environment, only companies that implement effective marketing tools become successful (Kyurova & Yaneva, 2017, p.495). Therefore, the marketing strategy must be focused on the strategic opportunities and the creation of a sustainable competitive advantage of the company. Timofeeva (2015) draws attention to the competitive potential of the enterprise as an important element in the formation and implementation of an effective competitive strategy (p.17). Another important aspect is the orientation towards scientific and technical progress and innovation activity. In this regard, Porter (2004) emphasizes that companies will not succeed if they do not base their strategies on improvement and innovation (p.45).
It is clear that marketing strategy is a key tool for strategic marketing management. It can be said that it is a complex and powerful weapon, with the help of which modern companies can withstand the changing conditions by bringing its capabilities in line with the external environment and the market situation (Pehlivanov, 2006, p. 46-47). It is no coincidence that Kotler and Andreassen (2005) view marketing strategy not only as a way to define marketing goals and objectives, but also as a compilation of specific market goals, competitive positioning and key elements of the marketing mix forming its "core" (p.84).
On the other hand, it helps to determine the strategic positions of the company, their fuller and more effective use, their expansion and / or the creation of future favorable opportunities for development. It presents the strategic alternatives, ways and actions for achieving the set goals in a long-term period. As it reflects the general orientation of the enterprise, it should be coordinated with other functional areas and functional strategies (Madgerova et al., 2012, p.146).

88
Analysis and discussion
To achieve the goal a survey was conducted among 132 managers and owners of enterprises in the field of production, trade and services on the territory of Blagoevgrad region, Bulgaria in the period June - July 2019.
Establishing the profile of enterprises is important for the study. The results of the survey show that according to the sphere of economic activity the enterprises in the sample are distributed as follows: 9.1% - production, 31.8% - trade and 59.1% - services. According to the size, depending on the number of employees, the surveyed enterprises are: 52.3% - micro, 27.3% - small, 6.8% - medium, 13.6% - large enterprises. According to the period of functioning of the market the distribution is as follows: 2.3% - up to 1 year, 25.1% - 1-5 years, 18.2% - 5-10 years, 54.4% - over 10 years.
The reliable planning of the strategic marketing activity of the company requires a study in the following aspects:
• importance of the marketing strategy for the company's success; • availability and degree of development of marketing strategy; • the types of marketing strategies developed in the enterprises.
Figure № 1. Importance of marketing strategy for the company success
Source: own calculation based on surveys’ results Based on the data illustrated in Figure 1, it is found that the majority of
respondents assess the importance of marketing strategy for the development of the organization. However, 18.2% consider it partly essential and 4.5% even insignificant. None of the respondents indicated that it has absolutely no significance for the company's success.
72,7%
18,2%
4,5% 4,5%stronglyagreeagree
undecided
disagree
stronglydisagree

89
Regarding to the existence of a marketing strategy, it is established that over a quarter of the enterprises in Blagoevgrad region (27.3%) have a fully developed strategy. Figure 2 shows that in 54.5% of them it is partially developed and in 6.8% it is under development. However, the relative share of enterprises without such a strategic instrument is relatively high - 11.4%.
Figure № 2. Existence and degree of development of marketing strategy in the
enterprises in Blagoevgrad region
Source: own calculation based on surveys’ results The results show that in larger enterprises, the degree of strategy
development is higher. Two thirds of medium and large enterprises have a fully formulated and implemented in their marketing activities strategy. For small and micro enterprises this share is 33.3% and 8.7%. On the other hand, the majority of them specify that it is partly ready - 65.2% (micro enterprises) and 58.4% (small enterprises). There is no company with more than 50 employees that does not have a developed strategy. At the same time, its absence is found in 17.4% of micro enterprises and 8.3% of small enterprises.
Survey data also show dependence on the period in which the organization operates. It turns out that companies with many years of experience in the market pay due attention to developing a marketing strategy.
For companies established more than 10 years ago the strategy is fully completed (33.3%), partly ready (50%) and under development (4.2%). A quarter of the companies operating from 5 to 10 years have a fully prepared strategy. In the remaining 75% it is partially formulated. 18.2% of the companies with 1 to 5 years of experience do not have such a document and in 45.5% it is partially
27,3%
54,5%
6,8%11,4% Yes
Partly
UnderdevelopmentNo

90
created. None of the companies operating on the market for several months has a fully developed marketing strategy.
Refracting the issues through the sphere of economic activity, it is found that there is a strategy mainly in the commercial enterprises - fully completed in 57.2% and partly in 35.7% of them. In the field of services 73.1% of enterprises claim that the marketing strategy is almost ready. At the same time, in 50% of the enterprises in the production sphere there is such a document and in the other enterprises it is not available.
The third area in the present study concerns the types of marketing strategies developed in the organizations. The results presented in Figure 3 show that the majority of enterprises in the Blagoevgrad region consider the importance of corporate strategies related to company growth and the achievement of the general goals.
Figure № 3. Types of strategies and their importance for the company
development in the enterprises in Blagoevgrad region
Source: own calculation based on surveys’ results For a better understanding of the issue, the developed strategies in the
different types of enterprises are examined. Growth strategies are found to be a priority for 41.7% of micro-enterprises. Equally respondents pay attention to competitive strategies. Their size determines the fact that they do not develop
0% 20% 40% 60% 80% 100%
operational
functional
portfolio/business
corporate
very important important moderately importantslightly important not important

91
business strategies. Small enterprises have an affinity for functional (75%), corporate (58.3%) and operational strategies (58.3%). For the medium-sized enterprises a leading role is played by the corporate and operational strategies. Strategic decisions concerning products, prices, distribution and communications are at the forefront in 66.7% of large companies.
The results of the study show that the leading role in the management of companies established over several months are the strategies related to increasing and maintaining market share, entering new markets, gaining a competitive advantage and market segmentation. Enterprises established less than 10 years ago focus mainly on market development strategies. Most companies (58.3%) with more than 10 years of experience are aware of the importance of the marketing mix in making strategic decisions.
The data reveal that growth strategies are most important for 69.2% of enterprises in the service sector, 78.6% - of those in trade and 75% of manufacturing enterprises. Every third manufacturing company mentions that it develops mainly competitive strategies. The development of business strategies is not directly related to the subject of company activity. That is why the same degree of development of this type of strategies is established in the enterprises in Blagoevgrad region. The formulation of functional strategies is present in 50% of manufacturing companies, 57.7% of service providers and 64.3% of commercial enterprises. Operational strategies are most widely applicable in the field of trade - 71.4% of respondents.
Conclusions
Based on the above, we can conclude that more and more managers understand the need to develop a marketing strategy as a key tool for achieving corporate goals and company prosperity. However, the share of companies that have developed an entirely marketing strategy is small. Most of them have developed individual elements of it.
All types of strategies are being developed in the enterprises in Blagoevgrad region. Priority is given to marketing decisions concerning the conquest of new markets, strengthening the market position, building lasting competitive advantages, increasing profitability, redistribution of resources between SBU, the formation of a portfolio of structural company divisions, market segmentation, product positioning and marketing mix.

92
REFERENCES
Brown, L. & McDonald, M. (1994). Competitive Marketing Strategy: Concepts and Application, Competitive Marketing Strategy for Europe, Palgrave, London, 1-71.
Kotler, P. & Andreasen, A. (2005). Strategic marketing for non-profit organizations. Sofia: Classics and style.
Kotler, P. (1996). Marketing management. Sofia: Grafema.
Kyurova, V. & Yaneva, D. (2017). Research on the impact of the corporate image on the competitiveness of interior design enterprises, CBU International Conference Proceedings, 5, Prague, Czech Republic, 495-498.
Madgerova, R. et al. (2012). Organization and management of small business. Blagoevgrad: Langov.
Mladenova, G. (2006). Marketing planning. Sofia: University for national and world economy Publishing House.
Pehlivanov, V. & Kyurova, V. (2013). Basic marketing issues. Sofia: Galik.
Pehlivanov, V. (2006). Marketing course. Sofia: Galik.
Porter, M. (2004). The competitive advantage of nations. Sofia: Classics and style.
Timofeeva, S. (2015). Competitive potential of enterprise – elements, model and guidelines for development, Entrepreneurship, 1, Blagoevgrad: South-West University Publishing House, 16-30.

93
Entrepreneurship ISSN: 2738-7402
DOI: 10.37708/ep.swu.v8i2.9 Volume: VІII, Issue: 2, Year: 2020, pp. 93-103
MARKET POSITIONING AND INFLUENCE OF TOURIST DESTINATIONS DEVELOPING EDUCATIONAL TOURISM
Iveta Voleva-Petrova1
Received: 28.09.2020, Accepted: 20.10.2020
Abstract
This report main aim is to represent and emphasize the market positioning and influence of tourism destinations developing educational tourism. Main research goals are to define the specification of the tourism market, define educational tourism, to identify the specification of the educational tourism market, and also to represent the methodology for positioning and building marketing influence in tourism destination suggested by the author. The suggested methodology is based on the examined academic literature concerning the positioning of tourist products on the market, the author presents his vision for the main stages for the successful positioning of destinations.
Keywords: educational tourism, tourism market, positioning, market influence
JEL Codes: I23, Z32, Z33, L11
1. Introduction
Tourism is one of the fastest developing economic sectors in the world. Tourism is the main economic power in any country. There are different types and form of tourism. Educational tourism is one specific form that is related to a combination of educational and tourism products. Educational tourism is a great opportunity for any country that has already a stable position in the tourism market but also have quality educational products. Educational tourism is a great opportunity for attraction specific market segments.
2. Tourism market
It is important to clarify some basic concepts related to the tourism market. The market, in general, can be defined as a place for transactions and trade
operations, commodity-money transactions or non-cash exchange or as a center for the exchange of products, services, ideas and money.
1 Southwest University “Neofit Rilski” Blagoevgrad, PhD student. e-mail: [email protected]; ORCID ID: https://orcid.org/0000-0002-9242-7954

94
The tourist market is an abstract construction that reflects the relationship between tourist demand and tourist supply. In principle, market relations are not abstract in real life, but due to the specifics of tourism products, the tourism market must be a symbol of abstract market relations (Neshkov et al., 2001).
The tourist market is the "place" where the connection between the demand and supply of tourist goods and services manifests itself. In the tourist market, several tourist companies come into direct contact with their customers and sell tourist products that are related to tourist travel.
The national tourist market can be emitting and receptive. However, this distinction is only conditional and is based mainly on the fact that the tourist demand is in the territory of the permanent residence of the tourists, and the tourist supply has a certain tourist place where the consumption of tourist goods and services is realized.
The emitting tourist market is the permanent residence of the tourists and the living conditions give rise to tourist needs. In this area there are no suitable conditions to meet these needs and thus the tourist demand is formed, which in turn is directed to other places (Neshkov et al., 2001).
In this sense, the receptive tourist market is a territory whose characteristic feature is the availability and possession of tourist resources and conditions that could meet the tourist needs and immediately thereafter realize the tourist consumption.
International tourism markets are highly segmented according to the different types of tourism products, according to customers and their needs, as well as depending on the destinations. The international tourism market is divided into several regions, which compile and contribute to the complete analysis of the tourism market (Neshkov et al., 2001).
The necessary analysis for each of the tourist regions is carried out to achieve specific goals. These analyzes help to more easily and accurately identify the leading tourist destinations in which there is an increase in interest and consumption of tourist products, and on the other hand identify destinations with a decline in tourist consumption and interest. One of the main characteristics of tourist consumption is its uneven distribution, namely, through such analyzes the concentration is determined and the big differences in the different geographical regions are established. With the help of this type of analysis, experts can identify potentially important countries that, internationally, have great potential to become leading and important tourist destinations, and the development of tourism will contribute positively to their economic and social development.

95
3. Educational tourism
First of all, it is important to define the term 'education'. According to Smith (1982), education can be defined as "an organized, systematized process for promoting learning, providing the necessary conditions and activities through which the learning process itself can take place."
Some authors, such as Kidd (1973) and Smith (1982), believe that there is no precise definition of training, as it can be referred to in three different directions. In the first place, it is a product of training, where the result is important. In second place is the learning process itself, which occurs during learning and gaining new knowledge. The third is the function itself or the actual actions that reinforce the knowledge gained.
There are many and varied forms and types of tourism. To a large extent, the type of tourism is determined by the purpose of the trip. One such type of tourism is youth tourism. According to some authors, educational tourism is a form of youth tourism. Youth tourism does not have a clear and specific definition.
Educational tourism is a niche type of tourism and due to this specificity, it is not widespread in the tourist market. Educational tourism and its supply are aimed at certain market segments, which are often significantly smaller, in contrast to the segments of mass tourism.
According to Haigh (1995), youth tourism is a type of tourism in which young travellers prefer budget accommodation, with an emphasis on meetings with other young travellers. This trip can be individual or organized, with flexible travel schedules with a longer duration than traditional leisure and recreation trips.
Ritchie (Ritchie, et al., 2003) defines educational tourism as “A tourism activity undertaken by individuals who travel on one or more nights with a primary or secondary purpose of education and learning. This definition gives a broader and more comprehensive picture of educational tourism, not only as tourism related to the travels of pupils and students but also individuals who wish to enrich their knowledge.
According to the World Tourism Organization (UNWTO, 2019), educational tourism is considered as a form of tourism that encompasses different types of tourism, which are related to the motives of tourists to travel, participate and engage themselves in various training, self-improvement processes, intellectual growth and the development of different and diverse skills. Educational tourism represents a wide range of products and services related to

96
academic research, skills acquisition holidays, school trips, sports training, career development courses and language courses, among others.
4. Market system of educational tourism
Richie illustrates the tourist demand and supply of educational tourism. It also identifies the factors that influence the two elements of the educational tourism market (Ritchie et al., 2003).
On the one hand, the elements that determine the tourist demand for educational tourism are:
• Demographic characteristics • Tourist behaviour • Motivation • Perceptions that are based on already gained life experience On the supply side, Ritchie points to several key elements that shape the
supply of educational tourist destinations (Ritchie et al., 2003): • The primary tourist product • Destination marketing and management structure • Environment and available resources on the territory of the destination The figure shows two main elements that have a direct impact on decision-
making and these are: • Personal influence • Influence of the destination Researcher Ritchie identifies two main components that underlie the
supply of educational destinations: the main tourism product and secondary or also known as complementary elements (Ritchie et al., 2003). According to the Tourism Commission, these elements are combined differently by organizations in order to create educational tourism products.
Different organizations combine the main tourist products for the purposes of educational tourism. These elements are:
• Tourist attractions and events that are a place to learn and gain certain knowledge. This group includes various historical sites, zoos, archaeological excavations, museums, and a number of other tourist attractions.
• Specialists who provide teaching and provide the necessary information. This group includes teachers, researchers, guides, curators, translators, teachers, and others.

97
• Tour operators who plan and organize tourist trips for tourists participating in educational trips. They offer organized trips with a total price to the destination, tour guide services and other tourist activities.
• Tourism programs developed by organizations that support the process of training tourists. These programs are developed by universities, language schools, specialized interest groups and others.
The secondary services that complement the main product are also important for tourists in educational tourism. These products are:
• Transport services. These services can be independent or included in the package price. These are different means of transport that can be used to reach the destination.
• Hotel services. They may also not be included in the package. • Tourist services. Various insurance companies, travel agencies are
included, which offer additional trips on the territory of the educational destination.
• Destination marketing. This is extremely important for the promotion of the destination as an educational one. It is necessary to build a marketing plan that aims to promote and advertise the destination at national, regional and even international level.
The development of educational tourism in a destination depends entirely on the combination of the first and secondary elements. One of the most important things for market positioning and establishing market influence is the continuous development of the innovation process, building a partnership network, developing and promoting the products of educational tourism (Canadian Tourism Commission, 2001).
As can be seen in the figure no.1, the fact that many of the organizations are not tourism companies and tourism is not their main business can quite effectively limit the management and development of this type of tourism. Such organizations, for example, various educational institutions such as universities, colleges, language schools and others. These are just some of the organizations involved in creating the product of educational tourism. Precisely because their main goal is education, not tourism, and this makes the dissemination and promotion of this type of tourism extremely difficult (Canadian Tourism Commission, 2001).

98
Figure no. 1 Market structure of educational tourism
Source: Ritchie, B., Carr, N., & Cooper, C. (2003). Managing Educational Tourism.
Clevedon, United Kingdom: Channel View Publications.
5. Positioning and market influence of tourist destinations developing educational tourism
In the development of tourism and the spread of new destinations and their entry into new markets, it is becoming increasingly difficult for tourists to distinguish destinations from each other and their positioning is becoming increasingly difficult. For this, the destination needs to base its positioning on physical characteristics such as climate, geographical location, services and infrastructure or specific landmarks and characteristics.
Given that more tourist destinations are similar in the specific characteristics listed, increasing weight in the decision of consumers affects the emotional reactions and experience. It is the same with educational tourist destinations. However, their specificity was played by education and development, which is the motive for attracting tourists to them.
THE EDUCATIONAL TOURIST EXPERIENCE
Personal impactValues and BeliefsEducation and LearningCultural UnderstandingCultural AppreciationMaking FriendsCulture ShockXenophobia
Destination impactsEconomic ImpactsSocio-cultural ImpactsEnvironmental ImpactsDirect and IndirectImpacts at the
National,
Demographics (Age, Gender, Education, Occupation, Origins, Travel Party)
Travel Behaviour ( Experiences, Planning, Length of Stay, Travel Patterns)
Motivations (Social, Escape, Exploration, Intellectual, Fantasy, Physiological,
Education)
Perceptions (Expectations, Preferences, Recommendations, Satisfaction)
THE PRIMARY EDUCATIONAL TOURIST PRODUCTAccommodation; Transport Operators; Universities; Tour Operators;
Sightseeing; Activities; Travel Planners; Language Schools; Attractions;
MARKETING AND MANAGEMENT STRUCTURES National Tourism Board; Heritage Organizations; Universities; Promotion
Organizations; Conservation Organisations; Non-profit Organisations; Language Schools; Trade Bodies; Regional/Local Autorities;
THE ENVIRONMENTAL AND SOCIAL RESOURCE BASE Local culture; Coastline; Nature and Natural Areas; Basic Facilities; Host
Community; Ladscapes;
TOURISM DEMAND
TOURISM SUPPLY
99
The positioning of the brand is closely related to the segmentation of the tourist market. We have already said that tourist markets are many and varied in type and speciality, but not every market can be well positioning a destination.
Positioning is important because of the need to establish and maintain a favourable and distinctive place in the minds of the target segments. This will help set the destination apart from everyone else. (Kotler P. a., 2002)
The concept of positioning is focused on three main areas - market segments, the brand image of the destination in different segments and its competitive advantages. These competitive advantages need to be clearly emphasized in the positioning of the brand in each of the selected segments. (Aaker, 1982).
According to the Economic Encyclopaedia, market influence is also known as market power. For the research, we can define the market influence as the ability of a company to determine the price of its products, at the same time to increase and regulate it without actually having a negative impact on the number of customers (Collective, 2005).
6. Methodology of positioning and building market influence of educational destinations
About successfully positioning of tourist destination on the market and have a market influence, it is necessary to go through several stages.
Based on the analysed academic literature concerning the positioning of tourist products on the market, the author presents his vision for the main stages for the successful positioning of destinations are:
• Effective destination management • Availability of the necessary resources for the development of
educational tourism. • Market segmentation and market assessment • Market forecasting • Building a brand and image • Destination marketing - analysis through several marketing tools. • Development of the tourist product • Building market influence First, the effective management of tourism is very important for
positioning in the tourism market with new tourism products. Management for tourism organizations is often organized by the
destination management organization. The World Tourism Organization defines

100
the destination management organization as a leading organization in the tourism sector, including various bodies, stakeholders and professionals. This organization of authorities aims to facilitate and improve collective work and to achieve partnership between individual countries interested in the implementation of tourism (World Tourism Organization, 2019)
The functions of the destination management organization can change at different management levels - national, regional and local. The main function of this type of organization is to assess the current state of tourism development of the destination, to organize meetings between stakeholders - government, civil society and private organizations (World Tourism Organization, 2019).
There are many and varied functions and responsibilities that the management organizations of the tourist destination can provide. Every tourist destination has this type of organization, but in order to be successfully spread in tourism, it is necessary to turn to a person. Despite the lack of this organization, some answers need to be included in the destination management strategy (World Tourism Organization, 2019).
Second, it is important to have the necessary resources - tourism and education.
Educational tourism is specific and affects certain market niches. In order to develop educational tourism in the territory of a destination, it is necessary to have certain resources. Both tourism and educational resources must be available.
Due to this feature of educational tourism, only certain tourist destinations have the necessary resources to offer and develop it.
In order to position itself on the market as an educational tourist destination, it is necessary to have both types of resources - tourist and educational. Therefore, not every tourist destination can be positioned on the tourist market as an educational one.
The traditional tourist product in order to be created and offered to potential visitors requires the availability of certain groups of resources. On the one hand are the tourist resources, which are divided into two main groups - anthropogenic and natural.
The second most important is the educational product. The quality of the product depends on the quality of education that the institutions provide. It is important to note that in addition to quality, it is important that the product is accessible. By affordable is meant that the product must be at a good price that is appropriate for the market segment that aims to be attracted to the destination. Also, accessibility is expressed in the location of the destination. This aspect includes the legal regime for visiting the destination. Quite often, in some
101
countries, it is necessary to issue a visa to access it. This is a factor that contributes to attracting consumers. If the destination is affordable, in addition to financial, it provides an opportunity to be better positioned in the market.
In order to achieve success as an educational tourist destination, it is necessary to study in detail the target customers. During this stage, attention is focused on key target markets that will generate a higher percentage of visitors. To this end, it is necessary to conduct a detailed study to identify and understand the main target markets. In order to achieve the goal and the position to be successfully positioned in these target markets, it is necessary to have a strong impact on market segments.
Market research is the key tool for identifying the needs and desires of the target visitors, both in terms of tangible products such as accommodation and attractions and intangibles such as various experiences, entertainment or education. In this process, it is important to pay attention to the emotional motive. In educational tourism, it is also possible that the choice of destination is tied to emotion.
Market forecasting provides an opportunity for destination managers to explore opportunities for development and building better market influence. Forecasting makes it possible to determine the leading trends in the movement of the number of foreign students who have chosen the destination. If an increase in the number of international students is envisaged, it is necessary to make improvements in the product, with the aim of meeting the needs.
Building the image is one of the important steps towards positioning and increasing the market share of the educational destination on the market. Creating a unique identity is important for the destination. As an educational tourist destination, it needs to be different from its competitors. This is achieved by creating a unique product that is a combination of tourism and education. Identity makes the destination more easily recognizable among competitors in the market.
Branding a tourist destination as an educational one will significantly contribute to increasing the market share of educational tourists. Good and effective branding helps to provide information and generates greater market demand.
The educational tourist product is a combination of various elements that create a complete experience that can be offered to potential visitors. On-site experiences at the destination include intangible features (educational products and services, unique events, attractions, quality of the environment, service levels, kindness to people, etc.) as well as material aspects such as public

102
infrastructure, private products and services, public attractions and services, community lifestyle, attractions, etc.
7. Conclusion
Educational tourism is a great opportunity for tourism destination who has already a stable position in the tourism market. This type of tourism can be the development of any country which has educational and tourism resources. There is a need for interaction between different institutions - educational and tourism. It is necessary for the development of the educational product. Some educational destinations are working on developing a good educational tourism product that is going to attract many visitors. Positioning and developing market influence is not an easy task but it is achievable.
REFERENCES
Aaker, D. a. (1982). Positioning your product. Business Horizons 25.
Canadian Tourism Commission (CTC). (2001). Learning Travel: ‘Canadian Ed-Ventures’ Learning Vacations in Canada: An Overview. Canadian Tourism Commission.
Collective. (2005). Economic Encyclopedia. Science and art.
Haigh, R. (1995). Backpackers in Australia. Canberra: Bureau of Tourism Research.
Kidd, J. R. (1973). How adults learn. Chicago: Follett.
Kotler, P. a. (2002). Country as brand, product, and beyond: a place marketing and brand management perspective. Journal of Brand Management 9, 249–261.
Neshkov, M., Rakadzhiyska, S., Dabeva, T., Marinov, S., Mileva, M., & Kazadjieva, V. (2001). Introduction to tourism. Varna: University Publishing House University of Economics - Varna.
Smith, R. (1982). Learning how to learn. Chicago: IL: Follett.
Ritchie, B., Carr, N., & Cooper, C. (2003). Managing Educational Tourism. Clevedon, United Kingdom: Channel View Publications.
103
World Tourism Organization. (2019). UNWTO Guidelines for Institutional Strengthening of Destination Management Organizations (DMOs) – Preparing DMOs for new challenges. Madrid: https://doi.org/10.18111/9789284420841.
World Tourism Organization (UNWTO). (2019). UNWTO Tourism Definitions. Madrid, Spain: World Tourism Organization (UNWTO) https://doi.org/10.18111/9789284420858.
World Tourism Organization (UNWTO). (2007). A Practical Guide to Tourism Destination Management. Madrid: UNWTO.

104
Entrepreneurship ISSN: 2738-7402
DOI: 10.37708/ep.swu.v8i2.10 Volume: VІII, Issue: 2, Year: 2020, pp. 104-118 SURVEY OF THE ATTITUDES OF BULGARIAN CONSUMERS
TO WINE CONSUMPTION
Nikolay V. Logodashki 1 Received: 10.10.2020, Accepted: 29.10.2020
Abstract
Continuous research of consumer product choice is the basis for improving the characteristics of the offered product. This in turn leads to the creation of consumer satisfaction with the product, and it helps to increase the competitiveness of the products offered. The main goal of the present study is to investigate the consumer behavior and attitudes of Bulgarian consumers for wine consumption, as well as the impact of the COVID-19 pandemic on them. The main expected results are established attitudes towards wine consumption by Bulgarian consumers, which wine producers can use in making decisions related to competitiveness. The main research methods used in the study are content analysis, method of comparison, intuitive and systematic approach, method of analysis and synthesis, survey.
Keywords: consumer behavior, consumer attitude, wine, wine producers
JEL Codes: L66
1. Introduction
The study of consumer behavior and the factors that influence consumer choice are important for the success of wine producers and for increasing their competitiveness. When deciding what wine to produce and how to market it, the real needs of the customer are decisive. This is because the behavior of the customer as a purchaser, as well as as an evaluator of the product in the process of its consumption decisively motivates the marketing actions of the producer (Karakasheva L., L. Mencheva, etc., 1997). Consumer behavior is a subdivision of human behavior that is related to the decisions and actions of individuals in the purchase and use of products. (Goranova P. 2002) It is a process of selectivity of activity and the form of manifestation of the many personal elements of the consumer as interests, motive for behavior, consumer needs, etc. (Uzunova Yu., 1 Department of Management and Marketing, Faculty of Economics SWU "Neofit Rilski" Blagoevgrad, PhD student e-mail: [email protected], ORCID ID: https://orcid.org/0000-0001-8674-8922;

105
D. Doganov. 1992) Consumer behavior is an understanding of who buys and why consumers buy (or do not buy) products and services (Hawkins, D., R. Best, K. Coney. 1992), and the ability to anticipate consumer behavior is key to planning and managing in a dynamically changing environment. In this regard, Kotler connects the study of consumers by managers in order to explain who exactly buys, how exactly they buy, when they buy, where they buy and why they buy. (Kotler, Ph. 1993) To summarize, we can define consumer behavior as a system of purposeful and motivated actions of individuals undertaken in the search, purchase and use of products and services that meet certain needs.
2. Discussion
The companies operate in a highly competitive environment and it demands to synchronize the company's activities to market trends which appear as an essential prerequisite for acquiring competitive advantages. (Zlateva, D., Atanasova, A., Kalaidjieva, V., 2016) According to Filipova, the precise and reliable grouping of consumers in terms of their requirements and preferences gives the necessary information to managers to implement the right strategies to increase competitiveness. (Filipova M., 2004) In this regard, she points out that it is necessary to study the consumer choice of the product constantly, and on this basis to improve the characteristics of the proposed product continuously, which will lead to consumer satisfaction with the product, which in turn leads to increased competitiveness of the offered products. (Filipova, M. 2005)
Kalaydzhieva point out that the competitiveness must be seen as an organisational and managerial process that guarantees long-term success, taking into account resource efficiency and providing continuous self-control. By nature, competitiveness is relative rather than absolute. It is not a static, but rather a dynamic variable, since it is determined by existing competitors. According to her opinion every innovation provides an opportunity to increase the quality of the product or the activity, which in turn is one of the prerequisites for increasing competitiveness. Innovations in products related to newly emerging needs require satisfaction, and thus attract new customers, and expand the markets of the enterprise. (Kalaydzhieva, V. 2020).
Innovation is most often seen as a tool, as a factor for increasing the competitiveness or as an element of it. (Kalaydzhieva, V. (2019) Knowledge of the techniques and the product positioning, their parallel implementation in order to combine their advantages to achieve a synergy, enables companies to gain a strong competitive advantage that is relevant to establishing a permanent place
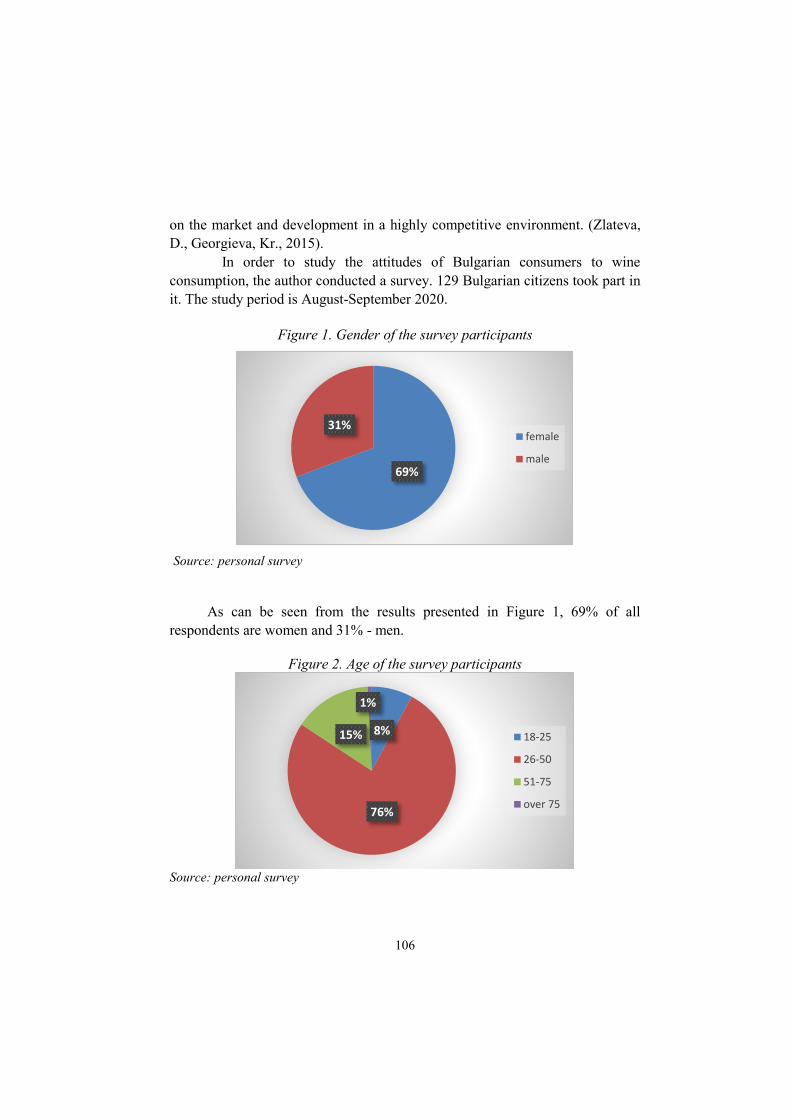
106
on the market and development in a highly competitive environment. (Zlateva, D., Georgieva, Kr., 2015).
In order to study the attitudes of Bulgarian consumers to wine consumption, the author conducted a survey. 129 Bulgarian citizens took part in it. The study period is August-September 2020.
Figure 1. Gender of the survey participants
Source: personal survey
As can be seen from the results presented in Figure 1, 69% of all respondents are women and 31% - men.
Figure 2. Age of the survey participants
Source: personal survey
69%
31%female
male
8%
76%
15%
1%
18-25
26-50
51-75
over 75
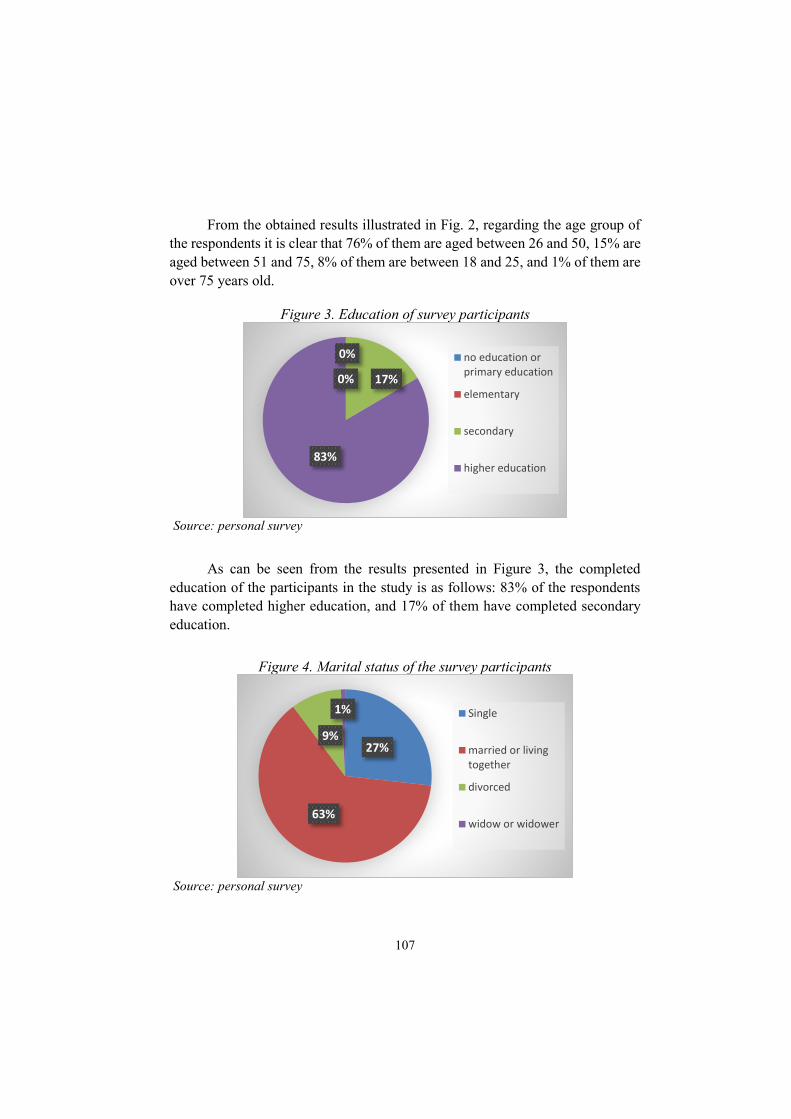
107
From the obtained results illustrated in Fig. 2, regarding the age group of the respondents it is clear that 76% of them are aged between 26 and 50, 15% are aged between 51 and 75, 8% of them are between 18 and 25, and 1% of them are over 75 years old.
Figure 3. Education of survey participants
Source: personal survey
As can be seen from the results presented in Figure 3, the completed education of the participants in the study is as follows: 83% of the respondents have completed higher education, and 17% of them have completed secondary education.
Figure 4. Marital status of the survey participants
Source: personal survey
0%
0%
17%
83%
no education orprimary education
elementary
secondary
higher education
27%
63%
9%
1% Single
married or livingtogether
divorced
widow or widower

108
From the results illustrated in Fig. 4 it can be seen that the largest number of respondents are married or people living with someone - 63%, and 27% are single. 9% of the respondents are divorced and 1% of all are widows/ers.
Figure 5. Monthly income of the survey participants
Source: personal survey
As can be seen from the results presented in Fig. 5, of those who classified their monthly income, the largest number of respondents earn between BGN 501 and BGN 1500 - 53%. 39% of them earn more than BGN 1,500 per month, and the least number are the respondents with a monthly income below BGN 500. - 8%.
8%
53%
39%
below BGN 500
between BGN 501and BGN 1500
more than BGN1500
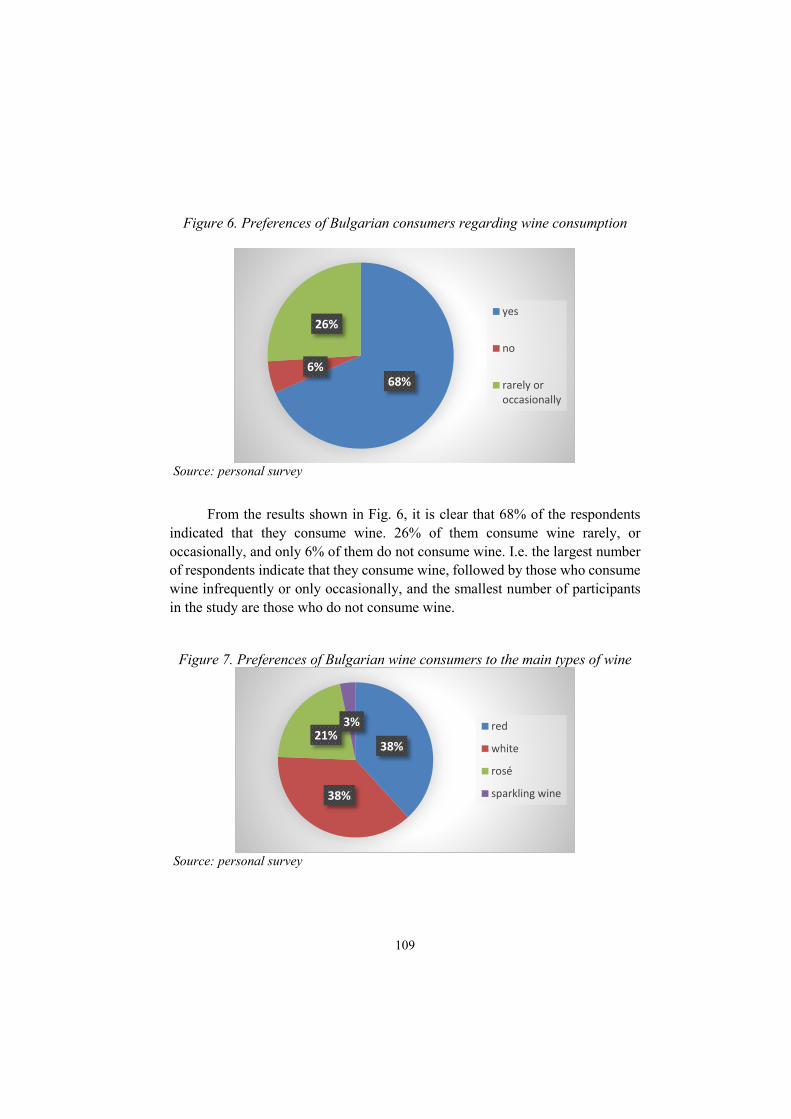
109
Figure 6. Preferences of Bulgarian consumers regarding wine consumption
Source: personal survey
From the results shown in Fig. 6, it is clear that 68% of the respondents indicated that they consume wine. 26% of them consume wine rarely, or occasionally, and only 6% of them do not consume wine. I.e. the largest number of respondents indicate that they consume wine, followed by those who consume wine infrequently or only occasionally, and the smallest number of participants in the study are those who do not consume wine.
Figure 7. Preferences of Bulgarian wine consumers to the main types of wine
Source: personal survey
68%6%
26%yes
no
rarely oroccasionally
38%
38%
21%3% red
white
rosé
sparkling wine

110
From the results of the study presented in Fig.7 regarding the preference of the main type of wine, we can distinguish that the largest number of people prefer red wine - 39%. People who drink white wine are one percent less - 38%. 22% of respondents prefer to drink rosé, and 1% prefer sparkling wine. The results obtained by the author give us reason to say that there is almost no difference in consumer preferences between red and white wine, and rosé and sparkling wine are less preferred by Bulgarian consumers of wine.
Figure 8. Preference of Bulgarian wine consumers to sweet or dry type of wine
Source: personal survey
As can be seen from the results shown in Fig. 8, it is clear that 73% of the respondents prefer dry wine and 27% prefer sweet wine, which means that dry wine is preferred three times more often than sweet wine by the Bulgarian wine consumer.
73%
27%
dry
sweet

111
Figure 9. Preferences of Bulgarian wine consumers to its alcohol content
Source: personal survey
From the results illustrated in Fig.9 it is clear that 82% are consumers who prefer lighter wine, compared to 18% who prefer stronger wine, ie. lighter wine is definitely much more preferable than the stronger one by the native wine consumer.
Figure 10. Preferences of Bulgarian wine consumers to Bulgarian or imported wine
Source: personal survey
18%
82%
I prefer stronger wine
I prefer lighter wine
85%
15%
native Bulgarian
imported

112
Figure 10 shows the results obtained in a study of the preferences of Bulgarian consumers in the choice of wine - produced in Bulgaria or imported wine. As can be seen from Figure 10, 83% of the participants in the study prefer the native Bulgarian wine, and only 17% of them prefer imported wine. Given the answers thus obtained, we can conclude that Bulgarians mainly prefer to consume domestic wine production, and only a small part of them prefer to drink imported wine.
Figure 11. Preferences of Bulgarian wine consumers to wine from a certain
region of Bulgaria
Source: personal survey
From the results shown in Fig.11 it is clear that for 52% of the participants in the study the region from which the wine they consume is produced is of little importance, and 30% choose wine produced in South-West Bulgaria. 10% of the consumers choose wine for consumption which is produced in the region they live in, 5% prefer wine produced in South-East Bulgaria, 2% have indicated as their preference wine produced in North-West Bulgaria, and only 1% prefer wine produced in North-East Bulgaria. Based on the results of the survey we can point out that for more than half of the respondents the region from which the wine they consume is produced is of little or no importance, and the wine from the Southwestern region is the most preferred by respondents who prefer wine from a certain region in Bulgaria. One tenth of the respondents prefer to consume wine from their local cellars. The percentage of Bulgarian wine consumers preferring wine from North-East, South-East and North-West Bulgaria is very small.
10%
30%
2%
5%
1%
52%
Yes, wine from theregion where I live
Yes, wine from South-West Bulgaria
Yes, wine from North-West Bulgaria
Yes, wine from South-East Bulgaria
Yes, wine from North-East Bulgaria
No, the region is oflittle importance

113
Figure 12. Preferences of Bulgarian consumers to the type of wine packaging
Source: personal survey
As can be seen from the results presented in Fig. 12 regarding the preferences of wine packaging, 95% indicated that the ideal wine for them is in a glass bottle, 4% prefer wine on tap, and 1% prefer bag-in-box wine, ie. almost all respondents prefer bottled wine.
95%
1%
4% wine in glass bottles
bag-in-box or BiB wine
wine on tap (draftwine)

114
Figure 13. Preferences of Bulgarian consumers of wine to wine from a certain price range
Source: personal survey
The results illustrated in Fig. 13 give us information about the price range of the wine consumed by Bulgarian consumers. 58% consume wine in the price range between BGN 11 and BGN 20, 18% prefer wine below BGN 10, 13% choose wine with a price between BGN 21 and BGN 30, and 11% like wine over BGN 30. Given the results obtained in this way, we can come to the conclusion that the largest number of respondents drink wine at a price between BGN 11 and BGN 20, followed by those who drink wine at a price below BGN 10, and there are the least preferences for wine at a price between BGN 21 and BGN 30 and over BGN 30.
18%
58%
13%
11%Below BGN 10
between BGN 11 andBGN 20
between BGN 21 andBGN 30
more than BGN 30

115
Figure 14. Frequency of wine consumption by Bulgarian consumers
Source: personal survey
As can be seen from the results shown in Fig. 14, we can determine how often the surveyed consumers drink wine. 23% indicated that they drink wine on a daily basis, 44% once a week, 15% once a month, and 18% more rarely than that, from which we can conclude that in Bulgaria most wine is consumed once a week, followed by daily consumption, and wine is rarely consumed once a month and even more rarely.
23%
44%
15%
18%every day
once a week
once a month
more rarely

116
Figure 15. Influence of the COVID-19 pandemic on the change of the habits of the Bulgarian consumers of the consumption of wine
Source: personal survey
The results illustrated in Fig.15 show that 79% of the participants in the study did not change their habits regarding wine consumption during the COVID-19 pandemic, 13% indicated that their habits changed in terms of the frequency of wine consumption, 6% indicated an impact on their ability to purchase wine, and 3% were affected by the price. Based on the results of the study, we can summarize that more than three-quarters of the respondents were not affected in any way by the COVID-19 pandemic in terms of their consumption of wine, and the rest of them were affected accordingly in terms of frequency of consumption, purchase options,price.
As a favorite brand of Bulgarian wine, respondents indicated many and varied preferences, but some of the most popular Bulgarian wine brands are produced from the wineries Vini Boshkilov, Logodazh, Targovishte, Cherga, Bratya Minkovi, Damyanitsa, Todoroff, Mezek, Stambolovo, Black sea, Starosel, Katarzhina, ‘Dve Mogili’, Svishtov, Domaine Boyar, Midalidare, Make 98, Villa Justina, Medi vali, Zlaten Rozhen, Dalakov Kvevri, Yambol, Cycle, Ethno, Korten, Varna, Karnobat, etc.
3%13%
6%
78%
Yes, regarding theprice
Yes, regarding thefrequency ofconsumption
Yes, regarding theability to purchase
No, not at all

117
3. Conclusion
Based on the results obtained by the author's study of the attitudes of Bulgarian consumers to wine consumption, we can draw the following more significant conclusions:
First, 68% of Bulgarian consumers drink wine, 26% rarely, only occasionally, and 6% of them do not consume wine at all. The highest percentage of consumers drink red and white wine. Both types of wine occupy a relatively equal percentage as a preference, so it is difficult to determine which of the two types is more preferred by consumers. Expectedly, rosѐ is the next type preferred by the Bulgarian consumers of wine, and proof of the low popularity on the one hand, and perhaps culture, on the other hand, is the small percentage of consumers of sparkling wine in our country. Bulgarian consumers definitely prefer twice more dry wine than sweet wine. They also prefer to consume almost four times more light wines than stronger ones.
Second, over 80% of Bulgarian wine consumers prefer native Bulgarian wine, and less than 20% of them prefer imported wine. Despite the great competition on the wine market in our country, a large part of Bulgarians are prefer the native wine, compared to renowned brands of imported wines. Over 50% of Bulgarian consumers do not consider as essential the region in which their preferred wine is produced. 30% of Bulgarian consumers drink wine produced in South-West Bulgaria, which indicates that this region produces wine valued by the Bulgarian wine consumer. 10% prefer wine produced from local wineries in the regions where they live, and less than 10% choose wine produced in other parts of Bulgaria. Almost all Bulgarian consumers (95%) prefer bottled wine, and a small part of them choose draft wine (4%) and bag-in-box wine (1%).
Third, Bulgarian consumers of wine consume the most wine in the price range between BGN 11 and BGN 20 (58%), followed by the consumer who consumes wine below BGN 10 (18%). The third place take consumers whose preferences are for wine with a price between BGN 21 and BGN 30 (13%), and the least Bulgarians consume wine over BGN 30 (11%). The largest percentage of Bulgarian consumers drink wine once a week (44%), followed by consumers who drink wine on a daily basis (23%). The third place take consumers who drink wine more rarely than once a month (18%), and the last place take Bulgarian consumers who tend to consume wine once a month (15%). 78% of Bulgarian consumers were not affected in any way by the COVID-19 pandemic in their habits regarding the consumption of wine, and a small part of them (13%) were affected only in terms of frequency of consumption. 6% of the consumers were affected by the COVID-19 pandemic in that it prevented them financially from
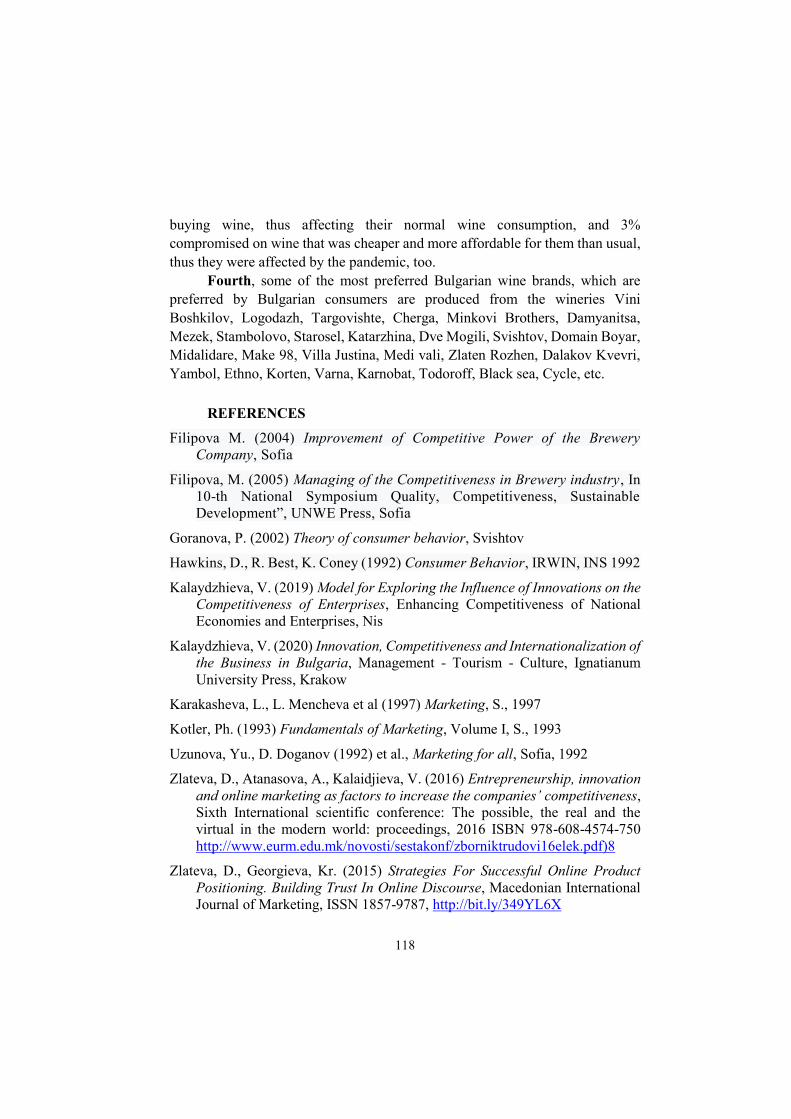
118
buying wine, thus affecting their normal wine consumption, and 3% compromised on wine that was cheaper and more affordable for them than usual, thus they were affected by the pandemic, too.
Fourth, some of the most preferred Bulgarian wine brands, which are preferred by Bulgarian consumers are produced from the wineries Vini Boshkilov, Logodazh, Targovishte, Cherga, Minkovi Brothers, Damyanitsa, Mezek, Stambolovo, Starosel, Katarzhina, Dve Mogili, Svishtov, Domain Boyar, Midalidare, Make 98, Villa Justina, Medi vali, Zlaten Rozhen, Dalakov Kvevri, Yambol, Ethno, Korten, Varna, Karnobat, Todoroff, Black sea, Cycle, etc.
REFERENCES
Filipova M. (2004) Improvement of Competitive Power of the Brewery Company, Sofia
Filipova, M. (2005) Managing of the Competitiveness in Brewery industry, In 10-th National Symposium Quality, Competitiveness, Sustainable Development”, UNWE Press, Sofia
Goranova, P. (2002) Theory of consumer behavior, Svishtov
Hawkins, D., R. Best, K. Coney (1992) Consumer Behavior, IRWIN, INS 1992
Kalaydzhieva, V. (2019) Model for Exploring the Influence of Innovations on the Competitiveness of Enterprises, Enhancing Competitiveness of National Economies and Enterprises, Nis
Kalaydzhieva, V. (2020) Innovation, Competitiveness and Internationalization of the Business in Bulgaria, Management - Tourism - Culture, Ignatianum University Press, Krakow
Karakasheva, L., L. Mencheva et al (1997) Marketing, S., 1997
Kotler, Ph. (1993) Fundamentals of Marketing, Volume I, S., 1993
Uzunova, Yu., D. Doganov (1992) et al., Marketing for all, Sofia, 1992
Zlateva, D., Atanasova, A., Kalaidjieva, V. (2016) Entrepreneurship, innovation and online marketing as factors to increase the companies’ competitiveness, Sixth International scientific conference: The possible, the real and the virtual in the modern world: proceedings, 2016 ISBN 978-608-4574-750 http://www.eurm.edu.mk/novosti/sestakonf/zborniktrudovi16elek.pdf)8
Zlateva, D., Georgieva, Kr. (2015) Strategies For Successful Online Product Positioning. Building Trust In Online Discourse, Macedonian International Journal of Marketing, ISSN 1857-9787, http://bit.ly/349YL6X

119
Entrepreneurship ISSN: 2738-7402
DOI: 10.37708/ep.swu.v8i2.11 Volume: VІII, Issue: 2, Year: 2020, pp. 119-129
ESTABLISHING THE ABILITIES OF EMPLOYEES TO MANAGE WORKING TIME IN VARIOUS ASPECTS OF THE
WORK PROCESS
Emiliya Duneva2 Received: 28.09.2020, Accepted: 18.10.2020
Abstract
For the past decade, organizations have been focusing more and more of their efforts on tackling the issue of effective time management and devoting resources to identifying problems in this direction, so that employees can be consulted and relevant innovations can be undertaken in a way that ensures a minimum of loss of working time in activities that do not lead to specific results in the workplace. In this regard, it is quite expected and advisable for managers and employees to focus on a certain minimum of a set of factors that affect the use of time in the workplace. It is imperative to create a system for tracking and evaluating the way employees use the regulated working hours. In this article we define the skills, abilities and the way to manage the time of a representative sample of employees of the company "LILIA 86 OOD".
Keywords: time management, work process, Bulgarian managers, time allocation
JEL Codes: J22, J29
1. Introduction
Managing the time of employees in modern business is one of the most serious issues among professionals, especially in times of crisis and finds an increasingly serious place in any organization. It is necessary in each employee to look for certain qualities, abilities and skills for proper management of their own working time, which will lead to high results for the organization. Building an indicative profile of employees related to their personal abilities and time management skills, as well as the impact of the above on the overall work process,
2 University of National and World Economy, Sofia, Assistant Professor, PhD, e-mail: [email protected] ORCID ID: https://orcid.org/0000-0003-4292-2989

120
would reveal the strengths and weaknesses of the organization in this area and thus it would be possible to take the necessary corrective actions. When the balance between personal time management of employees and the organization as a whole is there, then we could talk about successful time management. In this regard, when the waste of time is minimized in an organization, it would inevitably lead to competitive results, with the help of which successful management is achieved. The purpose of the development is to establish the extent to which there is a system for managing the working hours of employees in LILIA 86 OOD, both personally by the employees and by the established internal procedures and rules in this regard. For the purpose of the research we will use the method of the survey.
2. Layout of the problem
March 2020 has become emblematic in terms of time management in organizations, which undoubtedly led to stress in the workplace. Unexpectedly, most organizations had to change the way they worked. Whether the Covid-19 crisis will affect daily business tasks negatively or not remains to be seen. About 3 billion people worldwide were under blockade and could not go to their offices. Many managers had to manage their business remotely, and many employees were given the opportunity to write a new page in the list of their competencies. The situation forced the employees to quickly rearrange their tasks, to optimize their business - from production, supply chain, sales, human resources management and other different types of services, financial management, etc. The provided arguments make it possible to conclude that all employees and managers must adapt to the new environment, including employees in the company LILIA 86 OOD Dragoman.
The company was registered in April 2009 with subject of activity: Production and trade in confectionery. Currently, the company maintains and manages two own confectioneries and workshops - one in Sofia and one in Dragoman. Appointed employees 12 pcs
3. Literature Review
A time management system is a combination of processes, tools, techniques and methods. Usually time management is a necessity in the development of any project, as it determines the time for its completion and its scope.
In their book: „Human Resources Management” (Harizanova, 2006, p.229), the authors define the management of working time, identifying it with

121
„self-controlled experience of using time in a subjectively effective way to achieve certain results”. In his book: „Successful Time Management”, Patrick Forsyth (Forsyth, 2013, p.11-12) defines the general principles of time management as simple and clear. Each individual must do what is important and ignore everything that is not. For him, urgent tasks are tasks that are not properly distributed when they arise. However, oversimplifying tasks does not make them easier to deal with.
In order to continuously monitor the use of working time by employees, it is necessary to introduce constant control over its use. There are various ways to control working hours, the most common nowadays, among which are electronic cards, control systems for access to the workplace, video surveillance and „logging” in the database. However, some of the control tools are limited to reporting the entry and exit of employees at their workplace and do not have a mechanism for recording the actions of employees inside the workplace.
Main problems in consolidating working time 9 Many meetings (including face-to-face and online); 9 Unexpected visitors (unexpected meetings); 9 Incorrect delegation of tasks; 9 Telephone interruptions; 9 Crises; 9 Socialization at the workplace - coffee breaks, cigarettes,
conversations with colleagues; 9 Inability to prioritize tasks.
4. Time management methods
POSEC method
In his book: „How to Become Extraordinary Managers”, Dr. Libardo Gonzalez (Gonzalez, 2011, p.79) considers the POSEC method of time management as an acronym, denoting the following main points that are emphasized in its use:
9 Prioritize ; 9 Organizing; 9 Streamlining; 9 Economizing; 9 Contributing.
The method builds a template that emphasizes the average values of an individual's primary need for emotional and material security. This shows that by first satisfying the personal responsibilities of an individual, it is then easier for

122
him to take collective responsibility. According to the POSEC method, it is necessary to prioritize personal time and the lives of individuals to be determined by clear goals. It is then necessary to organize the tasks that are performed regularly in order for them to be successful. The next step is to streamline tasks that are not liked but need to be done. In addition, it is advisable to reduce the performance of tasks that are pleasant to perform, but not urgent. Finally, it is required to contribute by paying attention to the tasks that really matter.
Eisenhower matrix
The Time Management Matrix was popularized as a management method by Stephen Covey (1990, pp. 87-88) in his book The Seven Habits of Highly Effective People. It indicates how the whole work can be distributed according to two criteria: how important it is (the vertical axis of the diagram) and how urgent it is (the horizontal axis). As a result of these two criteria, the model creates four squares, which Covey calls quadrants, which represent the key to time management. All tasks are evaluated using the criteria important / not important and urgent / not urgent, and are placed in the defined quadrants.
The Pareto principle
The Pareto principle (Koch, 1999) is a statistical decision-making technique used for a limited number of tasks that generate a significant overall effect. Pareto's principle is based on the fact that doing 20% of the work generates 80% of the advantage of doing all the work. Or in terms of quality improvement, the vast majority of problems (80%) are generated by several key causes (20%). The Pareto principle is a formal technique, useful when many possible outcomes of action compete with each other. In essence, the principle assesses the benefits provided by each action and then selects a number of the most effective actions that provide an absolute benefit close to the maximum possible.
Delegation of powers
According to Richard Luke and Perry Mackintosh (Luecke, 2009, p.56), the authors of the book Handbook for Delegating an Employed Manager are processes in which supervisors and senior managers with direct subordinates assign formal authority and responsibility.
When the number of tasks of the manager exceeds his ability to cope with them, it is necessary to build a system for sharing them. In this way, the delegation of power becomes an important tool for organizational functions.
Obstacles to effective time management

123
The main obstacles (Vachkova, 2003, p.15) to the effective management of time, considered by most authors, specialists in the field, can be grouped into the following groups:
1) Lack of priorities For the manager, this means not understanding the priorities at work,
spending the day reacting to crisis moments, moving from one emergency to another, without a defined plan or group of goals.
2) Indecision or procrastination Delaying a decision or postponing action makes it difficult for the manager
to perform basic responsibilities and can paralyze his ability to perform the required work tasks effectively.
3)Inability to delegate The reasons for this are numerous and include: lack of training of managers
to properly delegate, insecurity on the part of the manager, lack of trust, belief that the manager can do something faster and better, fear that their subordinates will resent the tasks and responsibilities assigned to them.
4)Perfectionism and exceptional attention to detail This problem is related to the inability to delegate and includes a fixed idea
of perfectionism and attention to very small details in all tasks, including trivial ones.
5)Ineffective meetings They are one of the most common wastes of time, and managers spend
much of their time in meetings of various types. 6)Telephone interruptions They can upset a person's ability to concentrate and work well. 7)Visits to visitors and non-work-related conversations They are a significant obstacle in the work of the manager, making it
difficult to perform tasks on time. When the focus of the conversation is on something other than the main priorities, such visits are just a waste of time.
8)Rituals related to drinking coffee and smoking and reviewing Social Networks
Depending on the frequency of cigarette and coffee use, considerable time can be wasted during the day. Research shows that up to 1-2 hours a day can be lost from these rituals. In recent years, social networks are literally "eating" time.
9)Inability to say "No" This is the inability of the manager to refuse some unrelated requests from
friends, colleagues, subordinates, superiors and others.

124
The ability to properly manage time is a consequence of the use of various methods and techniques for the successful implementation of the process. In each organization, it is advisable to analyze how employees cope with their daily tasks, methods and the tools that they use to deal with time shortages. Based on the results obtained, management could take action to train and improve the way employees spend their working time.
6. Research
In order to establish the abilities and the ways of reaction of the employees in different aspects in the management of the working hours in LILIA 86 OOD a survey was conducted. Based on the findings, the strengths and weaknesses of employees regarding the application or non-application of time management methods will be highlighted. For the purpose of the study, a representative random sample of 8 people was made, which represents 80% of the total number of employees in the company. For the first step of the survey a questionnaire was compiled, consisting of three parts:
The first part consists of questions measuring various aspects of employee time management.
9 They aim to build a personal profile of the respondents about the ways they practice coping with the tasks in the workplace.
9 The second part consists of questions with listed options, re-evaluating aspects of the employees' time.
9 The third part consists of demographic issues. In the first part, the interviewed employees were asked to assess using a
scale from 1 to 5 to what extent the listed situations apply to them. The main skills that are assessed through the situations presented in the
survey in its first part are the following: 9 Concentration in the workplace; 9 Correct distribution of work tasks in order to complete them within
the specified period; 9 Regular preparation of a daily to-do list; 9 Ability to prioritize; 9 Ability to combine similar tasks; 9 Ability to communicate properly with colleagues in order to avoid
distractions in the workplace; 9 Correct assessment of the time required to perform a task;

125
The main skills that are assessed through the situations presented in the survey in the second part are:
9 Socialization in the workplace; 9 Delegation. The main indicators for which demographic information is collected for
the employees in the third part are: gender, age, level of position. With the help of the first and second parts of the questionnaire, it is possible
to assess the time management factors that employees are able to manage properly and those that need to be improved and paid attention to. The third part aims to gather information about the demographic profile of employees and their level of position. For greater clarity in the article: we also apply the distribution of participants by gender and selected option of question 1. The distribution for all questions in the questionnaire is made according to the same scheme.
Table. 2. Distribution of participants by gender and selected option of question 1.
Based on the results of the survey, it is clear that 40% of all employees almost never have to rush at the last minute to complete a task, that is, they manage to cope within the set deadlines. For 24% of them, however, rushing to complete a task at the last minute is a common phenomenon and applies to them in 75% of cases. 28% of all participants never rush at the last minute to complete their assignments. In 83% of the surveyed women there is a successful handling of all tasks on the agenda. This percentage is significantly lower for men - 17% of them manage to do everything they planned within the working day. 67% of the surveyed men often rush to finish their work at the last minute, while this percentage is significantly lower for women (33%). Of all participants in the study, 48% managed to complete their tasks within or before the deadline.
The situations listed in the second part of the questionnaire aim to assess the extent of the use of time for socialization in the workplace, as well as the skill and frequency of delegation of powers by employees.
Option % women from total no. % men from total no.
100% applies to me 100 0 75% applies to me 50 50 50% applies to me 79 21 25% applies to me 67 33 0% applies to me 100 0

126
None of the respondents spends 2 or more hours socializing in the workplace. 32 to 90 minutes are spent by 32% of the participants in the study, and the highest percentage of all - 48%, spend between 15 and 30 minutes. For 20% of employees, the minutes for socialization are less than 15 per day. These results show that most often the loss of working time per day is between 15 and 30 minutes, which is why employees have to compensate for this time by staying after work.
In all age groups participating in the study, it was observed that most employees spend between 15 and 30 minutes a day socializing. Most employees between the ages of 25 and 30 spend between 60 and 90 minutes a day.
It is advisable for the employer to take measures to limit the loss of working time in meaningless conversations, gossip and discussion of topics that are not related to the work process.
Only 8% of employees delegate more than 50% of their tasks, and 36% delegate a very small percentage. Of all respondents, 44% delegate about 25% of their responsibilities. These results clearly highlight the need for additional measures and training in order to familiarize employees with the benefits of delegation as a time management method.
In connection with the use of e-mails for accepting orders, etc., the author of the article has included a question assessing the way of dealing with the receipt and processing of electronic messages. 88% of the surveyed employees take the time to respond to the messages they receive each time they are received. Only 12% of participants respond to inquiries received at a specific time each day. This issue also requires attention to be paid to the software used to process electronic messages and the control options it offers. It is recommended that employees undergo special training to work with specialized message processing software to help manage their working hours.
Conclusions from the analysis of the conducted research
The evaluation of the elements was carried out on three criteria - personal qualities of the leader, professional competencies of the leader and communication culture of the leader. The highest rated elements for each criterion can be included in a list containing characteristics that a management culture should have:
x Responsibility x Transparency x Cooperation x Loyalty

127
x Knowledge of the law x Management experience x Strategic orientation x Promoting innovation x Keeping written correspondence x Conducting online communications x Successful negotiations x Knowledge of nonverbal communication.
The presented list includes the four elements of each criterion, which were most highly rated by the respondents, as important qualities and managerial competencies for the manager. We can conclude that according to the study, these are the elements that should be embedded in the management culture of successful managers.
Table 7. presents the derived elements of the concepts for corporate culture, the analysis of the documents from the public sector, in order to make a
comparison and to find out which are the most evaluated by them after the empirical research.
Elements of management culture derived from corporate concepts
Elements of management culture derived from public
sector documents
Elements of management culture, derived from the
empirical study
x Vision, as a guiding factor in the management of the head
x The values
x Openness and transparency
x Efficiency and effectiveness
x Responsibility for environmental
protection x Social responsibility
x Responsibility x Transparency x Сooperation x Loyalty x Knowledge of the law
x Mentoring x Respect and courtesy x Communication
x Responsibility x Knowledge in the field
of proper delegation x Administrative culture x Promoting innovation x Strategic orientation
x Management experience x Strategic orientation x Promoting innovation x Keeping written
correspondence x Conducting online
communications x Successful negotiations x Knowledge of nonverbal
communication

128
As can be seen from Table 7, certain elements derived from the theoretical
analysis were dropped after the empirical study, because they were poorly evaluated by the surveyed managers. Elements such as - efficiency and effectiveness, environmental protection and administrative culture, embedded in the culture of the manager in the public sector, are not highly valued by business managers. Communication at the corporate level, according to the respondents, should be represented in the managerial culture of the leader most strongly through the elements - written correspondence, online communication, successful negotiation and knowledge of nonverbal communication.
Thanks to the conducted empirical research, the basic goal of the research was fulfilled, namely to establish the key elements, characteristic for the managerial culture of the Bulgarian managers.
6. Conclusion
Based on the analysis of the survey and the study of working hypotheses, the highest rated elements of the manager's culture can be distinguished. The evaluation of the elements was carried out on three criteria - personal qualities of the leader, professional competencies of the leader and communication culture of the leader. The highest rated elements for each criterion can be included in a list containing characteristics that a management culture must have: √ responsibility, transparency, cooperation, loyalty, respondents over 35 years old Respondents under 35 years old, knowledge of the law, managerial experience , strategic orientation, promotion of innovations, keeping written correspondence √ conducting online communications, successful negotiations, knowledge of non-verbal communication. The presented list includes the four elements of each criterion, which were most highly rated by the respondents, as important qualities and managerial competencies for the manager.
We can conclude that according to the study, these are the elements that should be embedded in the management culture of successful managers. Table 7 presents the derived elements of the concepts for corporate culture, the analysis of the documents from the public sector, in order to make a comparison and to find out which are the most evaluated by them after the empirical research. As can be seen from Table 7, certain elements derived from the theoretical analysis were dropped after the empirical study, because they were poorly evaluated by the surveyed managers. Elements such as - efficiency and effectiveness, environmental protection and administrative culture, embedded in the culture of the manager in the public sector, are not highly valued by business managers. Communication at the corporate level, according to the respondents, should be represented in the managerial culture of the leader most strongly through the elements - written correspondence, online communication, successful negotiation and knowledge of nonverbal communication. Thanks to the conducted empirical

129
research, the basic goal of the research was fulfilled, namely to establish the key elements, characteristic for the managerial culture of the Bulgarian managers.
REFERENCES
Arthur, L., „What Are the Elements of a Strong Corporate Culture?“, Demand Media, http://smallbusiness.chron.com/elements-strong-corporate-culture-15674.html
Bellot J., (2011) Defining and assessing organizational culture, Nursing Forum
Harizanova, M., N. Mironova, M. Mirchev, (2006) Management. UI Economy, pp. 96-97
Hatch M., (1997) Organization Theory: Modern, symbolic and postmodern perspectives, Oxford: Oxford University Press
Jantsch, J., „7 Elements of a Healthy and Vibrant Business Culture“, https://www.openforum.com/articles/7-elements-of-a-healthy-and-vibrant-business-culture/
Kroeber L, C. Kluckhohn, W. Untereiner, (1952) Culture: A Critical Review of Concepts and Definitions New York: Vintage Books
Mironova, K. Radev, (2007), Organizational behavior. Avangard Prima, Sofia
Schein, EH., (1985) Organisational culture and leadership 1st Edition San Francisco: Jossey- Bass,
Stoykov, L., (1995) Company culture and communication. IM "Economy" Teatro. G., „Corporate culture: 10 elements to help drive results“, 18th of
February 2013, http://leadingcompany.smartcompany.com.au/employee-engagement/corporate-culture-10-elementsto-help-drive-results/201302183702
Tylor, Edward B., (1874), Primitive culture, researches into the development of mythology, philosophy, religion, language, art and custom. New York, H. Holt and company,
Westrum R., (2004) A typology of organisational cultures Qual Saf Health care

130
Entrepreneurship ISSN: 2738-7402
DOI: 10.37708/ep.swu.v8i2.12 Volume: VІII, Issue: 2, Year: 2020, pp. 130-160
HOW HR PRACTICES AFFECT ORGANIZATIONAL COMMITMENT AND ORGANIZATIONAL CITIZENSHIP
BEHAVIOR
Majida Jrad1 Received: 17.09.2020; Accepted: 01.10.2020
Abstract
The HRM and effective HR practices play an important role for promoting a committed environment and a culture of citizenship. This study is intended to explore the HRM systems’ dynamics and applied HR practices in Lebanese banks and to find their possible link with employee commitment and citizenship behavior. The primary research selected six most representative Lebanese banks. A questionnaire on employee commitment and citizenship behavior was sent to each bank’s HR officers. The questions were derived from the OCQ, ACS, CCS, NCS, and CBS. Direct positive relationship between HR and organizational commitment was not completely verified in terms of the Lebanese bank institutions. The HR-OCB relationship is much more coherent and noticeable especially when the HR role of employee champion emerges. Commitment has a strong relationship with the OCB. Lebanese banks have very promising examples of serious dynamic HRM initiatives that promote employees’ support and recognize their efforts while trying to capitalize on their competences, commitment, and displayed citizenship behaviors. Keywords: human resource management; commitment; questionnaire; Lebanese banks.
JEL Codes: C21; M51; M52; M54
INTRODUCTION
Human resource practices such as supportive environment, fairness and equality, employee participation and empowerment, extensive training, career development, and rewards were found to have significant positive impact on nurturing employee organizational commitment and citizenship behavior (Gaertner, 1999; Xiao and Björkman, 2006; Sun et al., 2007). Each organization should promote such effective HR systems that motivate and inspire employees
1 Lorraine University, France. Researcher, e-mail: [email protected] ORCID ID: https://orcid.org/0000-0002-2849-9507

131
who in turn will reciprocate this support with their individual commitment to the organization (Gould-Williams, 2004). By testing the validity of these correlations in the Lebanese framework, this study is intended to explore the HRM systems’ dynamics and applied HR practices in Lebanese banks and to find their possible link with employee commitment and citizenship behavior. The hypothesis will be tested is the HR practices such as supportive environment, fairness and equality, and employee empowerment have significant positive effect on fostering employee organizational commitment and citizenship behavior in terms of Lebanon’s banking sector.
The significance of this study lies in its attempt to establish a link between organizational parameters and employee attitudes in the Lebanese context. Moreover, the study will addresses the HR management in the Lebanon’s banking sector that is among the best performing sectors of all the Lebanon’s economy. The banking sector in Lebanon is one of the most profitable, highly liquid and well-capitalized in the region. For example, bank deposits exceeded USD 110 billion in 2010 that was among the best financial years for the banking sector of the country. In fact, Lebanon has attracted the largest share of bank deposits in the Middle East and North Africa region in the same year. Despite global credit tightening, credit to the private sector then reached the historical level of USD 36 billion, which is a growth rate of around 22%, the highest in the region. Lebanese banks have a high level of liquidity and the structure and quality of their capital is generally in line with international regulatory standards on bank capital adequacy and liquidity, especially Basle III standards. Lebanese Banks have international presence. Thus along with working on the Lebanese market with 92 Banks covering the Lebanese territory, the Lebanese Banks have significant operations abroad, in countries such as Arab countries, southern and western European countries, African countries, USA, India, Japan, Australia and many other countries. Lebanese banks have branches, affiliated companies, subsidiaries, sister banks and representative offices spread in 25 countries around the world with more than 80 units. There is a very large network of correspondent banks.
The paper is structured in the following main sections. The next section reviews the empirical evidence on this topic to describe the place of present study in the entire evidence. Second section is devoted to the research methodology and its application to find relevant results. Third section presents the results of the application of the research methodology adopted and the discussion on these results. Last section concludes.

132
1. LITERATURE REVIEW
Many studies have shown that HR practices can have a significant influence on firm performance (Huselid, 1995; Benkhoff, 1997; Collins and Clark, 2003; Sun et al., 2007). Human resource management has established notable value by helping companies locate and identify strengths and weaknesses in their resources and activities and which will ultimately have the highest impact on their performance. Managers would then be capable of fostering and benchmarking their firm’s HRM competences and thus take action to enhance organizational policies, management approaches and HR practices. As pointed: "the overall purpose of human resource management is to ensure that the organization is able to achieve success through people” (Armstrong, 2006). In fact, HRM focuses the attention of the firm’s management on the strategies and systems to be implemented in order to gain a higher added value from people achieving objectives in the following areas: organizational effectiveness, human capital management, knowledge management, reward management, employee and labor relations as well as meeting various needs (Armstrong, 2006; Mondy and Noe, 2005; Decenzo and Robbins, 2002).
Originally, literature relates HR to organizational performance. Clear positive relationship between HR practices and organizational performance was conceptualized two decades ago (Armstrong, 2006). Empirical studies provided evidence in favor of those conceptual predictions. Huselid (1995) directed an analysis of the responses of 968 US firms to a questionnaire investigating the use of high-performance work practices. These practices comprise meticulous recruitment and selection, intensive and appropriate training and management development activities, incentive paying, and performance management systems. The study also explored their synergies and their alignment with the corporate strategy and conclusively argued that workforce productivity is influenced by its motivation (Huselid, 1995) He also found that financial performance is affected by employee skills, motivation and organizational structures (Huselid, 1995; Sun et al., 2007).
Becker and Huselid (1998) adopted another approach. They established an index of HR systems in a sample of firms to specify the degree to which each firm took on a high-performance work system. The index comprised important dimensions, including HR strategy, employee motivation, selection and development, and compensation. They found

133
that companies with superior values on the index had financially and statistically higher levels of performance and sustainable competitive advantage.
Becker et al. (1997) evaluated the outcomes of several research projects to gauge the strategic impact of high-performance HR systems on firm’s shareholder value. They claimed that high performance systems will indeed have an impact as long as they are “rooted” in the management infrastructure. In their own words, HRM systems will only have a systematic effect on the bottom line when they are part of the managerial structure and help the company attain significant business priorities such as cutting product development cycle times, increasing customer service, reducing turnover among first-rate staff, etc.
High-performance HR practices have also been linked to organizational performance (productivity) through the mediating role of service-oriented citizenship behaviors (Sun et al., 2007). Actually, these practices promote employees’ perception of supportive work setting and social climate (as trust and cooperation) that inspires discretionary behaviors, which in turn positively affect productivity and thus organizational performance. The stated voluntary behaviors have usually been conceptualized in terms of organizational citizenship behavior (OCB).
Guest et al. (2003) surveyed 366 private sector organizations in the UK and conducted interviews with 610 HR professionals and 462 chief executives. The paper observed that a more systematic and greater use of HR practices (presented through 48 items) is linked to higher levels of labor productivity and higher profit per employee, thus reflecting greater profitability and superior financial performance. As well, employee perception of “developmental” HR practices (best methods) was found to increase the perceived quality of the employee-organization relationship (EOR) through four indicators: perceived organizational support, affective organizational commitment, and procedural and interactional justice. These EOR indicators, having a mediating function, would then enhance employees’ work performance (Kuvaas, 2008).
Paul and Anantharaman (2003) observed that HRM practices such as training, job design, selection, compensation, incentives, and performance appraisal directly influence the operational performance parameters of the firm, for instance employee productivity, product quality, speed of delivery and operating cost. As well, each studied HRM

134
practice had indirect impact on the financial performance of the organization. In an analogous paper by Wright et al. (2003), the researchers examined the impact of HR practices and organizational commitment on the operating performance and profitability of business units. Using a sample of 50 autonomous business units within the same company, the study demonstrates that both employee commitment and HR practices are (statistically) significantly linked to operational measures of performance like productivity and quality, as well as financial measures like operating expenses and pre-tax profits.
Likewise, financial performance was observed to be strongly linked to perceived HR practices and work climate at the business unit level. Inter-departmental cooperation and job security were found to be the most significant predictors (Van Veldhoven, 2005). On the other hand, Gilbreath and Montesino (2006) investigated Human Resource Development’s (HRD) crucial role in evaluating and restructuring the work environment so as to promote dynamic, mentally focused workers that supply their organization with a competitive advantage. They conclude that HRD professionals, by emphasizing HRD’s potential for organizational transformation, could in this way improve employees’ quality of life and contribute to the firm’s success.
Also, results from a survey conducted for CEOs of 73 high-tech firms revealed significant positive correlations between a set of network-building HR practices (training, performance evaluation, rewards) and organizational performance. The relationships were mediated through the companies’ top managers’ social networks – the schemes of connections they have with internal and external players – whereas the most influenced performance indicators were sales growth and stock returns (Collins and Clark, 2003).
Human resource or more accurately human capital measurement has been defined as being “about finding links, correlations and, ideally, causation, between different sets of (HR) data, using statistical techniques”. It actually handles “the analysis of the actual experience of employees, rather than stated HR programs and policies” (Armstrong, 2006).
Special attention is paid on the strategic approach in human resource management. An effective HR strategy realizes what it intended to realize (Mondy and Noe, 2005). Specifically, it will fulfill business needs, is established on thorough analysis and study, and may be developed into

135
executable programs. Effectiveness also entails being logical and comprehensive as well as containing interconnected and consistent elements; it also involves catering for the needs of workers and managers in addition to all of the organization’s stakeholders (Armstrong and Baron, 2002; Anthony et al., 2002; Mondy and Noe, 2005). The following is a comment from a chief executive on effective HR strategy: “is one which actually makes people feel valued. It makes them knowledgeable about the organization and makes them feel clear about where they sit as a group, or team, or individual” (Armstrong, 2006).
HRM has been evolving over recent years and it is now identified as an essential contributor to organizational effectiveness and strategic initiatives (Buck and Watson, 2002). Indeed, the strategic approach to HRM implies linking HRM with the firm’s strategic objectives to enhance organizational performance (Decenzo and Robbins, 2002). Strategic HRM (SHRM) is actually concerned with strategic planning and decision making and coordinates all HR functions for all staff (Anthony et al., 2002).
Moreover, when a strategic decision has a major impacts on the firm’s human capital, HR professionals have to advise and influence the decision process and thus become true business partners (Mondy and Noe, 2005). They should also acknowledge the contribution of HRM to the bottom line and promote the employees-employers communication (Becker and Huselid, 2006).
HRM seeks to enhance employees’ job satisfaction and commitment to the organization by designing and crafting HRM strategies and practices that enhance motivation, participation, and full employee engagement. Commitment was found to be firmly linked to performance indicators such as productivity and profitability (Decenzo and Robbins, 2002; Wright et al., 2003). The focus of organizational commitment research evolved from employee behaviors to employee attitudes. Some studies put emphasis on the factors that are peculiar to the commitment (Porter et al., 1974; Mowday et al., 1979). Other economists consider the organizational commitment as a psychological phenomenon of linkage (Mellor et al., 2001; Schwepker, 2001; Moynihan and Pandey, 2008). There are “attitudinal” views for organizational commitment as well (Mowday et al., 1979; Salancik, 1977; Swailes, 2002; Buck and Watson, 2002).
Commitment is also viewed as a variable with three distinguishable components (rather than types) as per Meyer and Allen’s three-component

136
model: affective, continuance, and normative commitment (Meyer and Allen, 1991; Swailes, 2002; Buck and Watson, 2002). Continuance commitment defines the commitment originating from the perceived cost associated with leaving the organization, that is “having to stay” with the company (Meyer and Allen, 1997; Buck and Watson, 2002; Mellor et al., 2001). Normative commitment is used to describe an individual’s feeling of obligation to remain with the organization, that is a “moral obligation to stay” with the firm (Meyer and Allen, 1997; Buck and Watson, 2002; Mellor et al., 2001; Swailes, 2002).
Several studies have verified that affective, continuance, and normative commitment are distinctive components of commitment. However, other research has reliably shown non-zero correlations between each of these. Most remarkably, the correlation between affective and normative commitment was regularly found to be fairly strong (Allen and Meyer, 1990; Meyer and Allen, 1991). Hence the three components should not be regarded as mutually exclusive commitment forms, but as elements that can commonly coexist; so an employee’s commitment may be made of one, two, or all three constituents (Meyer and Allen, 1997). On the other hand, some researchers asserted that, in spite of their high correlation, affective and normative commitment display sufficiently various correlations with other variables, particularly variables supposed to be antecedents (Allen and Meyer, 1990) or outcomes of commitment (Meyer et al., 2002).
Many researchers have used the Organizational Commitment Questionnaire (OCQ) to measure employee commitment – notably affective commitment – whereas other researchers have used different measurement scales to assess all three components of commitment.
The OCQ was created, introduced and described by Porter et al. (1974) as an “attitudinal assessment” tool. Actually, Mowday et al. (1979) mentioned the necessity for an instrument that displays “acceptable psychometric properties” within the limits of attitude measurement in order to obtain more precise indicators of commitment (p.227).
The purpose of the OCQ was to identify 15 items that mostly illustrate the three factors stated in the definition of commitment (Mowday et al., 1979). Also, it was designed to assess the extent to which employees feel committed to the organization. Indeed, the questionnaire comprises items relevant to the employee’s loyalty to the organization, his/her readiness to apply huge effort to achieve organizational goals, and his/her

137
recognition of the organizational values (Porter et al., 1974). The response format to the statements representing the OCQ items used a 7-point Likert scale. Mowday et al. (1979) administered the OCQ to 2563 employees working in a diversity of jobs in 9 different companies.
On the other hand, measurement of behavioral commitment was addressed by Benkhoff (1997). She proposed a measurement scale based on the assumption that a more genuine picture of commitment is obtained from observing “what employees do” (i.e. behaviors) rather than “what they report about their opinions and feelings” (i.e. attitudes) (Benkhoff, 1997, p.706). The instrument developed was referred to as the Commitment Behaviour Scale (CBS) where commitment behavior is measured from two standpoints: in terms of staff self-evaluation and by staff members assessing their superior. The purpose is to prove whether the respective commitments of managers and employees are uniformly relevant (Benkhoff, 1997).
Moreover, citizenship behaviors have been deemed crucial because they “lubricate the social machinery” of the organization and offer the flexibility required to work through many “unforeseen contingencies” (Smith et al., 1983). In fact, OCB cannot be justified by the same motivational causes as those that entice people to join, stay, and perform within contractual and imposed “in-role” job instructions. It actually lays more resources on behalf of the organization and averts the need for costly formal procedures (Smith et al., 1983; Organ, 1988).
As previously mentioned, the relationship between organizational commitment and OCB has been explored by Meyer et al. (2002). Their research revealed that among the three components of commitment, affective commitment had the strongest positive correlation with OCB, followed by normative commitment. However, continuance commitment was found be unrelated or related negatively to that behavior. Also, it is worth mentioning that the OCB dimensions of altruism and conscientiousness were analyzed separately in the study and that the aforesaid correlations were somewhat similar for these two dimensions (Meyer et al., 2002).
As well, Rifai (2005) investigated the effect of affective commitment on OCB. Employees’ affective organizational commitment is influenced by their perceptions of company support and fairness (Organ, 1988); indeed they will “reciprocate and exceed the minimum requirements of their job by helping others as well as the organization” (Rifai, 2005). Thus,

138
from this “psychological” perspective, affective commitment is positively correlated to OCB.
Similarly, in a survey of 317 clerical workers, Morrison (1994) concluded that employees with a strong feeling of normative commitment consider themselves personally responsible for some forms of discretionary behaviors typically characterized as OCB.
On the other hand, job attitudes (i.e. job satisfaction and organizational commitment) have been proposed by Ackfeldt and Coote (2005) as direct antecedents of OCB. In fact, when employees are satisfied with their jobs and committed to their companies, they will reciprocate by engaging in citizenship behaviors. Thus, a positive correlation between job attitudes and OCB is expected (Ackfeldt and Coote, 2005; Organ and Konovsky, 1989; Organ and Ryan, 1995; Podsakoff et al., 2000; Van Dyne et al., 1994).
When relevant HR strategies and practices are effectively built and executed, then HR is expected to cause a significant influence on commitment. Likewise, ‘high-commitment’ HR practices aim to increase organizational effectiveness and efficiency and provide conditions “that encourage employees to identify with the goals of the organization and work hard to accomplish those goals” (Whitener, 2001, p.517). High-commitment practices also refer to a system of HRM practices that intend to bring out employees’ organizational commitment (Xiao and Björkman, 2006; Iverson and Zatzick, 2007). In fact, the basic element of a high-commitment system is the display of the employer’s trust in the employees; executing these practices means the employer consistently expects that the employees “are trusted to reciprocate by their consummate Moreover, high-commitment HR practices include selective staffing, equitable compensation, inclusive training and development activities, performance appraisal, job design, information sharing, attitude assessment, and labor participation (Whitener, 2001; Gould-Williams, 2004). Also, Xiao and Björkman (2006) presented a more comprehensive list as a measurement construct of high-commitment systems. Table 4 illustrates the 15 items of that list.
It should be noted here that the term ‘high commitment’ is regularly employed in the UK in contrast to the term ‘high performance’ used in the US. Many scholars have stated that high-commitment HR systems affect employee behaviors and attitudes by promoting psychological ties between organization’s and employee’s goals (Huselid, 1995; Becker and

139
Huselid, 1998; Gould-Williams, 2004). Actually, employers and executives applying high-commitment practices are basically attempting to nurture committed employees entrusted “to use their discretion to carry out job tasks in ways that are consistent with organizational goals” (Gould-Williams, 2004, p.64). Thus, high-commitment systems will develop an environment of exchange and reciprocity between a company and its workforce (Whitener, 2001, p.520; Knight-Turvey and Neal, 2003; Gould-Williams, 2004; Paul and Anantharaman, 2004; Iverson and Zatzick, 2007).
Some studies have explored the influence of HRM on employee citizenship behavior. Ackfeldt and Coote (2005) observed that leadership support, professional development, and empowerment are considerably associated to displaying OCB. As well, the outcomes of the study strongly support the positive relationship between job attitudes (i.e. commitment and job satisfaction) and citizenship behaviors, and these findings are consistent with other research results (Organ and Konovsky, 1989; Podsakoff et al., 2000; Williams and Anderson, 1991; Van Dyne et al., 1994). Indeed, as previously mentioned, feelings of job satisfaction and commitment to the organization – which are nurtured by specific HR practices – are key antecedents of OCB (Ackfeldt and Coote, 2005).
Additionally, Piercy et al. (2006) and Sun et al. (2007) found that high-performance HR practices promote employees’ perceptions of a supportive work environment which in turn triggers discretionary behaviors commonly conceptualized in terms of OCB. In fact, and as discussed earlier in this chapter, the positive advantages of a flexible and friendly organizational environment drive employees to reciprocate with beneficial behaviors that best serve the company’s interests (Sun et al., 2007).
2. RESEARCH METHODOLOGY The primary research has been conducted in the Lebanese banking
environment during the month of April-May 2015. The aim was to select leading banks across Lebanon. Six most representative banks have been selected and connected with their HR officials. A questionnaire on employee commitment and citizenship behavior was sent to each bank’s HR officers who took care to administer it to an average of 10 employees. The instrument is divided into two constructs (commitment and OCB) which are then divided into scales representing dimensions of commitment
140
or OCB. In fact, the Organizational Commitment Construct includes items associated with the four components/types of commitment and grouped according to these components, for instance Affective Commitment Scale, Continuance Commitment Scale, and so on. The construct and scales’ items were derived from the most popular commitment measurement tools, mostly the OCQ, ACS, CCS, NCS, and CBS. As for the OCB Construct, it includes items associated with the five OCB dimensions and sorted according to these dimensions, for instance Compliance Scale, Courtesy Scale. The construct and scales’ items were derived from the leading OCB measurement instruments, particularly the ones developed by Smith et al. (1983) and Ackfeldt and Coote (2005). The items had to be rated on a 5-point Likert scale, from 1 (Strongly Disagree) to 5 (Strongly Agree). Prior to administering the questionnaire, titles of the constructs and scales were removed and therefore not visible to the respondents. Completed questionnaires were either handed in directly to author or to HR manager/officer who delivered them to author in sealed envelopes, or they were sent back to author via email. A total of 60 questionnaires were collected.
In order to analyze the raw data, we used SPSS-17. This software is one of the most used programs for statistical analysis.
3. EMPIRICAL RESULTS
When considering the employee questionnaire results (Table 1 below), items related to OCB dimensions had a mean score of 3.8 (out of 5) which could be viewed as a fair hence not a low rating. Thus, the stated roles of HRM and firm management may have contributed to increasing extra-role efforts and fostering citizenship. The examples of citizenship behaviors mentioned by the interviewee are most closely associated to the OCB dimensions of helping behavior and civic virtue. Both of these dimensions also had the same acceptable mean score and certainly reflect the actual discretionary effort of employees. Though compliance dimension was not cited but scored high (4.3), it should not be surprising since this conscientious behavior is normally expected in such prominent organization with highly professional, competent and courteous workforce.

141
Table 1: Fransa Bank Mean Scores for OCB Dimensions
Dimension Mean Score
Helping 3.8
OCB Compliance 4.3
>>> OCB Mean 4.05
When observing the questionnaire results and items pertaining to different types/components of commitment (Table 2 below), the mean score of these items is 3.5 which could be considered as a fair hence not a very low rating. The HRM initiatives may have played a role in increasing employee commitment from a previously very low level. Affective and behavioral commitment levels are around a score of 4 which is fairly high; these could be justified by the increased motivation that was stimulated by HRM intervention. However, it is expected to have an average normative commitment rating since this component is highly dependent on individual characteristics and perception of loyalty, thus the concepts of loyalty and “moral obligation” to stay with one organization are not commonly accepted or believed in. As for the quite average continuance commitment score, it simply suggests that this commitment component is weakly influenced by HRM involvement and that people are not holding on their jobs because of a socio-economic need (but rather a psychological attachment to the firm).
Table 2: Fransa Bank Mean Scores for Commitment Types
Dimension Mean Score
Affective Commitment 4.1
Commitment
Continuance Commitment 3.0
Normative Commitment 3.1
Behavioral Commitment 3.8
>>> Commitment Mean 3.5
When considering the employee questionnaire results (Table 3 below),

142
items related to OCB dimensions had a mean score of 4.1 which is indeed a high rating. Thus, the stated roles of HRM (particularly employee champion) and the promoted values and culture may have contributed to cultivating citizenship. The highest scoring OCB dimension is compliance. These dimensions are very much associated to the mentioned values, cultures, and code of ethics. One should not neglect the role played by the employee relations department that encouraged employee contribution and recognized their efforts as stated, which makes employees reciprocate by positive behaviors such as civic virtue.
Table 3: Bank Audi Mean Scores for OCB Dimensions
Dimension Mean Score
Helping 4.1
OCB Compliance 4.4
>>> OCB Mean 4.25
When observing the questionnaire results and items pertaining to different types/components of commitment (Table 4 below), their mean score is 3.6 which could be considered as a fair relative to the expected high level (by the interviewee). However, affective and then behavioral commitment have relatively much higher ratings than the other two components. Hence, the expectation of the interviewee may have been based on the affective component of commitment and on displaying commitment by behaviors (extra work etc.); hence the continuance and normative components’ lower scores have cut the average as shown. The higher scores could be justified by the mentioned high motivation, HR and management support, effort recognition, and the other cited indicators consistent with the employee champion role (thus the employees reciprocating). Also, it is expected to have an average normative commitment rating because the concepts of loyalty and “moral obligation” to stay with one organization are not commonly accepted or believed in and are not said to be promoted within the organization. As for the very average continuance commitment score, it simply suggests that this commitment component is weakly influenced by HRM roles and that people are not keeping on their jobs because of financial and tangible

143
benefits.
Table 4: Bank Audi Mean Scores for Commitment Types
Dimension Mean Score
Affective Commitment 4.2
Commitment
Continuance Commitment 3.0
Normative Commitment 3.1
Behavioral Commitment 3.9
>>> Commitment Mean 3.6
When considering the employee questionnaire results (Table 5 below), items related to OCB dimensions had a mean score of 4.0 which is high as actually expected. Thus, the mentioned indicators – especially team spirit and young workforce – seem to have positively influenced OCB. The highest scoring OCB dimension is compliance. This dimension is very much linked to the high team spirit which endorses and largely relies on helping and courtesy. As for compliance, the rating should not be surprising since such behavior is very much expected in highly professional and competent environments.
Table 5: BLOM Bank Mean Scores for OCB Dimensions
Dimension Mean Score
Helping 4.2
OCB Compliance 4.5
>>> OCB Mean 4.0
When examining the questionnaire results and items relating to different types/components of commitment (Table 6 below), their mean score is 3.9 which is high as actually expected by the interviewee. Affective component of commitment has an exceptionally high rating, followed by behavioral commitment. The fairly average normative

144
commitment rating could be justified by the fact that concepts of loyalty and “moral obligation” to stay with one organization are not commonly accepted or believed in and are not said to be promoted within the organization. As for the moderately high continuance commitment score, this component is reasonably influenced by the high pay and benefits; thus employees perceive that other organizations may not match the overall financial and tangible benefits they have here, which explains their display of such level of continuance commitment.
Table 6: BLOM Bank Mean Scores for Commitment Types
Dimension Mean Score
Commitment
Affective Commitment 4.6
Continuance Commitment 3.7 Normative Commitment 3.3
Behavioral Commitment 3.9 >>> Commitment Mean 3.9
When considering the employee questionnaire results (Table 7 below), items related to OCB dimensions had a mean score of 4.0 which is high as actually expected. The cited indicators – especially the culture of fraternity and collectivism, and cooperation and team spirit – look to have positively influenced citizenship. All OCB dimensions could be viewed as having a high rating and their scores revolve around 4. These dimensions are very much linked to the key role of employee champion and to the high team spirit which endorse and largely rely on helping and courtesy while collectivism largely promotes compliance.
Table 7: BLC Bank Mean Scores for OCB Dimensions
Dimension Mean Score
Helping 4.2
OCB Compliance 4.1
>>> OCB Mean 4.15

145
When observing the questionnaire results and items pertaining to different types/components of commitment (Table 8 below), their mean score is 3.6 which are moderately high as actually expected by the interviewee. This mean rating may reflect the actual composition of the company’s workforce, which is accordingly evenly split between the three staff levels with a little more experienced people. Affective commitment‘s high rating could be also associated to the workforce composition in addition to the mentioned transparency and communication of company image, and also the critical employee champion role. The fairly average normative commitment rating could be explained by the fact that the concepts of loyalty and “moral obligation” to stay with one organization are not commonly accepted or believed in. As for the fairly average continuance commitment score, it simply implies that this commitment component is weakly influenced by HRM roles and that people are not staying in their jobs because of financial benefits
Table 8: BLC Mean Scores for Commitment Types
Dimension Mean Score
Affective Commitment 4.2
Continuance Commitment 3.1
Normative Commitment 3.2
Commitment
Behavioral Commitment 3.8
>>> Commitment Mean 3.6
When considering the employee questionnaire results (Table 9 below), items related to OCB dimensions had a mean score of 3.9 which is acceptable as expected by the interviewee. The mentioned indicators – especially satisfaction with training, increase in referrals, and the employee champion role – seem to have positively affected OCB, mainly courtesy, compliance, and helping behavior. These dimensions are very much linked to fairness (and treatment as partner/family member) which promotes courtesy while involvement and recognition largely supports helping and compliance.

146
Table 9: SGBL Bank Mean Scores for OCB Dimensions
Dimension Mean Score
Helping 3.8
OCB Compliance 4.0
>>> OCB Mean 3.9
When observing the questionnaire results and items relating to different types/components of commitment (Table 10 below), the mean score of these items is 3.2 which is an average score as expected by the interviewee. This rating actually reflects the composition of the company’s workforce, which is increasingly being made up of young inexperienced individuals. Affective commitment‘s fair rating could be also linked to the workforce composition in addition to the mentioned flexibility and benefits. The average continuance commitment rating could be explained by stressing that this component is weakly influenced by HRM roles and that people are not staying in their jobs because of financial and tangible benefits. On the other hand, the somewhat low normative commitment rating could be explained by the fact that the concepts of loyalty and “moral obligation” to stay with one organization are not commonly accepted or believed in while adding that the workforce composition and the stated socio-cultural factors also negatively affect to a great extent the loyalty level and hence the normative commitment level.
Table 10: SGBL Bank Scores for Commitment Types
Dimension Mean Score Affective Commitment 3.5
Commitment
Continuance Commitment 3.2
Normative Commitment 2.8
Behavioral Commitment 3.3 >>> Commitment Mean 3.2
When considering the employee questionnaire results (Table 11

147
below), items related to OCB dimensions had a mean score of 4.1 which is indeed a high rating. Thus, the stated roles of HRM (particularly the role of employee champion) and the promoted values and culture could have contributed to nurturing citizenship. They are very much associated to the mentioned eagerness for teamwork, marketing for the firm, and the extra roles. One should not disregard the role played by HRM to daily support and assist employees, and that makes them reciprocate by such positive behavior.
Table 11: IBL Bank Mean Scores for OCB Dimensions
Dimension Mean Score
Helping 4.1
OCB Compliance 4.5
>>> OCB Mean 4.3
When observing the questionnaire results and items pertaining to different types/components of commitment (Table 12 below), the mean score of these items is 3.8 which is rather high as expected by the interviewee. Affective commitment has a particularly high rating, followed by both behavioral and normative commitment. Affective and normative components could be directly linked to all the factors stated by the HR manager, especially flexibility, high productivity, financial benefits, and empowerment. The behavioral component is mostly affected by both high productivity and the display of extra effort. The average continuance commitment rating could be justified as aforementioned: this component is weakly influenced by HRM roles and people are holding on their jobs because of socio-economic needs.
Table 12: IBL Bank Mean Scores for Commitment Types
Dimension Mean Score Affective Commitment 4.4
Commitment Continuance Commitment 3.0
Normative Commitment 3.9 Behavioral Commitment 3.9 >>> Commitment Mean 3.8
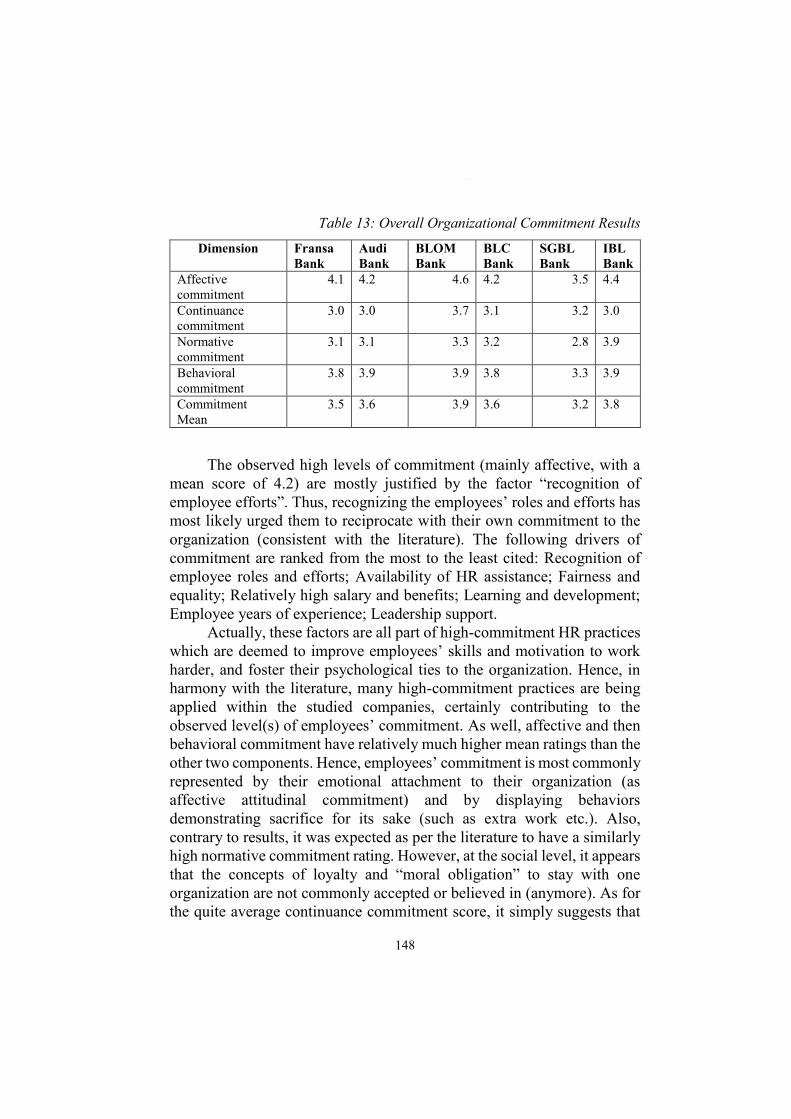
148
Table 13: Overall Organizational Commitment Results
Dimension Fransa Bank
Audi Bank
BLOM Bank
BLC Bank
SGBL Bank
IBL Bank
Affective commitment
4.1 4.2 4.6 4.2 3.5 4.4
Continuance commitment
3.0 3.0 3.7 3.1 3.2 3.0
Normative commitment
3.1 3.1 3.3 3.2 2.8 3.9
Behavioral commitment
3.8 3.9 3.9 3.8 3.3 3.9
Commitment Mean
3.5 3.6 3.9 3.6 3.2 3.8
The observed high levels of commitment (mainly affective, with a mean score of 4.2) are mostly justified by the factor “recognition of employee efforts”. Thus, recognizing the employees’ roles and efforts has most likely urged them to reciprocate with their own commitment to the organization (consistent with the literature). The following drivers of commitment are ranked from the most to the least cited: Recognition of employee roles and efforts; Availability of HR assistance; Fairness and equality; Relatively high salary and benefits; Learning and development; Employee years of experience; Leadership support.
Actually, these factors are all part of high-commitment HR practices which are deemed to improve employees’ skills and motivation to work harder, and foster their psychological ties to the organization. Hence, in harmony with the literature, many high-commitment practices are being applied within the studied companies, certainly contributing to the observed level(s) of employees’ commitment. As well, affective and then behavioral commitment have relatively much higher mean ratings than the other two components. Hence, employees’ commitment is most commonly represented by their emotional attachment to their organization (as affective attitudinal commitment) and by displaying behaviors demonstrating sacrifice for its sake (such as extra work etc.). Also, contrary to results, it was expected as per the literature to have a similarly high normative commitment rating. However, at the social level, it appears that the concepts of loyalty and “moral obligation” to stay with one organization are not commonly accepted or believed in (anymore). As for the quite average continuance commitment score, it simply suggests that

149
this commitment component is weakly influenced by HRM roles (compatible with literature findings) and that people are not just keeping on their jobs because of financial and tangible benefits. On the other hand, discussing the commitment driver stated as “high salary and benefits”, we will observe the commitment levels of Blom Bank compared to those of BLC Bank.
Table 14: Overall OCB Results
Dimension
FRANSA
Bank
Bank
Audi
Blom
Bank
BLC
Bank
SGBL
Bank
IBL
BANK
Overall
Mean
OCB Helping 3.8 4.1 4.2 4.2 3.8 4.1 4.0
Compliance 4.3 4.4 4.5 4.1 4.0 4.5 4.3
The observed high levels of OCB (mainly compliance, with a mean score of 4.3) are mostly explained by the factor “fairness, respect, flexibility”. Thus, treating employees fairly and with respect while providing a flexible work environment have most likely driven them to reciprocate with some discretionary and citizenship behaviors (consistent with the literature). The following drivers of OCB are ranked from the most to the least mentioned: Fairness, respect, flexibility; Support and follow-up by HR people; Treating them as “part of the family”; Explicit recognition of his/her efforts; High level of team spirit; Learning opportunities.
Essentially, these OCB drivers or antecedents are part of effective HR practices that promote an environment of exchange and reciprocity between employee and organization and strengthen the employee-employer contract hence facilitating the display of such discretionary behaviors.
The highest scoring OCB dimensions are compliance, followed by helping. As per the literature, and concerning compliance, its high rating is very much expected in such highly professional, competent and motivating environments. Also, perception of fairness, support and assistance do affect the level of helping behavior.
On the other hand, with regards to the commitment-OCB relationship, and as shown in Figure 1, when using OCB as the dependent variable and organizational commitment as the independent variable,

150
result of simple linear regression reveals a strong positive correlation with a coefficient of determination R² around 0.7 (with the linear equation shown). Hence, 70% of the relation is explained by commitment-related factors while 30% remain unexplained. This portion may be attributed to other factors than commitment, most probably those mentioned by the companies’ HR managers, for instance fair treatment, support, and recognition. A coefficient of determination R² around 0.7 means a correlation coefficient of 0.83. Thus, the high observed correlation is consistent with findings from the literature, where employees with strong emotional attachment to the organization are very much expected to engage in discretionary effort, psychological contract, and citizenship behaviors.
Figure 1: Commitment-OCB Correlation as per Questionnaire Results
5.0
4.5 y = 0.5736x + 1.8905
4.0
R2 = 0.6947
Data Points
3.5
Linear Regression
Fit
3.0
3.0 3.5 4.0 4.5 5.0
Table 15: Case Processing Summary
N %
Cases Valid 59 98.3
Excludeda 1 1.7
Total 60 100.0 a. Listwise deletion based on all variables in the procedure.

151
Table 16: Reliability Statistics
Cronbach's Alpha N of Items
0.745 18
In this study, Cronbach’s α is used to examine the internal consistency of each variable. If the Cronbach’s α is below 0.70, then the item is undesirable and the internal reliability does not meet the requirement. However, results with Cronbach’s α above 0.70 are accepted and imply high level of internal consistency. The Cronbach’s alpha test was implemented to represent the internal consistency of the scale and the sample that had been taken. The Cronbach alpha ranges from 0 to 1. The more the result is close to 1, and then it will show higher level of internal consistency. And the more the results move toward the 0 level, then a lower level of internal consistency will be seen. In the following table, the Cronbach alpha resulted with a 0.745 value near 1. We can observe that the given Cronbach’s values are above 0.70 which imply that the questionnaire being used is considered to be highly adequate due to the high level of internal consistency between both questions and scales.
Table 17: Emotionally attached v/s Loyalty: Correlations
I feel emotionally attached to this
company.
I believe that a person must always be loyal to his or her
organization. I feel emotionally attached to this company.
Pearson Correlation
1 .719**
Sig. (2-tailed) .000 N 60 60
I believe that a person must always be loyal to his or her organization.
Pearson Correlation
.719** 1
Sig. (2-tailed) .000 N 60 60
**. Correlation is significant at the 0.01 level (2-tailed).

152
Feeling Emotionally attached is correlated with Loyalty variable if the sig value is less than 0.05 it will show a start on the table of correlation the value of correlation is weak is its less than 0.5 and strong correlation if it’s more than 0.5.
Table 18: Moral obligation v/s Sacrifice for work: Correlations
One of the major reasons I continue to
work for this organization is that I believe that loyalty is
important and therefore feel a sense of moral obligation to
remain.
My job is so important to me that I sacrifice
much for it. One of the major reasons I continue to work for this organization is that I believe that loyalty is important and therefore feel a sense of moral obligation to remain.
Pearson Correlation
1 .564**
Sig. (2-tailed) .000 N 60 60
My job is so important to me that I sacrifice much for it.
Pearson Correlation
.564** 1
Sig. (2-tailed) .000 N 60 60
**. Correlation is significant at the 0.01 level (2-tailed).

153
Table 19: Work more than expected v/s help of employees: Correlations
I work more than typically expected
from somebody in my position.
I give my time to help employees
with work-related problems.
I work more than typically expected from somebody in my position.
Pearson Correlation
1 .290*
Sig. (2-tailed) .024 N 60 60
I give my time to help employees with work-related problems.
Pearson Correlation
.290* 1
Sig. (2-tailed) .024 N 60 60
*. Correlation is significant at the 0.05 level (2-tailed).
Working more than expected is correlated with time to help employees variable if the sig value is less than 0.05 it will show a start on the table of correlation the value of correlation is weak is its less than 0.5 and strong correlation if it’s more than 0.5.
Table 20: Emotionally attached v/s staying with organization: Correlations
I feel emotionally attached to this
company.
Right now, staying with my organization is a matter of necessity as
much as desire. I feel emotionally attached to this company.
Pearson Correlation
1 .750**
Sig. (2-tailed) .000 N 60 60
Right now, staying with my organization is a matter of necessity as much as desire.
Pearson Correlation
.750** 1
Sig. (2-tailed) .000 N 60 60
**. Correlation is significant at the 0.01 level (2-tailed).
Feeling Emotionally attached is correlated with staying with the organization variable if the sig value is less than 0.05 it will show a start on the table of correlation the value of correlation is weak is its less than 0.5 and strong correlation if it’s more than 0.5.

154
Table 21: Emotionally attached v/s proud to tell others: Correlations
I feel emotionally attached to this
company.
I am proud to tell others that I am part
of this company. I feel emotionally attached to this company.
Pearson Correlation 1 .568** Sig. (2-tailed) .000
N 60 60 I am proud to tell others that I am part of this company.
Pearson Correlation .568** 1 Sig. (2-tailed) .000
N 60 60
**. Correlation is significant at the 0.01 level (2-tailed).
Feeling Emotionally attached is correlated with proud to be part of the bank variable if the sig value is less than 0.05 it will show a start on the table of correlation the value of correlation is weak is its less than 0.5 and strong correlation if it’s more than 0.5.
CONCLUSIONS AND RECOMMENDATION
In general, it is evident that the role played by HRM and effective HR practices in promoting a committed environment and a culture of citizenship is vital. While the direct positive relationship between HR and organizational commitment has been proven in almost every studied company, on the combined aggregate of the Lebanese banking sector it could be said that the correlation is not completely verified. However, the HR-OCB relationship is much more coherent and noticeable especially when the HR role of employee champion emerges. Moreover, the commitment-OCB link is deemed to be strong. Finally, it appears that Lebanese banks are very promising examples of serious dynamic HRM initiatives that promote employees’ support and recognize their efforts while trying to capitalize on their competences, commitment, and displayed citizenship behaviors.
As for my recommendations to the banks included in this study, I would first suggest enlarging/restructuring the HR department more horizontally (across functions) than vertically (across hierarchy) to meet organizational strategic objectives. Banks’ HRM should also link their key HR practices with company targets and KPI’s. As well, for the banks with more operationally reactive roles and low strategic involvement, they should gradually get implicated in strategy formulation, increase focus on vertical alignment, and involve line managers in HR strategy.

155
Also, based on findings (especially regarding low levels of behavioral and affective commitment as well as low levels of compliance and helping), banks’ HRM should increase their staff’s participation and empowerment, promote a flexible and rewarding work environment, increase HR involvement and interest in employees’ daily concerns, and foster knowledge sharing and learning culture. Finally, banks may conduct frequent employee satisfaction surveys in line with performance appraisals to monitor satisfaction with HR practices, job satisfaction, commitment, and turnover levels.
REFERENCES
Ackfeldt, Anna-Lena and Coote, Leonard V. “A Study of Organizational Citizenship Behaviors in a Retail Setting”. Journal of Business Research 58 (2005): 151-159.
Allen, Natalie J. and Meyer, John P. “The Measurement and Antecedents of Affective, Continuance, and Normative Commitment to the Organization”. Journal of Occupational Psychology 63, 1 (1990): 1-18.
Anthony, William P., Kacmar, Michele K., and Perrewe, Pamela L. Human Resource Management: A Strategic Approach. 4th edition. South Western, Thomas Learning, 2002.
Armstrong, M. and Long, P. The Reality of Strategic HRM. Institute of Personnel and Development, 1994.
Armstrong, Michael and Baron, Angela. Strategic HRM: The Key to Improved Business Performance. CIPD Publishing, 2002.
Armstrong, Michael. Handbook of Human Resource Management Practice. 10th
Edition. Kogan Page, 2006. Becker, Brian E. and Huselid, Mark A. “High Performance Work Systems and
Firm Performance: A Synthesis of Research and Managerial Implications”. Research in Personnel and Human Resources Management 16 (1998): 53-101.
Becker, Brian E. and Huselid, Mark A. “Strategic Human Resources Management: Where Do We Go From Here?” Journal of Management 32, 6 (2006): 898-925.
Becker, Brian E., Huselid, Mark A., Pickus, Peter, and Spratt, Michael. “HR as a Source of Shareholder Value: Research and Recommendations”. Human Resource Management 36, 1 (1997): 39-47.
Benkhoff, Birgit. “Ignoring Commitment Is Costly: New Approaches Establish the Missing Link Between Commitment and Performance”. Human Relations 50, 6 (1997): 701-726.
Bergeron, Diane M. “The Potential Paradox of Organizational Citizenship Behavior: Good Citizens at What Cost?” Academy of Management Review 32, 4 (2007): 1078-1095.

156
Buck, Jeffrey M. and Watson, John L. “Retaining Staff Employees: The Relationship Between Human Resources Management Strategies and Organizational Commitment”. Innovative Higher Education 26, 3 (2002): 175-193.
Buyens, D. and De Vos, A. “Perceptions of the Value of the HR Function.” Human Resource Management Journal 11, 3 (2001): 70-89.
Collins, Christopher J. and Clark, Kevin D. (2000) . “Strategic Human Resource Practices, Top Management Team Social Networks, and Firm Performance: The Role of Human Resource Practices in Creating Organizational Competitive Advantage”. Academy of Management Journal 46, 6 (2003): 740–751.
Cook, J. and Wall, T. “New Work Attitude Measures of Trust, Organizational Commitment and Personal Need Non-Fulfilment”. Journal of Occupational Psychology 53 (1980): 39-52.
Currivan, Douglas B. “The Causal Order of Job Satisfaction and Organizational Commitment in Models of Employee Turnover”. Human Resource Management Review 9, 4 (1999): 495-524.
Decenzo, D. and Robbins, S. Human Resource Management, 7th Edition. John Wiley & Sons, Inc., 2002.
Feather, N. T. and Rauter, Katrin A. “Organizational Citizenship Behaviours In Relation to Job Status, Job Insecurity, Organizational Commitment and Identification, Job Satisfaction and Work Values”. Journal of Occupational and Organizational Psychology 77 (2004): 81-94.
Fiorito, Jack, Bozeman, Dennis P., Young, Angela, and Meurs, James A. “Organizational Commitment, Human Resource Practices, and Organizational Characteristics”. Journal of Managerial Issues 19, 2 (2007): 186-207.
Gaertner, Stefan. “Structural Determinants of Job Satisfaction and Organizational Commitment in Turnover Models”. Human Resource Management Review 9, 4 (1999): 479-493.
Gilbreath, B. and Montesino, M. U. “Expanding the HRD Role: Improving Employee Well-Being and Organizational Performance”. Human Resource Development International 9, 4 (2006): 563-571.
Gould-Williams, Julian. “The Effects of ‘High Commitment’ HRM Practices on Employee Attitude: The Views of Public Sector Workers”. Public Administration 82, 1 (2004): 63-81.
Guest, D., Michie, J., Conway, N., and Sheehan, M. “Human Resource Management and Corporate Performance in the UK”. British Journal of Industrial Relations, 41, 2 (2003): 291-314.
Huselid, M. A. “The Impact of Human Resource Management Practices on Turnover, Productivity, and Corporate Financial Performance”. Academy of

157
Management Journal 38, 3 (1995): 635-672. IRS. “Survey of HR Roles and Responsibilities”. Employment Review 795
(2004): 9-15. Iverson, Roderick D. and Zatzick, Christopher D. “High-Commitment Work
Practices and Downsizing Harshness in Australian Workplaces”. Industrial Relations 46, 3 (2007): 456-480.
Khilji, Shaista. E. and Wang, Xiaoyun. “New Evidence in an Old Debate: Investigating the Relationship between HR Satisfaction and Turnover”. International Business Review 16, 3 (2007): 377-395.
Knight-Turvey, N. and Neal, A. “’High Commitment’ Human Resource Practices, Affective Organisational Commitment, and Employee Level Outcomes: The Role of Perceived Organisational Support”. Australian Journal of Psychology 55 (2003): 134-134.
Kuvaas, Bård. “An Exploration of How the Employee-Organization Relationship Affects the Linkage Between Perception of Developmental Human Resource Practices and Employee Outcomes”. Journal of Management Studies 45, 1 (2008): 1-25.
Mellor, Steven, Mathieu, John E, Barnes-Farrell, Janet L., and Rogelberg, Steven G. “Employees’ Nonwork Obligations and Organizational Commitments: A New Way to Look at the Relationships”. Human Resource Management 40, 2 (2001): 171-184
Meyer, John P. and Allen, N. J. “A Three-component Conceptualization of Organizational Commitment”. Human Resource Management Review 1, 1 (1991): 61-89.
Meyer, John P. and Allen, N. J. Commitment in the Workplace: Theory, Research, and Application. Sage Publications, 1997.
Meyer, John P., Stanley, David J., Herscovitch, Lynne, and Topolnytsky, Laryssa. “Affective, Continuance, and Normative Commitment to the Organization: A Meta-analysis of Antecedents, Correlates, and Consequences”. Journal of Vocational Behavior 61 (2002): 20-52.
Mintzberg, H. “Patterns in Strategy Formation”. Management Sciences 24 (1978): 934-948.
Mondy, Wayne R. and Noe, Robert M. Human Resource Management. 9th Edition. International Edition. Prentice Hall, 2005.
Moorman, Robert H. “Relationship Between Organizational Justice and Organizational Citizenship Behaviors: Do Fairness Perceptions Influence Employee Citizenship?” Journal of Applied Psychology 76, 6 (1991): 845-855.
Morrison, Elizabeth Wolfe. “Role Definitions and Organizational Citizenship Behavior: The Importance of the Employee’s Perspective”. Academy of Management Journal 37, 6 (1994): 1543-1567.

158
Mowday, R. T., Steers, R. M., and Porter, L. W. “The Measurement of Organizational Commitment”. Journal of Vocational Behavior 14 (1979): 224-247.
Moynihan, Donald P. and Pandey, Sanjay K. “The Ties that Bind: Social Networks, Person-Organization Value Fit, and Turnover Intention”. Journal of Public Administration Research and Theory 18, 2 (2008): 205-227.
Organ D. W. Organizational Citizenship Behavior: The Good Soldier Syndrome. Lexington Books, 1988.
Organ, D. W. and Konovsky, M. “Cognitive Versus Affective Determinants of Organizational Citizenship Behavior”. Journal of Applied Psychology 74, 1 (1989): 157-164.
Organ, D. W. and Ryan, K. “A Meta-analytic Review of Attitudinal and Dispositional Predictors of Organizational Citizenship Behavior”. Personnel Psychology 48, 4 (1995): 775-802.
Paul, A. K. and Anantharaman, R. N. “Impact of People Management Practices on Organizational Performance: Analysis of a Causal Model”. The International Journal of Human Resource Management 14, 7 (2003): 1246-1266.
Paul, A. K. and Anantharaman, R. N. “Influence of HRM Practices on Organizational Commitment: A Study Among Software Professionals in India”. Human Resource Development Quarterly 15, 1 (2004): 77-88.
Piercy, Nigel F., Cravens, David W., Lane, Nikala, and Vorhies, Douglas W. “Driving Organizational Citizenship Behaviors and Salesperson In-Role Behavior Performance: The Role of Management Control and Perceived Organizational Support”. Journal of the Academy of Marketing Science 34, 2 (2006): 244-262.
Podsakoff, P. M. and MacKenzie, S. B. “Organizational Citizenship Behaviors and Sales Unit Effectiveness”. Journal of Marketing Research 31, 3 (1994): 351-363.
Podsakoff, P. M., Ahearne, M., and MacKenzie, S. B. “Organizational Citizenship Behavior and the Quality of Work Group Performance”. Journal of Applied Psychology 82 (1997): 262-270.
Podsakoff, P. M., MacKenzie, S. B., Paine, J. B., and Bachrach, D. G. “Organizational Citizenship Behaviors: A Critical Review of the Theoretical and Empirical Literature and Suggestions for Future Research”. Journal of Management 26, 3 (2000): 513-563.
Porter, L. W., Steers, R. M., Mowday, R. T., and Boulian, P. V. “Organizational Commitment, Job Satisfaction, and Turnover Among Psychiatric Technicians”. Journal of Applied Psychology 59, 5 (1974): 603-609.
Rifai, Harif Amali. “A Test of the Relationships Among Perceptions of Justice, Job Satisfaction, Affective Commitment and Organizational Citizenship

159
Behavior”. Gadjah Mada International Journal of Business 7, 2 (2005): 131-154.
Ritzer, G. and Trice, H. M. “An Empirical Study of Howard Becker’s Side-bet Theory”. Social Forces 47 (1969): 475-479.
Robinson, Sandra L. and Morrison, Elizabeth Wolfe. “Psychological Contracts and OCB: The Effect of Unfulfilled Obligations on Civic Virtue Behavior”. Journal of Organizational Behavior 16, 3 (1995): 289-298.
Rogg, K. L., Schmidt, D. B., Shull, C., and Schmitt, N. “Human Resource Practices, Organizational Climate, and Customer Satisfaction”. Journal of Management 27 (2001): 431-449.
Salancik, G. R. “Commitment and the Control of Organizational Behavior and Belief”. In Staw, B. M. and Salancik, G. R. (Eds), New Directions in Organizational Behavior. St. Clair Press, 1977.
Schwepker Jr., Charles H. “Ethical Climate’s Relationship to Job Satisfaction, Organizational Commitment, and Turnover Intention in the Salesforce”. Journal of Business Research 54 (2001): 39– 52.
Selouan, Claudine. Head of Recruitment and Selection Department, Human Resources, Bank Audi s.a.l. Interviewed by author, 14 May 2008, Beirut, Lebanon.
Sheehan, Cathy. “A Model for HRM Strategic Integration.” Personnel Review 34, 2 (2005): 192-209.
Smith, C. A., Organ, D. W., and Near, J. P. “Organizational Citizenship Behavior: Its Nature and Antecedents”. Journal of Applied Psychology 68, 4 (1983): 653-663.
Sun, Li-Yun, Aryee, Samuel, and Law, Kenneth S. “High-Performance Human Resource Practices, Citizenship Behavior, and Organizational Performance: A Relational Perspective”. Academy of Management Journal 50, 3 (2007): 558-577.
Swailes, Stephen. “Organizational Commitment: A Critique of the Construct and Measures”. International Journal of Management Reviews 4, 2 (2002): 155-178.
Ulrich, D. Human Resource Champions: The Next Agenda for Adding Value and Delivering Results. Harvard Business School Press, Boston, Massachusetts, 1997.
Van Dyne, Linn, Graham, Jill W., and Dienesch, Richard M. “Organizational Citizenship Behavior: Construct Redefinition, Measurement, and Validation”. Academy of Management Journal 37, 4 (1994): 765-802.
Van Veldhoven, M. “Financial Performance and the Long-Term Link with HR Practices, Work Climate and Job Stress”. Human Resource Management Journal 15, 4 (2005): 30-53.
Whitener, Ellen M. “Do “high commitment” human resource practices affect

160
employee commitment? A cross-level analysis using hierarchical linear modeling”, Journal of Management 27 (2001): 515–535.
Wiener, Y. and Vardi, Y. “Relationships Between Job, Organization, and Career Commitments and Work Outcomes: An Integrative Approach”. Organizational Behavior and Human Performance 26, 1 (1980): 81-96.
Williams, L. J. and Anderson, S. E. “Job Satisfaction and Organizational Commitment as Predictors of Organizational Citizenship and In-Role Behaviors”. Journal of Management 17 (1991): 601-617.
Wittig-Berman, U. and Lang, D. “Organizational Commitment and Its Outcomes: Differing Effects of Value Commitment and Continuance Commitment on Stress Reactions, Alienation and Organization-Serving Behaviors”. Work and Stress 4 (1990): 167-177.
Wright, P. M., Gardner, T. M., and Moynihan, L. M. “The Impact of HR Practices on the Performance of Business Units”. Human Resource Management Journal 13, 3 (2003): 21-36.
Xiao, Zhixing and Björkman, Ingmar. “High Commitment Work Systems in Chinese Organizations: A Preliminary Measure”. Management and Organization Review 2, 3 (2006): 403-422.

161
Entrepreneurship ISSN: 2738-7402
DOI: 10.37708/ep.swu.v8i2.13 Volume: VІII, Issue: 2, Year: 2020, pp. 161-172
QUALITY PASSENGER SERVICE IN AIR TRANSPORT AS A FOUNDATION FOR BUILDING LOYALTY TO AIR
COMPANIES
Svetla Tzvetkova1 Received: 30.09.2020, Accepted: 20.10.2020
Abstract All air companies in the world strive to build good image, preferences and
loyalty in customers by offering then services that come as close as possible to their requirements. Most air carriers incorporate entire systems to secure the necessary quality; however, the solution to this problem is quite complicated and depends on multiple factors, especially the human one, which is why two perfectly identical services never exist in transport. For this purpose, air carriers need to build an overall strategy to improve services and outline the fundamental reference points of a plan for undertaking specific measures. The main reference point of said plan is a professional management team, as well as the motivation and timely training of highly qualified, responsible and courteous personnel that has an individual approach to all passengers and satisfies their consumer ideas for quality transportation to the fullest.
Keywords: passenger air transport, strategy for quality passenger service
JEL Codes: R40, R41, R49
1. Introduction
Quality passenger service is a defining factor for increasing the competitive power of air companies in the vicious competitive conditions on the transport market. The quality of the transport service is a combination of properties which determine its fitness to respond to specific customer needs, in accordance with said customer’s requirements (or the requirements set by standards and other regulatory documents). Commonly accepted standards for high-quality passenger service in air transport practically do not exist.
All services, including transport ones, are commonly characterized by variability in quality. Unlike material goods, there are no two perfectly identical
1 Svetla Tzvetkova, University of National and World Economy, Economics of Transport Department, Assoc. Prof., PhD, e-mail: [email protected] ORCID ID: https://orcid.org/0000-0002-6499-5612
162
transport services due to their heterogeneity and the fact that production in the field of transport is influenced by multiple and various factors. What should be taken into account in the development of the air transport product is that primary and accompanying services are never identical in quality. Therefore, certain differences always exist between seemingly identical services provided by the same transport firm – a fact which necessitates the individualization of the transport service, i.e. the need for an individual approach and quality attendance on behalf of employees toward each individual plane passenger. It is the only way for an air company to satisfy the individual needs of all consumers and strengthen their trust and loyalty.
Air carrier strategies for improving the service quality usually include the development of special programs designed to keep current customers. They identify the requirements and expectations of customers in the target segment and develop specific programs to satisfy their consumer criteria, additionally, analyzing identical services offered by their competitors and taking specific steps to continually improve staff qualification and training in the process.
The main purpose of quality passenger service in air transport involves maintaining and developing a stable customer base. It is defined by consumers’ evaluation on the basis of qualitative indicators such as: professionalism, efficiency, approachability, courteousness, friendliness, honesty, empathy and readiness to assist in any situation on the part of employees. Quality service is aimed at mobilizing all resources and employees in the company toward fully satisfying customers’ transportation needs. This effect is based on customers’ positive attitude toward the company as gratitude for the professional service, loyalty. They are motivated to recommend the respective company’s services to other people as well.
Quality service in air transport is determined entirely by customers’ evaluation of transport services and it has a multiplicator effect, achieving effective marketing activity and increasing sales.
2. Requirements for the Implementation of Services in Air Transport
Services aimed at customers in air transport are required to: guarantee the safety of the passengers and their personal belongings; fulfill the requirements of aviation and fire safety, as well as sanitary and hygienic rules and norms; work in accordance with the requirements of the laws and regulatory documents regarding the range and conditions of service indicated in the agreements for ground service; guarantee passengers’ comfort during travel.

163
The services are provided by qualified personnel that need to be certified in accordance with established procedures.
The personnel providing passenger services are required to: • guarantee passengers that they will receive friendly, courteous and
timely attitude, as well as qualified help; • observe the ethical standards for behavior and communication; • strictly maintain the prescribed uniform and clean appearance; • maintain high culture of speech, in accordance with their professional
activities – questions and answers are short, the voice is level, elevated dialogue with unauthorized individuals is prohibited, no conversations are had in the office, and passengers receive an answer in the language they prefer.
All types of activities stipulated in the legislation are subject to licensing. In-flight services for passengers provided by corporate bodies and
organizations need to be certified, regardless of their organizational and legal form and form of ownership. The personnel in charge of organizing, carrying out, insuring and attending to passengers are required to have special training and certificate.
The timely realization of regular flights guarantees their safety, as well as commercial profitability for the air company; therefore, the managers and experts in charge of guaranteeing aircraft traffic regularity and flight safety need to be certified.
The services provided to passengers, as well as the terms of their implementation, are indicated on boards, monitors, posters and signs in brochures, announced through the broadcasted network, information desks at airports, ticket offices. Voice information needs to be clearly audible and understandable in all parts of airport terminals and adjacent territories. It needs to convey the message’s meaning accurately, be timely and synchronized with passengers’ registration process and preparation for each flight.
1.1 Requirements for Aviation Services at Airports
The procedure for providing services at the airport on a technological basis stipulates that they will be directly provided at places of work.
1. Support services by specially trained personnel for securing equipment and facilities:
• unaccompanied children and mothers with children; • people with disabilities, ill and frail passengers; • senior officials (VIPs); • passengers from high service classes;

164
• other, specially selected individuals. 2. Services (for additional charge) for transporting baggage from the
airport’s arrival zone for public and personal vehicles to the registration zone at the terminal or from the airport’s baggage claim zone to the departure zone for public and personal vehicles;
3. If flights are delayed for 6 hours or longer, overnight, or for 8 hours or longer following the time indicated in the schedule, the passengers registered for the flight or on the basis of “OK” in their tickets will be accommodated in a hotel with food at the air company’s expense. Regardless of their status and service class, the passengers registered for the flight or on the basis of “OK” in their flight tickets are supplied with food in case the flight is delayed for over 3 hours under the following conditions:
• flight delay time, and if a flight gets aborted, time needs to be determined for landing at an intermediate airport;
• local time is used to determine the type of food (breakfast, lunch or dinner).
4. The provision of soft drinks cannot be considered provision of food. Drinks are served to passengers who have been delayed for over 90 minutes.
In the event of a delay, the expenses for baggage storage at the terminal’s baggage section or baggage room, which is located in the airport’s customs zone, are covered by the air company.
5. Providing information about the option for hotel accommodations for passengers who have tickets with an “OK” sign for a period of no more than 24 hours before departure, with payment by the passengers.
6. Assisting passengers when receiving emergency and first aid at the airport’s first aid stations.
7. Organizing passenger traffic through the airport: • the length of the passenger road along the open platform in every
direction should not exceed 50 m (from the waiting zone for departure at the airport’s terminal to the bus, from the bus to the plane, etc.).
1.2 Air Companies’ Requirements Regarding Services Aboard the
Aircraft Services aboard the aircraft are a combination of household goods,
comforts and micro-climate, whose aim is to create specific physical and hygienic conditions for passengers and their maintenance by the flight attendants.
Operators need to guarantee that passengers aboard the aircraft are provided with a list of mandatory goods which is up to the established “Services

165
for Passengers Aboard the Aircraft” standard and they are within their right to expand the range of the services on the basis of studying passengers’ needs and requests, as well as IATA recommendations.
The terms and level of passenger service aboard the aircraft are provided by air companies:
• compartment equipment and interior; • technical devices and systems which guarantee passenger safety and
create comfort inside the cabin; • the sanitary and hygienic condition of the passenger cabin, the servicing
and maintenance of the buffet-kitchen equipment, passenger service items and elements;
• securing seats that allow the use of cradles for passengers with children; • option for comfortable accommodation of ill passengers/people with
disabilities; • items for personal use (individual lighting, ventilation, small tray table,
a safety belt system, oxygen masks, emergency life vests); • a guaranteed selection of services suited to the duration of the flight; • competent and tactful actions by the flight and cabin crew.
3. Problems Related to Passenger Service in Air Transport
As a qualitative characteristic of the air company product, customer service has several stages:
• ticket sale service; • service at the airport; • service aboard the aircraft. It is difficult to secure the level of service that the air company desires
when it comes to ticket sales due to the large variety and multitude of sales channels. In most cases about two thirds of the tickets are sold as a result of the activity of air company agents. The majority of the sales volume is realized by other air companies, whereas the rest is realized in the air company’s personal offices (the so-called personal sales).
Due to the nature of the established ticket sale system, air companies face multiple problems, the biggest of which include:
� Inconsistent passenger flow which is influenced by seasonal and daily fluctuations; � The large flow of vacationers aims to purchase tickets at the lowest possible prices;

166
� The necessity to refund customers for tickets they have already purchased in case a flight has been cancelled due to reasons outside the company’s control; � Competitive air companies which offer a multitude of special and promotional prices. In order to solve all these issues, companies incorporate modern automated
seat reservation systems which provide information for all prices and any changes to them.
The automated ticket reservation systems are used precisely because they allow passengers to reserve seats aboard an aircraft at any moment and pay for the tickets on the respective day along the selected direction.
Regular flights are among the services for which the utilization of a reservation system is imperative. Passengers need to be sure about the purchased tickets for each flight since every air company always has replacement aircraft with a crew ready to carry out a flight if the demand is high.
The main disadvantages of this type of flights include: • possible inconsistencies in schedules; • extended passenger stay in preparation for a flight; • a small number of flight hours per airplane; • the necessity to create additional crew lists for short-distance flights. As far as the issue of unused reserved tickets is concerned, the reasons
could be random, i.e. illness, late arrival at the airport or the occurrence of an incident or emergency situation, as well as non-random – for instance, a businessman who is unaware of the exact time when a certain meeting will conclude and has simultaneously reserved several flights in advance. In order to fill all available seats, air companies need to make super-reservations, i.e. reserve more seats than the number of available ones in the aircraft. For this purpose, air carriers usually collect statistical information and analyze calculations about the average quantity of refusals for specific periods from the year.
After all, the possibility that all passengers who have reserved seats aboard the respective flight will appear should be taken into account. Air companies determine this in the final minutes prior to the flight and are forced to deny business passengers a flight at the expense of late arrivals for flight registration. The failure of a planned business undertaking causes businessmen to protest and in turn leads to their refusal to use the respective air company’s services in the future.

167
Because of this, air companies select several passengers traveling for vacation as part of an individual program, warn them about the possible cancellation of their flight and offer them a choice between:
• choosing a flight on another day in a lounge with higher level of service; • refunding the paid ticket sum, as well as certain financial compensation for any experienced inconveniences. A large portion of travelers prefer to receive money and move their flight
to another day in the same class. Businessmen who arrive at the airport immediately before the flight
demand that airport service be at the necessary level: • to use a separate flight registration desk and carry their luggage into the airport lounge; • to await their flight in a separate room with office equipment; • to board the plane through a separate corridor for business passengers; • to have available parking space at the airport from which they depart, as well as the respective service and secured transportation from the airport when they arrive. Servicing businessmen at the desired level results in additional expenses
for airports, which in turn increases the price of its functioning and ticket prices respectively.
Ticket demand by businessmen is at its highest for morning and evening hours on work days, whereas demand by vacationers is at its highest during weekends. This irregularity in demand forces air carriers to use additional aircraft during peak periods when airports work with higher capacity and require larger personnel and production resources. During periods when there are drops in demand, both air companies and airports have unused production capacity and free personnel, which leads to increased prices.
Aboard the aircraft passengers are served food and drinks and entertainment programs are made available to them. All the same, though, the main expenses of air companies in regard to security and service aboard the aircraft are the payment of the crew and the costs for their hotel accommodations.
Problems involving the management of customer service quality are frequent as well. Managers from the middle sections of the company could be put in charge of improving the service and expanding the powers of line contractors, as well as assign more power to their subordinates in order to satisfy customers’ needs. The encouragement of managers needs to be bound to the results from the customer service, on the basis of constant and objective evaluation. Managers’ power is expanded when they are also put in charge of mobilizing human

168
resources in order to achieve results. The main goal of managers is aimed at creating new conditions for people who work directly with customers to make decisions. It is precisely middle-section managers who carry the full responsibility for achieving the set goals regarding service.
4. Inferences and Recommendations
Air companies need to pay special attention to airport service, even though they are unable to have complete influence over that. Therefore, even if there are insignificant oversights in airport service (i.e. untimely ramp service, baggage delay), passengers often associate them with the air company’s work.
On-board attendance is the main part of the service that air companies provide passengers with. Once they have purchased their tickets, passengers need to know what they will receive for it: whether they will have food on board or not, what assortment of dishes there will be, what additional services they will be offered, etc. When they spend several hours in the limited space aboard the plane, sitting in narrow and uncomfortable sets, passengers only think about how to pass the time. Therefore, the organization of free time aboard the plane should not be limited (as is often the case) to press distribution, which is still not always sufficient. At the very least, long-distance air companies should provide additional type of on-board entertainment (audio, video) despite all the difficulties involving the conversion of Russian airlines.
Some airlines view on-board food is an important factor whereas others do not see it as that essential. In spite of this, passengers consider it one of the fundamental indicators that help them assess an air company and its services. There is practically no information about feeding aboard a plane. Pictures and descriptions of offered dishes published on certain airlines’ websites pertain mainly to international flights. Saving food (i.e. cake or an extra cup of juice) could have a negative effect on the airline’s overall image. It is necessary to save the airline some resources, but in other positions for the expenses of the entire stage of the travel organization.
In order to understand passengers’ ideas regarding service quality, air carriers need to know and foresee their preferences and expectations and receive feedback from them. This can be achieved not only through studies, but also with the help of other channels, i.e. telephone lines, quality control data and other services which have direct contact with consumers. Even if they use an air company’s services once per year, all passengers need to be familiar with these channels. In order to maintain the necessary level of quality or improve it, air companies need to carry out regular market studies and research passengers’

169
needs. The achievement of high-level passenger service increases an air company’s competitive power and helps it stand out from other carriers on the transport market.
At present, the following view on the issue of quality improvement has been universally acknowledged in all developed countries: no episodic, separate, even brilliantly organized and major event can guarantee significant improvement of the product’s quality; the solution to this problem requires a system of purposeful and systematic measures or a quality management system. If the quality system is a combination of organizational structure, responsibility, procedures, processes and resources that guarantee the realization of general management of the quality of an airline’s production activities, it can be examined as a combination of interlinked systemic organizational, technical, economic, legal, social and information measures, methods and resources regulated by the regulatory documents aimed at the systemic, systematic improvement of the aviation enterprise, as well as the increased effectiveness and quality of the air company’s production activities.
It is recommended that air companies develop a service plan on the basis of a customer service strategy which is built on a clear vision for the corporate goals in the field of customer service, as well as a sensible and logical plan for achieving said goals. The strategy should include: characteristics of the customer base; customer evaluation on the various aspects of service; assessment of costs for increasing the level of customer satisfaction; prognosis for profit growth. The plan should be part of a completely new and different marketing plan.
The principles for its development are as follows: • to promise less and to do more; • to correctly determine customers’ expectations; • to study customers’ needs and questions carefully; • to make it clear that only the customers know what they want; • to divide the market into segments and develop the fundamental products and services which will satisfy customers’ individual needs due to the fact that customers can purchase the same product or service, but their needs during attendance can be different. The recommended methods for studying service quality include: • informal questions for the personnel; • formal questions for focus groups; • questions for associates and external consultants; • free telephone lines; • polls by post (phone), cards regarding customer feedback;

170
• control programs for deals that have not been concluded yet; • analysis of the responses and sales volume of key customers; • accounts of inspected complaints; • video recordings of interviews conducted with focus groups. The regular collection of information from customers (inquiries and
polling of customers) about their evaluation of the service quality and the degree of their satisfaction from the undertaken actions allows the determination of personnel work, as well as the ease of access to companies and their services. Additionally, the necessary time for solving typical problems can be determined, as well as the degree to which customers can attract personnel attention if necessary and cause a reaction in them, and how accurate, complete and effective that reaction would be.
The organizational activity which involves providing customers with quality service in air transport should be comprised of:
• developing a strategy and a plan for service; • direct leadership participation (first meeting under the supervision of the general manager, following seminars for managers, objectives and plans of subdivisions, control over plan implementation and personnel training); • highly qualified and motivated attending personnel; • high quality of the services offered by employees; • available maintenance infrastructure in the air company; • incorporating a monitoring procedure and systemic evaluation of the quality of the air company’s customer service. It should be noted that air companies’ associates and partner companies –
providers of services, should display resourcefulness and enthusiasm, otherwise the point and strategy of the service plan are lost. Associates should be assigned certain powers and be allowed to do everything necessary in regards to customer service – to the customer’s benefit, not the company’s. Training is a mandatory condition for the assignment of powers, which itself is a crucial condition for creating high culture of passenger service in air transport.
Marketing specialists in transport services often face the dilemma of how to provide standardized transport services at a good quality level, acceptable prices and simultaneously be competitive enough to approach each individual customer as a unique individuality. In order to secure control over quality, it is recommended that air carriers adopt a number of measures; first and foremost, of course, the rolling stock should be kept in good technical condition and enough resources should be set aside for the proper training of the personnel and the
171
recruitment of qualified workers. Attending personnel should be cultured, well-mannered and good-looking. The creation of a “complaints and suggestions” system also leads to good results, since it allows air companies to keep track of cases of customer dissatisfaction and to take timely measures for the elimination of flaws in the implementation process of the transport service itself.
5. Conclusion
In recent years the competition on the air transport market has grown vicious and consumers’ marketing criteria are ever-changing due to the influence of various environmental factors. In order to successfully maintain their positions on the transport market and stand out among the competition, air carriers need to aim towards developing new services, as well as keep a constant watch on the improvement of the services they already provide.
Improving the quality of passenger service in air transport should be one of the primary goals of air companies. The current vicious competitive conditions necessitate a new and different way of thinking which focuses not on profit as an end in itself, but rather on fully satisfying customers’ needs. Achieving high-quality service as an immaterial asset increases market capitalization. High personnel effectiveness is guaranteed when they receive acknowledgment for doing their job well. The building and strengthening of an air company’s reputation as an appealing employer that secures stable work pay, career growth and social protection creates opportunities for attracting good experts and highly qualified personnel. Passenger air transport businesses should hire employees who love people and are motivated to work and improve their skills. The principle for creating a system for moral encouragement such as additional financial support and bonus payments for work experience, sincere recognition, timeliness and publicity is crucial to the development of air carriers. The good reputation of the air company will guarantee stability and security for employees, which in turn will lead to reduced fluctuation and increase employment productivity. Good service and customer satisfaction are key conditions for creating brand loyalty which in turn determines whether a company would be able to maintain and even increase its market share.

172
REFERENCES
Авиатрансагентство; (2020) Web site: www.aviatrans.ru;
Фонд развития инфраструктуры воздушного транспорта «Партнёр гражданской авиации»;(2020) Web site: http://www.aviafond.ru/aviation;
transport.ru (2020) Web site: www.transport.ru;
АО «Эксперт РА»; (2020) Web site: http://www.raexpert.ru/researches/avia/part2/;
KrasAir (2013) Web site: http://www.krasair.ru;
Журнал БТИ - Бюллетень транспортной информации, рефераты статей о перевозках всеми видами транспорта (2020) Web site: www.natrans.ru;
gruzotransport.ru (2020) Web site: http://gruzotransport.ru/2009/10/06/tendencii_razvitija_vozdushnogo_transporta_rossii.html.

173
Entrepreneurship ISSN: 2738-7402
DOI: 10.37708/ep.swu.v8i2.14 Volume: VІII, Issue: 2, Year: 2020, pp. 173-182
RISK MANAGEMENT IN THE DEVELOPMENT OF TRANSPORT PROJECTS
Svetla Tzvetkova 1
Received: 30.09.2020, Accepted: 21.10.2020
Abstract The realization of transport projects is accompanied by multiple risks which
vary in nature. This is determined by the specificity of the transport activity and the multitude of internal and external factors which influence it. The occurrence of risks is caused by the inability to predict events which will take place in the future. This could lead to disasters, emergency situations and a lot of negative consequences for the transport firm such as reduced productivity, low competitiveness and insufficient highly qualified work force. Therefore, risk management in the development of transport projects needs to be aimed at the development and implementation of various methods which can reduce risks or prevent the probability for occurrence of unwanted events.
Keywords: risk management in transport, development of transport projects, risk reduction methods
JEL Codes: R40, R49
1. Introduction
Risks are random events or a system of interlinked phenomena which inflict certain damage under specific circumstances. When it comes to the development of transport projects, there is a difference between risk and uncertainty.
Uncertainty involves inadequate and incomplete information in regards to the conditions, prerequisites, project realization and the losses that accompany them. It is associated with incompetence, accidents or the occurrence of counteraction.
1 Svetla Tzvetkova, University of National and World Economy, Economics of Transport Department, Assoc. Prof., PhD, e-mail: [email protected] ORCID ID: https://orcid.org/0000-0002-6499-5612

174
The term risk is usually used to define an economic situation where all probabilities for the occurrence of a certain event are known, whereas the term uncertainty is used when it is impossible to assess said probabilities.
The scope of the risk for each event in the development of most projects, including transport ones, can be defined as a function of the probability and the amount of losses resulting from its occurrence.
Risk g (probability, amount of losses) The magnitude of the risk depends on the probability and the size of losses.
If the probability for occurrence of a risk event or an expected change in losses due to its occurrence grows, so does the risk.
Risks can be managed. Project managers could adopt the necessary measures to reduce the probability for the occurrence of unfavorable situations and the scope of the damage or secure compensation for said damage in case an insurance event takes place. Risk management is part of project management.
2. The Main Stages of Risk Management
Risk management in the development of transport projects is a function of defining the sources of potential risk events, analyzing and evaluating risks, reacting to the occurrence of risk situations, and controlling risks in projects.
Risk management in the development of transport projects g (sources, analysis, reaction, control) Risk management is a complicated process which needs to commence in
the early stages of a project’s realization since the risk of failure is at its highest precisely during that period, mainly due to lack of information (Zarenkov, 2011). In the later stages of the project, the financial risks associated with its realization become more important.
Figure 1 presents the main stages of management in the development of transport projects.

175
Figure 1. Stages of risk management in the development of transport projects
- Risk detection and identification is carried out on the basis of previously established systems which guarantee security and safety during production activity in transport; they can identify possible future risks during transportation processes, loading and unloading operations, risk situations, passenger incidents, etc.;
- Risk analysis and assessment is based on the detection of risk factors and the evaluation of their influence on the project realization process. Firstly, individual factors are detected, followed by their combined influence on the development of transport projects;
- Development of risk reduction/management methods. At this stage, a preemptive assessment is made of the negative consequences from the occurrence of risk situations in order to avert them. First and foremost, standards are determined with a view to achieving more high-quality transport services; the necessary information about the management team is collected and purposeful company policies and risk management systems are implemented. This involves the development of company strategies and measures for carrying out specific undertakings aimed at preventing or reducing the negative effects of risks;
- Risk monitoring and control is the final stage, where a plan for monitoring and control of the risk reduction process is developed. The modern concept of management views risk management as a
continuous process where risks are identified, analyzed and measured, ways of working with them are sought, and the effectiveness of previously adopted measures is evaluated. A great deal of uncertainty is involved in terms of the
Risk monitoring and control
Development of risk reduction methods
Risk analysis and assessment
Risk detection and identification
Stages of risk management in the development of transport projects
176
decision-making process and the taking of specific steps in the management of transport project development. In a broad sense, uncertainty is inadequate information about the conditions of a project’s realization. It is provoked under the influence of the following factors:
• incomplete knowledge about all parameters of the situation in terms of selecting an optimal solution, as well as the presence of probability characteristics in the environment’s behavior;
• the presence of a chance factor, i.e. the implementation of factors which cannot be foreseen or prognosticated, even in probability execution;
• the presence of subjective factors for counteraction when the decision-making process is carried out in a situation of playing with partners with opposite or non-concurrent interests. Uncertainty and the risks which accompany management during project
development are two interlinked categories.
2.1 . Determining the Sources of Hypothetical Risks
There are two types of risk which could emerge in the transport project management process. The first one, which corresponds to pure uncertainty, is the “catastrophic risk”, where there is a probability for the occurrence of irreversible losses of assets as a result of the infliction of irreparable damage on economic subjects. It is caused by unforeseen changes in the influence of a number of internal and external factors. The second type of risk is defined as “dynamic” and it involves the so-called “speculative uncertainty”. It is caused by the occurrence of unforeseen changes in the value of the examined subject under the influence of external factors such as fluctuations in the economic situation or inadequate management decisions. The difference between the two types of risk is the fact that static risk could be a one-time occurrence and disrupt the realization of the project (Parvanov, H., Bakalova, V., Tzvetkova, 2010), whereas the dynamic risk could occur multiple times in the project management process without leading to its disruption. Both types of risk result in complete or partial loss of invested capital, and their magnitude depends on the political, social, economic and ecological situation.
Given the specific peculiarity of the transport activity and the wide range of difficulties which emerge in the planning, organization and adequate realization of freight processes during project management in transport, the fundamental factors which could have significant influence over it should also be taken into account, as they could cause the occurrence of serious emergency situations which in turn could result in potential losses.

177
Figure 2 systematizes the fundamental groups of factors inherent to the transport activity which could lead to negative consequences for a project.
Figure 2. Factors which influence transport activity
• Regulations are implemented in regards to market access – namely, obtaining a license for transport activity. Said license could be revoked if violations in terms of financial stability and professional competence are detected in the company. Risks for regular transport activity could also occur if legal requirements within the mandatory prescriptions, standards, contract clauses, etc. are not strictly implemented;
• Organizational factors emerge during the realization of the transport activity, in the organization and planning of the activity, the management of human resources and their effective use, as well as the imposing of a specific type of organizational culture in the company;
factors which influence transport activity
regulations
financial
technological
operational
freight safety
company image
commercial
organizational

178
• Financial factors are directly associated with the use of financial resources and strict adherence to budget, observation of tax liabilities and payment of employment obligations. Financial risks occur mainly when the losses exceed the planned resources for a project or when the prime cost exceeds the value of the planned revenue;
• The commercial factor is associated with the market situation, more specifically the implementation of a marketing strategy, as well as the competition in force on the market;
• Technological and operational factors emerge in regards to the use of the rolling stock, the accrual of depreciation, and the effective organization of technical maintenance and repair activities;
• Company image/reputation is associated with inadequate company behavior, underestimation of existing and potential competitors, drops in the quality of supplied transport services, etc.;
• Freight safety and security involves risks which are dependent and connected to the overall activity of transport enterprises – management of assets and personnel, development of an effective information infrastructure, observation of enforced regulations and procedures in the field of intellectual property, and incorporation of new technology in the field of freight activity.
2.2 Risk Analysis and Assessment
Risk analysis and assessment is one of the most important stages of risk management in the development of transport projects. The quality of the assessment greatly influences the determination of the actions that an enterprise will take in order to reduce risks.
Once the risks have been defined, a qualitative assessment needs to be made in order to determine the probability for occurrence of a risk event, as well as the extent to which it will affect the realization of a project. To that end, it is appropriate that a risk parameter assessment matrix be created.
Table 1. Risk parameter assessment matrix
Risk event Probability for
occurrence Influence on the project
Time of occurrence
Probability for prevention
Changes in fuel prices
high average within a year
low
Event …. Event ….
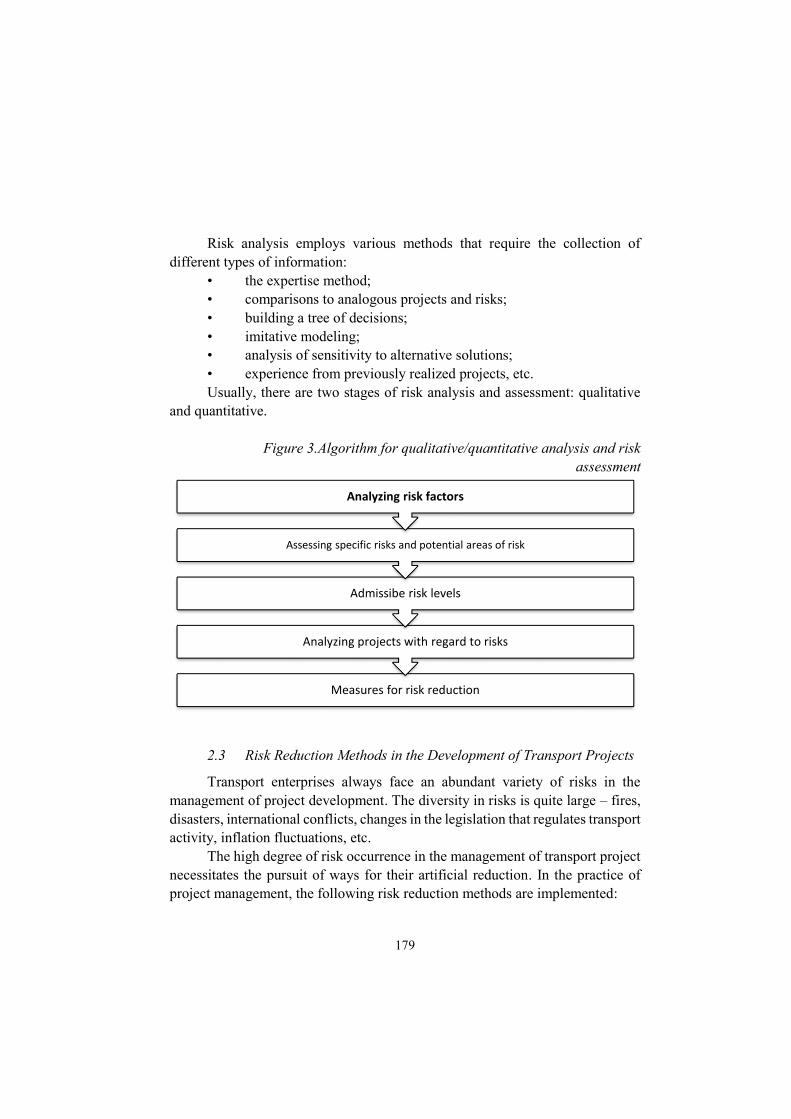
179
Risk analysis employs various methods that require the collection of
different types of information: • the expertise method; • comparisons to analogous projects and risks; • building a tree of decisions; • imitative modeling; • analysis of sensitivity to alternative solutions; • experience from previously realized projects, etc. Usually, there are two stages of risk analysis and assessment: qualitative
and quantitative.
Figure 3.Algorithm for qualitative/quantitative analysis and risk assessment
2.3 Risk Reduction Methods in the Development of Transport Projects
Transport enterprises always face an abundant variety of risks in the management of project development. The diversity in risks is quite large – fires, disasters, international conflicts, changes in the legislation that regulates transport activity, inflation fluctuations, etc.
The high degree of risk occurrence in the management of transport project necessitates the pursuit of ways for their artificial reduction. In the practice of project management, the following risk reduction methods are implemented:
Measures for risk reduction
Analyzing projects with regard to risks
Admissibe risk levels
Assessing specific risks and potential areas of risk
Analyzing risk factors

180
- Risk diversification – by predicting drops in the demand for offered transport services, transport enterprises seek new market niches for work or focus their activity towards performing other types of services or providing ones which accompany the main one. Diversification offers two primary ways of managing risks – active and passive. The active tactics of transport enterprises for realization of the transport production on the market involves, on one hand, careful research, examination and realization of the most effective investment projects, conquest of a significant portion of the transport market with specialization in one type of transport services, and, on the other hand, fast reorientation from one type of transport services to another, including possible conquests of other markets. Passive risk management is characterized by low turnover or a minimal level of concentration of the volume of work;
- Risk allocation among participants in the transport activity – the standard practice of risk allocation consists of assigning the responsibility for risks to a transport activity participant who is more qualified than everyone else to identify and control risks. Risk allocation is carried out during the development of a project’s financial plan and contractual documentation. It should be taken into account that any rise in the risk levels of one participant should be accompanied by adequate changes in the distribution of the profits from the project. Therefore, what should be accounted for first and foremost during negotiations is the capacity of project participants with regard to preventing unfavorable consequences from the potential occurrence of risks. An acceptable remuneration for the risk should be negotiated, and the parity in the correlation between risk and profit among all participants in the transport project should be observed. The higher the degree of the risk which the participants are willing to allocate to their partners is, the harder it becomes to attract funding for the transport activity from experienced investors. Therefore, it is advisable that participants in the transport project display maximum flexibility in terms of what share of the risk they are willing to take on during negotiations. Participants who are willing to discuss the issue of taking a large portion of the risk could convince experienced investors to lower their requirements;
- Insurance – in essence, risk insurance is the process of passing certain risks on to insurance companies. Insurance covers all risks, including exceptional circumstances, extending to the carriage of loads from one warehouse to another, i.e. it covers the entire transportation process, including ground transportation to the port of loading and from the port of unloading. This form of insurance is usually implemented for borrowed equipment as well. Moreover, it
181
is often used as protection from the consequences of material damage to transport vehicles/facilities;
- Coverage of unforeseen expenses is a risk reduction method which involves the determination of a correlation between potential risks which affect a project’s cost and the amount of expenses necessary to overcome losses. The magnitude of said amount should be equal or larger than the magnitude of the fluctuations of system parameters in time. A 7-12% increase in the project’s overall cost is permissible for setting aside reserve resources planned for the occurrence of exceptional circumstances (Parvanov, H., Bakalova, V., Tzvetkova, 2010). Additional sources of funding for the project should also be set aside, and reserve funds where deductions amounting to a certain percentage of the realization of transport services should be created. In order to reduce risks during the development of a project’s financial plan, a significant reserve needs to be created to guarantee stability during the realization of a project’s stages; additional expenses, as well as temporary drops in the supply of transport services should also be taken into account;
- Written negotiation or reception of guarantees for reduction of the risks for transport enterprises, etc.
2.4 Monitoring and Control
Once the risk reduction measures have been implemented, their effectiveness needs to be evaluated. A qualitative analysis of risks is made, and the expenses for their minimization are compared to the amount of losses resulting from the occurrence of risk events. After that, the project manager decides whether a certain level of risk is admissible or not.
3. Conclusion
The management of projects during their realization is an activity which is directly associated with the improvement of resource utilization along the EU’s operational programпs. Effective project management practically means the achievement of significant economic and social effects, especially organizational-technological measures and activities on the basis of improving the connections and the interaction between the individual components of business systems (Parvanov, H., Bakalova, V., Tzvetkova, 2010).
For a transport project to be realized successfully, the appropriate approaches and the optimal combination between them need to be pursued in order to reduce the risks which are too vast and varied. Among the main goals of risk reduction in the development of projects in transport enterprises is the

182
rationalization of a transport enterprise’s relationships with its partners, consignors, recipients and insurers.
The modern concept of risk management views it as a continuous process where risks are identified, analyzed and measured, methods and approaches for their reduction are sought, and the effectiveness of previously adopted measures is evaluated. REFERENCES
Zarenkov, V., (2011), “Project Management”, Varna: City Auto Center Publishing House;
Parvanov, H., Bakalova, V., Tzvetkova, S., (2010), “Management of Transport Projects”, Sofia, University Publ. House “Stopanstvo”;
Projektmanagement Manufaktur: Methoden, Insights, Know-How; http://projektmanagement-manufaktur.de/risikoanalyse-projektmanagement;
Die Umsetzungsberatung https://www.umsetzungsberatung.de/projekt-management/risikomanagement.php

183
Entrepreneurship ISSN: 2738-7402
DOI: 10.37708/ep.swu.v8i2.15 Volume: VІII, Issue: 2, Year: 2020, pp. 183-196
EDUCATION MANAGEMENT AND THE IMPACT OF INNOVATION
Lykopoulou Zacharoula 1
Received: 11.10.2020, Accepted: 29.10.2020
Abstract
This study concerns higher education in Greece, as applied today and in the forthcoming years and its aim is ternary; firstly, the study on the implementation of international innovation indicators in education, secondly the use of innovative teaching practices and finally the relationship between different organizations and its impact on innovative educational practices. The primary research contacted with the use of a questionnaire on a sample of 471 teachers all over Greece. The findings among others show that the higher the level of innovation regarding educational services, the higher also is the level of innovation on educational processes. Moreover, the higher the level of innovation regarding educational services, the higher also is the level of innovation on business organization, and the higher the level of innovation regarding educational processes, the higher also is the level of innovation on business organization. The importance of this work lies in its contribution to the description and definition of the concept, characteristics and operation of organizational innovation in the context of education, as well as the possibility of its use by the supervisors and teachers of the specific school level for better understanding and management of the culture of each school unit.
Keywords: Innovation, Management educational services, Educational process, Innovative practices
JEL Codes: I20, M10
Introduction
The term innovation appears to have various meanings which, however, share common features and characteristics. According to the Major Greek Dictionary (2006: 32), innovation is an "innovation or reform". In addition to identifying this term innovation with reform, one can find even more meaningful terms such as "best practice" "creativity" and "change". According to Cros 1996
1 Kinder garden „Kalampaki“, Drama, Greece, Director. e-mail:[email protected]; ORCID ID: https://orcid.org/0000-0001-5237-7895

184
(in Sultana, 2001) there are over three hundred (300) definitions of innovation. The most common term, according to Cros (1996), defines innovation as "something new" (eg an object, idea, practice or process, etc.) either in absolute terms or under the perspective through of which it is implemented or applied. According to Sultana (2001: 5), this common term refers not to a new idea but also to its application. Marsh's views are similar (1997: 185, referring to Sultana, 2001: 5), which argues that "authentic innovations" involve an "improvement intention" and aim not at the cancellation, cancellation or sabotage of current ideas, practices or procedures applied to a system, but to improve their efficiency and to renew the stakeholders.
Defining education
The OECD definition of innovation refers to "converting an idea into a marketable product or service, a new or improved production or distribution process, or even a new method of providing social services ... emphasis is given ... both in the process and in the outcome of innovation ... the emergence of new products, methods or services can be done in all areas of activity, traditional or high-tech, public or commercial, industrial, agricultural or tertiary. Innovation may also concern services of general interest or general interest". Educational innovation refers to the introduction or integration of new elements, situations, processes or persons into the educational work to modify, improve, replace or change part or all of the educational practice. The definition of Yamazumi (2008) expresses more precisely the delineation of educational innovations. According to these writers, educational innovations relate to "real and practical interventions designed to bring about improvements in education, whether or not these improvements are realized or simply delineated by the actors involved, irrespective of whether these changes are aimed at the aims, in skills, philosophies, beliefs, behaviors or practices".
This definition is of great interest, given that specific mention is made of the interventions that are often not implemented, as is clarified in the respective chapter on innovations in our country, as well as the real ones, which are also facing, difficulties in their application. This definition is, however, quite flexible in our view because it refers to individual elements or processes of the educational fabric that are being addressed in a dissociative way (eg goals, skills, beliefs, practices, etc.) as a pursuit of educational innovation, instead of addressing the "ecology of schools" (Subramanian et al., 2016) or the culture of education (Porter et al., 2014; Bryndin, 2019). As we will say later, if educational innovation is not addressed in the overall educational structure, the educational
185
improvements or changes that are being sought impinge on the existing system that resists the intended educational innovations which are aborted or fall into a vacuum. In the modern economy of knowledge, a business success is achieved by the enterprises that develop an innovative approach (Dimitrova, Sotirova, 2020). These are the enterprises in which human resources and managers are able to create conditions conductive to discovering and developing the workers’ and employees’ innovative potential. The process of globalization and the continuous development of the knowledge society places emphasis on education and training as important economic, social and political priorities (Rizova, Dimitrova, 2017). The development of human capital depends on many factors. One of the most important of them is access to education and vocational training and its quality (Dimitrova, Vladov, 2017). In modern society, lifelong learning is defined as a critical factor for personal development and a guarantee of a successful career, as formal education is only one part of what a person learns in life (Rizova, Dimitrova, 2017).
Innovation in the teaching process and levels of educational innovation
The term instructional innovation refers to the introduction, renewal or replacement of various factors of the didactic work and / or the teaching practices. A classic definition is that of Lee (1966, in Schoen & Fusarelli, 2008) which refers to a "continuous one that involves major changes to an existing teaching practice as well as the introduction of new elements and procedures or a complete replacement of existing teaching practice. Continuing a teaching practice refers to the various subjects of the teaching work, such as planning and organizing teaching, new methods, models, strategies or forms of teaching, making teaching decisions, using audiovisual and other media (eg new technologies, PCs, etc.), the climate of the classroom, the management of teaching time and other activities (Hofman et al., 2013, Krasteva R., Pantelis Ef., 2017). In addition, all educational innovations are often targeted at the "instructional environment" which aims to transform, modify or change it deliberately or not deliberately, a goal that is not always achieved " (Hovne, Hovne & Schott, 2014; Deming et al., 2015).
As mentioned above, many experts even associate the term innovation with the terms: change, renewal, best practice, creativity, or reform (Haller, Bullinger & Moslein, 2011). However, before we refer to aspects or levels of educational innovation, it is worthwhile to note the relationship between innovation and change, since the latter is often the pursuit or objective of the former. According to Porter et al. (2014), the change is characterized as "the adoption of an

186
innovation that seeks to improve the effects of education by modifying or replacing the practices that apply". In the literature on educational innovation, one often finds the point that a change requires complex planning and preparation processes at various levels, particularly those directly involved in it (Thorsteinsson, 2014). For the issues, however, these are discussed in more detail in other chapters.
The curriculum is the medium in which the school's knowledge, skills, values and generally the cultural assets of a country are established and is closely linked to school textbooks, work plans, audiovisual and technological media, as well as the activities that are an integral part of it (Maritz et al., 2014). The curriculum is usually at the heart of many of the educational innovations that are being implemented internationally. The reason is that often linked to both national and local needs as well as to external changes, trends or challenges at the international stage, such as globalization, the knowledge and information society, high technology and many others. National needs and international changes or trends are putting pressure on educational systems to renew or change CPIs in which school knowledge is structured to better respond to international challenges and to competition between countries (Serpell & Adamson-Holley, 2017). Such challenges have contributed to the creation of the new form of the Greek BS, namely, the Interdisciplinary Framework of the Program of Studies (DEPPS), the Curriculum for Advanced Studies (ASP) work plans, the Flexible Zone, as argued by various experts in our country (Al-Emran, Elsherif & Shaalan, 2016) and abroad (Rikkerink et al., 2016).
Innovations in the curriculum have direct and indirect effects on other successive functions of the educational project. is directly related to the didactic work, which is why Borrego and Henderson (2014) argued that the curriculum is the "contraction" of the heart of education while teaching is "its expansion". Multiple interconnections of the curriculum with other aspects of the didactic work, but also the new situation created in the context of its implementation provokes several times reactions and uncertainty for the teachers. For example, when a new curriculum has been applied in Slovenia, which demanded new roles and responsibility that burdened teachers' work, teachers made a strike (Gomez, Gomez & Gifford, 2010), as is often the case in our country as well as in other countries.
The complexity of the process of implementing educational innovations and the essential preconditions

187
As will be seen from what follows in the next chapters, the process of implementing an educational innovation is not an easy process. Instead, it depends on multiple factors on multiple levels to achieve and succeed. What we mention in the section below shows that even in cases where educational innovations have been institutionalized, it is not certain that their implementation will be realized and consolidated. This is because attempting to implement educational innovation is not an isolated act, but a process with a variety of aspects or levels, as has already been mentioned. Sultana (2001) argues that the application of educational innovation is a "life cycle" that consists of a fundamental dynamic and is governed by a variety of strategies including the origin of innovation, ie who to promote it, the means by which it is channeled towards schools, the ways in which it is accepted by schools, how it is piloted, and how it is monitored and evaluated ... to succeed". In principle, the chances of a successful success of an innovation are much greater if the educational innovation sought is not "foreign" or different to the institution of the institution in which it is introduced. On the other hand, if educational innovation or reform is "genius" - that is, it comes from the institution itself or the organization - the chances increase its success (Bradshaw & Hultquist, 2016; Bryndin, 2019). This direction could be also followed in other spheres such as hospitality and (Kyurova, Kiryakova-Dineva, 2020:4614)
A minute and important point is who and how an innovation is being promoted. There are indications that, when educational innovation is promoted from "top to bottom", there is a potential for the educational innovation sought to encounter obstacles. To a large extent, educational innovations in centralized systems, such as our country, are carried out in this way and are imposed without substantial results (Maritz et al., 2014). Educational innovation, by definition, according to Lozano et al. (2015) provokes, a priori, a process of questioning and resistance to it and is treated as a "foreign body". This motivates Sultana (2001) to argue that educational innovations should not be promoted one-dimensionally from top to bottom. When this becomes educational innovation "it challenges the dominant positions and practices and leads to further questioning by all those who have an interest in preserving the old ways, on the one hand, and those who show preference to follow the new ways from the other". In fact, and in view of the resistance put forward by the stakeholders, an educational innovation will not be adopted if its actors do not identify with it, nor are they given the appropriate incentives - for example. Wages, professional advancement, etc. - and there are no similar forms of support. This support - economic, ethical, etc. - is important for the realization of educational innovation because sometimes there is only

188
apparent support without the corresponding resources or appropriate forms of delivery. In these cases Sultana (2001) considers that "educational innovation is likened to the Trojan Horse, where the hope is that it will expand and influence other elements or processes of the system or the educational web".
Given that educational innovation is identified with change, it is imminent that the persons involved who are accustomed to a given situation will not accept and resist it, since the upcoming change will disrupt the balance of dominant practice that is established in their institution. This difficulty is expressed by a number of scholars, others stressing that critical factors are "people and relationships, and the support mechanisms needed to successfully implement educational innovations, especially when seeking to improve practices" (Credaro, 2001). Similar views are expressed by other scholars, such as Lozano et al. (2015) who say that education reforms are difficult to precisely plan, but educational innovations are even more difficult to implement.
Various difficulties in the implementation of reforms or educational innovations are highlighted by Fidalgo-Blanco, Sein-Echaluce and García-Penalvo (2015) who argue that their complexity is due to a variety of factors including: "Educational innovation or change must not is linear and needs to evolve through its various stages of implementation, while the requisite conditions are the commitment of the persons or bodies involved, collective decision-making, the common vision, cooperation as well as the operation of support structures". Given these peculiarities, he suggests four steps in implementing any change or educational innovation. These stages are: "first, the creation of the conditions for information and awareness of the upcoming change or innovation, second, the consolidation of the funnel-facilitation structures, the third, the complexity of the parallel process concerning the persuasion of the persons involved, the decision- and their commitment to promoting educational innovation or change, fourth, the start of implementation, and the adaptation of educational innovation to the school's context and its assessment".
According to the above, we note that non-realization of educational innovation or change is due to a number of factors, the most important of which are: attitudes or attitudes - natural or negative - of the persons involved, the lack of a holistic approach to educational innovation, change or reform, the absence of follow-up and post-evaluation, the absence of material, moral, scientific support, and the process of change that disfigures the persons involved (Fidalgo-Blanco, Sein-Echaluce& García-Penalvo, 2015; Bryan & Clegg, 2019).

189
Methodology
The appropriate research method was selected based on the literature review as well as to serve the objectives of the research. This primary research is characterized as quantitative and it is conducted using a questionnaire, a tool common to similar research efforts (Ghauri, Gronhaug & Strange, 2020). The overall aim of the research is to investigate teachers' perceptions of innovation in educational organizations. Based on the purpose of the research, the research design focused on the following research questions:
1. What are the teachers' views on innovation in educational services? 2. Is there a correlation between innovation levels at different levels of
educational organizations? 3. Is there a correlation between the relationships of the educational
organization and the levels of use of innovative practices in educational organizations?
The questionnaire was selected as the research data collection tool. The selection of the questionnaire was based on the advantages it can offer in terms of research compared to other options such as interviews and focus groups. Specifically, the questionnaire was selected as it can lead to fast, accurate and as low cost as possible collection of research data (Ghauri, Gronhaug & Strange, 2020). The questionnaire was based on previous research on innovative educational programs in Greece, with the necessary additions and improvements in terms of questions to meet all research objectives. In particular, the questionnaire includes 10 sections, with questions and sub-questions and with the measurement of which to be done with different scales. Categorical as demographics, but also 7-point Likert scales (where 1 = None, 7 = Extremely high) to emphasize the intensity of the choices and to be able to compare them.
In the present study, the target population is teachers in the Greek education system and the research sample was a random sample of 471 individuals. Simple random sampling was selected to collect the sample, with individuals being randomly selected from a database of the Ministry of Education, which functioned as a sampling framework. This particular sampling method has advantages and disadvantages over other ways of selecting population units. In particular, it offers random data collection as the researcher essentially randomly selects without discrimination who to ask, but instead finds it difficult to collect data quickly (Ghauri, Gronhaug & Strange, 2020). Geographically, the survey was conducted with respondents in all regions of the country and the identification of respondents was carried out via the internet. Below is the composition of the research sample. Finally, the majority of the

190
respondents were females (61.1%), 33.8% were from 31 to 45 years old, 91% hold a PhD while 47.8% of the respondents have less than 5 years of professional experience. The analysis of the data provided by the primary data analysis was performed using the SPSS 26.0 statistical analysis program. The One-way ANOVA and Pearson correlation parametric test were selected to verify statistically significant correlations at a = 0.05 level of significance.
Research Findings
Figure 1 presents the answers of respondents regarding institution’s most significant innovation concerning educational services in the last three years that has most transformed the business performance. Specifically, 64% state innovative educational packages are the most significant innovation concerning educational services in the last three years, following by offering collaborative programs (48%), and offering mix subject programs (40%).
Figure 1: Institution’s most significant innovation concerning educational services
Table 1 presents the answers of respondents regarding the importance of innovative change on educational delivery processes. Specifically, the respondents state that innovative change regarding educational delivery processes is most important for new learning resources or facilities (eg. virtual environments) (M = 6.04) following by new teaching and learning methods (eg peer group reviews) (M = 5.94) and finally new approaches to student monitoring or support (eg measures to improve retention) (M = 3.67).
64
25
48
40
0 10 20 30 40 50 60 70
Innovative educational packages
Multilingual educational packages
Offering of collaborative programs
Offering of mix subject programs

191
Table 1: Importance of innovative change
Innovation categories Degree of innovative change
New teaching and learning methods eg peer group reviews 5.94 New approaches to student monitoring or support eg measures to improve retention 3.67
New learning resources or facilities eg virtual environments 6.04
Table 2 presents the answers of respondents regarding institution’s most significant innovation concerning educational delivery processes in the last three years, that has most transformed the business performance. Specifically, 81% state that the use of group meeting applications are the most significant innovation concerning educational delivery processes in the last three years, following by internet platforms (78%), and the use of innovative teaching software (68%).
Table 2: Institution’s most significant innovation concerning educational delivery processes in the last three years
Innovation concerning educational services Percentage Use of innovative teaching software 68 Use of internet platforms 78 Use of internet applications 53 Use of group meeting applications 81
The majority of the respondents state regarding contrasting strategies that
their institutions always test alternative innovation designs before adopting one that fits our specific circumstances (M = 6.10) and that innovations are adopted only after a comprehensive evaluation of our needs and a thorough evaluation of the business case (M = 5.49). On the contrary at lower degree the respondents state that strategic innovations are usually built around a single good idea (M = 2.87).

192
Table 3: Contrasting strategies Mean
1 l 7
Innovations are always adopted when they have become standard practice in our sector.
5.49
Innovations are adopted only after a comprehensive evaluation of our needs and a thorough evaluation of the business case
We only implement the commonly accepted standard form of innovations. 6.10
We always test alternative innovation designs before adopting one that fits our specific circumstances
Strategic innovations are usually built around a single good idea 2.87
Strategic innovations usually emerge from the juxtaposition of several separate ideas
The findings show that the higher the level of innovation regarding
educational services, the higher also is the level of innovation on educational processes (r = .890, p < 0.01). Moreover, the higher the level of innovation regarding educational services, the higher also is the level of innovation on business organization, and the higher the level of innovation regarding educational processes, the higher also is the level of innovation on business organization (r = .559, p < 0.01). Moreover, the findings show that the higher the level of innovation regarding educational services, the higher also is the level of relationship with educational service providers and the level of relationship with government agencies. The level of innovation on educational processes presents a positive statistically significant relationship with the level of relationship with educational service providers (r = .393, p < 0.05) and the level of relationship with government agencies (r = .326, p < 0.01). Therefore, the higher the level of innovation regarding educational processes, the higher also is the level of relationship with educational service providers and the level of relationship with government agencies. Finally, the level of innovation on business organization presents a positive statistically significant relationship with the level of relationship with educational service providers (r = .382, p < 0.05) and the level of relationship with government agencies (r = .344, p < 0.01). Therefore, the higher the level of innovation regarding the business organization, the higher also is the level of relationship with educational service providers and the level of relationship with government agencies.

193
Table 4: Correlations 1 2 3 4 5 6 1. Level of innovation on educational
services 1 .890** .559** .393* .326* .016
2. Level of innovation on educational processes
1 .572** .382* .344* .033
3. Level of innovation on business organization
1 .356* .387* .062
4. Relationships with educational service providers
1 .335* .054
5. Relationships with government agencies
1 .801**
6. Relationships with professional networks
1
**. Correlation is significant at the 0.01 level (2-tailed). *. Correlation is significant at the 0.05 level (2-tailed).
Conclusion
The importance of this work lies in its contribution to the description and definition of the concept, characteristics and operation of organizational innovation in the context of education, as well as the possibility of its use by the supervisors and teachers of the specific school level for better understanding and management of the culture of each school unit. Introducing and implementing innovations in the school unit is a necessary process in order to solve problems, improve its results and adapt to the changing social environment. This process is not automatic with a predetermined result, and the degree of its success depends on several factors. The principal as a leader and not just as an administrator, is the one who must take the appropriate steps so that the school unit can select, introduce and implement innovations successfully.
In a constantly changing economic, social and technological environment, the introduction and use of technological innovations is considered a basic prerequisite for educational management to meet the upgraded and constantly updated goals set by the state. The purpose of our research is to determine whether and to what extent these technological innovations, such as electronic communication, remote electronic training, etc. on the one hand, they make the work of an education directorate effective and on the other hand, they facilitate teachers in their official capacity, but also the principals of the school units in their administrative work. From the results, a very positive attitude of the subjects regarding the implementation of the specific innovations is recorded. In particular, there is an improvement in the immediacy and completeness of the

194
information, in the reduction of bureaucracy, costs and processing time, a clear improvement in both the better performance of teachers' duties and the general administrative and educational work, while achieving substantial and efficient diffusion. Practices but also the work of school units. In conclusion, it turns out that the project of introducing and implementing technological innovations upgrades the role and work of regional structures of education.
According to the reports, organizational innovation is a central element of an educational organization, providing members with a common meaning system that distinguishes each organization from another and influences the attitudes and behaviors of members. It acts as a factor of cohesion and stability of the body, but it can also be a brake on its effectiveness, especially when it is strong. It is created as a result of successful treatment of situations that arise in the internal and external environment, is considered valid by the members of the organization and is an object of learning for new entrants during the process of their professional socialization, which plays a very important role in its maintenance.
REFERENCES
Al-Emran, M., Elsherif, H. M., & Shaalan, K. (2016). Investigating attitudes towards the use of mobile learning in higher education. Computers in Human Behavior, 56, 93-102.
Borrego, M., & Henderson, C. (2014). Increasing the use of evidence‐based teaching in STEM higher education: A comparison of eight change strategies. Journal of Engineering Education, 103(2), 220-252.
Bradshaw, M., & Hultquist, B. L. (2016). Innovative teaching strategies in nursing and related health professions. Jones & Bartlett Learning.
Bryan, C., & Clegg, K. (Eds.). (2019). Innovative Assessment in Higher Education: A Handbook for Academic Practitioners. Routledge.
Bryndin, E. (2019). Creative Innovative Higher Education of Researchers with Flexible Skills and Synergy of Cooperation. Contemporary Research in Education and English Language Teaching, 1(1), 1-6.
Deming, D. J., Goldin, C., Katz, L. F., & Yuchtman, N. (2015). Can online learning bend the higher education cost curve?. American Economic Review, 105(5), 496-501.
Dimitrova, R., Vladov, R. (2017). Continuing vocational training of specialists employed in the IT-sector in Bulgaria. Economics and Management, Volume: XIII, Issue: 2, Year: 2017, с. 185-207, ISSN (print): 1312-594Х, ISSN (online): 2367-7600
Dimitrova, R., Sotirova, A. Human resource management within the context of innovational development of the enterprise. In: Management - Tourism -

195
Culture, Studies and Reflections on Tourism Management, Ignatianum University Press, Kraków, 2020, рр 161-174, ISBN 978-83-7614-468-9
Fidalgo-Blanco, A., Sein-Echaluce, M. L., & García-Penalvo, F. (2015). Epistemological and ontological spirals: From individual experience in educational innovation to the organisational knowledge in the university sector. Program, 49(3), 266-288.
Ghauri, P., Grønhaug, K., & Strange, R. (2020). Research methods in business studies. Cambridge University Press.
Gomez, K., Gomez, K., & Gifford, B. R. (2010). Educational innovation with technology: A new look at scale and opportunity to learn. Transforming America’s education through innovation and technology, 7.
Haller, J. B., Bullinger, A. C., & Moslein, K. M. (2011). Innovation contests. Business & Information Systems Engineering, 3(2), 103-106.
Hofman, R. H., de Boom, J., Meeuwisse, M., & Hofman, W. A. (2013). Educational innovation, quality, and effects: An exploration of innovations and their effects in secondary education. Educational Policy, 27(6), 843-866.
Hovne, A. S., Hovne, B. S., & Schott, T. (2014). Entrepreneurs’ innovation benefitting from their education and training and from national policy and culture: A global study. International Journal of Entrepreneurship and Small Business, 23(1-2), 127-144.
Krasteva R., Pantelis Ef. (2017) Bridging relationships between education, refugee crisis and tourism, paper in Scientific Conference “Education and New Learning Technologies”, 3-5 July 2017, Barcelona, https://library.iated.org/view/KRASTEVA2017BRI
Kyurova, V., Kiryakova-Dineva, T. (2020). Product Innovations in the Bulgarian Hospitality: Linking Theory and Practice. International Journal of Recent Technology and Engineering (IJRTE, Vol. 8 (5), 4614-4618. DOI:10.35940/ijrte.E6957.018520
Lozano, R., Ceulemans, K., Alonso-Almeida, M., Huisingh, D., Lozano, F. J., Waas, T., ... &Hugé, J. (2015). A review of commitment and implementation of sustainable development in higher education: results from a worldwide survey. Journal of Cleaner Production, 108, 1-18.
Maritz, A., De Waal, A., Buse, S., Herstatt, C., Lassen, A., & Maclachlan, R. (2014). Innovation education programs: toward a conceptual framework. European Journal of Innovation Management, 17(2), 166-182.
Porter, W. W., Graham, C. R., Spring, K. A., & Welch, K. R. (2014). Blended learning in higher education: Institutional adoption and implementation. Computers & Education, 75, 185-195.
Rikkerink, M., Verbeeten, H., Simons, R. J., & Ritzen, H. (2016). A new model of educational innovation: Exploring the nexus of organizational learning,

196
distributed leadership, and digital technologies. Journal of Educational Change, 17(2), 223-249.
Rizova, E., Dimitrova, R. (2017). State and trends in the development of continuing vocational training. Economics and Management, Volume: XIII, Issue: 2, Year: 2017, pp. 165-184, ISSN (print): 1312-594Х, ISSN (online): 2367-7600
Rizova, E., Dimitrova, R. (2017). Social partnership in the field of continuing vocational training. Management and Sustainable Development, 3/2017 (64), pp. 12-16, ISSN 1311-4506 (print)
Schoen, L., & Fusarelli, L. D. (2008). Innovation, NCLB, and the fear factor: The challenge of leading 21st-century schools in an era of accountability. Educational Policy, 22(1), 181-203.
Serpell, R., & Adamson-Holley, D. (2017). African Socialization Values and Nonformal Educational Practices: Child Development, Parental Beliefs, and Educational Innovation in Rural Zambia. Laboring and Learning, 19-43.
Subramanian, A. M., Choi, Y. R., Lee, S. H., & Hang, C. C. (2016). Linking technological and educational level diversities to innovation performance. The Journal of Technology Transfer, 41(2), 182-204.
Thorsteinsson, G. (2014). Innovation education to improve social responsibility through general education. Tiltai, 61(4), 71-78.
Yamazumi, K. (2008). A hybrid activity system as educational innovation. Journal of Educational change, 9(4), 365-373.

197
Entrepreneurship ISSN: 2738-7402
DOI: 10.37708/ep.swu.v8i2.16 Volume: VІII, Issue: 2, Year: 2020, pp. 197-205
STRATEGIC MARKETING PLANNING IN THE PRESENT-DAY ORGANIZATION
Dilyana Yaneva1
Received: 10.10.2020, Accepted: 29.10.2020
Abstract
Looking for business sustainability in conditions of uncertainty, organizations must pay serious attention to strategic marketing planning. Achieving the strategic goals of the company is closely related to the adaptation to the dynamic market conditions. This necessitates an in-depth study of the specifics of the process including analysis and evaluation of the marketing environment factors, mission formulation, general and marketing goals setting, segmentation, market selection, positioning, development, selection, implementation and control of marketing strategies.
Keywords: strategic planning, marketing planning, strategic marketing planning, organization, development
JEL Codes: М10, М30, М31
Introduction
An important prerequisite for market success in modern organizations is the integration of marketing activity into the business. Its main component is the planning process. It “takes place in every area of an organization, must be coordinated and must be compatible with the overall mission and with corporate objectives and strategy” (Wrenn & Mansfield, 2014). In addition, company planning refers to the activities related to the definition of general objectives, analysis of trends in the development of the external environment and the definition of company resources and opportunities (Manov, 2001, p.23; Naydenov, 2020, p. 28).
It is clear that planning concerns the rationalization of the company's goals by exploiting company and market opportunities, anticipating, neutralizing or minimizing market risks and threats, overcoming company weaknesses. At the same time, the process contributes to the effective management of resources,
1 South-West University “Neofit Rilski”, Blagoevgrad, Faculty of Economics, Chief assist. prof., [email protected]; ORCID ID: https://orcid.org/0000-0003-3472-4595

198
coordination between functional areas and facilitation control over the implementation of all company activities.
Marketing planning, on the other hand, includes a set of methods, techniques and tools for segmentation and selection of target markets, formation of the marketing mix, definition of marketing policy, implementation and control of marketing activities. An important point is the impact on consumers and competitors. The intercultural connections between them are also highly effective in this regard (Trojanowski, 2014, p. 68; Kiryakova-Dineva & Hadzhipetrova-Lachova, 2017, p. 98).
According to some authors, marketing planning consists of two main phases - analytical and perspective (Mladenova, 2006, p. 32). Żyminkowska & Żyminkowski (2014) divide them into analytical and behavioral (p.672). However, a third group of authors incorporates a third dimension into the process – organizational, related to corporate culture, organizational structure, management style, processes and information flows (Piercy, 2002, p. 586; Harris, 1996, p.40; Gilligan & Wilson, 2012, p.58).We emphasize the importance of this stage, because in our opinion it reveals the value system and the views of senior management and employees, which inevitably has a significant impact on the competitiveness and development of the company.
These aspects are caused by the emergence of a new modification of internal planning and management in recent years - strategic planning (Veselinova, 2014, p.5). Its main objectives are to seek answers to the following questions:
• What is the desired state to which the organization aspires? • What are the main drivers of change? • What are the main ways - activities to reach the desired state? • Do the achieved results correspond to the set goals? It can be summarized that strategic planning is about outlining the direction
to achieve the goals by exploring alternatives, measuring results and creating values.
The purpose of the article is to present the characteristics of strategic
marketing planning and its importance for the prosperity of the modern organization.
199
Definition and role of strategic marketing planning
Strategic planning of marketing actions determines the need to take specific measures to identify the strengths of the company and opportunities, outlining key competencies and gaining a competitive advantage of the organization. It should not be neglected the threats from the external environment, which the company must constantly monitor, analyze and evaluate by adapting its activities to them.
A key role in the process is played by the formulation, evaluation and implementation of a marketing strategy, plan and programs. In this regard, Gilligan and Wilson (2012) support the thesis that strategic marketing planning covers a period of three to five-year period and it is “concerned with the development of strategies that are based on the planning team’s assessment of the market and perceptions of managerial expectations and organizational capability (p.44). According to Mladenova (2006), strategic marketing planning covers all levels of management and the main unit is the business level. Regarding the financial aspect, the author considers a number of financial indicators related to the expected financial results, the degree of risk, the necessary financial resources and the priorities for their distribution (p.22).
The literature review shows the diversity of the author's opinions regarding the technology of strategic marketing planning (Gilligan & Wilson, 2012, p.55; Drummond, Ensor & Ashford, 2007, p. 242-244; Mladenova, 1998, p. 21). According to a number of authors, the process includes analysis of the external and internal company environment, development of forecasts, definition of the mission and goals, choice of strategy, development of a strategic plan, implementation of plans, control (Madgerova, et al., 2012, p.110). Blagoev (1998) discusses the process in more detail, including the stages of presenting the results of marketing research, segmentation, selection of target market and positioning, strategic marketing analysis, SWOT analysis, marketing programs and budget of marketing activities (p.245).
Figure 1 illustrates the process algorithm which, in our opinion, includes the following seven main steps.
Stages and characteristics of strategic marketing planning
Mission is the general goal, which reveals the general strategic focus of the company. It is related to its history, activity, development guidelines, markets, customers, products. Its correct formulation will help not only to differentiate from competitors and orient to consumers, but also to identify employees with the company. Therefore, an important role here is the corporate culture, values,

200
organizational structure, management style, etc. In this regard, F. Kotler argues that the business mission is influenced by five main factors: company history, market environment, available resources, competitive advantages of the company and management team preferences (Kotler, 1997, p. 69)
Figure № 1. Algorithm of the strategic marketing planning process
Source: composed by the author
Present-day organizations must pay due attention to scientific, technological progress and innovations but they must also not forget the corporate social responsibility and implement it in the corporate mission. In this way, they will give meaning and value to consumers by fully meeting their needs.
There is a relationship between mission, goals and objectives (Rouillard, 2003, p.14). Strategic goal setting requires a clear definition of the direction of long-term development of the company by showing what should be the efforts of management. The process is related to the search for the desired company status based on analysis and forecasts of the environment, assessment of resources, organization activities, management functions, social corporate responsibility, collective goal setting, communication, hierarchical subordination, etc. The process technology includes defining and analyzing the factors and trends in the

201
external and internal company environment, determination of general goal and decomposed company goals and building a "tree of objectives".
For effective strategic marketing planning is necessary for businesses to know the characteristics and factors of external and internal marketing environment. Strategic marketing analysis occupies a key place here. It is a starting point for developing reliable marketing strategies and making the right strategic decisions. Its three main areas are related to the knowledge, definition, analysis and evaluation of:
• economic, demographic, social, technological, natural, environmental, political and other conditions;
• trends in the tastes and needs of consumers; competitors' goals, policies and strategies; relationships with suppliers, distributors, banking institutions, etc.;
• internal functional areas (production, finance, human resources, etc.) and their connection with the marketing process.
The literature review shows that the main methods of strategic planning are divided into the following areas:
• calculation-analytical (balance, normative, technical-economic); • graph-analytical (extrapolation, network, regression-econometric,
correlation); • economic-mathematical (linear, nonlinear and dynamic programming,
game theory, queuing); • heuristic (expert assessments, scenario method) (Brankova, 2009,
p.37). Among them, SWOT analysis, the model of Michael Porter and portfolio
models are the most widely used. Priority place in the process of strategic marketing planning is given to
segmentation, selection of target market and product positioning in the market. Customer focused companies master the flexibility and adaptability of their marketing activities and the decisions they have to make, thus forecasting their reaction and striving to better meet their needs. It is not only necessary to segment the market well and choose an effective market segment, but also to study consumer needs, to track behavior and seek their opinion, to create long-term and sustainable relationships and connections with them. That is why feedback plays an important role in this process.
Our opinion is that market segmentation goes through the following stages: • choice of market coverage approaches; • development of segmentation criteria; • determination of a leading criterion;
202
• developing alternative market segments; • analysis and evaluation of potential segments; • segment selection. Another important aspect of the market development process is product
positioning. The construction of a positive desired image in the minds of consumers is inevitably associated with the creation of uniqueness and sustainable competitive advantages of the product, brand and company. The main specific features of the positioning can be highlighted social status, importance, qualities, strengths and weaknesses, characteristics, price and value for the consumer (Harisson, 1987, p.7). Building such a concept is unthinkable without knowing and managing the factors that affect the process, positioning parameters, knowledge of competitors and their strategies, schemes and positioning strategies.
The marketing goals outline the ways to reach the defined directions for development, i.e. marketing activities to specify the expected results of marketing efforts. This stage serves as a basis for developing a marketing strategy. The main marketing decisions that need to be made concern the marketing tools and are related to market and business trends, factors of the marketing environment, current and future demand, sales volume, available resources, consumer needs, preferences and their dynamics. This type of goals must meet certain requirements such as accuracy, clarity, specificity, consistency, achievability, quantitative measurability, time measurability, interconnectedness with the general company goals, resource security, etc.
After completing the preparation of the entire process of strategic marketing planning, it can be proceed to the development of strategic alternatives, evaluation of alternatives and choice of strategy. Proposal formulation is based on marketing analyzes, formulated corporate and marketing goals, available resources, budget, expected results, etc. Using a rich set of models, methods, approaches, financial and non-financial indicators, the strategic effectiveness of the options is assessed. We believe that the methods Balanced Scorecard, Skandia Navigator and Performance Prism are extremely suitable. At the same time, tactical marketing tools such as a marketing plan and programs should be developed, on the basis of which the activities, responsibilities, resources, funds, etc. will be distributed.
The implementation and control of the chosen strategy requires the creation of certain conditions for its organizational provision, understanding and perception of human resources in the organization, making adjustments if necessary. An important condition is to constantly monitor the state and dynamics

203
of the environment and the results achieved by adopting appropriate behavior and adequate monitoring measures.
Ferrell and Hartline (2007) have made a significant contribution to the research. They adopt four techniques for implementing the marketing strategy:
x "by command" - by imposing a strategy by senior management; • "through change" - the company changes its activities so as to adapt to
the chosen strategy; • "by consensus" - joint development of the strategy and determination
of the ways for its implementation by the managers of all functional areas of the company;
• "organizational culture" - aims to be perceived by all employees (p.325 -326).
Supporting the opinion of Jaworski, we believe that the control process is divided into formal and informal. The first type consists of control activities initiated by the management process and it is incoming, processing and outgoing. At the same time, the informal concerns control activities initiated by the employees, including: self-control of the employees, social control and cultural control (cited by Ferrell & Hartline, 2007, p. 330).
Conclusions
Strategic marketing planning as a philosophy of thinking and a basic management function outlines the activities for achieving the general and marketing goals of the company in a long term. The process analyzes the situation, anticipates the changes, coordinates the activities and functions and formulates the adaptation or change. In order to improve the company's competitiveness and development opportunities, organizations need to study and know this process in depth.

204
REFERENCES
Blagoev, V. (1998). Marketing. Sofia: VEKKO.
Brankova, B. (2009). Methods and models for strategic decisions in the management of production enterprises, Yearbook of the University of Mining and Geology "St. Ivan Rilski”, 52, IV: Humanities and Economics, Sofia: University of Mining and Geology Publishing House, 37-41.
Drummond, G., Ensor, J. & Ashford, R. (2007). Strategic Marketing: Planning and Control. Routledge.
Ferrell, O. & Hartline, M. (2007). Marketing Strategy. Cengage Learning.
Gilligan, C. & Wilson, R. (2012). Strategic Marketing Planning. Burlington: Routledge.
Harris, L. (1996). The application of Piercy and Morgan`s dimensions of marketing planning, Management Decision, 34 (3), 35-40.
Harisson, T. (1987). Handbook of Advertising Techniques. London: Kogan Page.
Kiryakova-Dineva, T. & Hadzhipetrova-Lachova, М. (2017). Intercultural management - aspects and perspectives for the business practice of the organization, Entrepreneurship Journal, V (1), 97-105.
Kotler, P. (1997). Marketing management: analysis, planning, implementation and control. Prentice Hall, Upper Saddle River.
Madgerova, R. et al. (2012). Organization and management of small business. Blagoevgrad: Langov.
Manov, V. (2001). Forecasting and planning the development and functioning of economic systems. Sofia: University for national and world economy Publishing House.
Mladenova, G. (2006). Marketing planning. Sofia: University for national and world economy Publishing House.
Mladenova, G. (1998). Strategic Marketing Planning. Sofia: University for national and world economy Publishing House.
Naydenov, N. (2020). Forecasting and planning. Sofia: University for national and world economy Publishing House.
Piercy, N. (2002). Market-Led Strategic Change. Transforming the Process of Going to Market. Butterworh-Heinemann.
Rouillard, L. (2003). Goals and Goal Setting: Achieving Measured Objectives. USA: Cengage Learning.

205
Trojanowski, T. (2014). Culture of Marketing Actions of a Company in the Area of Sustainable Marketing Mix, Journal of Intercultural Management, 6(4-2), 67-74.
Veselinova, N. (2014). Marketing planning process in conditions of uncertainty of the environment, E-Journal VFU, 7, Varna: Varna Free University Publishing House, 1-14.
Wrenn, B. & Mansfield, Ph. (2014). Marketing Planning Guide. Routledge.
Żyminkowska, K. & Żyminkowski, T. (2014). Analytical and behavioural elements of marketing planning model – empirical evidence from Polish firms, International journal of economic practices and theories, 4 (5), 668 – 676.

206
Entrepreneurship ISSN: 2738-7402
DOI: 10.37708/ep.swu.v8i2.17 Volume: VІII, Issue: 2, Year: 2020, pp. 206-220 SCORE CARDS FOR EVALUATION OF RFI AND RFP
PROCESSES WITHIN ONE OF THE BULGARIAN TELECOMMUNICATION OPERATORS
Avgustin Milanov1
Received: 05.09.2020, Accepted: 27.09.2020
Abstract
The present paper regards some the score cards as a possible tool for measurement and evaluation of the risk in the “Request for Information” (RFI) and “Request for Proposal” (RFP) processes in the supply chain at the Bulgarian mobile telecommunication operators. The presented hereby score cards use measurement and calculations of the risk based on the risk calculation equation in which the assumption is that each risk event or risk action “m” can be regarded as function of the likelihood of occurrence, the consequences and the imminence in regards to the time horizon for the occurrence of the very same risk event or risk action “m”. Further to these components, the risk equation in use also takes into account the space in which the risk occurs and itself, as well as the size of the actions for prevention and overcoming of the risks that can appear at a certain organizational level. The data collected for the score cards is being provided by an online survey through the staff dealing with the RFI and RFP processes within the regarded in particular Bulgarian telecommunication operator. The final information from both the survey and the score cards is being processed and turned into a specific set of numeric coefficients that represent the contribution and the value of the separate risk components. Methods for defining the thresholds for acceptance of the levels of the risks are also suggested.
Keywords: score cards, supply chain management, risk management, risk evaluation, RFI and RFP process, telecommunication operators
JEL Codes: L93, O18, F47
1. Introduction
The present paper regards some the score cards as a possible tool for measurement and evaluation of the risk in the “Request for Information” (RFI) and “Request for Proposal” (RFP) processes in the supply chain at the Bulgarian
1Department of Economics, Faculty of Economics, South-West University “Neofit Rilski”, PhD candidate, e-mail: [email protected], ORCID ID: https://orcid.org/0000-0002-9968-7273

207
mobile telecommunication operators. These approaches include measurement and calculations of the risk based on the use of risk calculation equation and questionnaire surveys and follow-up score cards. The proposed in the paper risk calculation equation is based on the assumption that each risk event or risk action “m” can be regarded as function of the likelihood of occurrence, the consequences and the imminence in regards to the time horizon for the occurrence of the very same risk event or risk action “m”. Further to these components, the risk equation in use also takes into account the space in which the risk occurs and develops itself, as well as the size of the actions for prevention and overcoming of the risk at the certain organizational level. The data collected from the questionnaire surveys and score cards are being processed and turned into a specific set of numeric coefficients that represent the contribution and the value of the separate risk components. Methods for defining the thresholds for acceptance of the levels of the risks are also suggested. The present paper regards also several more specific problems in the application of the risk measurement and evaluation the RFI and RFP process in supply chain of the Bulgarian mobile telecommunication operators such the use of the risk evaluation for the point of time when the forecasts of the major indicators of the RFI RFP processes suggest a major future decline.
2. Literature review and some basic concept notes
The present paper’s approach for the risk measurement and evaluation, which differs significantly to the one used in the traditional financial management, dates back to 1989 when it was proposed by R. N. Charrette for the purposes of software engineering risk analysis and management. What Charrette proposed was actually to measure the risk by the use of the following risk assessment and evaluation equation:
(1.) R(m)=L(m)×C(m)×I(m), Where: L(m) is the likelihood of occurrence of the risk event or action “m”; C(m) stands the consequences from the occurrence of the risk event or
action “m”, and I(m) is the imminence for of the risk event or action “m” in regards to the
time horizon.

208
The problem of risk measurement and evaluation in RFI and RFP in the mobile telecommunication operators is a part of the broader problem of measuring the risk at business process level within the organizations. All business processes produce certain risks (Reilly et al., 2016), which are usually regarded by managers in terms of technical performance, cost, and schedule. In a more holistic approach, the risks within the organization are also regarded as “business risks”. And according to a survey conducted once by “Arthur Anderson” and “The Economist” and cited by Turner and Hunsucker, “business risk” is defined as, “the threat that an event or action will adversely affect the organizations ability to achieve its business objectives and execute its strategies effectively” (“The Economist”). Having into consideration the concept of the “Request For Information” (RFI) and “Request for Proposal” (RFP) processes in the supply chain at the mobile telecommunication operators as business risks, one can easily apply many of the existing (financial by the nature) methodologies for quantifying and measuring the business risks and their components. Most of these methodologies, however, suffer, from one main disadvantage: they present risk either as a standard deviation of a certain indicator across an average value, or present some understanding for the risk components which is not clearly explicit and/or does not include all of these very same risk components. The present paper adapts focuses on a particular methodology for measuring the occupational health and safety risks in tourism companies by numerical risk coefficients and use of risk evaluation score cards. Beside the initial work or R. N. Cahrette, this methodology was thoroughly explained also by John V. Turner and John L. Hunsucker in an article named “Effective risk management: a global based approach”, published in “International Journal of Technology Management”. It includes the achievements of several US and international research and innovation development programs, such as:
“SSP” (“Space Shuttle Program); “ISSP” (“International Space Station Program); “F/A-18” (a project of the US Department of Defense); and “AFMC” (US Air Force Material Command). Later on, this methodology was adapted and implemented for the needs of
risk management within the innovation process of the Bulgarian travel and tourism companies, mainly from the sub-sector of the hotel industry in regards to the risk management in tourism innovation processes and risk management in health and safety in tourism companies. The adapted by Dimitrov model for the risk evaluation and assessment in the hotel industry based on variables of the likelihood (Lm) of occurrence of the risk event or action “m”, the consequences

209
(Cm) from the occurrence of the risk event or action “m”, and imminence (Im) for of the risk event or action “m” in regards to the time horizon was enhances by A. Hristozova in 2012 for the needs of the insurance activities in the travel and tourism industry by adding a component regarding the space of the risk event or action.
(2) R(m)=L(m)×C(m)×I(m)×S(m) A similar methodology was also presented in 2003 by Dimitar Dimitrov
and Erdoan Hadzhiev for the need of the risks analysis on the working place and in the labor processes in the transport sector. Dimitrov and Hadziev’s methodology differs from Turner and Hunsucker’s concept only in the names of the main variables comprising the risk function and in the scaling of these variables which will be explained further on. They also propose a ready to use questionnaire for the purposes of the transport sector in Bulgaria instead of developing of an Integrated Risk Consequences Scorecard.
3. Methodology and main results
For the needs of the research that stands for the present paper, as well as taking into account of the extremely dynamic development of the sector of the mobile telecommunication operators both globally and in Bulgaria, and the resulting from this dynamic development of their supply chains, it becomes necessary the suggest by Charrette, Turner & Hunsucker, Dimitrov and Hristozova risk assessment and evaluation equation to be modified significantly. This modification refers to adding two more components, two more variables that influence with a negative sign the value of the risks with the businesses processes. These two components are the scale of the actions for the risk preventions and the risk aversions (Pr (m) and the scale of overcoming the consequences of the risks in case of their occurrence. In this regards, the risk assessment and evaluation equation, wherein the variables are being calculated by the use of scorecards, finally result in the following mathematical notation (3):
(3) R(m)=L(m)×C(m)×I(m)×S(m)-P(m)×O(m).
This modified risk equation plays a central role in construction of the methodology of the survey, the results of which are being reported in the present paper. As for the separate stages of the survey itself they are seven in number, as

210
follows: (i) an online questionnaire to be answered and filled in by the employers engaged in the two departments involved heavily in the RFI and RFP processes: (ii) a follow-up scorecard resulting survey for each of the components (variables) of the risk assessment and evaluation equation; (iii) calculation of the value of the risk in the RFI and RFP processes; (iv)applying of criteria for acceptance or non-acceptance of the RFI and RFP connected business risks; (v) taking of “Go / Not go decisions” for the usual flow of the RFI and RFP processes; (vi) forecasting the parameters of the usual flow of the RFI and RFP processes; and (vii) anticipating and planning the next measurement, assessment and evaluation and the “Go / Not Go” decision points. These very same seven stages represent a process not only for measurement, assessment and evaluation of the risks in RFI and RFP processes in the supply chain of one of the Bulgarian mobile telecommunication operators, but an overall pro-active risk management concept aimed at managing, averting, reducing and anticipating the respected business risks (Figure 1).
The pro-activeness of the suggested risk management concept is the presence of “Go / Not Go” decisions points in line with forecasting of the main parameters of the usual flow of the RFI and the RFP processes in order to anticipate the needs for next risk measurement, assessment and evaluation and next “Go/ Not Go“ decision points. Here, it has to be pointed out that this concepts steps to the modular approach for risk management in development of new products suggested by R. G. Cooper and R. A. More (Cooper & More, 1997) and it develop further this very same approach by adding the forecasting component.
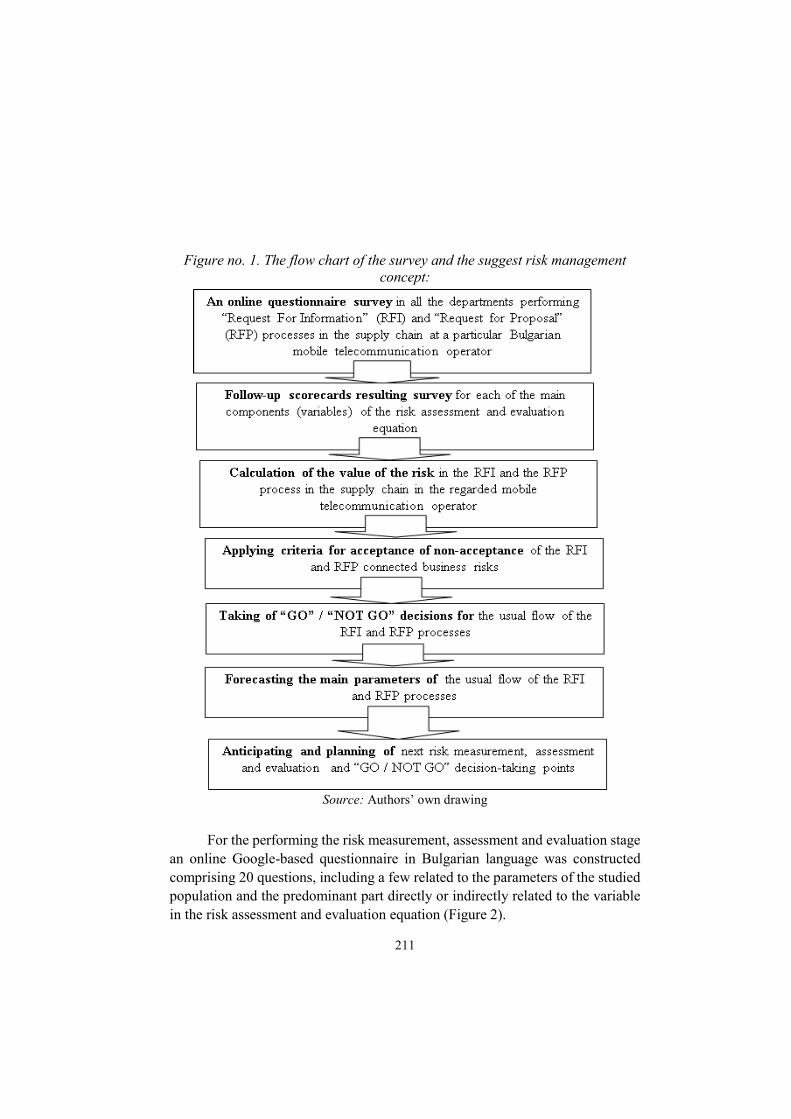
211
Figure no. 1. The flow chart of the survey and the suggest risk management concept:
Source: Authors’ own drawing
For the performing the risk measurement, assessment and evaluation stage
an online Google-based questionnaire in Bulgarian language was constructed comprising 20 questions, including a few related to the parameters of the studied population and the predominant part directly or indirectly related to the variable in the risk assessment and evaluation equation (Figure 2).
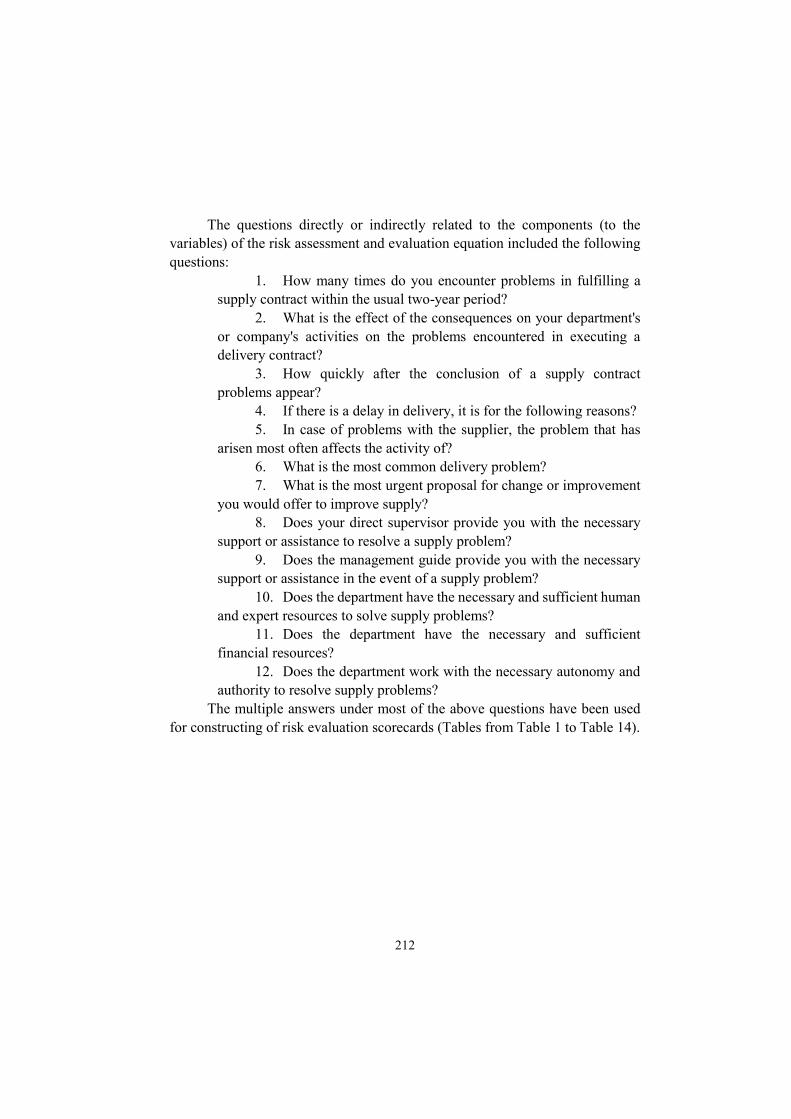
212
The questions directly or indirectly related to the components (to the variables) of the risk assessment and evaluation equation included the following questions:
1. How many times do you encounter problems in fulfilling a supply contract within the usual two-year period?
2. What is the effect of the consequences on your department's or company's activities on the problems encountered in executing a delivery contract?
3. How quickly after the conclusion of a supply contract problems appear?
4. If there is a delay in delivery, it is for the following reasons? 5. In case of problems with the supplier, the problem that has
arisen most often affects the activity of? 6. What is the most common delivery problem? 7. What is the most urgent proposal for change or improvement
you would offer to improve supply? 8. Does your direct supervisor provide you with the necessary
support or assistance to resolve a supply problem? 9. Does the management guide provide you with the necessary
support or assistance in the event of a supply problem? 10. Does the department have the necessary and sufficient human
and expert resources to solve supply problems? 11. Does the department have the necessary and sufficient
financial resources? 12. Does the department work with the necessary autonomy and
authority to resolve supply problems? The multiple answers under most of the above questions have been used
for constructing of risk evaluation scorecards (Tables from Table 1 to Table 14).
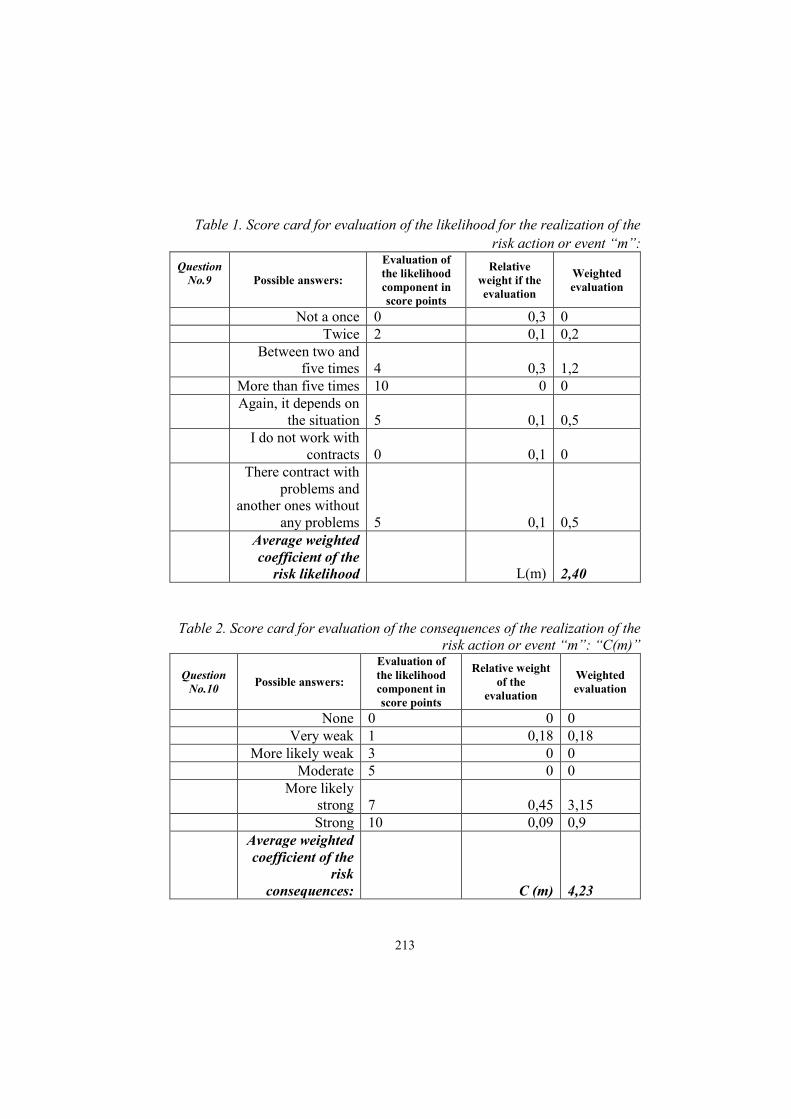
213
Table 1. Score card for evaluation of the likelihood for the realization of the risk action or event “m”:
Table 2. Score card for evaluation of the consequences of the realization of the risk action or event “m”: “C(m)”
Question No.9
Possible answers:
Evaluation of the likelihood component in score points
Relative weight if the evaluation
Weighted evaluation
Not a once 0 0,3 0 Twice 2 0,1 0,2 Between two and
five times 4 0,3 1,2 More than five times 10 0 0 Again, it depends on
the situation 5 0,1 0,5 I do not work with
contracts 0 0,1 0 There contract with
problems and another ones without
any problems 5 0,1 0,5 Average weighted
coefficient of the risk likelihood
L(m) 2,40
Question No.10 Possible answers:
Evaluation of the likelihood component in score points
Relative weight of the
evaluation
Weighted evaluation
None 0 0 0 Very weak 1 0,18 0,18 More likely weak 3 0 0 Moderate 5 0 0
More likely
strong 7 0,45 3,15 Strong 10 0,09 0,9
Average weighted coefficient of the
risk consequences: С (m) 4,23
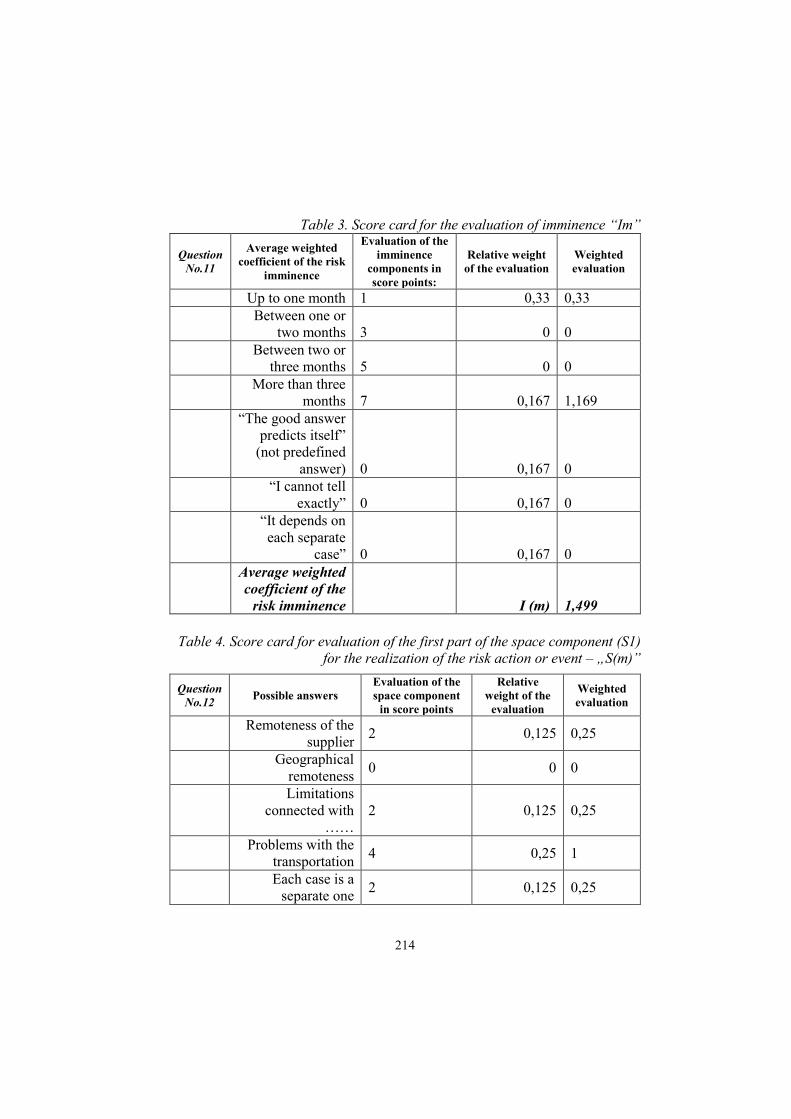
214
Table 3. Score card for the evaluation of imminence “Im”
Table 4. Score card for evaluation of the first part of the space component (S1)
for the realization of the risk action or event – „S(m)”
Question No.11
Average weighted coefficient of the risk
imminence
Evaluation of the imminence
components in score points:
Relative weight of the evaluation
Weighted evaluation
Up to one month 1 0,33 0,33
Between one or
two months 3 0 0
Between two or
three months 5 0 0
More than three
months 7 0,167 1,169
“The good answer predicts itself”
(not predefined answer) 0 0,167 0
“I cannot tell
exactly” 0 0,167 0
“It depends on each separate
case” 0 0,167 0
Average weighted coefficient of the
risk imminence I (m) 1,499
Question No.12 Possible answers
Evaluation of the space component
in score points
Relative weight of the
evaluation
Weighted evaluation
Remoteness of the
supplier 2 0,125 0,25
Geographical
remoteness 0 0 0
Limitations connected with
…… 2 0,125 0,25
Problems with the
transportation 4 0,25 1
Each case is a
separate one 2 0,125 0,25
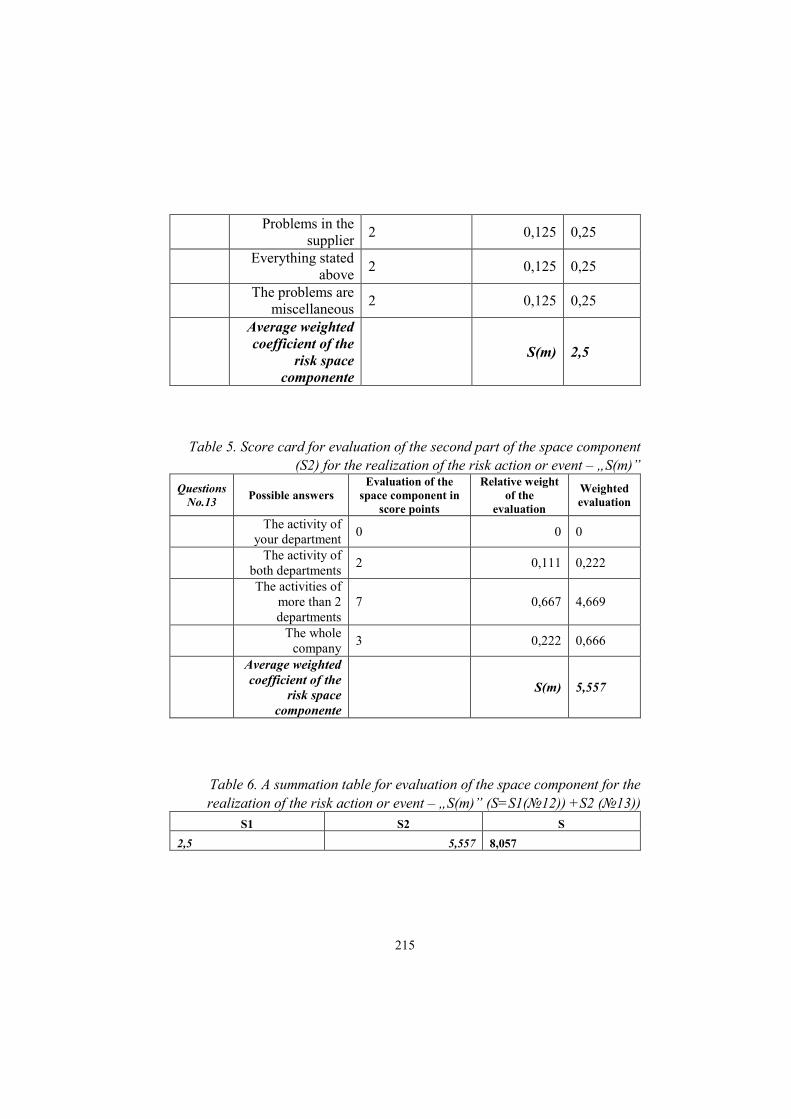
215
Table 5. Score card for evaluation of the second part of the space component (S2) for the realization of the risk action or event – „S(m)”
Table 6. A summation table for evaluation of the space component for the realization of the risk action or event – „S(m)” (S=S1(№12)) +S2 (№13))
S1 S2 S 2,5 5,557 8,057
Problems in the
supplier 2 0,125 0,25
Everything stated
above 2 0,125 0,25
The problems are
miscellaneous 2 0,125 0,25
Average weighted coefficient of the
risk space componente
S(m) 2,5
Questions No.13 Possible answers
Evaluation of the space component in
score points
Relative weight of the
evaluation
Weighted evaluation
The activity of
your department 0 0 0
The activity of
both departments 2 0,111 0,222
The activities of more than 2 departments
7 0,667 4,669
The whole
company 3 0,222 0,666
Average weighted coefficient of the
risk space componente
S(m) 5,557
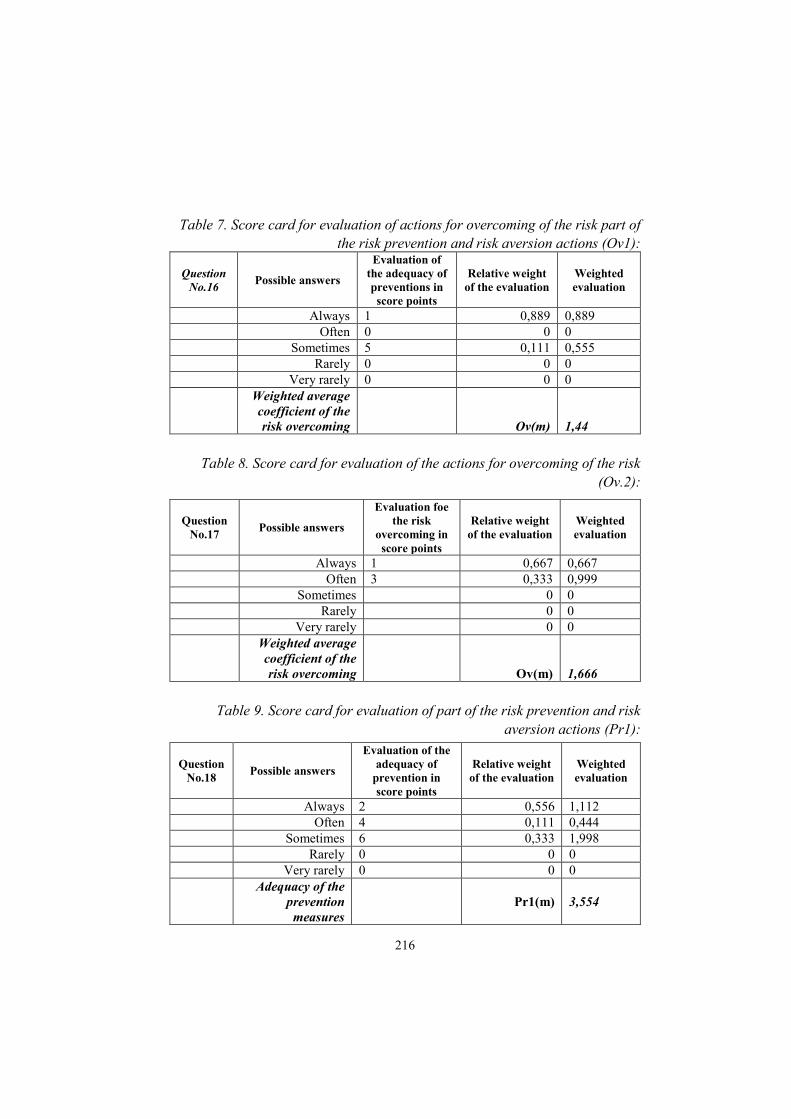
216
Table 7. Score card for evaluation of actions for overcoming of the risk part of the risk prevention and risk aversion actions (Ov1):
Table 8. Score card for evaluation of the actions for overcoming of the risk
(Ov.2):
Table 9. Score card for evaluation of part of the risk prevention and risk
aversion actions (Pr1):
Question No.16 Possible answers
Evaluation of the adequacy of preventions in score points
Relative weight of the evaluation
Weighted evaluation
Always 1 0,889 0,889 Often 0 0 0 Sometimes 5 0,111 0,555 Rarely 0 0 0 Very rarely 0 0 0
Weighted average coefficient of the risk overcoming Ov(m) 1,44
Question No.17 Possible answers
Evaluation foe the risk
overcoming in score points
Relative weight of the evaluation
Weighted evaluation
Always 1 0,667 0,667 Often 3 0,333 0,999 Sometimes 0 0 Rarely 0 0 Very rarely 0 0
Weighted average coefficient of the risk overcoming Ov(m) 1,666
Question No.18 Possible answers
Evaluation of the adequacy of
prevention in score points
Relative weight of the evaluation
Weighted evaluation
Always 2 0,556 1,112 Often 4 0,111 0,444 Sometimes 6 0,333 1,998 Rarely 0 0 0 Very rarely 0 0 0
Adequacy of the prevention measures
Pr1(m) 3,554

217
Table 10. Score card for evaluation of part of the risk prevention and risk aversion actions (Pr2):
Questions No. 19 Possible answers
Evaluation of the adequacy of
the risk prevention measures in score points
Relative weight of the
evaluation
Weighted evaluation
Always 1 0,111 0,111 Often 2 0,222 0,444 Sometimes 5 0,333 1,665 Rarely 7 0,111 0,777 Very rarely 0 0 0
Scattered distribution of
answers 2 0,111 0,222
No 10 0,111 1,11
Adequacy of the prevention
measures and actions
Pr(m) 4,329
Table 11. Score card for evaluation of the actions for overcoming of the risk (Ov.3):
Question No.20 Possible answers
Evaluation of the adequacy of
prevention in score points
Relative weight of the evaluation
Weighted evaluation
Always 1 0,1 0,1 Often 3 0,6 1,8 Sometimes 5 0,1 0,5 Rarely 7 0,1 0,7 Very rarely 9 0,1 0,9 Risk overcoming Ov(m) 4
Table 12. Score card summation table for evaluation of the action on the risk prevention and aversion Pr(m) = 𝑃r(m)1(No.18))+𝑃𝑟(m)2(No.19))
Pr(m)1 Pr(m)2 Pr(m)
3,554 4,329 7,883

218
Table 13. Score card summation table for evaluation of the actions on overcoming of the risk consequences in case of its realization Ov(m),
(𝑚))=Question No.(16)+Question No.(17)+Question No.(20)
Table 14. Table of the final evaluation of the risk with the date from the questionnaire survey R(m)= L(m)*C(m)*I(m)*S(m)-(Pr(m)*Ov(m)):
L(m) C(m) I(m) S(m) Pr(m) Ov(m) R(m)
2,40 4,23 1,499 8,06 7,883 7,11 66,56207
Based on results from the questionnaire survey and the follow-up scorecard resulting survey, a calculation of the value of the business risk or business risks can be performed by the use of the risk assessment and evaluation equation:
(4) R(m)=L(m)×C(m)×I(m)×S(m)-(Pr(m)×Ov(m)),
Where: Weighted average risk probability coefficient L (m) =2, 40 Consequences C (m) =4.23 Imminence I (m) =1.499 Spatial component S (m) =8.57 The risk prevention component Pr (m) =3.554 The risk overcoming component Ov (m) =7,883
The overall risk (R (m)) calculation achieved by a direct substitution in the equation of the above-listed variables is as follows (See also Table 14):
R (m) = L (m)*C (m)*I (m)*S (m)-(Pr (m)*Ov (m)) =
= 2.40*1.499*1.499*8.57-3.554*7.833=102.4007754.
4. Conclusion
The presented methodology for risk assessment and evaluation and the overall concept for risk management by the use of digital risk evaluation coefficients has led to a significant improve in the performance of the departments within the Bulgarian mobile telecommunication operator in concern
Question No.16 Question No.17 Question No.20 Ov(m) 1,444 1,666 4 7,11
219
with the supply chain management and with the RFI and RFP processes in particular. The mere fact of taking into consideration that the everyday business risk may be numerically measured has led to a decrease in the level of risks and the “GO / NOT TO GO” decision-taking point have added to the improved of the risk reduction, risk aversion, risk transfer and risk prevention actions with the company. The forecasting of appropriate moments for “GO / NOT TO GO” decision-taking points on the basis of the minimums of the main parameters of the RFI and the RFP processes have also added to the further refining of the suggested risk management implementation model.
References:
Brinkley, R. & Stone, D. (1996). International Space Station Program Directive – Program Risk Management Emphasis System”, ISS-PD-011, NASA, Johnson Space Center, Houston, Texas, USA.
Brooks, W. M. (1994). Project Risk Management (a presentation given at Johnson Space Center, May 9-11, 1994), Johnson Space Center, and Huston, Texas, USA.
Brown, R. G. (1959). Statistical Forecasting for Inventory Control. New York: McGraw-Hill.
Charette, R. N. (1989). Software Engineering Risk Analysis and Management, New York, USA: Intertext Publications, McGraw-Hill Book Company.
Chatfield, C. &Yar, M. (1988). Holt-Winters forecasting: Some practical issues. The Statistician, 37, pp. 129-140.
DeLurgio, S. A. (1998). Forecasting Principles and Applications. Pennsylvania State University: Irwin/McGraw-Hill.
Dimitrov, D. & Hadzhiev, E. (2003). Analysis of Place of Work and Labour Process Risk in Transport. Scientific Journal “Mechanics, Transport, Communication”, Issue: 1/2003, Article No. 0007, Retrieved January 21, 2019 from http://www.mtc-aj.com
Dimitrov, P. (2003). Risk Management in Tourism Innovations. Sofia, Bulgaria: Heron Press.
Dimitrov, P. (2006). Tourism Innovations. Blagoevgrad, Bulgaria: “Neofit Rilski” University Press.
Dimitrov, P. (2009). Measuring occupational health and safety risks in tourism companies. EgeAkademikBakışDergisi, Turkey.
Hamilton, J .D. (1994). Time Series Analysis. Princeton, NJ: Princeton University Press.
220
Hayan, J. A. (1996). F/A-18 “Risk management plan”, Report MDC 960074, McDonnel Douglas Aerospace, St. Luis, USA
Holt, C. C. (1957). Forecasting trends and seasonals by exponentially weighted averages, O.N.R. Memorandum 52/1957, Carnegie Institute of Technology.
Hyndman, R. J., Koehler, A.B., Ord, J.K. & Snyder, R.D. (2008). Forecasting with Exponential Smoothing – The State Space Approach. Berlin: Springer.
The Economist (1996). A Game of Risk – The Economist Survey, Corporate Risk Management, 10th February, 1996;