Embed Size (px)
Citation preview

Entertainment One Ltd. Annual Report and Accounts 2015
Entertainment O
ne Ltd. Annual Report and Accounts 2015

CONTENTSHighlights ...........................................................................................................................................................1Chairman’s statement ...................................................................................................12Chief Executive’s review ........................................................................................14Business review
Film ..............................................................................................................................................................18Television .......................................................................................................................................23
Financial review...........................................................................................................................29Principal risks and uncertainties ........................................................33Corporate responsibility .......................................................................................36Corporate governance .............................................................................................40Board of Directors ..............................................................................................................42Corporate governance report ................................................................44Audit Committee ..................................................................................................................49Nomination Committee .......................................................................................55Directors’ remuneration report ...........................................................57Directors’ report .......................................................................................................................76 Independent auditor’s report .....................................................................79Consolidated financial statements..............................................82Company information ............................................................................................ 128 Visit our website entertainmentone.com
Entertainment One’s goal is to bring the best content to the world by:– being a true partner to the best creative talent– being the world’s leading independent distributor
through a locally-deep, globally-connected networkEntertainment One’s updated strategy aims to double the size of the Group in the next five years.
YEARONE

HIGHLIGHTS
FINANCIAL HIGHLIGHTS
2015 has been a significant year for the Group with acquisitions and strategic investments, helping to ensure that it is in an excellent position to deliver its ambitious growth targets.
AUGUST 2014Acquisition of
Force Four Entertainment
JANUARY 2015Acquisition of stake in
The Mark Gordon Company
NOVEMBER 2014Growth strategy update
JUNE 2014 Acquisition of Phase 4 Films
JULY 2014Acquisition of
Paperny Entertainment
MAY 2014Strategic investment in
Secret Location
eOne Annual Report and Accounts 2015 | 1
REVENUE
£785.8m£793.5m (pro forma)
-5% (2014: £823.0m) -4% (2014 pro forma: £829.6m)
PROFIT BEFORE TAX
£44.0m£88.8m (adjusted)
+105% (2014: £21.5m) +13% (2014 adjusted: £78.4m)
ADJUSTED NET DEBT
£224.9m+£113.8m (2014: £111.1m)
UNDERLYING EBITDA
£107.3m£117.2m (pro forma)
+16% (2014: £92.8m) +11% (2014 pro forma: £105.3m)
ADJUSTED FULLY DILUTED EARNINGS PER SHARE
23.7 pence+13% (2014: 20.9 pence)
DIVIDEND
1.1 pence+10% (2014: 1.0 pence)
STRATEGIC
REPORT
CO
RPORATE G
OVERN
ANC
EFIN
ANC
IAL STATEMEN
TS

LEVERAGING SCALE AND REACH
GROUPONE
YUKON GOLDTHE HIT SHOW IS NOW IN ITS FOURTH SERIES AND IS SOLD IN OVER 140 TERRITORIES GLOBALLY.
2 | entertainmentone.com
Entertainment One is one of the major independent producers of television content commissioned primarily by the North American broadcast networks. This content is then sold through our in-house television sales teams to over 500 broadcasters in 150 territories globally.
Our Family operations sit within the Television Division, with our children’s properties spearheaded by Peppa Pig, one of the world’s leading pre-school brands. In addition to Peppa Pig, we own a number of launched and developing children’s brands.
FilmEntertainment One is a market leader in the territories where we operate, including Canada, the US, the UK, Spain, Australia/New Zealand and the Benelux.
In addition, through eOne Features, we use our scale to produce and sell a small number of titles every year, enabling us to participate in a film’s global success with no change in overall risk profile.
37%of pro forma Film Distribution revenue through broadcast and digital platforms
Television
A GROWING CONTENT PORTFOLIO
40,000+ film and television titles
4,500+ hours of television programming
OUR GROUPWe source, select and sell entertainment content rights across all media platforms globally. We offer investors an attractive and risk mitigated way to benefit from the long-term trend of rising consumer demand for film and television content. Through critical mass and scale Film is now poised to generate strong cash flows and Television is in a market where structural changes are creating significant growth opportunities.
72%
28%
2015 PRO FORMA REVENUE
2015 PRO FORMA UNDERLYING EBITDA
2015 PRO FORMA INVESTMENT IN AQUIRED CONTENT AND PRODUCTIONS
59%
41%
62%
38%
£793.5m
£117.2m
£285.5m600+ Family licensing agreements globally Film
Television
STRATEGIC
REPORT
CO
RPORATE G
OVERN
ANC
EFIN
ANC
IAL STATEMEN
TS
eOne Annual Report and Accounts 2015 | 3

BUILDING A GROUP OF GLOBAL PRESENCE
WORLDONE
GENERATED OVER US$1 BILLION OF RETAIL SALES IN 2015.
4 | entertainmentone.com

GLOBAL HIGHLIGHTS
eOne territories1. Canada2. United Kingdom3. Benelux4. Spain5. United States6. Australia/New Zealand
eOne partners7. France8. Germany9. Scandinavia10. South Africa
US$801m
CONTENT LIBRARY VALUATION
23%
DIGITAL REVENUES AS A PROPORTION OF TOTAL GROUP
£785.8m
EXTERNAL REVENUES BY GEOGRAPHIC SEGMENT
OUR GLOBAL FOOTPRINTWe are extending our reach into new geographies and enhancing our product offering across many markets, through multiple delivery channels. We are well placed globally to maximise opportunities from a growing demand for quality content.
1 2
45
6
9
7
8
10
3
US$XXXm
20142013201220112010
650
801
220 25
0 350
US$XXXm
20152014201320122011
23
21
16
1413
External Revenue by Geographic segments
Canada UKUSEuropeROW
33%
25%19%
14%
9%
STRATEGIC
REPORT
CO
RPORATE G
OVERN
ANC
EFIN
ANC
IAL STATEMEN
TS
eOne Annual Report and Accounts 2015 | 5
BRINGING THE BEST CONTENT TO THE WORLD
FOCUSONE
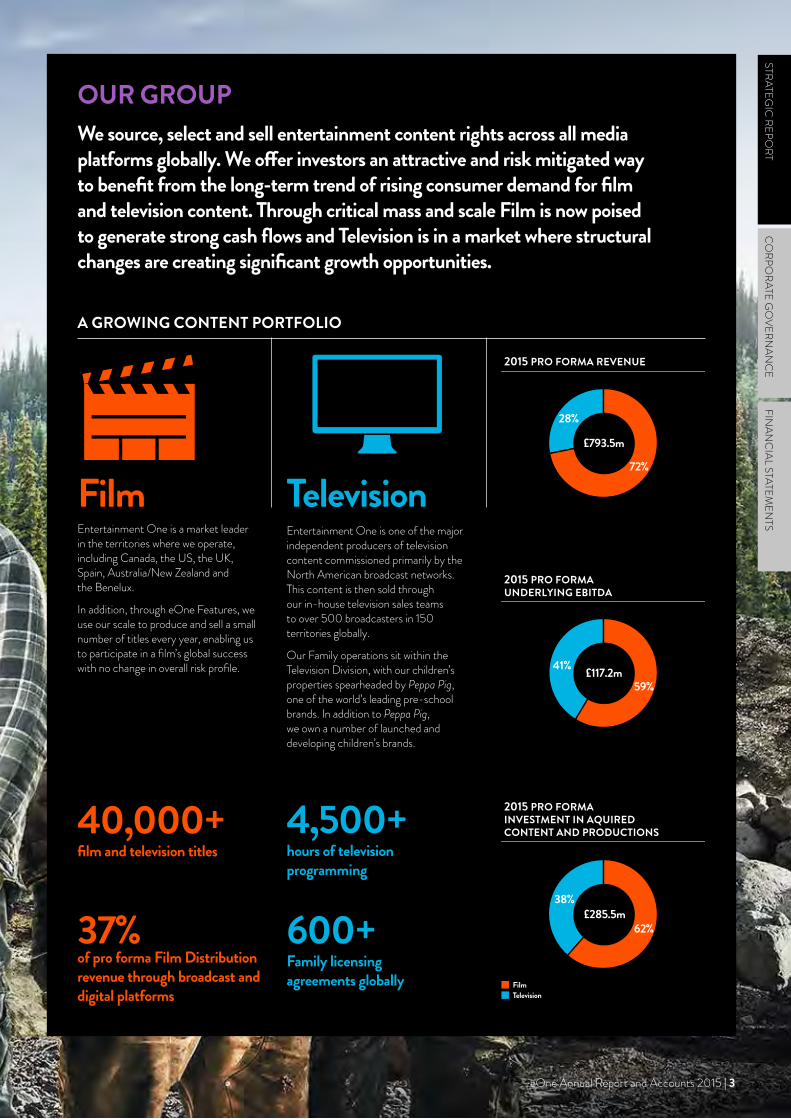
MR. TURNERACHIEVED £7 MILLION AT THE UK BOX OFFICE AND WAS NOMINATED FOR FIVE BAFTAS AND FOUR OSCARS.
6 | entertainmentone.com
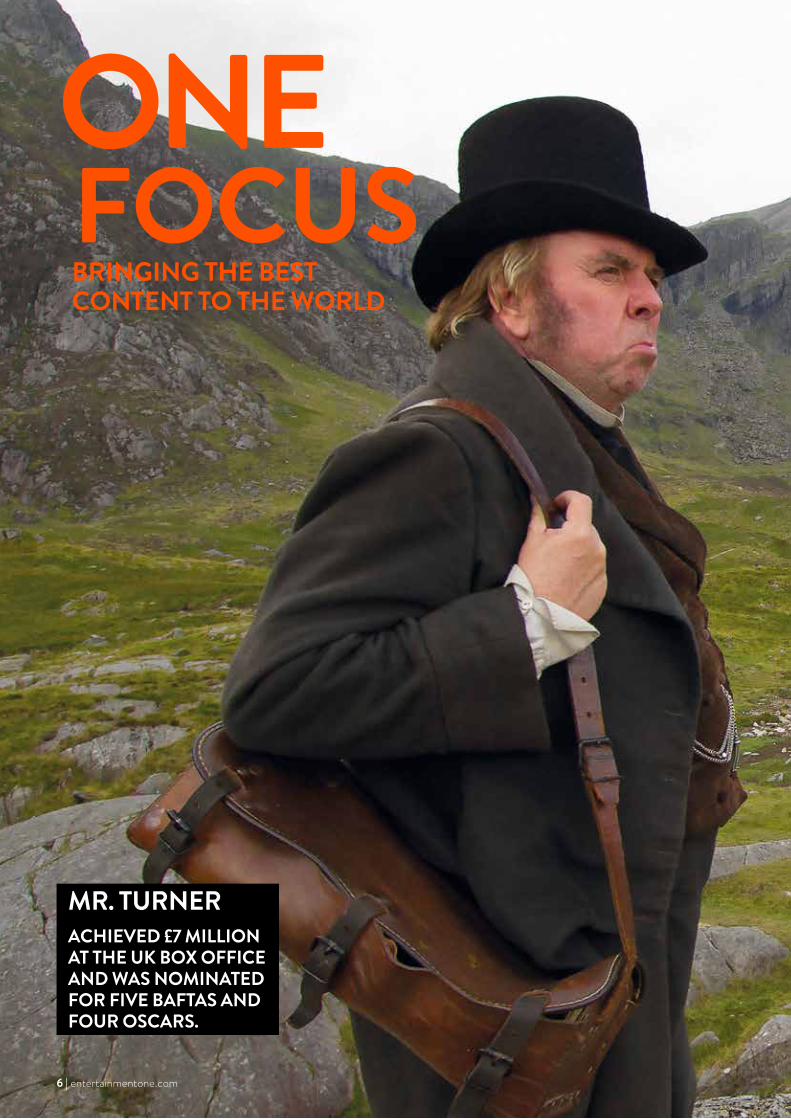
OUR BUSINESS MODEL AND STRATEGYFollowing a period of sustained growth in size and value, we refreshed and updated our strategy in the year. We will continue to drive economies of scale, take advantage of growing consumer content platforms and focus on producing the best content in high value genres. By partnering with the best creative talent and aiming to be the world’s leading independent distributor, we intend to double the size of the Group within the next five years.
The detailed strategy is presented in the Chief Executive’s review on pages 14-17.
SCALEREAC
H
CONNECT WITH CREATIVE TALENT
PRODUCE / ACQUIRE GLOBAL RIGHTS
SOURCE:
SELECT:
SELL:
A TRUE PARTNER TO THE BEST CREATIVE
TALENT
THE WORLD’S LEADING INDEPENDENT
DISTRIBUTOR
CINEMA RETAILER BROADCASTER DIGITAL
STRATEGIC
REPORT
CO
RPORATE G
OVERN
ANC
EFIN
ANC
IAL STATEMEN
TS
eOne Annual Report and Accounts 2015 | 7

DOUBLING THE SIZE OF THE GROUP WITHIN FIVE YEARS
GOALONE
THE HUNGER GAMES: MOCKINGJAY – PART 1ACHIEVED US$337m GLOBAL BOX OFFICE REVENUES.
8 | entertainmentone.com
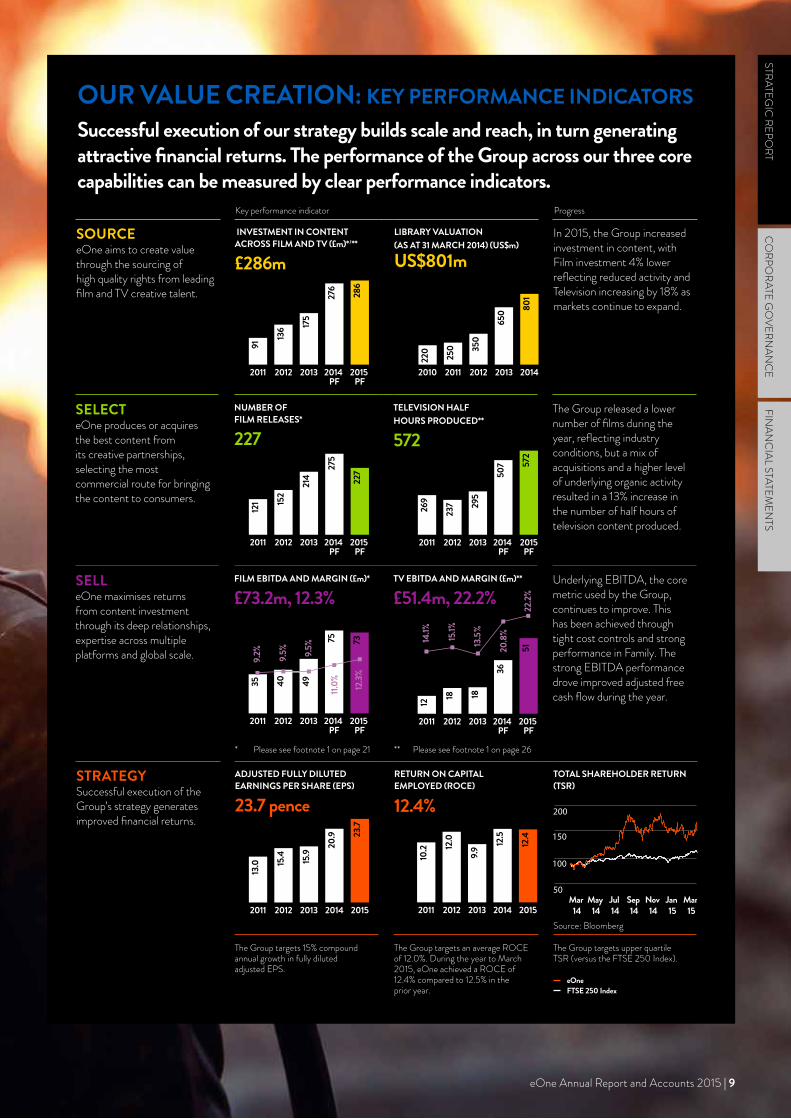
OUR VALUE CREATION: KEY PERFORMANCE INDICATORSSuccessful execution of our strategy builds scale and reach, in turn generating attractive financial returns. The performance of the Group across our three core capabilities can be measured by clear performance indicators.
Key performance indicator Progress
SOURCE eOne aims to create value through the sourcing of high quality rights from leading film and TV creative talent.
INVESTMENT IN CONTENT ACROSS FILM AND TV (£m)*/**
£286m
LIBRARY VALUATION (AS AT 31 MARCH 2014) (US$m) US$801m
In 2015, the Group increased investment in content, with Film investment 4% lower reflecting reduced activity and Television increasing by 18% as markets continue to expand.
STRATEGYSuccessful execution of the Group’s strategy generates improved financial returns.
ADJUSTED FULLY DILUTED EARNINGS PER SHARE (EPS)
23.7 pence
RETURN ON CAPITAL EMPLOYED (ROCE)
12.4%
TOTAL SHAREHOLDER RETURN (TSR)
The Group targets 15% compound annual growth in fully diluted adjusted EPS.
The Group targets an average ROCE of 12.0%. During the year to March 2015, eOne achieved a ROCE of 12.4% compared to 12.5% in the prior year.
The Group targets upper quartile TSR (versus the FTSE 250 Index).
SELECTeOne produces or acquires the best content from its creative partnerships, selecting the most commercial route for bringing the content to consumers.
NUMBER OF FILM RELEASES*
227
TELEVISION HALF HOURS PRODUCED**
572
The Group released a lower number of films during the year, reflecting industry conditions, but a mix of acquisitions and a higher level of underlying organic activity resulted in a 13% increase in the number of half hours of television content produced.
SELL eOne maximises returns from content investment through its deep relationships, expertise across multiple platforms and global scale.
FILM EBITDA AND MARGIN (£m)*
£73.2m, 12.3%TV EBITDA AND MARGIN (£m)**
£51.4m, 22.2%Underlying EBITDA, the core metric used by the Group, continues to improve. This has been achieved through tight cost controls and strong performance in Family. The strong EBITDA performance drove improved adjusted free cash flow during the year.
Mar 14
May 14
Jul 14
Sep 14
Nov 14
Jan 15
Mar 15
50
100
150
200
eOneFTSE 250 Index
2015 PF
2014 PF
201320122011
91
136 17
5
276
286
2015 PF
2014 PF
201320122011
121 15
2
214
275
227
2015 PF
2014 PF
201320122011
359.
2% 9.5% 9.
5%
11.0% 12
.3%40 49
75 73
2015 PF
2014 PF
201320122011
1214
.1%
15.1%
13.5
%
20.8
%
22.2%
18 18
36
51
20152014201320122011
13.0 15
.4 15.9
20.9 23
.7
20142013201220112010
220 250 35
0
650 80
1
2015PF
2014 PF
201320122011
269
237 29
5
507 57
2
20152014201320122011
10.2 12
.0
9.9 12
.5
12.4
* Please see footnote 1 on page 21 ** Please see footnote 1 on page 26
Source: Bloomberg
STRATEGIC
REPORT
CO
RPORATE G
OVERN
ANC
EFIN
ANC
IAL STATEMEN
TS
eOne Annual Report and Accounts 2015 | 9

CHIEF EXECUTIVE OFFICER DARREN THROOP
Appointed in 2003, Darren is an innovative global entrepreneur with 20 years of senior management experience in the entertainment industry.
CHIEF FINANCIAL OFFICER GILES WILLITS
Formerly director of group finance at J Sainsbury plc, Giles held a number of financial and operational management roles within Woolworths plc, Kingfisher plc and Sears plc.
DELIVERING THE GROWTH STRATEGY
TEAMONE
10 | entertainmentone.com
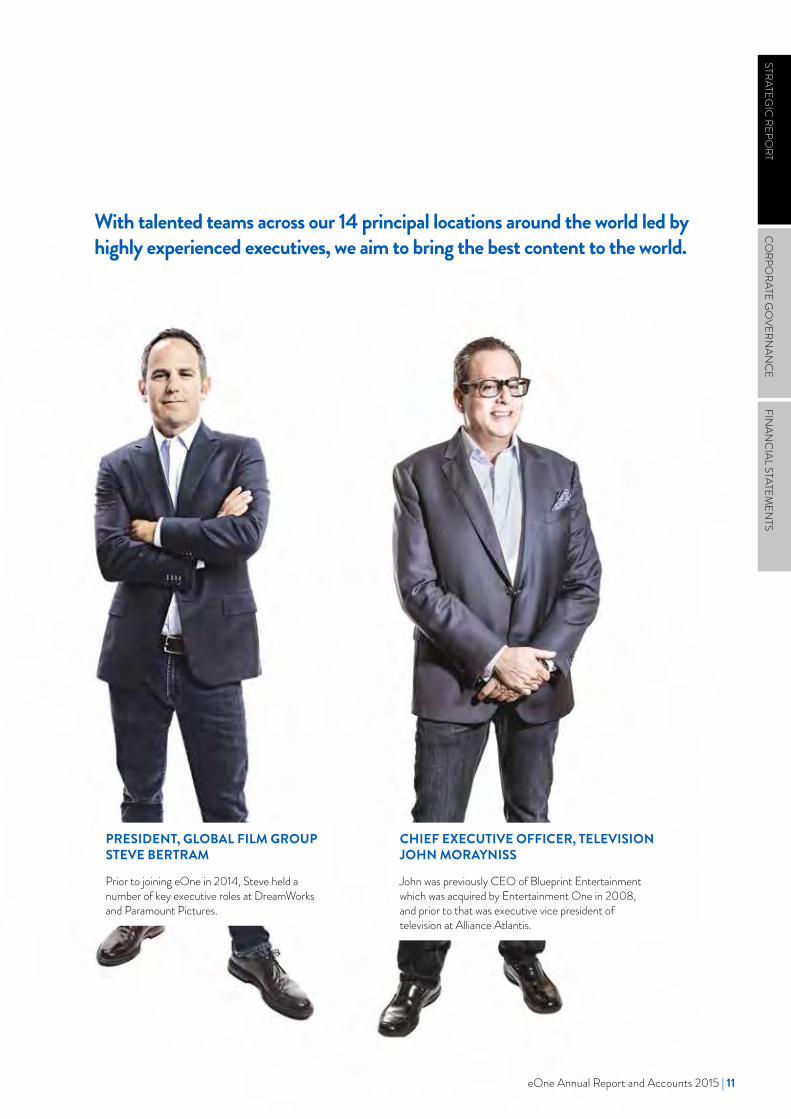
With talented teams across our 14 principal locations around the world led by highly experienced executives, we aim to bring the best content to the world.
PRESIDENT, GLOBAL FILM GROUP STEVE BERTRAM
Prior to joining eOne in 2014, Steve held a number of key executive roles at DreamWorks and Paramount Pictures.
CHIEF EXECUTIVE OFFICER, TELEVISION JOHN MORAYNISS
John was previously CEO of Blueprint Entertainment which was acquired by Entertainment One in 2008, and prior to that was executive vice president of television at Alliance Atlantis.
STRATEGIC
REPORT
CO
RPORATE G
OVERN
ANC
EFIN
ANC
IAL STATEMEN
TS
eOne Annual Report and Accounts 2015 | 11
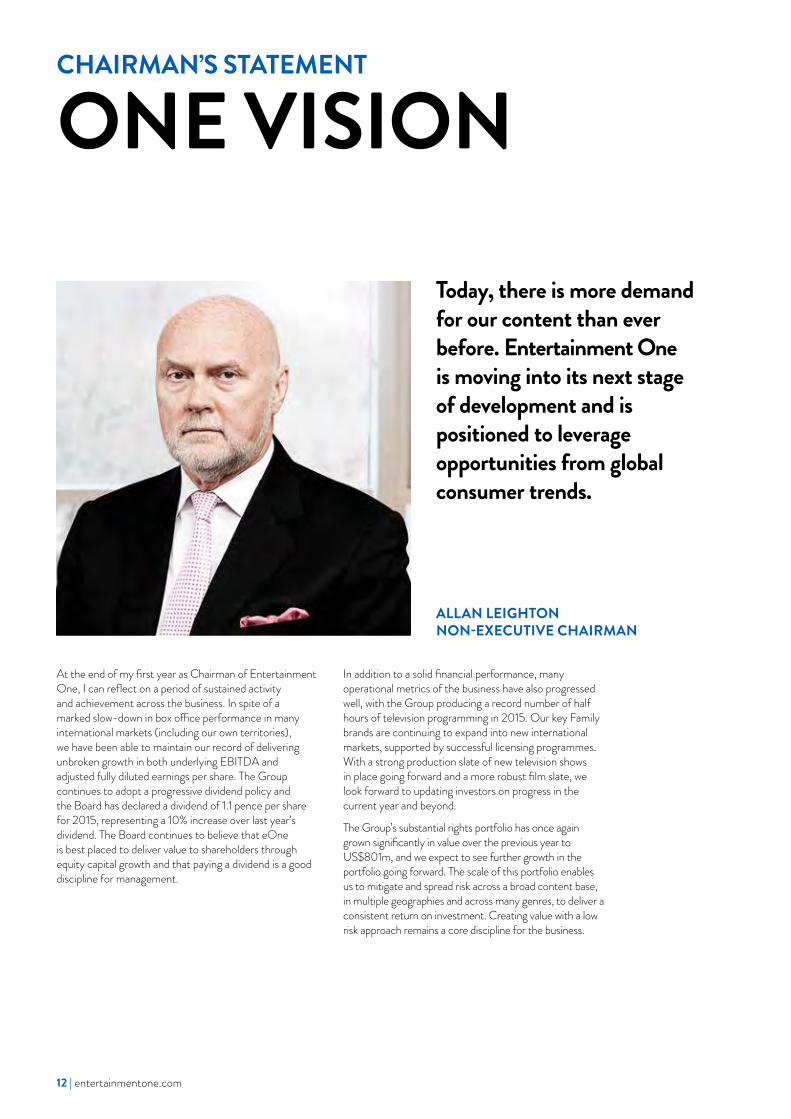
CHAIRMAN’S STATEMENT
ONE VISION
Today, there is more demand for our content than ever before. Entertainment One is moving into its next stage of development and is positioned to leverage opportunities from global consumer trends.
ALLAN LEIGHTON NON-EXECUTIVE CHAIRMAN
At the end of my first year as Chairman of Entertainment One, I can reflect on a period of sustained activity and achievement across the business. In spite of a marked slow-down in box office performance in many international markets (including our own territories), we have been able to maintain our record of delivering unbroken growth in both underlying EBITDA and adjusted fully diluted earnings per share. The Group continues to adopt a progressive dividend policy and the Board has declared a dividend of 1.1 pence per share for 2015, representing a 10% increase over last year’s dividend. The Board continues to believe that eOne is best placed to deliver value to shareholders through equity capital growth and that paying a dividend is a good discipline for management.
In addition to a solid financial performance, many operational metrics of the business have also progressed well, with the Group producing a record number of half hours of television programming in 2015. Our key Family brands are continuing to expand into new international markets, supported by successful licensing programmes. With a strong production slate of new television shows in place going forward and a more robust film slate, we look forward to updating investors on progress in the current year and beyond.
The Group’s substantial rights portfolio has once again grown significantly in value over the previous year to US$801m, and we expect to see further growth in the portfolio going forward. The scale of this portfolio enables us to mitigate and spread risk across a broad content base, in multiple geographies and across many genres, to deliver a consistent return on investment. Creating value with a low risk approach remains a core discipline for the business.
12 | entertainmentone.com
During the year we also made important strategic progress. After a period of sustained growth since the Group’s listing in the UK in 2007, in November 2014 we set out an updated growth strategy for the next five years, aiming to double the size of the Group by 2020. To support this plan, we have already completed and integrated three acquisitions, made two strategic investments and made senior executive hires across Film and Television.
During the year there have been no changes to the eOne Board of Directors. However, the executive team has been strengthened to enable the Group to execute its strategy effectively. In particular Steve Bertram, a highly-respected and experienced film executive who has worked at senior levels in DreamWorks and Paramount, joined as President of the Group’s Global Film Group. I also welcome the teams from Phase 4 Films, Paperny Entertainment and Force Four Entertainment, our latest acquisitions, and the teams from Secret Location and The Mark Gordon Company (MGC) to the Group.
As ever, none of the performance we have seen throughout the year would have been possible without the dedication and professionalism of our people at all levels throughout the organisation. I would like to thank them for their hard work and professionalism.
Finally, I would like to thank our shareholders for their ongoing support. We look forward to the current year with confidence, anticipating further growth and exciting opportunities in existing and new markets.
ALLAN LEIGHTON NON-EXECUTIVE CHAIRMAN
After a period of sustained growth since the Group’s UK listing in 2007, in November 2014 we set out an updated growth strategy.
STRATEGIC
REPORT
CO
RPORATE G
OVERN
ANC
EFIN
ANC
IAL STATEMEN
TS
eOne Annual Report and Accounts 2015 | 13

It’s been a year of significant progress. Our strong operating results have positioned us as category leaders. With favourable market conditions, we are well placed to continue on our strategic journey.
Great content is at the heart of Entertainment One. Consumer demand for high quality content continues to grow, with a variety of digital media platforms emerging to service this demand. As these platforms enhance their offerings and reach a wider global audience, we anticipate that audiences will increasingly focus on the quality of the content that they consume, gravitating towards premium television series, films and speciality genres. This market dynamic plays to eOne’s strengths and supports our aim to double the size of the Group within five years.
DARREN THROOP CHIEF EXECUTIVE OFFICER
CHIEF EXECUTIVE’S REVIEW
ONE JOURNEY
14 | entertainmentone.com
STRONG FINANCIAL PERFORMANCEThe Group has delivered a strong financial performance in the financial year, with Group underlying EBITDA up 16% to £107.3 million (up 11% to £117.2 million on a pro forma basis) and Group profit before tax doubling to £44.0 million (up 13% to £88.8 million on an adjusted basis).
Fully diluted earnings per share is up 104% to 14.3 pence per share (up 13% to 23.7 pence per share on an adjusted basis) and the business has seen significantly improved cash conversion, with adjusted free cash flow increasing to £41.0 million (2014: £18.8 million).
Group revenues were 5% lower at £785.8 million (down 4% to £793.5 million on a pro forma basis).
Our operational metrics have continued to improve, with 572 half hours of new programming delivered and over 850 half hours expected for next year. There has been solid growth in the international sales business and we have completed significant new deals with digital platforms.
The Group delivered 227 theatrical releases with underlying EBITDA in Film stable, despite declining revenue. This year has also seen the launch of eOne Features, focused on production and international sales, which reflects the growing slate of eOne productions for the financial years ahead.
DECLARATION OF DIVIDENDThe directors have declared a 10% increase in the final dividend for 2015 to 1.1 pence per share, reflecting our progressive dividend policy.
STRATEGIC PROGRESS eOne has come a long way in the last five years and is proud to have delivered significant growth and substantial shareholder value to investors over this period. Since 2010, Group revenues have doubled, underlying EBITDA has more than trebled and adjusted fully diluted earnings per share has doubled.
Looking ahead, the Board continues to see significant opportunity for further growth and in November 2014 set new targets through its new growth strategy which aims to bring the best content to the world by:
– being a true partner to the best creative talent – being the world’s leading independent distributor
through a locally-deep, globally-connected network
The strategy focuses on building a more balanced content and brand business which will see significant revenue growth in the Television Division in both Production & Sales and Family, while Film continues to focus on improving its operating margins.
This strategy is underpinned by detailed organic growth plans and supported by targeted acquisitions.
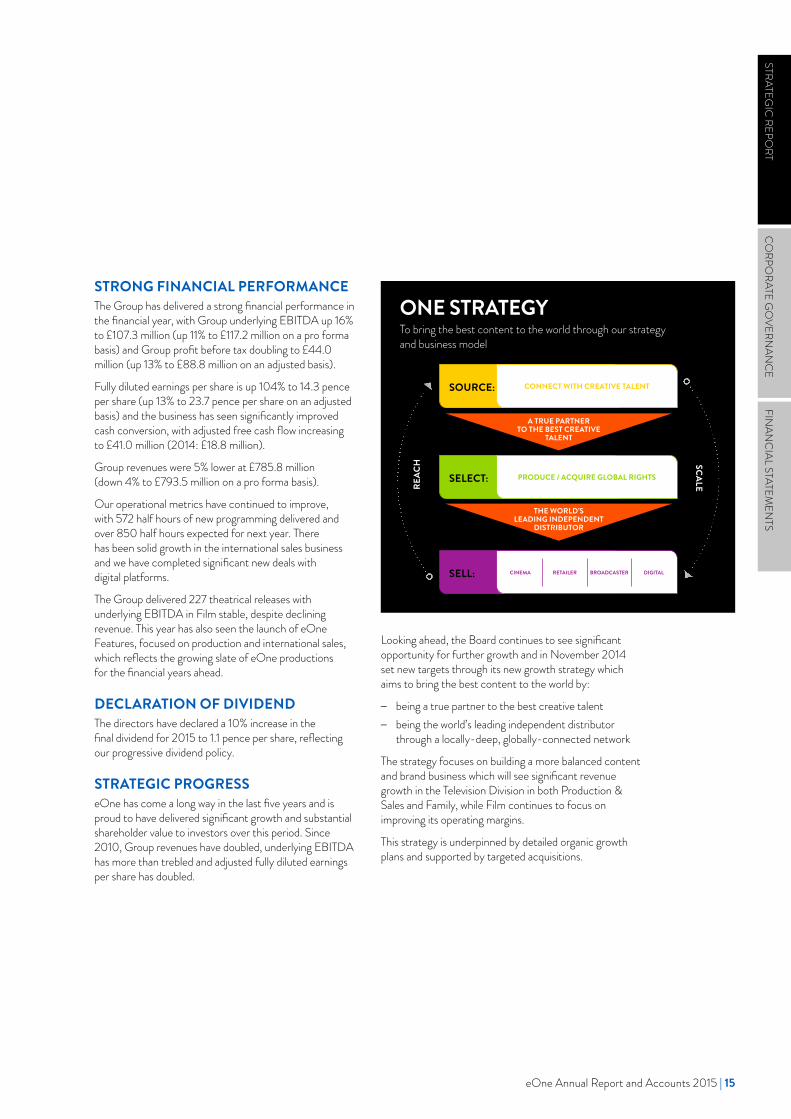
ONE STRATEGYTo bring the best content to the world through our strategy and business model
SCALEREAC
H
CONNECT WITH CREATIVE TALENT
PRODUCE / ACQUIRE GLOBAL RIGHTS
SOURCE::
SELECT:
SELL:
A TRUE PARTNER TO THE BEST CREATIVE
TALENT
THE WORLD’S LEADING INDEPENDENT
DISTRIBUTOR
CINEMA RETAILER BROADCASTER DIGITAL
STRATEGIC
REPORT
CO
RPORATE G
OVERN
ANC
EFIN
ANC
IAL STATEMEN
TS
eOne Annual Report and Accounts 2015 | 15
SCALE CREATES COMPETITIVE ADVANTAGEScale remains a critical differentiator in the content markets and, as one of the largest independent content companies, Entertainment One can take advantage of the benefits this critical mass brings to drive the Group’s financial performance. As our profile continues to strengthen, we are better able to attract and partner with more of the world’s best creative talent to produce the best content for distribution across our global network, which drives an improved financial return for the Group.
PORTFOLIO APPROACH MITIGATES INVESTMENT RISKTo mitigate concentration risk and changing audience tastes, the Group diversifies its content investment over a large number of films and television shows, across different geographies, different genres and across different media platforms. This approach means that there is no significant individual investment risk in its content acquisitions. The Group’s content portfolio comprises over 40,000 film and television titles, 4,500 hours of television programming and 45,000 music tracks.
FILMIn Film, there has been significant success in developing closer relationships with creative talent and in the last twelve months the Group has entered into new partnerships with film makers including Open Road, Endurance Media, Rumble Films, Hammer Films and The Ink Factory, with additional producer partnerships currently being negotiated. Further, the partnership with MGC brings new film projects and the studio has a number of film productions underway including the biopic Steve Jobs at Universal and Arms and the Dudes at Warner Bros.
eOne Features is the umbrella for eOne’s production and international sales business and has been successful in developing a production slate which will deliver exciting new film projects to the Group in the 2016 financial year.
CHIEF EXECUTIVE’S REVIEW CONTINUED
TELEVISIONDuring the 2015 financial year, the Group strengthened its reality television business with the acquisitions of television production companies Paperny Entertainment and Force Four Entertainment, which have extended the Group’s capabilities in non-scripted entertainment programming and diversified the base of the production business. Together, these companies produce over 200 half hours of content a year in genres such as documentaries, comedies and reality television.
The Group’s acquisition of a 51% stake in MGC in January 2015, which significantly increased the profile of the Group in the US, the largest global television production market, brought one of the world’s most prolific and successful producers of television and film content to eOne.
In addition, the deal provides eOne with exclusive rights to distribute all new content from MGC on a worldwide basis. Through the acquisition, the Group also benefits from the cash generation of the company’s existing content library, which includes titles such as Grey’s Anatomy, Criminal Minds and Ray Donovan.
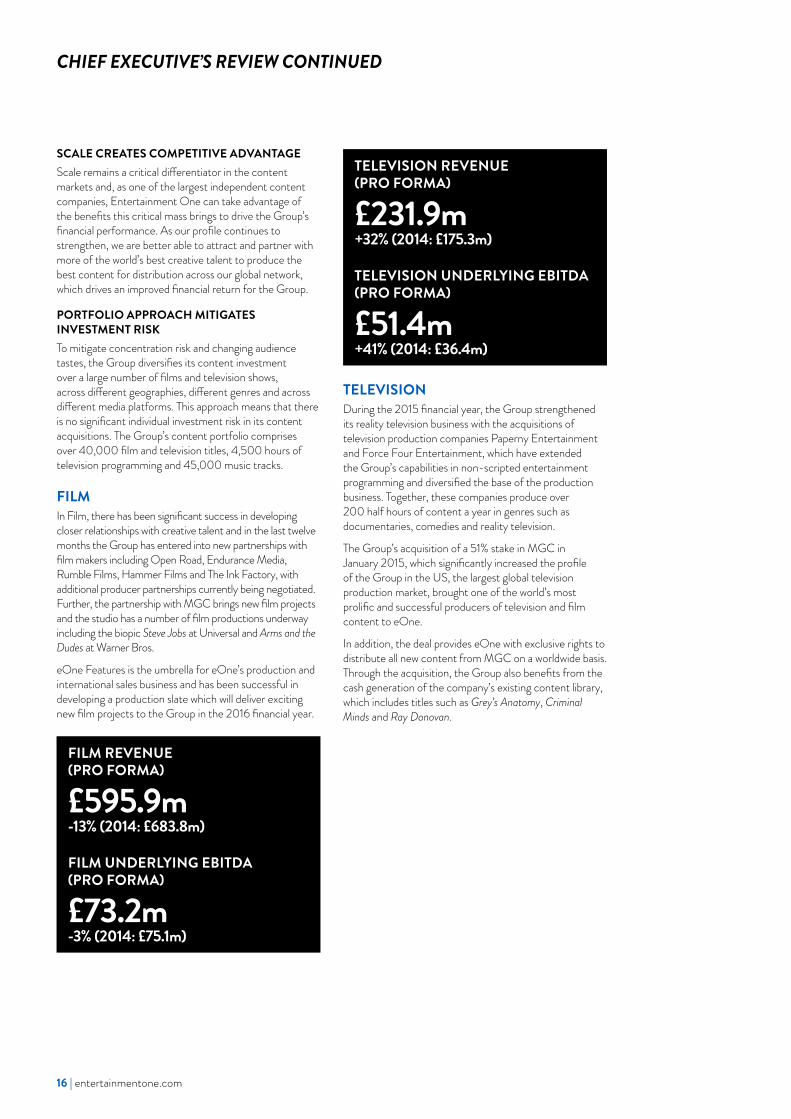
FILM REVENUE (PRO FORMA)
£595.9m-13% (2014: £683.8m)
FILM UNDERLYING EBITDA (PRO FORMA)
£73.2m-3% (2014: £75.1m)
TELEVISION REVENUE (PRO FORMA)
£231.9m+32% (2014: £175.3m)
TELEVISION UNDERLYING EBITDA (PRO FORMA)
£51.4m+41% (2014: £36.4m)
16 | entertainmentone.com
Since the acquisition, two new series have been green-lit by major US networks for first seasons: Quantico on ABC and Criminal Minds: Beyond Borders on CBS. These represent the first two shows from a significant slate of programmes currently under development.
Further, the Group announced that to enhance the operation of MGC, in partnership with Mark Gordon, changes in the shareholder agreement have been agreed that result in a change in the accounting treatment for the venture. As a result, from 19 May 2015, MGC will be fully consolidated in eOne’s financial statements as a subsidiary, rather than being treated as a joint venture. The change in accounting treatment delivers a pro forma increase of £8.9 million to the Group’s underlying EBITDA, with the overall pro forma contribution of MGC amounting to £18.2 million, representing 100% of the EBITDA of MGC in the current financial year. The effect of this change is to increase, for comparative purposes, the Group’s pro forma underlying EBITDA to £126.1 million in the current financial year.
FAMILYFamily & Licensing continues to perform very strongly with continued success for Peppa Pig, where the franchise generated over US$1 billion of retail sales in the current financial year. eOne owns half of the property’s underlying rights, but controls the worldwide exploitation of the brand. Traditional European markets have continued to perform well and the roll-out of the brand internationally has expanded into new markets in Latin America and the Far East. Peppa Pig ended the year with over 600 licensing deals globally.
DIGITALThe Group derives a significant proportion of its revenue from the sale of its film and television content digitally. In the current financial year digital revenues represented 23% of pro forma Group revenues (2014: 21%).
During the year, the Group increased its traction in the digital space by entering into a joint venture with digital agency, Secret Location. The company creates interactive experiences to launch content digitally to enable consumers to interact with both the Group’s and third party programming in a more engaging way. Secret Location is also producing original scripted series for digital platforms, and it provides the Group with the optimum vehicle to explore opportunities in the digital space and take advantage of the structural changes in the industry.
OUTLOOKThe Television Production & Sales operation will be further enhanced by the first full year contributions from Paperny Entertainment and Force Four Entertainment and anticipates producing over 850 half hours of content for distribution through the Group’s global sales network in the new financial year. This will be supported by the AMC output deal and other third party television content deals.
Family continues to focus on building Peppa Pig into the most loved pre-school property in the world while continuing to develop and build new brands across the Family portfolio, including Ben & Holly’s Little Kingdom.
As the film market continues to recover in 2015, driven by a strong slate from the major studios, a pick-up is expected in the Group’s box office performance. The Film Division plans to release over 250 films in the next financial year, in line with its profile of annual investment of up to £200 million in new film content over the next three to five years. This consistent profile of investment is anticipated to drive significant cash generation in the coming years.
The growth in the market for content rights is underpinned by changes in the way content is being consumed. eOne’s strategy to focus on growth through content ownership puts it at the centre of this positive structural change and the directors look forward to the new financial year with confidence.
DARREN THROOP CHIEF EXECUTIVE OFFICER
STRATEGIC
REPORT
CO
RPORATE G
OVERN
ANC
EFIN
ANC
IAL STATEMEN
TS
eOne Annual Report and Accounts 2015 | 17
18 | entertainmentone.com
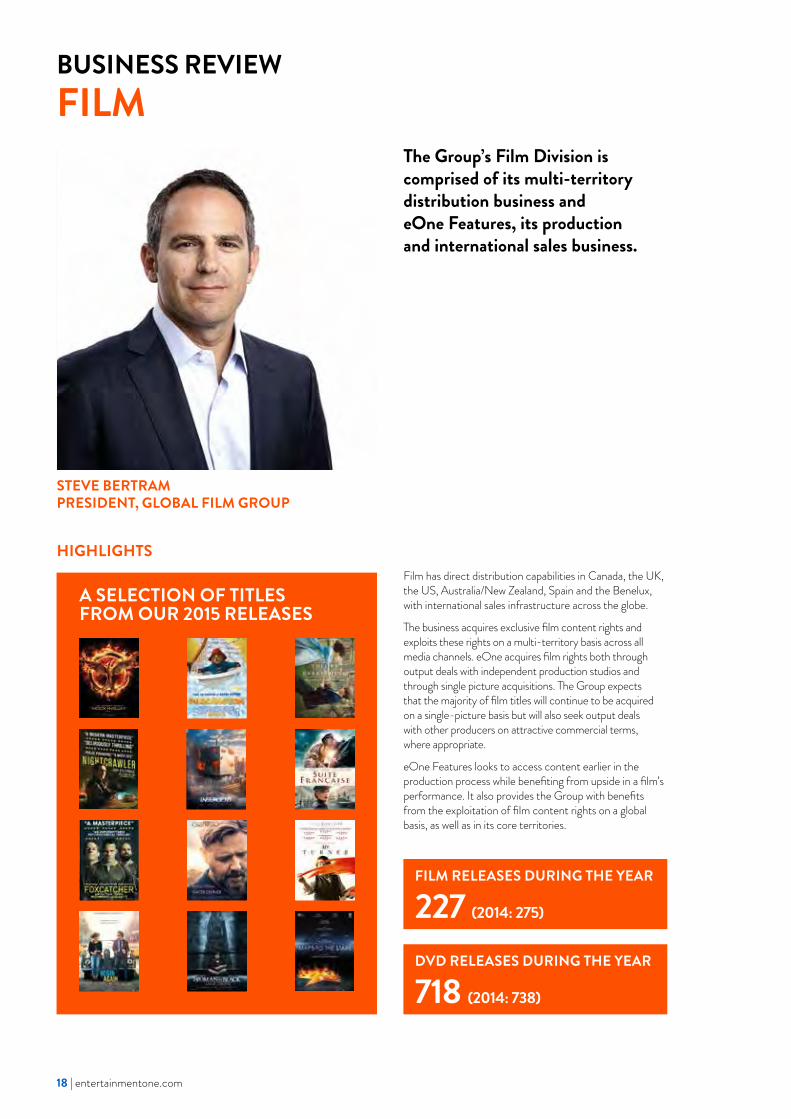
BUSINESS REVIEWFILM
STEVE BERTRAMPRESIDENT, GLOBAL FILM GROUP
HIGHLIGHTS
A SELECTION OF TITLES FROM OUR 2015 RELEASES
The Group’s Film Division is comprised of its multi-territory distribution business and eOne Features, its production and international sales business.
Film has direct distribution capabilities in Canada, the UK, the US, Australia/New Zealand, Spain and the Benelux, with international sales infrastructure across the globe.
The business acquires exclusive film content rights and exploits these rights on a multi-territory basis across all media channels. eOne acquires film rights both through output deals with independent production studios and through single picture acquisitions. The Group expects that the majority of film titles will continue to be acquired on a single-picture basis but will also seek output deals with other producers on attractive commercial terms, where appropriate.
eOne Features looks to access content earlier in the production process while benefiting from upside in a film’s performance. It also provides the Group with benefits from the exploitation of film content rights on a global basis, as well as in its core territories.
FILM RELEASES DURING THE YEAR
227 (2014: 275)
DVD RELEASES DURING THE YEAR
718 (2014: 738)
eOne Annual Report and Accounts 2015 | 19
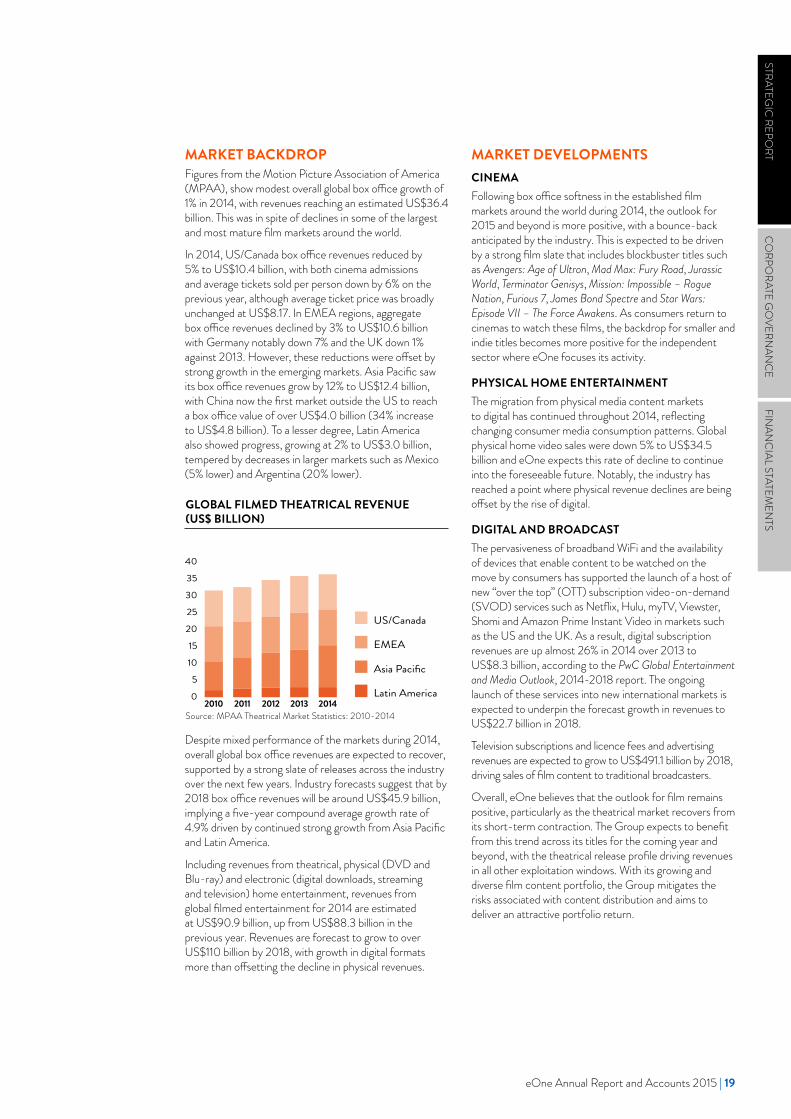
GLOBAL FILMED THEATRICAL REVENUE (US$ BILLION)
Source: MPAA Theatrical Market Statistics: 2010-2014
Asia Pacific
US/Canada
Latin America
EMEA
0
5
10
15
20
25
30
35
40
20142013201220112010
MARKET BACKDROPFigures from the Motion Picture Association of America (MPAA), show modest overall global box office growth of 1% in 2014, with revenues reaching an estimated US$36.4 billion. This was in spite of declines in some of the largest and most mature film markets around the world.
In 2014, US/Canada box office revenues reduced by 5% to US$10.4 billion, with both cinema admissions and average tickets sold per person down by 6% on the previous year, although average ticket price was broadly unchanged at US$8.17. In EMEA regions, aggregate box office revenues declined by 3% to US$10.6 billion with Germany notably down 7% and the UK down 1% against 2013. However, these reductions were offset by strong growth in the emerging markets. Asia Pacific saw its box office revenues grow by 12% to US$12.4 billion, with China now the first market outside the US to reach a box office value of over US$4.0 billion (34% increase to US$4.8 billion). To a lesser degree, Latin America also showed progress, growing at 2% to US$3.0 billion, tempered by decreases in larger markets such as Mexico (5% lower) and Argentina (20% lower).
MARKET DEVELOPMENTSCINEMAFollowing box office softness in the established film markets around the world during 2014, the outlook for 2015 and beyond is more positive, with a bounce-back anticipated by the industry. This is expected to be driven by a strong film slate that includes blockbuster titles such as Avengers: Age of Ultron, Mad Max: Fury Road, Jurassic World, Terminator Genisys, Mission: Impossible – Rogue Nation, Furious 7, James Bond Spectre and Star Wars: Episode VII – The Force Awakens. As consumers return to cinemas to watch these films, the backdrop for smaller and indie titles becomes more positive for the independent sector where eOne focuses its activity.
PHYSICAL HOME ENTERTAINMENTThe migration from physical media content markets to digital has continued throughout 2014, reflecting changing consumer media consumption patterns. Global physical home video sales were down 5% to US$34.5 billion and eOne expects this rate of decline to continue into the foreseeable future. Notably, the industry has reached a point where physical revenue declines are being offset by the rise of digital.
DIGITAL AND BROADCASTThe pervasiveness of broadband WiFi and the availability of devices that enable content to be watched on the move by consumers has supported the launch of a host of new “over the top” (OTT) subscription video-on-demand (SVOD) services such as Netflix, Hulu, myTV, Viewster, Shomi and Amazon Prime Instant Video in markets such as the US and the UK. As a result, digital subscription revenues are up almost 26% in 2014 over 2013 to US$8.3 billion, according to the PwC Global Entertainment and Media Outlook, 2014-2018 report. The ongoing launch of these services into new international markets is expected to underpin the forecast growth in revenues to US$22.7 billion in 2018.
Television subscriptions and licence fees and advertising revenues are expected to grow to US$491.1 billion by 2018, driving sales of film content to traditional broadcasters.
Overall, eOne believes that the outlook for film remains positive, particularly as the theatrical market recovers from its short-term contraction. The Group expects to benefit from this trend across its titles for the coming year and beyond, with the theatrical release profile driving revenues in all other exploitation windows. With its growing and diverse film content portfolio, the Group mitigates the risks associated with content distribution and aims to deliver an attractive portfolio return.
Despite mixed performance of the markets during 2014, overall global box office revenues are expected to recover, supported by a strong slate of releases across the industry over the next few years. Industry forecasts suggest that by 2018 box office revenues will be around US$45.9 billion, implying a five-year compound average growth rate of 4.9% driven by continued strong growth from Asia Pacific and Latin America.
Including revenues from theatrical, physical (DVD and Blu-ray) and electronic (digital downloads, streaming and television) home entertainment, revenues from global filmed entertainment for 2014 are estimated at US$90.9 billion, up from US$88.3 billion in the previous year. Revenues are forecast to grow to over US$110 billion by 2018, with growth in digital formats more than offsetting the decline in physical revenues.
STRATEGIC
REPORT
CO
RPORATE G
OVERN
ANC
EFIN
ANC
IAL STATEMEN
TS
20 | entertainmentone.com
BUSINESS REVIEW CONTINUED
STRATEGYThe Film Division’s strategic initiatives build on the Group’s goal to bring the best content to the world. At the core of these initiatives is the development of closer relationships with the best creative talent in the film industry, giving the Group access to the best new independent film projects. In this way, the Group is able to source film content sooner in the production process, securing the content earlier and at lower cost, so that the Group can benefit from the exploitation of film content rights on a territorial and/or global basis. Where eOne Features takes on a project, the Group benefits from being able to participate in the upside of the global success of a film in our role as equity owners and/or partners in the production, while the Group risk profile remains similar.
The strategy also focuses on increasing the size and scale of the Group’s global distribution network, which is an important competitive advantage in the film industry. As one of the largest independent distributors, the Group commands a strong position, enabling it to work with the world’s largest independent studios and consumer platforms. The quality and size of our filmed content portfolio makes eOne an important partner to retailers, broadcasters and digital content service providers. The Group will continue to take advantage of ongoing economies of scale and ensure that the business is well-positioned for the markets of tomorrow. This will help support margin growth across the Film business.
In each of the Group’s operations we aim to account for significant independent market share, to cement the competitive advantage driven by the scale of the business and the deep relationships with stakeholders across the various film release windows. The knowledge gained from operating directly in local markets further supports the Group’s content selection processes, reinforcing the benefit of having a locally-deep and globally-connected distribution network.
As such, the Group will look for opportunities to grow its international distribution footprint into new territories. The Group is focused on seeking corporate partnerships or acquisitions in Latin America and South East Asia, as well as opportunities in parts of Western Europe to complement eOne’s existing European presence.
The Group’s acquisition of Phase 4 Films, a leading independent film and family content distribution business operating across North America, has allowed the Group to consolidate its US film operations. This acquisition refocused the Group’s US business to capitalise on Phase 4 Films’ direct relationships with key home entertainment customers by investing in titles primarily designed to drive ancillary rather than theatrical revenue, thereby reducing print and advertising spend and increasing profitability. The acquisition supports the Group’s aim of building incremental scale and growth opportunities for the US Film business in the on-demand space, on home entertainment, cable, satellite and digital platforms.
KEY TRENDS
Independent content is in demand Hollywood studios are focusing more on blockbuster, franchise titles.
eOne opportunity Independent producers are stepping into the gap, with Entertainment One distributing their key titles for them internationally.
International markets Independent producers are looking to markets outside the US for growth, but lack the distribution infrastructure.
eOne opportunity eOne provides a route into major international markets for independent producers.
Size and scale Scale drives improved access to content and incremental margin through access to creative communities and increased purchasing power.
eOne opportunity eOne’s EBITDA margins will continue to expand as further economies of scale are achieved.
2016 FILM RELEASES
~2502016 INVESTMENT IN CONTENT AND PRODUCTIONS
Over £200m
eOne Annual Report and Accounts 2015 | 21
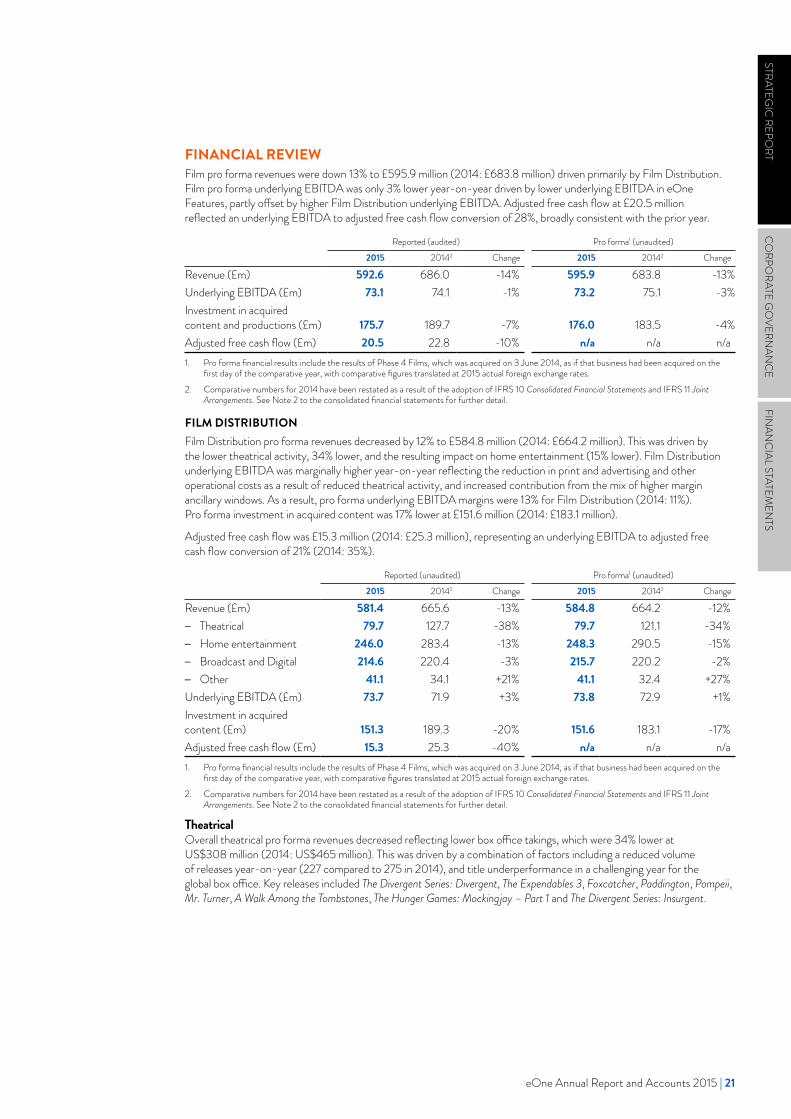
FINANCIAL REVIEW Film pro forma revenues were down 13% to £595.9 million (2014: £683.8 million) driven primarily by Film Distribution. Film pro forma underlying EBITDA was only 3% lower year-on-year driven by lower underlying EBITDA in eOne Features, partly offset by higher Film Distribution underlying EBITDA. Adjusted free cash flow at £20.5 million reflected an underlying EBITDA to adjusted free cash flow conversion of 28%, broadly consistent with the prior year.
Reported (audited) Pro forma1 (unaudited)2015 20142 Change 2015 20142 Change
Revenue (£m) 592.6 686.0 -14% 595.9 683.8 -13%Underlying EBITDA (£m) 73.1 74.1 -1% 73.2 75.1 -3%Investment in acquired content and productions (£m) 175.7 189.7 -7% 176.0 183.5 -4%Adjusted free cash flow (£m) 20.5 22.8 -10% n/a n/a n/a1. Pro forma financial results include the results of Phase 4 Films, which was acquired on 3 June 2014, as if that business had been acquired on the
first day of the comparative year, with comparative figures translated at 2015 actual foreign exchange rates.2. Comparative numbers for 2014 have been restated as a result of the adoption of IFRS 10 Consolidated Financial Statements and IFRS 11 Joint
Arrangements. See Note 2 to the consolidated financial statements for further detail.
FILM DISTRIBUTIONFilm Distribution pro forma revenues decreased by 12% to £584.8 million (2014: £664.2 million). This was driven by the lower theatrical activity, 34% lower, and the resulting impact on home entertainment (15% lower). Film Distribution underlying EBITDA was marginally higher year-on-year reflecting the reduction in print and advertising and other operational costs as a result of reduced theatrical activity, and increased contribution from the mix of higher margin ancillary windows. As a result, pro forma underlying EBITDA margins were 13% for Film Distribution (2014: 11%). Pro forma investment in acquired content was 17% lower at £151.6 million (2014: £183.1 million).
Adjusted free cash flow was £15.3 million (2014: £25.3 million), representing an underlying EBITDA to adjusted free cash flow conversion of 21% (2014: 35%).
Reported (unaudited) Pro forma1 (unaudited)2015 20142 Change 2015 20142 Change
Revenue (£m) 581.4 665.6 -13% 584.8 664.2 -12% – Theatrical 79.7 127.7 -38% 79.7 121.1 -34% – Home entertainment 246.0 283.4 -13% 248.3 290.5 -15% – Broadcast and Digital 214.6 220.4 -3% 215.7 220.2 -2% – Other 41.1 34.1 +21% 41.1 32.4 +27%
Underlying EBITDA (£m) 73.7 71.9 +3% 73.8 72.9 +1%Investment in acquired content (£m) 151.3 189.3 -20% 151.6 183.1 -17%Adjusted free cash flow (£m) 15.3 25.3 -40% n/a n/a n/a1. Pro forma financial results include the results of Phase 4 Films, which was acquired on 3 June 2014, as if that business had been acquired on the
first day of the comparative year, with comparative figures translated at 2015 actual foreign exchange rates.2. Comparative numbers for 2014 have been restated as a result of the adoption of IFRS 10 Consolidated Financial Statements and IFRS 11 Joint
Arrangements. See Note 2 to the consolidated financial statements for further detail.
TheatricalOverall theatrical pro forma revenues decreased reflecting lower box office takings, which were 34% lower at US$308 million (2014: US$465 million). This was driven by a combination of factors including a reduced volume of releases year-on-year (227 compared to 275 in 2014), and title underperformance in a challenging year for the global box office. Key releases included The Divergent Series: Divergent, The Expendables 3, Foxcatcher, Paddington, Pompeii, Mr. Turner, A Walk Among the Tombstones, The Hunger Games: Mockingjay – Part 1 and The Divergent Series: Insurgent.
STRATEGIC
REPORT
CO
RPORATE G
OVERN
ANC
EFIN
ANC
IAL STATEMEN
TS
22 | entertainmentone.com
BUSINESS REVIEW CONTINUED
The global film market is anticipated to improve from 2015 and beyond, with a broad range of major films set for release over the coming months. In tandem, the Group’s box office performance is also expected to improve, with a stronger film slate and an increased number of releases to around 250 film releases planned in the next financial year. Investment in acquired content is set to grow to around £170 million.
eOne’s theatrical release slate for the 2016 financial year includes a number of strong titles, such as The Hunger Games: Mockingjay – Part 2, The Divergent Series: Allegiant – Part 1, The Hateful Eight (the ninth film from Quentin Tarantino), Gods of Egypt, Masterminds, The Last Witch Hunter and Insidious: Chapter 3.
Home entertainmentHome entertainment pro forma revenues decreased by 15%, reflecting the continuing migration from physical to digital formats and the impact of lower theatrical activity in the year. In total, 718 DVDs were released (2014: 738) including Lone Survivor, The Hunger Games: Mockingjay – Part 1, The Divergent Series: Divergent, The Expendables 3, Pompeii, Philomena and Escape Plan. 12 Years a Slave, A Walk Among the Tombstones and Mr. Turner DVD releases hit number one in the UK in their first week of release and The Walking Dead season four has performed strongly in all territories.
Over 600 titles are planned for release in the next financial year including The Theory of Everything, Paddington, The Divergent Series: Insurgent, The Water Diviner, No Escape and The Cobbler.
Broadcast and DigitalThe Group’s combined broadcast and digital revenues were broadly in line with the prior year, and now account for 37% of overall Film Distribution revenues (2014: 33%).
Key broadcast/digital releases in the year included The Twilight Saga: Breaking Dawn – Part 2, Looper, 12 Years a Slave, American Hustle, Trailer Park Boys, Pompeii, Silver Linings Playbook and Chronicles of Riddick: Dead Man Stalking.
In addition, significant new deals were signed with Foxtel in Australia and Shomi, a new video on demand service launched in Canada by Rogers and Shaw Media.
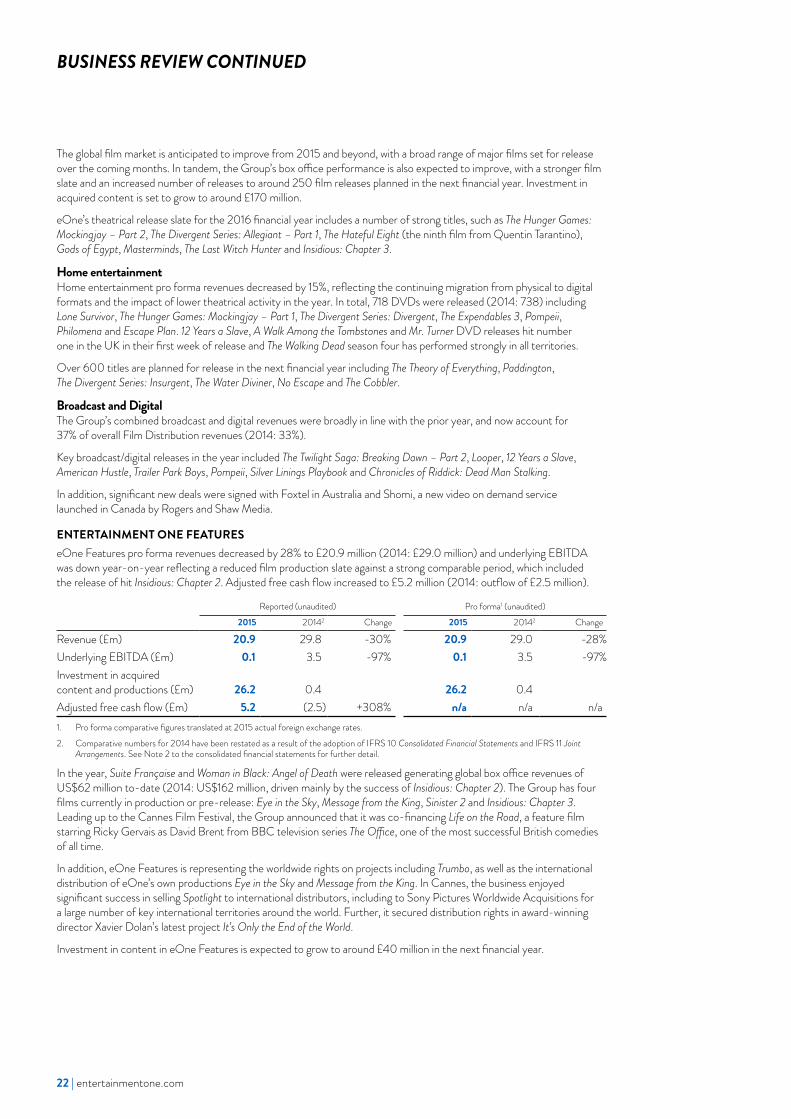
ENTERTAINMENT ONE FEATURESeOne Features pro forma revenues decreased by 28% to £20.9 million (2014: £29.0 million) and underlying EBITDA was down year-on-year reflecting a reduced film production slate against a strong comparable period, which included the release of hit Insidious: Chapter 2. Adjusted free cash flow increased to £5.2 million (2014: outflow of £2.5 million).
Reported (unaudited) Pro forma1 (unaudited)2015 20142 Change 2015 20142 Change
Revenue (£m) 20.9 29.8 -30% 20.9 29.0 -28%Underlying EBITDA (£m) 0.1 3.5 -97% 0.1 3.5 -97%Investment in acquired content and productions (£m) 26.2 0.4 26.2 0.4Adjusted free cash flow (£m) 5.2 (2.5) +308% n/a n/a n/a1. Pro forma comparative figures translated at 2015 actual foreign exchange rates.2. Comparative numbers for 2014 have been restated as a result of the adoption of IFRS 10 Consolidated Financial Statements and IFRS 11 Joint
Arrangements. See Note 2 to the consolidated financial statements for further detail.
In the year, Suite Française and Woman in Black: Angel of Death were released generating global box office revenues of US$62 million to-date (2014: US$162 million, driven mainly by the success of Insidious: Chapter 2). The Group has four films currently in production or pre-release: Eye in the Sky, Message from the King, Sinister 2 and Insidious: Chapter 3. Leading up to the Cannes Film Festival, the Group announced that it was co-financing Life on the Road, a feature film starring Ricky Gervais as David Brent from BBC television series The Office, one of the most successful British comedies of all time.
In addition, eOne Features is representing the worldwide rights on projects including Trumbo, as well as the international distribution of eOne’s own productions Eye in the Sky and Message from the King. In Cannes, the business enjoyed significant success in selling Spotlight to international distributors, including to Sony Pictures Worldwide Acquisitions for a large number of key international territories around the world. Further, it secured distribution rights in award-winning director Xavier Dolan’s latest project It’s Only the End of the World.
Investment in content in eOne Features is expected to grow to around £40 million in the next financial year.
eOne Annual Report and Accounts 2015 | 23
TELEVISION
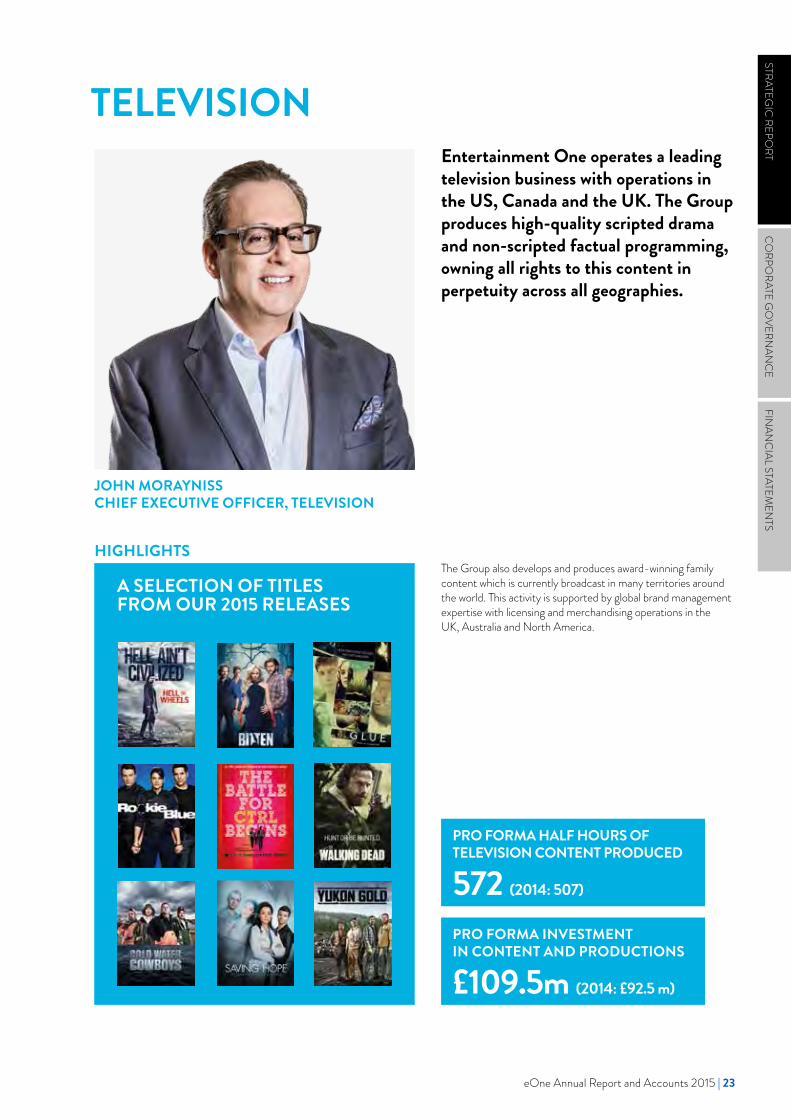
JOHN MORAYNISSCHIEF EXECUTIVE OFFICER, TELEVISION
HIGHLIGHTS
Entertainment One operates a leading television business with operations in the US, Canada and the UK. The Group produces high-quality scripted drama and non-scripted factual programming, owning all rights to this content in perpetuity across all geographies.
PRO FORMA HALF HOURS OF TELEVISION CONTENT PRODUCED
572 (2014: 507)
PRO FORMA INVESTMENT IN CONTENT AND PRODUCTIONS
£109.5m (2014: £92.5 m)
A SELECTION OF TITLES FROM OUR 2015 RELEASES
The Group also develops and produces award-winning family content which is currently broadcast in many territories around the world. This activity is supported by global brand management expertise with licensing and merchandising operations in the UK, Australia and North America.
STRATEGIC
REPORT
CO
RPORATE G
OVERN
ANC
EFIN
ANC
IAL STATEMEN
TS

24 | entertainmentone.com
MARKET BACKDROPA key factor driving Television production volume is the outlook for growth in global television subscriptions and licence fees. Combined global television subscriptions and licence fees and advertising revenues were estimated to be worth US$419.1 billion in 2014 and are expected to grow to US$491.1 billion by 2018. North America made up 43% of global revenues in 2014 and is the core market for the Group’s production strategy. As a result, revenue from the sale of programming to broadcasters is expected to grow, driven by increased subscriptions and advertising.
The IBISWorld report, published in January 2014, forecasts that the US television production industry will generate revenues of US$37.0 billion in 2014, and grow at a rate of 3.7% per annum to 2019.
MARKET DEVELOPMENTSThe disruptive change being brought about by the rise of OTT platforms that use the internet to distribute television content has been a factor in the US television market for a number of years. Offering SVOD services, these new OTT platforms, led by Netflix and Amazon Prime Instant Video, threaten to erode the traditional subscriber bases of the cable networks in the US before expanding into new territories overseas to drive further subscriber growth. Traditional broadcasters are responding to these new developments by increasing their investment into new service offerings and using exclusive content as a way of retaining subscribers.
According to Strategy Analytics, global OTT video revenues (SVOD subscriptions and advertising) totalled US$17.9 billion at the end of 2013, but this number is set to grow to US$55.4 billion by the end of 2019. This strong growth profile has created strong demand for high quality, exclusive content from the platforms, some of which are branding commissioned shows as their own differentiated productions to attract subscribers.
Although the OTT/SVOD revenue numbers are relatively small in the context of global television subscription and advertising revenues, traditional cable networks have increasingly become concerned over the loss of subscribers to these platforms, so-called “cord cutting”. They have responded in two ways: firstly, they have invested in new services, such as their own OTT platforms, allowing remote access to subscribers’ services through mobile devices (TV Anywhere), cloud storage capabilities, higher broadband speeds into the home and enhanced programme guides; secondly, they have invested in more content, replicating the strategy of the OTT platforms to drive subscriber stickiness around flagship content.
This demand for content from both sides of the broadcasting ecosystem plays to Entertainment One’s strengths as a producer and distributor of high quality, premium content in the important scripted drama genre. In tandem, helping to drive the growth of the market, there has been a fragmentation of viewing devices, allowing consumers to watch video content across a wide variety of devices, both within the home and on the move.
STRATEGYThe strategy focuses on partnering with the best creative talent through building on the success of the business in Canada to expand its television development and production activities into the US, the UK, Australia and beyond. Strategic acquisitions will provide a platform for growth, both in owned productions and acting as territorial hubs for partnerships with other creative producers. The first significant step in this strategy was the acquisition of a 51% stake in MGC in January 2015. This high profile studio produces and finances premium television and film content for the major US networks and international distribution. eOne will exclusively distribute new content created by the studio on a worldwide basis.
DEVICE SHARE OF TELEVISION CONTENT, USA IN 2015
Television set (live)DVR/VOD/DVD
Computer (desktop/notebook)Mobile device(smartphone/tablet)
Connected television set
Source: Horowitz Associates, State of Cable and Digital Media report, 2014
57%23%
10%
6% 4%
BUSINESS REVIEW CONTINUED
GLOBAL BROADCASTING MARKET SET TO GROW AT 4% CAGR 2014–2018
0
100
200
300
400
500
20182017201620152014
Asia Pacific
US/Canada
Latin America
EMEA
Global Broadcast Revenues, by Region, 2014-2018 (US$bn)Source: PwC Global Entertainment and Media Outlook, 2014-2018
eOne Annual Report and Accounts 2015 | 25
The Group has also continued to expand the business’s production capabilities in Canada, and during the year eOne successfully completed the acquisition of Paperny Entertainment and Force Four Entertainment. Both companies specialise in the development and production of non-scripted television programming, including a range of character-driven documentaries, comedies and reality series. Together these companies produced over 200 half hours of programming in the current financial year.
These acquisitions strengthen the Group’s television production capabilities in North America, supplement its content library and enhance the Group’s international sales offering.
The Group’s international sales distribution capability is a key competitive advantage for eOne, with the current network reaching over 500 broadcasters in more than 150 territories. As well as distributing eOne productions, the Group also sells content from output deal partners such as AMC and SundanceTV and other third party acquisitions across this infrastructure. In this market, digital platforms are becoming increasingly important and the Group recently signed a multi-year agreement with Amazon Prime to distribute a range of content across its platform in the UK and Germany.
Within Family, Peppa Pig continues to develop in line with our strategy to make the property the world’s most loved pre-school brand. The brand was rolled out into a range of new markets during the year, with broadcasting agreements supported by licensing and merchandising programmes. As traction for the brand grows among consumers we carefully manage the retail programmes to ensure we maximise the brand’s longevity. The Group looks forward to a continuing international roll-out of Peppa Pig in the new financial year, targeting attractive markets in the Asia Pacific region such as China. Finally, the US consumer roll-out continues in spring 2015 in Walmart stores, which will be followed by a launch in Target during the summer.
In addition to managing the growth of Peppa Pig, the Family business is also developing a balanced portfolio of complementary family brands for other demographics. Ben & Holly’s Little Kingdom has been launched into a number of new territories during the year and is showing positive signs of consumer traction. The Group is also in production with a number of new brands which will be launched in 2016, and beyond, with major broadcasting partners.
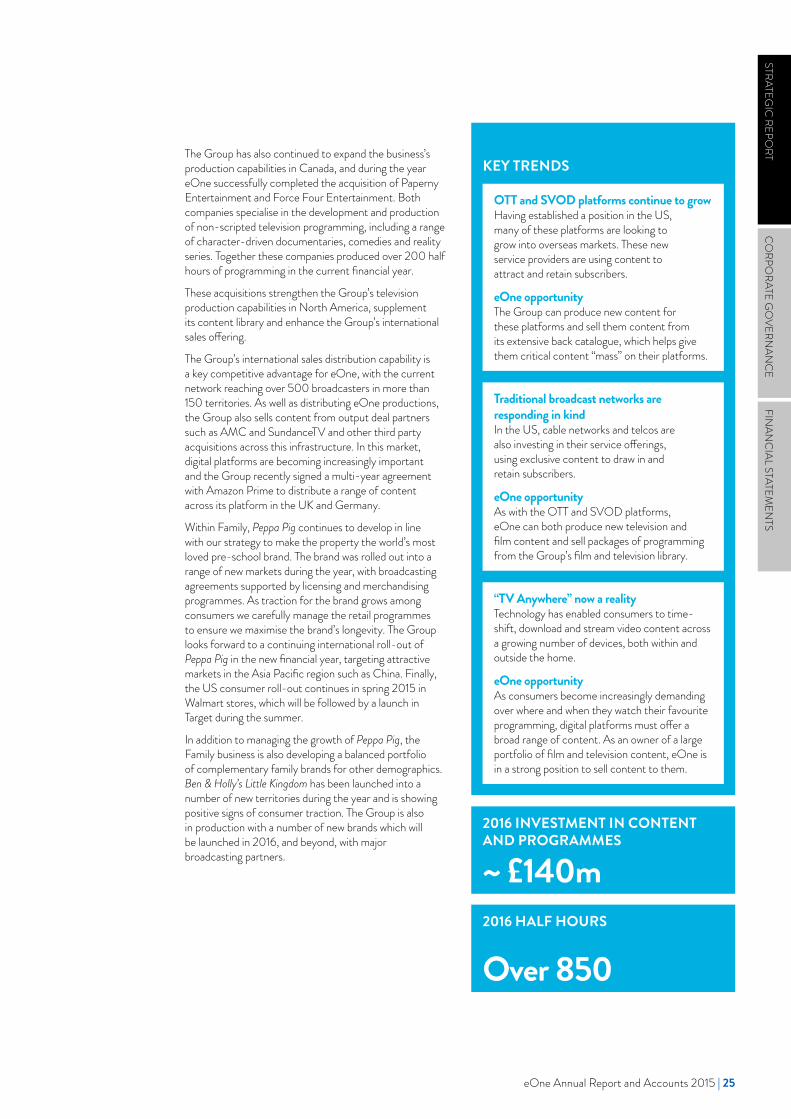
KEY TRENDS
OTT and SVOD platforms continue to growHaving established a position in the US, many of these platforms are looking to grow into overseas markets. These new service providers are using content to attract and retain subscribers.
eOne opportunityThe Group can produce new content for these platforms and sell them content from its extensive back catalogue, which helps give them critical content “mass” on their platforms.
Traditional broadcast networks are responding in kindIn the US, cable networks and telcos are also investing in their service offerings, using exclusive content to draw in and retain subscribers.
eOne opportunityAs with the OTT and SVOD platforms, eOne can both produce new television and film content and sell packages of programming from the Group’s film and television library.
“TV Anywhere” now a realityTechnology has enabled consumers to time-shift, download and stream video content across a growing number of devices, both within and outside the home.
eOne opportunityAs consumers become increasingly demanding over where and when they watch their favourite programming, digital platforms must offer a broad range of content. As an owner of a large portfolio of film and television content, eOne is in a strong position to sell content to them.
2016 INVESTMENT IN CONTENT AND PROGRAMMES
~ £140m2016 HALF HOURS
Over 850
STRATEGIC
REPORT
CO
RPORATE G
OVERN
ANC
EFIN
ANC
IAL STATEMEN
TS
26 | entertainmentone.com
BUSINESS REVIEW CONTINUED
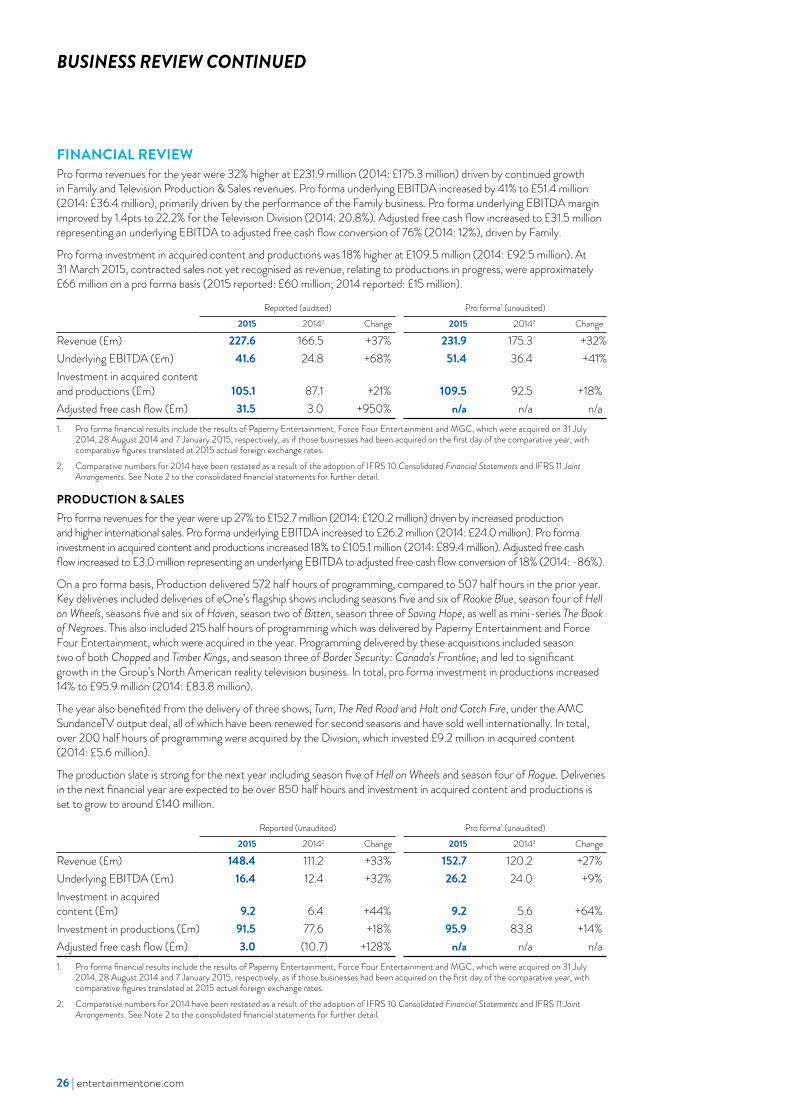
FINANCIAL REVIEW Pro forma revenues for the year were 32% higher at £231.9 million (2014: £175.3 million) driven by continued growth in Family and Television Production & Sales revenues. Pro forma underlying EBITDA increased by 41% to £51.4 million (2014: £36.4 million), primarily driven by the performance of the Family business. Pro forma underlying EBITDA margin improved by 1.4pts to 22.2% for the Television Division (2014: 20.8%). Adjusted free cash flow increased to £31.5 million representing an underlying EBITDA to adjusted free cash flow conversion of 76% (2014: 12%), driven by Family.
Pro forma investment in acquired content and productions was 18% higher at £109.5 million (2014: £92.5 million). At 31 March 2015, contracted sales not yet recognised as revenue, relating to productions in progress, were approximately £66 million on a pro forma basis (2015 reported: £60 million; 2014 reported: £15 million).
Reported (audited) Pro forma1 (unaudited)2015 20142 Change 2015 20142 Change
Revenue (£m) 227.6 166.5 +37% 231.9 175.3 +32%Underlying EBITDA (£m) 41.6 24.8 +68% 51.4 36.4 +41%Investment in acquired content and productions (£m) 105.1 87.1 +21% 109.5 92.5 +18%Adjusted free cash flow (£m) 31.5 3.0 +950% n/a n/a n/a1. Pro forma financial results include the results of Paperny Entertainment, Force Four Entertainment and MGC, which were acquired on 31 July
2014, 28 August 2014 and 7 January 2015, respectively, as if those businesses had been acquired on the first day of the comparative year, with comparative figures translated at 2015 actual foreign exchange rates.
2. Comparative numbers for 2014 have been restated as a result of the adoption of IFRS 10 Consolidated Financial Statements and IFRS 11 Joint Arrangements. See Note 2 to the consolidated financial statements for further detail.
PRODUCTION & SALESPro forma revenues for the year were up 27% to £152.7 million (2014: £120.2 million) driven by increased production and higher international sales. Pro forma underlying EBITDA increased to £26.2 million (2014: £24.0 million). Pro forma investment in acquired content and productions increased 18% to £105.1 million (2014: £89.4 million). Adjusted free cash flow increased to £3.0 million representing an underlying EBITDA to adjusted free cash flow conversion of 18% (2014: -86%).
On a pro forma basis, Production delivered 572 half hours of programming, compared to 507 half hours in the prior year. Key deliveries included deliveries of eOne’s flagship shows including seasons five and six of Rookie Blue, season four of Hell on Wheels, seasons five and six of Haven, season two of Bitten, season three of Saving Hope, as well as mini-series The Book of Negroes. This also included 215 half hours of programming which was delivered by Paperny Entertainment and Force Four Entertainment, which were acquired in the year. Programming delivered by these acquisitions included season two of both Chopped and Timber Kings, and season three of Border Security: Canada’s Frontline, and led to significant growth in the Group’s North American reality television business. In total, pro forma investment in productions increased 14% to £95.9 million (2014: £83.8 million).
The year also benefited from the delivery of three shows, Turn, The Red Road and Halt and Catch Fire, under the AMC SundanceTV output deal, all of which have been renewed for second seasons and have sold well internationally. In total, over 200 half hours of programming were acquired by the Division, which invested £9.2 million in acquired content (2014: £5.6 million).
The production slate is strong for the next year including season five of Hell on Wheels and season four of Rogue. Deliveries in the next financial year are expected to be over 850 half hours and investment in acquired content and productions is set to grow to around £140 million.
Reported (unaudited) Pro forma1 (unaudited)2015 20142 Change 2015 20142 Change
Revenue (£m) 148.4 111.2 +33% 152.7 120.2 +27%Underlying EBITDA (£m) 16.4 12.4 +32% 26.2 24.0 +9%Investment in acquired content (£m) 9.2 6.4 +44% 9.2 5.6 +64%Investment in productions (£m) 91.5 77.6 +18% 95.9 83.8 +14%Adjusted free cash flow (£m) 3.0 (10.7) +128% n/a n/a n/a1. Pro forma financial results include the results of Paperny Entertainment, Force Four Entertainment and MGC, which were acquired on 31 July
2014, 28 August 2014 and 7 January 2015, respectively, as if those businesses had been acquired on the first day of the comparative year, with comparative figures translated at 2015 actual foreign exchange rates.
2. Comparative numbers for 2014 have been restated as a result of the adoption of IFRS 10 Consolidated Financial Statements and IFRS 11 Joint Arrangements. See Note 2 to the consolidated financial statements for further detail.
eOne Annual Report and Accounts 2015 | 27
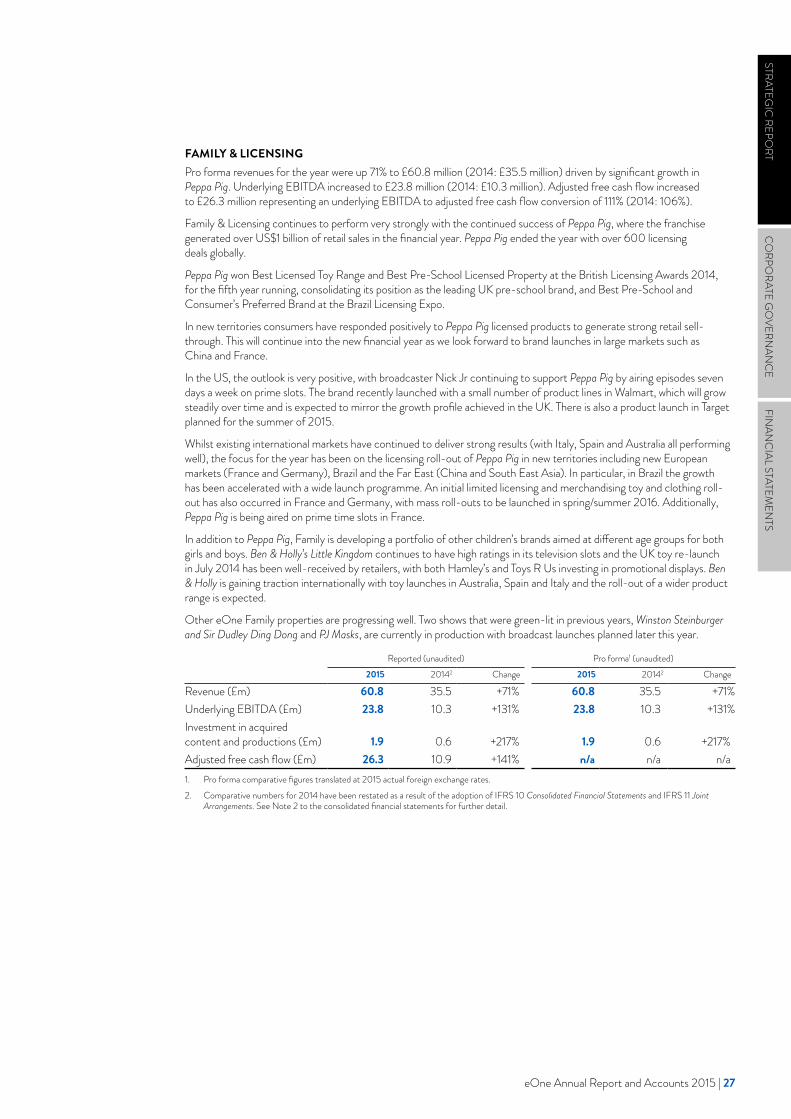
FAMILY & LICENSINGPro forma revenues for the year were up 71% to £60.8 million (2014: £35.5 million) driven by significant growth in Peppa Pig. Underlying EBITDA increased to £23.8 million (2014: £10.3 million). Adjusted free cash flow increased to £26.3 million representing an underlying EBITDA to adjusted free cash flow conversion of 111% (2014: 106%).
Family & Licensing continues to perform very strongly with the continued success of Peppa Pig, where the franchise generated over US$1 billion of retail sales in the financial year. Peppa Pig ended the year with over 600 licensing deals globally.
Peppa Pig won Best Licensed Toy Range and Best Pre-School Licensed Property at the British Licensing Awards 2014, for the fifth year running, consolidating its position as the leading UK pre-school brand, and Best Pre-School and Consumer’s Preferred Brand at the Brazil Licensing Expo.
In new territories consumers have responded positively to Peppa Pig licensed products to generate strong retail sell-through. This will continue into the new financial year as we look forward to brand launches in large markets such as China and France.
In the US, the outlook is very positive, with broadcaster Nick Jr continuing to support Peppa Pig by airing episodes seven days a week on prime slots. The brand recently launched with a small number of product lines in Walmart, which will grow steadily over time and is expected to mirror the growth profile achieved in the UK. There is also a product launch in Target planned for the summer of 2015.
Whilst existing international markets have continued to deliver strong results (with Italy, Spain and Australia all performing well), the focus for the year has been on the licensing roll-out of Peppa Pig in new territories including new European markets (France and Germany), Brazil and the Far East (China and South East Asia). In particular, in Brazil the growth has been accelerated with a wide launch programme. An initial limited licensing and merchandising toy and clothing roll-out has also occurred in France and Germany, with mass roll-outs to be launched in spring/summer 2016. Additionally, Peppa Pig is being aired on prime time slots in France.
In addition to Peppa Pig, Family is developing a portfolio of other children’s brands aimed at different age groups for both girls and boys. Ben & Holly’s Little Kingdom continues to have high ratings in its television slots and the UK toy re-launch in July 2014 has been well-received by retailers, with both Hamley’s and Toys R Us investing in promotional displays. Ben & Holly is gaining traction internationally with toy launches in Australia, Spain and Italy and the roll-out of a wider product range is expected.
Other eOne Family properties are progressing well. Two shows that were green-lit in previous years, Winston Steinburger and Sir Dudley Ding Dong and PJ Masks, are currently in production with broadcast launches planned later this year.
Reported (unaudited) Pro forma1 (unaudited)2015 20142 Change 2015 20142 Change
Revenue (£m) 60.8 35.5 +71% 60.8 35.5 +71%Underlying EBITDA (£m) 23.8 10.3 +131% 23.8 10.3 +131%Investment in acquired content and productions (£m) 1.9 0.6 +217% 1.9 0.6 +217%Adjusted free cash flow (£m) 26.3 10.9 +141% n/a n/a n/a1. Pro forma comparative figures translated at 2015 actual foreign exchange rates.2. Comparative numbers for 2014 have been restated as a result of the adoption of IFRS 10 Consolidated Financial Statements and IFRS 11 Joint
Arrangements. See Note 2 to the consolidated financial statements for further detail.
STRATEGIC
REPORT
CO
RPORATE G
OVERN
ANC
EFIN
ANC
IAL STATEMEN
TS

28 | entertainmentone.com
MUSICPro forma revenues for the year were broadly in line with the prior year at £18.4 million (2014: £19.6 million), with pro forma underlying EBITDA lower at £1.4 million (2014: £2.1 million). Adjusted free cash flow reduced to £2.2 million representing an underlying EBITDA to adjusted free cash flow conversion of 157% (2014: 133%).
The number of releases was marginally lower at 74 in 2015, versus 77 in 2014. The Group’s current roster of artists continues to be strong and is expected to deliver a content release schedule that is consistent year-on-year.
Reported (unaudited) Pro forma1 (unaudited)2015 20142 Change 2015 20142 Change
Revenue (£m) 18.4 19.8 -7% 18.4 19.6 -6%Underlying EBITDA (£m) 1.4 2.1 -33% 1.4 2.1 -33%Investment in acquired content and productions (£m) 2.5 2.5 – 2.5 2.5 –Adjusted free cash flow (£m) 2.2 2.8 -21% n/a n/a n/a1. Pro forma comparative figures translated at 2015 actual foreign exchange rates.2. Comparative numbers for 2014 have been restated as a result of the adoption of IFRS 10 Consolidated Financial Statements and IFRS 11 Joint
Arrangements. See Note 2 to the consolidated financial statements for further detail.
BUSINESS REVIEW CONTINUED
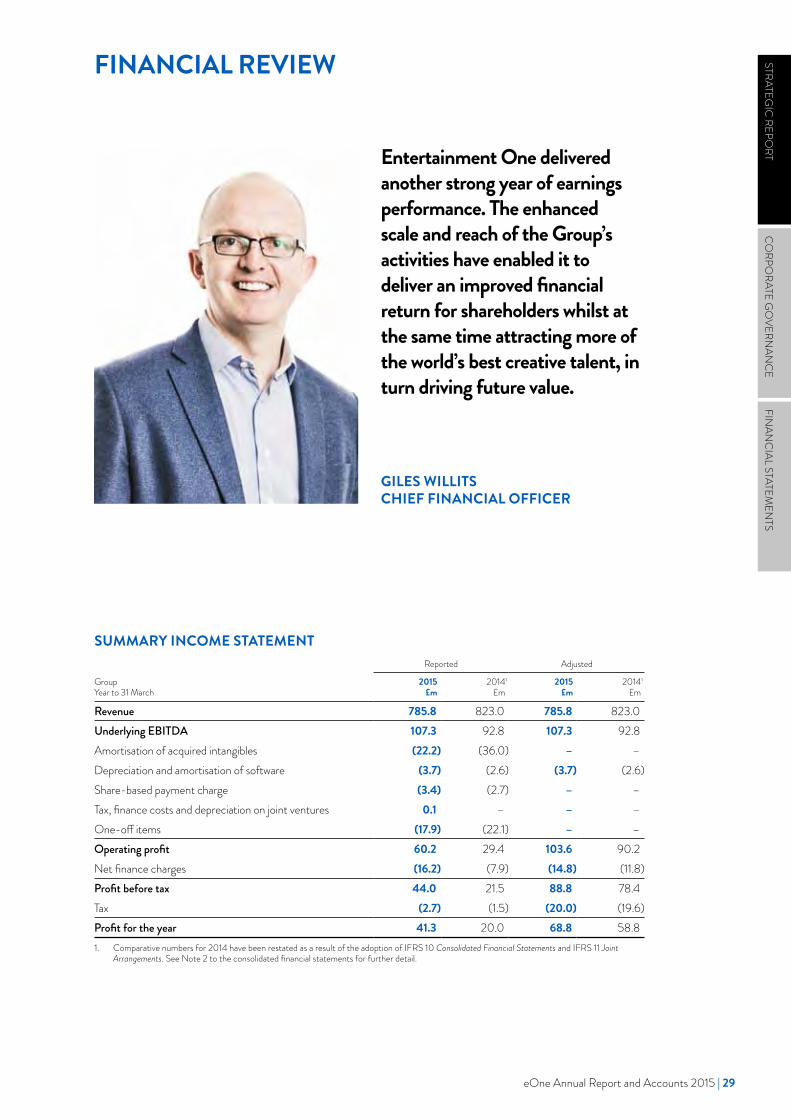
Entertainment One delivered another strong year of earnings performance. The enhanced scale and reach of the Group’s activities have enabled it to deliver an improved financial return for shareholders whilst at the same time attracting more of the world’s best creative talent, in turn driving future value.
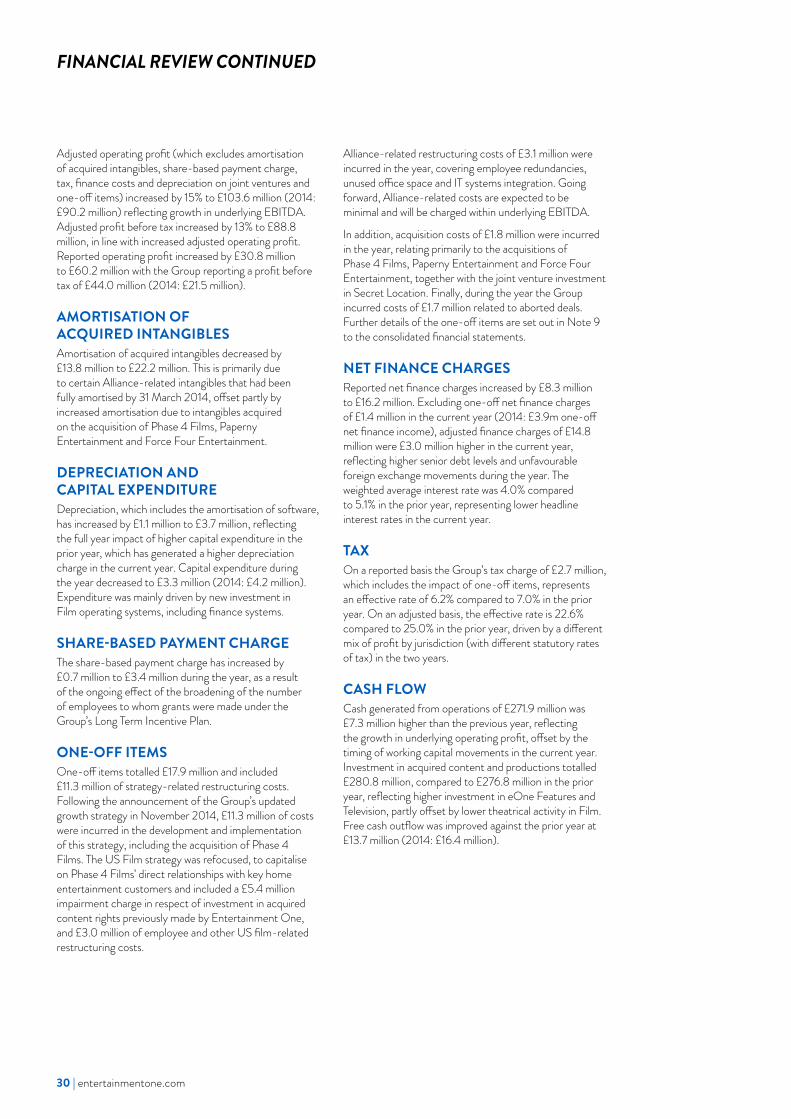
SUMMARY INCOME STATEMENTReported Adjusted
Group Year to 31 March
2015 £m
20141
£m2015
£m20141
£m
Revenue 785.8 823.0 785.8 823.0Underlying EBITDA 107.3 92.8 107.3 92.8Amortisation of acquired intangibles (22.2) (36.0) – –Depreciation and amortisation of software (3.7) (2.6) (3.7) (2.6)Share-based payment charge (3.4) (2.7) – –Tax, finance costs and depreciation on joint ventures 0.1 – – –One-off items (17.9) (22.1) – –Operating profit 60.2 29.4 103.6 90.2Net finance charges (16.2) (7.9) (14.8) (11.8)Profit before tax 44.0 21.5 88.8 78.4Tax (2.7) (1.5) (20.0) (19.6)Profit for the year 41.3 20.0 68.8 58.81. Comparative numbers for 2014 have been restated as a result of the adoption of IFRS 10 Consolidated Financial Statements and IFRS 11 Joint
Arrangements. See Note 2 to the consolidated financial statements for further detail.
GILES WILLITS CHIEF FINANCIAL OFFICER
FINANCIAL REVIEW STRATEGIC
REPORT
CO
RPORATE G
OVERN
ANC
EFIN
ANC
IAL STATEMEN
TS
eOne Annual Report and Accounts 2015 | 29
FINANCIAL REVIEW CONTINUED
Adjusted operating profit (which excludes amortisation of acquired intangibles, share-based payment charge, tax, finance costs and depreciation on joint ventures and one-off items) increased by 15% to £103.6 million (2014: £90.2 million) reflecting growth in underlying EBITDA. Adjusted profit before tax increased by 13% to £88.8 million, in line with increased adjusted operating profit. Reported operating profit increased by £30.8 million to £60.2 million with the Group reporting a profit before tax of £44.0 million (2014: £21.5 million).
AMORTISATION OF ACQUIRED INTANGIBLESAmortisation of acquired intangibles decreased by £13.8 million to £22.2 million. This is primarily due to certain Alliance-related intangibles that had been fully amortised by 31 March 2014, offset partly by increased amortisation due to intangibles acquired on the acquisition of Phase 4 Films, Paperny Entertainment and Force Four Entertainment.
DEPRECIATION AND CAPITAL EXPENDITURE Depreciation, which includes the amortisation of software, has increased by £1.1 million to £3.7 million, reflecting the full year impact of higher capital expenditure in the prior year, which has generated a higher depreciation charge in the current year. Capital expenditure during the year decreased to £3.3 million (2014: £4.2 million). Expenditure was mainly driven by new investment in Film operating systems, including finance systems.
SHARE-BASED PAYMENT CHARGEThe share-based payment charge has increased by £0.7 million to £3.4 million during the year, as a result of the ongoing effect of the broadening of the number of employees to whom grants were made under the Group’s Long Term Incentive Plan.
ONE-OFF ITEMS One-off items totalled £17.9 million and included £11.3 million of strategy-related restructuring costs. Following the announcement of the Group’s updated growth strategy in November 2014, £11.3 million of costs were incurred in the development and implementation of this strategy, including the acquisition of Phase 4 Films. The US Film strategy was refocused, to capitalise on Phase 4 Films’ direct relationships with key home entertainment customers and included a £5.4 million impairment charge in respect of investment in acquired content rights previously made by Entertainment One, and £3.0 million of employee and other US film-related restructuring costs.
Alliance-related restructuring costs of £3.1 million were incurred in the year, covering employee redundancies, unused office space and IT systems integration. Going forward, Alliance-related costs are expected to be minimal and will be charged within underlying EBITDA.
In addition, acquisition costs of £1.8 million were incurred in the year, relating primarily to the acquisitions of Phase 4 Films, Paperny Entertainment and Force Four Entertainment, together with the joint venture investment in Secret Location. Finally, during the year the Group incurred costs of £1.7 million related to aborted deals. Further details of the one-off items are set out in Note 9 to the consolidated financial statements.
NET FINANCE CHARGESReported net finance charges increased by £8.3 million to £16.2 million. Excluding one-off net finance charges of £1.4 million in the current year (2014: £3.9m one-off net finance income), adjusted finance charges of £14.8 million were £3.0 million higher in the current year, reflecting higher senior debt levels and unfavourable foreign exchange movements during the year. The weighted average interest rate was 4.0% compared to 5.1% in the prior year, representing lower headline interest rates in the current year.
TAXOn a reported basis the Group’s tax charge of £2.7 million, which includes the impact of one-off items, represents an effective rate of 6.2% compared to 7.0% in the prior year. On an adjusted basis, the effective rate is 22.6% compared to 25.0% in the prior year, driven by a different mix of profit by jurisdiction (with different statutory rates of tax) in the two years.
CASH FLOWCash generated from operations of £271.9 million was £7.3 million higher than the previous year, reflecting the growth in underlying operating profit, offset by the timing of working capital movements in the current year. Investment in acquired content and productions totalled £280.8 million, compared to £276.8 million in the prior year, reflecting higher investment in eOne Features and Television, partly offset by lower theatrical activity in Film. Free cash outflow was improved against the prior year at £13.7 million (2014: £16.4 million).
30 | entertainmentone.com
2015 20141
(audited)
Adjusted net debt
£m
Production net debt
£mTotal
£mTotal
£m
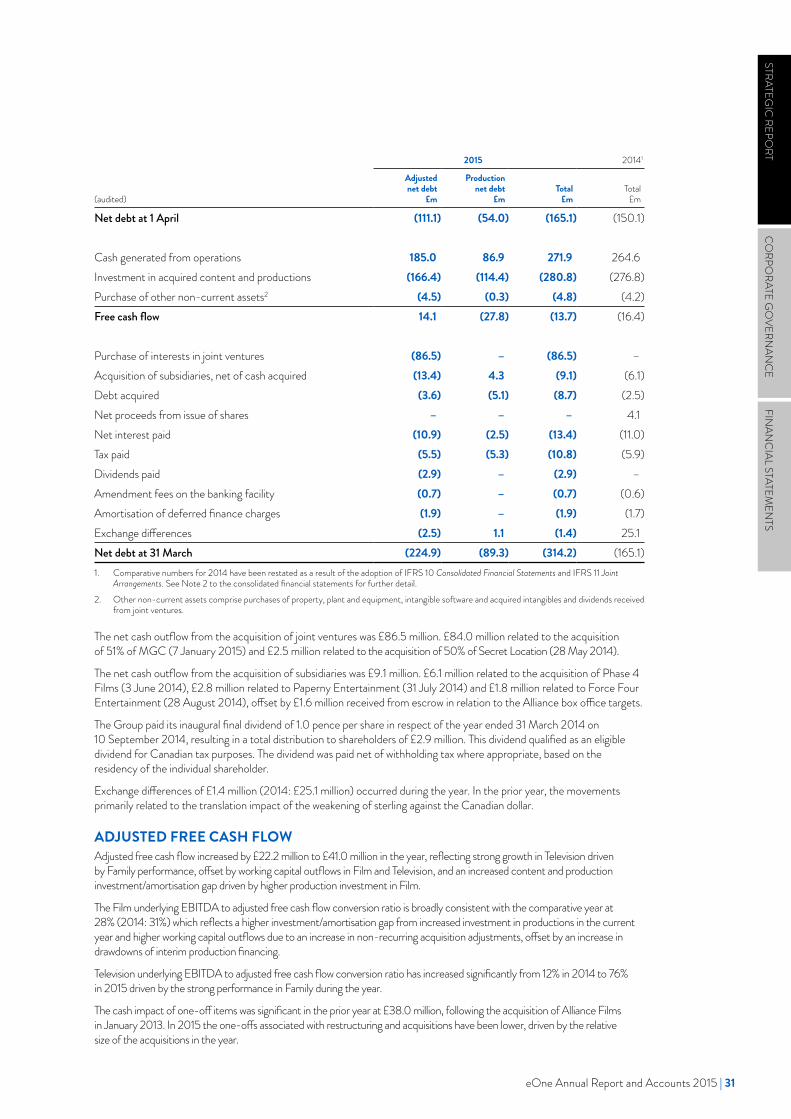
Net debt at 1 April (111.1) (54.0) (165.1) (150.1)
Cash generated from operations 185.0 86.9 271.9 264.6Investment in acquired content and productions (166.4) (114.4) (280.8) (276.8)Purchase of other non-current assets2 (4.5) (0.3) (4.8) (4.2)Free cash flow 14.1 (27.8) (13.7) (16.4)
Purchase of interests in joint ventures (86.5) – (86.5) –Acquisition of subsidiaries, net of cash acquired (13.4) 4.3 (9.1) (6.1)Debt acquired (3.6) (5.1) (8.7) (2.5)Net proceeds from issue of shares – – – 4.1Net interest paid (10.9) (2.5) (13.4) (11.0)Tax paid (5.5) (5.3) (10.8) (5.9)Dividends paid (2.9) – (2.9) –Amendment fees on the banking facility (0.7) – (0.7) (0.6)Amortisation of deferred finance charges (1.9) – (1.9) (1.7)Exchange differences (2.5) 1.1 (1.4) 25.1Net debt at 31 March (224.9) (89.3) (314.2) (165.1)1. Comparative numbers for 2014 have been restated as a result of the adoption of IFRS 10 Consolidated Financial Statements and IFRS 11 Joint
Arrangements. See Note 2 to the consolidated financial statements for further detail.2. Other non-current assets comprise purchases of property, plant and equipment, intangible software and acquired intangibles and dividends received
from joint ventures.
The net cash outflow from the acquisition of joint ventures was £86.5 million. £84.0 million related to the acquisition of 51% of MGC (7 January 2015) and £2.5 million related to the acquisition of 50% of Secret Location (28 May 2014).
The net cash outflow from the acquisition of subsidiaries was £9.1 million. £6.1 million related to the acquisition of Phase 4 Films (3 June 2014), £2.8 million related to Paperny Entertainment (31 July 2014) and £1.8 million related to Force Four Entertainment (28 August 2014), offset by £1.6 million received from escrow in relation to the Alliance box office targets.
The Group paid its inaugural final dividend of 1.0 pence per share in respect of the year ended 31 March 2014 on 10 September 2014, resulting in a total distribution to shareholders of £2.9 million. This dividend qualified as an eligible dividend for Canadian tax purposes. The dividend was paid net of withholding tax where appropriate, based on the residency of the individual shareholder.
Exchange differences of £1.4 million (2014: £25.1 million) occurred during the year. In the prior year, the movements primarily related to the translation impact of the weakening of sterling against the Canadian dollar.
ADJUSTED FREE CASH FLOWAdjusted free cash flow increased by £22.2 million to £41.0 million in the year, reflecting strong growth in Television driven by Family performance, offset by working capital outflows in Film and Television, and an increased content and production investment/amortisation gap driven by higher production investment in Film.
The Film underlying EBITDA to adjusted free cash flow conversion ratio is broadly consistent with the comparative year at 28% (2014: 31%) which reflects a higher investment/amortisation gap from increased investment in productions in the current year and higher working capital outflows due to an increase in non-recurring acquisition adjustments, offset by an increase in drawdowns of interim production financing.
Television underlying EBITDA to adjusted free cash flow conversion ratio has increased significantly from 12% in 2014 to 76% in 2015 driven by the strong performance in Family during the year.
The cash impact of one-off items was significant in the prior year at £38.0 million, following the acquisition of Alliance Films in January 2013. In 2015 the one-offs associated with restructuring and acquisitions have been lower, driven by the relative size of the acquisitions in the year.
STRATEGIC
REPORT
CO
RPORATE G
OVERN
ANC
EFIN
ANC
IAL STATEMEN
TS
eOne Annual Report and Accounts 2015 | 31
2015 20141
(unaudited)Film
£mTelevision
£mElims & Centre
£mTotal
£mTotal
£m
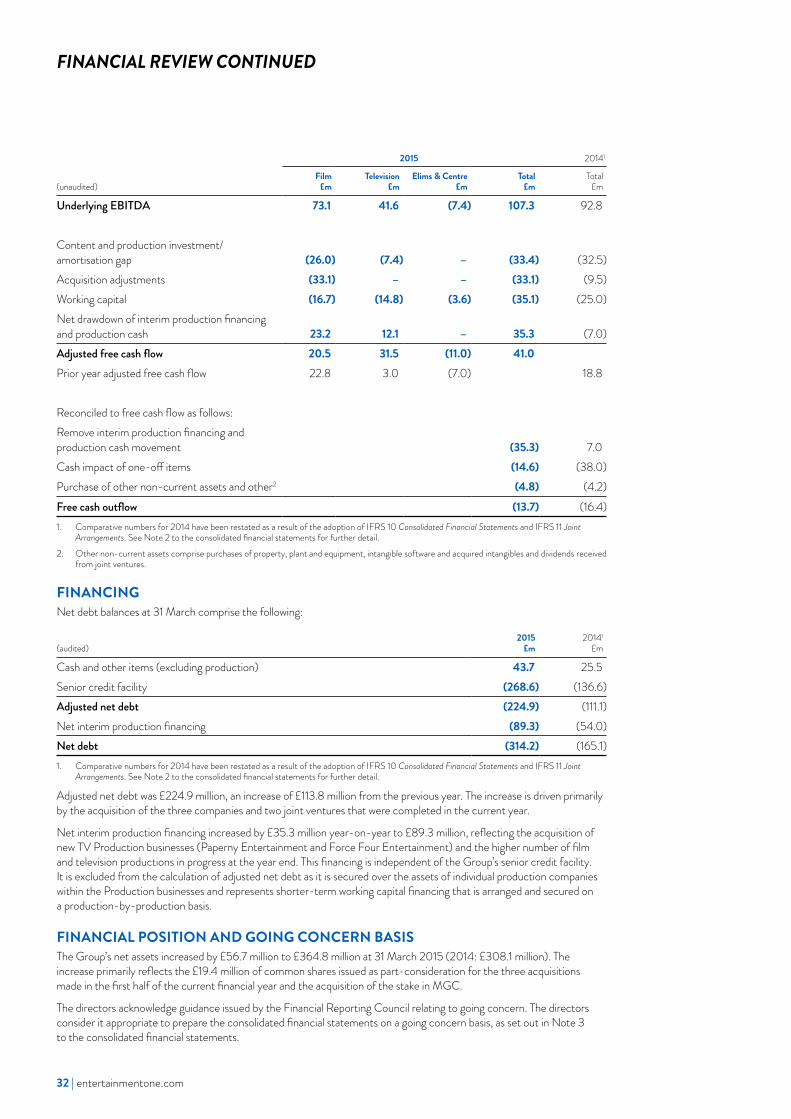
Underlying EBITDA 73.1 41.6 (7.4) 107.3 92.8
Content and production investment/ amortisation gap (26.0) (7.4) – (33.4) (32.5)Acquisition adjustments (33.1) – – (33.1) (9.5)Working capital (16.7) (14.8) (3.6) (35.1) (25.0)Net drawdown of interim production financing and production cash 23.2 12.1 – 35.3 (7.0)Adjusted free cash flow 20.5 31.5 (11.0) 41.0Prior year adjusted free cash flow 22.8 3.0 (7.0) 18.8
Reconciled to free cash flow as follows:Remove interim production financing and production cash movement (35.3) 7.0Cash impact of one-off items (14.6) (38.0)Purchase of other non-current assets and other2 (4.8) (4.2)Free cash outflow (13.7) (16.4)1. Comparative numbers for 2014 have been restated as a result of the adoption of IFRS 10 Consolidated Financial Statements and IFRS 11 Joint
Arrangements. See Note 2 to the consolidated financial statements for further detail.2. Other non-current assets comprise purchases of property, plant and equipment, intangible software and acquired intangibles and dividends received
from joint ventures.
FINANCING Net debt balances at 31 March comprise the following:
(audited)2015
£m20141
£m
Cash and other items (excluding production) 43.7 25.5Senior credit facility (268.6) (136.6)Adjusted net debt (224.9) (111.1)Net interim production financing (89.3) (54.0)Net debt (314.2) (165.1)1. Comparative numbers for 2014 have been restated as a result of the adoption of IFRS 10 Consolidated Financial Statements and IFRS 11 Joint
Arrangements. See Note 2 to the consolidated financial statements for further detail.
Adjusted net debt was £224.9 million, an increase of £113.8 million from the previous year. The increase is driven primarily by the acquisition of the three companies and two joint ventures that were completed in the current year.
Net interim production financing increased by £35.3 million year-on-year to £89.3 million, reflecting the acquisition of new TV Production businesses (Paperny Entertainment and Force Four Entertainment) and the higher number of film and television productions in progress at the year end. This financing is independent of the Group’s senior credit facility. It is excluded from the calculation of adjusted net debt as it is secured over the assets of individual production companies within the Production businesses and represents shorter-term working capital financing that is arranged and secured on a production-by-production basis.
FINANCIAL POSITION AND GOING CONCERN BASISThe Group’s net assets increased by £56.7 million to £364.8 million at 31 March 2015 (2014: £308.1 million). The increase primarily reflects the £19.4 million of common shares issued as part-consideration for the three acquisitions made in the first half of the current financial year and the acquisition of the stake in MGC.
The directors acknowledge guidance issued by the Financial Reporting Council relating to going concern. The directors consider it appropriate to prepare the consolidated financial statements on a going concern basis, as set out in Note 3 to the consolidated financial statements.
FINANCIAL REVIEW CONTINUED
32 | entertainmentone.com
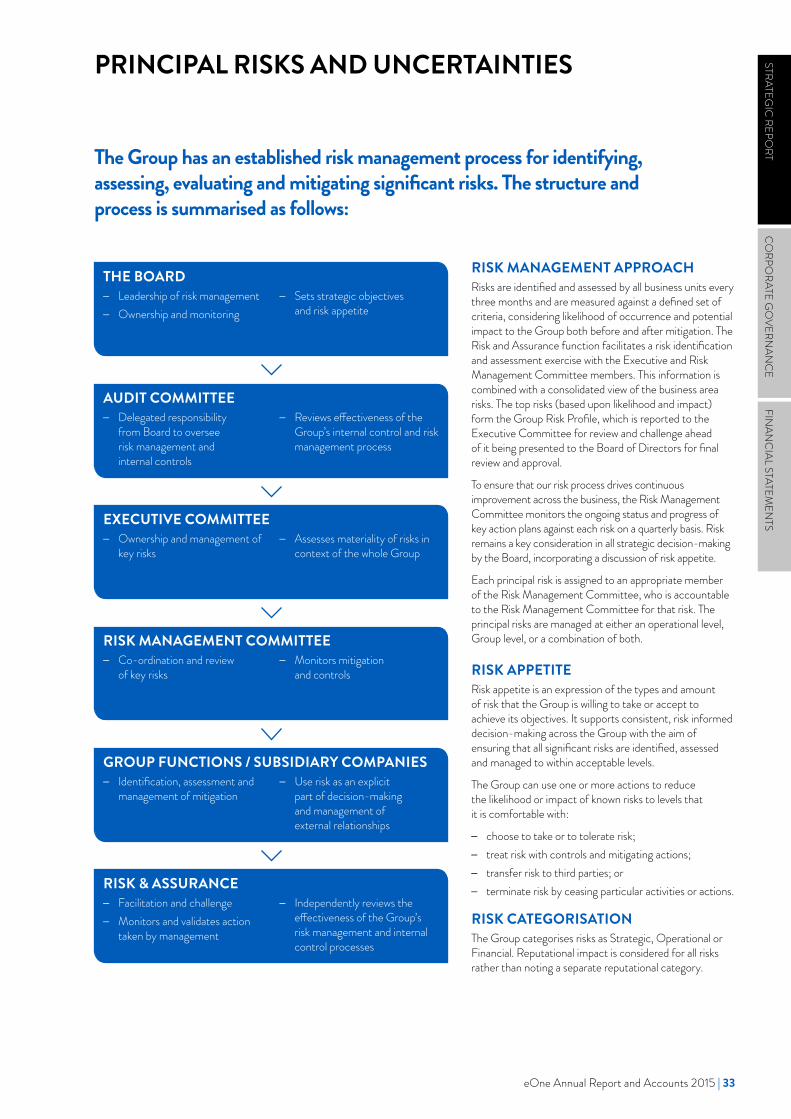
PRINCIPAL RISKS AND UNCERTAINTIES
The Group has an established risk management process for identifying, assessing, evaluating and mitigating significant risks. The structure and process is summarised as follows:
RISK MANAGEMENT APPROACHRisks are identified and assessed by all business units every three months and are measured against a defined set of criteria, considering likelihood of occurrence and potential impact to the Group both before and after mitigation. The Risk and Assurance function facilitates a risk identification and assessment exercise with the Executive and Risk Management Committee members. This information is combined with a consolidated view of the business area risks. The top risks (based upon likelihood and impact) form the Group Risk Profile, which is reported to the Executive Committee for review and challenge ahead of it being presented to the Board of Directors for final review and approval.
To ensure that our risk process drives continuous improvement across the business, the Risk Management Committee monitors the ongoing status and progress of key action plans against each risk on a quarterly basis. Risk remains a key consideration in all strategic decision-making by the Board, incorporating a discussion of risk appetite.
Each principal risk is assigned to an appropriate member of the Risk Management Committee, who is accountable to the Risk Management Committee for that risk. The principal risks are managed at either an operational level, Group level, or a combination of both.
RISK APPETITERisk appetite is an expression of the types and amount of risk that the Group is willing to take or accept to achieve its objectives. It supports consistent, risk informed decision-making across the Group with the aim of ensuring that all significant risks are identified, assessed and managed to within acceptable levels.
The Group can use one or more actions to reduce the likelihood or impact of known risks to levels that it is comfortable with:
– choose to take or to tolerate risk; – treat risk with controls and mitigating actions; – transfer risk to third parties; or – terminate risk by ceasing particular activities or actions.
RISK CATEGORISATIONThe Group categorises risks as Strategic, Operational or Financial. Reputational impact is considered for all risks rather than noting a separate reputational category.
THE BOARD – Leadership of risk management – Ownership and monitoring
– Sets strategic objectives and risk appetite
AUDIT COMMITTEE – Delegated responsibility
from Board to oversee risk management and internal controls
– Reviews effectiveness of the Group’s internal control and risk management process
EXECUTIVE COMMITTEE – Ownership and management of
key risks – Assesses materiality of risks in
context of the whole Group
RISK MANAGEMENT COMMITTEE – Co-ordination and review
of key risks – Monitors mitigation
and controls
GROUP FUNCTIONS / SUBSIDIARY COMPANIES – Identification, assessment and
management of mitigation – Use risk as an explicit
part of decision-making and management of external relationships
RISK & ASSURANCE – Facilitation and challenge – Monitors and validates action
taken by management
– Independently reviews the effectiveness of the Group’s risk management and internal control processes
STRATEGIC
REPORT
CO
RPORATE G
OVERN
ANC
EFIN
ANC
IAL STATEMEN
TS
eOne Annual Report and Accounts 2015 | 33
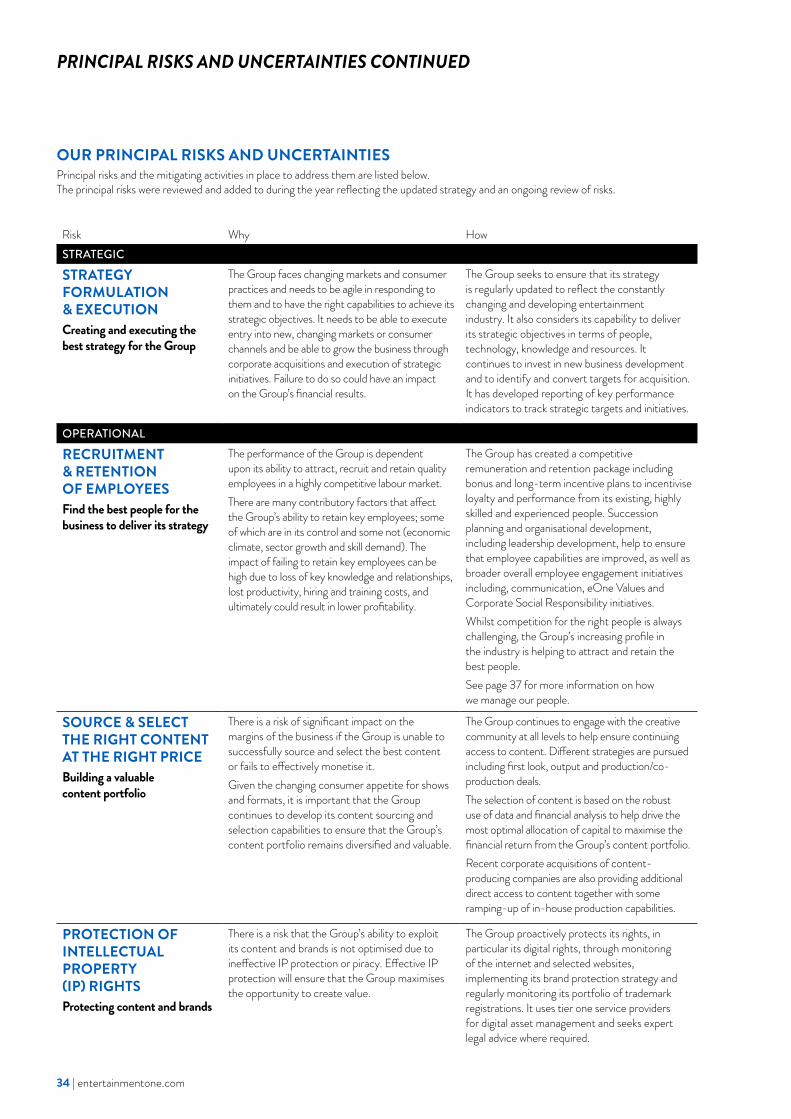
PRINCIPAL RISKS AND UNCERTAINTIES CONTINUED
OUR PRINCIPAL RISKS AND UNCERTAINTIESPrincipal risks and the mitigating activities in place to address them are listed below. The principal risks were reviewed and added to during the year reflecting the updated strategy and an ongoing review of risks.
Risk Why HowSTRATEGIC
STRATEGY FORMULATION & EXECUTIONCreating and executing the best strategy for the Group
The Group faces changing markets and consumer practices and needs to be agile in responding to them and to have the right capabilities to achieve its strategic objectives. It needs to be able to execute entry into new, changing markets or consumer channels and be able to grow the business through corporate acquisitions and execution of strategic initiatives. Failure to do so could have an impact on the Group’s financial results.
The Group seeks to ensure that its strategy is regularly updated to reflect the constantly changing and developing entertainment industry. It also considers its capability to deliver its strategic objectives in terms of people, technology, knowledge and resources. It continues to invest in new business development and to identify and convert targets for acquisition. It has developed reporting of key performance indicators to track strategic targets and initiatives.
OPERATIONAL
RECRUITMENT & RETENTION OF EMPLOYEESFind the best people for the business to deliver its strategy
The performance of the Group is dependent upon its ability to attract, recruit and retain quality employees in a highly competitive labour market. There are many contributory factors that affect the Group’s ability to retain key employees; some of which are in its control and some not (economic climate, sector growth and skill demand). The impact of failing to retain key employees can be high due to loss of key knowledge and relationships, lost productivity, hiring and training costs, and ultimately could result in lower profitability.
The Group has created a competitive remuneration and retention package including bonus and long-term incentive plans to incentivise loyalty and performance from its existing, highly skilled and experienced people. Succession planning and organisational development, including leadership development, help to ensure that employee capabilities are improved, as well as broader overall employee engagement initiatives including, communication, eOne Values and Corporate Social Responsibility initiatives.Whilst competition for the right people is always challenging, the Group’s increasing profile in the industry is helping to attract and retain the best people.See page 37 for more information on how we manage our people.
SOURCE & SELECT THE RIGHT CONTENT AT THE RIGHT PRICEBuilding a valuable content portfolio
There is a risk of significant impact on the margins of the business if the Group is unable to successfully source and select the best content or fails to effectively monetise it.Given the changing consumer appetite for shows and formats, it is important that the Group continues to develop its content sourcing and selection capabilities to ensure that the Group’s content portfolio remains diversified and valuable.
The Group continues to engage with the creative community at all levels to help ensure continuing access to content. Different strategies are pursued including first look, output and production/co-production deals. The selection of content is based on the robust use of data and financial analysis to help drive the most optimal allocation of capital to maximise the financial return from the Group’s content portfolio. Recent corporate acquisitions of content-producing companies are also providing additional direct access to content together with some ramping-up of in-house production capabilities.
PROTECTION OF INTELLECTUAL PROPERTY (IP) RIGHTSProtecting content and brands
There is a risk that the Group’s ability to exploit its content and brands is not optimised due to ineffective IP protection or piracy. Effective IP protection will ensure that the Group maximises the opportunity to create value.
The Group proactively protects its rights, in particular its digital rights, through monitoring of the internet and selected websites, implementing its brand protection strategy and regularly monitoring its portfolio of trademark registrations. It uses tier one service providers for digital asset management and seeks expert legal advice where required.
34 | entertainmentone.com
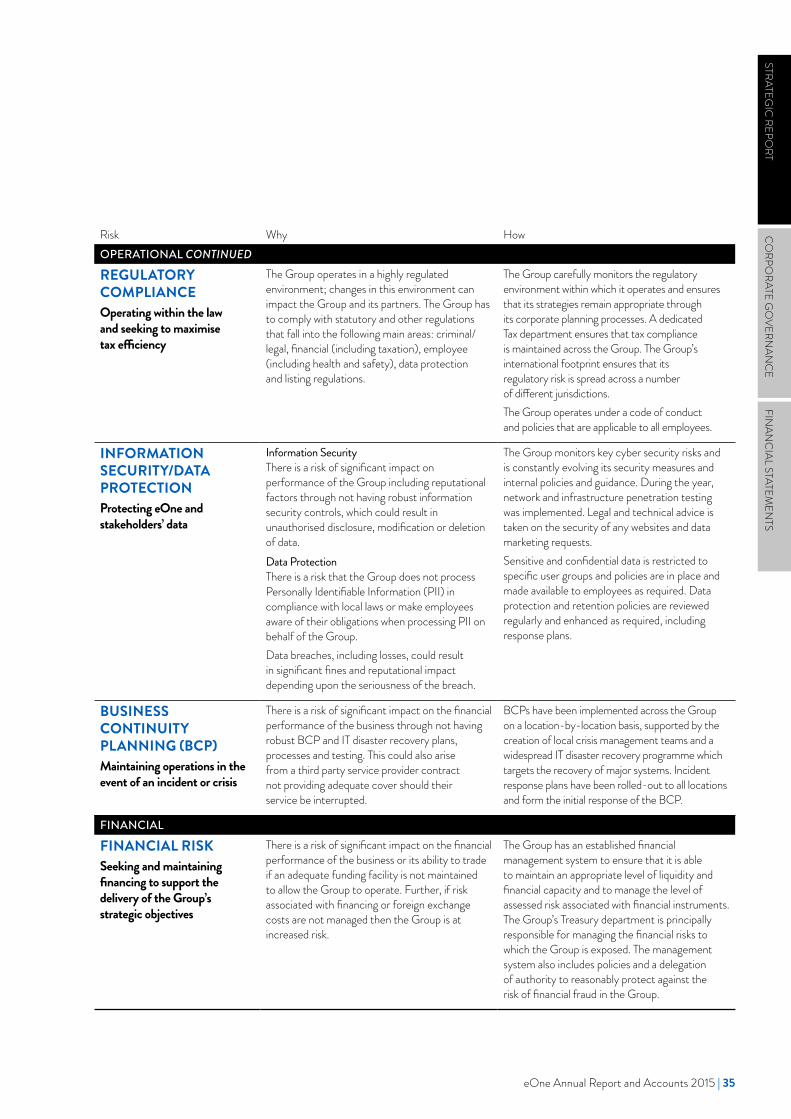
Risk Why HowOPERATIONAL CONTINUED
REGULATORY COMPLIANCEOperating within the law and seeking to maximise tax efficiency
The Group operates in a highly regulated environment; changes in this environment can impact the Group and its partners. The Group has to comply with statutory and other regulations that fall into the following main areas: criminal/legal, financial (including taxation), employee (including health and safety), data protection and listing regulations.
The Group carefully monitors the regulatory environment within which it operates and ensures that its strategies remain appropriate through its corporate planning processes. A dedicated Tax department ensures that tax compliance is maintained across the Group. The Group’s international footprint ensures that its regulatory risk is spread across a number of different jurisdictions.The Group operates under a code of conduct and policies that are applicable to all employees.
INFORMATION SECURITY/DATA PROTECTIONProtecting eOne and stakeholders’ data
Information SecurityThere is a risk of significant impact on performance of the Group including reputational factors through not having robust information security controls, which could result in unauthorised disclosure, modification or deletion of data.Data ProtectionThere is a risk that the Group does not process Personally Identifiable Information (PII) in compliance with local laws or make employees aware of their obligations when processing PII on behalf of the Group. Data breaches, including losses, could result in significant fines and reputational impact depending upon the seriousness of the breach.
The Group monitors key cyber security risks and is constantly evolving its security measures and internal policies and guidance. During the year, network and infrastructure penetration testing was implemented. Legal and technical advice is taken on the security of any websites and data marketing requests.Sensitive and confidential data is restricted to specific user groups and policies are in place and made available to employees as required. Data protection and retention policies are reviewed regularly and enhanced as required, including response plans.
BUSINESS CONTINUITY PLANNING (BCP)Maintaining operations in the event of an incident or crisis
There is a risk of significant impact on the financial performance of the business through not having robust BCP and IT disaster recovery plans, processes and testing. This could also arise from a third party service provider contract not providing adequate cover should their service be interrupted.
BCPs have been implemented across the Group on a location-by-location basis, supported by the creation of local crisis management teams and a widespread IT disaster recovery programme which targets the recovery of major systems. Incident response plans have been rolled-out to all locations and form the initial response of the BCP.
FINANCIAL
FINANCIAL RISKSeeking and maintaining financing to support the delivery of the Group’s strategic objectives
There is a risk of significant impact on the financial performance of the business or its ability to trade if an adequate funding facility is not maintained to allow the Group to operate. Further, if risk associated with financing or foreign exchange costs are not managed then the Group is at increased risk.
The Group has an established financial management system to ensure that it is able to maintain an appropriate level of liquidity and financial capacity and to manage the level of assessed risk associated with financial instruments. The Group’s Treasury department is principally responsible for managing the financial risks to which the Group is exposed. The management system also includes policies and a delegation of authority to reasonably protect against the risk of financial fraud in the Group.
STRATEGIC
REPORT
CO
RPORATE G
OVERN
ANC
EFIN
ANC
IAL STATEMEN
TS
eOne Annual Report and Accounts 2015 | 35
Ethical and responsible practices and a commitment to minimise our impact on the environment are key motivators behind the Group’s corporate responsibility framework.
The Group recognises that the performance of its business is reliant on close relationships with a range of stakeholders, including customers, suppliers, investors, employees, the wider community and the environment. The following is a summary of the many corporate responsibility activities in which we are involved.
The Group operates a Code of Business Conduct which sets out standards of conduct and business ethics which the Group requires its employees to comply with, and which includes provisions covering the Group’s anti-bribery policy and its whistleblowing channel.
CORPORATE RESPONSIBILITY
ONE COMMUNITY
Our Values
The Group’s operations continue to be guided by the shared values that it formalised in 2014, to highlight the Group’s distinctiveness and help to tell the eOne story. The values communicate what is important to our business and what makes us different in the industry. They influence our overall behaviour, how we treat each other and our partners, and help us in our decision-making processes. Our values influence the recruiting and retention of our teams, shape our organisational culture and contribute to our overall success.
WE CONNECT – By treating all of our colleagues and partners with fairness, honesty and respect – By creating an environment where all can flourish and succeed to their true potential – By supporting our industry and our local communities
WE CREATE – By bringing great ideas and stories to life – By working with people of different viewpoints, talents, experiences and backgrounds – By respecting local culture and knowledge
WE DELIVER – By setting and achieving ambitious goals – By meeting our commitments – By taking responsibility for our actions – By recognising the contribution of every team member
36 | entertainmentone.com

PEOPLEThe Group recognises that the skills, motivation and energy of our people are key drivers for success. The Group’s structure ensures that our teams are aware of our goals and are clear on how their roles help the Group succeed. Entertainment One is fundamentally a people business and the ability to attract, recruit and retain the best people is key to our success.
We seek to ensure we have appropriate processes to assess, manage and develop our people’s leadership skills, talents and experiences throughout the organisation.
The Group has numerous initiatives to promote employee engagement, including:
– regular Town Hall broadcasts to employees from our CEO;
– our internal intranet site and Yammer, our company-wide corporate social media platform;
– regular local office newsletters and global updates; – health and wellbeing initiatives organised in our office
locations; – various athletic teams and events, including a
summer softball league and an annual industry soccer tournament;
– team building events and an annual management retreat; and
– frequent film screenings/premieres, access to film/television libraries and discounts on eOne products.
Through our annual succession review and internal leadership framework we also aim to nurture talent and provide our people with a framework to advance their careers and provide Entertainment One with its future leaders.
We are committed to equality and diversity in our workforce and in addition to employing people with a wide mix of ethnic and cultural backgrounds, we also have a good balance between genders. Gender mix across the business is as follows:
Percentage of female employees
Percentage of male employees
Senior management 48% 52%Rest of workforce 62% 38%Total workforce 60% 40%
GREENHOUSE GAS (GHG) EMISSIONSThe Group collated data across all of its businesses with respect to their annual electricity and gas consumption. We have used the ISO 14064-1:2006 methodology to collate the data used in our GHG emissions report. The data collated was in kWh and was converted into tCO2 using guidelines from the UK Government’s GHG Conversion Factors for Carbon Reporting.
We deemed that collation of data from all eOne offices and warehouses was appropriate, and therefore no materiality level was applied.
Quantity
GHG Emissions by Scope Unit 2015 2014
Scope 2 Tonnes CO2e 2,780 2,785
Scope 2 intensityTonnes CO2e/
£m revenue 3.54 3.40
eOne is committed to reducing its impact on the environment and ensures that new office spaces have environmentally-friendly lighting and recycling points for the use of employees.
CHARITY AND COMMUNITYThe Group and its employees sponsored or supported many charitable initiatives involving both professional and non-profit organisations in all of our territories during the year.
The Group teamed up with a number of charities in Canada. Over C$4,000 was raised for United Way Toronto through the CN Tower Climb, C$10,000 was raised by eOne Canada’s Movember team, over 50 eOne employees ran in Toronto’s Sporting Life 10k race raising more than C$12,000 for Camp Oochigeas (a local charity supporting children affected by cancer) and a tonne of non-perishable food was donated to the Knight’s Table Food Bank.
Free the Children was one of the principal Canadian charity partners for 2014 and, through a number of events, the team raised almost C$60,000 for the organisation. Funds raised from our annual TIFF soccer tournament, which brings together industry partners and talent to swap their suits for jerseys in an industry soccer match, will be used to send three team members to Ecuador at the end of May 2015 to build a school on behalf of Free the Children.
STRATEGIC
REPORT
CO
RPORATE G
OVERN
ANC
EFIN
ANC
IAL STATEMEN
TS
eOne Annual Report and Accounts 2015 | 37
CORPORATE RESPONSIBILITY CONTINUED
Our Canadian team continues to be involved in Habitat for Humanity, a charity that helps low-income families build homes and we continue to be proud of the success of the Entertainment One Golf FORE Charity Tournament which has been held in Canada since 2007. The tournament is an annual event sponsored by our vendors and is attended by our major customers and partners. The event has now raised over C$680,000 in total for the SickKids Foundation, including C$100,000 in the current year.
2014 saw the extension of the CSR programme at eOne in the UK, including eOne Gives Back, designed to build on its charitable work and enhance working life within the Group – monthly lunches (prepared by employees) raise money for our charities and employees are allowed a paid day every year to work for a cause of their choice.
The UK office raised more than £10,000 for Kids Company, its principal charitable partner, with over £6,000 being raised at the eOne 100 challenge, an event which saw teams from across the UK office working together, competing to turn the largest profit on an initial investment of £100. Employees volunteered enthusiastically to help with a number of Kids Company’s schemes from teaching on Kids Company’s media programme to participating in the School of Confidence. We also provided tickets to premieres, held screenings and provided work experience.
Peppa Pig has maintained its partnership in the UK with the charity Tommy’s, which funds research into pregnancy problems and provides information to parents. Tommy’s has raised over £75,000 from activity weeks at Busy Bees Nurseries and Splash at First Choice holiday villages with the support of Peppa. Ben & Holly’s Little Kingdom’s partnership with ICAN (supporting children with speech, language and communication needs) has raised £65,000 through the Chatterbox Challenge. The Company has provided donations of merchandise to many charities
over the year, including The Rainbow Trust, Home Start Camden, The Light Fund and Save the Children.
In Spain, we continue to collaborate with Association ATZ, a Group that works in the social block of flats of Pinar de Chamartín and benefits children and youth in need. The Madrid office is donating merchandise to Association ATZ’s Tombola-Jumble Sale, the proceeds of which will go towards providing free education, employment guidance, and summer camps. We have also donated DVDs to Fundación Aladina, a foundation that helps children and families affected by cancer, and partnered with Banco de Alimentos (Madrid Food Bank), doubling our contribution this year.
On behalf of the SO SO Happy brand in the US, we have donated over US$4,500 to organisations such as The Breakfast Club of Canada, Walk for Miracles and National Tourette’s Foundation.
In Australia, our employee charity committee continues to support the Fact Tree Youth Service by providing food donations, monthly IT assistance, and the purchase of 30 Christmas gifts for local boys and girls aged 8-17 in need. In addition, our office raised A$4,300 for the Starlight Children’s Foundation at its September 2014 Movie Industry Trivia Night – Starlight Children’s Foundation places Starlight Rooms in every major children’s hospital in Australia. Employees participated in the City to Surf fun run and raised over A$5,000 for local charity Giant Steps, a foundation focused on services for families with autistic children.
eOne continues to partner with MediCinema, which aims to enrich the lives of critically ill or disabled patients by installing and managing permanent state-of-the-art cinemas in hospitals and places of care, showing the latest releases the film industry has to offer. In 2014, we hosted screenings of our own production, The Woman in Black: Angel of Death.
A SELECTION OF THE CHARITIES WE SUPPORTED IN THE YEAR
38 | entertainmentone.com
ENVIRONMENT AND WELL-BEINGOur activities are mainly office-based but also include warehousing and television production operations. We do not physically manufacture DVDs, CDs or merchandise but use third party suppliers. As such, our main environmental impacts come from the running of our businesses around the world, through the consumption of gas and electricity, transport activities and commuting, as well as office-based waste such as paper and printer toners.
We take our responsibilities seriously and work hard to minimise our impact on the environment. In all of our locations we have a recycling, conservation and usage policy. We monitor our supplier relationships and, wherever possible, make use of suppliers with consistent environmental aims.
The Group does not cause significant pollution and the Board is committed to further improving the way in which its activities affect the environment by:
– minimising the extent of the impact of operations within the Company’s areas of influence;
– conserving energy through reducing consumption and increasing efficiencies;
– minimising emissions that may cause environmental impacts; and
– promoting efficient purchasing and encouraging materials to be recycled where appropriate.
In Canada, Darren Throop and a team from eOne’s Brampton office participated in the Moraine for Life 160km Relay. The Relay is run to support the maintenance of the Oak Ridges Moraine and its network of conservation trails and conservation areas across Ontario.
Our Canadian operation supports a HIP Committee (Health for the Individual and the Planet). The Committee focuses on better living for employees through the provision of information on fitness, nutrition, environment and smoking cessation and organises a walking group for employees, boot camp fitness groups, soccer and ball hockey games and yoga classes.
The HIP Committee leads a number of green initiatives, including an annual community park clean-up for Earth Day, Adopt-a-Plant initiative and an overall goal of increasing the office’s waste diversion rate, achieved through the set-up of battery recycling centres, plastic bag recycling bins and organic waste bins. The Committee also works to bring the Canadian Blood Services Bloodmobile to the Brampton office on a quarterly basis, to encourage employees to donate blood while at work.
In the UK, eOne Active provides employees with opportunities to get and keep fit, ranging from boot camp sessions in Regent’s Park to yoga classes at lunchtime and eOne Social organises social events, with many of these initiatives complementing the Company’s fundraising activities for Kids Company.
The Australia office also emphasises health and fitness, with a weekly Pilates class and a Pilates Health and Lifestyle Challenge for employees.
Employees volunteering for eOne Green in the UK help make the Company more eco-friendly, by encouraging recycling and gardening in the outdoor spaces in the Warren Street office. The Australia Green Team is working to find eco-friendly equivalents for many of its office products. In Spain, the Green Team raises money through recycling to benefit Fundación Seur, which focuses on disadvantaged and marginalised children. The Group also aims to promote environmental awareness on set: in 2014, the cast and crew of our television series Rookie Blue made recycling a priority and have banned non-reusable water bottles on set.
HEALTH AND SAFETYThe Group has implemented a health and safety policy across all of its operations which meets at least the minimum legal requirements of the countries in which it operates and emphasises the principles of good safety management. The Group is committed to providing a safe working environment and to caring for the health and safety of its employees, visitors and contractors.
Regular health and safety reviews are carried out on the offices and warehouses of the Group. Each location has a nominated individual responsible for health and safety and for ensuring a safe environment for our colleagues.
We recognise that health and safety is an integral part of our operations. Our services do not pose great risk to either our employees or our customers. However, we work to maintain a safe environment at all times.
STRATEGIC
REPORT
CO
RPORATE G
OVERN
ANC
EFIN
ANC
IAL STATEMEN
TS
eOne Annual Report and Accounts 2015 | 39

The reports on the following pages explain our governance arrangements in detail and describe how we have applied the principles of corporate governance contained in the UK Corporate Governance Code.
Our Audit Committee continues to have a very full programme of meetings, with its four regular meetings in the year supplemented this year with four additional meetings to cover the acquisitions made during the year and the Group’s financial announcements. The Group’s risk review process has been formalised with the Executive Committee reviewing risks on a quarterly basis, and upward reporting to the Audit Committee and the Board.
The performance of the Group is dependent on its ability to attract, recruit and retain quality people in a highly competitive labour market and succession planning is an important contributor to the long-term success of the business. Our Nomination Committee carefully reviews succession plans for the executive directors and senior management and our Remuneration Committee ensures that our remuneration policy supports the succession planning process.
The Board recognises the importance of interaction with operational management and access to senior management is achieved through regular business review presentations provided to the Board and a full-day planning meeting with executive management to review the Group’s strategy, budgets and three year plans. In addition, the Audit Committee has a rolling programme of presentations from senior finance leaders from across the business focusing on the internal control environments of individual operating units.
During the year, the Group continued to expand its Internal Audit function with the recruitment of two Internal Audit Managers and the implementation of a formal internal audit plan. The Group continues to manage its risk environment through the framework it adopted on its step-up to a premium listing on the London Stock Exchange.
As noted in last year’s Annual Report the Group put in place an Executive Committee which meets on a monthly basis, and which reviews risk management formally on a quarterly basis.
ALLAN LEIGHTON NON-EXECUTIVE CHAIRMAN18 May 2015
CORPORATE GOVERNANCE
Entertainment One is committed to achieving high standards of corporate governance and the Group has well-established policies and procedures which are designed to facilitate good governance in a practical and workable way.
40 | entertainmentone.com
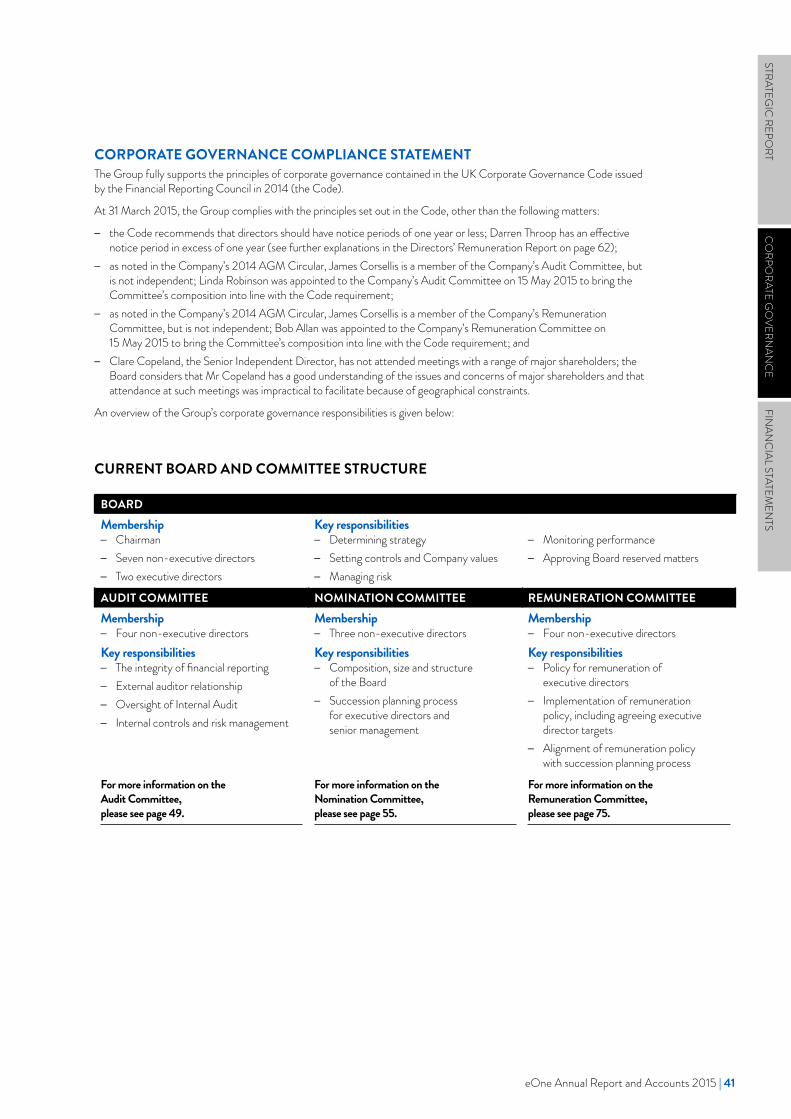
CORPORATE GOVERNANCE COMPLIANCE STATEMENTThe Group fully supports the principles of corporate governance contained in the UK Corporate Governance Code issued by the Financial Reporting Council in 2014 (the Code).
At 31 March 2015, the Group complies with the principles set out in the Code, other than the following matters:
– the Code recommends that directors should have notice periods of one year or less; Darren Throop has an effective notice period in excess of one year (see further explanations in the Directors’ Remuneration Report on page 62);
– as noted in the Company’s 2014 AGM Circular, James Corsellis is a member of the Company’s Audit Committee, but is not independent; Linda Robinson was appointed to the Company’s Audit Committee on 15 May 2015 to bring the Committee’s composition into line with the Code requirement;
– as noted in the Company’s 2014 AGM Circular, James Corsellis is a member of the Company’s Remuneration Committee, but is not independent; Bob Allan was appointed to the Company’s Remuneration Committee on 15 May 2015 to bring the Committee’s composition into line with the Code requirement; and
– Clare Copeland, the Senior Independent Director, has not attended meetings with a range of major shareholders; the Board considers that Mr Copeland has a good understanding of the issues and concerns of major shareholders and that attendance at such meetings was impractical to facilitate because of geographical constraints.
An overview of the Group’s corporate governance responsibilities is given below:
CURRENT BOARD AND COMMITTEE STRUCTURE
BOARDMembership
– Chairman – Seven non-executive directors – Two executive directors
Key responsibilities – Determining strategy – Setting controls and Company values – Managing risk
– Monitoring performance – Approving Board reserved matters
AUDIT COMMITTEE NOMINATION COMMITTEE REMUNERATION COMMITTEEMembership
– Four non-executive directorsKey responsibilities
– The integrity of financial reporting – External auditor relationship – Oversight of Internal Audit – Internal controls and risk management
Membership – Three non-executive directors
Key responsibilities – Composition, size and structure
of the Board – Succession planning process
for executive directors and senior management
Membership – Four non-executive directors
Key responsibilities – Policy for remuneration of
executive directors – Implementation of remuneration
policy, including agreeing executive director targets
– Alignment of remuneration policy with succession planning process
For more information on the Audit Committee, please see page 49.
For more information on the Nomination Committee, please see page 55.
For more information on the Remuneration Committee, please see page 75.
STRATEGIC
REPORT
CO
RPORATE G
OVERN
ANC
EFIN
ANC
IAL STATEMEN
TS
eOne Annual Report and Accounts 2015 | 41
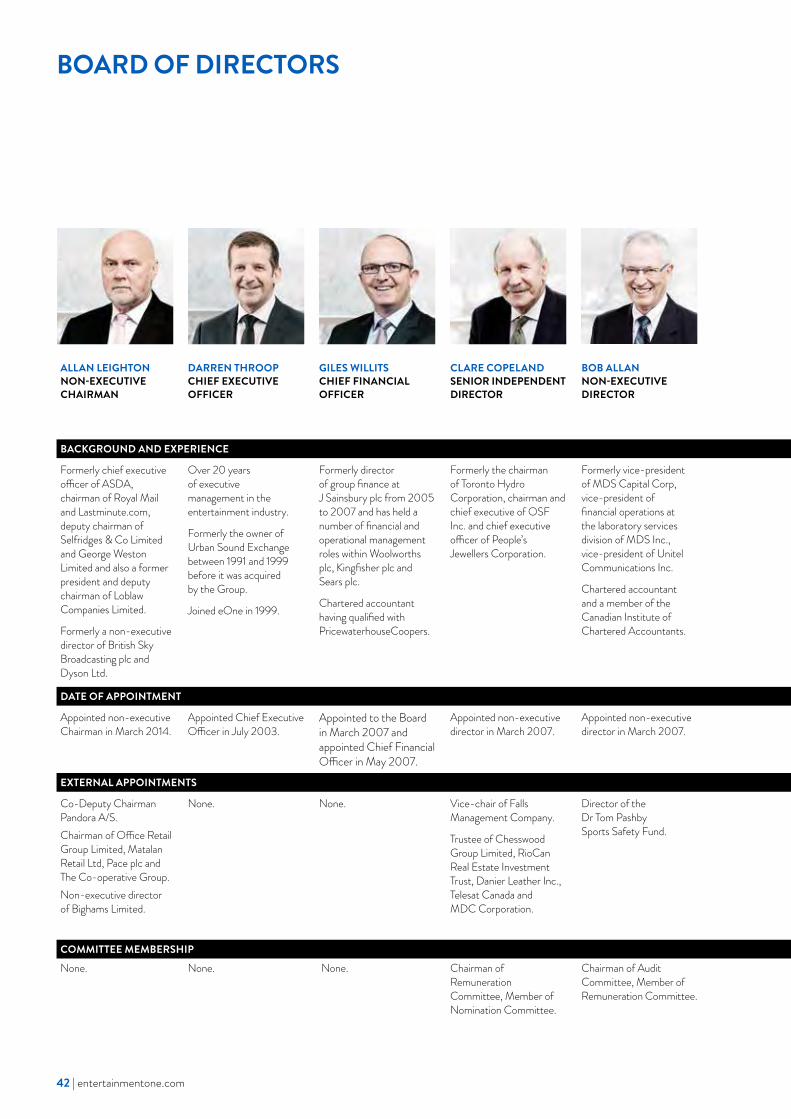
BOARD OF DIRECTORS
ALLAN LEIGHTONNON-EXECUTIVE CHAIRMAN
DARREN THROOPCHIEF EXECUTIVE OFFICER
GILES WILLITS CHIEF FINANCIAL OFFICER
CLARE COPELAND SENIOR INDEPENDENT DIRECTOR
BOB ALLAN NON-EXECUTIVE DIRECTOR
RONALD ATKEYNON-EXECUTIVE DIRECTOR
JAMES CORSELLISNON-EXECUTIVE DIRECTOR
GARTH GIRVANNON-EXECUTIVE DIRECTOR
MARK OPZOOMERNON-EXECUTIVE DIRECTOR
LINDA ROBINSONNON-EXECUTIVE DIRECTOR
BACKGROUND AND EXPERIENCE
Formerly chief executive officer of ASDA, chairman of Royal Mail and Lastminute.com, deputy chairman of Selfridges & Co Limited and George Weston Limited and also a former president and deputy chairman of Loblaw Companies Limited.
Formerly a non-executive director of British Sky Broadcasting plc and Dyson Ltd.
Over 20 years of executive management in the entertainment industry.
Formerly the owner of Urban Sound Exchange between 1991 and 1999 before it was acquired by the Group.
Joined eOne in 1999.
Formerly director of group finance at J Sainsbury plc from 2005 to 2007 and has held a number of financial and operational management roles within Woolworths plc, Kingfisher plc and Sears plc.
Chartered accountant having qualified with PricewaterhouseCoopers.
Formerly the chairman of Toronto Hydro Corporation, chairman and chief executive of OSF Inc. and chief executive officer of People’s Jewellers Corporation.
Formerly vice-president of MDS Capital Corp, vice-president of financial operations at the laboratory services division of MDS Inc., vice-president of Unitel Communications Inc.
Chartered accountant and a member of the Canadian Institute of Chartered Accountants.
Formerly a partner at Osler, Hoskin & Harcourt LLP with extensive experience in government regulation of Canadian cultural industries and corporate transactions in the arts, entertainment and media sectors.
Formerly was Chair of the Security Intelligence Review Committee.
Formerly a director of Breedon Aggregates, Concanteo plc, icollector plc and Catalina Holdings Ltd.
Formerly a director of Corby Distilleries Limited and Silcorp Limited.
Garth is called as a barrister and solicitor in Ontario (1978), Alberta (1982) and New York (1986).
Formerly CEO of Rambler Media Ltd, regional vice-chair of Yahoo! Europe, deputy CEO of Hodder Headline, director of Sega Europe Ltd and Virgin Communications Ltd.
Formerly non-executive director of Newbay Software Ltd, Web Reservations International Ltd, Autonomy plc and Miva Inc.
A retired partner at Osler, Hoskin & Harcourt LLP with extensive experience in the communications and media industries.
Formerly a director of a number of public and private companies.
DATE OF APPOINTMENT
Appointed non-executive Chairman in March 2014.
Appointed Chief Executive Officer in July 2003.
Appointed to the Board in March 2007 and appointed Chief Financial Officer in May 2007.
Appointed non-executive director in March 2007.
Appointed non-executive director in March 2007.
Appointed non-executive director in November 2010.
Appointed non-executive director in March 2007.
Appointed non-executive director in March 2007.
Appointed non-executive director in March 2007.
Appointed non-executive director in March 2014.
EXTERNAL APPOINTMENTS
Co-Deputy Chairman Pandora A/S.Chairman of Office Retail Group Limited, Matalan Retail Ltd, Pace plc and The Co-operative Group.Non-executive director of Bighams Limited.
None. None. Vice-chair of Falls Management Company.
Trustee of Chesswood Group Limited, RioCan Real Estate Investment Trust, Danier Leather Inc., Telesat Canada and MDC Corporation.
Director of the Dr Tom Pashby Sports Safety Fund.
None. Co-founder and managing partner at Marwyn Investment Management LLP.
Partner at the Canadian law firm McCarthy Tétrault LLP.
Non-executive director of Imax Corporation.
Partner Bond Capital Partners.
Non-executive Chairman of Somo Global Ltd, non-executive director of Blinkx plc and Adviser at Forward Internet Group Ltd.
Director and vice-chair of Infrastructure Ontario.
Director and Corporate Secretary of Women Lawyers Joining Hands.
COMMITTEE MEMBERSHIP
None. None. None. Chairman of Remuneration Committee, Member of Nomination Committee.
Chairman of Audit Committee, Member of Remuneration Committee.
Chairman of Nomination Committee.
Member of Audit, Remuneration and Nomination Committees.
Member of Remuneration Committee.
Member of Audit Committee.
Member of Audit Committee.
42 | entertainmentone.com
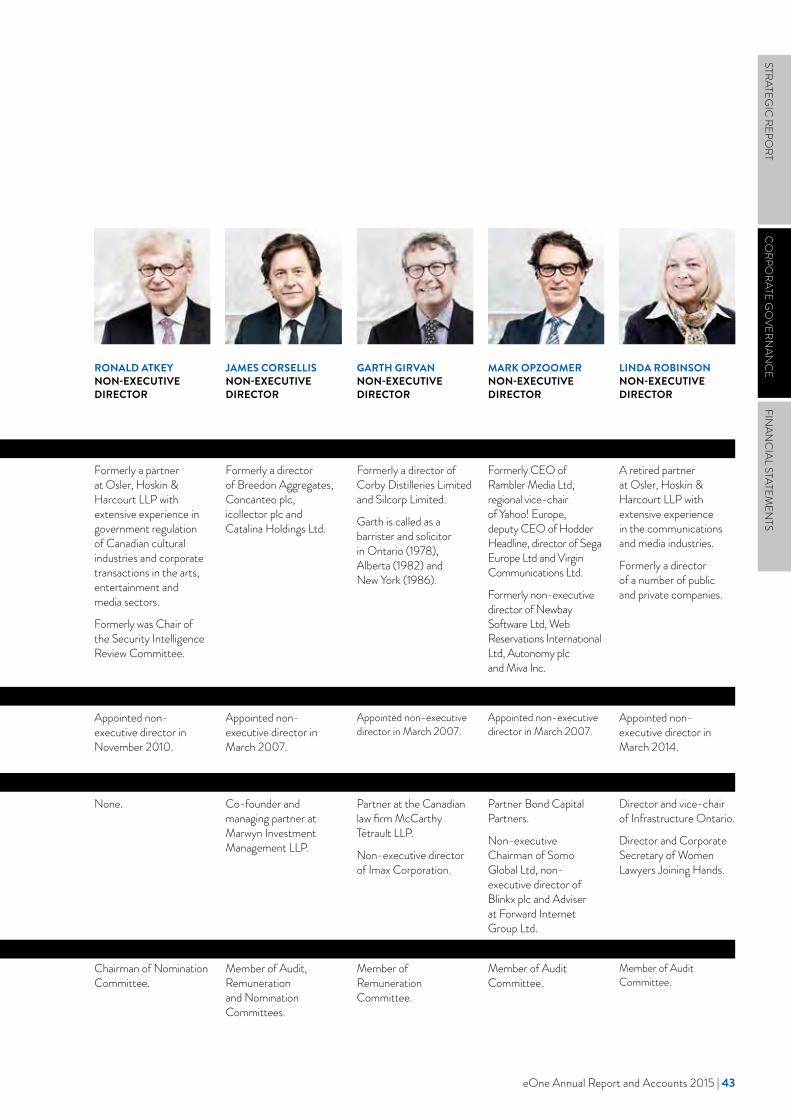
ALLAN LEIGHTONNON-EXECUTIVE CHAIRMAN
DARREN THROOPCHIEF EXECUTIVE OFFICER
GILES WILLITS CHIEF FINANCIAL OFFICER
CLARE COPELAND SENIOR INDEPENDENT DIRECTOR
BOB ALLAN NON-EXECUTIVE DIRECTOR
RONALD ATKEYNON-EXECUTIVE DIRECTOR
JAMES CORSELLISNON-EXECUTIVE DIRECTOR
GARTH GIRVANNON-EXECUTIVE DIRECTOR
MARK OPZOOMERNON-EXECUTIVE DIRECTOR
LINDA ROBINSONNON-EXECUTIVE DIRECTOR
BACKGROUND AND EXPERIENCE
Formerly chief executive officer of ASDA, chairman of Royal Mail and Lastminute.com, deputy chairman of Selfridges & Co Limited and George Weston Limited and also a former president and deputy chairman of Loblaw Companies Limited.
Formerly a non-executive director of British Sky Broadcasting plc and Dyson Ltd.
Over 20 years of executive management in the entertainment industry.
Formerly the owner of Urban Sound Exchange between 1991 and 1999 before it was acquired by the Group.
Joined eOne in 1999.
Formerly director of group finance at J Sainsbury plc from 2005 to 2007 and has held a number of financial and operational management roles within Woolworths plc, Kingfisher plc and Sears plc.
Chartered accountant having qualified with PricewaterhouseCoopers.
Formerly the chairman of Toronto Hydro Corporation, chairman and chief executive of OSF Inc. and chief executive officer of People’s Jewellers Corporation.
Formerly vice-president of MDS Capital Corp, vice-president of financial operations at the laboratory services division of MDS Inc., vice-president of Unitel Communications Inc.
Chartered accountant and a member of the Canadian Institute of Chartered Accountants.
Formerly a partner at Osler, Hoskin & Harcourt LLP with extensive experience in government regulation of Canadian cultural industries and corporate transactions in the arts, entertainment and media sectors.
Formerly was Chair of the Security Intelligence Review Committee.
Formerly a director of Breedon Aggregates, Concanteo plc, icollector plc and Catalina Holdings Ltd.
Formerly a director of Corby Distilleries Limited and Silcorp Limited.
Garth is called as a barrister and solicitor in Ontario (1978), Alberta (1982) and New York (1986).
Formerly CEO of Rambler Media Ltd, regional vice-chair of Yahoo! Europe, deputy CEO of Hodder Headline, director of Sega Europe Ltd and Virgin Communications Ltd.
Formerly non-executive director of Newbay Software Ltd, Web Reservations International Ltd, Autonomy plc and Miva Inc.
A retired partner at Osler, Hoskin & Harcourt LLP with extensive experience in the communications and media industries.
Formerly a director of a number of public and private companies.
DATE OF APPOINTMENT
Appointed non-executive Chairman in March 2014.
Appointed Chief Executive Officer in July 2003.
Appointed to the Board in March 2007 and appointed Chief Financial Officer in May 2007.
Appointed non-executive director in March 2007.
Appointed non-executive director in March 2007.
Appointed non-executive director in November 2010.
Appointed non-executive director in March 2007.
Appointed non-executive director in March 2007.
Appointed non-executive director in March 2007.
Appointed non-executive director in March 2014.
EXTERNAL APPOINTMENTS
Co-Deputy Chairman Pandora A/S.Chairman of Office Retail Group Limited, Matalan Retail Ltd, Pace plc and The Co-operative Group.Non-executive director of Bighams Limited.
None. None. Vice-chair of Falls Management Company.
Trustee of Chesswood Group Limited, RioCan Real Estate Investment Trust, Danier Leather Inc., Telesat Canada and MDC Corporation.
Director of the Dr Tom Pashby Sports Safety Fund.
None. Co-founder and managing partner at Marwyn Investment Management LLP.
Partner at the Canadian law firm McCarthy Tétrault LLP.
Non-executive director of Imax Corporation.
Partner Bond Capital Partners.
Non-executive Chairman of Somo Global Ltd, non-executive director of Blinkx plc and Adviser at Forward Internet Group Ltd.
Director and vice-chair of Infrastructure Ontario.
Director and Corporate Secretary of Women Lawyers Joining Hands.
COMMITTEE MEMBERSHIP
None. None. None. Chairman of Remuneration Committee, Member of Nomination Committee.
Chairman of Audit Committee, Member of Remuneration Committee.
Chairman of Nomination Committee.
Member of Audit, Remuneration and Nomination Committees.
Member of Remuneration Committee.
Member of Audit Committee.
Member of Audit Committee.
STRATEGIC
REPORT
CO
RPORATE G
OVERN
ANC
EFIN
ANC
IAL STATEMEN
TS
eOne Annual Report and Accounts 2015 | 43
BOARD OVERVIEWThe aim of the Board is to promote the long-term success of the Group. On behalf of shareholders, it is responsible for creating a framework of strategy and controls within which eOne operates and for the Group’s proper management. The Board takes account of the impact of its decisions not only on its shareholders but also on a wider group of stakeholders including employees, the communities in which it operates and its financing partners.
The Board is responsible for overseeing the implementation of strategy by the management team, setting the Group’s overall risk framework and monitoring the Group’s financial and operational performance.
A number of matters are specifically reserved for the Board’s approval. For example, the approval of annual budgets and forecasts, the approval of interim and annual results, setting and monitoring strategy, considering major acquisitions and approving investments in content and capital expenditure in excess of pre-agreed value thresholds. Other matters are delegated to the Audit, Remuneration and Nomination Committees. There are terms of reference for each of these Committees specifying their responsibilities, which are available on the Group’s website.
The Board operates both formally, through Board and Committee meetings, and informally, through regular contact between directors and senior executives.
The directors can obtain independent professional advice at the Company’s expense in the performance of their duties as directors.
BOARD MEMBERSHIPAs at 31 March 2015, the Board comprised a non-executive chairman, seven other non-executive directors and two executive directors.
The Company’s Articles of Amalgamation set specific requirements with respect to the Company’s directors, as follows:
– at least two-thirds of the directors must be Canadian; – a majority of the directors must be resident
Canadians; and – a majority of the directors must be independent.
For the financial year and as at 31 March 2015, the Board has complied with these requirements.
Information about the directors, including their background and experience, is given on pages 42 and 43.
THE CHAIRMANThe role of the Chairman is to provide leadership to the Board and to ensure that the Board and its Committees operate effectively. He sets the agenda for Board meetings and chairs the meetings to facilitate open and constructive debate.
The Chairman is Allan Leighton.
THE CHIEF EXECUTIVE OFFICERThe Chief Executive Officer is responsible for the day-to-day management of the business and for the development of strategy for approval by the Board.
There is a clear division of responsibility between the Chairman and the Chief Executive Officer which is formally documented and agreed by the Board.
The Chief Executive Officer is Darren Throop.
SENIOR INDEPENDENT DIRECTORThe role of the Senior Independent Director is to act as a sounding board to the Chairman and to provide an additional point of contact for shareholders. He acts as an intermediary for other directors and is responsible for coordinating the process for the evaluation of the performance of the Chairman.
The Senior Independent Director is Clare Copeland.
NON-EXECUTIVE DIRECTORSThe non-executive directors bring a wide range of experience and expertise to the Group’s activities and provide a strong balance to the executive directors. Their role is to provide an independent element to the Board and to constructively challenge management.
INDEPENDENCE OF NON-EXECUTIVE DIRECTORSThe Board has reviewed the independence of the non-executive directors and concluded that seven non-executive directors including the Company’s Chairman are independent. The independent directors are: Allan Leighton, Clare Copeland, Bob Allan, Ronald Atkey, Garth Girvan, Linda Robinson and Mark Opzoomer.
The review took into account the results of the Board’s annual performance evaluation, together with the factors listed in the Code.
One non-executive director, James Corsellis, is not considered to be independent due to his relationship with Marwyn, a significant shareholder of the Company, as further outlined in Note 36 to the consolidated financial statements.
CORPORATE GOVERNANCE REPORT
44 | entertainmentone.com
TIME COMMITMENTThe Chairman is expected to spend approximately one day per week and other non-executive directors are expected to spend approximately one day per month on Group business. This includes attendance at Board and Committee meetings, preparation for meetings and the provision of advice and assistance to the Group outside of Board and Committee meetings.
BOARD MEETINGSThere are regular, scheduled Board and Committee meetings throughout the year and additional ad hoc meetings are held as necessary. During the current financial year, there were thirteen Board meetings.
There are annual work plans which list the recurring items to be dealt with at each scheduled Board and Committee meeting, as well as specific items which are addressed at different points during the year.
BOARD PAPERSThe Board is supplied with detailed Board papers, in a timely manner, in a form and quality appropriate to enable it to discharge its duties. These include routine reports on the performance of the business and on any matters for Board approval. Standard formats have been developed for the reports to make it easy to track progress against targets and identify key facts. In addition to written reports, presentations are also given to the Board reviewing the performance and outlook of the Group’s Film and Television Divisions.
A detailed agenda is prepared for each meeting to make sure there is sufficient time allocated to deal with all issues.
CONFLICTS OF INTERESTThe Group has adopted and followed a procedure under which directors must declare actual or potential conflicts of interest as they arise. The Board reviews potential conflict of interest situations arising from other posts held by directors on an annual basis.
No actual conflicts of interest arising in respect of any specific arrangement or transaction have been declared to the Board during the financial year.
BOARD PERFORMANCE EVALUATIONEach year the Board undertakes a formal internal evaluation of its own performance and that of its Committees and individual directors. This review also includes an evaluation of the Chairman’s performance.
An evaluation questionnaire has been developed covering the key attributes of an effective Board, the role of the Chairman, the role of the Senior Independent Director and the role of executive and non-executive directors which is provided to each director to enable them to provide specific feedback. These questionnaires are
collated and used as input to a performance discussion at the relevant Board meeting on an annual basis.
Separate questionnaires are developed for each Committee and these are completed by Committee members and collated as input to an annual performance discussion at the relevant Committee meeting. In addition, specific feedback is sought on the performance of the Audit Committee from the Group’s Chief Executive Officer, Chief Financial Officer and the Company’s external auditor.
The Chairman and the Senior Independent Director meet to evaluate the performance of individual directors and this evaluation enables the Group to confirm on an annual basis that the individual directors continue to perform their roles effectively and that non-executive directors continue to demonstrate ongoing time commitment to their roles. The evaluation also informs the Group’s determination of the independence of individual directors, as noted in this report.
The Senior Independent Director leads a discussion amongst the non-executive directors, on an annual basis, to consider the performance of the Company’s Chairman.
BOARD COMMITTEESThe Board Committees comprise the Audit Committee, the Remuneration Committee and the Nomination Committee, each of which operates within defined terms of reference which are displayed on the Group’s website.
During the year, the Audit Committee comprised Bob Allan (Chairman) with James Corsellis and Mark Opzoomer as the other non-executive members. Mark Opzoomer and Bob Allan have recent and relevant financial experience. On 15 May 2015, Linda Robinson was appointed as a third independent member of the Audit Committee to bring the Committee’s composition into line with Code requirements.
During the year, the Remuneration Committee comprised Clare Copeland (Chairman) with James Corsellis and Garth Girvan as the other non-executive members. On 15 May 2015, Bob Allan was appointed as a third independent member of the Remuneration Committee to bring the Committee’s composition into line with Code requirements.
During the year, the Nomination Committee comprised Clare Copeland (Chairman) with James Corsellis and Ronald Atkey as the other non-executive members. On 15 May 2015, the Board appointed Ronald Atkey as the Chairman of the Committee, with Mr Copeland remaining a member of the Committee.
Further details of the operation of these Board Committees are given on pages 49 to 75.
STRATEGIC
REPORT
CO
RPORATE G
OVERN
ANC
EFIN
ANC
IAL STATEMEN
TS
eOne Annual Report and Accounts 2015 | 45
CORPORATE GOVERNANCE REPORT CONTINUED
BOARD AND COMMITTEE MEETING ATTENDANCEThe table below sets out the attendance at Board and Committee meetings during the year, by presence or by telephone, of individual directors.
BoardAudit
CommitteeRemuneration
CommitteeNomination Committee
Total held in year 13 8 4 2Allan Leighton 13 – – –Darren Throop 13 – – –Giles Willits 13 – – –Clare Copeland 12 – 4 2Bob Allan1 13 8 – –Ronald Atkey 13 – – 2Garth Girvan 12 – 4 –James Corsellis 8 7 3 1Mark Opzoomer 13 7 – –Linda Robinson2 12 – – –1. Appointed to the Remuneration Committee on 15 May 2015.2. Appointed to the Audit Committee on 15 May 2015.
DIALOGUE WITH SHAREHOLDERSThe Group maintains a regular dialogue with analysts and institutional shareholders to discuss its performance and future prospects and holds regular meetings with them. In the current financial year, the executive directors have undertaken an extended round of meetings with investors both in the UK and abroad – these took place at the time of the Group’s full year and interim results, and as part of specific investor programmes in Europe and North America.
In order to assist non-executive directors to develop an understanding of the views of major shareholders, the Board is presented with a shareholder report covering key shareholder issues, share price performance, the composition of the shareholder register and analyst expectations at each regular Board meeting.
The Company responds formally to all queries and requests for information from existing and prospective shareholders. In addition, the Company seeks to regularly update shareholders through stock exchange
announcements and wider press releases on its activities. It publishes regular trading updates as well as a full Annual Report and Accounts.
Clare Copeland, the Senior Independent Director, has not attended meetings with any major shareholders as suggested by Code provision E.1.1. The Board considers that Mr Copeland has a good understanding of the issues and concerns of major shareholders, through regular updates provided to the Board, and that his attendance at such meetings was impractical to facilitate because of geographical constraints.
The Annual General Meeting provides an opportunity for shareholders to address questions to the Chairman or the Board directly. All the directors attend the meeting and are available to answer questions. Time is set aside after the formal business of the AGM for shareholders to talk informally with the directors.
Shareholders can access further information on the Group via the Company’s website at www.entertainmentone.com.
46 | entertainmentone.com
ANNUAL GENERAL MEETINGThe 2014 Annual General Meeting was held on 11 September 2014 at the offices of Osler, Hoskin & Harcourt LLP in Toronto, Canada.
All resolutions were passed, with votes in favour of all resolutions being in excess of 90% of votes cast, except the resolution in relation to the Chairman’s Award which was passed with votes in favour of 70%.
All directors were re-elected to the Board with at least 95% of the votes cast in favour of each individual director.
The Company plans to hold its 2015 Annual General Meeting on 16 September 2015 in Toronto.
RISK MANAGEMENT AND INTERNAL CONTROLSThe directors are responsible for the Group’s system of internal control and for reviewing its effectiveness, whilst the role of management is to implement Board policies on risk management and control. It should be recognised that the Group’s system of internal control is designed to manage, rather than eliminate, the risk of failure to achieve the Group’s business objectives and can only provide reasonable, and not absolute, assurance against material misstatement or loss.
The Group operates a series of controls to meet its needs. These controls include, but are not limited to, a clearly defined organisational structure, written policies, minimum financial controls and Group authority limits, a comprehensive annual strategic planning and budgeting process and detailed monthly reporting. The Group’s internal controls fall into four key areas: financial controls, operational controls, compliance and risk management.
FINANCIAL CONTROLSFINANCIAL REPORTINGAll operating units complete business plans and budgets for the year. The annual budget is approved by the Board as part of its normal responsibilities. In addition, the budget figures are regularly re-forecast to facilitate the Board’s understanding of the Group’s overall position throughout the year and this re-forecasting is reported to the Board.
Each month, operating units produce written reports in a defined format on their performance against these plans and provide updated business forecasts. The reports and forecasts are reviewed by the executive directors. Reports from operating units are consolidated into monthly management accounts and presented to the Board on a regular basis, with significant issues discussed by the Board, as appropriate.
ACCOUNTING POLICIES AND PROCEDURESThe Group has written accounting policies and procedures which are applicable to all of the Group’s operations. Local management is required to provide written confirmation of compliance with the policies and procedures as part of the half year and full year results process.
There is a formal review process overseen by the Audit Committee which seeks to verify that policies and procedures have been correctly applied and to confirm that there is an effective process of management and control within the business. Compliance with internal controls is monitored on a regular basis through the Group’s internal audit programme.
INFORMATION TECHNOLOGY SECURITYThe Group relies on financial and management information processed by, and stored on, computer systems. Controls and procedures have been established to endeavour to protect the security and integrity of data held on the systems, with disaster recovery arrangements in the event of failure of major systems. Tests are conducted on an annual basis to assess the security of the systems. This year there has been a particular focus on information and network security and regular updates have been presented to the Audit Committee on this issue.
TREASURYThe treasury function operates under guidelines and policies approved by the Board and regular reports are made to the Board on treasury activities.
INVESTMENTSThe Group has defined procedures for the review and control of acquisitions, investments in content and capital expenditure. Expenditure requires different levels of approval according to the level of spend. Significant expenditure requires full Board approval and all approval requests are presented in a defined format to ensure that full justification is provided, including projected financial returns on the investment.
OPERATIONAL CONTROLSAll Group businesses are required to operate in accordance with detailed standards and procedures which cover all material aspects of their operations. Compliance with these standards is subject to assessment by internal and external review.
As part of the Group’s half year and full year reporting processes, local management confirms by way of a Corporate Governance Statement of Compliance and a Letter of Representation that its operating units have complied with Group control requirements.
There have been no significant control failures during the year.
STRATEGIC
REPORT
CO
RPORATE G
OVERN
ANC
EFIN
ANC
IAL STATEMEN
TS
eOne Annual Report and Accounts 2015 | 47
CORPORATE GOVERNANCE REPORT CONTINUED
COMPLIANCEThere is a Group Code of Business Conduct which sets out standards of conduct and business ethics which the Group requires its employees to comply with. All members of senior management sign-off on the Code of Business Conduct on an annual basis, including confirmation that members of their teams understand the Code. Separate Anti-bribery and Whistleblowing policies are in place across the Group and are included in the annual senior management sign-off process. All Group polices are available to employees via the Group’s intranet.
There is a schedule of delegated authority designed to ensure that all material transactions are considered at the appropriate level within the Group and are subject to review by the Group Finance team.
When acquisitions are made, the Group’s controls and accounting policies are implemented during the first full year of ownership.
RISK MANAGEMENTThe Company’s risk framework has been formalised during the year and is reviewed on a quarterly basis by the Executive Committee and Audit Committee. The Audit Committee reports formally on risk management to the Board on a quarterly basis.
The Executive Committee is chaired by Darren Throop, the Chief Executive Officer, and meets monthly with a focus on risk on a quarterly basis. The role of the Committee is to:
– promote effective identification and management of risk throughout the Group;
– maintain a risk register identifying significant risks, risk control measures and responsibility for control measures;
– review and confirm that all significant risks have been identified and suitable control measures adopted;
– monitor implementation of risk control measures for all significant risks; and
– ensure all operating units operate an effective risk management process.
In addition, the Audit Committee receives reports from management and the external auditor concerning the system of internal control and any material control weaknesses. Any significant risk issues are referred to the Board for consideration.
During the year, the Group continued to develop its Internal Audit function through the recruitment of two Internal Audit Managers and the implementation of a formal internal audit programme covering the Group’s key operations.
BOARD REVIEW PROCESSThe Board conducts a review of the effectiveness of the Group’s system of internal controls, covering all material controls, including financial, operational and compliance controls and risk management systems as part of its half year and full year financial reporting process.
The Board’s assessment of the Company’s risk framework is supported by the quarterly updates it receives at Board meetings and the existence of a rolling internal audit programme that places a focus on internal controls.
As a premium listed Company, the Group’s approach to its control environment is codified in its Financial Position and Prospects Procedures. These procedures are maintained on an ongoing basis and are formally reviewed and re-adopted by the Board on an annual basis.
The independence and objectivity of the external auditor is considered on a regular basis, with particular regard to non-audit fees. The split between audit and non-audit fees for the year under review appears in Note 6 to the consolidated financial statements.
The external auditor has in place processes to ensure independence is maintained including safeguards to ensure that where it provides non-audit services its independence is not threatened. In this context, the Audit Committee considers that it is appropriate for the external auditor to provide tax advice and other accounting and transactional services to the Group, including those in connection with supporting and reporting on financial representations in public documentation and due diligence on acquisitions.
INTERNAL CONTROL AND COMPLIANCE STATEMENTThe directors acknowledge their overall responsibility for the system of internal control and for reviewing its effectiveness. They have established a system that is designed to provide reasonable but not absolute assurance against material misstatement or loss and to manage rather than eliminate the risk of failure to achieve business objectives.
There is a continuing process for identifying, evaluating and managing the key risks faced by the Group that has been in place for the year under review and up to the date of approval of the Annual Report and Accounts.
The process is regularly reviewed by the Board and is in accordance with the recommendations of Internal Control: Guidance to Directors (formerly known as the Turnbull Guidance). Steps continue to be taken to embed internal control further into the operations of the business and to deal with any issues that come to the Board’s attention.
The directors have reviewed the effectiveness of the system of internal control and are satisfied that the Group’s internal controls are operating effectively.
48 | entertainmentone.com
AUDIT COMMITTEE
ANNUAL STATEMENT OF THE CHAIR OF THE AUDIT COMMITTEE During the year, the Group continued to develop its Internal Audit function with the recruitment of two Internal Audit Managers. With the additional resources available, a formal internal audit programme has now been implemented covering all of the Group’s main business units.
The initial work of the Internal Audit team has been a “baseline” review of the general control environment of the Group’s operations as well as focusing on any specific risk areas highlighted by management. The Group has rolled out a more formal risk management process to its operating units and implemented a Group risk register, and focused more attention on business continuity planning.
The Group has formalised an Executive Committee which meets monthly and focuses on risk management on a quarterly basis. Regular updates on risk management are reported to the Audit Committee and the Board is updated on a quarterly basis.
The Committee has continued its programme of presentations from senior operational finance employees, increasing the Committee’s understanding of financial and internal controls in the Group’s operating units.
The Committee’s report has been expanded to provide more detail on the significant issues considered in relation to the financial statements and on how these issues were addressed.
BOB ALLAN AUDIT COMMITTEE CHAIRMAN18 May 2015
COMMITTEE MEMBERSHIPDuring the year, the Audit Committee comprised Bob Allan (Chairman) with James Corsellis and Mark Opzoomer as the other non-executive members. Bob Allan and Mark Opzoomer have recent and relevant financial experience. On 15 May 2015, Linda Robinson was appointed as a third independent member of the Audit Committee to bring the Committee’s composition into line with Code requirements.
The Chairman (Allan Leighton), the CEO (Darren Throop) and the CFO (Giles Willits) are invited to attend Audit Committee meetings but do not participate in decisions.
AUDIT PLANNINGThe Committee oversees the plans for the audit to ensure it is comprehensive, risk-based and cost-effective.
As in previous years, Deloitte drafted an initial external audit plan in conjunction with executive management and presented it for review by the Committee. The plan set out the proposed scope of their work and the approach to be taken. It also proposed the materiality levels to be used, based on forecast profit before tax, adding back operating and financing one-off items.
In order to focus the audit work on the right areas, the auditor identified particular risk issues based on its knowledge of the business and operating environment, discussions with management and the half year review. Agreement was reached on the audit approach for different areas of the business, based on their scale and complexity. This has resulted in an audit approach which has provided for a full scope audit for the Group’s largest operating units, a focused scope approach for smaller operating units and a desktop review of units with less significant operations.
The Committee met at an earlier point in the financial year to carry out its year end audit planning, to allow more in-depth discussion on the planning process and to ensure feedback was appropriately reflected in the year end audit approach.
The audit approach in the current year has been modified to bring additional analytical work into the Group audit team.
STRATEGIC
REPORT
CO
RPORATE G
OVERN
ANC
EFIN
ANC
IAL STATEMEN
TS
eOne Annual Report and Accounts 2015 | 49
AUDIT COMMITTEE CONTINUED
REVIEW OF CONSOLIDATED FINANCIAL STATEMENTS AND AUDIT FINDINGSThe Committee reviewed the full and half year consolidated financial statements and the report of the auditor on these statements. The Deloitte partner responsible for the eOne audit attends all regular Audit Committee meetings to present reports and answer questions from Committee members. Senior Deloitte employees who have had day-to-day involvement in the conduct of the audit also attend.
The Committee considered the following significant accounting areas of judgement as part of its review:
AREAS OF JUDGEMENT ASSESSMENT
Investment in acquired content rights
In the absence of any prescribed IFRS accounting treatment for content rights, the Group applies the guidance included in US GAAP “Accounting Standards Codification 926, Entertainment – Films” under which the carrying value of investment in acquired content rights, and associated charges to the consolidated income statement, are directly linked to management estimates of future revenues.The Committee is satisfied that processes exist to ensure that the carrying value of investment in acquired content rights is assessed on a regular basis and that operating management has sufficient expertise to assess the recoverability of investments, based on its local market knowledge.Investment in accounting systems during the year, particularly in Canada, has resulted in improvements in the internal processes that are used to ensure that carrying amounts are appropriately recognised and monitored.In addition, this is an area of focus for the audit and Deloitte carries out detailed testing, which has been centralised to provide further consistency of approach. Deloitte provides a detailed report on this issue to the Audit Committee and reports explicitly on the matter in its audit opinion in the consolidated financial statements.
Investment in productions In the absence of any prescribed IFRS accounting treatment for content rights, the Group applies the guidance included in US GAAP “Accounting Standards Codification 926, Entertainment – Films” under which the carrying value of investment in productions, and associated charges to the consolidated income statement, are directly linked to management estimates of future revenues.The Committee is satisfied that processes exist to ensure that the carrying value of investment in productions is assessed on a regular basis and that operating management has sufficient expertise to assess the recoverability of investments, based on its local market knowledge. During the year, the Group expanded its Television leadership team which has provided additional focus on the assessment and monitoring of television content assets. In addition, this is an area of focus for the audit and Deloitte carries out detailed testing, which has been centralised to provide further consistency of approach. Deloitte provides a detailed report on this issue to the Audit Committee and reports explicitly on the matter in its audit opinion in the consolidated financial statements.
Impairment of goodwill and acquired intangible assets
The Group holds significant intangible assets including acquired intangible assets and goodwill from past acquisitions. In accordance with IFRS, management conducts an annual impairment review of intangible assets with indefinite useful economic lives to ensure that the value in use of the cash generating units supports the carrying value in the financial statements. The Committee is satisfied that the assumptions made by management are reasonable, and that appropriate sensitivities are applied, to ensure that the annual impairment testing process is robust.In addition, Deloitte reviews and challenges the assumptions made by management to confirm that they are reasonable in comparison to industry peers and analyst assumptions, and that they reflect current market conditions. Deloitte provides a detailed report on this issue to the Audit Committee and reports explicitly on the matter in its audit opinion in the consolidated financial statements.
50 | entertainmentone.com
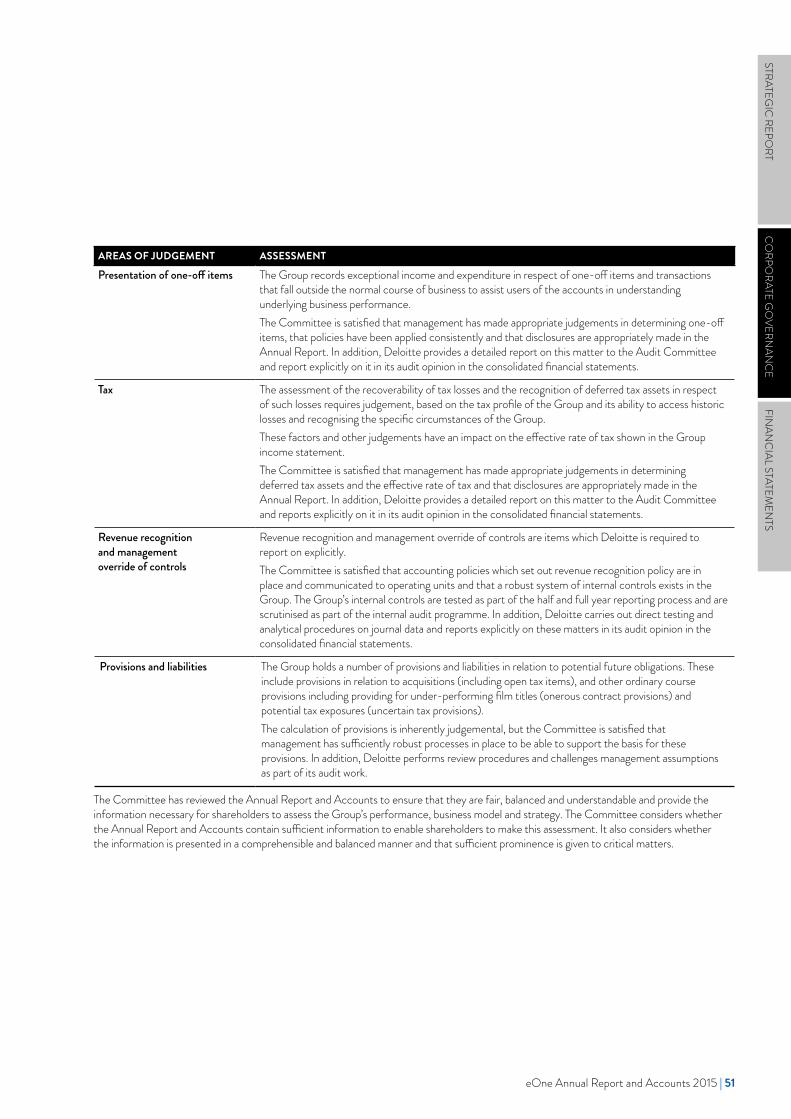
AREAS OF JUDGEMENT ASSESSMENT
Presentation of one-off items The Group records exceptional income and expenditure in respect of one-off items and transactions that fall outside the normal course of business to assist users of the accounts in understanding underlying business performance.The Committee is satisfied that management has made appropriate judgements in determining one-off items, that policies have been applied consistently and that disclosures are appropriately made in the Annual Report. In addition, Deloitte provides a detailed report on this matter to the Audit Committee and report explicitly on it in its audit opinion in the consolidated financial statements.
Tax The assessment of the recoverability of tax losses and the recognition of deferred tax assets in respect of such losses requires judgement, based on the tax profile of the Group and its ability to access historic losses and recognising the specific circumstances of the Group.These factors and other judgements have an impact on the effective rate of tax shown in the Group income statement.The Committee is satisfied that management has made appropriate judgements in determining deferred tax assets and the effective rate of tax and that disclosures are appropriately made in the Annual Report. In addition, Deloitte provides a detailed report on this matter to the Audit Committee and reports explicitly on it in its audit opinion in the consolidated financial statements.
Revenue recognition and management override of controls
Revenue recognition and management override of controls are items which Deloitte is required to report on explicitly.The Committee is satisfied that accounting policies which set out revenue recognition policy are in place and communicated to operating units and that a robust system of internal controls exists in the Group. The Group’s internal controls are tested as part of the half and full year reporting process and are scrutinised as part of the internal audit programme. In addition, Deloitte carries out direct testing and analytical procedures on journal data and reports explicitly on these matters in its audit opinion in the consolidated financial statements.
Provisions and liabilities The Group holds a number of provisions and liabilities in relation to potential future obligations. These include provisions in relation to acquisitions (including open tax items), and other ordinary course provisions including providing for under-performing film titles (onerous contract provisions) and potential tax exposures (uncertain tax provisions).The calculation of provisions is inherently judgemental, but the Committee is satisfied that management has sufficiently robust processes in place to be able to support the basis for these provisions. In addition, Deloitte performs review procedures and challenges management assumptions as part of its audit work.
The Committee has reviewed the Annual Report and Accounts to ensure that they are fair, balanced and understandable and provide the information necessary for shareholders to assess the Group’s performance, business model and strategy. The Committee considers whether the Annual Report and Accounts contain sufficient information to enable shareholders to make this assessment. It also considers whether the information is presented in a comprehensible and balanced manner and that sufficient prominence is given to critical matters.
STRATEGIC
REPORT
CO
RPORATE G
OVERN
ANC
EFIN
ANC
IAL STATEMEN
TS
eOne Annual Report and Accounts 2015 | 51
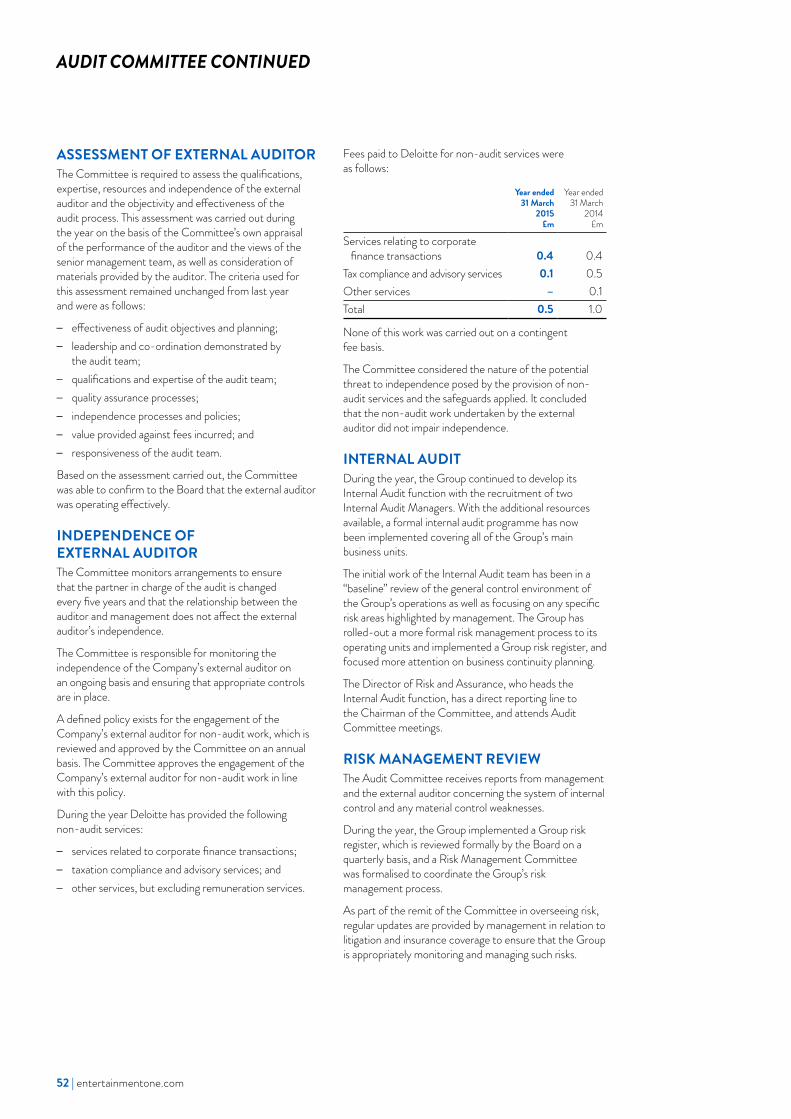
AUDIT COMMITTEE CONTINUED
ASSESSMENT OF EXTERNAL AUDITORThe Committee is required to assess the qualifications, expertise, resources and independence of the external auditor and the objectivity and effectiveness of the audit process. This assessment was carried out during the year on the basis of the Committee’s own appraisal of the performance of the auditor and the views of the senior management team, as well as consideration of materials provided by the auditor. The criteria used for this assessment remained unchanged from last year and were as follows:
– effectiveness of audit objectives and planning; – leadership and co-ordination demonstrated by
the audit team; – qualifications and expertise of the audit team; – quality assurance processes; – independence processes and policies; – value provided against fees incurred; and – responsiveness of the audit team.
Based on the assessment carried out, the Committee was able to confirm to the Board that the external auditor was operating effectively.
INDEPENDENCE OF EXTERNAL AUDITORThe Committee monitors arrangements to ensure that the partner in charge of the audit is changed every five years and that the relationship between the auditor and management does not affect the external auditor’s independence.
The Committee is responsible for monitoring the independence of the Company’s external auditor on an ongoing basis and ensuring that appropriate controls are in place.
A defined policy exists for the engagement of the Company’s external auditor for non-audit work, which is reviewed and approved by the Committee on an annual basis. The Committee approves the engagement of the Company’s external auditor for non-audit work in line with this policy.
During the year Deloitte has provided the following non-audit services:
– services related to corporate finance transactions; – taxation compliance and advisory services; and – other services, but excluding remuneration services.
Fees paid to Deloitte for non-audit services were as follows:
Year ended 31 March
2015 £m
Year ended 31 March
2014 £m
Services relating to corporate finance transactions 0.4 0.4
Tax compliance and advisory services 0.1 0.5Other services – 0.1Total 0.5 1.0
None of this work was carried out on a contingent fee basis.
The Committee considered the nature of the potential threat to independence posed by the provision of non-audit services and the safeguards applied. It concluded that the non-audit work undertaken by the external auditor did not impair independence.
INTERNAL AUDITDuring the year, the Group continued to develop its Internal Audit function with the recruitment of two Internal Audit Managers. With the additional resources available, a formal internal audit programme has now been implemented covering all of the Group’s main business units.
The initial work of the Internal Audit team has been in a “baseline” review of the general control environment of the Group’s operations as well as focusing on any specific risk areas highlighted by management. The Group has rolled-out a more formal risk management process to its operating units and implemented a Group risk register, and focused more attention on business continuity planning.
The Director of Risk and Assurance, who heads the Internal Audit function, has a direct reporting line to the Chairman of the Committee, and attends Audit Committee meetings.
RISK MANAGEMENT REVIEWThe Audit Committee receives reports from management and the external auditor concerning the system of internal control and any material control weaknesses.
During the year, the Group implemented a Group risk register, which is reviewed formally by the Board on a quarterly basis, and a Risk Management Committee was formalised to coordinate the Group’s risk management process.
As part of the remit of the Committee in overseeing risk, regular updates are provided by management in relation to litigation and insurance coverage to ensure that the Group is appropriately monitoring and managing such risks.
52 | entertainmentone.com
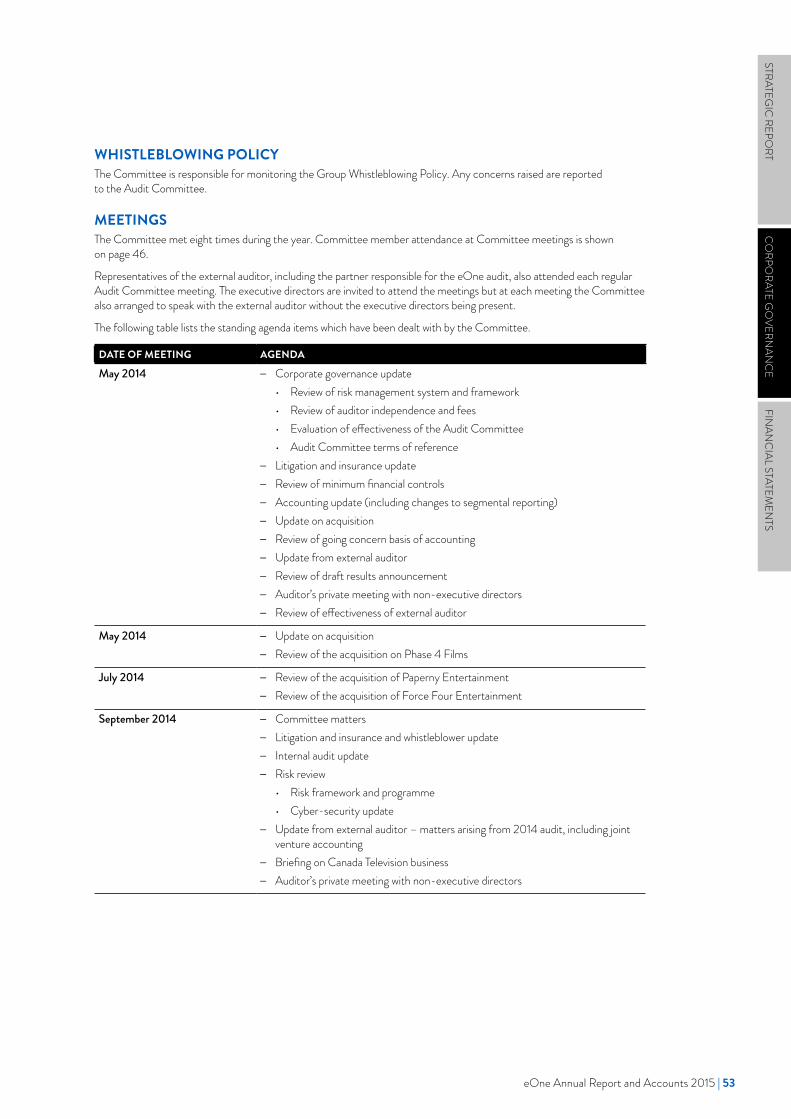
WHISTLEBLOWING POLICYThe Committee is responsible for monitoring the Group Whistleblowing Policy. Any concerns raised are reported to the Audit Committee.
MEETINGSThe Committee met eight times during the year. Committee member attendance at Committee meetings is shown on page 46.
Representatives of the external auditor, including the partner responsible for the eOne audit, also attended each regular Audit Committee meeting. The executive directors are invited to attend the meetings but at each meeting the Committee also arranged to speak with the external auditor without the executive directors being present.
The following table lists the standing agenda items which have been dealt with by the Committee.
DATE OF MEETING AGENDA
May 2014 – Corporate governance update • Review of risk management system and framework • Review of auditor independence and fees • Evaluation of effectiveness of the Audit Committee • Audit Committee terms of reference
– Litigation and insurance update – Review of minimum financial controls – Accounting update (including changes to segmental reporting) – Update on acquisition – Review of going concern basis of accounting – Update from external auditor – Review of draft results announcement – Auditor’s private meeting with non-executive directors – Review of effectiveness of external auditor
May 2014 – Update on acquisition – Review of the acquisition on Phase 4 Films
July 2014 – Review of the acquisition of Paperny Entertainment – Review of the acquisition of Force Four Entertainment
September 2014 – Committee matters – Litigation and insurance and whistleblower update – Internal audit update – Risk review
• Risk framework and programme • Cyber-security update
– Update from external auditor – matters arising from 2014 audit, including joint venture accounting
– Briefing on Canada Television business – Auditor’s private meeting with non-executive directors
STRATEGIC
REPORT
CO
RPORATE G
OVERN
ANC
EFIN
ANC
IAL STATEMEN
TS
eOne Annual Report and Accounts 2015 | 53
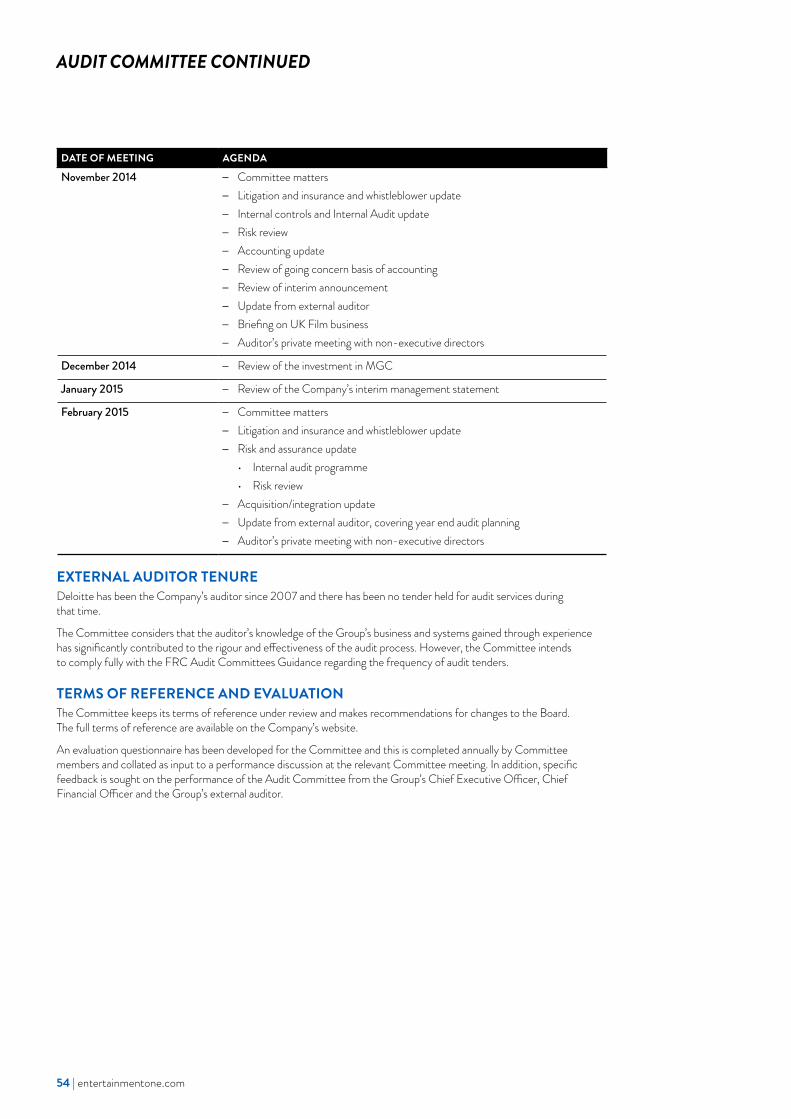
AUDIT COMMITTEE CONTINUED
DATE OF MEETING AGENDA
November 2014 – Committee matters – Litigation and insurance and whistleblower update – Internal controls and Internal Audit update – Risk review – Accounting update – Review of going concern basis of accounting – Review of interim announcement – Update from external auditor – Briefing on UK Film business – Auditor’s private meeting with non-executive directors
December 2014 – Review of the investment in MGC
January 2015 – Review of the Company’s interim management statement
February 2015 – Committee matters – Litigation and insurance and whistleblower update – Risk and assurance update
• Internal audit programme • Risk review
– Acquisition/integration update – Update from external auditor, covering year end audit planning – Auditor’s private meeting with non-executive directors
EXTERNAL AUDITOR TENUREDeloitte has been the Company’s auditor since 2007 and there has been no tender held for audit services during that time.
The Committee considers that the auditor’s knowledge of the Group’s business and systems gained through experience has significantly contributed to the rigour and effectiveness of the audit process. However, the Committee intends to comply fully with the FRC Audit Committees Guidance regarding the frequency of audit tenders.
TERMS OF REFERENCE AND EVALUATIONThe Committee keeps its terms of reference under review and makes recommendations for changes to the Board. The full terms of reference are available on the Company’s website.
An evaluation questionnaire has been developed for the Committee and this is completed annually by Committee members and collated as input to a performance discussion at the relevant Committee meeting. In addition, specific feedback is sought on the performance of the Audit Committee from the Group’s Chief Executive Officer, Chief Financial Officer and the Group’s external auditor.
54 | entertainmentone.com
NOMINATION COMMITTEE
ANNUAL STATEMENT OF THE CHAIR OF THE NOMINATION COMMITTEEThe performance of the Group is dependent on its ability to attract, recruit and retain quality people in a highly competitive labour market. Succession planning is an important contributor to the long-term success of the business.
The Nomination Committee carefully reviews succession plans for the executive directors and senior management, as well as evaluating the size, structure, composition and diversity of the Board and its Committees.
The Committee has evaluated the Board during the year and is content that the Board’s size, structure, composition and diversity are appropriate for the specific circumstances of the Group. The Committee has made recommendations on the composition of the Board’s Committees to ensure that they comply with the UK Code of Corporate Governance.
RONALD ATKEY NOMINATION COMMITTEE CHAIRMAN18 May 2015
COMMITTEE MEMBERSHIPDuring the year, the Nomination Committee comprised Clare Copeland (Chairman) with James Corsellis and Ronald Atkey as the other non-executive members. On 15 May 2015, the Board appointed Ronald Atkey as the Chairman of the Committee, with Mr Copeland remaining as a member of the Committee.
The Chairman (Allan Leighton), the CEO (Darren Throop) and the CFO (Giles Willits) are invited to attend Nomination Committee meetings but do not participate in decisions.
BOARD COMPOSITIONThe Committee keeps the membership of the Board under review to ensure that it has the required combination of skills, knowledge and experience. The Board fully appreciates the benefits of diversity and is committed to equal opportunities for all.
The Committee carried out a formal review of the Board’s composition, size and structure including criteria for assessing the skills, knowledge and experience of individual directors as well as diversity, including gender, and the particular requirements of the Board as set out in the Company’s Articles of Amalgamation.
There were no changes to the Board recommended during the year. It was recommended that an additional independent non-executive director be appointed to both the Audit Committee and the Remuneration Committee, to ensure that the composition of those Committees complies with the UK Code of Corporate Governance going forward. These appointments were effected after the year end.
STRATEGIC
REPORT
CO
RPORATE G
OVERN
ANC
EFIN
ANC
IAL STATEMEN
TS
eOne Annual Report and Accounts 2015 | 55
NOMINATION COMMITTEE CONTINUED
SUCCESSION PLANNINGThere is a detailed succession plan which is reviewed by the Committee on an annual basis. In the plan, all senior posts are graded according to the impact and likelihood of the post-holder leaving the Company. Where possible, suitable internal successors are identified together with the training and experience required by the successor to take over the post. When no immediate successor is identified the plan includes details of interim arrangements and employee development schemes necessary to progress internal candidates, as well as highlighting roles where external successors may be required.
BOARDChairman:
– Allan LeightonNon-executive directors:
– Clare Copeland – Bob Allan – Ronald Atkey – James Corsellis
– Garth Girvan – Mark Opzoomer – Linda Robinson
Executive directors: – Darren Throop – Giles Willits
AUDIT COMMITTEE NOMINATION COMMITTEE REMUNERATION COMMITTEEChairman:
– Bob AllanNon-executive directors:
– James Corsellis – Mark Opzoomer – Linda Robinson
(from 15 May 2015)
Chairman: – Clare Copeland
(until 14 May 2015) – Ronald Atkey
(from 15 May 2015)Non-executive directors:
– James Corsellis – Ronald Atkey – Clare Copeland
Chairman: – Clare Copeland
Non-executive directors: – James Corsellis – Garth Girvan – Bob Allan
(from 15 May 2015)
BOARD AND COMMITTEE EVALUATIONThe Board has not undertaken an external evaluation, but plans to do so in line with the requirements of the Code.
MEETINGSThe Committee met twice during the year. Committee member attendance at Committee meetings is shown on page 46.
The following table lists the agenda items which have been dealt with by the Committee during the year.
DATE OF MEETING AGENDASeptember 2014 – Review of Board and Committee composition
– Succession planning process
March 2015 – Review of Board and Committee composition – Succession planning review – Terms of reference and Committee self-evaluation
TERMS OF REFERENCE AND EVALUATIONThe Committee keeps its terms of reference under review. The full terms of reference are available on the Group’s website. An evaluation questionnaire has been developed for the Committee and this is completed annually by Committee members and collated as input to a performance discussion at the relevant Committee meeting.
56 | entertainmentone.com
eOne Annual Report and Accounts 2015 | 57
DIRECTORS’ REMUNERATION REPORT
ANNUAL STATEMENT OF THE CHAIR OF THE REMUNERATION COMMITTEEOn behalf of the Board, I am pleased to present the Directors’ Remuneration Report for 2015, which sets out the remuneration policy for the directors of eOne and the amounts earned in respect of the year ended 31 March 2015. This report has been prepared by the Remuneration Committee and approved by the Board.
The Report complies with the Large and Medium-Sized Companies and Groups (Accounts and Reports) (Amendment) Regulations 2013, the 2014 UK Corporate Governance Code (the Code) and the Financial Conduct Authority Listing Rules. To reflect the requirements of the revised remuneration reporting regulations, this report is presented in two sections: the Directors’ Remuneration Policy and the Annual Report on Remuneration. The Directors’ Remuneration Policy sets out eOne’s forward-looking remuneration policy which was approved by a binding vote of shareholders at the 2014 Annual General Meeting, and remains in force for the three years ending 31 March 2017. The Annual Report on Remuneration provides details of the amounts earned in respect of the year ended 31 March 2015 and how the Directors’ Remuneration Policy will be operated for the year commencing 1 April 2015. This is subject to an advisory vote at the 2015 Annual General Meeting.
CLARE COPELAND REMUNERATION COMMITTEE CHAIRMAN18 May 2015
MAJOR DECISIONS TAKEN DURING THE YEARHaving received shareholder approval for the Company’s Remuneration Policy at the 2014 Annual General Meeting, there have been no changes in the remuneration structure for executive directors in the current financial year.
The Company’s Long Term Incentive Plan (LTIP), which was approved by shareholders in June 2013, remains in place and has been designed to align the long-term interests of executives and shareholders. The performance conditions against which the performance of the executive directors is measured for the LTIP are equally weighted between adjusted fully diluted earnings per share (EPS) growth, total shareholder return (TSR) growth and average return on capital employed (ROCE), all over the three-year period relating to each grant under the LTIP, and support our long-term strategic goals. Annual LTIP awards are granted at 125% of base salary for Darren Throop (Chief Executive Officer) and 100% of base salary for Giles Willits (Chief Financial Officer) and have a three-year vesting period before they can be exercised. Further details of the LTIP are set out on pages 59 and 61.
The annual bonus scheme continues to be measured based on the achievement of Group adjusted profit before tax and to have a maximum opportunity of 100% of base salary which is only achieved when 110% of the budgeted target is met.
INCENTIVE OUT-TURNS IN THE CURRENT YEARAs described in the Strategic Report, the Group has enjoyed a successful year with strong underlying EBITDA growth which has translated into the Group making an adjusted profit before tax of £88.8 million (an increase of 13% on the prior year) which has resulted in an annual bonus of 82.8% of base salary being earned by the two executive directors. Further details of this award are set out on page 69.
PROPOSED CHANGES IN EXECUTIVE DIRECTOR REMUNERATION IN THE COMING FINANCIAL YEARAs set out on page 58, the Remuneration Committee has approved pay increases for the coming year for the two executive directors in line with the Directors’ Remuneration Policy. There are no proposed changes to either the annual bonus scheme or the LTIP for the coming financial year.
We remain committed to taking a responsible approach in respect of executive pay. The Remuneration Committee will continue to actively engage with and seek to incorporate the views of the Company’s shareholders in any major changes to the Directors’ Remuneration Policy.
STRATEGIC
REPORT
CO
RPORATE G
OVERN
ANC
EFIN
ANC
IAL STATEMEN
TS
58 | entertainmentone.com
DIRECTORS’ REMUNERATION POLICY
This section of the Remuneration Report sets out the Directors’ Remuneration Policy which was approved by a binding shareholder vote at the 2014 Annual General Meeting, and applies for the three financial years ending 31 March 2017.
1. REMUNERATION POLICY TABLE(i) EXECUTIVE DIRECTORSThe table below provides an overview of each element of the approved remuneration for the Chief Executive Officer (CEO) and the Chief Financial Officer (CFO). To the extent that additional executive directors are employed in the future by the Company, this policy will apply on a consistent basis.
ComponentLink to Group strategy and objectives Operation Opportunity
Framework used to assess performance
Base salary Core element of fixed remuneration that provides the basis to recruit and retain talent necessary to deliver the business strategy.Reflects individual experience, skill and scope of responsibility.Takes into account wider contribution to the Group.
Usually reviewed annually (but may be reviewed more frequently) with any changes effective as follows:
– CEO: 1 April – CFO: 1 April
The review process considers a range of factors including, but not limited to:
– role, experience and performance;
– average change in broader workforce salary;
– increases in size and complexity of the Group; and
– market and competitive factors.
External benchmark data against companies of a similar size and complexity is also considered.
No maximum base salary has been set under the Remuneration Policy. To the extent pay increases are awarded, these are considered on a case-by-case basis and will generally be based on the factors set out.Where appropriate and merited, the policy is to position base salaries for each executive director at an upper quartile level of the relevant comparator group. The expected base salaries for the year ended 31 March 2016 are as follows:
– CEO: C$989,000 – CFO: £414,000
N/A
Annual bonus To motivate and reward superior performance measured against annual financial targets of the Group.
Usually a cash payment. Awards approved by the Remuneration Committee after the year end, based on performance against annual targets. Subject to a clawback provision which extends for a period of 12 months following payment of the bonus.
Up to 100% of base salary. Bonus performance condition is Group adjusted profit before tax. Award of 30% and 65% of maximum opportunity for threshold and target performance, respectively. Award of 100% of maximum opportunity for achieving 110% of target. The threshold level for bonus payments is 90% of target, below which level no bonus is payable.The performance period is one year.
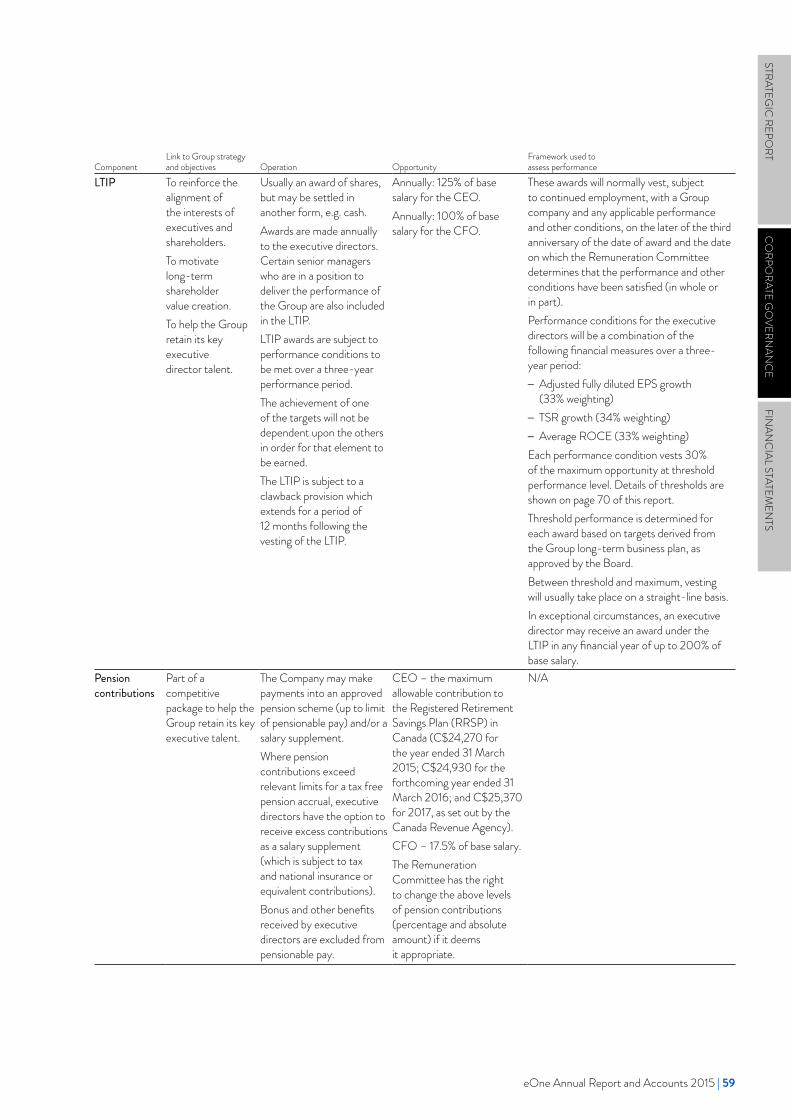
eOne Annual Report and Accounts 2015 | 59
ComponentLink to Group strategy and objectives Operation Opportunity
Framework used to assess performance
LTIP To reinforce the alignment of the interests of executives and shareholders.To motivate long-term shareholder value creation. To help the Group retain its key executive director talent.
Usually an award of shares, but may be settled in another form, e.g. cash. Awards are made annually to the executive directors. Certain senior managers who are in a position to deliver the performance of the Group are also included in the LTIP. LTIP awards are subject to performance conditions to be met over a three-year performance period. The achievement of one of the targets will not be dependent upon the others in order for that element to be earned. The LTIP is subject to a clawback provision which extends for a period of 12 months following the vesting of the LTIP.
Annually: 125% of base salary for the CEO.Annually: 100% of base salary for the CFO.
These awards will normally vest, subject to continued employment, with a Group company and any applicable performance and other conditions, on the later of the third anniversary of the date of award and the date on which the Remuneration Committee determines that the performance and other conditions have been satisfied (in whole or in part).Performance conditions for the executive directors will be a combination of the following financial measures over a three-year period:
– Adjusted fully diluted EPS growth (33% weighting)
– TSR growth (34% weighting) – Average ROCE (33% weighting)
Each performance condition vests 30% of the maximum opportunity at threshold performance level. Details of thresholds are shown on page 70 of this report.Threshold performance is determined for each award based on targets derived from the Group long-term business plan, as approved by the Board.Between threshold and maximum, vesting will usually take place on a straight-line basis.In exceptional circumstances, an executive director may receive an award under the LTIP in any financial year of up to 200% of base salary.
Pension contributions
Part of a competitive package to help the Group retain its key executive talent.
The Company may make payments into an approved pension scheme (up to limit of pensionable pay) and/or a salary supplement. Where pension contributions exceed relevant limits for a tax free pension accrual, executive directors have the option to receive excess contributions as a salary supplement (which is subject to tax and national insurance or equivalent contributions). Bonus and other benefits received by executive directors are excluded from pensionable pay.
CEO – the maximum allowable contribution to the Registered Retirement Savings Plan (RRSP) in Canada (C$24,270 for the year ended 31 March 2015; C$24,930 for the forthcoming year ended 31 March 2016; and C$25,370 for 2017, as set out by the Canada Revenue Agency). CFO – 17.5% of base salary.The Remuneration Committee has the right to change the above levels of pension contributions (percentage and absolute amount) if it deems it appropriate.
N/A
STRATEGIC
REPORT
CO
RPORATE G
OVERN
ANC
EFIN
ANC
IAL STATEMEN
TS

60 | entertainmentone.com
ComponentLink to Group strategy and objectives Operation Opportunity
Framework used to assess performance
Taxable benefits
Part of a competitive package to help the Group retain its key executive talent.
Base salary is supplemented with a range of benefits based on the role and individual circumstances. These benefits include, but are not limited to, car allowance, payments in lieu of pension, life and disability assurance and healthcare arrangements. Other benefits may be provided based on individual circumstances, such as, but not limited to, housing or relocation allowances, travel allowances or other expatriate benefits. Benefits are reviewed by the Remuneration Committee in the context of market practice from time-to-time.
While the Remuneration Committee has not set an absolute maximum on the level of benefits executive directors may receive, the value of benefits is set to a level which the Committee considers to be appropriately positioned, taking into account relevant market levels based on the nature and location of the role and individual circumstances.
N/A
Shareholding policy
Share ownership is a key cornerstone of the Group’s reward policy and is designed to help maintain commitment over the long term, and to ensure that the interests of the executive are aligned with those of shareholders.
Executives are expected to build and maintain a significant shareholding in eOne shares, with expected holdings valued at:
– CEO: 3 times base salary – CFO: 2 times base salary
N/A N/A
(ii) NON-EXECUTIVE CHAIRMAN AND NON-EXECUTIVE DIRECTORSThe table below sets out the approved Remuneration Policy for the non-executive Chairman and non-executive directors.
Element Approach of the Company
Non-executive Chairman fees
The remuneration of the Chairman is set by the executive directors. Fees are set at a level which reflects the skills, knowledge and experience of the individual, whilst taking into account appropriate market data. The fee is set as a fixed annual fee and may be paid wholly or partly in cash or Company shares. Fees are ratified by the Board.
Non-executive director fees
The executive directors are responsible for deciding non-executive directors’ fees. Fees are set taking into account several factors including the size and complexity of the business, fees paid to non-executive directors of UK-listed companies of a similar size and complexity and the expected time commitment and contribution for the role. Fees are structured as a basic fee with additional fees payable for chairmanship or membership of a committee or other additional responsibilities. The fee is set as a fixed annual fee and may be paid wholly or partly in cash or Company shares. Fees are ratified by the Board.
In setting the Remuneration Policy, the Group reserves the right to make any remuneration payments and payments for loss of office (including exercising any discretions available to it in connection with such payments) notwithstanding that they are not in line with the policy set out above where the terms of the payment were agreed (i) before the policy came into effect or (ii) at a time when the relevant individual was not a director of the Group and, in the opinion of the Group, the payment was not in consideration for the individual becoming a director of the Group. For these purposes “payments” includes the Group satisfying awards of variable remuneration and, in relation to an award over shares, the terms of the payment are agreed at the time the award is granted.
The Group may make minor amendments to the policy set out above (for regulatory, exchange control, tax or administrative purposes or to take account of a change in legislation) without obtaining shareholder approval for that amendment.
In exceptional circumstances, the Group may make share awards to non-executive directors to facilitate the recruitment or retention of individuals that are judged to be important in delivering the Group’s strategic goals, the awards being subject to shareholder approval where appropriate.
DIRECTORS’ REMUNERATION POLICY CONTINUED
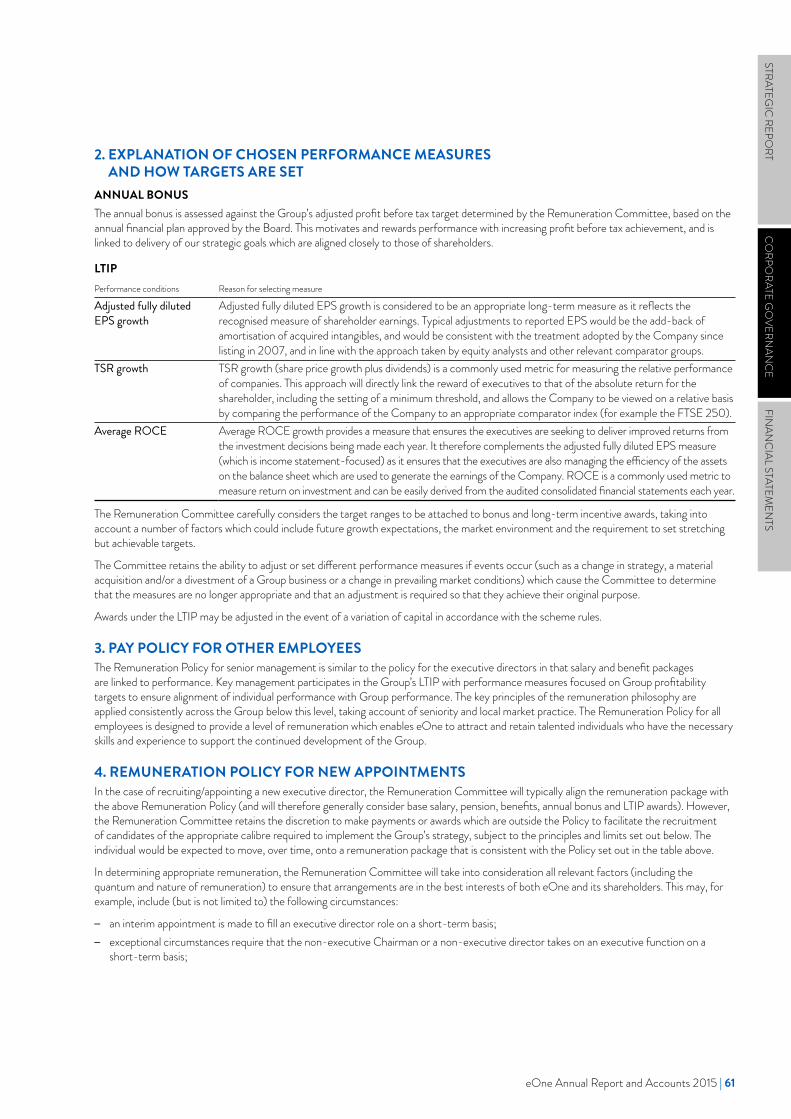
eOne Annual Report and Accounts 2015 | 61
2. EXPLANATION OF CHOSEN PERFORMANCE MEASURES AND HOW TARGETS ARE SET
ANNUAL BONUSThe annual bonus is assessed against the Group’s adjusted profit before tax target determined by the Remuneration Committee, based on the annual financial plan approved by the Board. This motivates and rewards performance with increasing profit before tax achievement, and is linked to delivery of our strategic goals which are aligned closely to those of shareholders.
LTIPPerformance conditions Reason for selecting measure
Adjusted fully diluted EPS growth
Adjusted fully diluted EPS growth is considered to be an appropriate long-term measure as it reflects the recognised measure of shareholder earnings. Typical adjustments to reported EPS would be the add-back of amortisation of acquired intangibles, and would be consistent with the treatment adopted by the Company since listing in 2007, and in line with the approach taken by equity analysts and other relevant comparator groups.
TSR growth TSR growth (share price growth plus dividends) is a commonly used metric for measuring the relative performance of companies. This approach will directly link the reward of executives to that of the absolute return for the shareholder, including the setting of a minimum threshold, and allows the Company to be viewed on a relative basis by comparing the performance of the Company to an appropriate comparator index (for example the FTSE 250).
Average ROCE Average ROCE growth provides a measure that ensures the executives are seeking to deliver improved returns from the investment decisions being made each year. It therefore complements the adjusted fully diluted EPS measure (which is income statement-focused) as it ensures that the executives are also managing the efficiency of the assets on the balance sheet which are used to generate the earnings of the Company. ROCE is a commonly used metric to measure return on investment and can be easily derived from the audited consolidated financial statements each year.
The Remuneration Committee carefully considers the target ranges to be attached to bonus and long-term incentive awards, taking into account a number of factors which could include future growth expectations, the market environment and the requirement to set stretching but achievable targets.
The Committee retains the ability to adjust or set different performance measures if events occur (such as a change in strategy, a material acquisition and/or a divestment of a Group business or a change in prevailing market conditions) which cause the Committee to determine that the measures are no longer appropriate and that an adjustment is required so that they achieve their original purpose.
Awards under the LTIP may be adjusted in the event of a variation of capital in accordance with the scheme rules.
3. PAY POLICY FOR OTHER EMPLOYEESThe Remuneration Policy for senior management is similar to the policy for the executive directors in that salary and benefit packages are linked to performance. Key management participates in the Group’s LTIP with performance measures focused on Group profitability targets to ensure alignment of individual performance with Group performance. The key principles of the remuneration philosophy are applied consistently across the Group below this level, taking account of seniority and local market practice. The Remuneration Policy for all employees is designed to provide a level of remuneration which enables eOne to attract and retain talented individuals who have the necessary skills and experience to support the continued development of the Group.
4. REMUNERATION POLICY FOR NEW APPOINTMENTSIn the case of recruiting/appointing a new executive director, the Remuneration Committee will typically align the remuneration package with the above Remuneration Policy (and will therefore generally consider base salary, pension, benefits, annual bonus and LTIP awards). However, the Remuneration Committee retains the discretion to make payments or awards which are outside the Policy to facilitate the recruitment of candidates of the appropriate calibre required to implement the Group’s strategy, subject to the principles and limits set out below. The individual would be expected to move, over time, onto a remuneration package that is consistent with the Policy set out in the table above.
In determining appropriate remuneration, the Remuneration Committee will take into consideration all relevant factors (including the quantum and nature of remuneration) to ensure that arrangements are in the best interests of both eOne and its shareholders. This may, for example, include (but is not limited to) the following circumstances:
– an interim appointment is made to fill an executive director role on a short-term basis; – exceptional circumstances require that the non-executive Chairman or a non-executive director takes on an executive function on a
short-term basis;
STRATEGIC
REPORT
CO
RPORATE G
OVERN
ANC
EFIN
ANC
IAL STATEMEN
TS
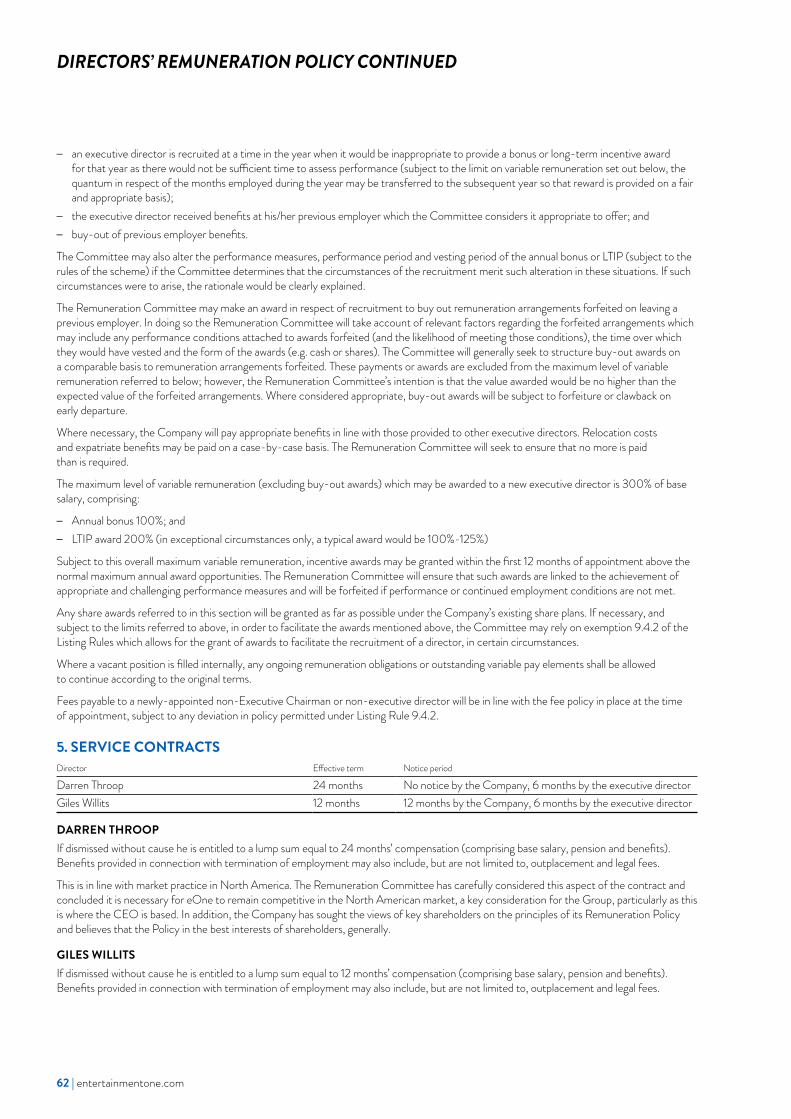
62 | entertainmentone.com
– an executive director is recruited at a time in the year when it would be inappropriate to provide a bonus or long-term incentive award for that year as there would not be sufficient time to assess performance (subject to the limit on variable remuneration set out below, the quantum in respect of the months employed during the year may be transferred to the subsequent year so that reward is provided on a fair and appropriate basis);
– the executive director received benefits at his/her previous employer which the Committee considers it appropriate to offer; and – buy-out of previous employer benefits.
The Committee may also alter the performance measures, performance period and vesting period of the annual bonus or LTIP (subject to the rules of the scheme) if the Committee determines that the circumstances of the recruitment merit such alteration in these situations. If such circumstances were to arise, the rationale would be clearly explained.
The Remuneration Committee may make an award in respect of recruitment to buy out remuneration arrangements forfeited on leaving a previous employer. In doing so the Remuneration Committee will take account of relevant factors regarding the forfeited arrangements which may include any performance conditions attached to awards forfeited (and the likelihood of meeting those conditions), the time over which they would have vested and the form of the awards (e.g. cash or shares). The Committee will generally seek to structure buy-out awards on a comparable basis to remuneration arrangements forfeited. These payments or awards are excluded from the maximum level of variable remuneration referred to below; however, the Remuneration Committee’s intention is that the value awarded would be no higher than the expected value of the forfeited arrangements. Where considered appropriate, buy-out awards will be subject to forfeiture or clawback on early departure.
Where necessary, the Company will pay appropriate benefits in line with those provided to other executive directors. Relocation costs and expatriate benefits may be paid on a case-by-case basis. The Remuneration Committee will seek to ensure that no more is paid than is required.
The maximum level of variable remuneration (excluding buy-out awards) which may be awarded to a new executive director is 300% of base salary, comprising:
– Annual bonus 100%; and – LTIP award 200% (in exceptional circumstances only, a typical award would be 100%-125%)
Subject to this overall maximum variable remuneration, incentive awards may be granted within the first 12 months of appointment above the normal maximum annual award opportunities. The Remuneration Committee will ensure that such awards are linked to the achievement of appropriate and challenging performance measures and will be forfeited if performance or continued employment conditions are not met.
Any share awards referred to in this section will be granted as far as possible under the Company’s existing share plans. If necessary, and subject to the limits referred to above, in order to facilitate the awards mentioned above, the Committee may rely on exemption 9.4.2 of the Listing Rules which allows for the grant of awards to facilitate the recruitment of a director, in certain circumstances.
Where a vacant position is filled internally, any ongoing remuneration obligations or outstanding variable pay elements shall be allowed to continue according to the original terms.
Fees payable to a newly-appointed non-Executive Chairman or non-executive director will be in line with the fee policy in place at the time of appointment, subject to any deviation in policy permitted under Listing Rule 9.4.2.
5. SERVICE CONTRACTSDirector Effective term Notice period
Darren Throop 24 months No notice by the Company, 6 months by the executive directorGiles Willits 12 months 12 months by the Company, 6 months by the executive director
DARREN THROOP If dismissed without cause he is entitled to a lump sum equal to 24 months’ compensation (comprising base salary, pension and benefits). Benefits provided in connection with termination of employment may also include, but are not limited to, outplacement and legal fees.
This is in line with market practice in North America. The Remuneration Committee has carefully considered this aspect of the contract and concluded it is necessary for eOne to remain competitive in the North American market, a key consideration for the Group, particularly as this is where the CEO is based. In addition, the Company has sought the views of key shareholders on the principles of its Remuneration Policy and believes that the Policy in the best interests of shareholders, generally.
GILES WILLITS If dismissed without cause he is entitled to a lump sum equal to 12 months’ compensation (comprising base salary, pension and benefits). Benefits provided in connection with termination of employment may also include, but are not limited to, outplacement and legal fees.
DIRECTORS’ REMUNERATION POLICY CONTINUED
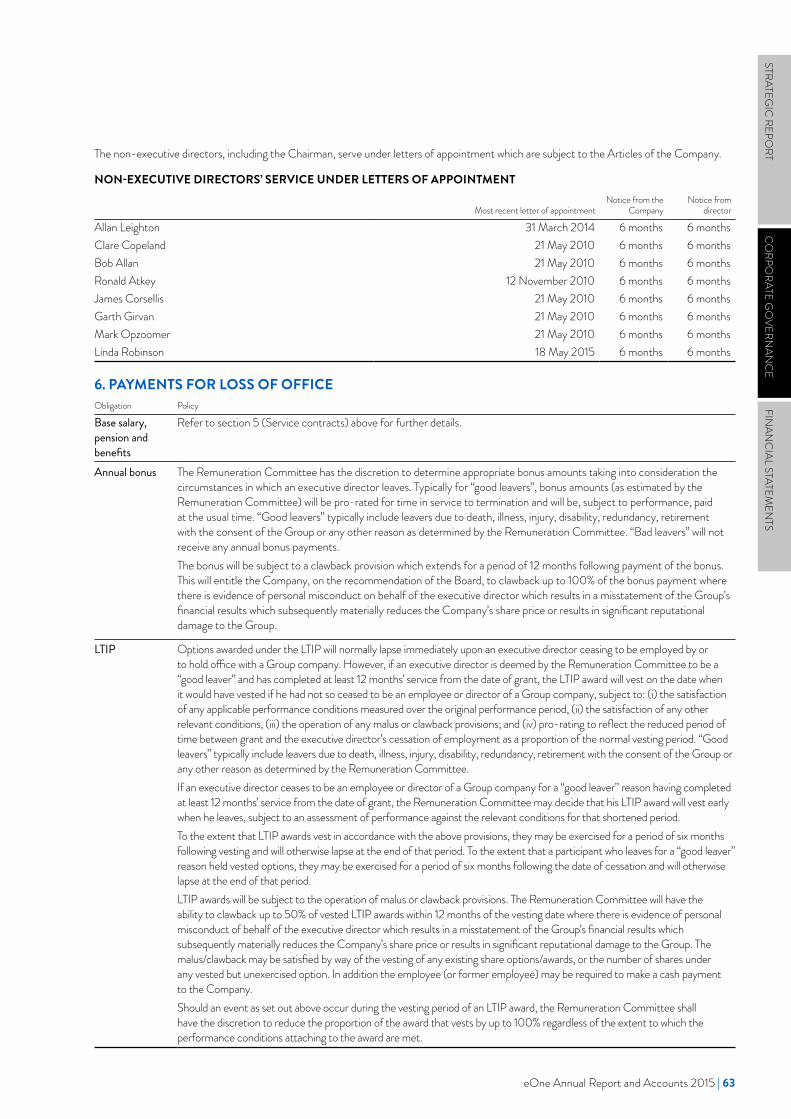
eOne Annual Report and Accounts 2015 | 63
The non-executive directors, including the Chairman, serve under letters of appointment which are subject to the Articles of the Company.
NON-EXECUTIVE DIRECTORS’ SERVICE UNDER LETTERS OF APPOINTMENT
Most recent letter of appointmentNotice from the
CompanyNotice from
director
Allan Leighton 31 March 2014 6 months 6 monthsClare Copeland 21 May 2010 6 months 6 monthsBob Allan 21 May 2010 6 months 6 monthsRonald Atkey 12 November 2010 6 months 6 monthsJames Corsellis 21 May 2010 6 months 6 monthsGarth Girvan 21 May 2010 6 months 6 monthsMark Opzoomer 21 May 2010 6 months 6 monthsLinda Robinson 18 May 2015 6 months 6 months
6. PAYMENTS FOR LOSS OF OFFICEObligation Policy
Base salary, pension and benefits
Refer to section 5 (Service contracts) above for further details.
Annual bonus The Remuneration Committee has the discretion to determine appropriate bonus amounts taking into consideration the circumstances in which an executive director leaves. Typically for “good leavers”, bonus amounts (as estimated by the Remuneration Committee) will be pro-rated for time in service to termination and will be, subject to performance, paid at the usual time. “Good leavers” typically include leavers due to death, illness, injury, disability, redundancy, retirement with the consent of the Group or any other reason as determined by the Remuneration Committee. “Bad leavers” will not receive any annual bonus payments.The bonus will be subject to a clawback provision which extends for a period of 12 months following payment of the bonus. This will entitle the Company, on the recommendation of the Board, to clawback up to 100% of the bonus payment where there is evidence of personal misconduct on behalf of the executive director which results in a misstatement of the Group’s financial results which subsequently materially reduces the Company’s share price or results in significant reputational damage to the Group.
LTIP Options awarded under the LTIP will normally lapse immediately upon an executive director ceasing to be employed by or to hold office with a Group company. However, if an executive director is deemed by the Remuneration Committee to be a “good leaver” and has completed at least 12 months’ service from the date of grant, the LTIP award will vest on the date when it would have vested if he had not so ceased to be an employee or director of a Group company, subject to: (i) the satisfaction of any applicable performance conditions measured over the original performance period, (ii) the satisfaction of any other relevant conditions, (iii) the operation of any malus or clawback provisions; and (iv) pro-rating to reflect the reduced period of time between grant and the executive director’s cessation of employment as a proportion of the normal vesting period. “Good leavers” typically include leavers due to death, illness, injury, disability, redundancy, retirement with the consent of the Group or any other reason as determined by the Remuneration Committee.If an executive director ceases to be an employee or director of a Group company for a “good leaver” reason having completed at least 12 months’ service from the date of grant, the Remuneration Committee may decide that his LTIP award will vest early when he leaves, subject to an assessment of performance against the relevant conditions for that shortened period.To the extent that LTIP awards vest in accordance with the above provisions, they may be exercised for a period of six months following vesting and will otherwise lapse at the end of that period. To the extent that a participant who leaves for a “good leaver” reason held vested options, they may be exercised for a period of six months following the date of cessation and will otherwise lapse at the end of that period.LTIP awards will be subject to the operation of malus or clawback provisions. The Remuneration Committee will have the ability to clawback up to 50% of vested LTIP awards within 12 months of the vesting date where there is evidence of personal misconduct of behalf of the executive director which results in a misstatement of the Group’s financial results which subsequently materially reduces the Company’s share price or results in significant reputational damage to the Group. The malus/clawback may be satisfied by way of the vesting of any existing share options/awards, or the number of shares under any vested but unexercised option. In addition the employee (or former employee) may be required to make a cash payment to the Company.Should an event as set out above occur during the vesting period of an LTIP award, the Remuneration Committee shall have the discretion to reduce the proportion of the award that vests by up to 100% regardless of the extent to which the performance conditions attaching to the award are met.
STRATEGIC
REPORT
CO
RPORATE G
OVERN
ANC
EFIN
ANC
IAL STATEMEN
TS
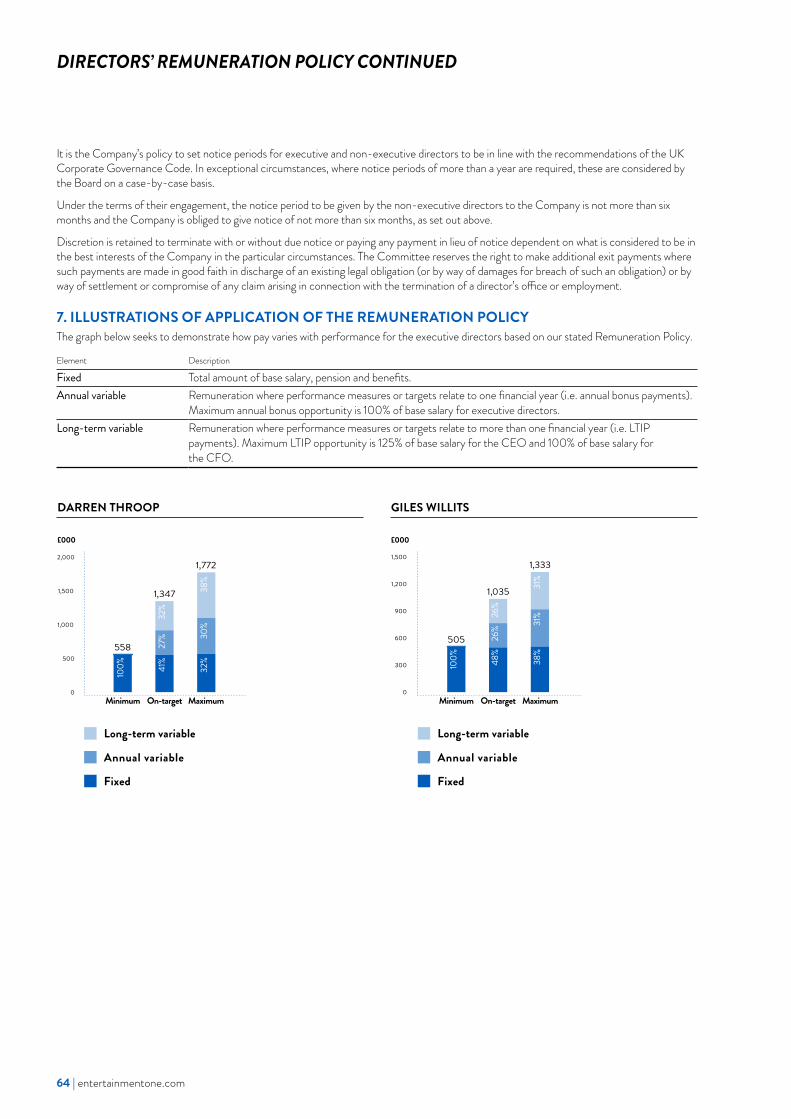
64 | entertainmentone.com
It is the Company’s policy to set notice periods for executive and non-executive directors to be in line with the recommendations of the UK Corporate Governance Code. In exceptional circumstances, where notice periods of more than a year are required, these are considered by the Board on a case-by-case basis.
Under the terms of their engagement, the notice period to be given by the non-executive directors to the Company is not more than six months and the Company is obliged to give notice of not more than six months, as set out above.
Discretion is retained to terminate with or without due notice or paying any payment in lieu of notice dependent on what is considered to be in the best interests of the Company in the particular circumstances. The Committee reserves the right to make additional exit payments where such payments are made in good faith in discharge of an existing legal obligation (or by way of damages for breach of such an obligation) or by way of settlement or compromise of any claim arising in connection with the termination of a director’s office or employment.
7. ILLUSTRATIONS OF APPLICATION OF THE REMUNERATION POLICYThe graph below seeks to demonstrate how pay varies with performance for the executive directors based on our stated Remuneration Policy.
Element Description
Fixed Total amount of base salary, pension and benefits.Annual variable Remuneration where performance measures or targets relate to one financial year (i.e. annual bonus payments).
Maximum annual bonus opportunity is 100% of base salary for executive directors.Long-term variable Remuneration where performance measures or targets relate to more than one financial year (i.e. LTIP
payments). Maximum LTIP opportunity is 125% of base salary for the CEO and 100% of base salary for the CFO.
DIRECTORS’ REMUNERATION POLICY CONTINUED
DARREN THROOP
Fixed
Annual variable
Long-term variable
0
500
1,000
1,500
2,000
£000
MaximumOn-targetMinimum
100% 41
%
32%
27% 30
%
32%
38%
558
1,347
1,772
GILES WILLITS
0
300
600
900
1,200
1,500
MaximumOn-targetMinimum
100% 48
%
38%
26% 31
%26%
31%
1,333
1,035
505
Fixed
Annual variable
Long-term variable
£000
eOne Annual Report and Accounts 2015 | 65
Assumptions used in determining the level of pay-out under the given scenarios are as follows:
Scenario Description
Minimum performance Fixed elements of remuneration only – comprising base salary, benefits and pension.On-target performance Total fixed pay as above, plus:
– Assumes 65% of maximum pay-out under the annual bonus scheme (i.e. 65% of base salary) based on the Group achieving budgeted adjusted profit before tax
– Assumes 65% of maximum pay-out under the LTIP based on the Group achieving the median point between the threshold performance and maximum performance for each performance condition. This equates to 81% of base salary for the CEO and 65% of base salary for the CFO
Maximum performance Total fixed pay as above, plus: – Assumes 100% of maximum pay-out under the annual bonus scheme (i.e. 100% of base salary) based on the
Group achieving 110% or more of budgeted adjusted profit before tax – Assumes 100% of maximum pay-out under the LTIP based on the Group achieving the maximum
performance for each performance condition. This equates to 125% of base salary for the CEO and 100% of base salary for the CFO
As required by the regulations, the scenarios do not include any share price growth assumptions or take into account any dividends that may be paid.
Base salary is the latest known salary (i.e. the salary effective from 1 April 2015) and the value for pension and benefits has been assumed to be equivalent to that included in the single total figure of remuneration on page 67.
8. WIDER WORKFORCE REMUNERATIONWhen determining the remuneration arrangements for executive directors, the Remuneration Committee takes into consideration, as a matter of course, the pay and conditions of employees throughout the Group. In particular, the Remuneration Committee is kept informed of:
– salary increase for the general employee population; – overall spend on annual bonus; and – participation levels in the annual bonus and share plans.
Although no consultation with employees takes place in relation to determining the Remuneration Policy for executive directors, the Group has various ways of engaging employees collectively, as teams and one-to-one.
9. CONSIDERATION OF SHAREHOLDER VIEWSThe Company engages in regular dialogue with key shareholders to discuss and seek feedback on its Remuneration Policy and governance matters and, in particular, the Company discusses any significant changes to policy or measures used to assess performance.
During the year, there were no changes to the executive director Remuneration Policy proposed for 2015. The Company will continue to actively engage with and seek to incorporate the views of its shareholders in any major changes to executive director Remuneration Policy.
STRATEGIC
REPORT
CO
RPORATE G
OVERN
ANC
EFIN
ANC
IAL STATEMEN
TS
66 | entertainmentone.com
ANNUAL REPORT ON REMUNERATION
This section of the Remuneration Report contains details of how the Company’s Remuneration Policy for directors was implemented during the year ended 31 March 2015.
1. REMUNERATION PHILOSOPHYThe Company’s proposed Remuneration Policy is designed to provide the executive directors a level of remuneration which enables eOne to attract and retain talented individuals who have the necessary skills and experience to support the continued development of the Company and motivate them to deliver the Company’s strategy. The Policy intends to incentivise management to provide long-term value growth for the Company’s shareholders whilst taking account of internal and external risks.
The remuneration package has been designed based on the following key principles:
Principle Explanation
Reward package to attract and retain the best talent
To ensure that the Company is in a position to attract and retain the best executive directors the total remuneration package will target to pay at an upper quartile level, based on meeting relevant performance criteria.
Relevant comparator group The principal external comparator group (which is used for reference purposes only) is made up of constituents of the FTSE 250 Index (as the Company is a constituent member of the Index), with reference also made to UK and North American sector specific companies and other Canadian listed companies (against which the Company competes to attract and retain executive talent).
Reward assessed on a total compensation basis
The remuneration package provided to the executive directors is reviewed annually on a total compensation basis (i.e. single elements of the package are not reviewed in isolation). Packages are reviewed in the context of individual and Group performance, internal relativities, criticality of the individual to the business, experience, and the scarcity or otherwise of executives with the relevant skill set.
Pay for performance The Remuneration Committee consistently aims to set stretching targets, and ensure that maximum or near maximum pay-outs are only delivered for achievement against these.
Incentive target measures linked to business strategy
When designing the incentive packages for executives the Board has considered performance measures and targets that support delivery of the Group’s strategic objectives.
Alignment to shareholder interests
The package is designed to align the interests of the executives with those of shareholders, with an appropriate proportion of total remuneration dependent upon sustained long-term performance. Share ownership is a key cornerstone of the Group’s reward policy and is designed to help maintain commitment over the long-term, and to ensure that the interests of the executive are aligned with those of shareholders.

eOne Annual Report and Accounts 2015 | 67
2. SINGLE TOTAL FIGURE OF REMUNERATIONThe information in this section has been audited.
EXECUTIVE DIRECTORSThe tables below set out the single total figure of remuneration and breakdown for each executive director earned in the years ended 31 March 2015 and 2014. Figures provided have been calculated in accordance with the remuneration disclosure regulations (The Large and Medium-sized Companies and Groups (Accounts and Reports) (Amendment) Regulations 2013).
Year ended 31 March 2015
Salary £000
Taxable benefits
£000
Annual bonus £000
Long-term incentives
£000Pensions
£000Total
£000
Darren Throop1 524 5 434 – 13 976Giles Willits2 402 51 333 – 40 8261. Canadian director remuneration has been translated at the C$:£ rate of 1.8319.2. Taxable benefits for Giles Willits include £30,298 of payment in lieu of pension.
Year ended 31 March 2014
Salary £000
Taxable benefits
£000
Annual bonus £000
Long-term incentives4
£000Pensions
£000Total
£000
Darren Throop1,2 594 5 507 9,149 14 10,269Giles Willits3 390 47 329 5,748 40 6,5541. Canadian director remuneration has been translated at the C$:£ rate of 1.6767.2. Darren Throop’s salary includes C$63,000, or £38,000, in respect of retrospective salary adjustments from September 2012 to March 2013. Consequently, the annual
bonus amount in the table above of £507,000 includes a retrospective payment of £38,000 at the prior year bonus rate of 100%. 3. Taxable benefits for Giles Willits include £28,000 of payment in lieu of pension. 4. Amounts included as long-term incentives relate to the out-performance incentive plan and the MPS (see details on page 70) which vested during the year.
Taxable benefits in the years ended 31 March 2015 and 2014 consist of costs relating to the provision of a motor vehicle, private medical insurance, health insurance, dental insurance, income protection insurance and payments in lieu of pension contributions.
STRATEGIC
REPORT
CO
RPORATE G
OVERN
ANC
EFIN
ANC
IAL STATEMEN
TS
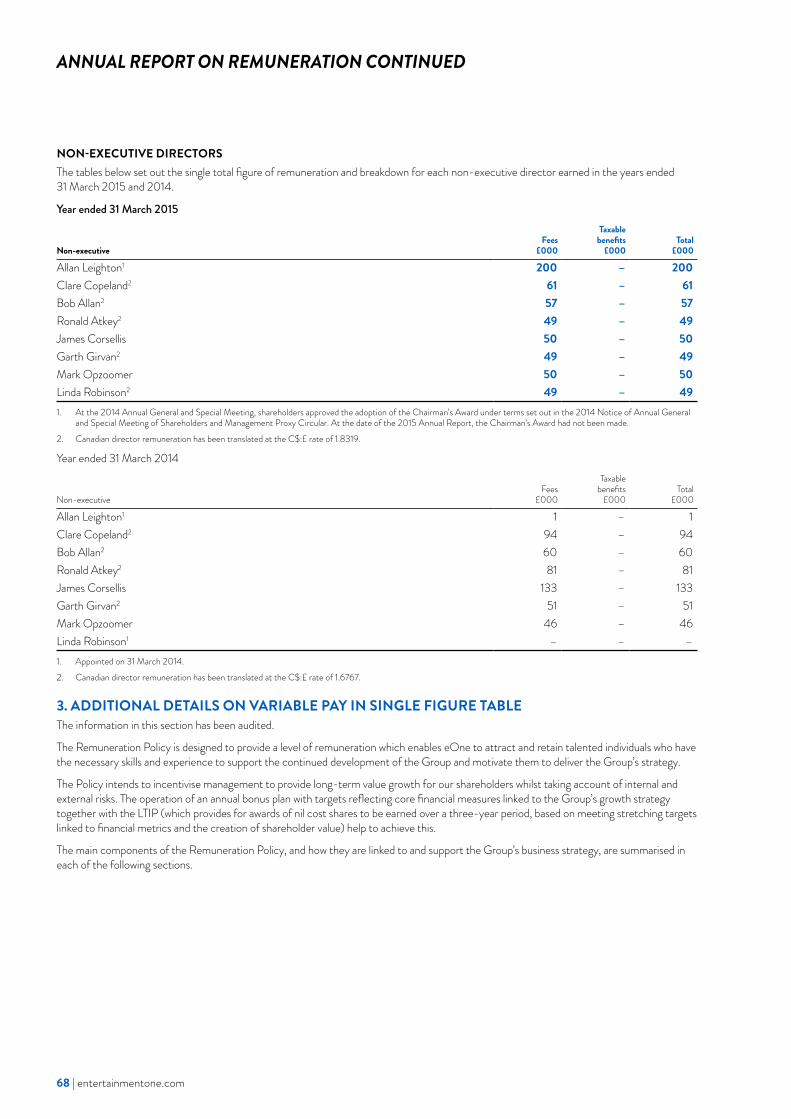
68 | entertainmentone.com
NON-EXECUTIVE DIRECTORSThe tables below set out the single total figure of remuneration and breakdown for each non-executive director earned in the years ended 31 March 2015 and 2014.
Year ended 31 March 2015
Non-executiveFees
£000
Taxable benefits
£000Total
£000
Allan Leighton1 200 – 200Clare Copeland2 61 – 61Bob Allan2 57 – 57Ronald Atkey2 49 – 49James Corsellis 50 – 50Garth Girvan2 49 – 49Mark Opzoomer 50 – 50Linda Robinson2 49 – 491. At the 2014 Annual General and Special Meeting, shareholders approved the adoption of the Chairman’s Award under terms set out in the 2014 Notice of Annual General
and Special Meeting of Shareholders and Management Proxy Circular. At the date of the 2015 Annual Report, the Chairman’s Award had not been made.2. Canadian director remuneration has been translated at the C$:£ rate of 1.8319.
Year ended 31 March 2014
Non-executiveFees
£000
Taxable benefits
£000Total
£000
Allan Leighton1 1 – 1Clare Copeland2 94 – 94Bob Allan2 60 – 60Ronald Atkey2 81 – 81James Corsellis 133 – 133Garth Girvan2 51 – 51Mark Opzoomer 46 – 46Linda Robinson1 – – –1. Appointed on 31 March 2014.2. Canadian director remuneration has been translated at the C$:£ rate of 1.6767.
3. ADDITIONAL DETAILS ON VARIABLE PAY IN SINGLE FIGURE TABLEThe information in this section has been audited.
The Remuneration Policy is designed to provide a level of remuneration which enables eOne to attract and retain talented individuals who have the necessary skills and experience to support the continued development of the Group and motivate them to deliver the Group’s strategy.
The Policy intends to incentivise management to provide long-term value growth for our shareholders whilst taking account of internal and external risks. The operation of an annual bonus plan with targets reflecting core financial measures linked to the Group’s growth strategy together with the LTIP (which provides for awards of nil cost shares to be earned over a three-year period, based on meeting stretching targets linked to financial metrics and the creation of shareholder value) help to achieve this.
The main components of the Remuneration Policy, and how they are linked to and support the Group’s business strategy, are summarised in each of the following sections.
ANNUAL REPORT ON REMUNERATION CONTINUED
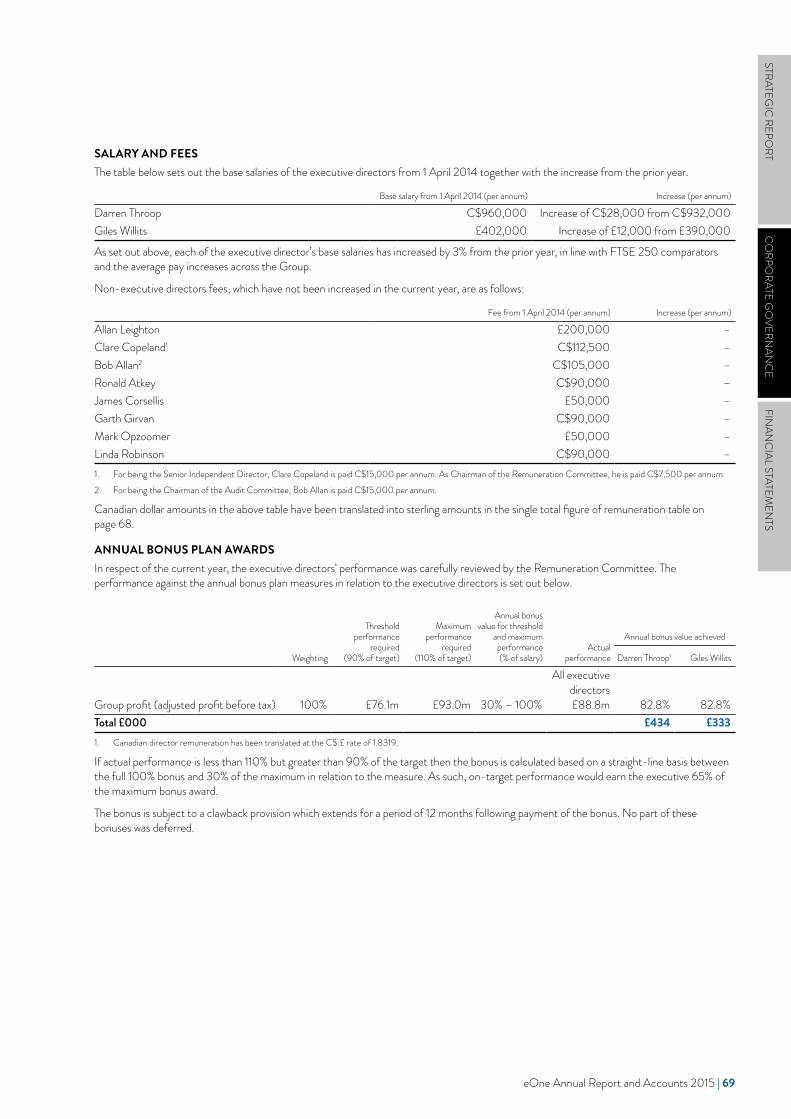
eOne Annual Report and Accounts 2015 | 69
SALARY AND FEESThe table below sets out the base salaries of the executive directors from 1 April 2014 together with the increase from the prior year.
Base salary from 1 April 2014 (per annum) Increase (per annum)
Darren Throop C$960,000 Increase of C$28,000 from C$932,000Giles Willits £402,000 Increase of £12,000 from £390,000
As set out above, each of the executive director’s base salaries has increased by 3% from the prior year, in line with FTSE 250 comparators and the average pay increases across the Group.
Non-executive directors fees, which have not been increased in the current year, are as follows:
Fee from 1 April 2014 (per annum) Increase (per annum)
Allan Leighton £200,000 –Clare Copeland1 C$112,500 –Bob Allan2 C$105,000 –Ronald Atkey C$90,000 –James Corsellis £50,000 –Garth Girvan C$90,000 –Mark Opzoomer £50,000 –Linda Robinson C$90,000 –1. For being the Senior Independent Director, Clare Copeland is paid C$15,000 per annum. As Chairman of the Remuneration Committee, he is paid C$7,500 per annum.2. For being the Chairman of the Audit Committee, Bob Allan is paid C$15,000 per annum.
Canadian dollar amounts in the above table have been translated into sterling amounts in the single total figure of remuneration table on page 68.
ANNUAL BONUS PLAN AWARDSIn respect of the current year, the executive directors’ performance was carefully reviewed by the Remuneration Committee. The performance against the annual bonus plan measures in relation to the executive directors is set out below.
Weighting
Threshold performance
required (90% of target)
Maximum performance
required (110% of target)
Annual bonus value for threshold
and maximum performance (% of salary)
Actual performance
Annual bonus value achieved
Darren Throop1 Giles Willits
Group profit (adjusted profit before tax) 100% £76.1m £93.0m 30% – 100%
All executive directors £88.8m 82.8% 82.8%
Total £000 £434 £3331. Canadian director remuneration has been translated at the C$:£ rate of 1.8319.
If actual performance is less than 110% but greater than 90% of the target then the bonus is calculated based on a straight-line basis between the full 100% bonus and 30% of the maximum in relation to the measure. As such, on-target performance would earn the executive 65% of the maximum bonus award.
The bonus is subject to a clawback provision which extends for a period of 12 months following payment of the bonus. No part of these bonuses was deferred.
STRATEGIC
REPORT
CO
RPORATE G
OVERN
ANC
EFIN
ANC
IAL STATEMEN
TS
70 | entertainmentone.com
OUT-PERFORMANCE PLANFrom March 2007, the Group had in place an out-performance incentive plan for the benefit of the executive directors. Under this plan, a total amount of £5.0 million was payable to the executive directors, conditional on the Company’s share price achieving a 180 day volume-weighted average price of £2.25 per share. The conditions were met on 6 February 2014 and this amount was paid out during 2014, having been fully provided for as at 31 March 2013.
Executive directorAmount paid per director
£000
Darren Throop 1,667Giles Willits 1,667
MPSIn 2010, the executive directors subscribed for shares in a subsidiary of the Company that were exchangeable for common shares of an equivalent value upon satisfaction of certain conditions. The exchange for common shares under the MPS was conditional, amongst other things, on the performance of the Company’s share price exceeding a compound annual growth rate of at least 12.5% in the three-year period ending 31 March 2013. This condition was achieved and therefore during the prior year the executive directors received common shares in the Company as follows:
Executive director Number of shares awarded
Volume-weighted average share price over the 30 dealing days
immediately preceding the award date Pence
Monetary equivalent of the MPS award
£000
Darren Throop 3,970,227 188.5 7,482Giles Willits 2,165,578 188.5 4,081
4. LONG TERM INCENTIVES AWARDED DURING THE FINANCIAL YEARThe information in this section has been audited.
The table below sets out the details of the LTIP awards granted in the year ended 31 March 2015 where vesting will be determined according to the achievement of performance conditions that will be tested in future reporting periods.
Executive director Award type LTIP awarded
(% of base salary1) Face value of award2
Percentage of award vesting at threshold
performance
Maximum percentage of face
value that could vest Performance period Performance
conditions
Darren ThroopLTIP – second annual cycle of
awards
125% 664
30% 100% 1 April 2014 to 31 March 2017
Adjusted fully diluted EPS
growthTSR growth
Giles Willits 100% 402 Average ROCE1. The LTIP award has been calculated based on the salaries of the executives as at 1 April 2014. For Darren Throop, Canadian dollar base salary of C$960,000 was converted
to pounds sterling at the C$:£ rate of 1.8072 (being the average exchange rate over the three dealing days immediately preceding the award date of 25 September 2014).2. Maximum number of shares multiplied by 320.2p (being the volume-weighted average share price over the three dealing days immediately preceding the award date of
25 September 2014).
These awards will normally vest, subject to continued employment with a Group company and any applicable performance and other conditions, on the later of the third anniversary of the date of award and the date on which the Remuneration Committee determines that the performance and other conditions have been satisfied (in whole or in part). Detailed explanations of each performance condition are set out on the following pages.
ANNUAL REPORT ON REMUNERATION CONTINUED

eOne Annual Report and Accounts 2015 | 71
(i) ADJUSTED FULLY DILUTED EPS GROWTH Adjusted fully diluted EPS is calculated before one-off operating and finance items, share-based payments and amortisation of acquired assets (net of any related tax effects) and is as disclosed in the relevant Annual Report and Accounts. The measure is calculated after adjusting the weighted average number of shares in issue for a year to assume conversion of all potentially dilutive shares.
Vesting of 33% of the LTIP award for each executive director will be determined by an assessment of the annualised adjusted fully diluted EPS growth from 1 April 2014 to 31 March 2017 as follows:
Annualised adjusted EPS growth
Vesting of this portion
As % of total LTIP award
Threshold 10% per annum 30% 9.9%Maximum 15% per annum 100% 33.0%
The growth rate will be calculated based on adjusted fully diluted EPS as disclosed in the relevant Annual Report and Accounts (subject to such adjustments as the Board may determine from time-to-time). Adjusted fully diluted EPS at 31 March 2014 (the denominator in any growth rate calculations) was 20.9 pence.
Awards will vest on a straight-line basis for performance between threshold and maximum performance. No vesting of this portion will occur if performance is below threshold.
(ii) TSR GROWTH The comparator group comprises those companies constituting the FTSE 250 index on 1 April 2014 (excluding investment trusts).
Vesting of 34% of the LTIP award for each executive director will be determined by ranking the Company and each member of the comparator group by TSR and the extent to which the award vests will be determined as follows:
Rank of the Company’s TSR within the comparator group
Vesting of this portion
As % of total LTIP award
Threshold Median 30% 10.2%Maximum Upper quartile 100% 34.0%
For these purposes, a company with a more negative TSR will rank lower than a company with a less negative TSR. If any member of the comparator group ceases to exist, its shares cease to be listed on a recognised stock exchange, or otherwise is so changed as to make it, in the opinion of the Board, unsuitable as a member of the comparator group, the Board will exclude that company unless it decides to (a) in the event of a takeover of that company, replace that company with the acquiring company; (b) include a substitute for that company; (c) track the future performance of that company by reference to an index; or (d) treat the company in any other way it decides is appropriate.
Awards will vest on a straight-line basis for performance between median and upper quartile performance. No vesting of this portion will occur if either (i) performance is below median or (ii) the Company’s TSR is less than 5%.
(iii) AVERAGE ROCE ROCE is calculated by dividing adjusted net operating profit (adjusted NOP) by net operating assets, where adjusted NOP is calculated before one-off operating and finance items, share-based payments and amortisation of acquired assets (net of any related tax effects) and is stated before adjusted finance costs (after tax). Adjusted NOP can be derived from the audited consolidated financial statements.
Net operating assets means, for any financial year, the average of opening and closing total assets as shown in the audited consolidated financial statements less current liabilities (excluding current debt balances). The calculation will also take into account any of the adjustments which the Committee determines are required to ensure it is consistent with the calculation of adjusted NOP.
Vesting of 33% of the LTIP award will be determined by an assessment of the average ROCE over the three consecutive years ending 31 March 2017 as follows:
Average ROCE
Vesting of this portion
As % of total LTIP award
Threshold 10.5% 30% 9.9%Maximum 12.0% 100% 33.0%
Awards will vest on a straight-line basis for performance between threshold and maximum performance. No vesting of this portion will occur if performance is below threshold.
STRATEGIC
REPORT
CO
RPORATE G
OVERN
ANC
EFIN
ANC
IAL STATEMEN
TS
72 | entertainmentone.com
5. PENSION ENTITLEMENTSThe information in this section has been audited.
The Group does not operate any defined benefit retirement plans. In the year ended 31 March 2015, Darren Throop received pension contributions up to the maximum permitted by the RRSP in Canada (C$24,270 for the current financial year). Giles Willits currently receives pension contributions and supplements up to a maximum of 17.5% of base salary. The Remuneration Committee has the authority to change the above levels of pension contributions (percentage and absolute amount) if it deems it appropriate.
6. PAYMENTS TO PAST DIRECTORSThe information in this section has been audited.
Payments of £2.1 million were made to past directors during the year.
7. PAYMENTS FOR LOSS OF OFFICEThe information in this section has been audited.
There were no payments for loss of office during the year.
8. STATEMENT OF DIRECTORS’ SHAREHOLDINGThe information in this section has been audited.
Shares (without performance measures)
Unvested share options (with performance measures)
Executive director 31 March 2015 31 March 2014 31 March 2015 31 March 2014
Darren Throop 8,400,000 8,400,000 603,811 396,305Giles Willits 3,061,322 3,061,322 335,017 209,572
To further promote alignment with the interests of our shareholders, executive directors are expected to build up and maintain significant holdings of eOne shares as follows:
– CEO 3 times base salary – Other executive directors 2 times base salary
The table below summaries the executive directors’ interests in shares and the extent to which the shareholding expectation applicable to executive directors has been achieved as at 31 March 2015.
Executive director
Value of shares to be held1
£000
Beneficial interests in shares2
Value of beneficial interests in shares3
£000
Shareholding expectation
met?
Darren Throop £1,531 8,400,000 25,410 YesGiles Willits £804 3,061,322 9,260 Yes1. This has been calculated based on the salaries of the executives as at 1 April 2014. For Darren Throop, his Canadian dollar salary has been translated at the 31 March 2015
C$:£ rate of 1.8805. 2. Beneficial interests include shares held directly or indirectly by connected persons. 3. Based on the closing share price at 31 March 2015 of £3.025.
At 31 March 2015, the shareholding expectation has been achieved for each executive director. There is no shareholding expectation for non-executive directors. Notwithstanding James Corsellis’ relationship with Marwyn as set out in Note 36, no non-executive director had any beneficial interests in shares at 31 March 2015.
ANNUAL REPORT ON REMUNERATION CONTINUED
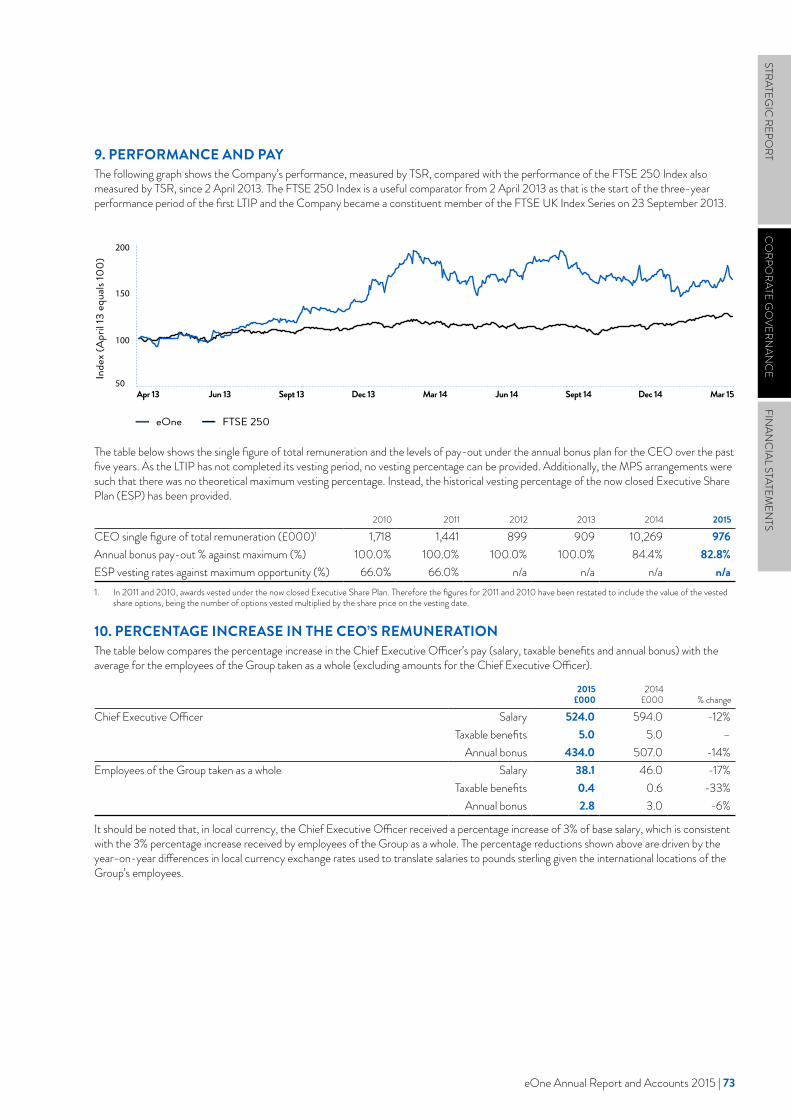
eOne Annual Report and Accounts 2015 | 73
9. PERFORMANCE AND PAYThe following graph shows the Company’s performance, measured by TSR, compared with the performance of the FTSE 250 Index also measured by TSR, since 2 April 2013. The FTSE 250 Index is a useful comparator from 2 April 2013 as that is the start of the three-year performance period of the first LTIP and the Company became a constituent member of the FTSE UK Index Series on 23 September 2013.
The table below shows the single figure of total remuneration and the levels of pay-out under the annual bonus plan for the CEO over the past five years. As the LTIP has not completed its vesting period, no vesting percentage can be provided. Additionally, the MPS arrangements were such that there was no theoretical maximum vesting percentage. Instead, the historical vesting percentage of the now closed Executive Share Plan (ESP) has been provided.
2010 2011 2012 2013 2014 2015
CEO single figure of total remuneration (£000)1 1,718 1,441 899 909 10,269 976Annual bonus pay-out % against maximum (%) 100.0% 100.0% 100.0% 100.0% 84.4% 82.8%ESP vesting rates against maximum opportunity (%) 66.0% 66.0% n/a n/a n/a n/a1. In 2011 and 2010, awards vested under the now closed Executive Share Plan. Therefore the figures for 2011 and 2010 have been restated to include the value of the vested
share options, being the number of options vested multiplied by the share price on the vesting date.
10. PERCENTAGE INCREASE IN THE CEO’S REMUNERATIONThe table below compares the percentage increase in the Chief Executive Officer’s pay (salary, taxable benefits and annual bonus) with the average for the employees of the Group taken as a whole (excluding amounts for the Chief Executive Officer).
2015
£0002014
£000 % change
Chief Executive Officer Salary 524.0 594.0 -12%Taxable benefits 5.0 5.0 –
Annual bonus 434.0 507.0 -14%Employees of the Group taken as a whole Salary 38.1 46.0 -17%
Taxable benefits 0.4 0.6 -33%Annual bonus 2.8 3.0 -6%
It should be noted that, in local currency, the Chief Executive Officer received a percentage increase of 3% of base salary, which is consistent with the 3% percentage increase received by employees of the Group as a whole. The percentage reductions shown above are driven by the year-on-year differences in local currency exchange rates used to translate salaries to pounds sterling given the international locations of the Group’s employees.
eOne
Apr 13 Jun 13 Sept 13 Dec 13 Mar 14 Mar 15
FTSE 250
Inde
x (A
pril
13 e
quals
100)
Jun 14 Sept 14 Dec 1450
100
150
200
STRATEGIC
REPORT
CO
RPORATE G
OVERN
ANC
EFIN
ANC
IAL STATEMEN
TS
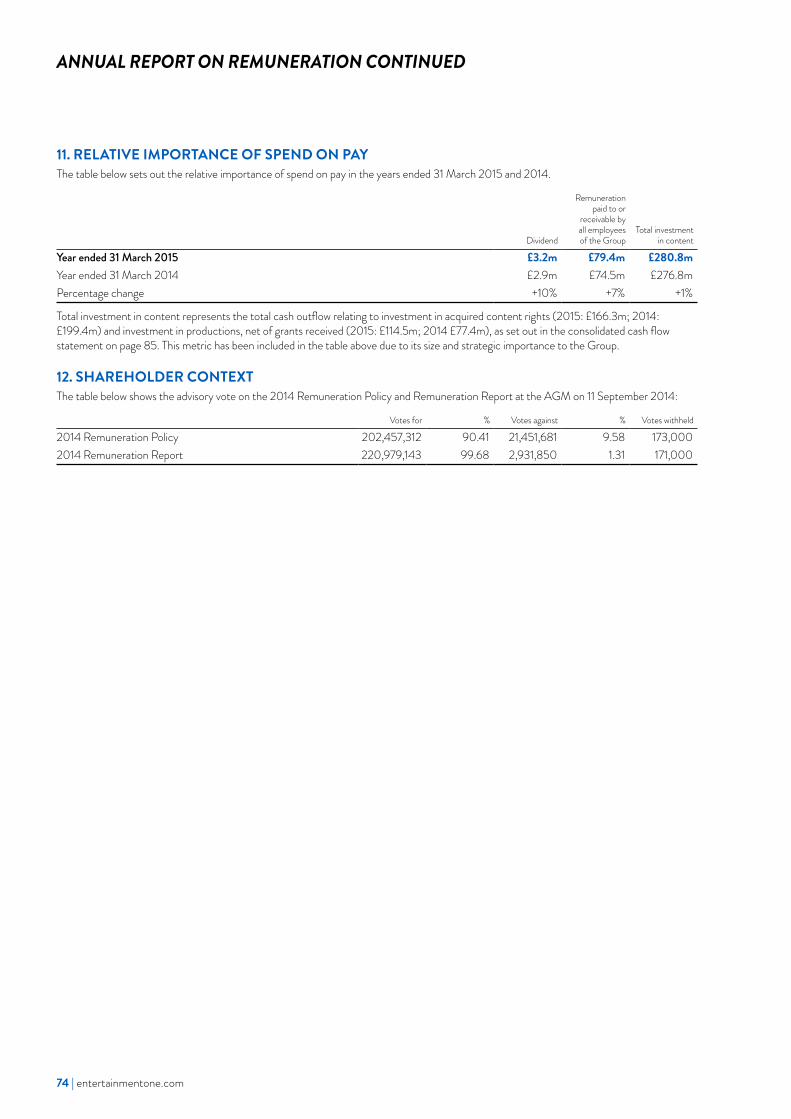
74 | entertainmentone.com
11. RELATIVE IMPORTANCE OF SPEND ON PAYThe table below sets out the relative importance of spend on pay in the years ended 31 March 2015 and 2014.
Dividend
Remuneration paid to or
receivable by all employees of the Group
Total investment in content
Year ended 31 March 2015 £3.2m £79.4m £280.8mYear ended 31 March 2014 £2.9m £74.5m £276.8mPercentage change +10% +7% +1%
Total investment in content represents the total cash outflow relating to investment in acquired content rights (2015: £166.3m; 2014: £199.4m) and investment in productions, net of grants received (2015: £114.5m; 2014 £77.4m), as set out in the consolidated cash flow statement on page 85. This metric has been included in the table above due to its size and strategic importance to the Group.
12. SHAREHOLDER CONTEXTThe table below shows the advisory vote on the 2014 Remuneration Policy and Remuneration Report at the AGM on 11 September 2014:
Votes for % Votes against % Votes withheld
2014 Remuneration Policy 202,457,312 90.41 21,451,681 9.58 173,0002014 Remuneration Report 220,979,143 99.68 2,931,850 1.31 171,000
ANNUAL REPORT ON REMUNERATION CONTINUED
eOne Annual Report and Accounts 2015 | 75
REMUNERATION COMMITTEE TERMS OF REFERENCE AND EVALUATIONThe Remuneration Committee is responsible for overseeing the policy regarding executive remuneration and approving the remuneration packages for the Group’s executive directors and senior managers over agreed thresholds and its terms of reference includes:
– the framework or broad policy regarding executive remuneration and individual remuneration and incentive packages; – participation in any discretionary employee share schemes operated by the Group; – targets for any performance-related payments; – participation in any discretionary incentive schemes and bonus arrangements operated by the Group; – the policy for and scope of any pension arrangements; – the policy for and scope of any termination payments and the severance terms; and – the provision of benefits.
The Remuneration Committee is responsible for recommending and monitoring the level and structure of senior management remuneration and also determines the issue and terms of all share schemes operated by the Group for the benefit of certain Group employees. In addition, the Remuneration Committee will review, at least annually, a succession plan prepared by the Group that sets out details in relation to succession planning for executive directors and senior management in order to consider an appropriate remuneration framework to fit with the succession plan.
The executive directors determine the remuneration of the non-executive directors with the support of external professional advice, if required, and ratification by the Board. No director participates in any discussion regarding his or her own remuneration.
The Committee keeps its terms of reference under review and makes recommendations for changes to the Board. The full terms of reference are available on the Company’s website. A questionnaire has been developed for the Committee and this is completed annually by Committee members and collated as input to a performance discussion at the relevant Committee meeting.
COMMITTEE MEMBERSHIPDuring the year, the Remuneration Committee comprised Clare Copeland (Chairman) with James Corsellis and Garth Girvan as the other non-executive members. On 15 May 2015, Bob Allan was appointed as a third independent member of the Remuneration Committee to bring the Committee’s composition into line with Code requirements.
The Chairman (Allan Leighton), the CEO (Darren Throop) and the CFO (Giles Willits) are invited to attend Remuneration Committee meetings but do not participate in decisions. These attendees were present when the Remuneration Committee considered matters relating to the executive directors’ remuneration for the year ended 31 March 2015.
MEETINGSThe Committee met four times during the year. Committee member attendance at Committee meetings is shown on page 46.
The Committee’s activities for the year ended 31 March 2015 have included:
DATE OF MEETING AGENDAMay 2014 – Approval of executive director bonuses for the year ended 31 March 2014
– Approval of proposed changes to executive director remuneration, including remuneration objectives, principles, policy recommendations and the LTIP
– Approval of executive director bonus targets for the year ended 31 March 2015 – Approval of LTIP awards made to senior management – Terms of reference and Committee self-evaluation
September 2014 – External market update – Senior management approvals, including share option awards under the LTIP
March 2015(two meetings)
– Senior management approvals, including share option awards under the LTIP – Approval of LTIP awards made to senior management – Succession planning
The Remuneration Committee adopts the principles of good governance as set out in the UK Corporate Governance Code and complies with the Listing Rules of the Financial Conduct Authority and Schedule 8 of The Large and Medium-sized Companies and Groups (Accounts and Reports) Regulations 2008 (as amended in 2013).
ADVISERS TO THE REMUNERATION COMMITTEEOn the basis that the Company’s Remuneration Policy was approved at the 2014 Annual General Meeting and remains in place until 2017, the Company did not appoint a formal remuneration adviser during the year and paid no fees for remuneration advice.
REMUNERATION COMMITTEE STRATEGIC
REPORT
CO
RPORATE G
OVERN
ANC
EFIN
ANC
IAL STATEMEN
TS
76 | entertainmentone.com
DIRECTORS’ REPORT: ADDITIONAL INFORMATION
The directors present their report and audited consolidated financial statements for the year ended 31 March 2015.
PRINCIPAL ACTIVITIESEntertainment One Ltd. is a leading independent entertainment Group focused on the acquisition, production and distribution of film and television content rights across all media throughout the world.
STRATEGIC REPORTThe Strategic Report on pages 1 to 39 sets out a comprehensive review of the development and performance of the business for the year ended 31 March 2015.
RESULTS AND DIVIDENDSDuring the year the Group made a profit after tax of £41.3 million (2014: £20.0 million). The Company did not pay an interim dividend during the year ended 31 March 2015; however, the directors have declared the payment of a final dividend in respect of 2015 of 1.1 pence per share.
RISK MANAGEMENT AND INTERNAL CONTROLSDisclosures can be found in Note 32 to the consolidated financial statements and in the Corporate Governance section on pages 47, 48 and 52.
CAPITAL STRUCTUREThe Company has one class of shares. These common shares carry the right to one vote at general meetings of the Company. They have no par value and the authorised number of common shares is unlimited. There are no specific restrictions on the size of a holding nor on the transfer of shares, which are both governed by the general provisions of the Articles of the Company and prevailing legislation. Further information regarding the capital structure, together with details of new share issues during the year, are shown in Note 33 to the consolidated financial statements.
DIRECTORSAll directors served throughout the year under review. Details for all present directors are listed, together with their biographical details, on pages 42 to 43. The Company has agreed to indemnify the directors as permitted by law against liabilities they may incur in the execution of their duties as directors of the Company. The Company may, by ordinary resolution, appoint or remove a director to the Board. The responsibilities of the directors are detailed in the Corporate Governance section on pages 40 to 75.DIRECTORS’ INTERESTS
The beneficial interests of the directors and their families in the shares of the Company are shown below. Options granted under the Company’s employee share plans are shown in the Remuneration Report on pages 70 to 72.
Number of common shares
at 31 March 2015
Darren Throop 8,400,000Giles Willits 3,061,322
SUBSTANTIAL SHAREHOLDINGSAt 30 April 2015 the Company was aware of the following holdings representing 3% or more in its issued common shares:
Number of common shares
held as at 30 April 2015
Percentage of voting rights and
issued shares
Marwyn Value Investors L.P. 79,424,894 26.9%M&G Investment Management Ltd 22,732,032 7.7%Capital Research and Management 16,145,082 5.5%Fidelity International Limited 12,170,819 4.1%Standard Life Investments Ltd. 9,842,957 3.3%
CORPORATE RESPONSIBILITYThe Group has an open, honest and responsible approach towards its stakeholders which include employees, suppliers, customers, investors and the wider community. Ethical and responsible practices and a commitment to minimise our impact on the environment are key motivators behind the Group’s corporate responsibility framework. Further details of the Group’s approach to such matters are set out in the Corporate Responsibility section on pages 36 to 39.
DISABLED EMPLOYEESApplications for employment by disabled persons are always fully considered, bearing in mind the aptitudes of the applicant concerned. In the event of employees becoming disabled every effort is made to ensure that their employment with the Group continues and that appropriate training is arranged. It is the policy of the Group that the training, career development and promotion of disabled persons should, as far as possible, be identical to that of other employees.
GOING CONCERNThe directors continue to adopt the going concern basis in preparing the Annual Report and Accounts. Further details are set out in Note 3 to the consolidated financial statements.
AUDITORA resolution to reappoint Deloitte LLP as auditor will be proposed at the forthcoming Annual General Meeting.
DISCLOSURE OF INFORMATION TO AUDITORThe following applies to each of those persons who were directors at the time this report was approved:
– so far as the director is aware, there is no relevant audit information of which the Company’s auditor is unaware; and
– he/she has taken all the steps that he/she ought to have taken as a director in order to make himself/herself aware of any relevant audit information and to establish that the Company’s auditor is aware of that information.
ANNUAL GENERAL MEETINGThe Annual General Meeting of the Company will be held on 16 September 2015.
By order of the Board
GILES WILLITS DIRECTOR18 May 2015
eOne Annual Report and Accounts 2015 | 77
STATEMENT OF DIRECTORS’ RESPONSIBILITIES
The directors are responsible for preparing the Annual Report and Accounts and the consolidated financial statements in accordance with applicable law and regulations.
The directors are required to prepare the consolidated financial statements in accordance with International Financial Reporting Standards (IFRSs) as adopted by the European Union and Article 4 of the IAS Regulation. The directors must not approve the accounts unless they are satisfied that they give a true and fair view of the state of affairs of the Group and of the profit or loss of the Group for that period. In preparing these consolidated financial statements, International Accounting Standard 1 requires that directors:
– properly select and apply accounting policies; – present information, including accounting policies, in a manner
that provides relevant, reliable, comparable and understandable information;
– provide additional disclosures when compliance with the specific requirements in IFRSs are insufficient to enable users to understand the impact of particular transactions, other events and conditions on the entity’s financial position and financial performance; and
– make an assessment of the Group’s ability to continue as a going concern.
The directors are responsible for keeping adequate accounting records that are sufficient to show and explain the Group’s transactions and disclose with reasonable accuracy at any time the financial position of the Group. They are also responsible for safeguarding the assets of the Group and hence for taking reasonable steps for the prevention and detection of fraud and other irregularities.
The directors are responsible for the maintenance and integrity of the corporate and financial information included on the Company’s website. Legislation in the United Kingdom governing the preparation and dissemination of financial information differs from legislation in other jurisdictions.
RESPONSIBILITY STATEMENT We confirm that to the best of our knowledge:
– the consolidated financial statements, prepared in accordance with IFRSs as adopted by the European Union, give a true and fair view of the assets, liabilities, financial position and profit of the Group as a whole;
– the Business and Financial Reviews include a fair review of the development and performance of the business and the position of the Group, together with a description of the principal risks and uncertainties that they face; and
– the Annual Report and Accounts and the consolidated financial statements, taken as a whole, are fair, balanced and understandable and provide the information necessary for shareholders to assess the Group’s performance, business model and strategy.
By order of the Board
GILES WILLITS DIRECTOR18 May 2015
STRATEGIC
REPORT
CO
RPORATE G
OVERN
ANC
EFIN
ANC
IAL STATEMEN
TS
78 | entertainmentone.com
INDEX TO THE CONSOLIDATED FINANCIAL STATEMENTS
78 | entertainmentone.com
Consolidated Financial Statements Independent Auditor’s Report to the Members of Entertainment One Ltd. 79Consolidated Income Statement 82Consolidated Statement of Comprehensive Income 82Consolidated Balance Sheet 83Consolidated Statement of Changes in Equity 84Consolidated Cash Flow Statement 85
Notes to the Consolidated Financial Statements 1. Nature of operations and general information 862. New, amended, revised and improved Standards 863. Significant accounting policies 874. Significant accounting judgements and key sources of estimation uncertainty 935. Segmental analysis 956. Operating profit 977. Key management compensation and directors’ emoluments 978. Staff costs 989. One-off items 9810. Finance income and finance costs 9911. Tax 10012. Deferred tax assets and liabilities 10113. Dividends 10114. Earnings per share 10215. Goodwill 10316. Other intangible assets 10517. Investment in productions 10518. Property, plant and equipment 10619. Inventories 10620. Investment in acquired content rights 10621. Trade and other receivables 10722. Cash and cash equivalents 10823. Interest-bearing loans and borrowings 10924. Net debt reconciliation 11025. Trade and other payables 11126. Provisions 11127. Business combinations 11228. Subsidiaries 11629. Interests in joint ventures 11730. Interests in partly-owned subsidiaries 11931. Derivative financial instruments 12032. Financial risk management 12033. Stated capital, own shares and other reserves 12334. Share-based payments 12435. Commitments 12636. Related party transactions 127
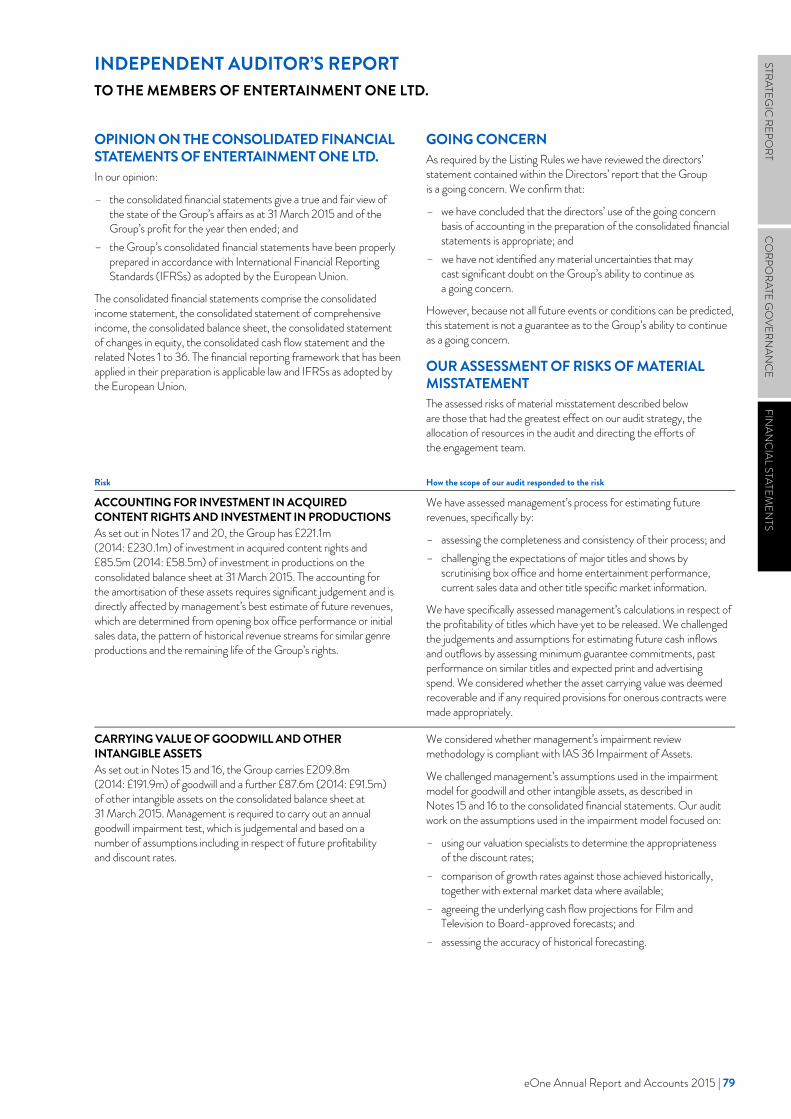
eOne Annual Report and Accounts 2015 | 79
STRATEGIC
REPORT
CO
RPORATE G
OVERN
ANC
EFIN
ANC
IAL STATEMEN
TS
INDEPENDENT AUDITOR’S REPORT TO THE MEMBERS OF ENTERTAINMENT ONE LTD.
eOne 2015 Annual Report and Accounts | 79
STRATEGIC
REPORT
CORPO
RATE GO
VERNAN
CEFIN
ANC
IAL STATEMEN
TS
OPINION ON THE CONSOLIDATED FINANCIAL STATEMENTS OF ENTERTAINMENT ONE LTD. In our opinion:
– the consolidated financial statements give a true and fair view of the state of the Group’s affairs as at 31 March 2015 and of the Group’s profit for the year then ended; and
– the Group’s consolidated financial statements have been properly prepared in accordance with International Financial Reporting Standards (IFRSs) as adopted by the European Union.
The consolidated financial statements comprise the consolidated income statement, the consolidated statement of comprehensive income, the consolidated balance sheet, the consolidated statement of changes in equity, the consolidated cash flow statement and the related Notes 1 to 36. The financial reporting framework that has been applied in their preparation is applicable law and IFRSs as adopted by the European Union.
GOING CONCERN As required by the Listing Rules we have reviewed the directors’ statement contained within the Directors’ report that the Group is a going concern. We confirm that:
– we have concluded that the directors’ use of the going concern basis of accounting in the preparation of the consolidated financial statements is appropriate; and
– we have not identified any material uncertainties that may cast significant doubt on the Group’s ability to continue as a going concern.
However, because not all future events or conditions can be predicted, this statement is not a guarantee as to the Group’s ability to continue as a going concern.
OUR ASSESSMENT OF RISKS OF MATERIAL MISSTATEMENT The assessed risks of material misstatement described below are those that had the greatest effect on our audit strategy, the allocation of resources in the audit and directing the efforts of the engagement team.
Risk How the scope of our audit responded to the risk
ACCOUNTING FOR INVESTMENT IN ACQUIRED CONTENT RIGHTS AND INVESTMENT IN PRODUCTIONS As set out in Notes 17 and 20, the Group has £221.1m (2014: £230.1m) of investment in acquired content rights and £85.5m (2014: £58.5m) of investment in productions on the consolidated balance sheet at 31 March 2015. The accounting for the amortisation of these assets requires significant judgement and is directly affected by management’s best estimate of future revenues, which are determined from opening box office performance or initial sales data, the pattern of historical revenue streams for similar genre productions and the remaining life of the Group’s rights.
We have assessed management’s process for estimating future revenues, specifically by:
– assessing the completeness and consistency of their process; and – challenging the expectations of major titles and shows by
scrutinising box office and home entertainment performance, current sales data and other title specific market information.
We have specifically assessed management’s calculations in respect of the profitability of titles which have yet to be released. We challenged the judgements and assumptions for estimating future cash inflows and outflows by assessing minimum guarantee commitments, past performance on similar titles and expected print and advertising spend. We considered whether the asset carrying value was deemed recoverable and if any required provisions for onerous contracts were made appropriately.
CARRYING VALUE OF GOODWILL AND OTHER INTANGIBLE ASSETS As set out in Notes 15 and 16, the Group carries £209.8m (2014: £191.9m) of goodwill and a further £87.6m (2014: £91.5m) of other intangible assets on the consolidated balance sheet at 31 March 2015. Management is required to carry out an annual goodwill impairment test, which is judgemental and based on a number of assumptions including in respect of future profitability and discount rates.
We considered whether management’s impairment review methodology is compliant with IAS 36 Impairment of Assets.
We challenged management’s assumptions used in the impairment model for goodwill and other intangible assets, as described in Notes 15 and 16 to the consolidated financial statements. Our audit work on the assumptions used in the impairment model focused on:
– using our valuation specialists to determine the appropriateness of the discount rates;
– comparison of growth rates against those achieved historically, together with external market data where available;
– agreeing the underlying cash flow projections for Film and Television to Board-approved forecasts; and
– assessing the accuracy of historical forecasting.
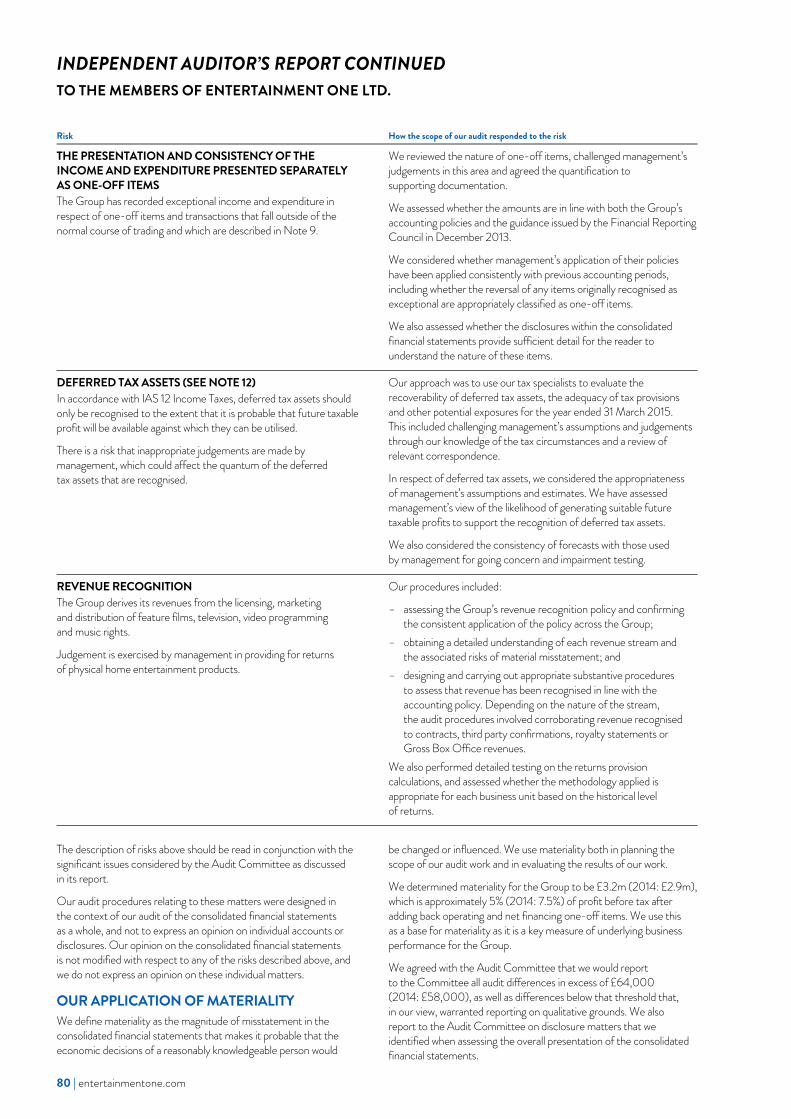
80 | entertainmentone.com
INDEPENDENT AUDITOR’S REPORT CONTINUED TO THE MEMBERS OF ENTERTAINMENT ONE LTD.
80 | entertainmentone.com
Risk How the scope of our audit responded to the risk
THE PRESENTATION AND CONSISTENCY OF THE INCOME AND EXPENDITURE PRESENTED SEPARATELY AS ONE-OFF ITEMS The Group has recorded exceptional income and expenditure in respect of one-off items and transactions that fall outside of the normal course of trading and which are described in Note 9.
We reviewed the nature of one-off items, challenged management’s judgements in this area and agreed the quantification to supporting documentation.
We assessed whether the amounts are in line with both the Group’s accounting policies and the guidance issued by the Financial Reporting Council in December 2013.
We considered whether management’s application of their policies have been applied consistently with previous accounting periods, including whether the reversal of any items originally recognised as exceptional are appropriately classified as one-off items.
We also assessed whether the disclosures within the consolidated financial statements provide sufficient detail for the reader to understand the nature of these items.
DEFERRED TAX ASSETS (SEE NOTE 12) In accordance with IAS 12 Income Taxes, deferred tax assets should only be recognised to the extent that it is probable that future taxable profit will be available against which they can be utilised.
There is a risk that inappropriate judgements are made by management, which could affect the quantum of the deferred tax assets that are recognised.
Our approach was to use our tax specialists to evaluate the recoverability of deferred tax assets, the adequacy of tax provisions and other potential exposures for the year ended 31 March 2015. This included challenging management’s assumptions and judgements through our knowledge of the tax circumstances and a review of relevant correspondence.
In respect of deferred tax assets, we considered the appropriateness of management’s assumptions and estimates. We have assessed management’s view of the likelihood of generating suitable future taxable profits to support the recognition of deferred tax assets.
We also considered the consistency of forecasts with those used by management for going concern and impairment testing.
REVENUE RECOGNITION The Group derives its revenues from the licensing, marketing and distribution of feature films, television, video programming and music rights.
Judgement is exercised by management in providing for returns of physical home entertainment products.
Our procedures included:
– assessing the Group’s revenue recognition policy and confirming the consistent application of the policy across the Group;
– obtaining a detailed understanding of each revenue stream and the associated risks of material misstatement; and
– designing and carrying out appropriate substantive procedures to assess that revenue has been recognised in line with the accounting policy. Depending on the nature of the stream, the audit procedures involved corroborating revenue recognised to contracts, third party confirmations, royalty statements or Gross Box Office revenues.
We also performed detailed testing on the returns provision calculations, and assessed whether the methodology applied is appropriate for each business unit based on the historical level of returns.
The description of risks above should be read in conjunction with the significant issues considered by the Audit Committee as discussed in its report.
Our audit procedures relating to these matters were designed in the context of our audit of the consolidated financial statements as a whole, and not to express an opinion on individual accounts or disclosures. Our opinion on the consolidated financial statements is not modified with respect to any of the risks described above, and we do not express an opinion on these individual matters.
OUR APPLICATION OF MATERIALITY We define materiality as the magnitude of misstatement in the consolidated financial statements that makes it probable that the economic decisions of a reasonably knowledgeable person would
be changed or influenced. We use materiality both in planning the scope of our audit work and in evaluating the results of our work.
We determined materiality for the Group to be £3.2m (2014: £2.9m), which is approximately 5% (2014: 7.5%) of profit before tax after adding back operating and net financing one-off items. We use this as a base for materiality as it is a key measure of underlying business performance for the Group.
We agreed with the Audit Committee that we would report to the Committee all audit differences in excess of £64,000 (2014: £58,000), as well as differences below that threshold that, in our view, warranted reporting on qualitative grounds. We also report to the Audit Committee on disclosure matters that we identified when assessing the overall presentation of the consolidated financial statements.

eOne Annual Report and Accounts 2015 | 81
STRATEGIC
REPORT
CO
RPORATE G
OVERN
ANC
EFIN
ANC
IAL STATEMEN
TS
eOne 2015 Annual Report and Accounts | 81
STRATEGIC
REPORT
CORPO
RATE GO
VERNAN
CEFIN
ANC
IAL STATEMEN
TS
AN OVERVIEW OF THE SCOPE OF OUR AUDIT Our Group audit was scoped by obtaining an understanding of the Group and its environment, including Group-wide controls, and assessing the risks of material misstatement at the Group level. Based on that assessment, we focused our Group audit scope primarily on the UK and Canadian business units. Five of these were subject to a full audit, whilst the remaining twelve were subject to specified audit procedures where the extent of our testing was based on our assessment of the risks of material misstatement and of the materiality of the Group’s operations at those locations. The five full scope divisions represent the principal business units and account for 69% (2014: 70%) of the Group’s revenue and 90% (2014: 93%) of the Group’s adjusted profit before tax. They were also selected to provide an appropriate basis for undertaking audit work to address the risks of material misstatement identified above. Our audit work at the different locations was executed at levels of materiality applicable to each individual entity which were lower than Group materiality and ranged from 50% to 65% of Group materiality.
At the parent entity level we also tested the consolidation process and carried out analytical procedures to confirm our conclusion that there were no significant risks of material misstatement of the aggregated financial information of the remaining components not subject to audit or audit of specified account balances.
The Group audit team continued to follow a programme of planned visits that has been designed so that the Senior Statutory Auditor or a senior member of the Group audit team visits each of the locations where the Group audit scope was focused at least once every year.
MATTERS ON WHICH WE ARE REQUIRED TO REPORT BY EXCEPTION CORPORATE GOVERNANCE STATEMENT Under the Listing Rules we are also required to review the part of the Corporate Governance Statement relating to the Company’s compliance with ten provisions of the UK Corporate Governance Code. We have nothing to report arising from our review.
OUR DUTY TO READ OTHER INFORMATION IN THE ANNUAL REPORT Under International Standards on Auditing (UK and Ireland), we are required to report to you if, in our opinion, information in the annual report is:
– materially inconsistent with the information in the audited consolidated financial statements; or
– apparently materially incorrect based on, or materially inconsistent with, our knowledge of the Group acquired in the course of performing our audit; or
– otherwise misleading. In particular, we are required to consider whether we have identified any inconsistencies between our knowledge acquired during the audit and the directors’ statement that they consider the annual report is fair, balanced and understandable and whether the annual report appropriately discloses those matters that we communicated to
the audit committee which we consider should have been disclosed. We confirm that we have not identified any such inconsistencies or misleading statements.
RESPECTIVE RESPONSIBILITIES OF DIRECTORS AND AUDITOR As explained more fully in the Directors’ Responsibilities Statement, the directors are responsible for the preparation of the consolidated financial statements and for being satisfied that they give a true and fair view. Our responsibility is to audit and express an opinion on the consolidated financial statements in accordance with applicable law and International Standards on Auditing (UK and Ireland). Those standards require us to comply with the Auditing Practices Board’s Ethical Standards for Auditors. We also comply with International Standard on Quality Control 1 (UK and Ireland). Our audit methodology and tools aim to ensure that our quality control procedures are effective, understood and applied. Our quality controls and systems include our dedicated professional standards review team and independent partner reviews.
This report is made solely to the Company’s members, as a body, in accordance with Disclosure and Transparency Rule 4.1. Our audit work has been undertaken so that we might state to the Company’s members those matters we are required to state to them in an auditor’s report and for no other purpose. To the fullest extent permitted by law, we do not accept or assume responsibility to anyone other than the Company and the Company’s members as a body, for our audit work, for this report, or for the opinions we have formed.
SCOPE OF THE AUDIT OF THE CONSOLIDATED FINANCIAL STATEMENTS An audit involves obtaining evidence about the amounts and disclosures in the consolidated financial statements sufficient to give reasonable assurance that the consolidated financial statements are free from material misstatement, whether caused by fraud or error. This includes an assessment of: whether the accounting policies are appropriate to the Group’s and the parent Company’s circumstances and have been consistently applied and adequately disclosed; the reasonableness of significant accounting estimates made by the directors; and the overall presentation of the consolidated financial statements. In addition, we read all the financial and non-financial information in the annual report to identify material inconsistencies with the audited consolidated financial statements and to identify any information that is apparently materially incorrect based on, or materially inconsistent with, the knowledge acquired by us in the course of performing the audit. If we become aware of any apparent material misstatements or inconsistencies we consider the implications for our report.
DELOITTE LLP CHARTERED ACCOUNTANTS AND STATUTORY AUDITOR London 18 May 2015
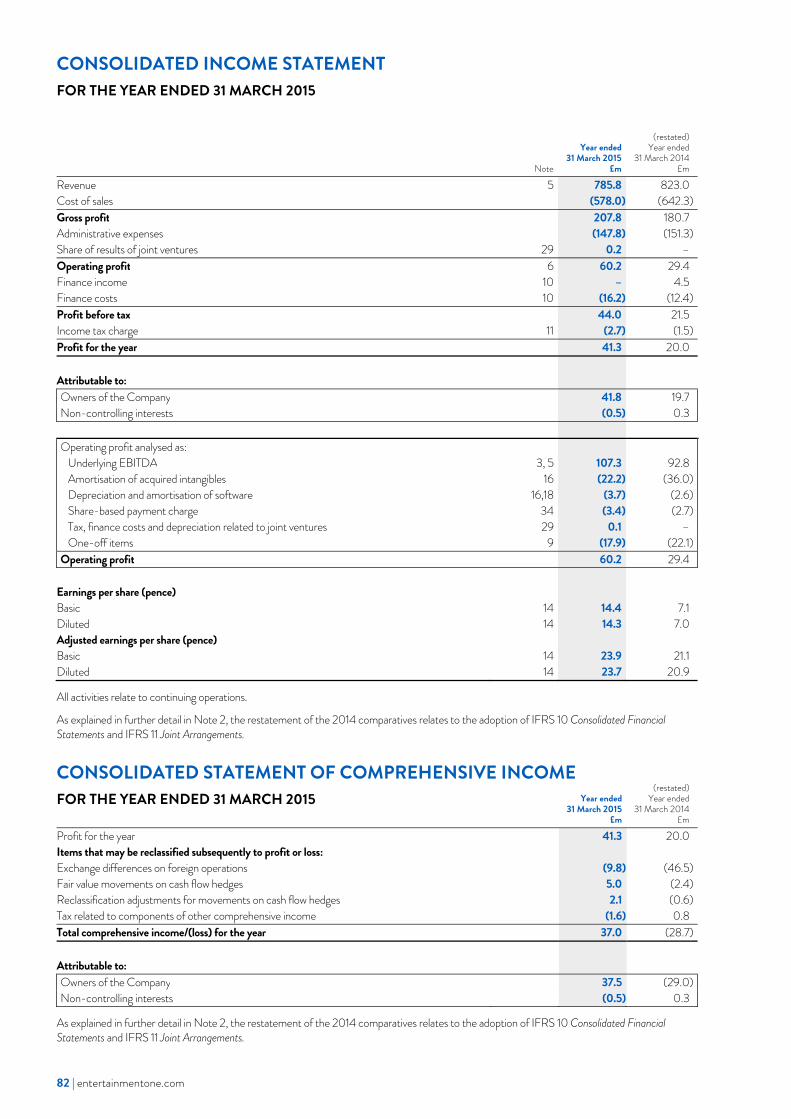
82 | entertainmentone.com
CONSOLIDATED INCOME STATEMENT FOR THE YEAR ENDED 31 MARCH 2015
82 | entertainmentone.com
Note
Year ended 31 March 2015
£m
(restated)Year ended
31 March 2014 £m
Revenue 5 785.8 823.0Cost of sales (578.0) (642.3)Gross profit 207.8 180.7Administrative expenses (147.8) (151.3)Share of results of joint ventures 29 0.2 –Operating profit 6 60.2 29.4Finance income 10 – 4.5Finance costs 10 (16.2) (12.4)Profit before tax 44.0 21.5Income tax charge 11 (2.7) (1.5)Profit for the year 41.3 20.0 Attributable to: Owners of the Company 41.8 19.7Non-controlling interests (0.5) 0.3
Operating profit analysed as:
Underlying EBITDA 3, 5 107.3 92.8Amortisation of acquired intangibles 16 (22.2) (36.0)Depreciation and amortisation of software 16,18 (3.7) (2.6)Share-based payment charge 34 (3.4) (2.7)Tax, finance costs and depreciation related to joint ventures 29 0.1 –One-off items 9 (17.9) (22.1)
Operating profit 60.2 29.4 Earnings per share (pence) Basic 14 14.4 7.1Diluted 14 14.3 7.0Adjusted earnings per share (pence) Basic 14 23.9 21.1Diluted 14 23.7 20.9
All activities relate to continuing operations.
As explained in further detail in Note 2, the restatement of the 2014 comparatives relates to the adoption of IFRS 10 Consolidated Financial Statements and IFRS 11 Joint Arrangements.
CONSOLIDATED STATEMENT OF COMPREHENSIVE INCOME FOR THE YEAR ENDED 31 MARCH 2015
Year ended 31 March 2015
£m
(restated)Year ended
31 March 2014 £m
Profit for the year 41.3 20.0Items that may be reclassified subsequently to profit or loss: Exchange differences on foreign operations (9.8) (46.5)Fair value movements on cash flow hedges 5.0 (2.4)Reclassification adjustments for movements on cash flow hedges 2.1 (0.6)Tax related to components of other comprehensive income (1.6) 0.8Total comprehensive income/(loss) for the year 37.0 (28.7) Attributable to: Owners of the Company 37.5 (29.0)Non-controlling interests (0.5) 0.3
As explained in further detail in Note 2, the restatement of the 2014 comparatives relates to the adoption of IFRS 10 Consolidated Financial Statements and IFRS 11 Joint Arrangements.
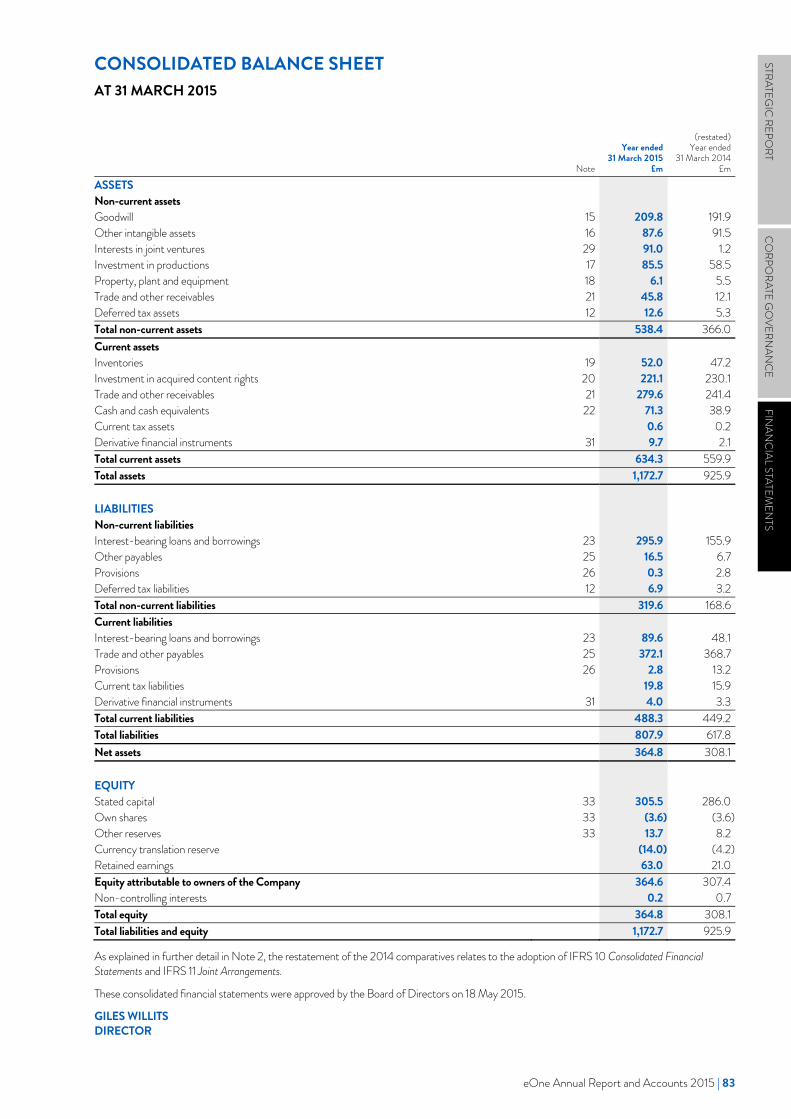
eOne Annual Report and Accounts 2015 | 83
STRATEGIC
REPORT
CO
RPORATE G
OVERN
ANC
EFIN
ANC
IAL STATEMEN
TS
CONSOLIDATED BALANCE SHEET AT 31 MARCH 2015
eOne 2015 Annual Report and Accounts | 83
STRATEGIC
REPORT
CORPO
RATE GO
VERNAN
CEFIN
ANC
IAL STATEMEN
TS
Note
Year ended31 March 2015
£m
(restated)Year ended
31 March 2014£m
ASSETS Non-current assets Goodwill 15 209.8 191.9Other intangible assets 16 87.6 91.5Interests in joint ventures 29 91.0 1.2Investment in productions 17 85.5 58.5Property, plant and equipment 18 6.1 5.5Trade and other receivables 21 45.8 12.1Deferred tax assets 12 12.6 5.3Total non-current assets 538.4 366.0Current assets Inventories 19 52.0 47.2Investment in acquired content rights 20 221.1 230.1Trade and other receivables 21 279.6 241.4Cash and cash equivalents 22 71.3 38.9Current tax assets 0.6 0.2Derivative financial instruments 31 9.7 2.1Total current assets 634.3 559.9Total assets 1,172.7 925.9 LIABILITIES Non-current liabilities Interest-bearing loans and borrowings 23 295.9 155.9Other payables 25 16.5 6.7Provisions 26 0.3 2.8Deferred tax liabilities 12 6.9 3.2Total non-current liabilities 319.6 168.6Current liabilities Interest-bearing loans and borrowings 23 89.6 48.1Trade and other payables 25 372.1 368.7Provisions 26 2.8 13.2Current tax liabilities 19.8 15.9Derivative financial instruments 31 4.0 3.3Total current liabilities 488.3 449.2Total liabilities 807.9 617.8Net assets 364.8 308.1 EQUITY Stated capital 33 305.5 286.0Own shares 33 (3.6) (3.6)Other reserves 33 13.7 8.2Currency translation reserve (14.0) (4.2)Retained earnings 63.0 21.0Equity attributable to owners of the Company 364.6 307.4Non-controlling interests 0.2 0.7Total equity 364.8 308.1Total liabilities and equity 1,172.7 925.9
As explained in further detail in Note 2, the restatement of the 2014 comparatives relates to the adoption of IFRS 10 Consolidated Financial Statements and IFRS 11 Joint Arrangements.
These consolidated financial statements were approved by the Board of Directors on 18 May 2015.
GILES WILLITS DIRECTOR
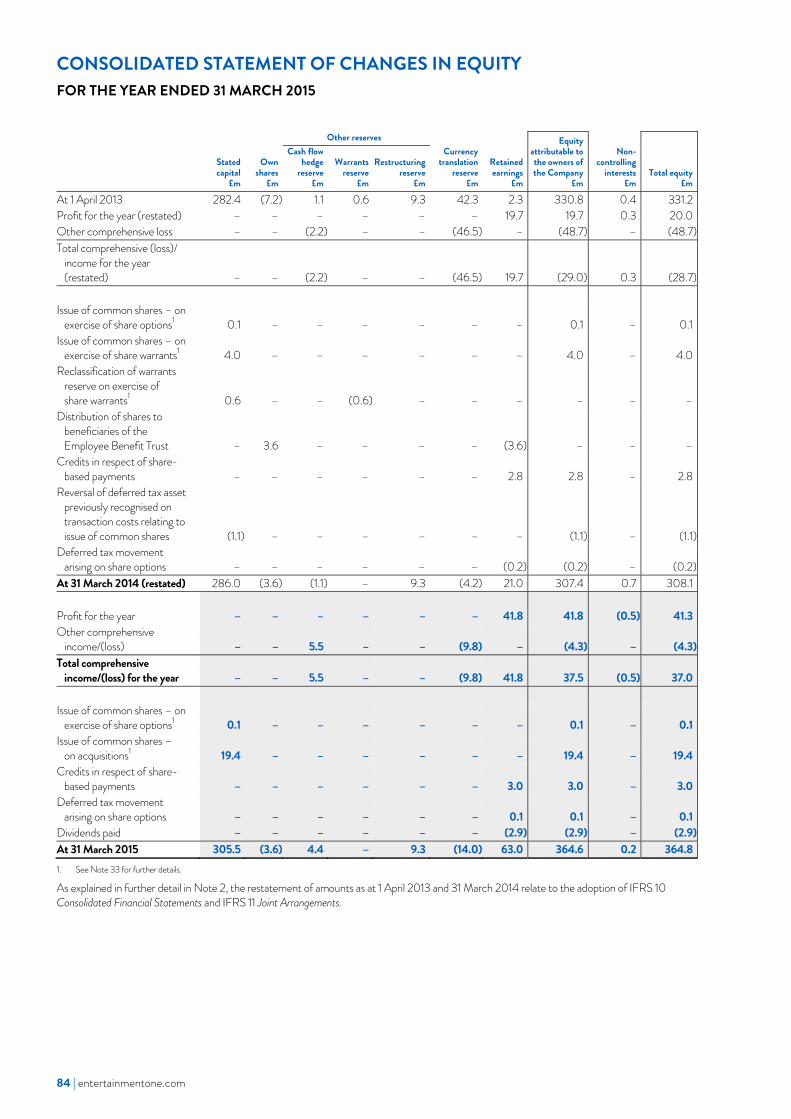
84 | entertainmentone.com
CONSOLIDATED STATEMENT OF CHANGES IN EQUITY FOR THE YEAR ENDED 31 MARCH 2015
84 | entertainmentone.com
Stated capital
£m
Own shares
£m
Other reservesCurrency
translation reserve
£m
Retained earnings
£m
Equity attributable to the owners of the Company
£m
Non-controlling
interests £m
Total equity£m
Cash flow hedge
reserve £m
Warrants reserve
£m
Restructuring reserve
£m
At 1 April 2013 282.4 (7.2) 1.1 0.6 9.3 42.3 2.3 330.8 0.4 331.2Profit for the year (restated) – – – – – – 19.7 19.7 0.3 20.0Other comprehensive loss – – (2.2) – – (46.5) – (48.7) – (48.7)Total comprehensive (loss)/
income for the year (restated) – – (2.2) – – (46.5) 19.7 (29.0) 0.3 (28.7)
Issue of common shares – on
exercise of share options1 0.1 – – – – – – 0.1 – 0.1Issue of common shares – on
exercise of share warrants1 4.0 – – – – – – 4.0 – 4.0Reclassification of warrants
reserve on exercise of share warrants1 0.6 – – (0.6) – – – – – –
Distribution of shares to beneficiaries of the Employee Benefit Trust – 3.6 – – – – (3.6) – – –
Credits in respect of share-based payments – – – – – – 2.8 2.8 – 2.8
Reversal of deferred tax asset previously recognised on transaction costs relating to issue of common shares (1.1) – – – – – – (1.1) – (1.1)
Deferred tax movement arising on share options – – – – – – (0.2) (0.2) – (0.2)
At 31 March 2014 (restated) 286.0 (3.6) (1.1) – 9.3 (4.2) 21.0 307.4 0.7 308.1 Profit for the year – – – – – – 41.8 41.8 (0.5) 41.3Other comprehensive
income/(loss) – – 5.5 – – (9.8) – (4.3) – (4.3)Total comprehensive
income/(loss) for the year – – 5.5 – – (9.8) 41.8 37.5 (0.5) 37.0 Issue of common shares – on
exercise of share options1 0.1 – – – – – – 0.1 – 0.1Issue of common shares –
on acquisitions1 19.4 – – – – – – 19.4 – 19.4Credits in respect of share-
based payments – – – – – – 3.0 3.0 – 3.0Deferred tax movement
arising on share options – – – – – – 0.1 0.1 – 0.1Dividends paid – – – – – – (2.9) (2.9) – (2.9)At 31 March 2015 305.5 (3.6) 4.4 – 9.3 (14.0) 63.0 364.6 0.2 364.81. See Note 33 for further details.
As explained in further detail in Note 2, the restatement of amounts as at 1 April 2013 and 31 March 2014 relate to the adoption of IFRS 10 Consolidated Financial Statements and IFRS 11 Joint Arrangements.
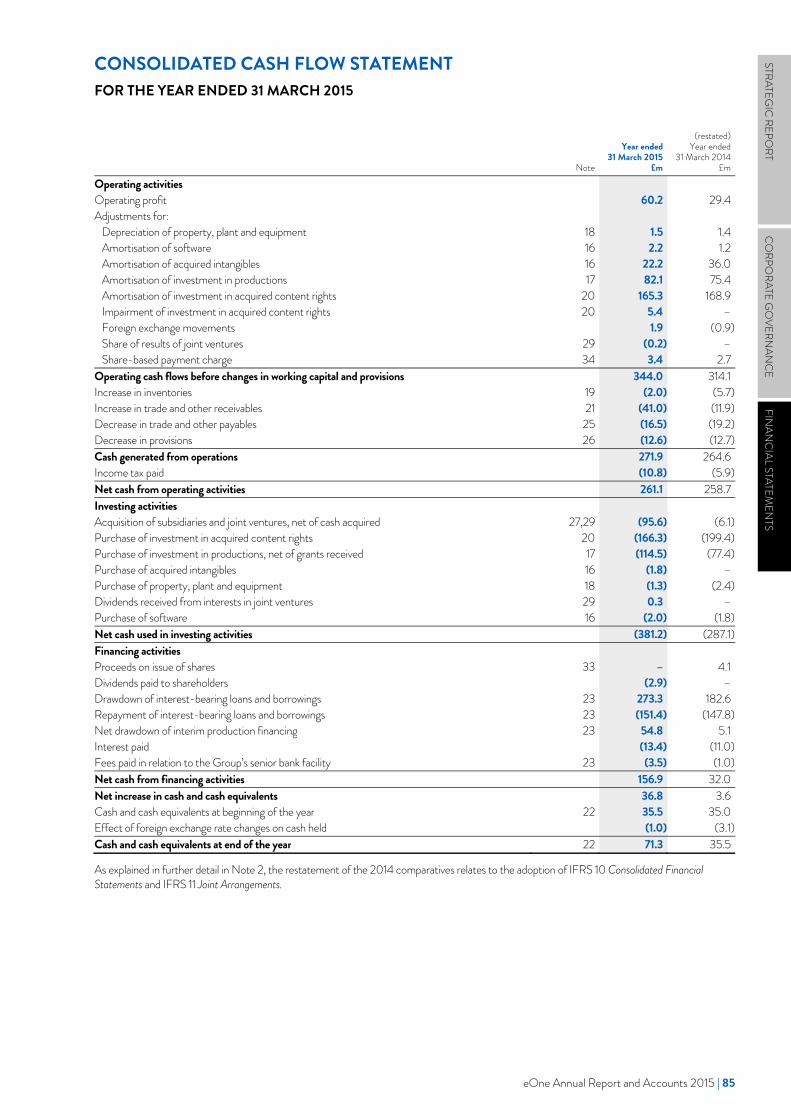
eOne Annual Report and Accounts 2015 | 85
STRATEGIC
REPORT
CO
RPORATE G
OVERN
ANC
EFIN
ANC
IAL STATEMEN
TS
CONSOLIDATED CASH FLOW STATEMENT FOR THE YEAR ENDED 31 MARCH 2015
eOne 2015 Annual Report and Accounts | 85
STRATEGIC
REPORT
CORPO
RATE GO
VERNAN
CEFIN
ANC
IAL STATEMEN
TS
Note
Year ended31 March 2015
£m
(restated)Year ended
31 March 2014£m
Operating activities Operating profit 60.2 29.4Adjustments for:
Depreciation of property, plant and equipment 18 1.5 1.4Amortisation of software 16 2.2 1.2Amortisation of acquired intangibles 16 22.2 36.0Amortisation of investment in productions 17 82.1 75.4Amortisation of investment in acquired content rights 20 165.3 168.9Impairment of investment in acquired content rights 20 5.4 –Foreign exchange movements 1.9 (0.9)Share of results of joint ventures 29 (0.2) –Share-based payment charge 34 3.4 2.7
Operating cash flows before changes in working capital and provisions 344.0 314.1Increase in inventories 19 (2.0) (5.7)Increase in trade and other receivables 21 (41.0) (11.9)Decrease in trade and other payables 25 (16.5) (19.2)Decrease in provisions 26 (12.6) (12.7)Cash generated from operations 271.9 264.6Income tax paid (10.8) (5.9)Net cash from operating activities 261.1 258.7Investing activities Acquisition of subsidiaries and joint ventures, net of cash acquired 27,29 (95.6) (6.1)Purchase of investment in acquired content rights 20 (166.3) (199.4)Purchase of investment in productions, net of grants received 17 (114.5) (77.4)Purchase of acquired intangibles 16 (1.8) –Purchase of property, plant and equipment 18 (1.3) (2.4)Dividends received from interests in joint ventures 29 0.3 –Purchase of software 16 (2.0) (1.8)Net cash used in investing activities (381.2) (287.1)Financing activities Proceeds on issue of shares 33 – 4.1Dividends paid to shareholders (2.9) –Drawdown of interest-bearing loans and borrowings 23 273.3 182.6Repayment of interest-bearing loans and borrowings 23 (151.4) (147.8)Net drawdown of interim production financing 23 54.8 5.1Interest paid (13.4) (11.0)Fees paid in relation to the Group’s senior bank facility 23 (3.5) (1.0)Net cash from financing activities 156.9 32.0Net increase in cash and cash equivalents 36.8 3.6Cash and cash equivalents at beginning of the year 22 35.5 35.0Effect of foreign exchange rate changes on cash held (1.0) (3.1)Cash and cash equivalents at end of the year 22 71.3 35.5
As explained in further detail in Note 2, the restatement of the 2014 comparatives relates to the adoption of IFRS 10 Consolidated Financial Statements and IFRS 11 Joint Arrangements.
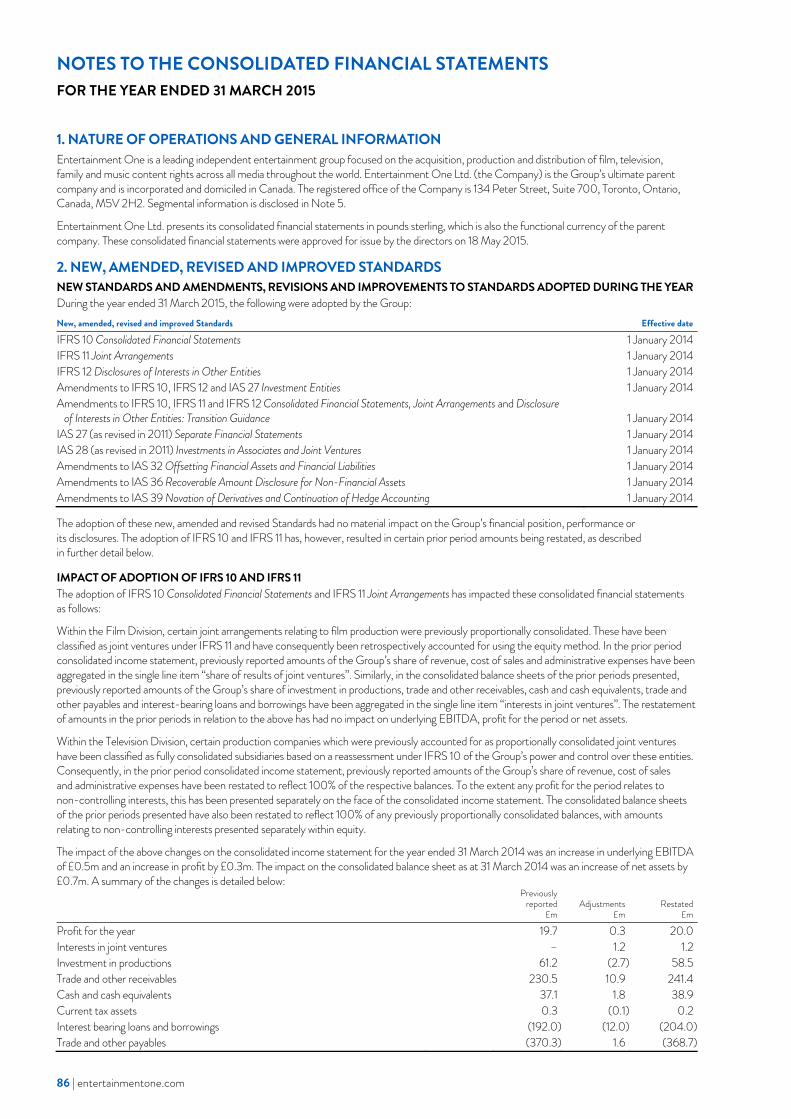
86 | entertainmentone.com
NOTES TO THE CONSOLIDATED FINANCIAL STATEMENTS FOR THE YEAR ENDED 31 MARCH 2015
86 | entertainmentone.com
1. NATURE OF OPERATIONS AND GENERAL INFORMATION Entertainment One is a leading independent entertainment group focused on the acquisition, production and distribution of film, television, family and music content rights across all media throughout the world. Entertainment One Ltd. (the Company) is the Group’s ultimate parent company and is incorporated and domiciled in Canada. The registered office of the Company is 134 Peter Street, Suite 700, Toronto, Ontario, Canada, M5V 2H2. Segmental information is disclosed in Note 5.
Entertainment One Ltd. presents its consolidated financial statements in pounds sterling, which is also the functional currency of the parent company. These consolidated financial statements were approved for issue by the directors on 18 May 2015.
2. NEW, AMENDED, REVISED AND IMPROVED STANDARDS NEW STANDARDS AND AMENDMENTS, REVISIONS AND IMPROVEMENTS TO STANDARDS ADOPTED DURING THE YEAR During the year ended 31 March 2015, the following were adopted by the Group: New, amended, revised and improved Standards Effective date
IFRS 10 Consolidated Financial Statements 1 January 2014IFRS 11 Joint Arrangements 1 January 2014IFRS 12 Disclosures of Interests in Other Entities 1 January 2014Amendments to IFRS 10, IFRS 12 and IAS 27 Investment Entities 1 January 2014Amendments to IFRS 10, IFRS 11 and IFRS 12 Consolidated Financial Statements, Joint Arrangements and Disclosure
of Interests in Other Entities: Transition Guidance 1 January 2014IAS 27 (as revised in 2011) Separate Financial Statements 1 January 2014IAS 28 (as revised in 2011) Investments in Associates and Joint Ventures 1 January 2014Amendments to IAS 32 Offsetting Financial Assets and Financial Liabilities 1 January 2014Amendments to IAS 36 Recoverable Amount Disclosure for Non-Financial Assets 1 January 2014Amendments to IAS 39 Novation of Derivatives and Continuation of Hedge Accounting 1 January 2014
The adoption of these new, amended and revised Standards had no material impact on the Group’s financial position, performance or its disclosures. The adoption of IFRS 10 and IFRS 11 has, however, resulted in certain prior period amounts being restated, as described in further detail below.
IMPACT OF ADOPTION OF IFRS 10 AND IFRS 11 The adoption of IFRS 10 Consolidated Financial Statements and IFRS 11 Joint Arrangements has impacted these consolidated financial statements as follows:
Within the Film Division, certain joint arrangements relating to film production were previously proportionally consolidated. These have been classified as joint ventures under IFRS 11 and have consequently been retrospectively accounted for using the equity method. In the prior period consolidated income statement, previously reported amounts of the Group’s share of revenue, cost of sales and administrative expenses have been aggregated in the single line item “share of results of joint ventures”. Similarly, in the consolidated balance sheets of the prior periods presented, previously reported amounts of the Group’s share of investment in productions, trade and other receivables, cash and cash equivalents, trade and other payables and interest-bearing loans and borrowings have been aggregated in the single line item “interests in joint ventures”. The restatement of amounts in the prior periods in relation to the above has had no impact on underlying EBITDA, profit for the period or net assets.
Within the Television Division, certain production companies which were previously accounted for as proportionally consolidated joint ventures have been classified as fully consolidated subsidiaries based on a reassessment under IFRS 10 of the Group’s power and control over these entities. Consequently, in the prior period consolidated income statement, previously reported amounts of the Group’s share of revenue, cost of sales and administrative expenses have been restated to reflect 100% of the respective balances. To the extent any profit for the period relates to non-controlling interests, this has been presented separately on the face of the consolidated income statement. The consolidated balance sheets of the prior periods presented have also been restated to reflect 100% of any previously proportionally consolidated balances, with amounts relating to non-controlling interests presented separately within equity.
The impact of the above changes on the consolidated income statement for the year ended 31 March 2014 was an increase in underlying EBITDA of £0.5m and an increase in profit by £0.3m. The impact on the consolidated balance sheet as at 31 March 2014 was an increase of net assets by £0.7m. A summary of the changes is detailed below:
Previously reported
£m Adjustments
£m Restated
£m
Profit for the year 19.7 0.3 20.0Interests in joint ventures – 1.2 1.2Investment in productions 61.2 (2.7) 58.5Trade and other receivables 230.5 10.9 241.4Cash and cash equivalents 37.1 1.8 38.9Current tax assets 0.3 (0.1) 0.2Interest bearing loans and borrowings (192.0) (12.0) (204.0)Trade and other payables (370.3) 1.6 (368.7)
eOne Annual Report and Accounts 2015 | 87
STRATEGIC
REPORT
CO
RPORATE G
OVERN
ANC
EFIN
ANC
IAL STATEMEN
TS
eOne 2015 Annual Report and Accounts | 87
STRATEGIC
REPORT
CORPO
RATE GO
VERNAN
CEFIN
ANC
IAL STATEMEN
TS
2. NEW, AMENDED, REVISED AND IMPROVED STANDARDS CONTINUED NEW, AMENDED AND REVISED STANDARDS ISSUED BUT NOT ADOPTED DURING THE YEAR At the date of authorisation of these consolidated financial statements, the following Standards, which have not been applied in these consolidated financial statements, are in issue but not yet effective for periods beginning 1 April 2014: New, amended and revised Standards Effective date
Amendments to IAS 19 Defined Benefit Plans: Employee Contributions 1 July 2014Annual improvements 2010-2012 Cycle
Amendments to IFRS 2 Share-based Payment 1 July 2014Amendments to IFRS 3 Business Combinations 1 July 2014Amendments to IFRS 8 Operating Segments 1 July 2014Amendments to IAS 16 Property, Plant and Equipment and IAS 38 Intangible Assets 1 July 2014Amendments to IAS 24 Related Party Disclosures 1 July 2014
Annual improvements 2011-2013 Cycle Amendments to IFRS 3 Business Combinations 1 July 2014Amendments to IFRS 13 Fair Value Measurement 1 July 2014Amendments to IAS 40 Investment Property 1 July 2014
Amendments to IFRS 11 Joint arrangements: accounting for acquisitions of interests 1 January 2016 IAS 16 and IAS 38 Clarification of Acceptable Methods of Depreciation and Amortisation 1 January 2016Amendments to IAS 27 Equity Method in Separate Financial Statements 1 January 2016IFRS 14 Regulatory Deferral Accounts 1 January 2016IFRS 15 Revenue from Contracts with Customers 1 January 2017IFRS 9 Financial Instruments 1 January 2018
The directors do not anticipate that the adoption of these Standards will have a material impact on the Group’s consolidated financial statements in the period of initial application.
3. SIGNIFICANT ACCOUNTING POLICIES USE OF ADDITIONAL PERFORMANCE MEASURES The Group presents underlying EBITDA, one-off items, adjusted profit before tax and adjusted earnings per share information. These measures are used by the directors for internal performance analysis and incentive compensation arrangements for employees. The terms “underlying”, “one-off items” and “adjusted” may not be comparable with similarly titled measures reported by other companies.
The term “underlying EBITDA” refers to operating profit or loss excluding amortisation of acquired intangibles, depreciation, amortisation of software, share-based payment charge, “tax, finance costs and depreciation” related to joint ventures and operating one-off items.
The terms “adjusted profit before tax” and “adjusted earnings per share” refer to the reported measures excluding amortisation of acquired intangibles, share-based payment charge, “tax, finance costs and depreciation” related to joint ventures, operating one-off items, one-off items relating to the Group’s financing arrangements and, in the case of adjusted earnings per share, one-off tax items.
BASIS OF PREPARATION i. Preparation of the consolidated financial statements on the going concern basis The Group’s activities, together with the factors likely to affect its future development, are set out in the Business and Financial reviews on pages 18 to 32.
The Group meets its day-to-day working capital requirements and funds its investment in content through a revolving credit facility which matures in January 2018 and is secured on assets held by the Group. Under the terms of the facility the Group is able to drawdown in the local currencies of its operating businesses. The amounts drawn down by currency at 31 March 2015 are shown in Note 23.
The facility is subject to a series of covenants including fixed charge cover, gross debt against underlying EBITDA and capital expenditure. The Group has a track record of cash generation and is in full compliance with its existing bank facility covenant arrangements. At 31 March 2015, the Group had £71.3m of cash and cash equivalents (refer to Note 22), £224.9m of adjusted net debt (refer to Note 24) and undrawn down amounts under the senior debt facility of £63.7m (refer to Note 23).
The Group is exposed to uncertainties arising from the economic climate and uncertainties in the markets in which it operates. Market conditions could lead to lower than anticipated demand for the Group’s products and services and exchange rate volatility could also impact reported performance. The directors have considered the impact of these and other uncertainties and factored them into their financial forecasts and assessment of covenant headroom. The Group’s forecasts and projections, taking account of reasonable possible changes in trading performance (and available mitigating actions), show that the Group will be able to operate within the expected limits of the facility and provide headroom against the covenants for the foreseeable future. For these reasons the directors continue to adopt the going concern basis in preparing the consolidated financial statements.
88 | entertainmentone.com
NOTES TO THE CONSOLIDATED FINANCIAL STATEMENTS CONTINUED FOR THE YEAR ENDED 31 MARCH 2015
88 | entertainmentone.com
3. SIGNIFICANT ACCOUNTING POLICIES CONTINUED ii. Statement of compliance These consolidated financial statements have been prepared under the historical cost convention (except for derivative financial instruments and share-based payment charge that have been measured at fair value) and in accordance with applicable International Financial Reporting Standards as adopted by the European Union (EU) and IFRIC interpretations (IFRS). The Group’s consolidated financial statements comply with Article 4 of the EU IAS Regulation.
BASIS OF CONSOLIDATION The consolidated financial statements comprise the financial statements of the Company (Entertainment One Ltd.) and its subsidiaries (the Group). Control of the Group’s subsidiaries is achieved when the Group is exposed, or has rights, to variable returns from its involvement with the investee and has the ability to affect those returns through its power over the investee.
The financial statements of the subsidiaries are generally prepared for the same reporting periods as the parent company, using consistent accounting policies. Subsidiaries are fully consolidated from the date of acquisition and continue to be consolidated until the date of disposal. All intra-group balances, transactions, income and expenses, and unrealised profits and losses resulting from intra-group transactions that are recognised in assets, are eliminated in full.
BUSINESS COMBINATIONS Business combinations are accounted for using the acquisition method. The cost of a business combination is measured as the aggregate of the consideration transferred, measured at acquisition date fair value and the amount of any non-controlling interests in the acquiree. For each business combination, the acquirer measures the non-controlling interests in the acquiree either at fair value or at the proportionate share of the acquiree’s identifiable net assets.
The cost of a business combination is measured as the aggregate of the fair values, at the date of exchange, of assets given, liabilities incurred or assumed, and equity instruments issued by the Group in exchange for control of the acquiree. Acquisition-related costs are recognised in the consolidated income statement as incurred.
Any contingent consideration to be transferred by the acquirer is recognised at fair value at the acquisition date. Subsequent changes to the fair value of the contingent consideration which is deemed to be an asset or liability, are recognised either in the consolidated income statement or as a change to other comprehensive income. If the contingent consideration is classified as equity, it is not re-measured until it is finally settled within equity.
Goodwill arising on a business combination is recognised as an asset and initially measured at cost, being the excess of the aggregate of the consideration transferred and the amount recognised for non-controlling interests over the fair value of net identifiable assets acquired (including other intangible assets) and liabilities assumed. If this consideration is lower than the fair value of the net assets of the subsidiary or business acquired, any negative goodwill is recognised immediately in the consolidated income statement.
REVENUE RECOGNITION Revenue represents the amounts receivable for goods and services provided in the normal course of business, net of discounts and excluding value added tax (or equivalent). Revenue is derived from the licensing, marketing and distribution of feature films, television, video programming and music rights. Revenue is also derived from film and television production and family licensing and merchandising sales. The following summarises the Group’s main revenue recognition policies:
– Revenue from the exploitation of film and music rights is recognised based upon the completion of contractual obligations relevant to each agreement
– Revenue is recognised where there is reasonable contractual certainty that the revenue is receivable and will be received – Revenue from television licensing represents the contracted value of licence fees which is recognised when the licence term has commenced,
the production is available for delivery, substantially all technical requirements have been met and collection of the fee is reasonably assured – Revenue from the sale of own or co-produced film or television productions is recognised when the production is available for delivery and
there is reasonable contractual certainty that the revenue is receivable and will be received – Revenue from the sale of home entertainment and audio inventory is recognised at the point at which goods are despatched. A provision is
made for returns based on historical trends – Revenue from licensing and merchandising sales represents the contracted value of licence fees which is recognised when the licence terms
have commenced and collection of the fee is reasonably assured
PENSION COSTS Payments to defined contribution retirement benefit plans are charged as an expense as they fall due. Any contributions unpaid at the year end reporting date are included as a liability within the consolidated balance sheet.
eOne Annual Report and Accounts 2015 | 89
STRATEGIC
REPORT
CO
RPORATE G
OVERN
ANC
EFIN
ANC
IAL STATEMEN
TS
eOne 2015 Annual Report and Accounts | 89
STRATEGIC
REPORT
CORPO
RATE GO
VERNAN
CEFIN
ANC
IAL STATEMEN
TS
3. SIGNIFICANT ACCOUNTING POLICIES CONTINUED OPERATING LEASES The determination of whether an arrangement is, or contains, a lease is based on the substance of the arrangement at inception date, whether fulfilment of the arrangement is dependent on the use of a specific asset or assets or the arrangement conveys a right to use the asset, even if that right is not explicitly specified in an arrangement. Rentals payable under operating leases are charged to the consolidated income statement on a straight-line basis over the lease term.
BORROWING COSTS Borrowing costs, including finance costs, are recognised in the consolidated income statement in the period in which they are incurred. Borrowing costs are accounted for using the effective interest rate method.
Borrowing costs directly attributable to the acquisition or production of a qualifying asset (such as investment in productions) form part of the cost of that asset and are capitalised.
FOREIGN CURRENCIES i. Within individual companies The individual financial statements of each Group company are presented in the currency of the primary economic environment in which it operates (its functional currency). For the purpose of the consolidated financial statements, the results and financial position of each Group company are expressed in pounds sterling, which is the functional currency of the Company and the presentation currency for the consolidated financial statements.
In preparing the financial statements of the individual companies, transactions in currencies other than the entity’s functional currency are recorded at the rates of exchange prevailing on the dates of the transactions. Foreign exchange differences arising on the settlement of such transactions and from translating monetary assets and liabilities denominated in foreign currencies at year end exchange rates are recognised in the consolidated income statement.
ii. Retranslation within the consolidated financial statements For the purpose of presenting consolidated financial statements, the assets and liabilities of the Group’s foreign operations are translated at exchange rates prevailing on the balance sheet date. Income and expense items are translated at the exchange rate ruling at the date of each transaction during the period. Foreign exchange differences arising, if any, are classified as equity and transferred to the Group’s translation reserve. Such translation differences are recognised as income or expenses in the period in which the operation is disposed of.
ONE-OFF ITEMS One-off items are items of income and expenditure that are non-recurring and, in the judgement of the directors, should be disclosed separately on the basis that they are material, either by their nature or their size, in order to provide a better understanding of the Group’s underlying financial performance and enable comparison of underlying financial performance between years.
The one-off items recorded in the consolidated income statement include items such as significant restructuring, the costs incurred in entering into business combinations, and the impact of the sale, disposal or impairment of an investment in a business or an asset.
TAX i. Income tax The income tax charge/credit represents the sum of the income tax currently payable and deferred tax.
The income tax currently payable is based on taxable profit for the year. Taxable profit differs from profit as reported in the consolidated income statement because it excludes items of income or expense that are taxable or deductible in other years and it further excludes items that are never taxable or deductible. The Group’s asset or liability for current tax is calculated using tax rates that have been enacted or substantively enacted by the balance sheet date.
ii. Deferred tax assets and liabilities Deferred tax is the tax expected to be payable or recoverable on differences between the carrying amounts of assets and liabilities in the financial statements and the corresponding tax bases used in the computation of taxable profit, and is accounted for using the balance sheet liability method. Deferred tax liabilities are generally recognised for all taxable temporary differences and deferred tax assets are recognised to the extent that it is probable that taxable profits will be available against which deductible temporary differences can be utilised. Such assets and liabilities are not recognised if the temporary difference arises from the initial recognition of goodwill or from the initial recognition of other assets and liabilities in a transaction (other than in a business combination) that affects neither the tax profit nor the accounting profit.
Deferred tax liabilities are recognised for taxable temporary differences arising on investments in subsidiaries, except where the Group is able to control the reversal of the temporary difference and it is probable that the temporary difference will not reverse in the foreseeable future.
In the UK and the US, the Group is entitled to a tax deduction for amounts treated as compensation on exercise of certain employee share options or vesting of share awards under each jurisdiction’s tax rules. A share-based payment charge is recorded in the consolidated income statement over the vesting period of the relevant options and awards. As there is a temporary difference between the accounting and tax bases, a deferred tax asset is recorded. The deferred tax asset arising is calculated by comparing the estimated amount of tax deduction to be obtained in the future (based on the Company’s share price at the balance sheet date) with the cumulative amount of the share-based payment charge recorded in the consolidated income statement. If the amount of estimated future tax deduction exceeds the cumulative amount of the compensation expense at the statutory rate, the excess is recorded directly in equity, against retained earnings.
90 | entertainmentone.com
NOTES TO THE CONSOLIDATED FINANCIAL STATEMENTS CONTINUED FOR THE YEAR ENDED 31 MARCH 2015
90 | entertainmentone.com
3. SIGNIFICANT ACCOUNTING POLICIES CONTINUED The carrying amount of deferred tax assets is reviewed at each balance sheet date and reduced to the extent that it is no longer probable that sufficient taxable profits will be available to allow all or part of the asset to be recovered.
Deferred tax assets and liabilities are measured on an undiscounted basis at the tax rates that are expected to apply in the period when the asset is realised or the liability is settled, based on tax rates (and tax laws) that have been enacted or substantively enacted by the balance sheet date. Deferred tax is charged or credited in the consolidated income statement, except when it relates to items charged or credited directly to equity, in which case the deferred tax is also dealt with in equity.
Deferred tax assets and liabilities are offset when there is a legally enforceable right to offset current tax assets against current tax liabilities. This applies when they relate to income taxes levied by the same tax authority and the Group intends to settle its current tax assets and liabilities on a net basis.
GOODWILL Goodwill arising on a business combination is recognised as an asset and initially measured at cost, being the excess of the aggregate of the consideration transferred and the amount recognised for non-controlling interests over the fair value of net identifiable assets acquired (including other intangible assets) and liabilities assumed. Transaction costs directly attributable to the acquisition form part of the acquisition cost for business combinations prior to 1 January 2010, but from that date such costs are written-off to the consolidated income statement and do not form part of goodwill. Following initial recognition, goodwill is measured at cost less any accumulated impairment losses.
Goodwill is allocated to cash generating units (CGUs) which are tested for impairment annually, or more frequently if there are indications that goodwill might be impaired. The CGUs identified are the smallest identifiable group of assets that generate cash inflows that are largely independent of the cash inflows from other groups of assets. Gains or losses on the disposal of an entity include the carrying amount of goodwill relating to the entity sold.
OTHER INTANGIBLE ASSETS Other intangible assets acquired by the Group are stated at cost less accumulated amortisation. Amortisation is charged to administrative expenses in the consolidated income statement on a straight-line basis over the estimated useful life of intangible fixed assets unless such lives are indefinite.
Other intangible assets mainly comprise amounts arising on consolidation of acquired subsidiaries such as exclusive content agreements and libraries, trade names and brands, exclusive distribution agreements, customer relationships and non-compete agreements. Other intangible assets also include amounts relating to costs of software.
Other intangible assets are generally amortised over the following periods:
Exclusive content agreements and libraries 3-14 yearsTrade names and brands 1-10 yearsExclusive distribution agreements 9 yearsCustomer relationships 9-10 yearsNon-compete agreements 2-5 yearsSoftware 3 years
INTERESTS IN JOINT ARRANGEMENTS An associate is an entity over which the Group has significant influence. Significant influence is the power to participate in the financial and operating decisions of the investee, but is not control or joint control over those policies.
A joint venture is a type of joint arrangement whereby the parties that have joint control of the arrangement have rights to the net assets of the joint venture. Joint control is the contractually agreed sharing of control of the arrangement, which exists only when decisions about the relevant activities require unanimous consent of the parties sharing control.
The Group’s interests in its associates and joint ventures are accounted for using the equity method. The investment is initially recognised at cost and is subsequently adjusted to recognise changes in the Group’s share of net assets of the associate or joint venture since the acquisition date. The share of results of its associates and joint ventures are shown within single line items in the consolidated balance sheet and consolidated income statement, respectively.
The financial statements of the Group’s associates and joint ventures are generally prepared for the same reporting period as the Group. Where necessary, adjustments are made to bring the accounting policies in line with those of the Group.
eOne Annual Report and Accounts 2015 | 91
STRATEGIC
REPORT
CO
RPORATE G
OVERN
ANC
EFIN
ANC
IAL STATEMEN
TS
eOne 2015 Annual Report and Accounts | 91
STRATEGIC
REPORT
CORPO
RATE GO
VERNAN
CEFIN
ANC
IAL STATEMEN
TS
3. SIGNIFICANT ACCOUNTING POLICIES CONTINUED INVESTMENT IN PRODUCTIONS Investment in productions that are in development and for which the realisation of expenditure can be reasonably determined are classified and capitalised in accordance with IAS 38 Intangible Assets as productions in progress within investment in productions. On delivery of a production, the cost of investment is reclassified as productions delivered. Also included within investment in productions are programmes acquired on acquisition of subsidiaries.
Amortisation of investment in productions, including government grants credited, is charged to cost of sales unless it arises from revaluation on acquisition of subsidiaries in which case it is charged to administrative expenses. The maximum useful life is considered to be 10 years.
GOVERNMENT GRANTS A government grant is recognised and credited as part of investment in productions when there is reasonable assurance that any conditions attached to the grant will be satisfied and the grants will be received and the programme has been delivered. Government grants are recognised at fair value.
PROPERTY, PLANT AND EQUIPMENT Property, plant and equipment are stated at original cost less accumulated depreciation. Depreciation is charged to write-off cost less estimated residual value of each asset over their estimated useful lives using the following methods and rates:
Leasehold improvements Over the term of the leaseFixtures, fittings and equipment 20%-30% reducing balance
The carrying amounts of property, plant and equipment are reviewed for impairment when events or changes in circumstances indicate that the carrying amounts may not be recoverable. The Group reviews residual values and useful lives on an annual basis and any adjustments are made prospectively.
An item of property, plant and equipment is derecognised upon disposal or when no future economic benefits are expected to arise from the continued use of the asset. Any gain or loss arising on derecognition of the asset (determined as the difference between the sales proceeds and the carrying amount of the asset) is recorded in the consolidated income statement in the period of derecognition.
IMPAIRMENT OF NON-FINANCIAL ASSETS The carrying amounts of the Group’s non-financial assets are tested annually for impairment (as required by IFRS, in the case of goodwill) or when circumstances indicate that the carrying amounts may be impaired. If any such indication exists, or when annual impairment testing for an asset is required, the Group makes an estimate of the asset’s recoverable amount. The recoverable amount is the higher of an asset’s or CGU’s fair value less costs to sell and its value-in-use and is determined for an individual asset, unless the asset does not generate cash inflows that are largely independent of those from other assets or groups of assets. Where the carrying amount of an asset or CGU exceeds its recoverable amount, the asset is considered to be impaired and is written-down to its recoverable amount. In assessing value-in-use, the estimated future cash flows are discounted to their present value using a pre-tax discount rate that reflects current market assessments of the time value of money and the risks specific to the asset or CGU. In determining fair value less costs to sell, an appropriate valuation model is used. These calculations are corroborated by valuation multiples or other available fair value indicators.
INVENTORIES Inventories are stated at the lower of cost, including direct expenditure and other appropriate attributable costs incurred in bringing inventories to their present location and condition, and net realisable value. The cost of inventories is calculated using the weighted average method. Net realisable value is the estimated selling price in the ordinary course of business, less estimated costs of completion and the estimated costs necessary to make the sale.
INVESTMENT IN ACQUIRED CONTENT RIGHTS In the ordinary course of business the Group contracts with film and television programme producers to acquire content rights for exploitation. Certain of these agreements require the Group to pay minimum guaranteed advances (MGs), the largest portion of which often becomes due when the film or television programme is delivered to the Group, usually some months subsequent to signing the contract. MGs are recognised in the consolidated balance sheet when a liability arises, usually on delivery of the film or television programme to the Group.
Investments in acquired content rights are recorded in the consolidated balance sheet if such amounts are considered recoverable against future revenues. These costs are amortised to cost of sales on a revenue forecast basis over a period not exceeding 10 years from the date of initial release. Acquired libraries are amortised over a period not exceeding 20 years. Amounts capitalised are reviewed at least quarterly and any portion of the unamortised amount that appears not to be recoverable from future net revenues is written-off to cost of sales during the period the loss becomes evident. Balances are included within current assets if they are expected to be realised within the normal operating cycle of the Film and Television businesses. The normal operating cycle of these businesses can be greater than 12 months. In general 65%-75% of film and television programme content is amortised within 12 months of theatrical release/delivery.
92 | entertainmentone.com
NOTES TO THE CONSOLIDATED FINANCIAL STATEMENTS CONTINUED FOR THE YEAR ENDED 31 MARCH 2015
92 | entertainmentone.com
3. SIGNIFICANT ACCOUNTING POLICIES CONTINUED TRADE AND OTHER RECEIVABLES Trade receivables are generally not interest-bearing and are stated at their fair value as reduced by appropriate allowances for estimated irrecoverable amounts.
CASH AND CASH EQUIVALENTS Cash and cash equivalents in the consolidated balance sheet comprise cash at bank and in hand. For the purpose of the consolidated cash flow statement, cash and cash equivalents consist of cash and cash equivalents as defined above, net of outstanding bank overdrafts. Bank overdrafts are shown within borrowings in current liabilities on the consolidated balance sheet.
INTEREST-BEARING LOANS AND BORROWINGS All interest-bearing loans and borrowings are initially recognised at the fair value of the consideration received less directly attributable transaction costs. Gains and losses are recognised in the consolidated income statement when the liabilities are derecognised, as well as through the amortisation process.
Interim production financing relates to short-term financing for the Group’s film and television productions. Interest payable on interim production financing loans is capitalised and forms part of the cost of investment in productions.
DEFERRED FINANCE CHARGES All costs incurred by the Group that are directly attributable to the issue of debt are initially capitalised and deducted from the amount of gross borrowings. Such costs are then amortised through the consolidated income statement over the term of the instrument using the effective interest rate method.
Should there be a material change to the terms of the underlying instrument, any remaining unamortised deferred finance charges are immediately written-off to the consolidated income statement as a one-off finance item. Any new costs incurred as a result of the change to the terms of the underlying instrument are capitalised and then amortised over the term of the new instrument, again using the effective interest rate method.
TRADE AND OTHER PAYABLES Trade payables are generally not interest-bearing and are stated at their nominal value.
PROVISIONS Provisions are recognised when the Group has a present obligation (legal or constructive) as a result of a past event, where the obligation can be estimated reliably, and where it is probable that an outflow of economic benefits will be required to settle that obligation. Provisions are measured at the directors’ best estimate of the expenditure required to settle the obligation at the balance sheet date, and are discounted to present value where the effect is material. Where discounting is used, the increase in the provision due to unwinding the discount is recognised as a finance expense.
DERIVATIVE FINANCIAL INSTRUMENTS AND HEDGING Derivative financial assets and liabilities are recognised when the Group becomes a party to the contractual provisions of the instrument.
The Group uses derivative financial instruments to reduce its exposure to foreign exchange and interest rate movements. The Group does not hold or issue derivative financial instruments for financial trading purposes.
Derivative financial instruments are classified as held-for-trading and recognised in the consolidated balance sheet at fair value. Derivatives designated as hedging instruments are classified on inception as cash flow hedges, net investment hedges or fair value hedges.
Changes in the fair value of derivatives designated as cash flow hedges are recognised in equity to the extent that they are deemed effective. Ineffective portions are immediately recognised in the consolidated income statement. When the hedged item affects profit or loss then the amounts deferred in equity are recycled to the consolidated income statement.
Fair value hedges record the change in the fair value in the consolidated income statement, along with the changes in the fair value of the hedged asset or liability.
Changes in the fair value of any derivative instruments that do not qualify for hedge accounting are immediately recognised in the consolidated income statement.
DIVIDENDS Distributions to equity holders are not recognised in the consolidated income statement under IFRS, but are disclosed as a component of the movement in total equity. A liability is recorded for a dividend when the dividend is declared by the Company’s directors.
EQUITY INSTRUMENTS An equity instrument is any contract that evidences a residual interest in the assets of an entity after deducting all of its liabilities. Equity instruments issued by the Company are recorded at the proceeds received, net of direct issue costs.
eOne Annual Report and Accounts 2015 | 93
STRATEGIC
REPORT
CO
RPORATE G
OVERN
ANC
EFIN
ANC
IAL STATEMEN
TS
eOne 2015 Annual Report and Accounts | 93
STRATEGIC
REPORT
CORPO
RATE GO
VERNAN
CEFIN
ANC
IAL STATEMEN
TS
3. SIGNIFICANT ACCOUNTING POLICIES CONTINUED OWN SHARES The Entertainment One Ltd. shares held by the Trustees of the Company’s Employee Benefit Trust (EBT) are classified in total equity as own shares and are recognised at cost. Consideration received for the sale of such shares is also recognised in equity, with any difference between the proceeds from sale and the original cost being taken to reserves. No gain or loss is recognised on the purchase, sale, issue or cancellation of equity shares.
SHARE-BASED PAYMENTS The Group issues equity-settled share-based payments to certain employees. Equity-settled share-based payments are measured at fair value at the date of grant. The fair value determined at the grant date of equity-settled share-based payments is expensed on a straight-line basis over the vesting period, based on the Group’s estimate of shares that will eventually vest. Fair value is measured by means of a binomial valuation model. The expected life used in the model has been adjusted, based on management’s best estimate, for the effect of non-transferability, exercise restrictions, and behavioural considerations.
SEGMENTAL REPORTING The Group’s operating segments are identified on the basis of internal reports that are regularly reviewed by the chief operating decision maker in order to allocate resources to the segment and to assess its performance. The Chief Executive Officer has been identified as the chief operating decision maker. The Group has two reportable segments: Film and Television, based on the types of products and services from which each segment derives its revenues.
The Film segment includes revenues from all of the Group’s activities in relation to the production, acquisition and exploitation of film content rights.
The Television segment includes revenues from all of the Group’s activities in relation to the production, acquisition and exploitation of television, family and music content.
4. SIGNIFICANT ACCOUNTING JUDGEMENTS AND KEY SOURCES OF ESTIMATION UNCERTAINTY
The preparation of consolidated financial statements under IFRS requires the Group to make estimates and assumptions that affect the amounts reported for assets and liabilities at the balance sheet date and amounts reported for revenues and expenses during the year. The nature of estimation means that actual outcomes could differ from those estimates.
Estimates and judgements are reviewed on an ongoing basis. Revisions to accounting estimates are recognised in the period in which the estimate is revised if the revision affects that period only, or in the period of the revision and future periods if the revision affects both current and future periods.
The estimates and assumptions which have a significant risk of causing a material adjustment to the carrying amount of assets and liabilities are discussed below.
IMPAIRMENT OF GOODWILL The Group determines whether goodwill is impaired on at least an annual basis. This requires an estimation of the value-in-use of the CGUs to which the goodwill is allocated. Estimating a value-in-use amount requires the directors to make an estimate of the expected future cash flows from the CGU and also to choose a suitable discount rate in order to calculate the present value of those cash flows. Further details of goodwill are contained in Note 15.
ACQUIRED INTANGIBLES The Group recognises intangible assets acquired as part of a business combination at fair value at the date of acquisition. The determination of these fair values is based upon the directors’ judgement and includes assumptions on the timing and amount of future incremental cash flows generated by the assets and selection of an appropriate cost of capital. Furthermore, the directors must estimate the expected useful lives of intangible assets and charge amortisation on these assets accordingly. Further details of acquired intangibles are contained in Note 16.
INVESTMENT IN PRODUCTIONS AND INVESTMENT IN ACQUIRED CONTENT RIGHTS The Group capitalises investment in productions and investment in acquired content rights and then amortises these balances on a revenue forecast basis, recording the amortisation charge in cost of sales. Amounts capitalised are reviewed at least quarterly and any amounts that appear to be irrecoverable from future net revenues are written-off to cost of sales during the period the loss becomes evident. The estimate of future net revenues depends on the directors’ judgement and assumptions based on the pattern of historical revenue streams and the remaining life of each contract. Further details of investment in productions and investment in acquired content rights are contained in Notes 17 and 20, respectively.

94 | entertainmentone.com
NOTES TO THE CONSOLIDATED FINANCIAL STATEMENTS CONTINUED FOR THE YEAR ENDED 31 MARCH 2015
94 | entertainmentone.com
4. SIGNIFICANT ACCOUNTING JUDGEMENTS AND KEY SOURCES OF ESTIMATION UNCERTAINTY CONTINUED
PROVISIONS FOR ONEROUS FILM CONTRACTS The Group recognises a provision for an onerous film contract when the unavoidable costs of meeting the obligations under the contract exceed the expected benefits to be received under it. The estimate of the amount of the provision requires management to make judgements and assumptions on future cash inflows and outflows and also an assessment of the least cost of exiting the contract. To the extent that events, revenues or costs differ in the future, the carrying amount of provisions may change. Further details of onerous film contracts are contained in Note 26.
SHARE-BASED PAYMENTS The charge for share-based payments is determined based on the fair value of awards at the date of grant by use of the binomial model which requires judgements to be made regarding expected volatility, dividend yield, risk free rates of return and expected option lives. The list of inputs used in the binomial model to calculate the fair values is provided in Note 34.
DEFERRED TAX Deferred tax assets and liabilities require the directors’ judgement in determining the amounts to be recognised. In particular, judgement is used when assessing the extent to which deferred tax assets should be recognised with consideration to the timing and level of future taxable income. Further details of deferred tax are contained in Note 12.
INCOME TAX The actual tax on the result for the year is determined according to complex tax laws and regulations. Where the effect of these laws and regulations is unclear, estimates are used in determining the liability for tax to be paid on past profits which are recognised in the consolidated financial statements. The Group considers the estimates, assumptions and judgements to be reasonable but this can involve complex issues which may take a number of years to resolve. The final determination of prior year tax liabilities could be different from the estimates reflected in the consolidated financial statements.
JOINT ARRANGEMENTS The Group participates in a number of joint arrangements where control of the arrangement is shared with one or more other parties. A joint arrangement is classified as a joint operation or as a joint venture, depending on the Group’s assessment of the legal form and substance of the arrangement. The classification can have a material impact on the consolidated financial statements.
FAIR VALUE MEASUREMENT OF FINANCIAL INSTRUMENTS When the fair values of financial assets and financial liabilities recorded in the consolidated balance sheet cannot be measured based on quoted prices in active markets, their fair value is measured using valuation techniques including the discounted cash flow model. The inputs to these models are taken from observable markets where possible, but where this is not feasible, a degree of judgement is required in establishing fair values. Judgements include considerations of inputs such as liquidity risk, credit risk and volatility. Changes in assumptions about these factors could affect the reported fair value of financial instruments. See Note 32 for further disclosures.
CONTINGENT CONSIDERATION Contingent consideration, resulting from business combinations, is valued at fair value at the acquisition date as part of the business combination. When the contingent consideration meets the definition of a financial liability, it is subsequently re-measured to fair value at each reporting date. The determination of the fair value is based on discounted cash flows. The key assumptions take into consideration the probability of meeting each performance target and the discount factor.
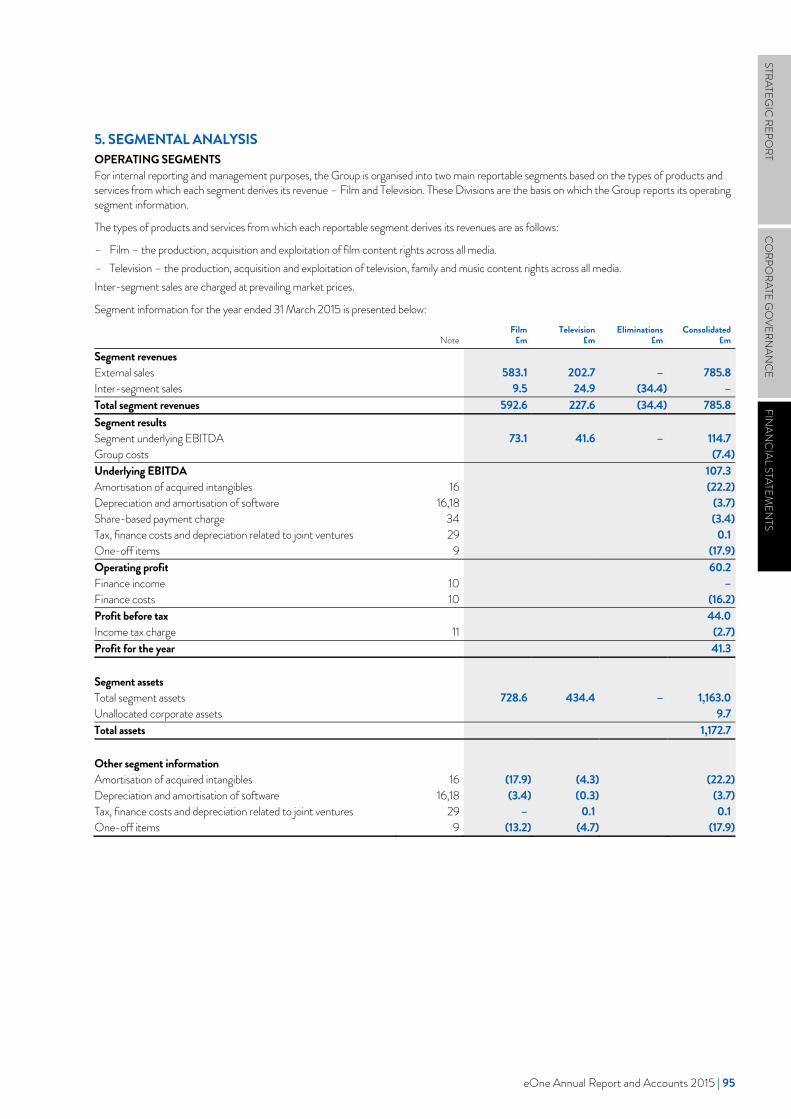
eOne Annual Report and Accounts 2015 | 95
STRATEGIC
REPORT
CO
RPORATE G
OVERN
ANC
EFIN
ANC
IAL STATEMEN
TS
eOne 2015 Annual Report and Accounts | 95
STRATEGIC
REPORT
CORPO
RATE GO
VERNAN
CEFIN
ANC
IAL STATEMEN
TS
5. SEGMENTAL ANALYSIS OPERATING SEGMENTS For internal reporting and management purposes, the Group is organised into two main reportable segments based on the types of products and services from which each segment derives its revenue – Film and Television. These Divisions are the basis on which the Group reports its operating segment information.
The types of products and services from which each reportable segment derives its revenues are as follows:
– Film – the production, acquisition and exploitation of film content rights across all media. – Television – the production, acquisition and exploitation of television, family and music content rights across all media. Inter-segment sales are charged at prevailing market prices.
Segment information for the year ended 31 March 2015 is presented below:
Note Film
£m Television
£m Eliminations
£m Consolidated
£m
Segment revenues External sales 583.1 202.7 – 785.8Inter-segment sales 9.5 24.9 (34.4) –Total segment revenues 592.6 227.6 (34.4) 785.8Segment results Segment underlying EBITDA 73.1 41.6 – 114.7Group costs (7.4)Underlying EBITDA 107.3Amortisation of acquired intangibles 16 (22.2)Depreciation and amortisation of software 16,18 (3.7)Share-based payment charge 34 (3.4)Tax, finance costs and depreciation related to joint ventures 29 0.1One-off items 9 (17.9)Operating profit 60.2Finance income 10 –Finance costs 10 (16.2)Profit before tax 44.0Income tax charge 11 (2.7)Profit for the year 41.3 Segment assets Total segment assets 728.6 434.4 – 1,163.0Unallocated corporate assets 9.7Total assets 1,172.7 Other segment information Amortisation of acquired intangibles 16 (17.9) (4.3) (22.2)Depreciation and amortisation of software 16,18 (3.4) (0.3) (3.7)Tax, finance costs and depreciation related to joint ventures 29 – 0.1 0.1One-off items 9 (13.2) (4.7) (17.9)
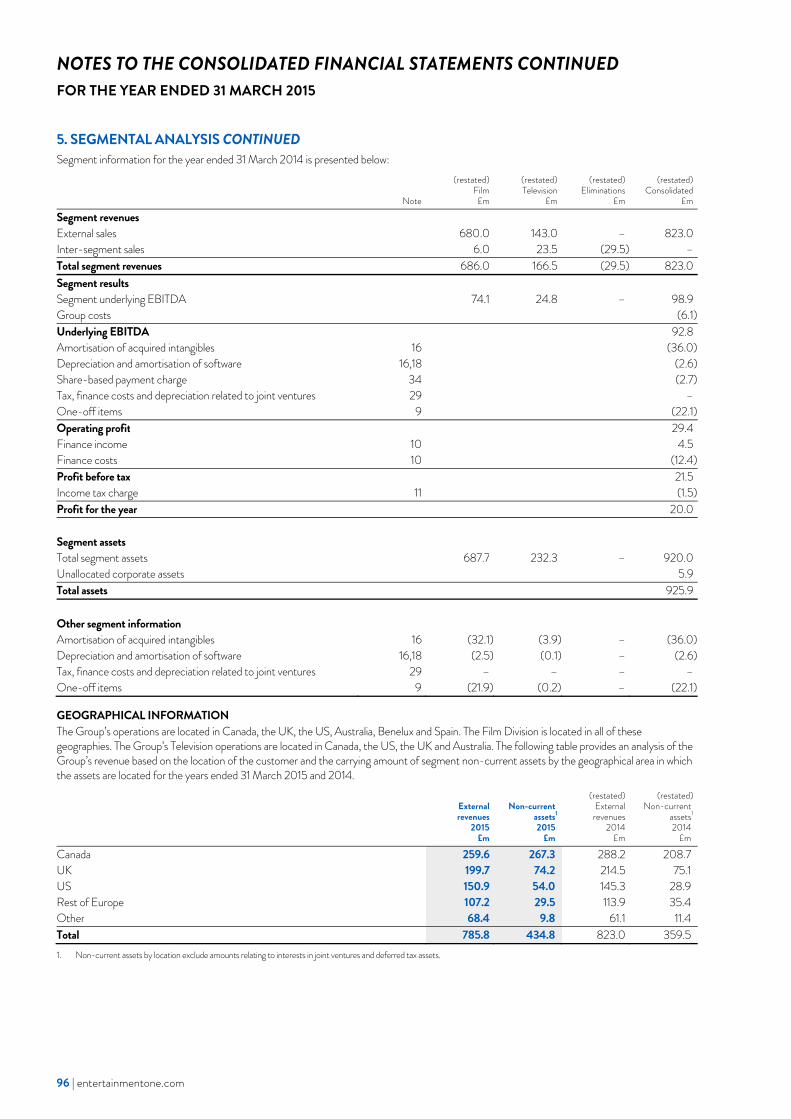
96 | entertainmentone.com
NOTES TO THE CONSOLIDATED FINANCIAL STATEMENTS CONTINUED FOR THE YEAR ENDED 31 MARCH 2015
96 | entertainmentone.com
5. SEGMENTAL ANALYSIS CONTINUED Segment information for the year ended 31 March 2014 is presented below:
Note
(restated) Film
£m
(restated)Television
£m
(restated) Eliminations
£m
(restated)Consolidated
£m
Segment revenues External sales 680.0 143.0 – 823.0Inter-segment sales 6.0 23.5 (29.5) –Total segment revenues 686.0 166.5 (29.5) 823.0Segment results Segment underlying EBITDA 74.1 24.8 – 98.9Group costs (6.1)Underlying EBITDA 92.8Amortisation of acquired intangibles 16 (36.0)Depreciation and amortisation of software 16,18 (2.6)Share-based payment charge 34 (2.7)Tax, finance costs and depreciation related to joint ventures 29 –One-off items 9 (22.1)Operating profit 29.4Finance income 10 4.5Finance costs 10 (12.4)Profit before tax 21.5Income tax charge 11 (1.5)Profit for the year 20.0 Segment assets Total segment assets 687.7 232.3 – 920.0Unallocated corporate assets 5.9Total assets 925.9 Other segment information Amortisation of acquired intangibles 16 (32.1) (3.9) – (36.0)Depreciation and amortisation of software 16,18 (2.5) (0.1) – (2.6)Tax, finance costs and depreciation related to joint ventures 29 – – – –One-off items 9 (21.9) (0.2) – (22.1)
GEOGRAPHICAL INFORMATION The Group’s operations are located in Canada, the UK, the US, Australia, Benelux and Spain. The Film Division is located in all of these geographies. The Group’s Television operations are located in Canada, the US, the UK and Australia. The following table provides an analysis of the Group’s revenue based on the location of the customer and the carrying amount of segment non-current assets by the geographical area in which the assets are located for the years ended 31 March 2015 and 2014.
Externalrevenues
2015£m
Non-current assets1
2015 £m
(restated) External
revenues 2014
£m
(restated) Non-current
assets1
2014 £m
Canada 259.6 267.3 288.2 208.7UK 199.7 74.2 214.5 75.1US 150.9 54.0 145.3 28.9Rest of Europe 107.2 29.5 113.9 35.4Other 68.4 9.8 61.1 11.4Total 785.8 434.8 823.0 359.51. Non-current assets by location exclude amounts relating to interests in joint ventures and deferred tax assets.
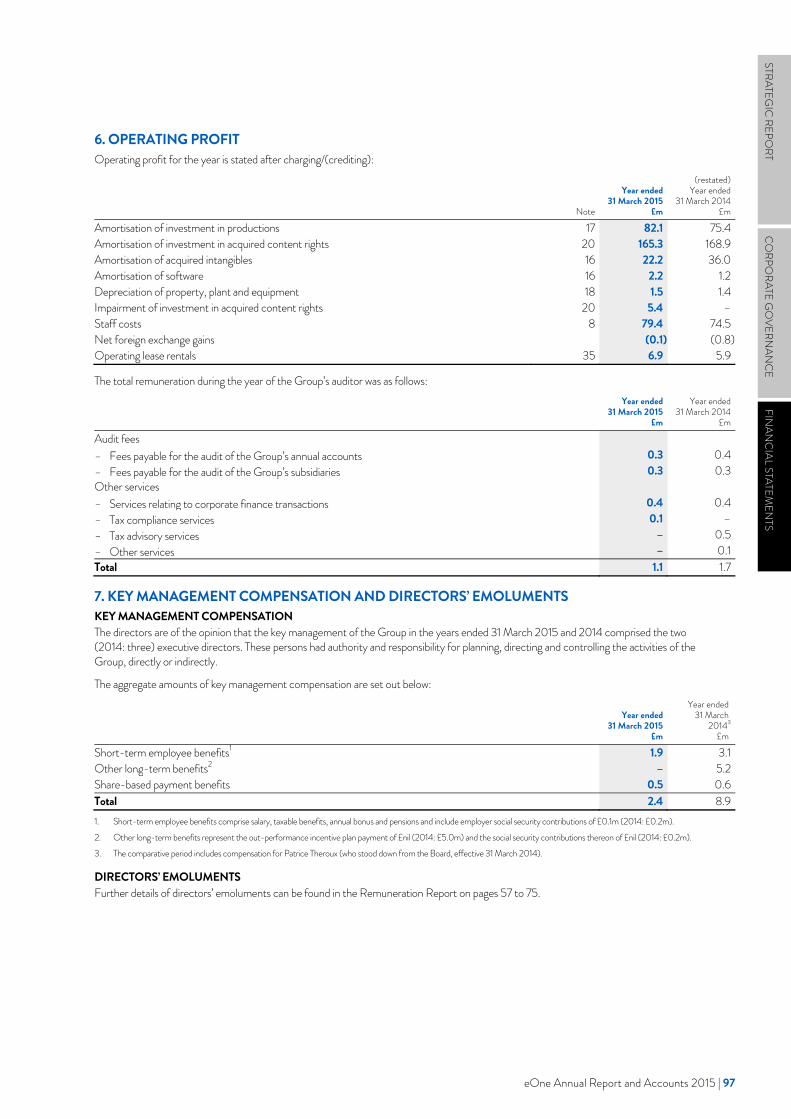
eOne Annual Report and Accounts 2015 | 97
STRATEGIC
REPORT
CO
RPORATE G
OVERN
ANC
EFIN
ANC
IAL STATEMEN
TS
eOne 2015 Annual Report and Accounts | 97
STRATEGIC
REPORT
CORPO
RATE GO
VERNAN
CEFIN
ANC
IAL STATEMEN
TS
6. OPERATING PROFIT Operating profit for the year is stated after charging/(crediting):
Note
Year ended31 March 2015
£m
(restated)Year ended
31 March 2014
£m
Amortisation of investment in productions 17 82.1 75.4Amortisation of investment in acquired content rights 20 165.3 168.9Amortisation of acquired intangibles 16 22.2 36.0Amortisation of software 16 2.2 1.2Depreciation of property, plant and equipment 18 1.5 1.4Impairment of investment in acquired content rights 20 5.4 –Staff costs 8 79.4 74.5Net foreign exchange gains (0.1) (0.8)Operating lease rentals 35 6.9 5.9
The total remuneration during the year of the Group’s auditor was as follows:
Year ended31 March 2015
£m
Year ended31 March 2014
£m
Audit fees – Fees payable for the audit of the Group’s annual accounts 0.3 0.4– Fees payable for the audit of the Group’s subsidiaries 0.3 0.3Other services – Services relating to corporate finance transactions 0.4 0.4– Tax compliance services 0.1 –– Tax advisory services – 0.5– Other services – 0.1Total 1.1 1.7
7. KEY MANAGEMENT COMPENSATION AND DIRECTORS’ EMOLUMENTS KEY MANAGEMENT COMPENSATION The directors are of the opinion that the key management of the Group in the years ended 31 March 2015 and 2014 comprised the two (2014: three) executive directors. These persons had authority and responsibility for planning, directing and controlling the activities of the Group, directly or indirectly.
The aggregate amounts of key management compensation are set out below:
Year ended31 March 2015
£m
Year ended31 March
20143
£m
Short-term employee benefits1 1.9 3.1Other long-term benefits2 – 5.2Share-based payment benefits 0.5 0.6Total 2.4 8.91. Short-term employee benefits comprise salary, taxable benefits, annual bonus and pensions and include employer social security contributions of £0.1m (2014: £0.2m).
2. Other long-term benefits represent the out-performance incentive plan payment of £nil (2014: £5.0m) and the social security contributions thereon of £nil (2014: £0.2m). 3. The comparative period includes compensation for Patrice Theroux (who stood down from the Board, effective 31 March 2014).
DIRECTORS’ EMOLUMENTS Further details of directors’ emoluments can be found in the Remuneration Report on pages 57 to 75.
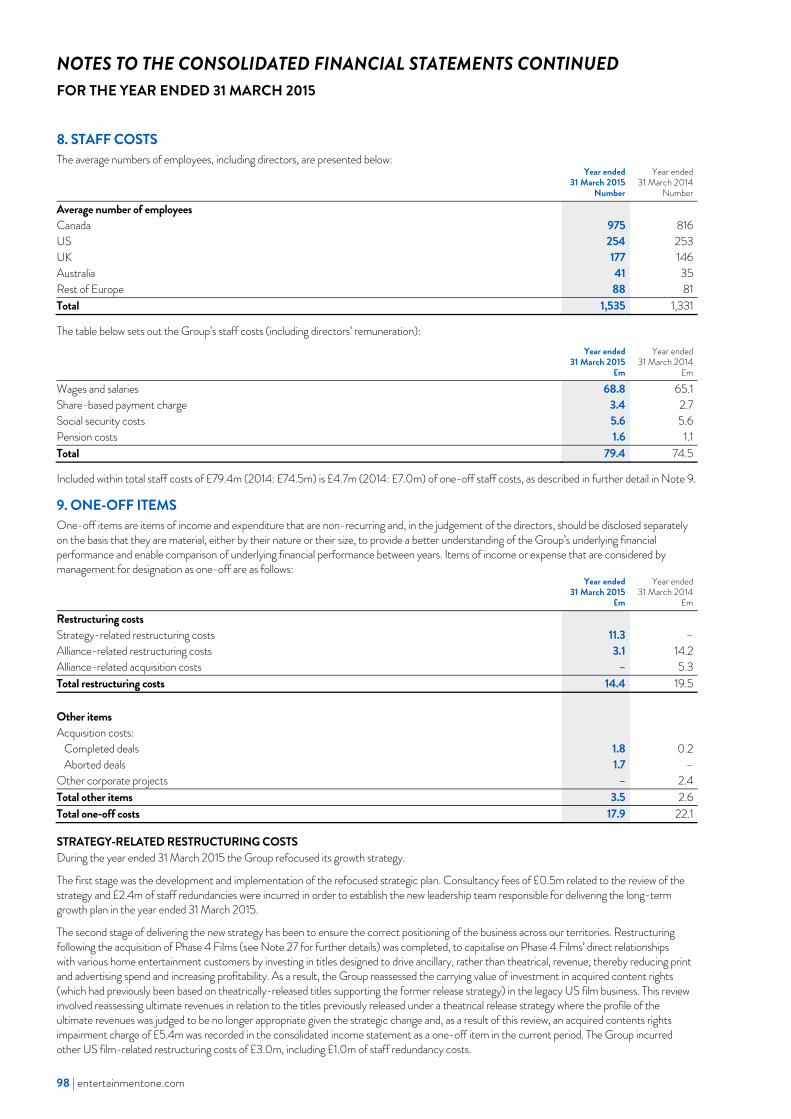
98 | entertainmentone.com
NOTES TO THE CONSOLIDATED FINANCIAL STATEMENTS CONTINUED FOR THE YEAR ENDED 31 MARCH 2015
98 | entertainmentone.com
8. STAFF COSTS The average numbers of employees, including directors, are presented below:
Year ended 31 March 2015
Number
Year ended31 March 2014
Number
Average number of employees Canada 975 816US 254 253UK 177 146Australia 41 35Rest of Europe 88 81Total 1,535 1,331
The table below sets out the Group’s staff costs (including directors’ remuneration):
Year ended 31 March 2015
£m
Year ended31 March 2014
£m
Wages and salaries 68.8 65.1Share-based payment charge 3.4 2.7Social security costs 5.6 5.6Pension costs 1.6 1.1Total 79.4 74.5
Included within total staff costs of £79.4m (2014: £74.5m) is £4.7m (2014: £7.0m) of one-off staff costs, as described in further detail in Note 9.
9. ONE-OFF ITEMS One-off items are items of income and expenditure that are non-recurring and, in the judgement of the directors, should be disclosed separately on the basis that they are material, either by their nature or their size, to provide a better understanding of the Group’s underlying financial performance and enable comparison of underlying financial performance between years. Items of income or expense that are considered by management for designation as one-off are as follows:
Year ended 31 March 2015
£m
Year ended31 March 2014
£m
Restructuring costs Strategy-related restructuring costs 11.3 –Alliance-related restructuring costs 3.1 14.2Alliance-related acquisition costs – 5.3Total restructuring costs 14.4 19.5 Other items Acquisition costs:
Completed deals 1.8 0.2Aborted deals 1.7 –
Other corporate projects – 2.4Total other items 3.5 2.6Total one-off costs 17.9 22.1
STRATEGY-RELATED RESTRUCTURING COSTS During the year ended 31 March 2015 the Group refocused its growth strategy.
The first stage was the development and implementation of the refocused strategic plan. Consultancy fees of £0.5m related to the review of the strategy and £2.4m of staff redundancies were incurred in order to establish the new leadership team responsible for delivering the long-term growth plan in the year ended 31 March 2015.
The second stage of delivering the new strategy has been to ensure the correct positioning of the business across our territories. Restructuring following the acquisition of Phase 4 Films (see Note 27 for further details) was completed, to capitalise on Phase 4 Films’ direct relationships with various home entertainment customers by investing in titles designed to drive ancillary, rather than theatrical, revenue, thereby reducing print and advertising spend and increasing profitability. As a result, the Group reassessed the carrying value of investment in acquired content rights (which had previously been based on theatrically-released titles supporting the former release strategy) in the legacy US film business. This review involved reassessing ultimate revenues in relation to the titles previously released under a theatrical release strategy where the profile of the ultimate revenues was judged to be no longer appropriate given the strategic change and, as a result of this review, an acquired contents rights impairment charge of £5.4m was recorded in the consolidated income statement as a one-off item in the current period. The Group incurred other US film-related restructuring costs of £3.0m, including £1.0m of staff redundancy costs.
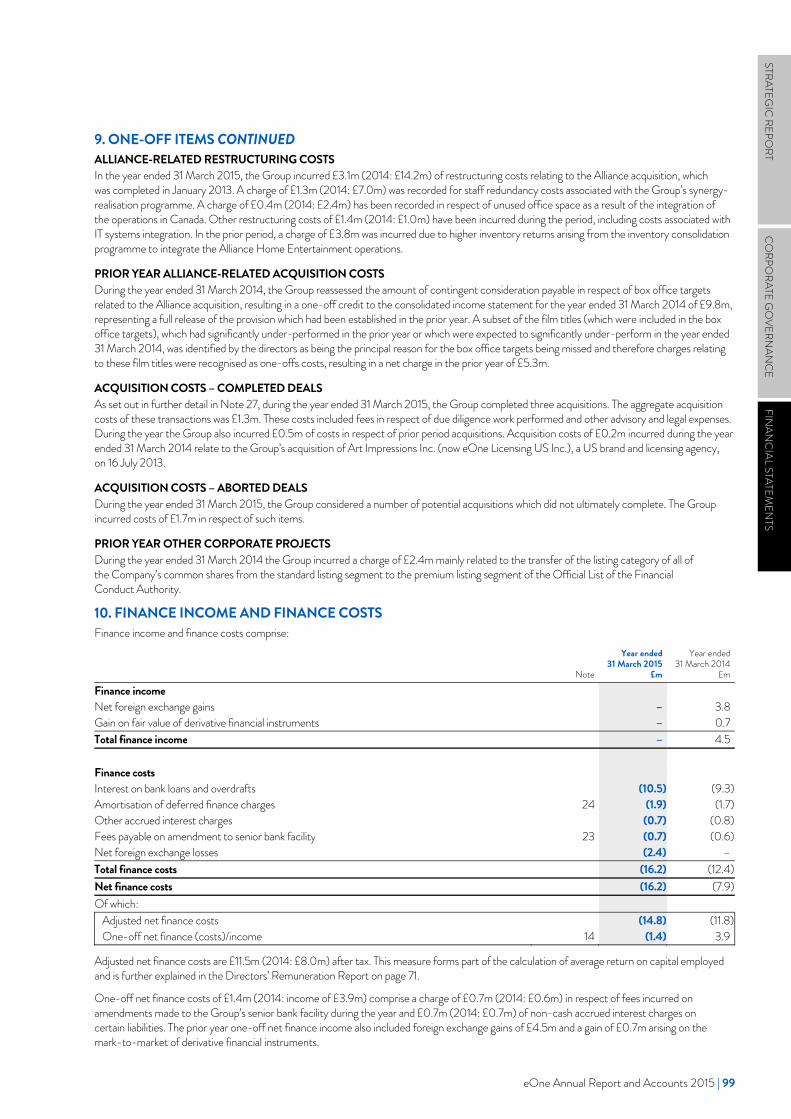
eOne Annual Report and Accounts 2015 | 99
STRATEGIC
REPORT
CO
RPORATE G
OVERN
ANC
EFIN
ANC
IAL STATEMEN
TS
eOne 2015 Annual Report and Accounts | 99
STRATEGIC
REPORT
CORPO
RATE GO
VERNAN
CEFIN
ANC
IAL STATEMEN
TS
9. ONE-OFF ITEMS CONTINUED ALLIANCE-RELATED RESTRUCTURING COSTS In the year ended 31 March 2015, the Group incurred £3.1m (2014: £14.2m) of restructuring costs relating to the Alliance acquisition, which was completed in January 2013. A charge of £1.3m (2014: £7.0m) was recorded for staff redundancy costs associated with the Group’s synergy-realisation programme. A charge of £0.4m (2014: £2.4m) has been recorded in respect of unused office space as a result of the integration of the operations in Canada. Other restructuring costs of £1.4m (2014: £1.0m) have been incurred during the period, including costs associated with IT systems integration. In the prior period, a charge of £3.8m was incurred due to higher inventory returns arising from the inventory consolidation programme to integrate the Alliance Home Entertainment operations.
PRIOR YEAR ALLIANCE-RELATED ACQUISITION COSTS During the year ended 31 March 2014, the Group reassessed the amount of contingent consideration payable in respect of box office targets related to the Alliance acquisition, resulting in a one-off credit to the consolidated income statement for the year ended 31 March 2014 of £9.8m, representing a full release of the provision which had been established in the prior year. A subset of the film titles (which were included in the box office targets), which had significantly under-performed in the prior year or which were expected to significantly under-perform in the year ended 31 March 2014, was identified by the directors as being the principal reason for the box office targets being missed and therefore charges relating to these film titles were recognised as one-offs costs, resulting in a net charge in the prior year of £5.3m.
ACQUISITION COSTS – COMPLETED DEALS As set out in further detail in Note 27, during the year ended 31 March 2015, the Group completed three acquisitions. The aggregate acquisition costs of these transactions was £1.3m. These costs included fees in respect of due diligence work performed and other advisory and legal expenses. During the year the Group also incurred £0.5m of costs in respect of prior period acquisitions. Acquisition costs of £0.2m incurred during the year ended 31 March 2014 relate to the Group’s acquisition of Art Impressions Inc. (now eOne Licensing US Inc.), a US brand and licensing agency, on 16 July 2013.
ACQUISITION COSTS – ABORTED DEALS During the year ended 31 March 2015, the Group considered a number of potential acquisitions which did not ultimately complete. The Group incurred costs of £1.7m in respect of such items.
PRIOR YEAR OTHER CORPORATE PROJECTS During the year ended 31 March 2014 the Group incurred a charge of £2.4m mainly related to the transfer of the listing category of all of the Company’s common shares from the standard listing segment to the premium listing segment of the Official List of the Financial Conduct Authority.
10. FINANCE INCOME AND FINANCE COSTS Finance income and finance costs comprise:
Note
Year ended31 March 2015
£m
Year ended31 March 2014
£m
Finance income Net foreign exchange gains – 3.8Gain on fair value of derivative financial instruments – 0.7Total finance income – 4.5 Finance costs Interest on bank loans and overdrafts (10.5) (9.3)Amortisation of deferred finance charges 24 (1.9) (1.7)Other accrued interest charges (0.7) (0.8)Fees payable on amendment to senior bank facility 23 (0.7) (0.6)Net foreign exchange losses (2.4) –Total finance costs (16.2) (12.4)Net finance costs (16.2) (7.9)Of which:
Adjusted net finance costs (14.8) (11.8)One-off net finance (costs)/income 14 (1.4) 3.9
Adjusted net finance costs are £11.5m (2014: £8.0m) after tax. This measure forms part of the calculation of average return on capital employed and is further explained in the Directors’ Remuneration Report on page 71.
One-off net finance costs of £1.4m (2014: income of £3.9m) comprise a charge of £0.7m (2014: £0.6m) in respect of fees incurred on amendments made to the Group’s senior bank facility during the year and £0.7m (2014: £0.7m) of non-cash accrued interest charges on certain liabilities. The prior year one-off net finance income also included foreign exchange gains of £4.5m and a gain of £0.7m arising on the mark-to-market of derivative financial instruments.
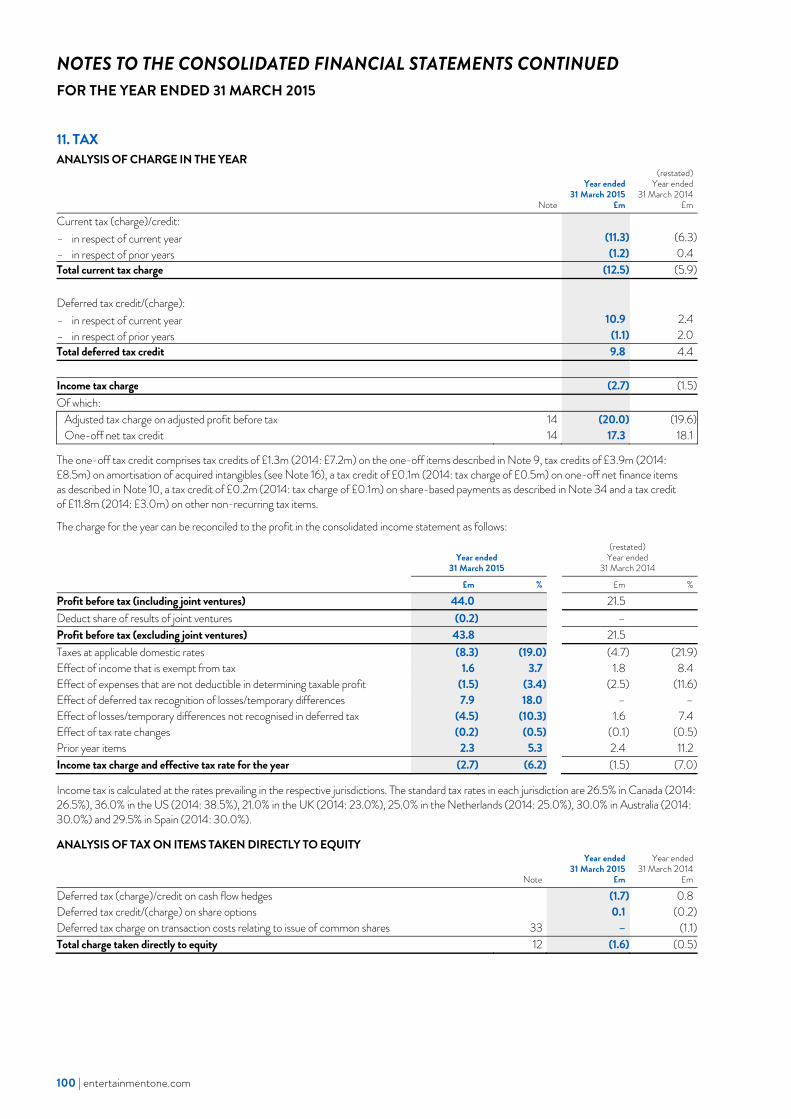
100 | entertainmentone.com
NOTES TO THE CONSOLIDATED FINANCIAL STATEMENTS CONTINUED FOR THE YEAR ENDED 31 MARCH 2015
100 | entertainmentone.com
11. TAX ANALYSIS OF CHARGE IN THE YEAR
Note
Year ended 31 March 2015
£m
(restated)Year ended
31 March 2014£m
Current tax (charge)/credit: – in respect of current year (11.3) (6.3)– in respect of prior years (1.2) 0.4Total current tax charge (12.5) (5.9) Deferred tax credit/(charge): – in respect of current year 10.9 2.4– in respect of prior years (1.1) 2.0Total deferred tax credit 9.8 4.4 Income tax charge (2.7) (1.5)Of which:
Adjusted tax charge on adjusted profit before tax 14 (20.0) (19.6)One-off net tax credit 14 17.3 18.1
The one-off tax credit comprises tax credits of £1.3m (2014: £7.2m) on the one-off items described in Note 9, tax credits of £3.9m (2014: £8.5m) on amortisation of acquired intangibles (see Note 16), a tax credit of £0.1m (2014: tax charge of £0.5m) on one-off net finance items as described in Note 10, a tax credit of £0.2m (2014: tax charge of £0.1m) on share-based payments as described in Note 34 and a tax credit of £11.8m (2014: £3.0m) on other non-recurring tax items.
The charge for the year can be reconciled to the profit in the consolidated income statement as follows:
Year ended
31 March 2015
(restated) Year ended
31 March 2014
£m % £m %
Profit before tax (including joint ventures) 44.0 21.5 Deduct share of results of joint ventures (0.2) – Profit before tax (excluding joint ventures) 43.8 21.5 Taxes at applicable domestic rates (8.3) (19.0) (4.7) (21.9)Effect of income that is exempt from tax 1.6 3.7 1.8 8.4Effect of expenses that are not deductible in determining taxable profit (1.5) (3.4) (2.5) (11.6)Effect of deferred tax recognition of losses/temporary differences 7.9 18.0 – –Effect of losses/temporary differences not recognised in deferred tax (4.5) (10.3) 1.6 7.4Effect of tax rate changes (0.2) (0.5) (0.1) (0.5)Prior year items 2.3 5.3 2.4 11.2Income tax charge and effective tax rate for the year (2.7) (6.2) (1.5) (7.0)
Income tax is calculated at the rates prevailing in the respective jurisdictions. The standard tax rates in each jurisdiction are 26.5% in Canada (2014: 26.5%), 36.0% in the US (2014: 38.5%), 21.0% in the UK (2014: 23.0%), 25.0% in the Netherlands (2014: 25.0%), 30.0% in Australia (2014: 30.0%) and 29.5% in Spain (2014: 30.0%).
ANALYSIS OF TAX ON ITEMS TAKEN DIRECTLY TO EQUITY
Note
Year ended 31 March 2015
£m
Year ended31 March 2014
£m
Deferred tax (charge)/credit on cash flow hedges (1.7) 0.8Deferred tax credit/(charge) on share options 0.1 (0.2)Deferred tax charge on transaction costs relating to issue of common shares 33 – (1.1)Total charge taken directly to equity 12 (1.6) (0.5)
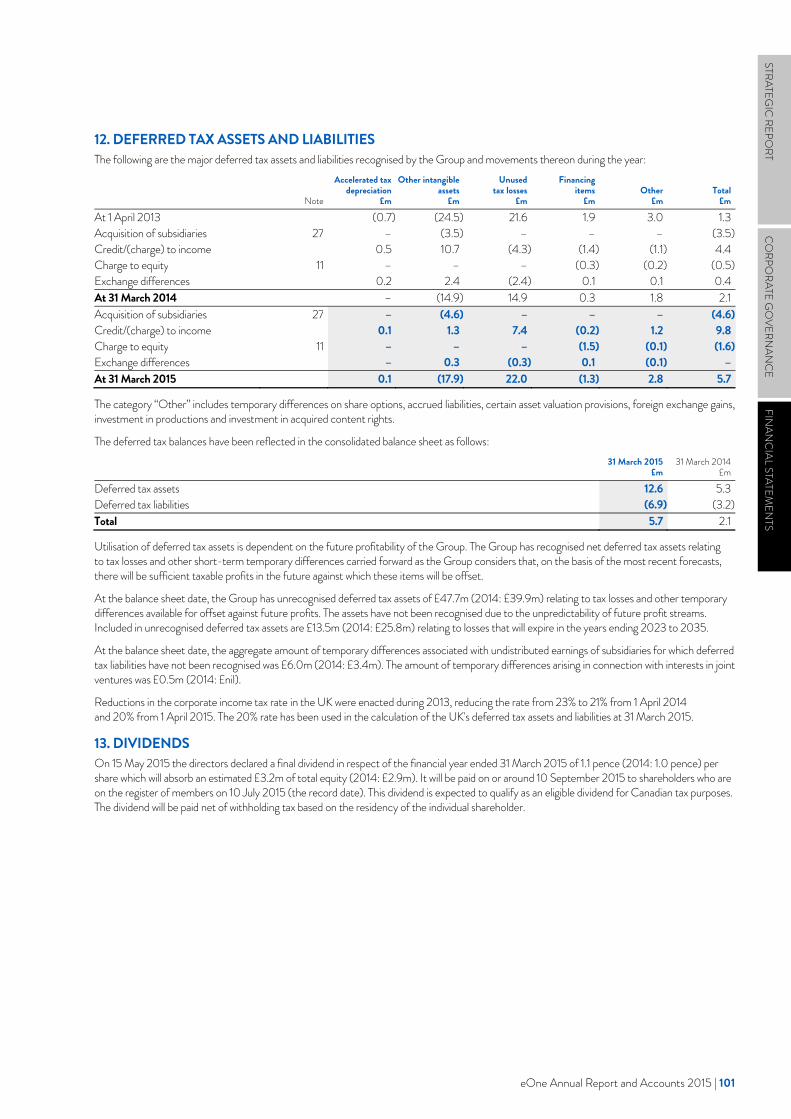
eOne Annual Report and Accounts 2015 | 101
STRATEGIC
REPORT
CO
RPORATE G
OVERN
ANC
EFIN
ANC
IAL STATEMEN
TS
eOne 2015 Annual Report and Accounts | 101
STRATEGIC
REPORT
CORPO
RATE GO
VERNAN
CEFIN
ANC
IAL STATEMEN
TS
12. DEFERRED TAX ASSETS AND LIABILITIES The following are the major deferred tax assets and liabilities recognised by the Group and movements thereon during the year:
Note
Accelerated tax depreciation
£m
Other intangible assets
£m
Unused tax losses
£m
Financing items
£m Other
£m Total
£m
At 1 April 2013 (0.7) (24.5) 21.6 1.9 3.0 1.3Acquisition of subsidiaries 27 – (3.5) – – – (3.5)Credit/(charge) to income 0.5 10.7 (4.3) (1.4) (1.1) 4.4Charge to equity 11 – – – (0.3) (0.2) (0.5)Exchange differences 0.2 2.4 (2.4) 0.1 0.1 0.4At 31 March 2014 – (14.9) 14.9 0.3 1.8 2.1Acquisition of subsidiaries 27 – (4.6) – – – (4.6)Credit/(charge) to income 0.1 1.3 7.4 (0.2) 1.2 9.8Charge to equity 11 – – – (1.5) (0.1) (1.6)Exchange differences – 0.3 (0.3) 0.1 (0.1) –At 31 March 2015 0.1 (17.9) 22.0 (1.3) 2.8 5.7
The category “Other” includes temporary differences on share options, accrued liabilities, certain asset valuation provisions, foreign exchange gains, investment in productions and investment in acquired content rights.
The deferred tax balances have been reflected in the consolidated balance sheet as follows:
31 March 2015
£m 31 March 2014
£m
Deferred tax assets 12.6 5.3Deferred tax liabilities (6.9) (3.2)Total 5.7 2.1
Utilisation of deferred tax assets is dependent on the future profitability of the Group. The Group has recognised net deferred tax assets relating to tax losses and other short-term temporary differences carried forward as the Group considers that, on the basis of the most recent forecasts, there will be sufficient taxable profits in the future against which these items will be offset.
At the balance sheet date, the Group has unrecognised deferred tax assets of £47.7m (2014: £39.9m) relating to tax losses and other temporary differences available for offset against future profits. The assets have not been recognised due to the unpredictability of future profit streams. Included in unrecognised deferred tax assets are £13.5m (2014: £25.8m) relating to losses that will expire in the years ending 2023 to 2035.
At the balance sheet date, the aggregate amount of temporary differences associated with undistributed earnings of subsidiaries for which deferred tax liabilities have not been recognised was £6.0m (2014: £3.4m). The amount of temporary differences arising in connection with interests in joint ventures was £0.5m (2014: £nil).
Reductions in the corporate income tax rate in the UK were enacted during 2013, reducing the rate from 23% to 21% from 1 April 2014 and 20% from 1 April 2015. The 20% rate has been used in the calculation of the UK's deferred tax assets and liabilities at 31 March 2015.
13. DIVIDENDS On 15 May 2015 the directors declared a final dividend in respect of the financial year ended 31 March 2015 of 1.1 pence (2014: 1.0 pence) per share which will absorb an estimated £3.2m of total equity (2014: £2.9m). It will be paid on or around 10 September 2015 to shareholders who are on the register of members on 10 July 2015 (the record date). This dividend is expected to qualify as an eligible dividend for Canadian tax purposes. The dividend will be paid net of withholding tax based on the residency of the individual shareholder.
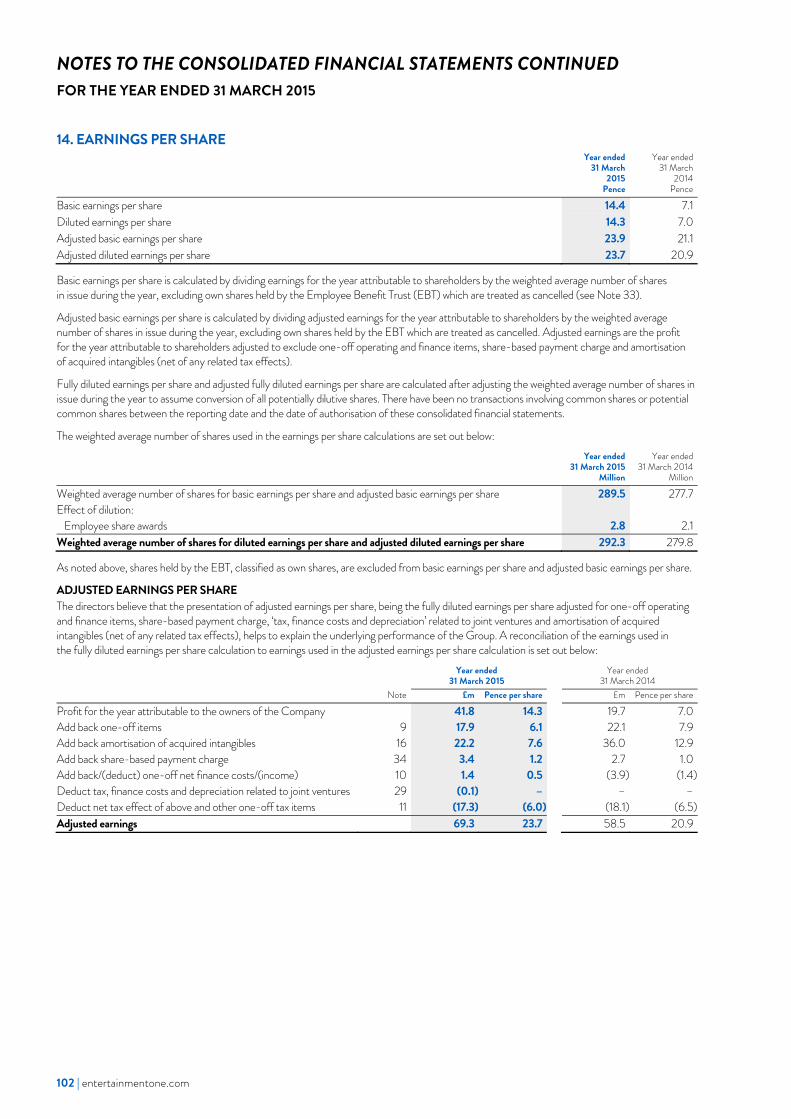
102 | entertainmentone.com
NOTES TO THE CONSOLIDATED FINANCIAL STATEMENTS CONTINUED FOR THE YEAR ENDED 31 MARCH 2015
102 | entertainmentone.com
14. EARNINGS PER SHARE
Year ended 31 March
2015 Pence
Year ended 31 March
2014 Pence
Basic earnings per share 14.4 7.1Diluted earnings per share 14.3 7.0Adjusted basic earnings per share 23.9 21.1Adjusted diluted earnings per share 23.7 20.9
Basic earnings per share is calculated by dividing earnings for the year attributable to shareholders by the weighted average number of shares in issue during the year, excluding own shares held by the Employee Benefit Trust (EBT) which are treated as cancelled (see Note 33).
Adjusted basic earnings per share is calculated by dividing adjusted earnings for the year attributable to shareholders by the weighted average number of shares in issue during the year, excluding own shares held by the EBT which are treated as cancelled. Adjusted earnings are the profit for the year attributable to shareholders adjusted to exclude one-off operating and finance items, share-based payment charge and amortisation of acquired intangibles (net of any related tax effects).
Fully diluted earnings per share and adjusted fully diluted earnings per share are calculated after adjusting the weighted average number of shares in issue during the year to assume conversion of all potentially dilutive shares. There have been no transactions involving common shares or potential common shares between the reporting date and the date of authorisation of these consolidated financial statements.
The weighted average number of shares used in the earnings per share calculations are set out below:
Year ended 31 March 2015
Million
Year ended 31 March 2014
Million
Weighted average number of shares for basic earnings per share and adjusted basic earnings per share 289.5 277.7Effect of dilution:
Employee share awards 2.8 2.1Weighted average number of shares for diluted earnings per share and adjusted diluted earnings per share 292.3 279.8
As noted above, shares held by the EBT, classified as own shares, are excluded from basic earnings per share and adjusted basic earnings per share.
ADJUSTED EARNINGS PER SHARE The directors believe that the presentation of adjusted earnings per share, being the fully diluted earnings per share adjusted for one-off operating and finance items, share-based payment charge, ‘tax, finance costs and depreciation’ related to joint ventures and amortisation of acquired intangibles (net of any related tax effects), helps to explain the underlying performance of the Group. A reconciliation of the earnings used in the fully diluted earnings per share calculation to earnings used in the adjusted earnings per share calculation is set out below:
Year ended
31 March 2015 Year ended
31 March 2014 Note £m Pence per share £m Pence per share
Profit for the year attributable to the owners of the Company 41.8 14.3 19.7 7.0Add back one-off items 9 17.9 6.1 22.1 7.9Add back amortisation of acquired intangibles 16 22.2 7.6 36.0 12.9Add back share-based payment charge 34 3.4 1.2 2.7 1.0Add back/(deduct) one-off net finance costs/(income) 10 1.4 0.5 (3.9) (1.4)Deduct tax, finance costs and depreciation related to joint ventures 29 (0.1) – – –Deduct net tax effect of above and other one-off tax items 11 (17.3) (6.0) (18.1) (6.5)Adjusted earnings 69.3 23.7 58.5 20.9
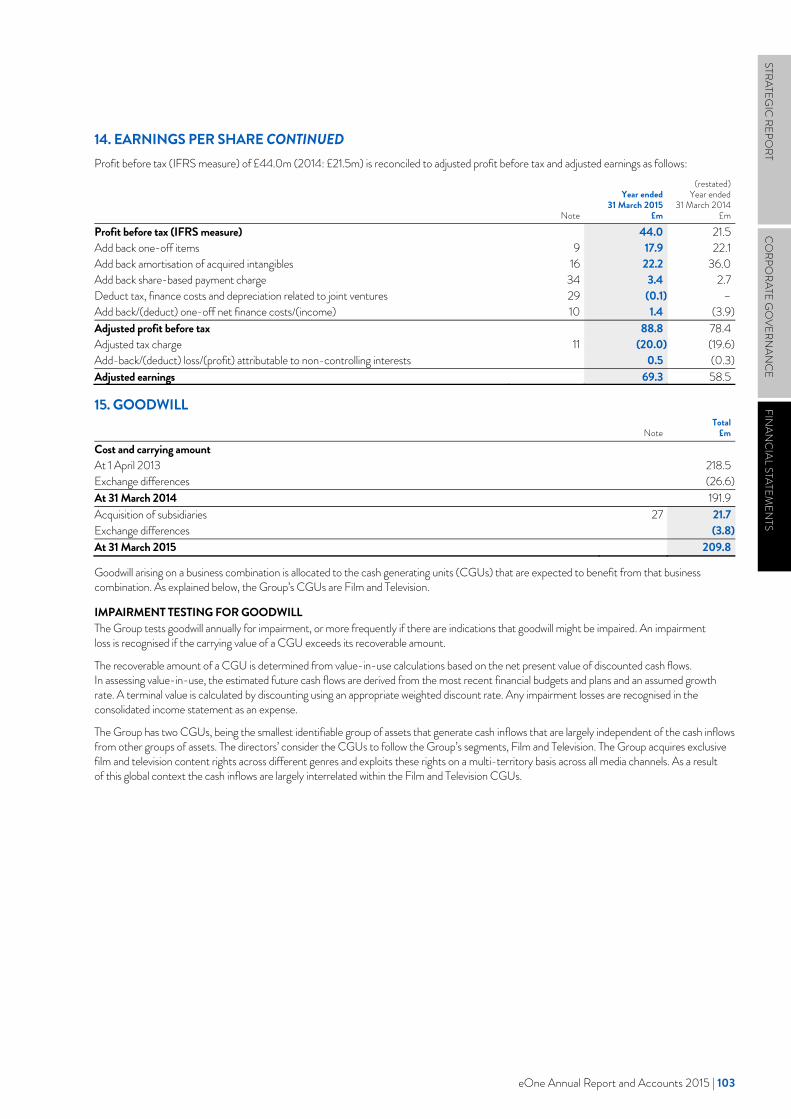
eOne Annual Report and Accounts 2015 | 103
STRATEGIC
REPORT
CO
RPORATE G
OVERN
ANC
EFIN
ANC
IAL STATEMEN
TS
eOne 2015 Annual Report and Accounts | 103
STRATEGIC
REPORT
CORPO
RATE GO
VERNAN
CEFIN
ANC
IAL STATEMEN
TS
14. EARNINGS PER SHARE CONTINUED Profit before tax (IFRS measure) of £44.0m (2014: £21.5m) is reconciled to adjusted profit before tax and adjusted earnings as follows:
Note
Year ended 31 March 2015
£m
(restated)Year ended
31 March 2014£m
Profit before tax (IFRS measure) 44.0 21.5Add back one-off items 9 17.9 22.1Add back amortisation of acquired intangibles 16 22.2 36.0Add back share-based payment charge 34 3.4 2.7Deduct tax, finance costs and depreciation related to joint ventures 29 (0.1) –Add back/(deduct) one-off net finance costs/(income) 10 1.4 (3.9)Adjusted profit before tax 88.8 78.4Adjusted tax charge 11 (20.0) (19.6)Add-back/(deduct) loss/(profit) attributable to non-controlling interests 0.5 (0.3)Adjusted earnings 69.3 58.5
15. GOODWILL
Note Total
£m
Cost and carrying amount At 1 April 2013 218.5Exchange differences (26.6)At 31 March 2014 191.9Acquisition of subsidiaries 27 21.7Exchange differences (3.8)At 31 March 2015 209.8
Goodwill arising on a business combination is allocated to the cash generating units (CGUs) that are expected to benefit from that business combination. As explained below, the Group’s CGUs are Film and Television.
IMPAIRMENT TESTING FOR GOODWILL The Group tests goodwill annually for impairment, or more frequently if there are indications that goodwill might be impaired. An impairment loss is recognised if the carrying value of a CGU exceeds its recoverable amount.
The recoverable amount of a CGU is determined from value-in-use calculations based on the net present value of discounted cash flows. In assessing value-in-use, the estimated future cash flows are derived from the most recent financial budgets and plans and an assumed growth rate. A terminal value is calculated by discounting using an appropriate weighted discount rate. Any impairment losses are recognised in the consolidated income statement as an expense.
The Group has two CGUs, being the smallest identifiable group of assets that generate cash inflows that are largely independent of the cash inflows from other groups of assets. The directors’ consider the CGUs to follow the Group’s segments, Film and Television. The Group acquires exclusive film and television content rights across different genres and exploits these rights on a multi-territory basis across all media channels. As a result of this global context the cash inflows are largely interrelated within the Film and Television CGUs.
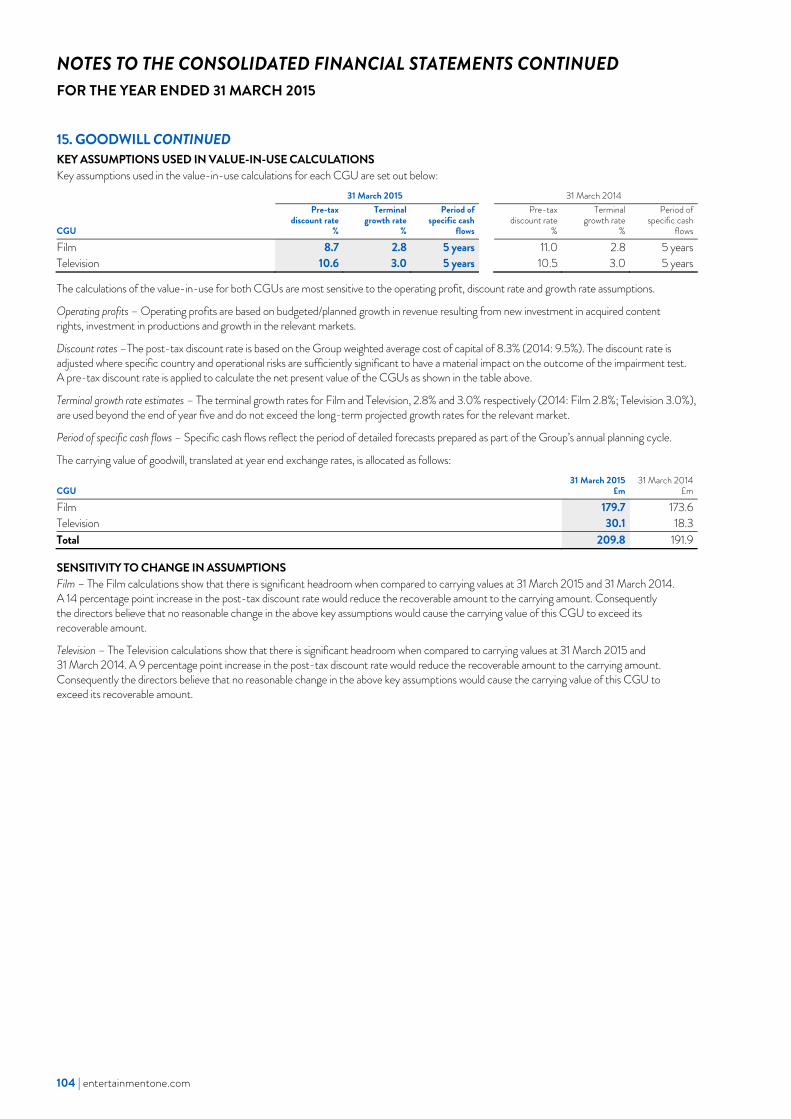
104 | entertainmentone.com
NOTES TO THE CONSOLIDATED FINANCIAL STATEMENTS CONTINUED FOR THE YEAR ENDED 31 MARCH 2015
104 | entertainmentone.com
15. GOODWILL CONTINUED KEY ASSUMPTIONS USED IN VALUE-IN-USE CALCULATIONS Key assumptions used in the value-in-use calculations for each CGU are set out below: 31 March 2015 31 March 2014
CGU
Pre-tax discount rate
%
Terminalgrowth rate
%
Period ofspecific cash
flows
Pre-tax discount rate
%
Terminal growth rate
%
Period ofspecific cash
flows
Film 8.7 2.8 5 years 11.0 2.8 5 yearsTelevision 10.6 3.0 5 years 10.5 3.0 5 years
The calculations of the value-in-use for both CGUs are most sensitive to the operating profit, discount rate and growth rate assumptions.
Operating profits – Operating profits are based on budgeted/planned growth in revenue resulting from new investment in acquired content rights, investment in productions and growth in the relevant markets.
Discount rates –The post-tax discount rate is based on the Group weighted average cost of capital of 8.3% (2014: 9.5%). The discount rate is adjusted where specific country and operational risks are sufficiently significant to have a material impact on the outcome of the impairment test. A pre-tax discount rate is applied to calculate the net present value of the CGUs as shown in the table above.
Terminal growth rate estimates – The terminal growth rates for Film and Television, 2.8% and 3.0% respectively (2014: Film 2.8%; Television 3.0%), are used beyond the end of year five and do not exceed the long-term projected growth rates for the relevant market.
Period of specific cash flows – Specific cash flows reflect the period of detailed forecasts prepared as part of the Group’s annual planning cycle.
The carrying value of goodwill, translated at year end exchange rates, is allocated as follows:
CGU 31 March 2015
£m 31 March 2014
£m
Film 179.7 173.6Television 30.1 18.3Total 209.8 191.9
SENSITIVITY TO CHANGE IN ASSUMPTIONS Film – The Film calculations show that there is significant headroom when compared to carrying values at 31 March 2015 and 31 March 2014. A 14 percentage point increase in the post-tax discount rate would reduce the recoverable amount to the carrying amount. Consequently the directors believe that no reasonable change in the above key assumptions would cause the carrying value of this CGU to exceed its recoverable amount.
Television – The Television calculations show that there is significant headroom when compared to carrying values at 31 March 2015 and 31 March 2014. A 9 percentage point increase in the post-tax discount rate would reduce the recoverable amount to the carrying amount. Consequently the directors believe that no reasonable change in the above key assumptions would cause the carrying value of this CGU to exceed its recoverable amount.
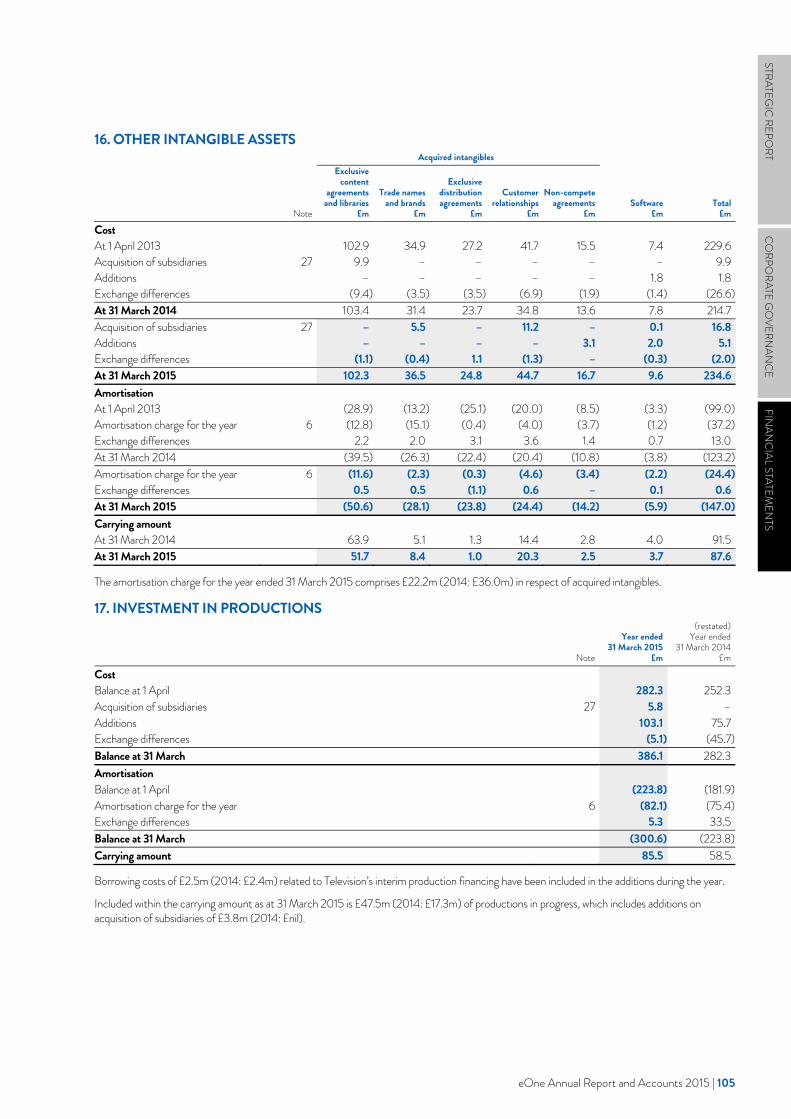
eOne Annual Report and Accounts 2015 | 105
STRATEGIC
REPORT
CO
RPORATE G
OVERN
ANC
EFIN
ANC
IAL STATEMEN
TS
eOne 2015 Annual Report and Accounts | 105
STRATEGIC
REPORT
CORPO
RATE GO
VERNAN
CEFIN
ANC
IAL STATEMEN
TS
16. OTHER INTANGIBLE ASSETS Acquired intangibles
Note
Exclusive content
agreements and libraries
£m
Trade names and brands
£m
Exclusive distribution agreements
£m
Customer relationships
£m
Non-compete agreements
£m Software
£m Total
£m
Cost At 1 April 2013 102.9 34.9 27.2 41.7 15.5 7.4 229.6Acquisition of subsidiaries 27 9.9 – – – – – 9.9Additions – – – – – 1.8 1.8Exchange differences (9.4) (3.5) (3.5) (6.9) (1.9) (1.4) (26.6)At 31 March 2014 103.4 31.4 23.7 34.8 13.6 7.8 214.7Acquisition of subsidiaries 27 – 5.5 – 11.2 – 0.1 16.8Additions – – – – 3.1 2.0 5.1Exchange differences (1.1) (0.4) 1.1 (1.3) – (0.3) (2.0)At 31 March 2015 102.3 36.5 24.8 44.7 16.7 9.6 234.6Amortisation At 1 April 2013 (28.9) (13.2) (25.1) (20.0) (8.5) (3.3) (99.0)Amortisation charge for the year 6 (12.8) (15.1) (0.4) (4.0) (3.7) (1.2) (37.2)Exchange differences 2.2 2.0 3.1 3.6 1.4 0.7 13.0At 31 March 2014 (39.5) (26.3) (22.4) (20.4) (10.8) (3.8) (123.2)Amortisation charge for the year 6 (11.6) (2.3) (0.3) (4.6) (3.4) (2.2) (24.4)Exchange differences 0.5 0.5 (1.1) 0.6 – 0.1 0.6At 31 March 2015 (50.6) (28.1) (23.8) (24.4) (14.2) (5.9) (147.0)Carrying amount At 31 March 2014 63.9 5.1 1.3 14.4 2.8 4.0 91.5At 31 March 2015 51.7 8.4 1.0 20.3 2.5 3.7 87.6
The amortisation charge for the year ended 31 March 2015 comprises £22.2m (2014: £36.0m) in respect of acquired intangibles.
17. INVESTMENT IN PRODUCTIONS
Note
Year ended 31 March 2015
£m
(restated) Year ended
31 March 2014£m
Cost Balance at 1 April 282.3 252.3Acquisition of subsidiaries 27 5.8 –Additions 103.1 75.7Exchange differences (5.1) (45.7)Balance at 31 March 386.1 282.3Amortisation Balance at 1 April (223.8) (181.9)Amortisation charge for the year 6 (82.1) (75.4)Exchange differences 5.3 33.5Balance at 31 March (300.6) (223.8)Carrying amount 85.5 58.5
Borrowing costs of £2.5m (2014: £2.4m) related to Television’s interim production financing have been included in the additions during the year.
Included within the carrying amount as at 31 March 2015 is £47.5m (2014: £17.3m) of productions in progress, which includes additions on acquisition of subsidiaries of £3.8m (2014: £nil).
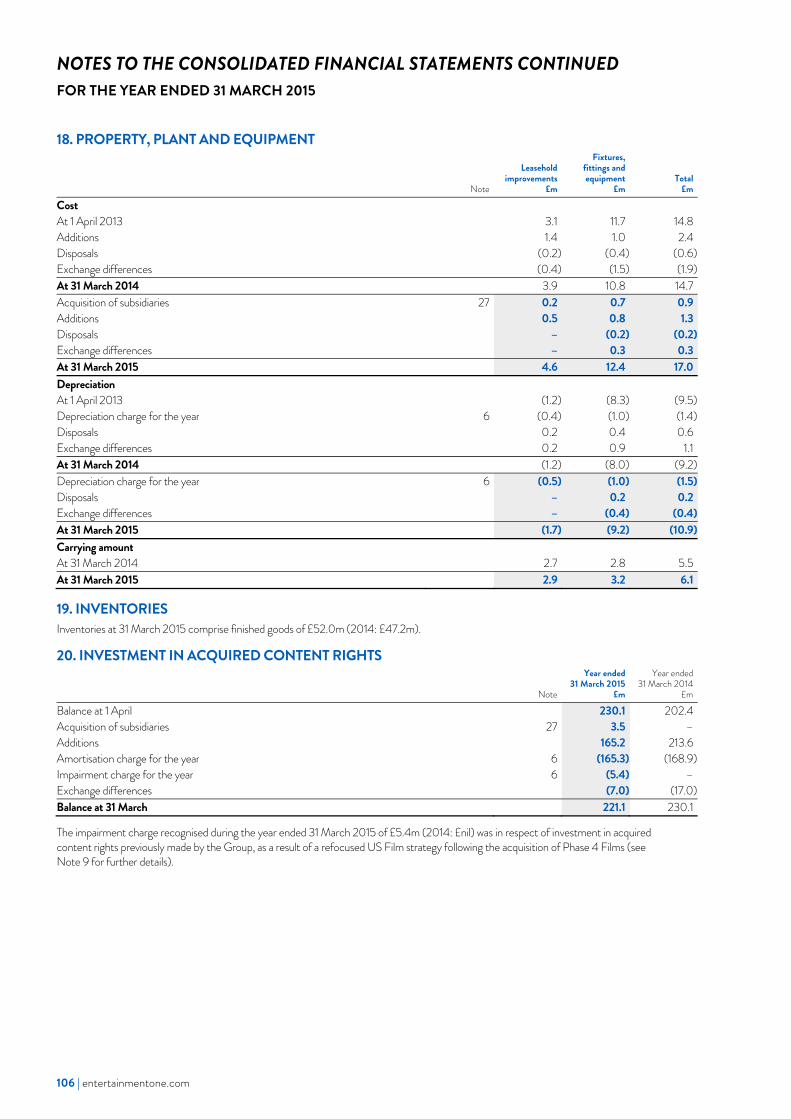
106 | entertainmentone.com
NOTES TO THE CONSOLIDATED FINANCIAL STATEMENTS CONTINUED FOR THE YEAR ENDED 31 MARCH 2015
106 | entertainmentone.com
18. PROPERTY, PLANT AND EQUIPMENT
Note
Leasehold improvements
£m
Fixtures, fittings and equipment
£m Total
£m
Cost At 1 April 2013 3.1 11.7 14.8Additions 1.4 1.0 2.4Disposals (0.2) (0.4) (0.6)Exchange differences (0.4) (1.5) (1.9)At 31 March 2014 3.9 10.8 14.7Acquisition of subsidiaries 27 0.2 0.7 0.9Additions 0.5 0.8 1.3Disposals – (0.2) (0.2)Exchange differences – 0.3 0.3At 31 March 2015 4.6 12.4 17.0Depreciation At 1 April 2013 (1.2) (8.3) (9.5)Depreciation charge for the year 6 (0.4) (1.0) (1.4)Disposals 0.2 0.4 0.6Exchange differences 0.2 0.9 1.1At 31 March 2014 (1.2) (8.0) (9.2)Depreciation charge for the year 6 (0.5) (1.0) (1.5)Disposals – 0.2 0.2Exchange differences – (0.4) (0.4)At 31 March 2015 (1.7) (9.2) (10.9)Carrying amount At 31 March 2014 2.7 2.8 5.5At 31 March 2015 2.9 3.2 6.1
19. INVENTORIES Inventories at 31 March 2015 comprise finished goods of £52.0m (2014: £47.2m).
20. INVESTMENT IN ACQUIRED CONTENT RIGHTS
Note
Year ended 31 March 2015
£m
Year ended31 March 2014
£m
Balance at 1 April 230.1 202.4Acquisition of subsidiaries 27 3.5 –Additions 165.2 213.6Amortisation charge for the year 6 (165.3) (168.9)Impairment charge for the year 6 (5.4) –Exchange differences (7.0) (17.0)Balance at 31 March 221.1 230.1
The impairment charge recognised during the year ended 31 March 2015 of £5.4m (2014: £nil) was in respect of investment in acquired content rights previously made by the Group, as a result of a refocused US Film strategy following the acquisition of Phase 4 Films (see Note 9 for further details).
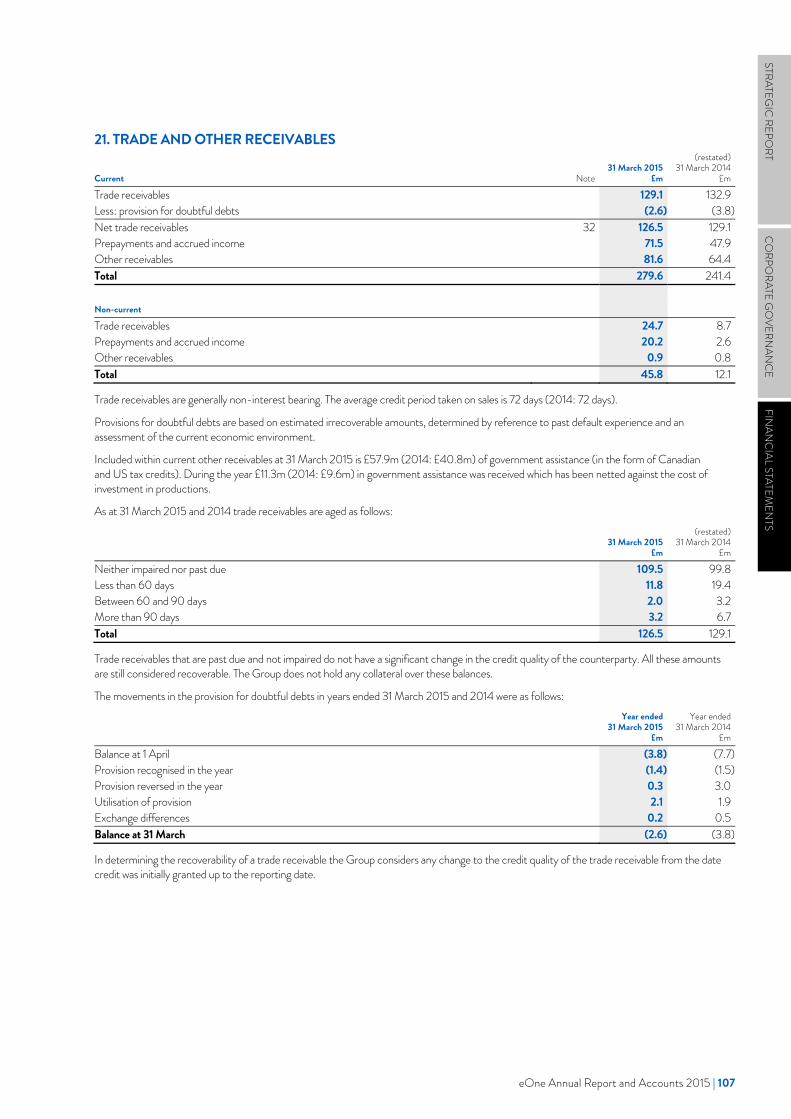
eOne Annual Report and Accounts 2015 | 107
STRATEGIC
REPORT
CO
RPORATE G
OVERN
ANC
EFIN
ANC
IAL STATEMEN
TS
eOne 2015 Annual Report and Accounts | 107
STRATEGIC
REPORT
CORPO
RATE GO
VERNAN
CEFIN
ANC
IAL STATEMEN
TS
21. TRADE AND OTHER RECEIVABLES
Current Note 31 March 2015
£m
(restated)31 March 2014
£m
Trade receivables 129.1 132.9Less: provision for doubtful debts (2.6) (3.8)Net trade receivables 32 126.5 129.1Prepayments and accrued income 71.5 47.9Other receivables 81.6 64.4Total 279.6 241.4 Non-current Trade receivables 24.7 8.7Prepayments and accrued income 20.2 2.6Other receivables 0.9 0.8Total 45.8 12.1
Trade receivables are generally non-interest bearing. The average credit period taken on sales is 72 days (2014: 72 days).
Provisions for doubtful debts are based on estimated irrecoverable amounts, determined by reference to past default experience and an assessment of the current economic environment.
Included within current other receivables at 31 March 2015 is £57.9m (2014: £40.8m) of government assistance (in the form of Canadian and US tax credits). During the year £11.3m (2014: £9.6m) in government assistance was received which has been netted against the cost of investment in productions.
As at 31 March 2015 and 2014 trade receivables are aged as follows:
31 March 2015
£m
(restated)31 March 2014
£m
Neither impaired nor past due 109.5 99.8Less than 60 days 11.8 19.4Between 60 and 90 days 2.0 3.2More than 90 days 3.2 6.7Total 126.5 129.1
Trade receivables that are past due and not impaired do not have a significant change in the credit quality of the counterparty. All these amounts are still considered recoverable. The Group does not hold any collateral over these balances.
The movements in the provision for doubtful debts in years ended 31 March 2015 and 2014 were as follows:
Year ended31 March 2015
£m
Year ended31 March 2014
£m
Balance at 1 April (3.8) (7.7)Provision recognised in the year (1.4) (1.5)Provision reversed in the year 0.3 3.0Utilisation of provision 2.1 1.9Exchange differences 0.2 0.5Balance at 31 March (2.6) (3.8)
In determining the recoverability of a trade receivable the Group considers any change to the credit quality of the trade receivable from the date credit was initially granted up to the reporting date.
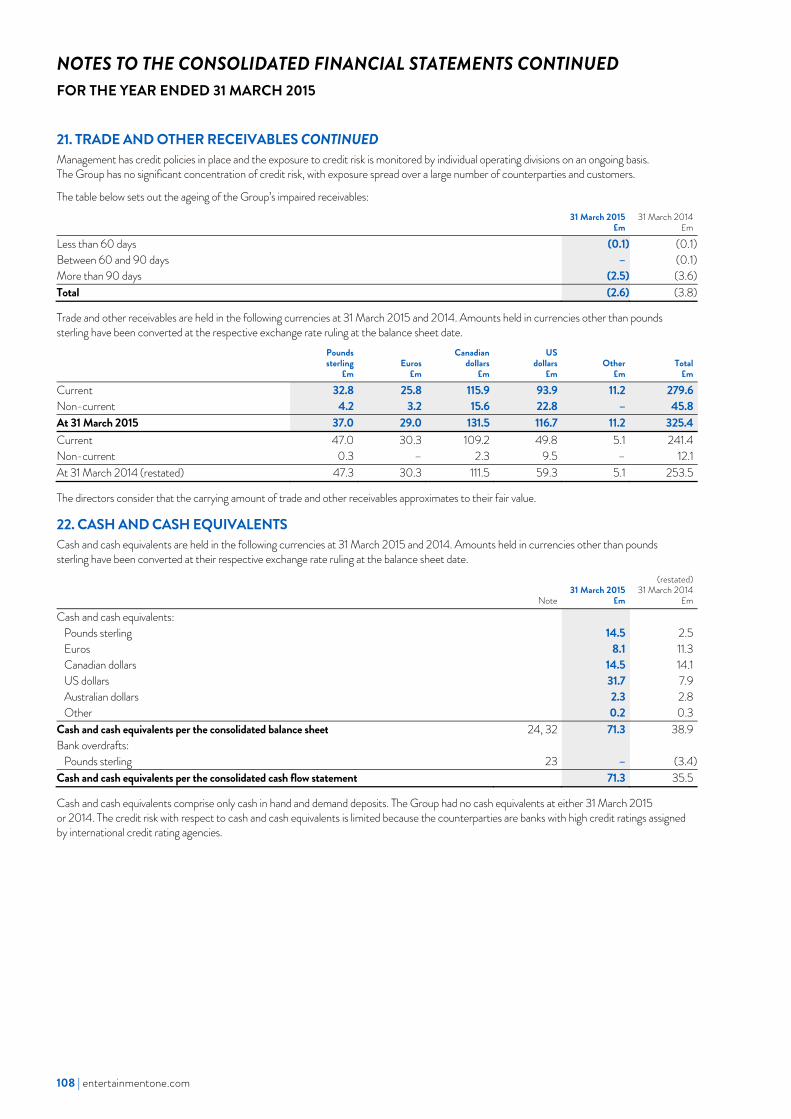
108 | entertainmentone.com
NOTES TO THE CONSOLIDATED FINANCIAL STATEMENTS CONTINUED FOR THE YEAR ENDED 31 MARCH 2015
108 | entertainmentone.com
21. TRADE AND OTHER RECEIVABLES CONTINUED Management has credit policies in place and the exposure to credit risk is monitored by individual operating divisions on an ongoing basis. The Group has no significant concentration of credit risk, with exposure spread over a large number of counterparties and customers.
The table below sets out the ageing of the Group’s impaired receivables:
31 March 2015
£m 31 March 2014
£m
Less than 60 days (0.1) (0.1)Between 60 and 90 days – (0.1)More than 90 days (2.5) (3.6)Total (2.6) (3.8)
Trade and other receivables are held in the following currencies at 31 March 2015 and 2014. Amounts held in currencies other than pounds sterling have been converted at the respective exchange rate ruling at the balance sheet date.
Pounds sterling
£m Euros
£m
Canadian dollars
£m
US dollars
£m Other
£m Total
£m
Current 32.8 25.8 115.9 93.9 11.2 279.6Non-current 4.2 3.2 15.6 22.8 – 45.8At 31 March 2015 37.0 29.0 131.5 116.7 11.2 325.4Current 47.0 30.3 109.2 49.8 5.1 241.4Non-current 0.3 – 2.3 9.5 – 12.1At 31 March 2014 (restated) 47.3 30.3 111.5 59.3 5.1 253.5
The directors consider that the carrying amount of trade and other receivables approximates to their fair value.
22. CASH AND CASH EQUIVALENTS Cash and cash equivalents are held in the following currencies at 31 March 2015 and 2014. Amounts held in currencies other than pounds sterling have been converted at their respective exchange rate ruling at the balance sheet date.
Note 31 March 2015
£m
(restated)31 March 2014
£m
Cash and cash equivalents: Pounds sterling 14.5 2.5Euros 8.1 11.3Canadian dollars 14.5 14.1US dollars 31.7 7.9Australian dollars 2.3 2.8Other 0.2 0.3
Cash and cash equivalents per the consolidated balance sheet 24, 32 71.3 38.9Bank overdrafts:
Pounds sterling 23 – (3.4)Cash and cash equivalents per the consolidated cash flow statement 71.3 35.5
Cash and cash equivalents comprise only cash in hand and demand deposits. The Group had no cash equivalents at either 31 March 2015 or 2014. The credit risk with respect to cash and cash equivalents is limited because the counterparties are banks with high credit ratings assigned by international credit rating agencies.
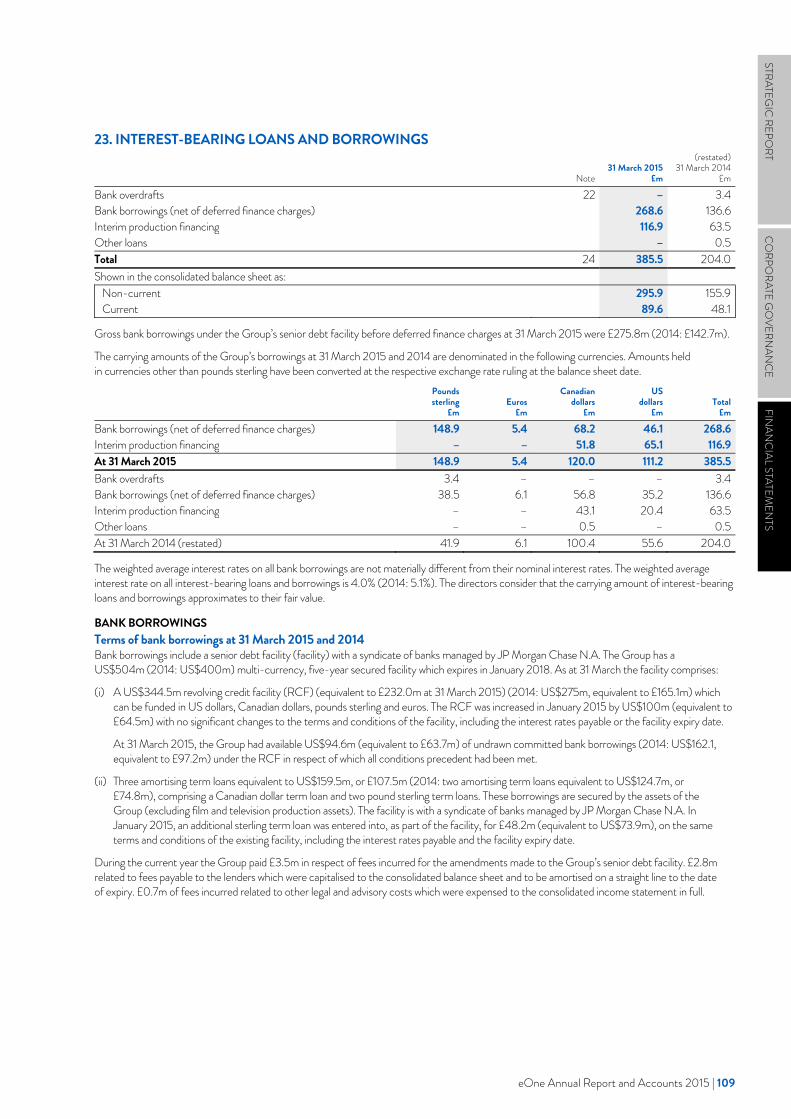
eOne Annual Report and Accounts 2015 | 109
STRATEGIC
REPORT
CO
RPORATE G
OVERN
ANC
EFIN
ANC
IAL STATEMEN
TS
eOne 2015 Annual Report and Accounts | 109
STRATEGIC
REPORT
CORPO
RATE GO
VERNAN
CEFIN
ANC
IAL STATEMEN
TS
23. INTEREST-BEARING LOANS AND BORROWINGS
Note 31 March 2015
£m
(restated)31 March 2014
£m
Bank overdrafts 22 – 3.4Bank borrowings (net of deferred finance charges) 268.6 136.6Interim production financing 116.9 63.5Other loans – 0.5Total 24 385.5 204.0Shown in the consolidated balance sheet as:
Non-current 295.9 155.9Current 89.6 48.1
Gross bank borrowings under the Group’s senior debt facility before deferred finance charges at 31 March 2015 were £275.8m (2014: £142.7m).
The carrying amounts of the Group’s borrowings at 31 March 2015 and 2014 are denominated in the following currencies. Amounts held in currencies other than pounds sterling have been converted at the respective exchange rate ruling at the balance sheet date.
Pounds sterling
£m Euros
£m
Canadian dollars
£m
US dollars
£m Total
£m
Bank borrowings (net of deferred finance charges) 148.9 5.4 68.2 46.1 268.6Interim production financing – – 51.8 65.1 116.9At 31 March 2015 148.9 5.4 120.0 111.2 385.5Bank overdrafts 3.4 – – – 3.4Bank borrowings (net of deferred finance charges) 38.5 6.1 56.8 35.2 136.6Interim production financing – – 43.1 20.4 63.5Other loans – – 0.5 – 0.5At 31 March 2014 (restated) 41.9 6.1 100.4 55.6 204.0
The weighted average interest rates on all bank borrowings are not materially different from their nominal interest rates. The weighted average interest rate on all interest-bearing loans and borrowings is 4.0% (2014: 5.1%). The directors consider that the carrying amount of interest-bearing loans and borrowings approximates to their fair value.
BANK BORROWINGS Terms of bank borrowings at 31 March 2015 and 2014 Bank borrowings include a senior debt facility (facility) with a syndicate of banks managed by JP Morgan Chase N.A. The Group has a US$504m (2014: US$400m) multi-currency, five-year secured facility which expires in January 2018. As at 31 March the facility comprises:
(i) A US$344.5m revolving credit facility (RCF) (equivalent to £232.0m at 31 March 2015) (2014: US$275m, equivalent to £165.1m) which can be funded in US dollars, Canadian dollars, pounds sterling and euros. The RCF was increased in January 2015 by US$100m (equivalent to £64.5m) with no significant changes to the terms and conditions of the facility, including the interest rates payable or the facility expiry date.
At 31 March 2015, the Group had available US$94.6m (equivalent to £63.7m) of undrawn committed bank borrowings (2014: US$162.1, equivalent to £97.2m) under the RCF in respect of which all conditions precedent had been met.
(ii) Three amortising term loans equivalent to US$159.5m, or £107.5m (2014: two amortising term loans equivalent to US$124.7m, or £74.8m), comprising a Canadian dollar term loan and two pound sterling term loans. These borrowings are secured by the assets of the Group (excluding film and television production assets). The facility is with a syndicate of banks managed by JP Morgan Chase N.A. In January 2015, an additional sterling term loan was entered into, as part of the facility, for £48.2m (equivalent to US$73.9m), on the same terms and conditions of the existing facility, including the interest rates payable and the facility expiry date.
During the current year the Group paid £3.5m in respect of fees incurred for the amendments made to the Group’s senior debt facility. £2.8m related to fees payable to the lenders which were capitalised to the consolidated balance sheet and to be amortised on a straight line to the date of expiry. £0.7m of fees incurred related to other legal and advisory costs which were expensed to the consolidated income statement in full.
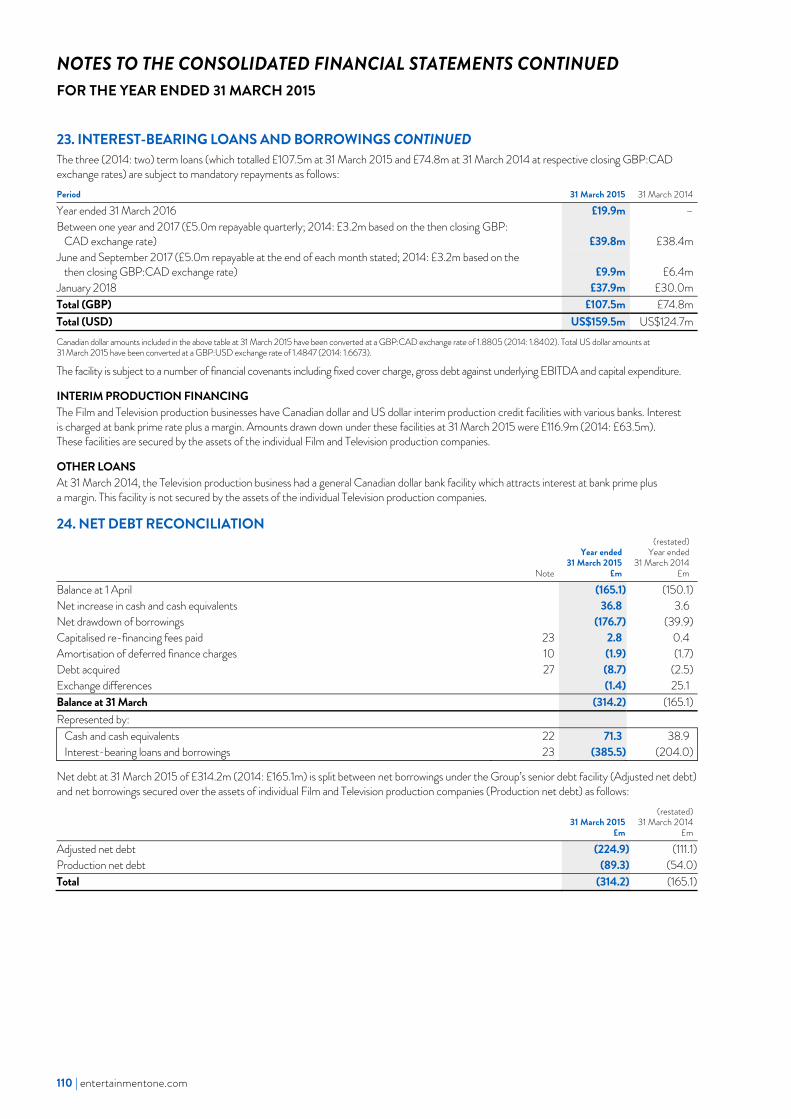
110 | entertainmentone.com
NOTES TO THE CONSOLIDATED FINANCIAL STATEMENTS CONTINUED FOR THE YEAR ENDED 31 MARCH 2015
110 | entertainmentone.com
23. INTEREST-BEARING LOANS AND BORROWINGS CONTINUED The three (2014: two) term loans (which totalled £107.5m at 31 March 2015 and £74.8m at 31 March 2014 at respective closing GBP:CAD exchange rates) are subject to mandatory repayments as follows: Period 31 March 2015 31 March 2014
Year ended 31 March 2016 £19.9m –Between one year and 2017 (£5.0m repayable quarterly; 2014: £3.2m based on the then closing GBP:
CAD exchange rate) £39.8m £38.4mJune and September 2017 (£5.0m repayable at the end of each month stated; 2014: £3.2m based on the
then closing GBP:CAD exchange rate) £9.9m £6.4mJanuary 2018 £37.9m £30.0mTotal (GBP) £107.5m £74.8mTotal (USD) US$159.5m US$124.7mCanadian dollar amounts included in the above table at 31 March 2015 have been converted at a GBP:CAD exchange rate of 1.8805 (2014: 1.8402). Total US dollar amounts at 31 March 2015 have been converted at a GBP:USD exchange rate of 1.4847 (2014: 1.6673).
The facility is subject to a number of financial covenants including fixed cover charge, gross debt against underlying EBITDA and capital expenditure.
INTERIM PRODUCTION FINANCING The Film and Television production businesses have Canadian dollar and US dollar interim production credit facilities with various banks. Interest is charged at bank prime rate plus a margin. Amounts drawn down under these facilities at 31 March 2015 were £116.9m (2014: £63.5m). These facilities are secured by the assets of the individual Film and Television production companies.
OTHER LOANS At 31 March 2014, the Television production business had a general Canadian dollar bank facility which attracts interest at bank prime plus a margin. This facility is not secured by the assets of the individual Television production companies.
24. NET DEBT RECONCILIATION
Note
Year ended 31 March 2015
£m
(restated)Year ended
31 March 2014 £m
Balance at 1 April (165.1) (150.1)Net increase in cash and cash equivalents 36.8 3.6Net drawdown of borrowings (176.7) (39.9)Capitalised re-financing fees paid 23 2.8 0.4Amortisation of deferred finance charges 10 (1.9) (1.7)Debt acquired 27 (8.7) (2.5)Exchange differences (1.4) 25.1Balance at 31 March (314.2) (165.1)Represented by:
Cash and cash equivalents 22 71.3 38.9Interest-bearing loans and borrowings 23 (385.5) (204.0)
Net debt at 31 March 2015 of £314.2m (2014: £165.1m) is split between net borrowings under the Group’s senior debt facility (Adjusted net debt) and net borrowings secured over the assets of individual Film and Television production companies (Production net debt) as follows:
31 March 2015
£m
(restated)31 March 2014
£m
Adjusted net debt (224.9) (111.1)Production net debt (89.3) (54.0)Total (314.2) (165.1)
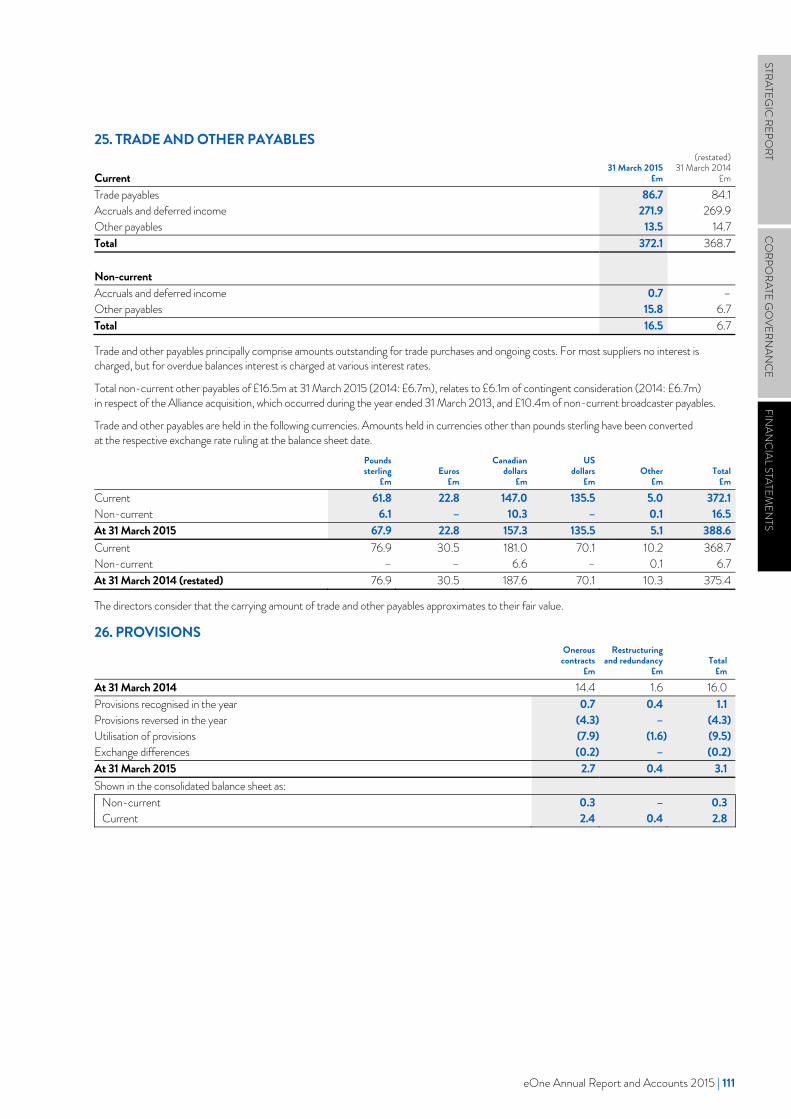
eOne Annual Report and Accounts 2015 | 111
STRATEGIC
REPORT
CO
RPORATE G
OVERN
ANC
EFIN
ANC
IAL STATEMEN
TS
eOne 2015 Annual Report and Accounts | 111
STRATEGIC
REPORT
CORPO
RATE GO
VERNAN
CEFIN
ANC
IAL STATEMEN
TS
25. TRADE AND OTHER PAYABLES
Current 31 March 2015
£m
(restated)31 March 2014
£m
Trade payables 86.7 84.1Accruals and deferred income 271.9 269.9Other payables 13.5 14.7Total 372.1 368.7 Non-current Accruals and deferred income 0.7 –Other payables 15.8 6.7Total 16.5 6.7
Trade and other payables principally comprise amounts outstanding for trade purchases and ongoing costs. For most suppliers no interest is charged, but for overdue balances interest is charged at various interest rates.
Total non-current other payables of £16.5m at 31 March 2015 (2014: £6.7m), relates to £6.1m of contingent consideration (2014: £6.7m) in respect of the Alliance acquisition, which occurred during the year ended 31 March 2013, and £10.4m of non-current broadcaster payables.
Trade and other payables are held in the following currencies. Amounts held in currencies other than pounds sterling have been converted at the respective exchange rate ruling at the balance sheet date.
Pounds sterling
£m Euros
£m
Canadian dollars
£m
US dollars
£m Other
£m Total
£m
Current 61.8 22.8 147.0 135.5 5.0 372.1Non-current 6.1 – 10.3 – 0.1 16.5At 31 March 2015 67.9 22.8 157.3 135.5 5.1 388.6Current 76.9 30.5 181.0 70.1 10.2 368.7Non-current – – 6.6 – 0.1 6.7At 31 March 2014 (restated) 76.9 30.5 187.6 70.1 10.3 375.4
The directors consider that the carrying amount of trade and other payables approximates to their fair value.
26. PROVISIONS
Onerous contracts
£m
Restructuring and redundancy
£m Total
£m
At 31 March 2014 14.4 1.6 16.0Provisions recognised in the year 0.7 0.4 1.1Provisions reversed in the year (4.3) – (4.3)Utilisation of provisions (7.9) (1.6) (9.5)Exchange differences (0.2) – (0.2)At 31 March 2015 2.7 0.4 3.1Shown in the consolidated balance sheet as:
Non-current 0.3 – 0.3Current 2.4 0.4 2.8
112 | entertainmentone.com
NOTES TO THE CONSOLIDATED FINANCIAL STATEMENTS CONTINUED FOR THE YEAR ENDED 31 MARCH 2015
112 | entertainmentone.com
26. PROVISIONS CONTINUED ONEROUS CONTRACTS Onerous contracts principally represent provisions in respect of loss-making film titles and vacant leasehold properties. Provisions for onerous contracts are recognised when the unavoidable costs of meeting the obligations under the contract exceed the economic benefits expected to be received under it and the general recognition criteria of IAS 37 Provisions, Contingent Liabilities and Contingent Assets are met.
Loss-making film titles These provisions represent future cash flows relating to film titles which are forecast to make a loss over their remaining lifetime at the balance sheet date. As required by IFRS, before a provision for an onerous film title is recognised the Group first fully writes-down any related assets (generally these are investment in acquired content rights balances).
These provisions are expected to be utilised within three years (2014: three years) from the balance sheet date.
Vacant leasehold properties Provisions for vacant leasehold properties relate to properties in Canada and are calculated by reference to an estimate of any expected sub-let income, compared to the head rent, and the possibility of disposing of the Group’s interest in the lease, taking into account conditions in the property market. Where a leasehold property is disposed of earlier than anticipated, any remaining provision balance relating to that property is released to the consolidated income statement.
These provisions are expected to be utilised within one year (2014: one year) from the balance sheet date.
RESTRUCTURING AND REDUNDANCY Restructuring and redundancy provisions represent future cash flows related to the cost of redundancy plans, outplacement, supplementary unemployment benefits and senior staff benefits. Such provisions are only recognised when restructuring or redundancy programmes are formally adopted and announced publicly and the general recognition criteria of IAS 37 Provisions, Contingent Liabilities and Contingent Assets are met.
These provisions are expected to be utilised within one year (2014: one year) from the balance sheet date.
27. BUSINESS COMBINATIONS YEAR ENDED 31 MARCH 2015 Phase 4 Films On 3 June 2014, the Group acquired 100% of the issued share capital of the Phase 4 Films group of companies (Phase 4) for a total consideration of £11.9m, comprising £7.2m cash consideration, £0.4m contingent consideration and £4.3m share consideration. For accounting purposes, the fair value of the common shares issued in the Company was based on 1,412,062 common shares at the fair value of those equity instruments at the date of exchange. This purchase was accounted for as an acquisition.
Phase 4, a leading independent film and television distributor based in Canada and the US, specialises in the sales, marketing, licensing and distribution of feature films, television and special-interest content across all media in the North American market. The acquisition provides incremental scale, growth opportunities and synergies from consolidation for the Group's Film Division.
For the reasons outlined above, combined with the ability to hire the workforce of Phase 4, including the management team, the Group paid a premium on the acquisition, giving rise to goodwill. None of the goodwill is expected to be deductible for income tax purposes.
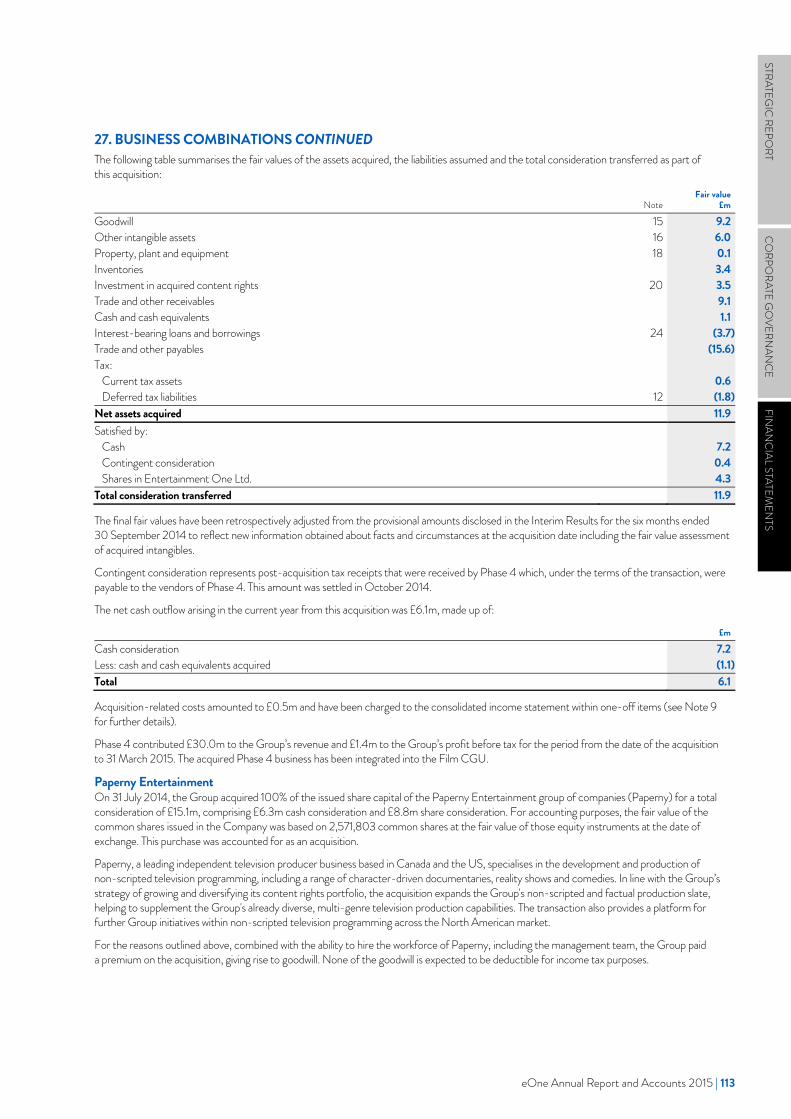
eOne Annual Report and Accounts 2015 | 113
STRATEGIC
REPORT
CO
RPORATE G
OVERN
ANC
EFIN
ANC
IAL STATEMEN
TS
eOne 2015 Annual Report and Accounts | 113
STRATEGIC
REPORT
CORPO
RATE GO
VERNAN
CEFIN
ANC
IAL STATEMEN
TS
27. BUSINESS COMBINATIONS CONTINUED The following table summarises the fair values of the assets acquired, the liabilities assumed and the total consideration transferred as part of this acquisition:
Note Fair value
£m
Goodwill 15 9.2Other intangible assets 16 6.0Property, plant and equipment 18 0.1Inventories 3.4Investment in acquired content rights 20 3.5Trade and other receivables 9.1Cash and cash equivalents 1.1Interest-bearing loans and borrowings 24 (3.7)Trade and other payables (15.6)Tax:
Current tax assets 0.6Deferred tax liabilities 12 (1.8)
Net assets acquired 11.9Satisfied by:
Cash 7.2Contingent consideration 0.4Shares in Entertainment One Ltd. 4.3
Total consideration transferred 11.9
The final fair values have been retrospectively adjusted from the provisional amounts disclosed in the Interim Results for the six months ended 30 September 2014 to reflect new information obtained about facts and circumstances at the acquisition date including the fair value assessment of acquired intangibles.
Contingent consideration represents post-acquisition tax receipts that were received by Phase 4 which, under the terms of the transaction, were payable to the vendors of Phase 4. This amount was settled in October 2014.
The net cash outflow arising in the current year from this acquisition was £6.1m, made up of:
£m
Cash consideration 7.2Less: cash and cash equivalents acquired (1.1)Total 6.1
Acquisition-related costs amounted to £0.5m and have been charged to the consolidated income statement within one-off items (see Note 9 for further details).
Phase 4 contributed £30.0m to the Group’s revenue and £1.4m to the Group’s profit before tax for the period from the date of the acquisition to 31 March 2015. The acquired Phase 4 business has been integrated into the Film CGU.
Paperny Entertainment On 31 July 2014, the Group acquired 100% of the issued share capital of the Paperny Entertainment group of companies (Paperny) for a total consideration of £15.1m, comprising £6.3m cash consideration and £8.8m share consideration. For accounting purposes, the fair value of the common shares issued in the Company was based on 2,571,803 common shares at the fair value of those equity instruments at the date of exchange. This purchase was accounted for as an acquisition.
Paperny, a leading independent television producer business based in Canada and the US, specialises in the development and production of non-scripted television programming, including a range of character-driven documentaries, reality shows and comedies. In line with the Group’s strategy of growing and diversifying its content rights portfolio, the acquisition expands the Group's non-scripted and factual production slate, helping to supplement the Group's already diverse, multi-genre television production capabilities. The transaction also provides a platform for further Group initiatives within non-scripted television programming across the North American market.
For the reasons outlined above, combined with the ability to hire the workforce of Paperny, including the management team, the Group paid a premium on the acquisition, giving rise to goodwill. None of the goodwill is expected to be deductible for income tax purposes.
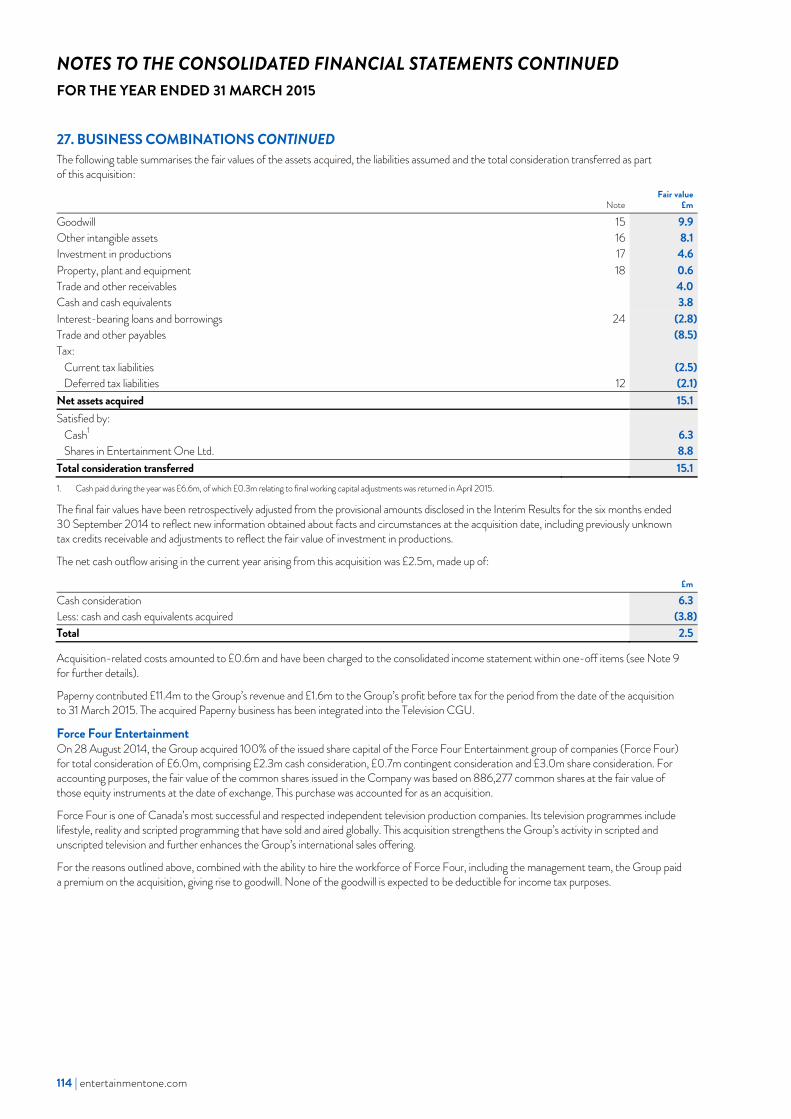
114 | entertainmentone.com
NOTES TO THE CONSOLIDATED FINANCIAL STATEMENTS CONTINUED FOR THE YEAR ENDED 31 MARCH 2015
114 | entertainmentone.com
27. BUSINESS COMBINATIONS CONTINUED The following table summarises the fair values of the assets acquired, the liabilities assumed and the total consideration transferred as part of this acquisition:
Note Fair value
£m
Goodwill 15 9.9Other intangible assets 16 8.1Investment in productions 17 4.6Property, plant and equipment 18 0.6Trade and other receivables 4.0Cash and cash equivalents 3.8Interest-bearing loans and borrowings 24 (2.8)Trade and other payables (8.5)Tax:
Current tax liabilities (2.5)Deferred tax liabilities 12 (2.1)
Net assets acquired 15.1Satisfied by:
Cash1 6.3Shares in Entertainment One Ltd. 8.8
Total consideration transferred 15.11. Cash paid during the year was £6.6m, of which £0.3m relating to final working capital adjustments was returned in April 2015.
The final fair values have been retrospectively adjusted from the provisional amounts disclosed in the Interim Results for the six months ended 30 September 2014 to reflect new information obtained about facts and circumstances at the acquisition date, including previously unknown tax credits receivable and adjustments to reflect the fair value of investment in productions.
The net cash outflow arising in the current year arising from this acquisition was £2.5m, made up of:
£m
Cash consideration 6.3Less: cash and cash equivalents acquired (3.8)Total 2.5
Acquisition-related costs amounted to £0.6m and have been charged to the consolidated income statement within one-off items (see Note 9 for further details).
Paperny contributed £11.4m to the Group’s revenue and £1.6m to the Group’s profit before tax for the period from the date of the acquisition to 31 March 2015. The acquired Paperny business has been integrated into the Television CGU.
Force Four Entertainment On 28 August 2014, the Group acquired 100% of the issued share capital of the Force Four Entertainment group of companies (Force Four) for total consideration of £6.0m, comprising £2.3m cash consideration, £0.7m contingent consideration and £3.0m share consideration. For accounting purposes, the fair value of the common shares issued in the Company was based on 886,277 common shares at the fair value of those equity instruments at the date of exchange. This purchase was accounted for as an acquisition.
Force Four is one of Canada’s most successful and respected independent television production companies. Its television programmes include lifestyle, reality and scripted programming that have sold and aired globally. This acquisition strengthens the Group’s activity in scripted and unscripted television and further enhances the Group’s international sales offering.
For the reasons outlined above, combined with the ability to hire the workforce of Force Four, including the management team, the Group paid a premium on the acquisition, giving rise to goodwill. None of the goodwill is expected to be deductible for income tax purposes.
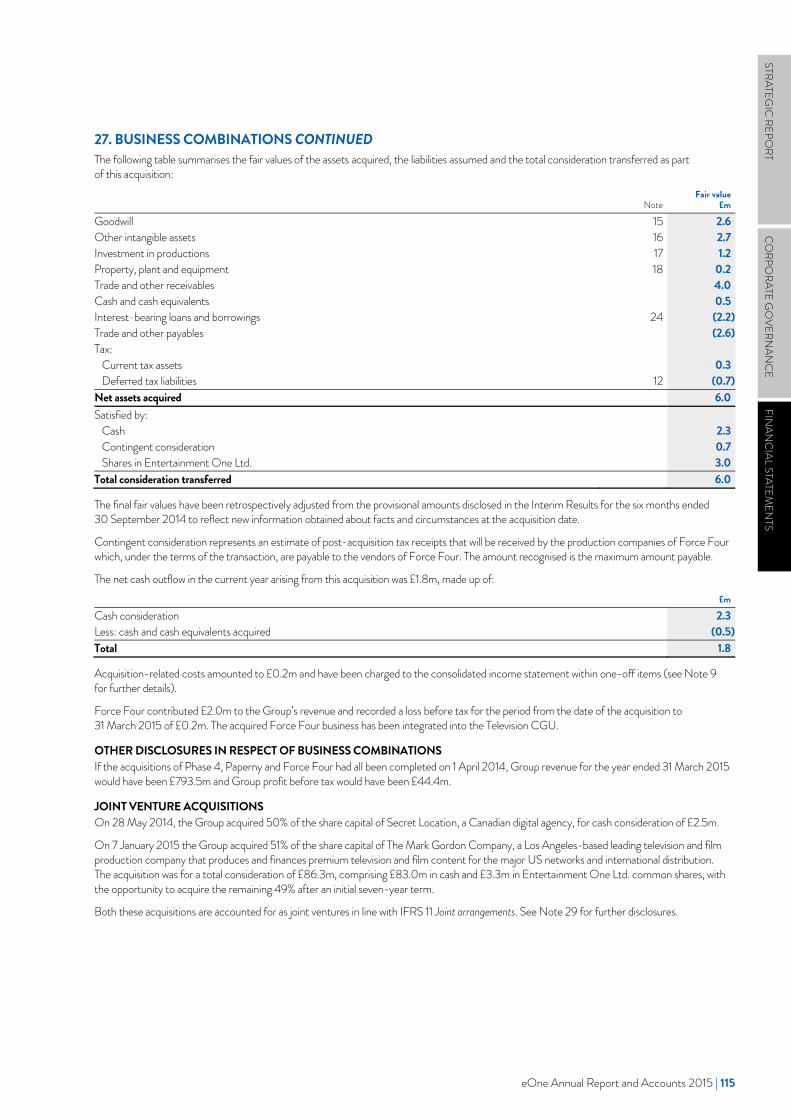
eOne Annual Report and Accounts 2015 | 115
STRATEGIC
REPORT
CO
RPORATE G
OVERN
ANC
EFIN
ANC
IAL STATEMEN
TS
eOne 2015 Annual Report and Accounts | 115
STRATEGIC
REPORT
CORPO
RATE GO
VERNAN
CEFIN
ANC
IAL STATEMEN
TS
27. BUSINESS COMBINATIONS CONTINUED The following table summarises the fair values of the assets acquired, the liabilities assumed and the total consideration transferred as part of this acquisition:
Note Fair value
£m
Goodwill 15 2.6Other intangible assets 16 2.7Investment in productions 17 1.2Property, plant and equipment 18 0.2Trade and other receivables 4.0Cash and cash equivalents 0.5Interest-bearing loans and borrowings 24 (2.2)Trade and other payables (2.6)Tax:
Current tax assets 0.3Deferred tax liabilities 12 (0.7)
Net assets acquired 6.0Satisfied by:
Cash 2.3Contingent consideration 0.7Shares in Entertainment One Ltd. 3.0
Total consideration transferred 6.0
The final fair values have been retrospectively adjusted from the provisional amounts disclosed in the Interim Results for the six months ended 30 September 2014 to reflect new information obtained about facts and circumstances at the acquisition date.
Contingent consideration represents an estimate of post-acquisition tax receipts that will be received by the production companies of Force Four which, under the terms of the transaction, are payable to the vendors of Force Four. The amount recognised is the maximum amount payable.
The net cash outflow in the current year arising from this acquisition was £1.8m, made up of: £m
Cash consideration 2.3Less: cash and cash equivalents acquired (0.5)Total 1.8
Acquisition-related costs amounted to £0.2m and have been charged to the consolidated income statement within one-off items (see Note 9 for further details).
Force Four contributed £2.0m to the Group’s revenue and recorded a loss before tax for the period from the date of the acquisition to 31 March 2015 of £0.2m. The acquired Force Four business has been integrated into the Television CGU.
OTHER DISCLOSURES IN RESPECT OF BUSINESS COMBINATIONS If the acquisitions of Phase 4, Paperny and Force Four had all been completed on 1 April 2014, Group revenue for the year ended 31 March 2015 would have been £793.5m and Group profit before tax would have been £44.4m.
JOINT VENTURE ACQUISITIONS On 28 May 2014, the Group acquired 50% of the share capital of Secret Location, a Canadian digital agency, for cash consideration of £2.5m.
On 7 January 2015 the Group acquired 51% of the share capital of The Mark Gordon Company, a Los Angeles-based leading television and film production company that produces and finances premium television and film content for the major US networks and international distribution. The acquisition was for a total consideration of £86.3m, comprising £83.0m in cash and £3.3m in Entertainment One Ltd. common shares, with the opportunity to acquire the remaining 49% after an initial seven-year term.
Both these acquisitions are accounted for as joint ventures in line with IFRS 11 Joint arrangements. See Note 29 for further disclosures.
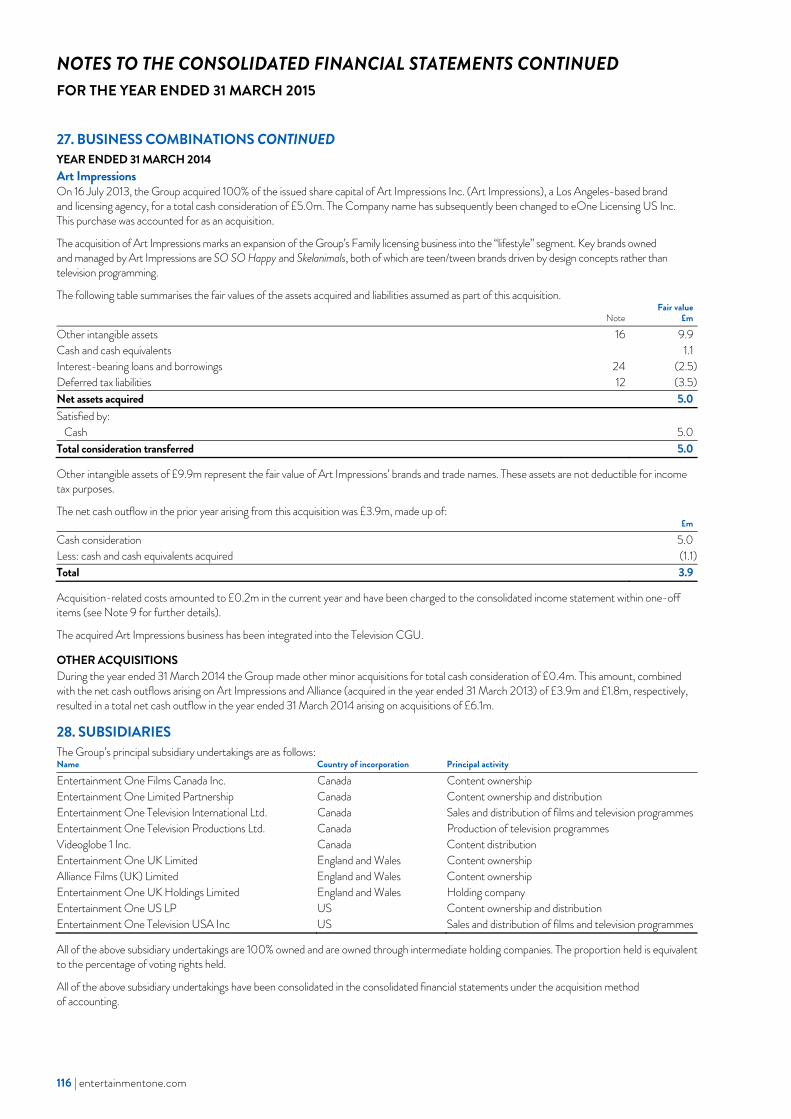
116 | entertainmentone.com
NOTES TO THE CONSOLIDATED FINANCIAL STATEMENTS CONTINUED FOR THE YEAR ENDED 31 MARCH 2015
116 | entertainmentone.com
27. BUSINESS COMBINATIONS CONTINUED YEAR ENDED 31 MARCH 2014 Art Impressions On 16 July 2013, the Group acquired 100% of the issued share capital of Art Impressions Inc. (Art Impressions), a Los Angeles-based brand and licensing agency, for a total cash consideration of £5.0m. The Company name has subsequently been changed to eOne Licensing US Inc. This purchase was accounted for as an acquisition.
The acquisition of Art Impressions marks an expansion of the Group’s Family licensing business into the “lifestyle” segment. Key brands owned and managed by Art Impressions are SO SO Happy and Skelanimals, both of which are teen/tween brands driven by design concepts rather than television programming.
The following table summarises the fair values of the assets acquired and liabilities assumed as part of this acquisition.
Note Fair value
£m
Other intangible assets 16 9.9Cash and cash equivalents 1.1Interest-bearing loans and borrowings 24 (2.5)Deferred tax liabilities 12 (3.5)Net assets acquired 5.0Satisfied by:
Cash 5.0Total consideration transferred 5.0
Other intangible assets of £9.9m represent the fair value of Art Impressions’ brands and trade names. These assets are not deductible for income tax purposes.
The net cash outflow in the prior year arising from this acquisition was £3.9m, made up of: £m
Cash consideration 5.0Less: cash and cash equivalents acquired (1.1)Total 3.9
Acquisition-related costs amounted to £0.2m in the current year and have been charged to the consolidated income statement within one-off items (see Note 9 for further details).
The acquired Art Impressions business has been integrated into the Television CGU.
OTHER ACQUISITIONS During the year ended 31 March 2014 the Group made other minor acquisitions for total cash consideration of £0.4m. This amount, combined with the net cash outflows arising on Art Impressions and Alliance (acquired in the year ended 31 March 2013) of £3.9m and £1.8m, respectively, resulted in a total net cash outflow in the year ended 31 March 2014 arising on acquisitions of £6.1m.
28. SUBSIDIARIES The Group’s principal subsidiary undertakings are as follows: Name Country of incorporation Principal activity
Entertainment One Films Canada Inc. Canada Content ownershipEntertainment One Limited Partnership Canada Content ownership and distribution Entertainment One Television International Ltd. Canada Sales and distribution of films and television programmesEntertainment One Television Productions Ltd. Canada Production of television programmes Videoglobe 1 Inc. Canada Content distributionEntertainment One UK Limited England and Wales Content ownershipAlliance Films (UK) Limited England and Wales Content ownershipEntertainment One UK Holdings Limited England and Wales Holding companyEntertainment One US LP US Content ownership and distribution Entertainment One Television USA Inc US Sales and distribution of films and television programmes
All of the above subsidiary undertakings are 100% owned and are owned through intermediate holding companies. The proportion held is equivalent to the percentage of voting rights held.
All of the above subsidiary undertakings have been consolidated in the consolidated financial statements under the acquisition method of accounting.
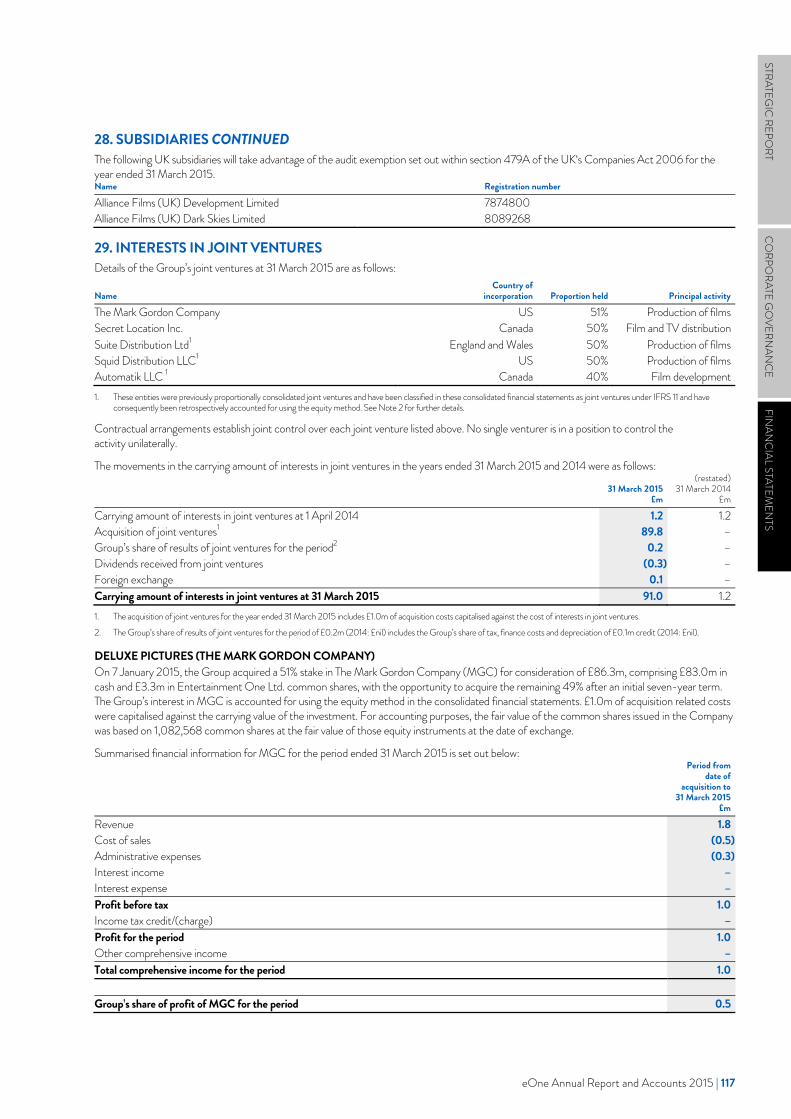
eOne Annual Report and Accounts 2015 | 117
STRATEGIC
REPORT
CO
RPORATE G
OVERN
ANC
EFIN
ANC
IAL STATEMEN
TS
eOne 2015 Annual Report and Accounts | 117
STRATEGIC
REPORT
CORPO
RATE GO
VERNAN
CEFIN
ANC
IAL STATEMEN
TS
28. SUBSIDIARIES CONTINUED The following UK subsidiaries will take advantage of the audit exemption set out within section 479A of the UK‘s Companies Act 2006 for the year ended 31 March 2015. Name Registration number
Alliance Films (UK) Development Limited 7874800Alliance Films (UK) Dark Skies Limited 8089268
29. INTERESTS IN JOINT VENTURES Details of the Group’s joint ventures at 31 March 2015 are as follows:
Name Country of
incorporation Proportion held Principal activity
The Mark Gordon Company US 51% Production of filmsSecret Location Inc. Canada 50% Film and TV distributionSuite Distribution Ltd1 England and Wales 50% Production of filmsSquid Distribution LLC1 US 50% Production of filmsAutomatik LLC 1 Canada 40% Film development1. These entities were previously proportionally consolidated joint ventures and have been classified in these consolidated financial statements as joint ventures under IFRS 11 and have
consequently been retrospectively accounted for using the equity method. See Note 2 for further details.
Contractual arrangements establish joint control over each joint venture listed above. No single venturer is in a position to control the activity unilaterally.
The movements in the carrying amount of interests in joint ventures in the years ended 31 March 2015 and 2014 were as follows:
31 March 2015
£m
(restated)31 March 2014
£m
Carrying amount of interests in joint ventures at 1 April 2014 1.2 1.2Acquisition of joint ventures1 89.8 –Group’s share of results of joint ventures for the period2 0.2 –Dividends received from joint ventures (0.3) –Foreign exchange 0.1 –Carrying amount of interests in joint ventures at 31 March 2015 91.0 1.21. The acquisition of joint ventures for the year ended 31 March 2015 includes £1.0m of acquisition costs capitalised against the cost of interests in joint ventures.
2. The Group’s share of results of joint ventures for the period of £0.2m (2014: £nil) includes the Group’s share of tax, finance costs and depreciation of £0.1m credit (2014: £nil).
DELUXE PICTURES (THE MARK GORDON COMPANY) On 7 January 2015, the Group acquired a 51% stake in The Mark Gordon Company (MGC) for consideration of £86.3m, comprising £83.0m in cash and £3.3m in Entertainment One Ltd. common shares, with the opportunity to acquire the remaining 49% after an initial seven-year term. The Group’s interest in MGC is accounted for using the equity method in the consolidated financial statements. £1.0m of acquisition related costs were capitalised against the carrying value of the investment. For accounting purposes, the fair value of the common shares issued in the Company was based on 1,082,568 common shares at the fair value of those equity instruments at the date of exchange.
Summarised financial information for MGC for the period ended 31 March 2015 is set out below:
Period from date of
acquisition to 31 March 2015
£m
Revenue 1.8Cost of sales (0.5)Administrative expenses (0.3)Interest income –Interest expense –Profit before tax 1.0Income tax credit/(charge) –Profit for the period 1.0Other comprehensive income –Total comprehensive income for the period 1.0 Group’s share of profit of MGC for the period 0.5
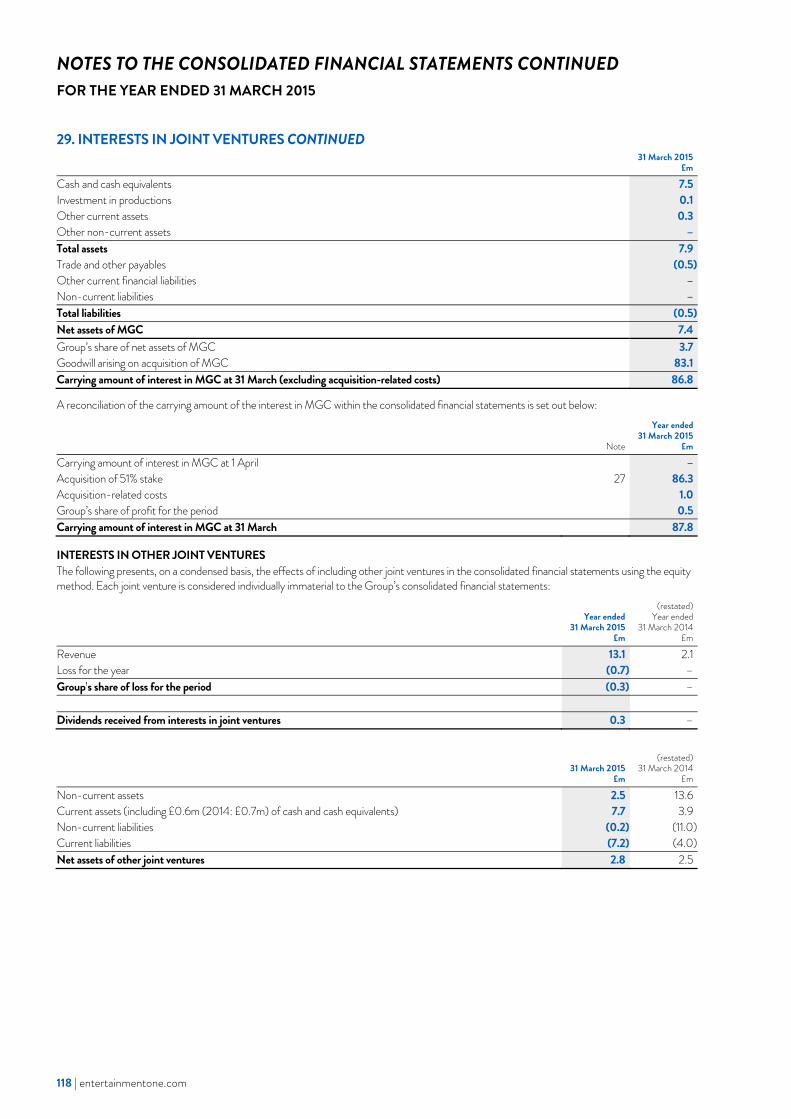
118 | entertainmentone.com
NOTES TO THE CONSOLIDATED FINANCIAL STATEMENTS CONTINUED FOR THE YEAR ENDED 31 MARCH 2015
118 | entertainmentone.com
29. INTERESTS IN JOINT VENTURES CONTINUED
31 March 2015
£m
Cash and cash equivalents 7.5Investment in productions 0.1Other current assets 0.3Other non-current assets –Total assets 7.9Trade and other payables (0.5)Other current financial liabilities –Non-current liabilities –Total liabilities (0.5)Net assets of MGC 7.4Group’s share of net assets of MGC 3.7Goodwill arising on acquisition of MGC 83.1Carrying amount of interest in MGC at 31 March (excluding acquisition-related costs) 86.8
A reconciliation of the carrying amount of the interest in MGC within the consolidated financial statements is set out below:
Note
Year ended31 March 2015
£m
Carrying amount of interest in MGC at 1 April –Acquisition of 51% stake 27 86.3Acquisition-related costs 1.0Group’s share of profit for the period 0.5Carrying amount of interest in MGC at 31 March 87.8
INTERESTS IN OTHER JOINT VENTURES The following presents, on a condensed basis, the effects of including other joint ventures in the consolidated financial statements using the equity method. Each joint venture is considered individually immaterial to the Group’s consolidated financial statements:
Year ended 31 March 2015
£m
(restated)Year ended
31 March 2014£m
Revenue 13.1 2.1Loss for the year (0.7) –Group’s share of loss for the period (0.3) – Dividends received from interests in joint ventures 0.3 –
31 March 2015
£m
(restated)31 March 2014
£m
Non-current assets 2.5 13.6Current assets (including £0.6m (2014: £0.7m) of cash and cash equivalents) 7.7 3.9Non-current liabilities (0.2) (11.0)Current liabilities (7.2) (4.0)Net assets of other joint ventures 2.8 2.5
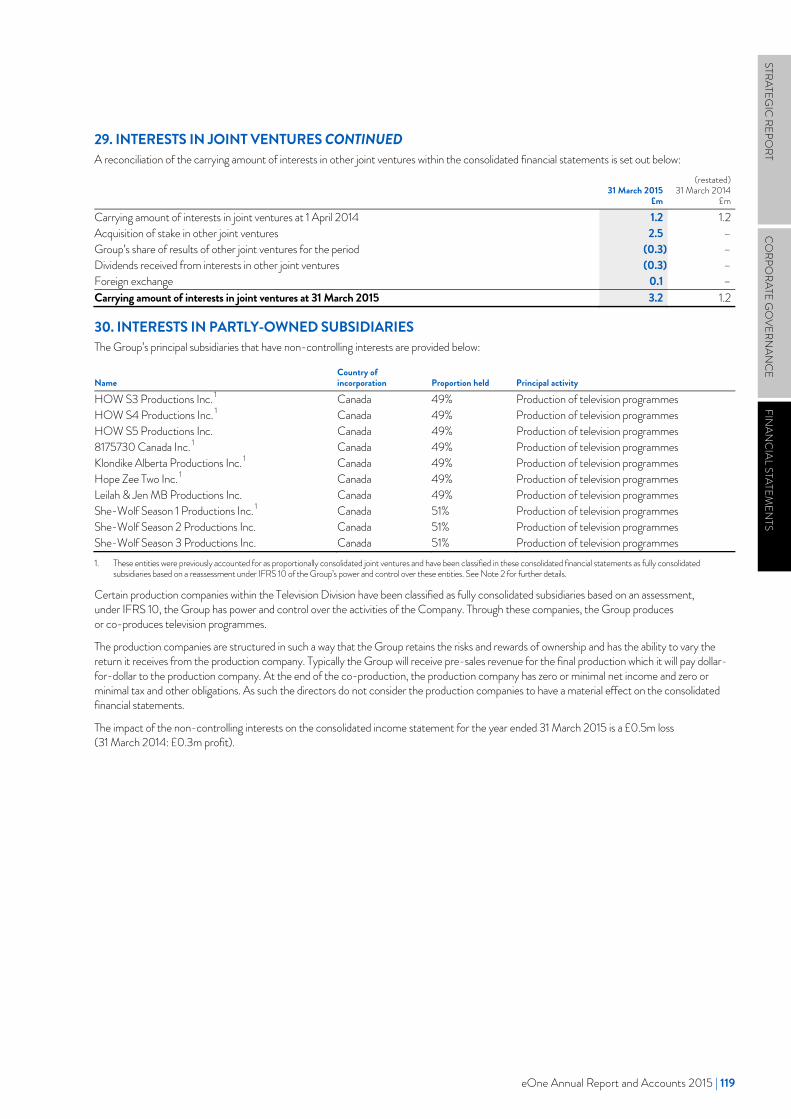
eOne Annual Report and Accounts 2015 | 119
STRATEGIC
REPORT
CO
RPORATE G
OVERN
ANC
EFIN
ANC
IAL STATEMEN
TS
eOne 2015 Annual Report and Accounts | 119
STRATEGIC
REPORT
CORPO
RATE GO
VERNAN
CEFIN
ANC
IAL STATEMEN
TS
29. INTERESTS IN JOINT VENTURES CONTINUED A reconciliation of the carrying amount of interests in other joint ventures within the consolidated financial statements is set out below:
31 March 2015
£m
(restated)31 March 2014
£m
Carrying amount of interests in joint ventures at 1 April 2014 1.2 1.2Acquisition of stake in other joint ventures 2.5 –Group’s share of results of other joint ventures for the period (0.3) –Dividends received from interests in other joint ventures (0.3) –Foreign exchange 0.1 –Carrying amount of interests in joint ventures at 31 March 2015 3.2 1.2
30. INTERESTS IN PARTLY-OWNED SUBSIDIARIES The Group’s principal subsidiaries that have non-controlling interests are provided below:
Name Country of incorporation Proportion held Principal activity
HOW S3 Productions Inc. 1 Canada 49% Production of television programmesHOW S4 Productions Inc. 1 Canada 49% Production of television programmesHOW S5 Productions Inc. Canada 49% Production of television programmes8175730 Canada Inc. 1 Canada 49% Production of television programmesKlondike Alberta Productions Inc. 1 Canada 49% Production of television programmesHope Zee Two Inc. 1 Canada 49% Production of television programmesLeilah & Jen MB Productions Inc. Canada 49% Production of television programmesShe-Wolf Season 1 Productions Inc. 1 Canada 51% Production of television programmesShe-Wolf Season 2 Productions Inc. Canada 51% Production of television programmesShe-Wolf Season 3 Productions Inc. Canada 51% Production of television programmes1. These entities were previously accounted for as proportionally consolidated joint ventures and have been classified in these consolidated financial statements as fully consolidated
subsidiaries based on a reassessment under IFRS 10 of the Group’s power and control over these entities. See Note 2 for further details.
Certain production companies within the Television Division have been classified as fully consolidated subsidiaries based on an assessment, under IFRS 10, the Group has power and control over the activities of the Company. Through these companies, the Group produces or co-produces television programmes.
The production companies are structured in such a way that the Group retains the risks and rewards of ownership and has the ability to vary the return it receives from the production company. Typically the Group will receive pre-sales revenue for the final production which it will pay dollar-for-dollar to the production company. At the end of the co-production, the production company has zero or minimal net income and zero or minimal tax and other obligations. As such the directors do not consider the production companies to have a material effect on the consolidated financial statements.
The impact of the non-controlling interests on the consolidated income statement for the year ended 31 March 2015 is a £0.5m loss (31 March 2014: £0.3m profit).
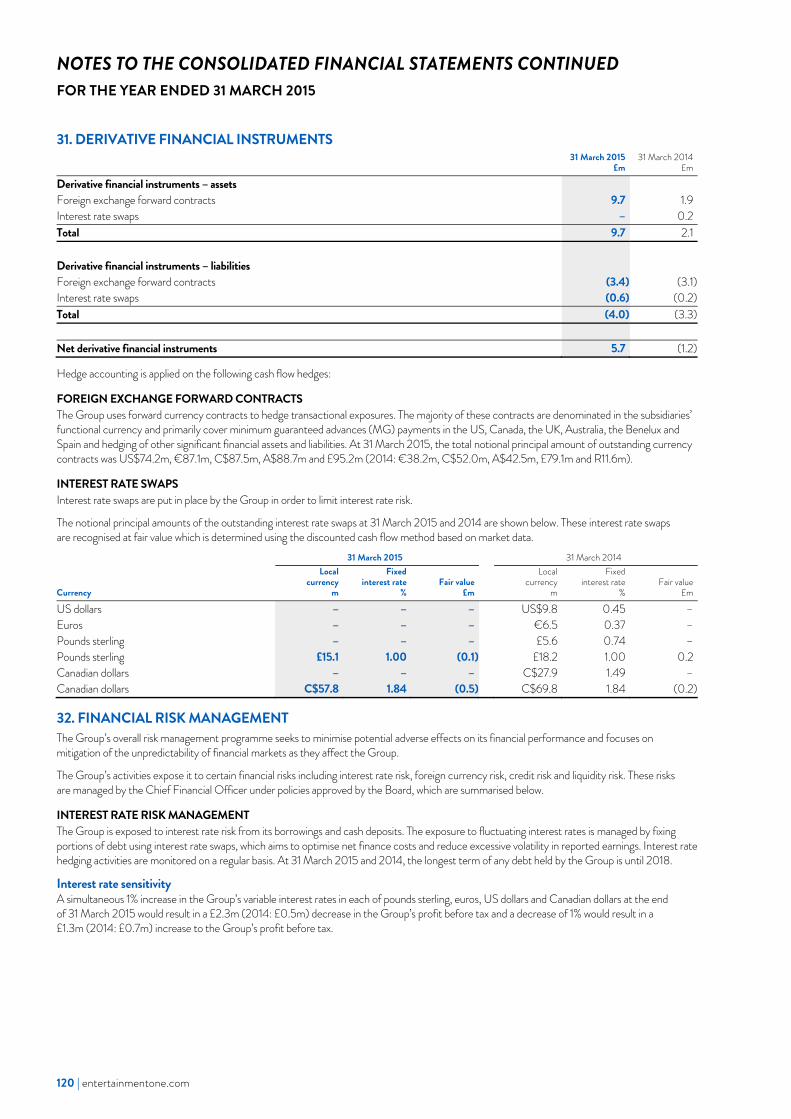
120 | entertainmentone.com
NOTES TO THE CONSOLIDATED FINANCIAL STATEMENTS CONTINUED FOR THE YEAR ENDED 31 MARCH 2015
120 | entertainmentone.com
31. DERIVATIVE FINANCIAL INSTRUMENTS
31 March 2015
£m 31 March 2014
£m
Derivative financial instruments – assets Foreign exchange forward contracts 9.7 1.9Interest rate swaps – 0.2Total 9.7 2.1 Derivative financial instruments – liabilities Foreign exchange forward contracts (3.4) (3.1)Interest rate swaps (0.6) (0.2)Total (4.0) (3.3) Net derivative financial instruments 5.7 (1.2)
Hedge accounting is applied on the following cash flow hedges:
FOREIGN EXCHANGE FORWARD CONTRACTS The Group uses forward currency contracts to hedge transactional exposures. The majority of these contracts are denominated in the subsidiaries’ functional currency and primarily cover minimum guaranteed advances (MG) payments in the US, Canada, the UK, Australia, the Benelux and Spain and hedging of other significant financial assets and liabilities. At 31 March 2015, the total notional principal amount of outstanding currency contracts was US$74.2m, €87.1m, C$87.5m, A$88.7m and £95.2m (2014: €38.2m, C$52.0m, A$42.5m, £79.1m and R11.6m).
INTEREST RATE SWAPS Interest rate swaps are put in place by the Group in order to limit interest rate risk.
The notional principal amounts of the outstanding interest rate swaps at 31 March 2015 and 2014 are shown below. These interest rate swaps are recognised at fair value which is determined using the discounted cash flow method based on market data.
31 March 2015 31 March 2014
Currency
Local currency
m
Fixed interest rate
% Fair value
£m
Local currency
m
Fixed interest rate
% Fair value
£m
US dollars – – – US$9.8 0.45 –Euros – – – €6.5 0.37 –Pounds sterling – – – £5.6 0.74 –Pounds sterling £15.1 1.00 (0.1) £18.2 1.00 0.2Canadian dollars – – – C$27.9 1.49 –Canadian dollars C$57.8 1.84 (0.5) C$69.8 1.84 (0.2)
32. FINANCIAL RISK MANAGEMENT The Group’s overall risk management programme seeks to minimise potential adverse effects on its financial performance and focuses on mitigation of the unpredictability of financial markets as they affect the Group.
The Group’s activities expose it to certain financial risks including interest rate risk, foreign currency risk, credit risk and liquidity risk. These risks are managed by the Chief Financial Officer under policies approved by the Board, which are summarised below.
INTEREST RATE RISK MANAGEMENT The Group is exposed to interest rate risk from its borrowings and cash deposits. The exposure to fluctuating interest rates is managed by fixing portions of debt using interest rate swaps, which aims to optimise net finance costs and reduce excessive volatility in reported earnings. Interest rate hedging activities are monitored on a regular basis. At 31 March 2015 and 2014, the longest term of any debt held by the Group is until 2018.
Interest rate sensitivity A simultaneous 1% increase in the Group’s variable interest rates in each of pounds sterling, euros, US dollars and Canadian dollars at the end of 31 March 2015 would result in a £2.3m (2014: £0.5m) decrease in the Group’s profit before tax and a decrease of 1% would result in a £1.3m (2014: £0.7m) increase to the Group’s profit before tax.
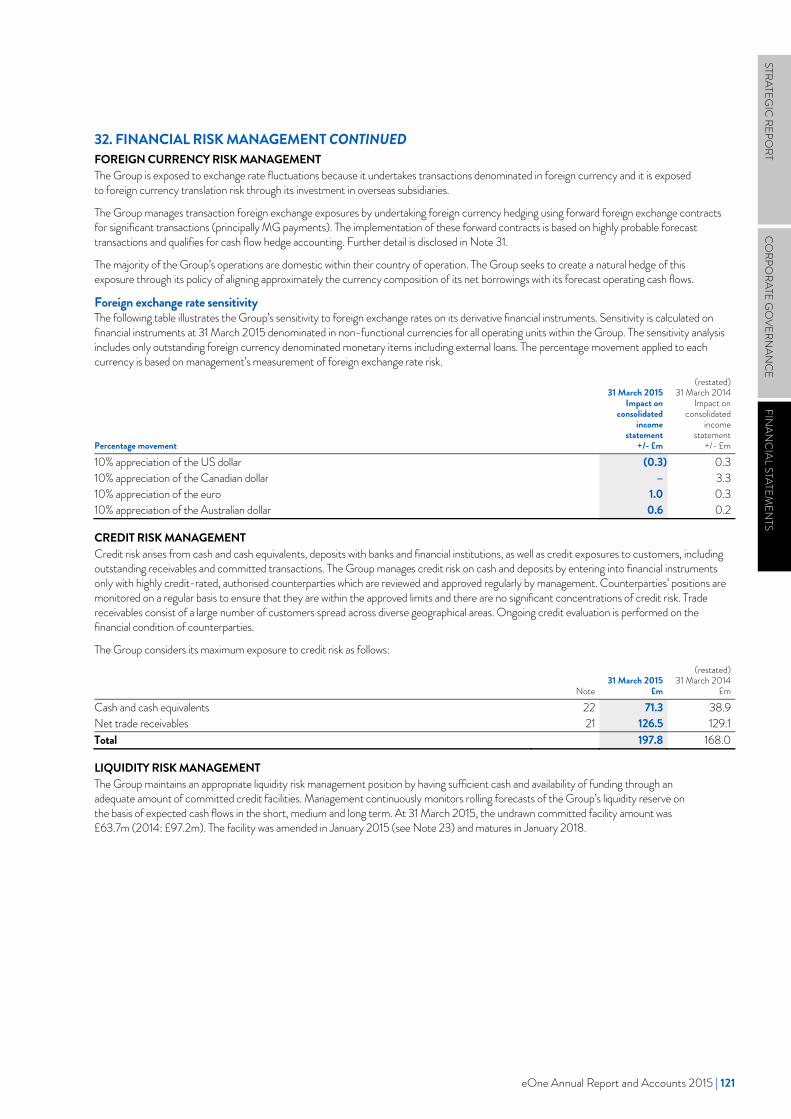
eOne Annual Report and Accounts 2015 | 121
STRATEGIC
REPORT
CO
RPORATE G
OVERN
ANC
EFIN
ANC
IAL STATEMEN
TS
eOne 2015 Annual Report and Accounts | 121
STRATEGIC
REPORT
CORPO
RATE GO
VERNAN
CEFIN
ANC
IAL STATEMEN
TS
32. FINANCIAL RISK MANAGEMENT CONTINUED FOREIGN CURRENCY RISK MANAGEMENT The Group is exposed to exchange rate fluctuations because it undertakes transactions denominated in foreign currency and it is exposed to foreign currency translation risk through its investment in overseas subsidiaries.
The Group manages transaction foreign exchange exposures by undertaking foreign currency hedging using forward foreign exchange contracts for significant transactions (principally MG payments). The implementation of these forward contracts is based on highly probable forecast transactions and qualifies for cash flow hedge accounting. Further detail is disclosed in Note 31.
The majority of the Group’s operations are domestic within their country of operation. The Group seeks to create a natural hedge of this exposure through its policy of aligning approximately the currency composition of its net borrowings with its forecast operating cash flows.
Foreign exchange rate sensitivity The following table illustrates the Group’s sensitivity to foreign exchange rates on its derivative financial instruments. Sensitivity is calculated on financial instruments at 31 March 2015 denominated in non-functional currencies for all operating units within the Group. The sensitivity analysis includes only outstanding foreign currency denominated monetary items including external loans. The percentage movement applied to each currency is based on management’s measurement of foreign exchange rate risk.
Percentage movement
31 March 2015Impact on
consolidated income
statement+/- £m
(restated)31 March 2014
Impact on consolidated
incomestatement
+/- £m
10% appreciation of the US dollar (0.3) 0.310% appreciation of the Canadian dollar – 3.310% appreciation of the euro 1.0 0.310% appreciation of the Australian dollar 0.6 0.2
CREDIT RISK MANAGEMENT Credit risk arises from cash and cash equivalents, deposits with banks and financial institutions, as well as credit exposures to customers, including outstanding receivables and committed transactions. The Group manages credit risk on cash and deposits by entering into financial instruments only with highly credit-rated, authorised counterparties which are reviewed and approved regularly by management. Counterparties’ positions are monitored on a regular basis to ensure that they are within the approved limits and there are no significant concentrations of credit risk. Trade receivables consist of a large number of customers spread across diverse geographical areas. Ongoing credit evaluation is performed on the financial condition of counterparties.
The Group considers its maximum exposure to credit risk as follows:
Note 31 March 2015
£m
(restated)31 March 2014
£m
Cash and cash equivalents 22 71.3 38.9Net trade receivables 21 126.5 129.1Total 197.8 168.0
LIQUIDITY RISK MANAGEMENT The Group maintains an appropriate liquidity risk management position by having sufficient cash and availability of funding through an adequate amount of committed credit facilities. Management continuously monitors rolling forecasts of the Group’s liquidity reserve on the basis of expected cash flows in the short, medium and long term. At 31 March 2015, the undrawn committed facility amount was £63.7m (2014: £97.2m). The facility was amended in January 2015 (see Note 23) and matures in January 2018.
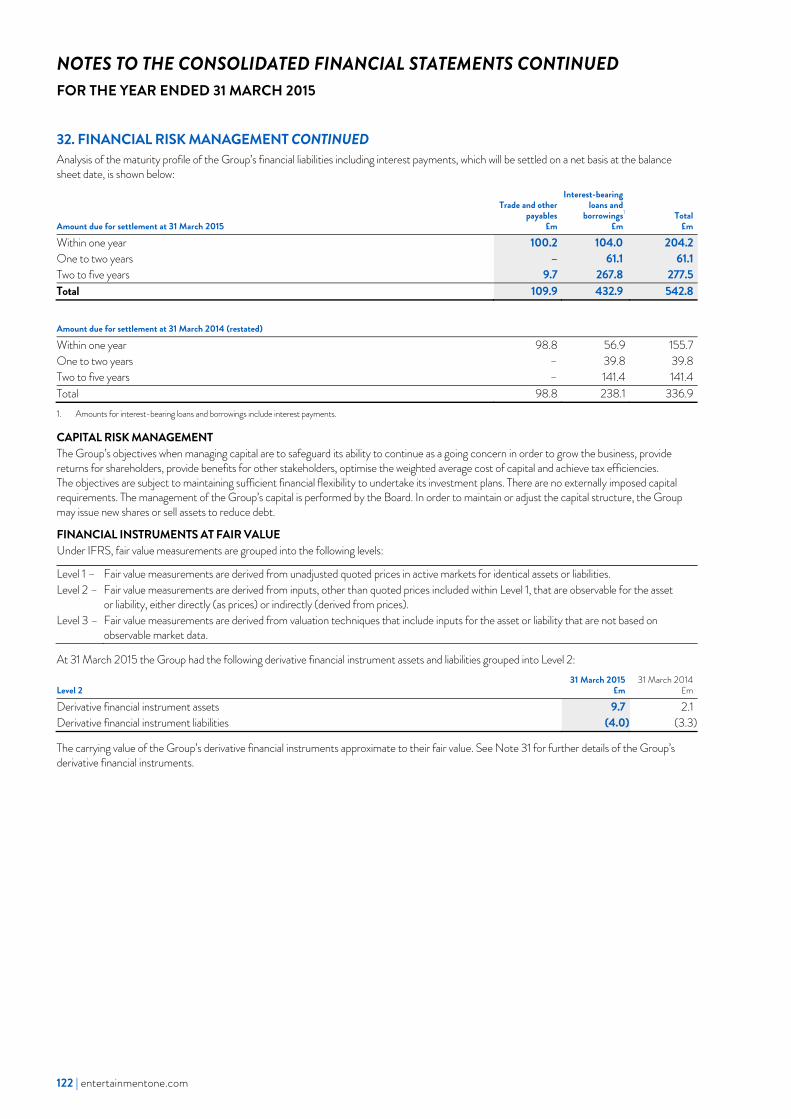
122 | entertainmentone.com
NOTES TO THE CONSOLIDATED FINANCIAL STATEMENTS CONTINUED FOR THE YEAR ENDED 31 MARCH 2015
122 | entertainmentone.com
32. FINANCIAL RISK MANAGEMENT CONTINUED Analysis of the maturity profile of the Group’s financial liabilities including interest payments, which will be settled on a net basis at the balance sheet date, is shown below:
Amount due for settlement at 31 March 2015
Trade and other payables
£m
Interest-bearing loans and
borrowings1 £m
Total £m
Within one year 100.2 104.0 204.2One to two years – 61.1 61.1Two to five years 9.7 267.8 277.5Total 109.9 432.9 542.8 Amount due for settlement at 31 March 2014 (restated)
Within one year 98.8 56.9 155.7One to two years – 39.8 39.8Two to five years – 141.4 141.4Total 98.8 238.1 336.91. Amounts for interest-bearing loans and borrowings include interest payments.
CAPITAL RISK MANAGEMENT The Group’s objectives when managing capital are to safeguard its ability to continue as a going concern in order to grow the business, provide returns for shareholders, provide benefits for other stakeholders, optimise the weighted average cost of capital and achieve tax efficiencies. The objectives are subject to maintaining sufficient financial flexibility to undertake its investment plans. There are no externally imposed capital requirements. The management of the Group’s capital is performed by the Board. In order to maintain or adjust the capital structure, the Group may issue new shares or sell assets to reduce debt.
FINANCIAL INSTRUMENTS AT FAIR VALUE Under IFRS, fair value measurements are grouped into the following levels:
Level 1 – Fair value measurements are derived from unadjusted quoted prices in active markets for identical assets or liabilities. Level 2 – Fair value measurements are derived from inputs, other than quoted prices included within Level 1, that are observable for the asset
or liability, either directly (as prices) or indirectly (derived from prices). Level 3 – Fair value measurements are derived from valuation techniques that include inputs for the asset or liability that are not based on
observable market data.
At 31 March 2015 the Group had the following derivative financial instrument assets and liabilities grouped into Level 2:
Level 2 31 March 2015
£m 31 March 2014
£m
Derivative financial instrument assets 9.7 2.1Derivative financial instrument liabilities (4.0) (3.3)
The carrying value of the Group’s derivative financial instruments approximate to their fair value. See Note 31 for further details of the Group’s derivative financial instruments.
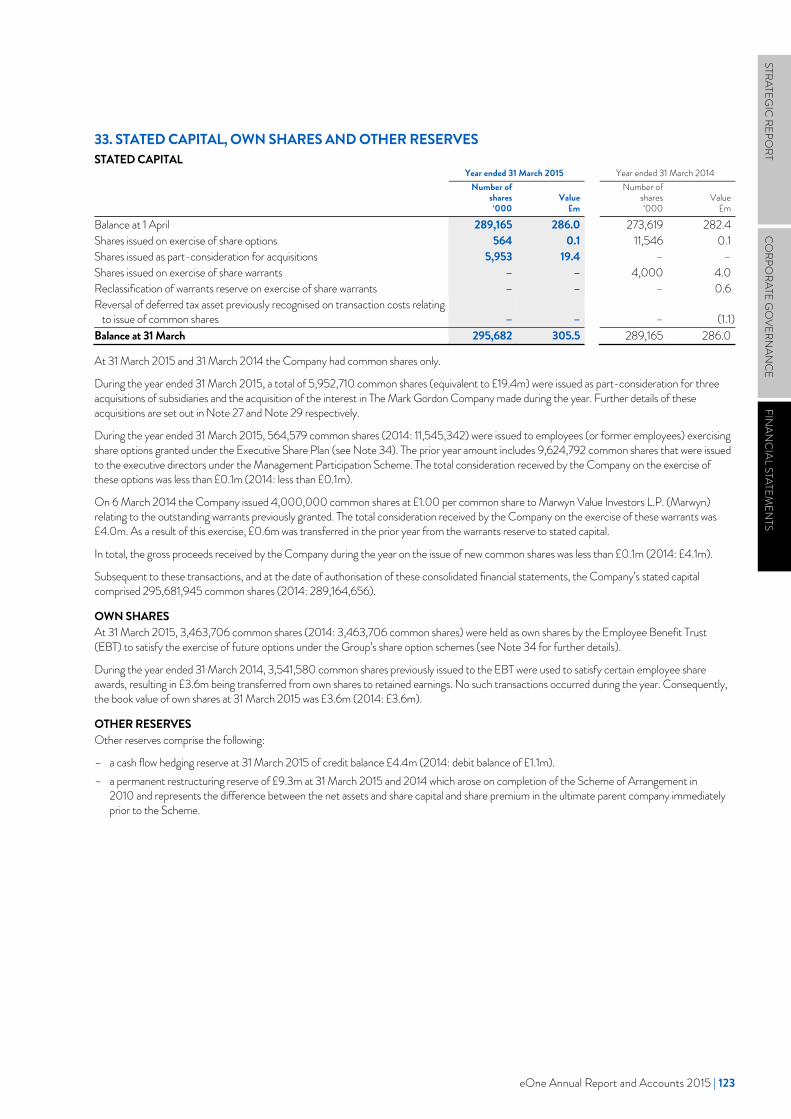
eOne Annual Report and Accounts 2015 | 123
STRATEGIC
REPORT
CO
RPORATE G
OVERN
ANC
EFIN
ANC
IAL STATEMEN
TS
eOne 2015 Annual Report and Accounts | 123
STRATEGIC
REPORT
CORPO
RATE GO
VERNAN
CEFIN
ANC
IAL STATEMEN
TS
33. STATED CAPITAL, OWN SHARES AND OTHER RESERVES STATED CAPITAL
Year ended 31 March 2015 Year ended 31 March 2014Number of
shares‘000
Value £m
Number of shares‘000
Value£m
Balance at 1 April 289,165 286.0 273,619 282.4Shares issued on exercise of share options 564 0.1 11,546 0.1Shares issued as part-consideration for acquisitions 5,953 19.4 – –Shares issued on exercise of share warrants – – 4,000 4.0Reclassification of warrants reserve on exercise of share warrants – – – 0.6Reversal of deferred tax asset previously recognised on transaction costs relating
to issue of common shares – – – (1.1)Balance at 31 March 295,682 305.5 289,165 286.0
At 31 March 2015 and 31 March 2014 the Company had common shares only.
During the year ended 31 March 2015, a total of 5,952,710 common shares (equivalent to £19.4m) were issued as part-consideration for three acquisitions of subsidiaries and the acquisition of the interest in The Mark Gordon Company made during the year. Further details of these acquisitions are set out in Note 27 and Note 29 respectively.
During the year ended 31 March 2015, 564,579 common shares (2014: 11,545,342) were issued to employees (or former employees) exercising share options granted under the Executive Share Plan (see Note 34). The prior year amount includes 9,624,792 common shares that were issued to the executive directors under the Management Participation Scheme. The total consideration received by the Company on the exercise of these options was less than £0.1m (2014: less than £0.1m).
On 6 March 2014 the Company issued 4,000,000 common shares at £1.00 per common share to Marwyn Value Investors L.P. (Marwyn) relating to the outstanding warrants previously granted. The total consideration received by the Company on the exercise of these warrants was £4.0m. As a result of this exercise, £0.6m was transferred in the prior year from the warrants reserve to stated capital.
In total, the gross proceeds received by the Company during the year on the issue of new common shares was less than £0.1m (2014: £4.1m).
Subsequent to these transactions, and at the date of authorisation of these consolidated financial statements, the Company’s stated capital comprised 295,681,945 common shares (2014: 289,164,656).
OWN SHARES At 31 March 2015, 3,463,706 common shares (2014: 3,463,706 common shares) were held as own shares by the Employee Benefit Trust (EBT) to satisfy the exercise of future options under the Group’s share option schemes (see Note 34 for further details).
During the year ended 31 March 2014, 3,541,580 common shares previously issued to the EBT were used to satisfy certain employee share awards, resulting in £3.6m being transferred from own shares to retained earnings. No such transactions occurred during the year. Consequently, the book value of own shares at 31 March 2015 was £3.6m (2014: £3.6m).
OTHER RESERVES Other reserves comprise the following:
– a cash flow hedging reserve at 31 March 2015 of credit balance £4.4m (2014: debit balance of £1.1m). – a permanent restructuring reserve of £9.3m at 31 March 2015 and 2014 which arose on completion of the Scheme of Arrangement in
2010 and represents the difference between the net assets and share capital and share premium in the ultimate parent company immediately prior to the Scheme.
124 | entertainmentone.com
NOTES TO THE CONSOLIDATED FINANCIAL STATEMENTS CONTINUED FOR THE YEAR ENDED 31 MARCH 2015
124 | entertainmentone.com
34. SHARE-BASED PAYMENTS EQUITY-SETTLED SHARE SCHEMES At 31 March 2015, the Group operated two equity-settled share-based payment schemes for its employees (including the executive directors). These are the Long Term Incentive Plan (LTIP) and the Executive Share Plan (ESP).
During the prior year, final distributions were made from the Employee Benefit Trust (EBT) and previous awards made under the Management Participation Scheme (MPS) were converted into common shares. Both the EBT and MPS plans were closed during the prior year and therefore no further awards will be made from either of these schemes.
The total charge in the year relating to the Group’s equity-settled schemes was £3.4m (2014: £2.7m), inclusive of a charge of £0.2m (2014: £0.1m) relating to movements in associated social security liabilities.
Long Term Incentive Plan (LTIP) On 28 June 2013, an LTIP for the benefit of employees (including executive directors) of the Group was approved by the Company’s shareholders. A summary of the arrangements is set out below:
Nature Grant of nil cost options Service period Three years Performance conditions
(for executive directors) (i) Annualised adjusted fully diluted earnings per share growth over the performance period; (ii) average return on capital employed over the performance period; and (iii) total shareholder return over the performance period.
Performance conditions (for other employees)
Majority based on a performance condition of 50% vesting over the three-year service period and 50% vesting dependent on performance against annual Group underlying EBITDA targets.
Maximum term 10 years
During the year, grants were made under the LTIP. The fair value of each grant was measured at the date of grant using a binomial model. The assumptions used in the model were as follows:
Grant date 17July 2014 September 20141 Fair value at measurement date (pence) 309.52 295.12
Number of options granted 799,466 957,951Performance period (three years ending) 31 May 2017 1 July 2017 Share price on date of grant (pence) 319.0 318.83
Exercise price Nil NilExpected volatility 25% 25%Expected life 10 years 10 yearsDividend yield 1.0% 1.0%Risk free interest rate 2.74% 2.46%1. The options were granted on various days between 15 September 2014 and 26 September 2014. The fair value was calculated as at 25 September 2014 as a significant proportion of the
options were granted on that date. The directors do not consider there to be a material change in fair value between 25 September 2014 and the other grant dates in this period. 2. The fair value of the 17 July 2014 grant of 309.5 pence and the September 2014 grants of 295.1 pence are the weighted average fair value of each of the three performance conditions,
as set out above. 3. The share price of the September grants of 318.8 pence, is the weighted average of the share prices on the grant days between 15 September 2014 and 26 September 2014.
eOne Annual Report and Accounts 2015 | 125
STRATEGIC
REPORT
CO
RPORATE G
OVERN
ANC
EFIN
ANC
IAL STATEMEN
TS
eOne 2015 Annual Report and Accounts | 125
STRATEGIC
REPORT
CORPO
RATE GO
VERNAN
CEFIN
ANC
IAL STATEMEN
TS
34. SHARE-BASED PAYMENTS CONTINUED The expected volatility is based on the Company’s share price from the period since trading first began, adjusted where appropriate for unusual volatility. Actual future dividend yields may be different from the assumptions made in the above valuations. Details of share options granted and outstanding at the end of the year are as follows:
2015Number
Million
2015 Weighted
average exercise price
Pence
2014Number
Million
2014Weighted
averageexercise price
Pence
Outstanding at 1 April 2.8 – – –Exercised (0.2) – – –Granted 1.8 – 2.8 –Forfeited (0.1) – – –Lapsed (0.3) – – –Outstanding at 31 March 4.0 – 2.8 –Exercisable – – – –
The weighted average contractual life remaining of the LTIP options in existence at the end of the year was 9.0 years (2014: 9.7 years).
Executive Share Plan (ESP) A summary of the arrangements is set out below:
Nature Grant of options, generally with an exercise price of C$0.01Service period Three years Performance conditions Majority based on a performance condition of 50% vesting over the three year service period and 50% vesting
dependent on performance against annual Group underlying EBITDA targets.Maximum term Five years
Details of share options exercised, lapsed and outstanding at the end of the year are as follows:
2015 Number
Million
2015 Weighted
average exercise price
Pence
2014Number
Million
2014Weighted
averageexercise price
Pence
Outstanding at 1 April 0.6 0.5 2.6 3.6Exercised (0.4) 0.5 (1.9) 3.8Lapsed – – (0.1) 0.6Outstanding at 31 March 0.2 0.5 0.6 0.5Exercisable 0.2 0.5 0.4 0.5
The weighted average contractual life remaining of the ESP options in existence at the end of the year was 0.6 years (2014: 1.7 years) and their weighted average exercise price was 0.5 pence (2014: 0.5 pence).
126 | entertainmentone.com
NOTES TO THE CONSOLIDATED FINANCIAL STATEMENTS CONTINUED FOR THE YEAR ENDED 31 MARCH 2015
126 | entertainmentone.com
34. SHARE-BASED PAYMENTS CONTINUED Employee Benefit Trust (EBT) Details of share awards distributed and outstanding at the end of the year are as follows:
2015 Number
Million
2015 Weighted
average exercise price
Pence
2014 Number
Million
2014Weighted
averageexercise price
Pence
Outstanding at 1 April – – 3.5 –Distributed – – (3.5) –Outstanding at 31 March – – – –Exercisable – – – –
During the prior year, final distributions were made from the EBT and the plan is closed at 31 March 2015. No further awards will be made from the scheme.
Management Participation Scheme (MPS) Since 31 March 2010, the Group had operated an MPS for executive directors. The extent to which rights vested depended upon the Company’s performance over a three-year period from 31 March 2010. Participants were only rewarded if shareholder value was created, thereby aligning the interests of the participants directly with those of shareholders. The growth condition required to be met was that the compound annual growth of the Company’s share price from 31 March 2010 must be at least 12.5% per annum. The growth condition was measured at 31 March 2013 and was met. During the prior year the executive directors exercised their option in relation to this scheme, converting their MPS shares into 9.6m common shares of the Company.
No share-based payment charge was recorded in respect of the MPS in the current or prior year. The new LTIP has replaced the MPS meaning no further grants will be made from this scheme.
35. COMMITMENTS OPERATING LEASE COMMITMENTS The Group operates from properties in respect of which commercial operating leases have been entered into.
At the balance sheet date, the Group had outstanding commitments for future minimum lease payments under non-cancellable operating leases, which fall due as follows:
31 March 2015
£m 31 March 2014
£m
Within one year 8.6 6.3Later than one year and less than five years 20.7 15.0After five years 21.2 1.0Total 50.5 22.3
FUTURE CAPITAL EXPENDITURE
31 March 2015
£m 31 March 2014
£m
Investment in acquired content rights contracted for but not provided 218.4 187.6
eOne Annual Report and Accounts 2015 | 127
STRATEGIC
REPORT
CO
RPORATE G
OVERN
ANC
EFIN
ANC
IAL STATEMEN
TS
eOne 2015 Annual Report and Accounts | 127
STRATEGIC
REPORT
CORPO
RATE GO
VERNAN
CEFIN
ANC
IAL STATEMEN
TS
36. RELATED PARTY TRANSACTIONS Transactions between the Company and its subsidiaries, which are related parties, have been eliminated on consolidation and are not disclosed in this Note.
Marwyn Value Investors L.P. held 79,424,894 common shares in the Company at 31 March 2015 (2014: 79,424,894), amounting to 26.9% (2014: 27.5%) of the issued share capital of the Company. Marwyn Value Investors L.P. is deemed to be a related party of Entertainment One Ltd. by virtue of this significant shareholding.
James Corsellis is a partner of Marwyn Capital LLP, a partner of Marwyn Investment Management LLP, a director of Marwyn Partners Limited and a director of Marwyn Investments Group Limited and these entities are therefore deemed to be related parties of Entertainment One Ltd. by virtue of a common director or member.
During the year the Company paid fees of £0.2m (2014: £0.4m) to Marwyn Capital LLP for corporate finance advisory services under the terms of their advisory agreement pursuant to which Marwyn Capital LLP have agreed to provide general strategic and corporate finance services to the Company for a fixed monthly fee of £15,000 (2014: £15,000).
At 31 March 2015 the Group owed Marwyn Capital LLP less than £0.1m (2014: less than £0.1m). The amounts outstanding are unsecured and will be settled in cash. No guarantees have been given or received.
The Group owed £nil (restated 2014: £nil) to its joint venture film and television production companies and was owed £nil (restated 2014: £nil) by its joint venture film and television production companies at 31 March 2015.
128 | entertainmentone.com
COMPANY INFORMATION
REGISTERED OFFICE134 Peter Street Suite 700 Toronto Ontario Canada M5V 2H2
BANKERSJP Morgan Chase N.A. 25 Bank Street Canary Wharf London E14 5JP UK
LEGAL ADVISERS TO THE COMPANY (CANADA)Osler, Hoskin & Harcourt LLP 100 King Street West 1 First Canadian Place Toronto Ontario M5X 1B8 Canada
LEGAL ADVISERS TO THE COMPANY (UK AND US)Mayer Brown International LLP 201 Bishopsgate London EC2M 3AF UK
JOINT BROKERJP Morgan Cazenove 25 Bank Street Canary Wharf London E14 5JP UK
JOINT BROKERCredit Suisse Securities (Europe) Limited 17 Columbus Courtyard London E14 4DA UK
REGISTRARSCapita Registrars (Jersey) Limited 12 Castle Street St. Helier JE2 3RT Jersey
AUDITORDeloitte LLP 2 New Street Square London EC4A 3BZ UK

This report is printed on Magno Satin and Essential Offset. Both have been independently certified by the Forest Stewardship Council® and manufactured using materials from sustainable sources.
Printed at Principal Colour Ltd. ISO 14001 certified, Alcohol Free and FSC® Chain of Custody certified.
The inks used are vegetable oil based.

Entertainment O
ne Ltd. Annual Report and Accounts 2015
Entertainment One Ltd. 134 Peter Street Suite 700 Toronto Ontario Canada M5V 2H2 T: +1 416 646 2400
www.entertainmentone.com