Embed Size (px)
Citation preview

Sun Microsystems, Inc.4150 Network CircleSanta Clara, CA 95045 USA650 960-1300
http://www.sun.com/blueprints
EnterpriseQuality of Service (QoS)Part II: Enterprise Solution
using SolarisTM Bandwidth
Manager 1.6 Software
By Deepak Kakadia - Enterprise Engineering
Sun BluePrints™ OnLine - March 2002
Part No.: 816-4459-10Revision 1.0, 03/07/02Edition: March 2002

Please
Recycle
Copyright 2002 Sun Microsystems, Inc. 901 San Antonio Road, Palo Alto, California 94303 U.S.A. All rights reserved.
This product or document is protected by copyright and distributed under licenses restricting its use, copying, distribution, and decompilation.
No part of this product or document may be reproduced in any form by any means without prior written authorization of Sun and its licensors,
if any. Third-party software, including font technology, is copyrighted and licensed from Sun suppliers.
Parts of the product may be derived from Berkeley BSD systems, licensed from the University of California.
Sun, Sun Microsystems, the Sun logo, Sun BluePrints, JavaServer Pages (JSP) , Enterprise JavaBeans (EJB) , Sun Enterprise, Java, Ultra, and
Solaris are trademarks or registered trademarks of Sun Microsystems, Inc. in the United States and other countries.
The OPEN LOOK and Sun™ Graphical User Interface was developed by Sun Microsystems, Inc. for its users and licensees. Sun acknowledges
the pioneering efforts of Xerox in researching and developing the concept of visual or graphical user interfaces for the computer industry. Sun
holds a non-exclusive license from Xerox to the Xerox Graphical User Interface, which license also covers Sun’s licensees who implement OPEN
LOOK GUIs and otherwise comply with Sun’s written license agreements.
RESTRICTED RIGHTS: Use, duplication, or disclosure by the U.S. Government is subject to restrictions of FAR 52.227-14(g)(2)(6/87) and
FAR 52.227-19(6/87), or DFAR 252.227-7015(b)(6/95) and DFAR 227.7202-3(a).
DOCUMENTATION IS PROVIDED “AS IS” AND ALL EXPRESS OR IMPLIED CONDITIONS, REPRESENTATIONS AND WARRANTIES,
INCLUDING ANY IMPLIED WARRANTY OF MERCHANTABILITY, FITNESS FOR A PARTICULAR PURPOSE OR NON-
INFRINGEMENT, ARE DISCLAIMED, EXCEPT TO THE EXTENT THAT SUCH DISCLAIMERS ARE HELD TO BE LEGALLY INVALID.
Copyright 2002 Sun Microsystems, Inc., 901 San Antonio Road, Palo Alto, Californie 94303 Etats-Unis. Tous droits réservés.
Ce produit ou document est protégé par un copyright et distribué avec des licences qui en restreignent l’utilisation, la copie, la distribution, et la
décompilation. Aucune partie de ce produit ou document ne peut être reproduite sous aucune forme, par quelque moyen que ce soit, sans
l’autorisation préalable et écrite de Sun et de ses bailleurs de licence, s’il y en a. Le logiciel détenu par des tiers, et qui comprend la technologie
relative aux polices de caractères, est protégé par un copyright et licencié par des fournisseurs de Sun.
Des parties de ce produit pourront être dérivées des systèmes Berkeley BSD licenciés par l’Université de Californie.
Sun, Sun Microsystems, le logo Sun, Sun BluePrints, JavaServer Pages (JSP) , Enterprise JavaBeans (EJB) , Sun Enterprise, Java, Ultra, et Solaris
sont des marques de fabrique ou des marques déposées, ou marques de service, de Sun Microsystems, Inc. aux Etats-Unis et dans d’autres pays.
L’interface d’utilisation graphique OPEN LOOK et Sun™ a été développée par Sun Microsystems, Inc. pour ses utilisateurs et licenciés. Sun
reconnaît les efforts de pionniers de Xerox pour la recherche et le développement du concept des interfaces d’utilisation visuelle ou graphique
pour l’industrie de l’informatique. Sun détient une licence non exclusive de Xerox sur l’interface d’utilisation graphique Xerox, cette licence
couvrant également les licenciés de Sun qui mettent en place l’interface d’utilisation graphique OPEN LOOK et qui en outre se conforment aux
licences écrites de Sun.
CETTE PUBLICATION EST FOURNIE "EN L’ETAT" ET AUCUNE GARANTIE, EXPRESSE OU IMPLICITE, N’EST ACCORDEE, Y COMPRIS
DES GARANTIES CONCERNANT LA VALEUR MARCHANDE, L’APTITUDE DE LA PUBLICATION A REPONDRE A UNE UTILISATION
PARTICULIERE, OU LE FAIT QU’ELLE NE SOIT PAS CONTREFAISANTE DE PRODUIT DE TIERS. CE DENI DE GARANTIE NE
S’APPLIQUERAIT PAS, DANS LA MESURE OU IL SERAIT TENU JURIDIQUEMENT NUL ET NON AVENU.

1
Enterprise Quality of Service (QoS)Part II: Enterprise Solution using
SolarisTM Bandwidth Manager 1.6
Software
This article is Part II of a two-part series with a focus on Enterprise Networks
detailing what corporations can do to prioritize traffic in an optimal manner to
ensure that certain applications receive priority over less important applications,
starting from the computing server up to the enterprise’s egress point. This article
investigates the effectiveness of SolarisTM Bandwidth Manager 1.6 (Solaris BM 1.6)
software in implementing a Quality of Service (QoS) solution in an enterprise
network. This article also briefly looks at how policy based network and systems
management takes Solaris BM 1.6 software one step further, allowing the QoS
configurations to change dynamically based on certain feedback measurements. It
doesn’t make sense to restrict traffic when there is no congestion, however to
constantly manually perform QoS reconfigurations itself can be a daunting task, this
is where policy controls play a major role.
This article details the following:
■ QoS deployment scenarios
■ Available QoS solutions
Note – Solaris Bandwidth Manager 1.6 software is supported on SolarisTM
Operating Environment version 8 and older.

2 Enterprise Quality of Service (QoS) Part II: Enterprise Solution using SolarisTM Bandwidth Manager 1.6
QoS Deployment Scenarios
There are several QoS solution approaches from a deployment perspective. Further,
there are two available options from an implementation perspective, hardware and
software. This article focuses on where in the enterprise QoS can be deployed and is
limited to a software implementation.
The end-to-end path from a client to the server is composed of various network
segments, each with different bandwidths and more important, different loads. QoS
deployments are all based on one fundamental principle, restricting the amount of
traffic that is injected into a slower link from a faster link. In this context, the notion
of slower and faster is not necessarily about bandwidth, it is also about
oversubscription of a link. To better understand this concept, let’s step out of the
enterprise environment and into the access network, where a local Internet Service
Provider (ISP), provides Digital Subscriber Line (DSL) service. In order to generate
profits, it is often the case where many DSL lines are aggregated into a DSL Access
multiplier (DSLAM). Aggregate egress traffic is forwarded to an Optical Carrier 3
(OC-3) line. Although the DSL line is much slower in terms of bandwidth, the choke
point is in fact the OC-3 link at 155 mbps, since the service provider may aggregate
thousands of 144 kbs lines, hoping that not all the lines will be in use at the same
time. Back in the enterprise environment, where enterprise networks are usually
over provisioned. Recent trends in enterprise networks have evolved where
centralize web servers often provide services to all employees and partners. This is
often an area of contention and an ideal situation where Solaris BM 1.6 software may
be used to control traffic. There are various deployment options and the following
list describes some QoS deployment possibilities:
1. Outsourcing the ISP to provide QoS Network services, providing enterprise
customers with a web interface provision and their own QoS policies for their
portion of bandwidth.
2. Deploying a QoS Capable Network Switch. This is usually located at a choke
point at a corporate Wide Area Network (WAN) access point.
3. Deploying a Solaris BM 1.6 software server at a choke point, in front of a
centralized network resource such as a consolidated server.
4. Deploying Solaris BM 1.6 software on the consolidated server themselves.
One of the main limitations of a purely network-centric approach, is that the
network is not always the bottleneck. Often the server may be the source of a
bottleneck. For example, web servers or application servers that are generating
dynamic web pages, using JavaServer PagesTM (JSPTM) technology, servlets, and
Enterprise JavaBeansTM (EJBTM) technology can be central processing unit (CPU)
bound, due to a few relatively small-sized Hypertext Transfer Protocol (HTTP)
requests. In this case, having QoS policy enforcement points (PEP) that can only

QoS Deployment Scenarios 3
control the network bandwidth does not contribute to improving overall
performance. However, if there is some feedback from the servers that provides
some indication of load, the QoS device can restrict the incoming requests, aligning
the requests with the server load, letting only the priority requests through. This
article describes QoS from network bandwidth perspective and then describes a
solution that takes server load into consideration of the QoS equation.
In order to understand the effectiveness of the Solaris BM 1.6 software, FIGURE 1
illustrates several representative configurations deployed with heavy loads.
Measurements were taken on the server and the client side for verification. FIGURE 1
illustrates that with the same offered load the following is true:
1. No QoS—all clients receive poor service.
2. QoS on a dedicated server—clients receive good differential services, ensuring
that priority clients receive noticeably better service than non-priority.
3. QoS located on the application server—the amount of load that QoS uses up on
a server to implement differential services. This shows that there is a cost to
implementing QoS, which uses CPU cycles that could be used to service client
requests.
This section discusses a proposed integrated feedback closed loop solution, that
integrates Solaris BM 1.6 software with SunTM Management Center 3.0 (Sun MC 3.0)
software as illustrated in FIGURE 1. This solution takes the server load into
consideration when restricting traffic and providing differentiated services.
In FIGURE 1 configuration A, shows the baseline case, where no QoS was deployed.
In FIGURE 1 configuration B, shows a dedicated server deployed to control
bandwidth allocation. This also illustrates how an integrated Systems and Network
Approach can be used, where the policy decision point (PDP) is monitoring and
controlling both the servers and the network and taking the appropriate action. In
this case, if the servers become overloaded, the PDP can perform several actions to
remedy the situation, depending on the Policy Decision Algorithms. The PDP can
increase the priority of the process involved and can also reduce the number of
requests coming into the server. This provides a closed loop solution. The PDP is
located on the same server as the PEP. As previously mentioned, the PDP makes the
decision about what to do with particular flows, based on console input or other
input. The PDP then instructs the PEPs about what level of QoS to give specific
traffic.
In FIGURE 1 configuration C, shows a deployment where the QoS function is no
longer implemented on a dedicated server, but located on the server labelled Server
Load. This approach describes an architecture where the PDP and policy
management tool (PMT) can be shifted from a dedicated separate box, to the servers
themselves (in this case, the Server Load). This would normally represent a web
server. This solution may make sense for enterprise customers who do not want to

4 Enterprise Quality of Service (QoS) Part II: Enterprise Solution using SolarisTM Bandwidth Manager 1.6
add new hardware into existing data center deployments and who want to make
better use of current resources that are not fully utilized. The PEP in this case, is
implemented in the network protocol stack.
FIGURE 1 Performance Tests Configurations
Serverload
Clientload
Configuration A Baseline - No QoS, no policies
Serverload
Clientload
Configuration B QoS and policies - Hardware and software solution
Sun MC software
agent
Sun MC software
agent
Sun MC software server
PDP
Solaris BM 1.6 software
PEP
Sun MC software server
PDP
Solaris BM 1.6 software
PEP
Serverload
Clientload
Configuration C QoS and policies - Software only solution
QoS Deployment Scenarios 5
Configuration A—Baseline Results with No QoS
FIGURE 2 shows the results of the client average bandwidths for the four classes;
bronze, silver, gold, and platinum. Platinum is referred to the best class of service
and bronze as the worst class of service. Gold and silver are the middle of line
service. Clearly all classes received poor results, ranging from .6 Mbits/sec to 0.1
Mbits/sec. Response times for the platinum class range from 38 seconds to 155
seconds. The bronze class response times range from 64 seconds to 115 seconds.
FIGURE 2 also shows the average load on the client, server, and QoS Solaris BM 1.6
software server. The client and end server CPU utilization is maxed out, yet the
overall throughput is extremely low. The network is saturated. This clearly
demonstrates that in a oversubscribed network, all traffic degrades. If this were an
example of an e-commerce site, QoS would prove to be of extreme value at the time
when business peaks.
FIGURE 2 Client Side Measurements of Throughput
0.7
0.6
0.5
0.4
0.3
0.2
0.1
00 5 10 15 20 25 30 35 40 45 50
No QoS - BronzeNo QoS - SilverNo QoS - Gold
No QoS - Platinum
Mbi
ts/s
ec.
Run
Platinum
GoldSilver
Bronze
Baseline - No QoS

6 Enterprise Quality of Service (QoS) Part II: Enterprise Solution using SolarisTM Bandwidth Manager 1.6
Configuration B—QoS Policy on Dedicated Server
TCP Traffic
FIGURE 3 shows the device specific configuration file used to configure the PEP,
which was implemented by Solaris BM 1.6 software. Various filters and classes are
defined.

QoS Deployment Scenarios 7
FIGURE 3 Solaris Bandwidth Manager 1.6 Software Configuration File
# Configuration file generated on angeli at 17:03:49 2/27/01#
version 1.5timeout 30
filter clientplatfilterout remote type subnet address 14.0.0.0 mask 255.0.0.0
filter clientgoldfilterout remote type subnet address 16.0.0.0 mask 255.0.0.0
filter clientsilfilterout remote type subnet address 18.0.0.0 mask 255.0.0.0
filter clientbrzefilterout remote type subnet address 20.0.0.0 mask 255.0.0.0
filter clientplatfilerin local type subnet address 20.0.0.0 mask 255.0.0.0
filter clientgoldfilterin local type subnet address 18.0.0.0 mask 255.0.0.0
filter clientsilfilterin local type subnet address 16.0.0.0 mask 255.0.0.0
filter clientbrzfilterin local type subnet address 14.0.0.0 mask 255.0.0.0
interface hme2_in rate 100000000 activate enabled
class bronzeclass interface hme2_in parent root filter clientbrzfilterin bandwidth 10 priority 1 max_bandwidth 10 flow_events bronzeflow
class silverclass interface hme2_in parent root filter clientsilfilterin bandwidth 15
priority 1 max_bandwidth 15 flow_events silverflow
class goldclass interface hme2_in parent root filter clientgoldfilterin bandwidth 25 priority 1 max_bandwidth 25 flow_events goldflow
class platclass interface hme2_in parent root filter clientplatfilerin bandwidth 50 priority 1 max_bandwidth 50 flow_events platflow
interface hme2_out rate 100000000 activate enabled
class brzclassout interface hme2_out parent root filter clientbrzefilterout bandwidth 10 priority 1 max_bandwidth 10 flow_events brzclassout
class silverclassout interface hme2_out parent root filter clientsilfilterout bandwidth 15 priority 1 max_bandwidth 15 flow_events silclassout
class goldclassout interface hme2_out parent root filter clientgoldfilterout bandwidth 25 priority 1 max_bandwidth 25 flow_events goldout
class platclassout interface hme2_out parent root filter clientplatfilterout bandwidth 50 priority 1 max_bandwidth 50 flow_events platflowout
QoS Settings allocating percentageof overall available bandwidth tothe various classes of traffic

8 Enterprise Quality of Service (QoS) Part II: Enterprise Solution using SolarisTM Bandwidth Manager 1.6
FIGURE 4 shows the measurements taken on the client side, clearly showing that the
four classes of traffic are first experiencing throughput ranging from 40 Mbits/sec to
5 Mbits/sec, much better than the results of no QoS.
FIGURE 4 Dedicated Server Case
As a cross check, FIGURE 5 and FIGURE 6 illustrate the measurements taken on the
policy server, showing the bandwidth proportions of all classes of traffic. The
measurements show that for the transmission control protocol (TCP) traffic, all
classes are in fact receiving the proportions of bandwidth of the specified
configuration. Clearly, there is a tremendous improvement in all classes except the
lowest bronze class whose response times have worsened to 352 seconds during
congestion. Platinum class on the other hand is consistently receiving 1.5 seconds
response times and an average bandwidth of 44 Mbits/sec. Gold class is also not
consistently receiving response times of 2.7 seconds with an average bandwidth of
24 Mbits/sec. Silver class is not consistently receiving 4.7 seconds response times
with an average bandwidth of 14.2 Mbits/sec. Bronze class is not as important, its
traffic is dramatically sacrificed for the others, starving out the lowest class queue,
disproportionately. As illustrated, the bandwidth manager proved effective in
allocating TCP traffic.
70
60
50
40
30
20
10
0
0 5 10 15 20 25 30 35 40 45
Mbi
ts/s
ec.
Run
Dedicated server - QoS - TCP
QoS dedicated server - TCP - Client throughput - BronzeQoS dedicated server - TCP - Client throughput - SilverQoS dedicated server - TCP - Client throughput - Gold
QoS dedicated server - TCP - Client throughput - Platinum
Platinum
Gold
Silver
Bronze

QoS Deployment Scenarios 9
FIGURE 5 TCP Traffic Flow Statistics of QoS and Policy on Dedicated Server

10 Enterprise Quality of Service (QoS) Part II: Enterprise Solution using SolarisTM Bandwidth Manager 1.6
FIGURE 6 TCP Traffic Statistics of QoS and Policy on Dedicated Server
The load statistics in FIGURE 7 show that the client and server are under a full load,
and the policy server under approximately 2/3 capacity. The server is completely
overloaded, because the server feedback was not used. By including feedback and
restricting overall bandwidth, across all classes, it is not expected to dramatically
improve response times by all clients. Better allocation of overall resources is
achieved by keeping the server from reaching its saturation point.

QoS Deployment Scenarios 11
FIGURE 7 MPSTAT-CPU Performance Load Statistics
Two sets of tests were ran, the TCP traffic and the user datagram protocol (UDP)
traffic, using the dedicated server to enforce policies as shown in FIGURE 1,
configuration B. The results show the usefulness of the bandwidth manager product.
Premium customers are getting a larger share of the overall pipe. The TCP traffic is
flow-controlled and the client slows in sending data if the server advertises a small
receive window. This allows packets to be dropped or the ACK Packet returned after
various time-outs. An ACK Packet is a TCP packet that the receiver sends to the
sender acknowledging receipt of certain sequence of bytes of the stream. Using UDP
traffic allows the client to blindly pump data.
Application Server E-250 Load Statistics -CPU minf mjf xcal intr ithr csw icsw migr smtx srw syscl usr sys wt idl 0 42 12 86 2107 106 5659 1723 203 1164 0 8458 10 90 0 0 1 31 9 57 11808 11690 1354 350 157 1031 0 4540 4 96 0 0
0 25 7 56 2170 104 5310 1804 210 1072 0 6613 8 92 0 0 1 23 4 88 11928 11809 2050 349 456 979 0 3595 3 97 0 0
0 15 5 18 1970 106 5921 1590 345 1291 0 6475 7 93 0 0 1 6 2 41 11698 11598 1464 430 106 1025 0 3416 2 98 0 0
0 11 5 51 2074 107 6002 1682 548 1227 0 6799 9 91 0 0 1 10 3 16 11735 11624 1926 349 532 975 0 4011 3 97 0 0
Client E-250 Load Statistics -CPU minf mjf xcal intr ithr csw icsw migr smtx srw syscl usr sys wt idl 0 2918 0 459 2729 115 5989 2450 177 1429 0 3016 23 77 0 0 1 1897 13 236 2763 2616 1728 555 145 1360 0 3818 16 84 0 0
0 2914 4 446 2963 124 6478 2670 117 1408 0 3065 24 76 0 0 1 2026 10 108 2700 2592 1238 374 163 1287 0 3692 13 87 0 0
0 2834 2 464 3097 118 6831 2815 122 1499 0 2928 16 83 0 0 1 1821 14 170 2922 2823 1217 369 141 1352 0 3405 12 88 0 0
0 2857 1 502 3137 115 6944 2853 155 1497 0 3223 24 76 0 0 1 1717 0 193 2727 2619 1236 357 133 1363 0 3497 18 82 0 0
CPU minf mjf xcal intr ithr csw icsw migr smtx srw syscl usr sys wt idl 0 0 0 41 294 125 3563 56 389 456 0 6184 39 4 0 57 1 0 0 101 3352 3288 1940 59 383 7113 0 2390 21 10 0 69 2 0 0 135 11974 11887 1266 48 151 6397 0 1277 9 35 0 55 3 4 0 81 74 0 3655 60 587 342 0 6491 36 9 0 55
0 0 0 94 397 129 4943 110 963 1121 0 6590 46 10 0 43 1 0 0 151 4323 4200 3108 111 415 6874 0 2719 23 23 0 54 2 0 0 209 11882 11785 1558 122 161 6512 0 674 4 13 0 83 3 0 0 80 152 1 5133 106 1061 1059 0 6873 29 19 0 52
0 1 0 50 263 130 3265 29 792 422 0 6099 30 8 0 62 1 0 0 45 3474 3443 1523 38 267 7457 0 2424 20 14 0 66 2 0 0 61 11671 11638 656 53 109 6736 0 685 5 20 0 75 3 0 0 13 66 1 4662 57 633 296 0 9942 49 14 0 37
Policy Server Ultra 80 Load Statistics
g ( y ) y p y

12 Enterprise Quality of Service (QoS) Part II: Enterprise Solution using SolarisTM Bandwidth Manager 1.6
Configuration B—QoS Policy on Dedicated Server
UDP Traffic
If you use the same architecture as shown in FIGURE 1, configuration C, but change
the traffic from TCP to UDP, some interesting results are revealed. FIGURE 8 and
FIGURE 9 graphically illustrate the measurements captured on the QoS policy server.
The results show a dramatic degradation in performance, for all classes. The
graphical results taken on the bandwidth manager server are consistent with the
class settings. As FIGURE 3 previously illustrated, the configuration file, out of a total
pipe of 100 Mbits/sec, platinum class is 50% of the pipe, gold is 25%, silver is 15%,
and bronze is 10%. Referring to FIGURE 8, you can see that platinum, in general, is
experiencing better bandwidth and response times than gold. In the same matter,
gold is better than silver, and silver is still better than bronze. You can clearly see
that it is much more difficult to implement QoS on UDP traffic than on TCP traffic.
The reason for this is that TCP traffic is flow-controlled. When packets are dropped,
the sender reduces the amount of traffic it injects into the network, thus reducing
congestion. In comparison, UDP traffic is not well-behaved. If packets are dropped,
the sender continues to interject the same amount of traffic, so the congestion on the
client side is not improved.

QoS Deployment Scenarios 13
FIGURE 8 QoS and Policy on Dedicated Server UDP Traffic Statistics
Platinum
Gold
SilverBronze

14 Enterprise Quality of Service (QoS) Part II: Enterprise Solution using SolarisTM Bandwidth Manager 1.6
FIGURE 9 QoS and Policy on Dedicated Server UDP Traffic Flow Statistics
FIGURE 10 shows the performance measurements taken on the client side. By looking
at the client throughput, you can see that the UDP traffic can be controlled by QoS.
It is not controlled as well as the TCP traffic but much better than without using QoS
at all.

QoS Deployment Scenarios 15
FIGURE 10 Dedicated Server, QoS UDP Traffic
Configuration C—QoS Policy Software Only
Solution
FIGURE 11 shows the results of deploying the architecture that is illustrated in
FIGURE 1, where the PDP function is deployed on the server running the network
application. The results show that the CPU availability is required to process all the
packets, classify, queue, and schedule. This is all processed in the kernel mode. The
one issue realized after the experimental results are reviewed, is that the
configuration of the interfaces in creating classes made a big difference. The CPU
performance was much better when only one side of the network was filtered and
classified, either on the ingress or egress, but not both sides.
Mbi
ts/s
ec.
Run
Dedicated server - QoS - UDP
QoS dedicated server - UDP - Client throughput - BronzeQoS dedicated server - UDP - Client throughput - SilverQoS dedicated server - UDP - Client throughput - Gold
QoS dedicated server - UDP - Client throughput - Platinum
40
35
30
25
20
15
10
5
00 5 10 15 20 25 30

16 Enterprise Quality of Service (QoS) Part II: Enterprise Solution using SolarisTM Bandwidth Manager 1.6
FIGURE 11 QoS and Policy Deployed on the Application Server—TCP Traffic Statistics
Experimental Setup
This section describes an experimental setup. The client and server hosts were
deployed on dual CPU Sun Enterprise 250TM servers and in-between the Sun
Enterprise 250 servers is a 4 CPU UltraTM 80 workstation running Solaris BM 1.6
software. The client side runs an equal number of New Test TCP—TCP Performance
Test Program (NTTCP) sessions per class. Care is taken to ensure a calibrated load
among the classes, in order to achieve correct results. Equal number of platinum,
gold, silver, and bronze NTTCP requests are generated from client to server.
As FIGURE 12 illustrates, the client and server are attached via an 100 Mbyte/sec FDX
Netgear switch. The client side continuously runs NTTCP in a loop, ensuring that
each class runs the same number of NTTCP requests, thus calibrating the load
equally across all the four classes of traffic (platinum, gold, silver, and bronze). Each
class is mapped directly to one logical interface, thus simplifying the filters and class
configurations on the Solaris BM 1.6 software.
Platinum
Gold
Silver
Bronze

Products 17
FIGURE 12 Example of an Experimental Setup
Products
There are several QoS Solutions available in the market place that can be applied to
different Network Segments and Systems. Network QoS capable switches, such as
those offered by Extreme Networks, Foundry, Cisco, and others provide multiple
services, switching, and routing along with QoS and QoS rules capability. These are
vendor-specific solutions that require significant knowledge of Network
Management and specific understanding of the switch vendor’s Command Line
Interface or Simple Network Management Protocol (SNMP) Management
Information Base (MIB) definition for QoS provisioning, but provides a better
solution in the long run. If however, a fast and simple solution is required, the
software based QoS solution can be a worthwhile alternative. If existing routers are
not QoS capable, upgrading routers in existing infrastructures requires a significant
investment of time and effort. Products that can be installed next to routers, such as
Allot and Packeteer, provide hardware solutions that provide QoS and limited policy
capabilities on a few devices. Load balancers simply make an estimate of the
response times of servers among a server farm but does not incorporate QoS in
concise manner.
Monitor andkeyboard for3D graphics
Hub/switch(100 mbps)
Management LAN
Sun MCsoftware
agent
Server (Ex500) Client (Ex500)
Solaris 8 Operating Environment
01/01
Solaris 8 Operating Environment
01/01
Solaris 8 Operating Environment
01/01
Ultra 80 workstation, TxSolaris bandwidth manager
policy server
nttcp nttcp
Sun MCsoftware
SolarisBM 1.6
software
Sun MCsoftware
Policyserver
100 fdxback
to back
100 fdxback
to back
hme1:1hme1:2hme1:3hme1:4
hme1:1 14.6.49.71hme1:2 16.6.49.71hme1:3 18.6.49.71hme1:4 20.6.49.71
hme2:1hme2:2hme2:3hme2:4
hme1:1 13.6.49.73hme1:2 15.6.49.73hme1:3 17.6.49.73hme1:4 19.6.49.73
18 Enterprise Quality of Service (QoS) Part II: Enterprise Solution using SolarisTM Bandwidth Manager 1.6
The main limitation of these products are that the server load is sometimes the
bottleneck, with the network being uncongested and impacting the effectiveness of
differentiated services. Solaris BM 1.6 software and the Sun MC 3.0 software solution
exposes a set of API’s where the server load can be monitored and dynamic
reconfiguration is possible on both the Server and Network Resource. Section ,
“Appendix A” provides some code skeletons that show how such a solution can be
implemented using Sun MC 3.0 software and the Solaris BM 1.6 software API’s.
Summary
The results showed that the Solaris BM 1.6 software performed well, providing users
true differentiated services. TCP traffic is much more predictable and controlled than
UDP traffic, but the Solaris BM 1.6 software still proved to do a fairly reasonable job
in segregating traffic classes proportionately. Deploying the PDP and PEP on a
dedicated server offered the best results. Deploying the PDP and PEP on the
application server, as a software-only solution, was the least intrusive solution.
However, sufficient CPU resources must be available for best results. Finally, an
architecture was proposed, with some code skeletons in Section , “Appendix A” that
offer an integrated QoS Policy Based System and Network Management System.
This is where the server is also monitored and reconfigured based on policies. This
solution is a closed loop feedback architecture that offers promising performance
results.
Author’s Bio
Deepak Kakadia is a Staff Engineer, Network Architect in the Enterprise Engineering Group,at Sun Microsystems Inc. located in Menlo Park, California. Deepak has been with Sun forseven years. He previously worked for various companies including Corona Networks as aPrincipal Engineer; Network Management Systems, as a team leader for the QoS PolicyBased NMS subsystem; Digital Equipment Corp, where he worked on DEC OSF/1; NortelNetworks (Bell Northern Research) in Ottawa as member of the technical staff. Deepakreceived his B.Eng in Computer Systems, MSc Computer Science in addition to completingPh.D qualifying exams and course work. Deepak has filed 2 patents: 1) Event Correlationand 2) QoS in the area of Network Management.
Appendix A 19
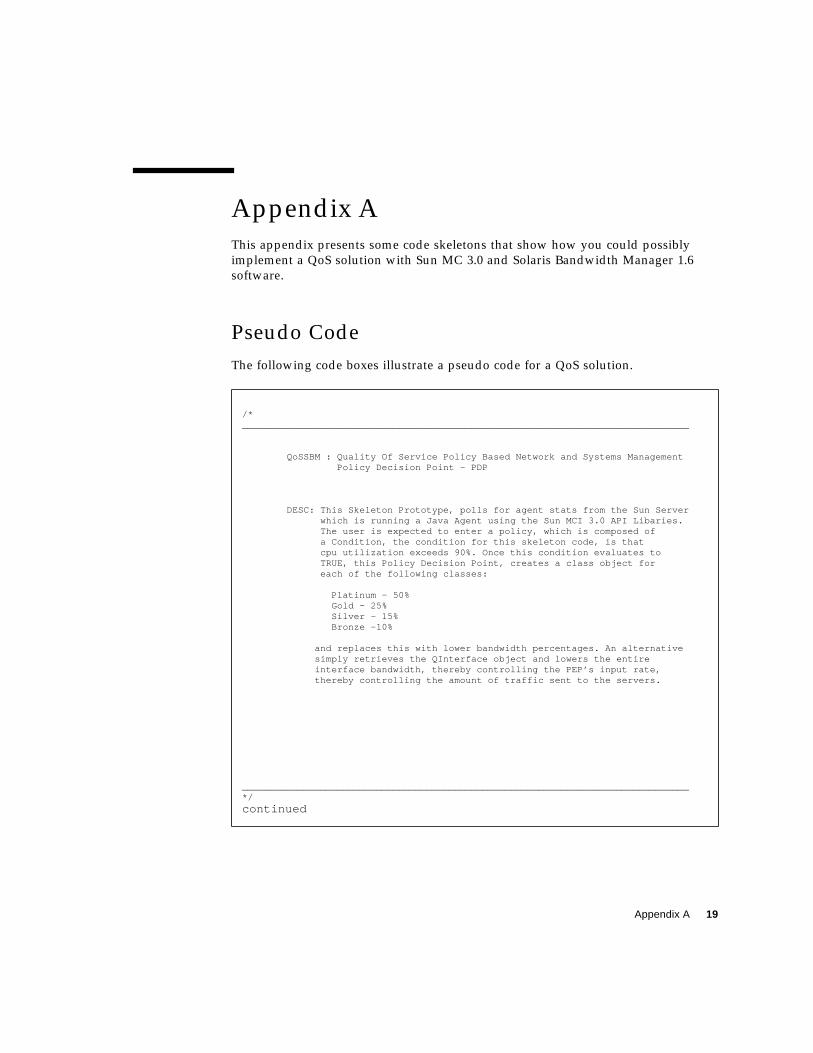
Appendix A
This appendix presents some code skeletons that show how you could possibly
implement a QoS solution with Sun MC 3.0 and Solaris Bandwidth Manager 1.6
software.
Pseudo Code
The following code boxes illustrate a pseudo code for a QoS solution.
/*________________________________________________________________________________
QoSSBM : Quality Of Service Policy Based Network and Systems Management Policy Decision Point - PDP
DESC: This Skeleton Prototype, polls for agent stats from the Sun Server which is running a Java Agent using the Sun MCI 3.0 API Libaries. The user is expected to enter a policy, which is composed of a Condition, the condition for this skeleton code, is that cpu utilization exceeds 90%. Once this condition evaluates to TRUE, this Policy Decision Point, creates a class object for each of the following classes:
Platinum - 50% Gold - 25% Silver - 15% Bronze -10%
and replaces this with lower bandwidth percentages. An alternative simply retrieves the QInterface object and lowers the entire interface bandwidth, thereby controlling the PEP’s input rate, thereby controlling the amount of traffic sent to the servers.
________________________________________________________________________________*/
continued

20 Enterprise Quality of Service (QoS) Part II: Enterprise Solution using SolarisTM Bandwidth Manager 1.6
*/
import Java.util.*;import Java.net.*;import Java.lang.reflect.*;import Java.io.*;import com.sun.jaw.reference.query.*;import com.sun.jaw.reference.client.adaptor.*;import com.sun.jaw.reference.client.mo.*;import com.sun.jaw.impl.adaptor.security.*;import com.sun.jaw.impl.adaptor.http.*;
import Java.util.Vector;import Java.io.PrintWriter;
import com.sun.jaw.reference.common.*;import com.sun.ba.common.*;import com.sun.ba.mo.*;import com.sun.ba.events.*;import com.sun.ba.config.*;
public class QoSSBM implements QConstants{
private static void usage() { System.err.println("Usage: Java QoSSBM [PEP]"); }
public void reconfigurePEP( QDynamicConfMO runningConf)
throws InstanceAlreadyExistException, InstanceNotFoundException {
try{ ServerSocket PEPsock = new ServerSocket(3001);
Loop: while (true) {
Socket pepsocket=PEPsock.accept();
BufferedReader pepin = new BufferedReader(new InputStreamReader(pep-socket.getInputStream() ));
System.out.println("--------------------- data from agent ------------------");System.out.println(pepin.readLine());
if Agent cpu utilization data < threshold{ continue Loop: }
/*
continued

Appendix A 21
Create the new lower b/w classes that will replace existing classes definitions Note these class names must match the class definitions infile:deepak.ba.conf-2.27.5pm */
System.out.println("creating modified classes for PEP reconfigura-tion...\n"); try {
/* Platinum Class reconfiguration */
QIfName hmein = new QIfName("hme2_in"); System.out.println("QIfName hmein = " + hmein);
QClassName pn = new QClassName(hmein, "platclass"); System.out.println("QClassName pn =" + pn);
QClass platcl = runningConf.performGetClass(pn); System.out.println("QClass platcl="+platcl);
platcl.setName("platclass"); platcl.setBandwidth(40); platcl.setPriority((byte) 1);
System.out.println(" Downloading Reprovisioned Class information toPEP"); pn = runningConf.performModifyClass(pn,platcl); System.out.println(" Modified pn=" + pn);
/* Gold Class reconfiguration */
QClassName gn = new QClassName(hmein, "goldclass");
QClass goldcl = new QClass();

22 Enterprise Quality of Service (QoS) Part II: Enterprise Solution using SolarisTM Bandwidth Manager 1.6
PEP Agent Pseudo Code
This is the feedback of a server load to the Policy server via socket connection.
/*__________________________________________________________________________
PEP: Policy Enforcement Point Server Agent
DESC: This Java client code, runs on the server as an PEP agent. This agent continually sends feedback peformance data to the Policy Server, which then decides what action to take. This is a skeleton code, that still needs to have code written to open another socket that accepts reconfiguration commands from the PDP. Some of this code was borrowed from the Sun MC 3.0 examples. Reconfiguration of this pep is currently via rsh system calls.
AUTHOR: Deepak Kakadia, Staff Engineer, Enterprise Services, Sun Microsystems
DATE: March 2 2001
__________________________________________________________________________
*/import Java.net.*;import Java.io.*;
import com.sun.symon.base.client.*;import Java.util.Vector;
public class PEP extends SMRawDataResponseAdapter {
Socket pdpsock = null; InputStream pdpin =null; PrintStream pdpout =null;
public PEP( String server_name, int server_port, int agent_port, String user, String password ) throws Exception { try { String publicKey = "687a8398ad4a85077d33b72a94e16ffde0c4ba023e" + "9c9ba77b247cc25bd3cd0015bc24b7429916751e68" + "1fd02e5ad6eb5345eb7c75b39a1c304e0f000846aa" + "470b755b0640af974e7fc70daa6191dff6efa31a09" + "431bb5e9848b7dc4cf4b97e1dbca31792d2860ca5a" + "5990dfb369e1bcf296274a4e4984c8089329679dd3" + "04cd";
System.out.println(" Connecting to local Sun MC 3.0 Agent...."); SMLogin obj = new SMLogin();
obj.connect(server_name, server_port, user, password, publicKey); System.out.println("Successfully Connected and Authenticated");
continued

Appendix A 23
System.out.println(" connecting to pdp server - angeli ..."); pdpsock = new Socket("angeli",3001);
pdpin = pdpsock.getInputStream(); /* future to process reconfigurationcommands from PDP */ pdpout =new PrintStream(pdpsock.getOutputStream()); /* polling serverresource utilization data to PDP */
SMRawDataRequest req = obj.getRawDataRequest();
while(true) {
String[] urlarr = new String[2];
urlarr[0] = "snmp://" + server_name + ":" + agent_port + "/mod/kernel-reader/cpu-detail/cpu-util/cpuUtilTable" + "/cpuUtilEntry/cpu_idle";
urlarr[1] = "snmp://" + server_name + ":" + agent_port + "/mod/kernel-reader/cpu-detail/cpu-util/cpuUtilTable/" + "cpuUtilEntry/cpu_user";
Vector urlvect = new Vector(); urlvect.addElement(urlarr[0]); urlvect.addElement(urlarr[1]);
req.getURLValue(urlvect, "2", this, this);
System.out.println("sleeping..."); Thread.sleep(2000);
}
} catch (Exception e) { System.out.println(e.getMessage()); } }
public void getURLResponse( SMRequestStatus status, Vector dat, Object identifier){ int error = status.getReturnCode(); if (error == SMErrorCode.SUCCESS) { if (dat.size() != 2) { System.out.println("Incorrect data returned. size =" + dat.size()); } else {
for (int i = 0; i < dat.size(); i++) {
continued

24 Enterprise Quality of Service (QoS) Part II: Enterprise Solution using SolarisTM Bandwidth Manager 1.6
Vector row = (Vector) dat.elementAt(i); pdpout.println(row.elementAt(0)); for (int j = 0; j < row.size() ; j++) { if (i == 0) {
System.out.println("Sending Feedback to PDP -% CPU Idletime for cpu(s): " + row.elementAt(j)); pdpout.println(row.elementAt(j)); } else{ System.out.println("% CPU User time for cpu(s): " + row.elementAt(j)); } } } } } else { // Failure // The various error codes as in SMErrorCode may be reported here System.out.println("Error code = " + error + " " + "Msg Text = " + status.getMessageText() + " " + "Exception = " + (status.getException()).getMessage()); } }
private static void usage() { System.out.println( "usage: Java PEP " + "server_name server_port agent_port user password"); }
public static void main(String[] args) throws Exception { if ( args.length != 5) { usage(); System.exit(1); } else { try{ new PEP (args[0], new Integer(args[1]).intValue(), new Integer(args[2]).intValue(), args[3], args[4]); System.exit(0);
} catch(Exception e){ e.printStackTrace(); } } }}