Embed Size (px)
Citation preview
All rights reserved. Enterprise Products Partners L.P.
Enterprise Products Partners L.P.Investor Presentation
January 2006
All rights reserved. Enterprise Products Partners L.P. 2
This presentation contains forward-looking statements and information that are based on Enterprise’s beliefs and those of its general partner, as well as assumptions made by and information currently available to them. When used in this presentation, words such as “anticipate,” “project,” “expect,” “plan,”“goal,” “forecast,” “intend,” “could,” “believe,” “may,” and similar expressions and statements regarding the contemplated transaction and the plans and objectives of Enterprise for future operations, are intended to identify forward-looking statements. Although Enterprise and its general partner believe that such expectations reflected in such forward looking statements are reasonable, neither it nor its general partner can give assurances that such expectations will prove to be correct. Such statements are subject to a variety of risks, uncertainties and assumptions. If one or more of these risks or uncertainties materialize, or if underlying assumptions prove incorrect, actual results may vary materially from those Enterprise anticipated, estimated, projected or expected. Among the key risk factors that may have a direct bearing on Enterprise’s results of operations and financial condition are:
Fluctuations in oil, natural gas and NGL prices and production due to weather and other natural and economic forces;A reduction in demand for its products by the petrochemical, refining or heating industries;The effects of its debt level on its future financial and operating flexibility;A decline in the volumes of NGLs delivered by its facilities;The failure of its credit risk management efforts to adequately protect it against customer non-payment;Terrorist attacks aimed at its facilities;The failure to successfully integrate any future acquisitions; andThe failure to successfully integrate its operations with assets or companies, if any that it may acquire in the future.
Enterprise has no obligation to publicly update or revise any forward-looking statement, whether as a result of new information, future events or otherwise.
Forward Looking Statements
All rights reserved. Enterprise Products Partners L.P. 3
2005 Accomplishments / Takeaways
Successfully integrated EPD and GTMMerger cost savings realizedBusiness and geographic diversification have reduced volatility of cash flows
Natural hedge to natural gas prices is realDiversity largely offset effects of hurricanes and volatile energy prices
Despite a $67MM decrease in margin due to hurricanes since completing the merger with GTM, EPD has retained approximately $200MM in distributable cash flow to reinvest in a major construction phase
All rights reserved. Enterprise Products Partners L.P. 4
2005 Accomplishments / Takeaways
Leading business positions have resulted in organic business opportunities that are greater than expected
Rocky MountainsGulf of Mexico
Major construction activities that began in 2005 with emphasis on Gulf of Mexico continues in 2006 with major emphasis in Rocky Mountains to support development activities in the Jonah/Pinedale, Piceance and San Juan producing regionsGrowth capital expenditures on major projects are budgeted at $1.560 billion in 2006Total portfolio of major projects that are either in development, under construction or completed but still in the ramp-up phase of commercial operations total $3.5 billion
All rights reserved. Enterprise Products Partners L.P. 5
Hurricane Update
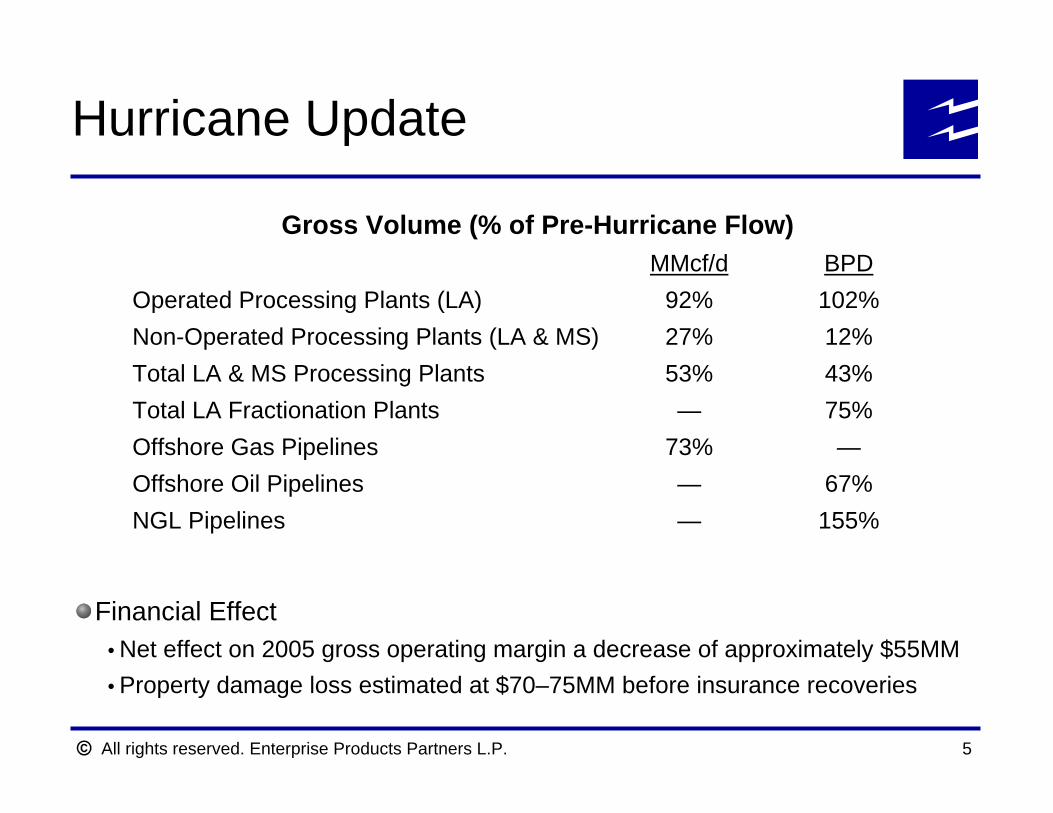
Financial EffectNet effect on 2005 gross operating margin a decrease of approximately $55MMProperty damage loss estimated at $70–75MM before insurance recoveries
BPDMMcf/d
155%—NGL Pipelines67%—Offshore Oil Pipelines—73%Offshore Gas Pipelines
75%—Total LA Fractionation Plants43%53%Total LA & MS Processing Plants12%27%Non-Operated Processing Plants (LA & MS)102%92%Operated Processing Plants (LA)
Gross Volume (% of Pre-Hurricane Flow)
All rights reserved. Enterprise Products Partners L.P. 6
EPD Growth Strategy
EPD’s midstream asset network is well positioned to access supply-side growth opportunities, increase fee-based services and generate higher returns on existing assets
Large geographic infrastructure footprintFully integrated value chain offers multiple servicesStrategically located in most attractive basinsLeverage midstream asset network to benefit from shift in regional supply sources and changes in market requirements
EPD pursuing a low-risk organic growth capital program through expansions, extensions, upgrades and new builds to feed value chain
Minimal execution risk / few large-scale greenfield projectsSupported by long-term contracts with strong producers / customersFlexibility to delay / defer projects to match production / demand profile
All rights reserved. Enterprise Products Partners L.P. 7
EPD Growth Strategy (continued)
Strong pricing fundamentals are driving record upstream activity in key EPD basins
Rockies, San Juan, Midcontinent / Permian and Barnett Shale see strong activity in 2005/6Deepwater GOM completes 10 new field discoveries in 2005 with increased semisubmersible rig count for 2006
Stable economic growth strengthens petrochemical and refinery demand for feedstock and blendstock products
Ethane consumption predicted to stay at 700–750 MBPD through 2010Announced refinery expansions increase demand for heavy end products
2006 is a “bridge year” as we continue to invest in multiple organic projects in high potential regions that further diversify our midstream portfolio, produce attractive long-term returns and increase cash flow in 2007–2008
All rights reserved. Enterprise Products Partners L.P. 8
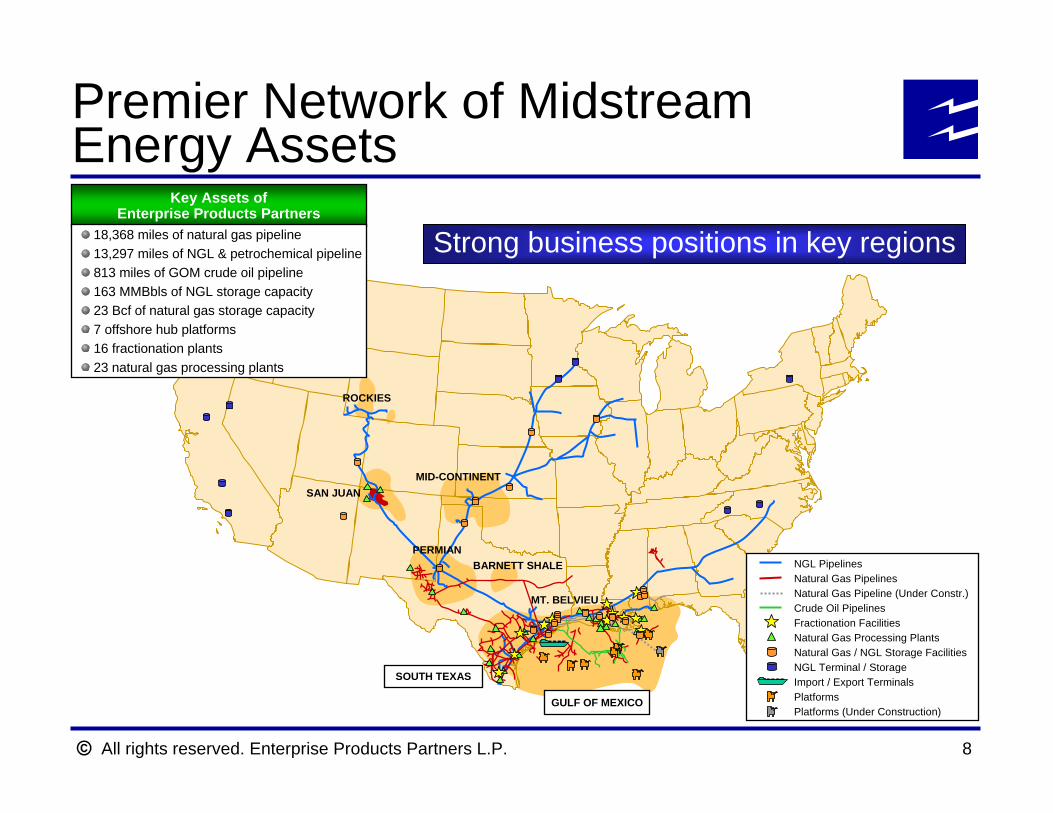
ROCKIES
SAN JUAN
BARNETT SHALEPERMIAN
GULF OF MEXICO
MID-CONTINENT
MT. BELVIEU
SOUTH TEXAS
NGL PipelinesNatural Gas PipelinesNatural Gas Pipeline (Under Constr.)Crude Oil PipelinesFractionation FacilitiesNatural Gas Processing PlantsNatural Gas / NGL Storage FacilitiesNGL Terminal / StorageImport / Export TerminalsPlatformsPlatforms (Under Construction)
Key Assets of Enterprise Products Partners
18,368 miles of natural gas pipeline13,297 miles of NGL & petrochemical pipeline813 miles of GOM crude oil pipeline163 MMBbls of NGL storage capacity23 Bcf of natural gas storage capacity7 offshore hub platforms16 fractionation plants23 natural gas processing plants
Premier Network of Midstream Energy Assets
Strong business positions in key regions
All rights reserved. Enterprise Products Partners L.P. 9
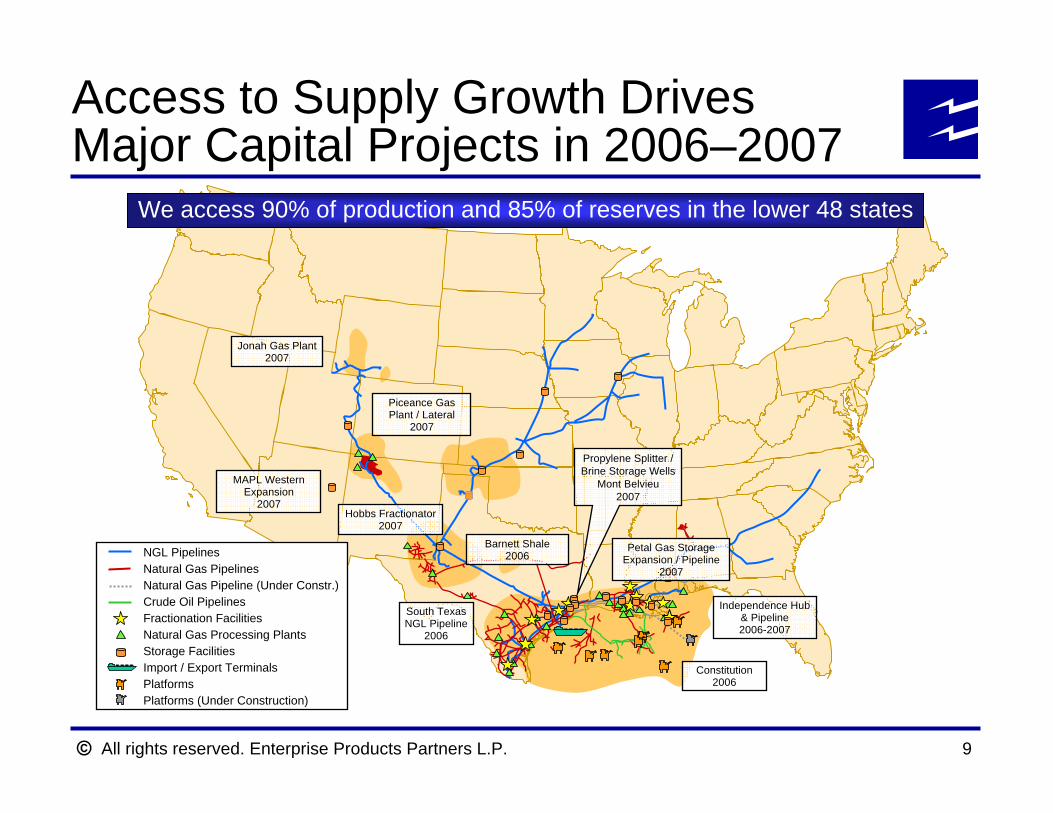
Access to Supply Growth Drives Major Capital Projects in 2006–2007
Jonah Gas Plant2007
Petal Gas StorageExpansion / Pipeline
2007
South TexasNGL Pipeline
2006
Constitution2006
Independence Hub& Pipeline2006-2007
Piceance Gas Plant / Lateral
2007
Hobbs Fractionator2007
Barnett Shale2006NGL Pipelines
Natural Gas PipelinesNatural Gas Pipeline (Under Constr.)Crude Oil PipelinesFractionation FacilitiesNatural Gas Processing PlantsStorage FacilitiesImport / Export TerminalsPlatformsPlatforms (Under Construction)
MAPL Western Expansion
2007
Propylene Splitter / Brine Storage Wells
Mont Belvieu2007
We access 90% of production and 85% of reserves in the lower 48 states
All rights reserved. Enterprise Products Partners L.P. 10
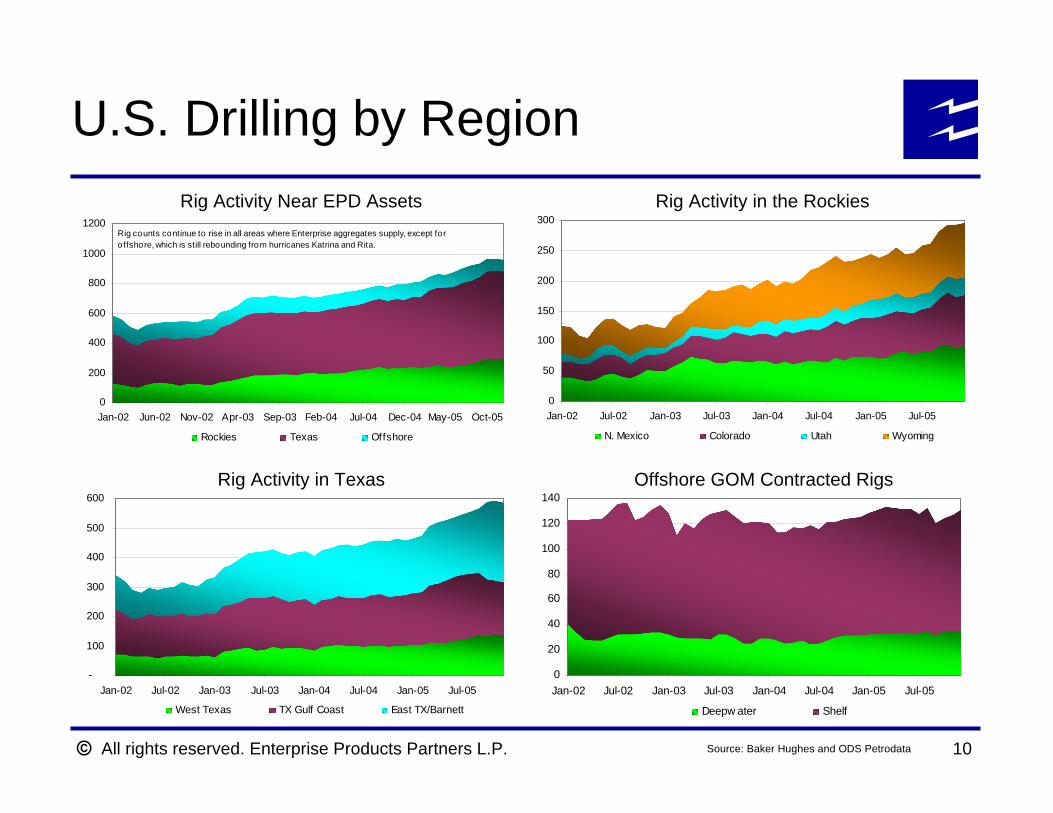
U.S. Drilling by Region
0
200
400
600
800
1000
1200
Jan-02 Jun-02 Nov-02 Apr-03 Sep-03 Feb-04 Jul-04 Dec-04 May-05 Oct-05
Rockies Texas Offshore
Rig counts continue to rise in all areas where Enterprise aggregates supply, except for o ffshore, which is still rebounding from hurricanes Katrina and Rita.
Rig Activity Near EPD Assets
0
50
100
150
200
250
300
Jan-02 Jul-02 Jan-03 Jul-03 Jan-04 Jul-04 Jan-05 Jul-05
N. Mexico Colorado Utah Wyoming
Rig Activity in the Rockies
-
100
200
300
400
500
600
Jan-02 Jul-02 Jan-03 Jul-03 Jan-04 Jul-04 Jan-05 Jul-05
West Texas TX Gulf Coast East TX/Barnett
Rig Activity in Texas
0
20
40
60
80
100
120
140
Jan-02 Jul-02 Jan-03 Jul-03 Jan-04 Jul-04 Jan-05 Jul-05
Deepw ater Shelf
Offshore GOM Contracted Rigs
Source: Baker Hughes and ODS Petrodata
All rights reserved. Enterprise Products Partners L.P. 11
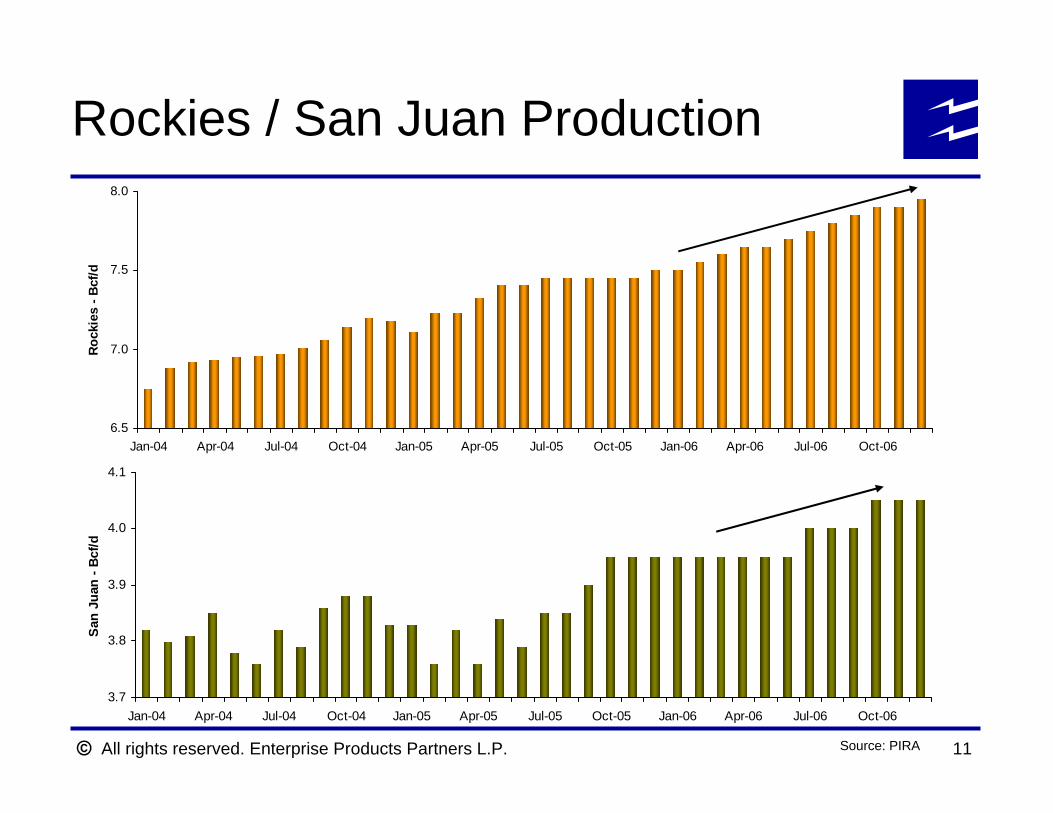
Rockies / San Juan Production
6.5
7.0
7.5
8.0
Jan-04 Apr-04 Jul-04 Oct-04 Jan-05 Apr-05 Jul-05 Oct-05 Jan-06 Apr-06 Jul-06 Oct-06
Rock
ies
- Bcf
/d
3.7
3.8
3.9
4.0
4.1
Jan-04 Apr-04 Jul-04 Oct-04 Jan-05 Apr-05 Jul-05 Oct-05 Jan-06 Apr-06 Jul-06 Oct-06
San
Juan
- Bc
f/d
Source: PIRA
All rights reserved. Enterprise Products Partners L.P.
Western U.S.Growth Strategy
All rights reserved. Enterprise Products Partners L.P. 13
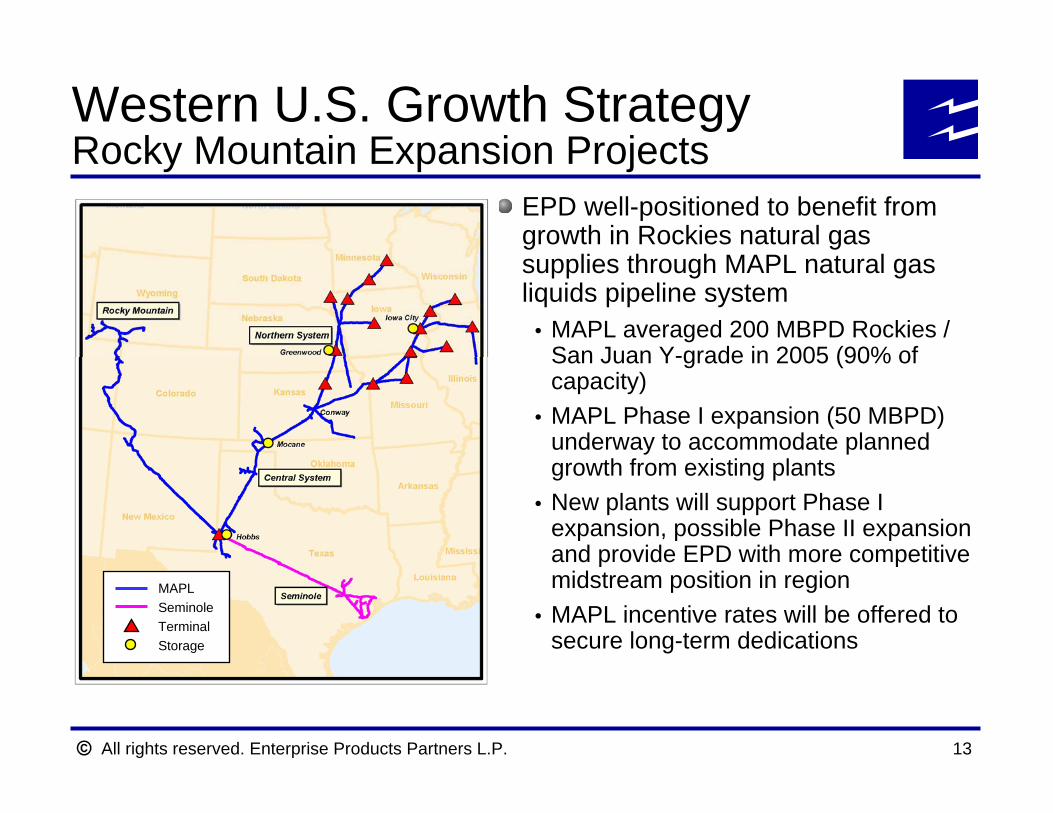
Western U.S. Growth StrategyRocky Mountain Expansion Projects
EPD well-positioned to benefit from growth in Rockies natural gas supplies through MAPL natural gas liquids pipeline system
MAPL averaged 200 MBPD Rockies / San Juan Y-grade in 2005 (90% of capacity)MAPL Phase I expansion (50 MBPD) underway to accommodate planned growth from existing plantsNew plants will support Phase I expansion, possible Phase II expansion and provide EPD with more competitive midstream position in regionMAPL incentive rates will be offered to secure long-term dedications
MAPLSeminoleTerminalStorage
All rights reserved. Enterprise Products Partners L.P. 14
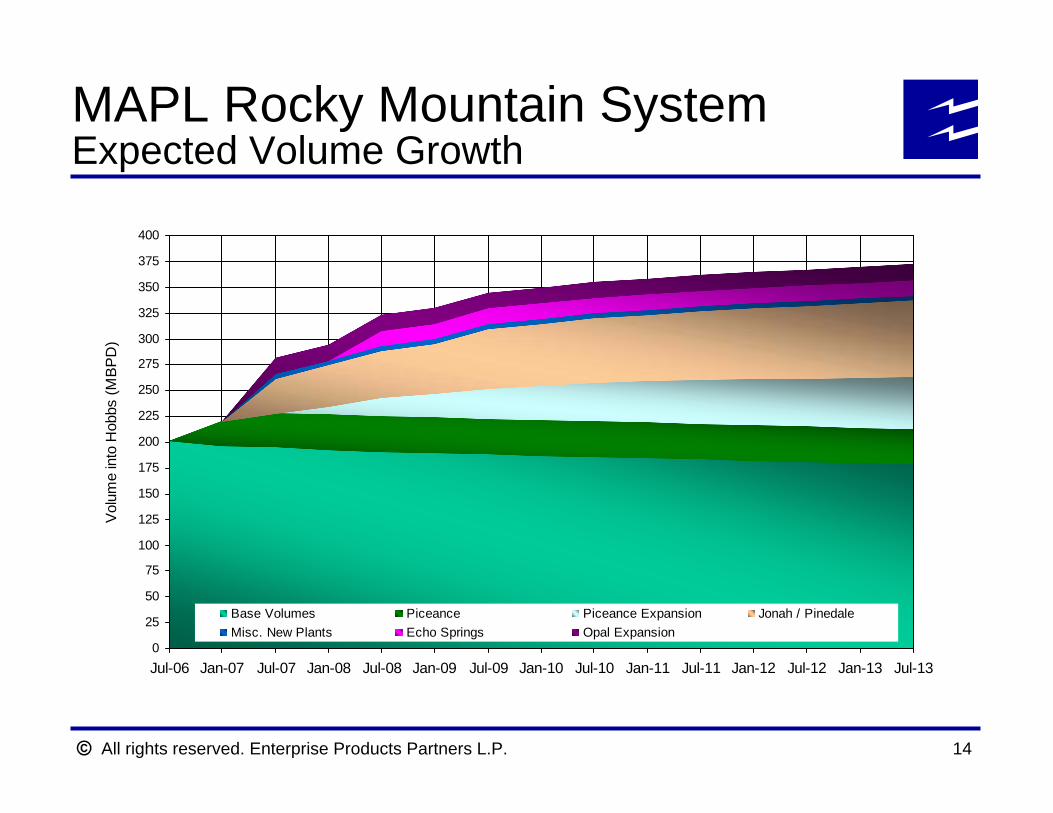
MAPL Rocky Mountain SystemExpected Volume Growth
0
25
50
75
100
125
150
175
200
225
250
275
300
325
350
375
400
Jul-06 Jan-07 Jul-07 Jan-08 Jul-08 Jan-09 Jul-09 Jan-10 Jul-10 Jan-11 Jul-11 Jan-12 Jul-12 Jan-13 Jul-13
Vol
ume
into
Hob
bs (M
BP
D)
Base Volumes Piceance Piceance Expansion Jonah / PinedaleMisc. New Plants Echo Springs Opal Expansion
All rights reserved. Enterprise Products Partners L.P. 15
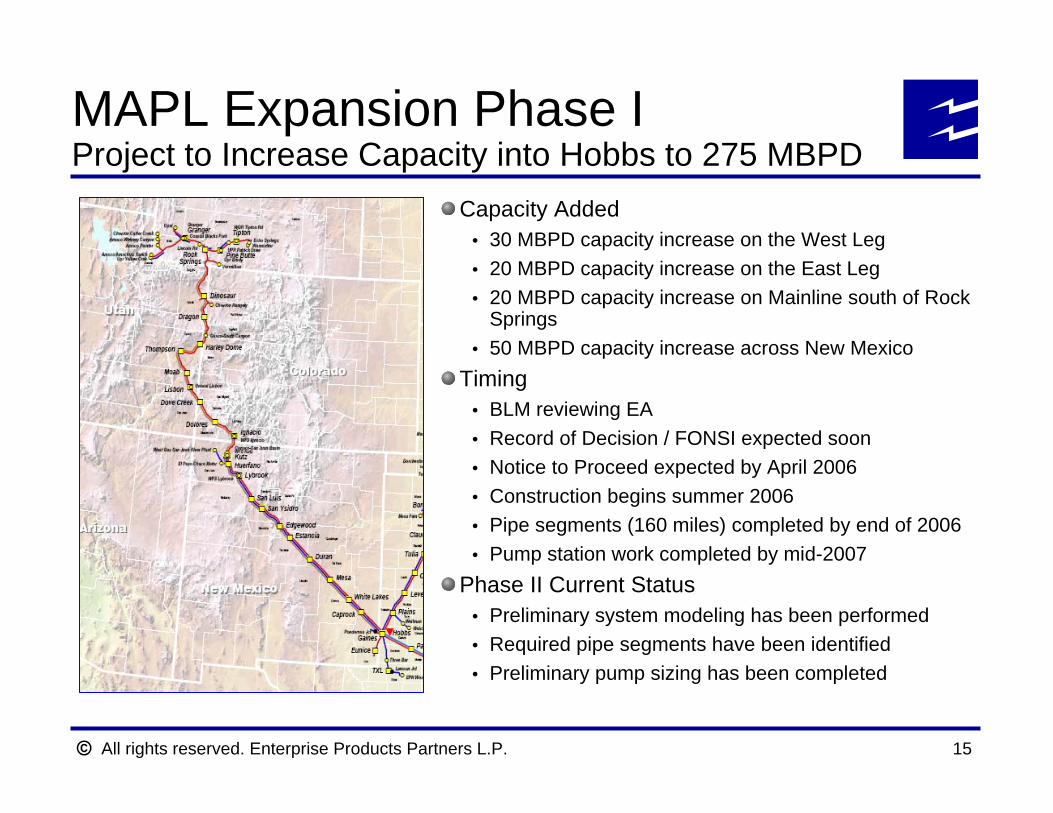
Capacity Added30 MBPD capacity increase on the West Leg20 MBPD capacity increase on the East Leg20 MBPD capacity increase on Mainline south of Rock Springs50 MBPD capacity increase across New Mexico
TimingBLM reviewing EARecord of Decision / FONSI expected soonNotice to Proceed expected by April 2006Construction begins summer 2006Pipe segments (160 miles) completed by end of 2006Pump station work completed by mid-2007
Phase II Current StatusPreliminary system modeling has been performedRequired pipe segments have been identifiedPreliminary pump sizing has been completed
MAPL Expansion Phase IProject to Increase Capacity into Hobbs to 275 MBPD
All rights reserved. Enterprise Products Partners L.P. 16
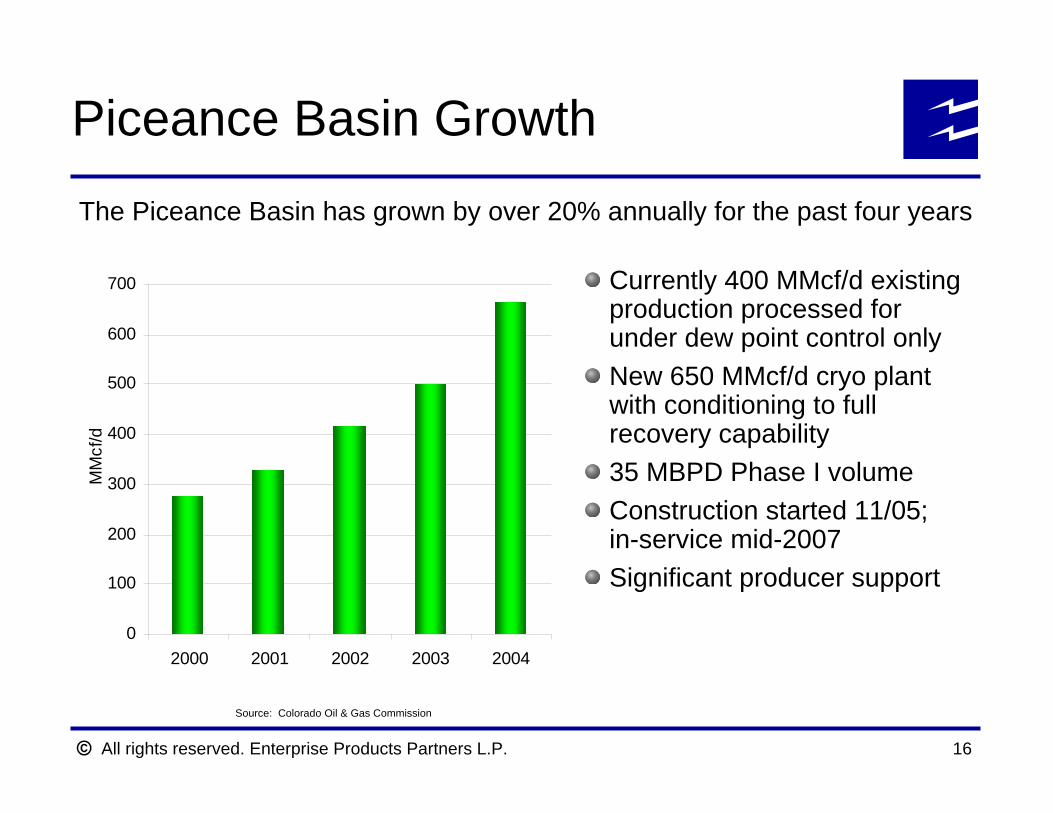
Piceance Basin Growth
The Piceance Basin has grown by over 20% annually for the past four years
0
100
200
300
400
500
600
700
2000 2001 2002 2003 2004
MM
cf/d
Source: Colorado Oil & Gas Commission
Currently 400 MMcf/d existing production processed for under dew point control onlyNew 650 MMcf/d cryo plant with conditioning to full recovery capability35 MBPD Phase I volumeConstruction started 11/05; in-service mid-2007Significant producer support

All rights reserved. Enterprise Products Partners L.P. 17
Total Field Volumes by OperatorSource: IHS Energy
BP AMERICA
ENCANA
SHELL
ULTRA
QUESTAR
OTHERS
0
200
400
600
800
1000
1200
1400
Jan-96 Jan-97 Jan-98 Jan-99 Jan-00 Jan-01 Jan-02 Jan-03 Jan-04 Jan-05
Aver
age
MM
cf/d
Jonah and Pinedale Fields Growth
Currently 275 MMcf/d existing production processed for dew point control onlyIncreased capacity of conditioning plant to 600 MMcf/d by July 2006New 650 MMcf/d cryo plant with conditioning to full recovery capability35 MBPD Phase I volumeConstruction will start 2Q2006; in-service 3Q2007Significant producer support
All rights reserved. Enterprise Products Partners L.P. 18
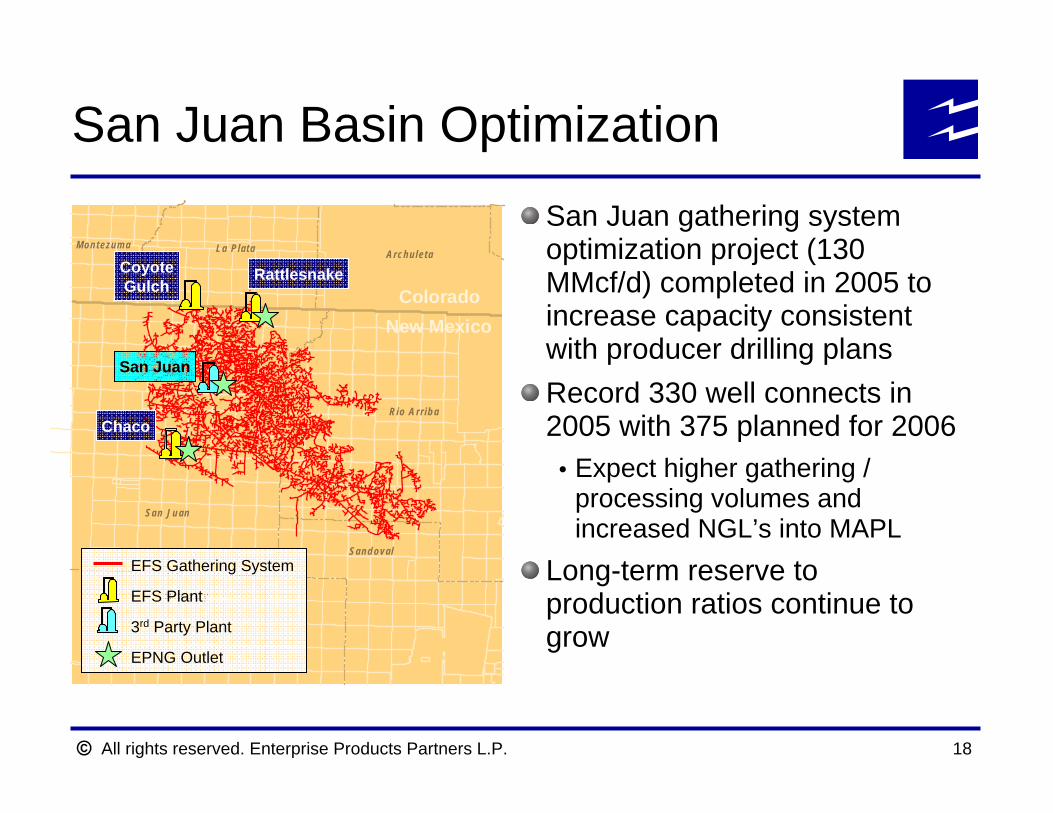
San Juan gathering system optimization project (130 MMcf/d) completed in 2005 to increase capacity consistent with producer drilling plansRecord 330 well connects in 2005 with 375 planned for 2006
Expect higher gathering / processing volumes and increased NGL’s into MAPL
Long-term reserve to production ratios continue to grow
San Juan
McKinley
Sandoval
Rio Arriba
ArchuletaLa PlataMontezuma
ColoradoNew Mexico
Chaco
San Juan
CoyoteGulch
Rattlesnake
EFS Gathering System
EFS Plant
3rd Party Plant
EPNG Outlet
San Juan Basin Optimization
All rights reserved. Enterprise Products Partners L.P. 19
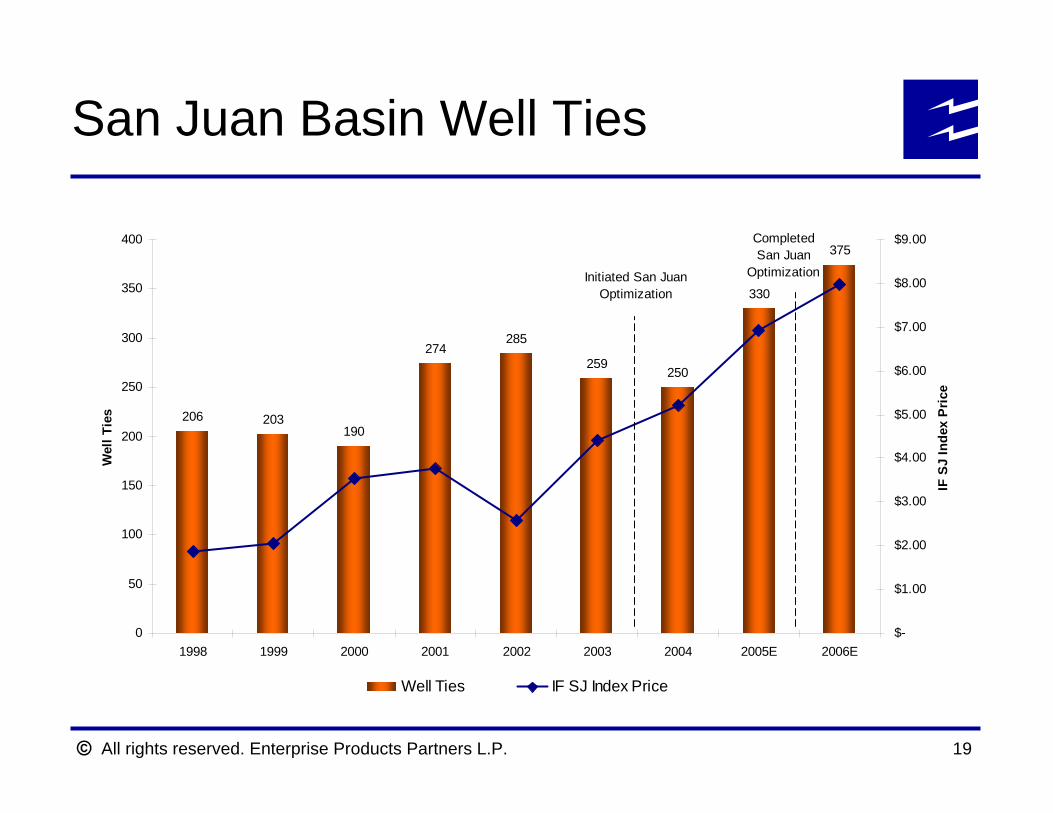
San Juan Basin Well Ties
206 203190
274285
259250
330
375
0
50
100
150
200
250
300
350
400
1998 1999 2000 2001 2002 2003 2004 2005E 2006E
Wel
l Tie
s
$-
$1.00
$2.00
$3.00
$4.00
$5.00
$6.00
$7.00
$8.00
$9.00
IF S
J In
dex
Pric
e
Well Ties IF SJ Index Price
Initiated San JuanOptimization
CompletedSan Juan
Optimization
All rights reserved. Enterprise Products Partners L.P. 20
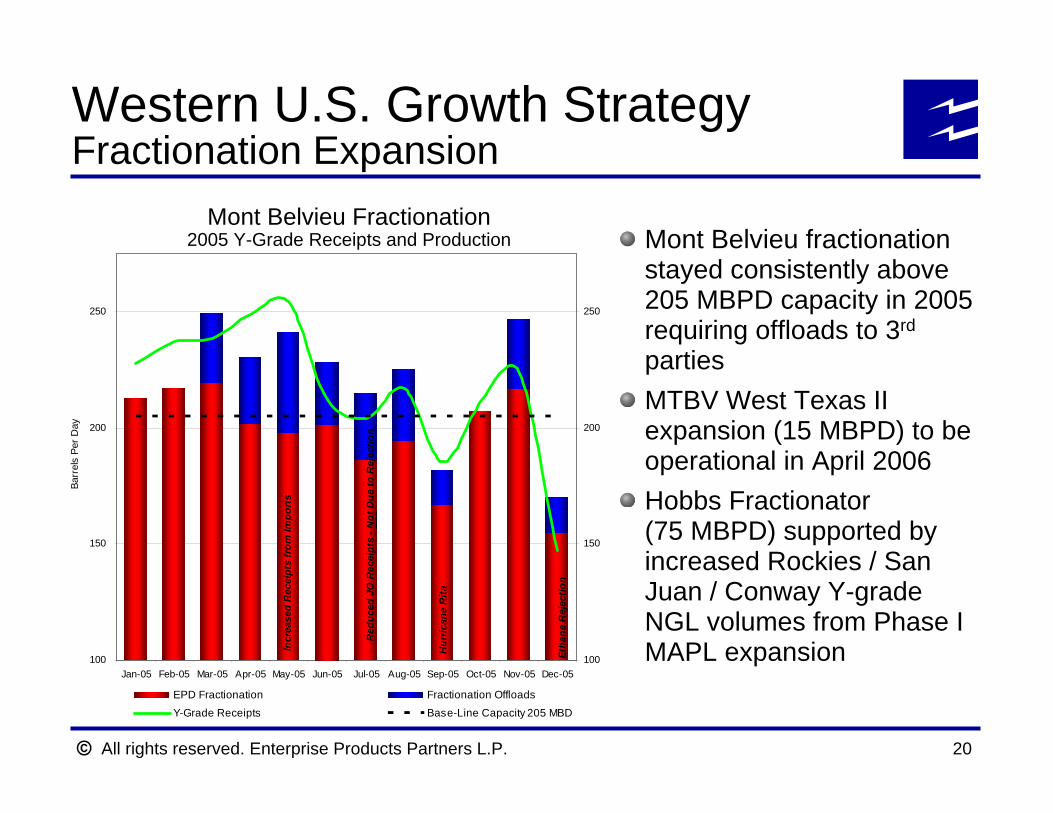
Mont Belvieu Fractionation2005 Y-Grade Receipts and Production
100
150
200
250
Jan-05 Feb-05 Mar-05 Apr-05 May-05 Jun-05 Jul-05 Aug-05 Sep-05 Oct-05 Nov-05 Dec-05
Barr
els
Per D
ay
100
150
200
250
EPD Fractionation Fractionation Offloads
Y-Grade Receipts Base-Line Capacity 205 MBD
Etha
ne R
ejec
tion
Hur
rican
e R
ita
Incr
ease
d R
ecei
pts
from
Impo
rts
Red
uced
JO
Rec
eipt
s - N
ot D
ue to
Rej
ectio
n
Mont Belvieu fractionation stayed consistently above 205 MBPD capacity in 2005 requiring offloads to 3rd
partiesMTBV West Texas II expansion (15 MBPD) to be operational in April 2006Hobbs Fractionator (75 MBPD) supported by increased Rockies / San Juan / Conway Y-grade NGL volumes from Phase I MAPL expansion
Western U.S. Growth StrategyFractionation Expansion
All rights reserved. Enterprise Products Partners L.P. 21
NM
CO
TX
KS
OK
Conway
Mocane
Skellytown
Hobbs/Gaines
MontBelvieu
HobbsFrac
Rio Grande
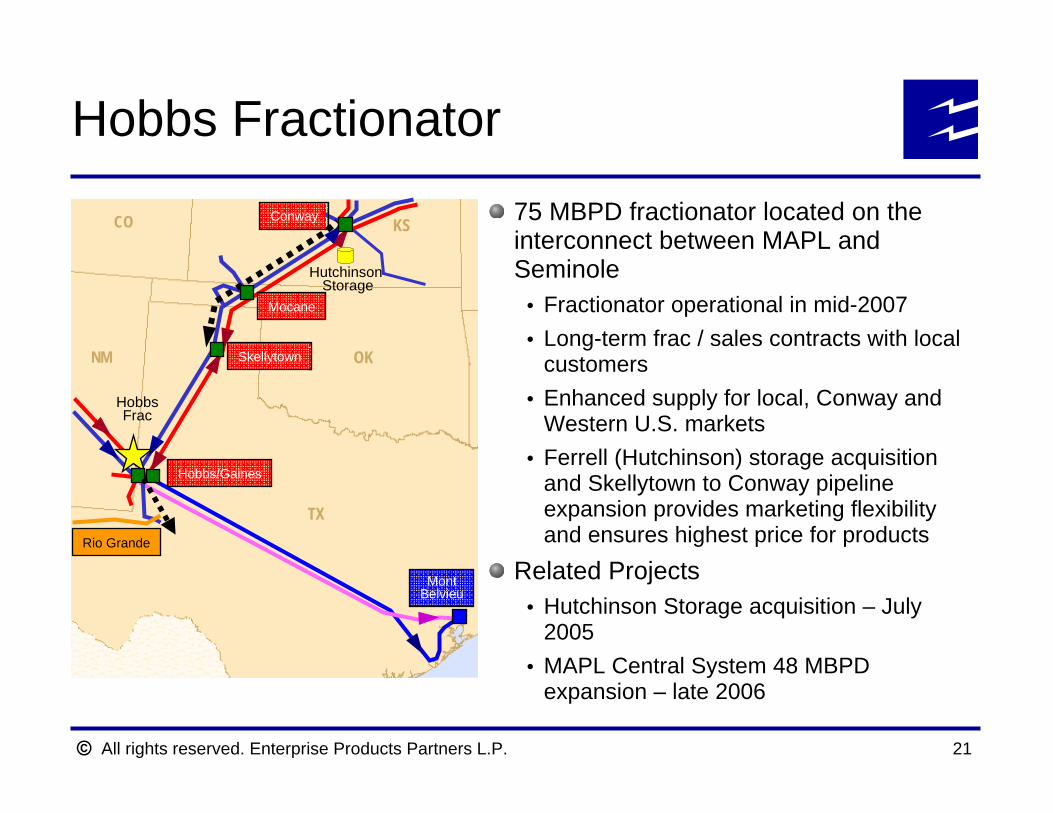
75 MBPD fractionator located on the interconnect between MAPL and Seminole
Fractionator operational in mid-2007Long-term frac / sales contracts with local customersEnhanced supply for local, Conway and Western U.S. marketsFerrell (Hutchinson) storage acquisition and Skellytown to Conway pipeline expansion provides marketing flexibility and ensures highest price for products
Related ProjectsHutchinson Storage acquisition – July 2005MAPL Central System 48 MBPD expansion – late 2006
Hobbs Fractionator
Hutchinson Storage
All rights reserved. Enterprise Products Partners L.P.
Deepwater Gulf of MexicoGrowth Strategy
All rights reserved. Enterprise Products Partners L.P. 23
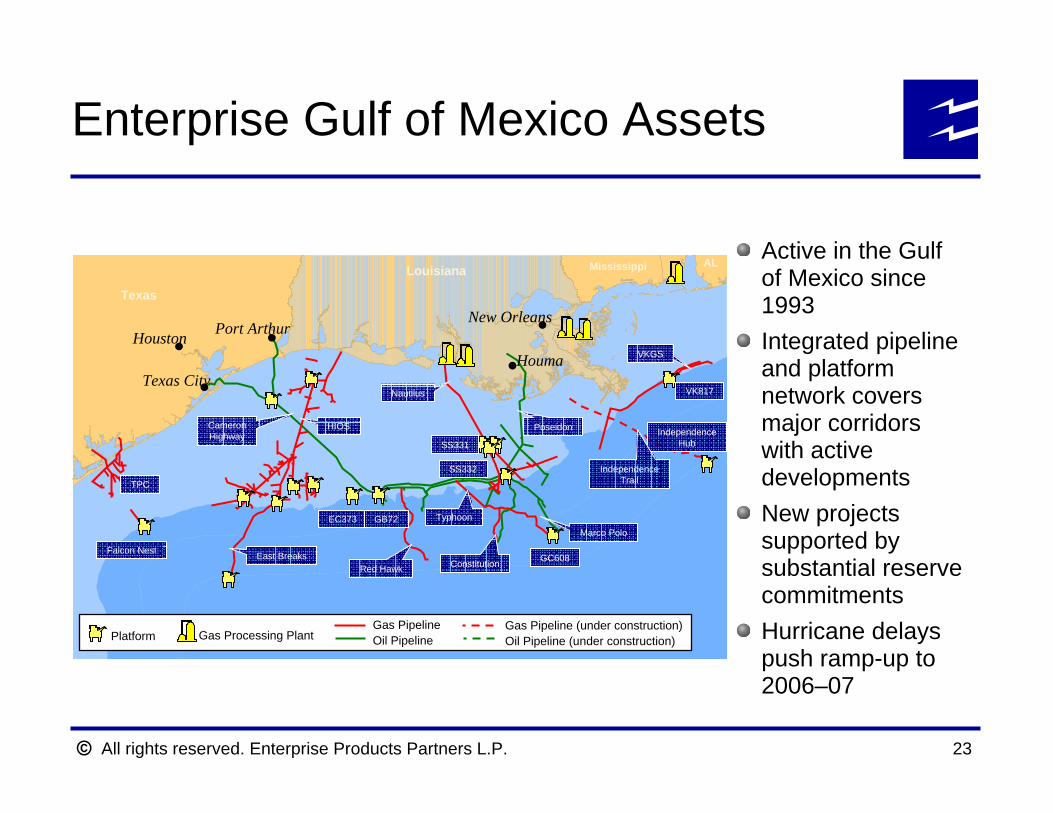
Enterprise Gulf of Mexico Assets
Texas
Louisiana Mississippi AL
Texas City
Port ArthurNew Orleans
HoustonHouma
Falcon Nest
EC373 GB72
SS332
SS331
GC608
VK817
IndependenceHub
East Breaks
CameronHighway
HIOS
Nautilus
Red Hawk Constitution
Marco Polo
IndependenceTrail
Poseidon
VKGS
Typhoon
TPC
Platform Gas Processing PlantGas PipelineOil Pipeline
Gas Pipeline (under construction)Oil Pipeline (under construction)
Active in the Gulf of Mexico since 1993Integrated pipeline and platform network covers major corridors with active developmentsNew projects supported by substantial reserve commitmentsHurricane delays push ramp-up to 2006–07
All rights reserved. Enterprise Products Partners L.P. 24
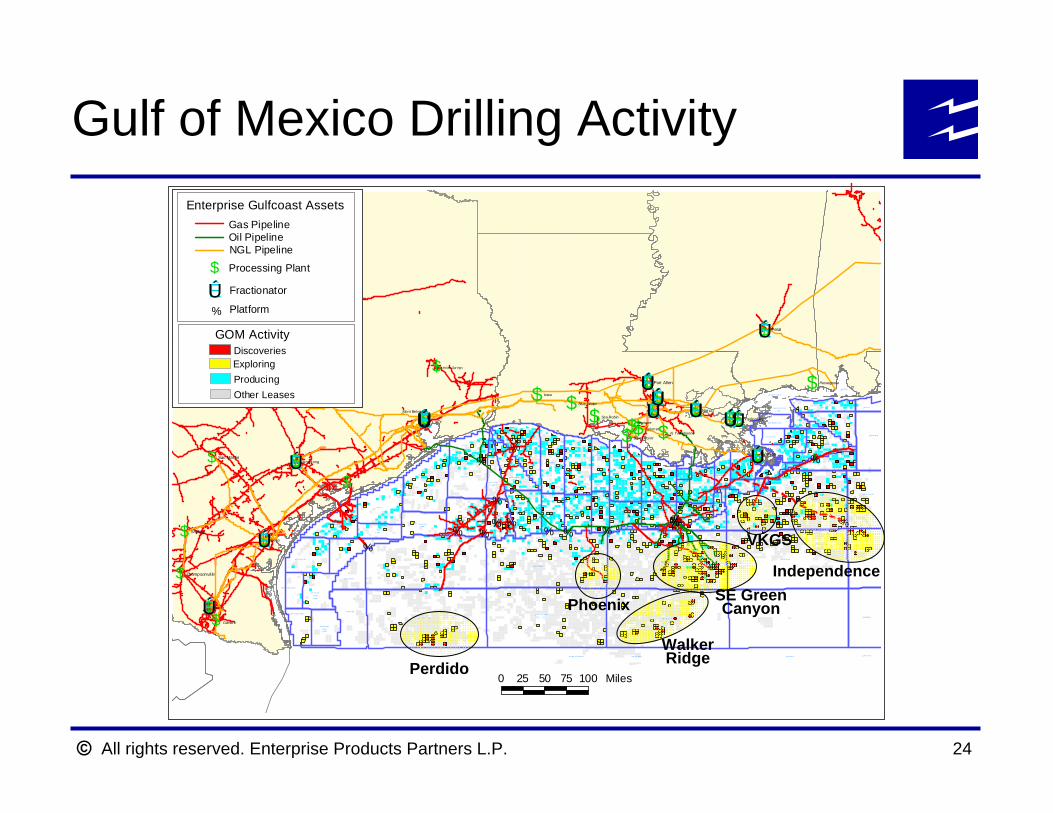
Gulf of Mexico Drilling Activity
NORT H PA DRE I SLAN D
SOUTH PA DRE I SLAND
MUSTA NG IS LA ND
NORT H PA DRE
ISLAN D
E. ADDN
SOUTH PA DRE
ISLAN D
E. ADDN
MATAG ORD A I SLAN D
CORP US CHRI STI
PORT IS ABEL
MUSTA NG IS LA ND E. AD DN
BRAZO S
S. ADDN
BRAZO S
GALVES TONS. ADDN
GALVES TON
HIG H I SLAN D
S. ADDN
EAST BREAK S
ALAMI NOS CA NYON
HIG H I SLAN D
SA BI NE P AS S
SA BI NE P AS S
HIG H I SLAN D
E. ADDN
HIG H I SLAN D
E. ADDN
S. EXT
WES T CA MER ON
W. AD DN
WES T CA MER ON
WES T CA MER ON
S. ADDN
EAST CAM ERON
EAST CAM ERON
S. ADDN
VERM ILI ON
VERM ILI ON
S. ADDN
KEATHLE Y CA NYON
GARD EN BANKS
SOUTH M ARSH
ISLAN D
S. ADDN
SOUTH M ARSH
ISLAN D
SOUTH M ARSH
ISLAN D
N. ADD N
EUGE NE I SLAN D
EUGE NE I SLAN D
S. ADDN SHIP SH OAL
S. ADDN
SHIP SH OAL
SOUTH PE LTO
SOUTH TI MBA LIERS. ADDN
SOUTH TI MBA LIER
BA Y MA RC H AN D
EWI NG BAN K
GRAN D I SLE
S. ADDN
GREE N C ANYO N
WALK ER RID GE
GRAN D I SLE
WES T DE LTA
S. ADDN
WES T DE LTA
MIS SISS IPP I SOUN D
SOUTH PA SS
S. ADDN
BRETO N S OUND
SOUTH PA SS
CHAN DELEUR SO UND
CHAN DELEUR SO UND
ADDN .
SOUTH PA SS
E. ADDN
MAI N P ASS
CHAN DELEUR
MOB ILE BAY
CH AN D EL EU R
E. AD DN
MIS SISS IPP I CANYO N
ATW ATER VALLEY
LU ND
MOB ILE
VIO SCA KNO LL
MAI N P ASSS.& E. ADD NS
HEND ERSO N
LLO YD RI DGE
DE S OTO CAN YON
DESTI N D OM E
PENSAC OLA
AMER Y TE RRAC ESIG SBEE ESCA RPM ENT LU ND SOU TH FLORI DA PLAI N
VIO SCA KNO LL
% %
%
%
%
%%%%
%%
%%%
%%
%
$
$
$
$
$
$
$
$
$
$
$$$$ $ $ $$$$$
$$$
$
$$ $$
$$$$$
$ $
ÊÚÊÚÊÚÊÚ ÊÚÊÚÊÚ
ÊÚ
ÊÚ
ÊÚ ÊÚ
ÊÚ
ÊÚÊÚÊÚÊÚ ÊÚ ÊÚÊÚÊÚÊÚÊÚÊÚÊÚ
ÊÚ
Ind ian Spr ings
Sea RobinNeptune
Pascagoula
Iowa
Blue Water
N. T errebonneBurns Poi nt
Calumet
Armstrong
Mont Belvieu
Delmita
Shoup
Petal
Nor co
YscloskeyToca
Port Allen
Venice
Gilmore
San Martin
Shil ling
Thompsonvil le
GOM Activity
Platform
Fractionator
Processing Plant
NGL PipelineOil PipelineGas Pipeline
$ÊÚ%
Enterprise Gulfcoast Assets
Producing
DiscoveriesExploring
Other Leases
0 25 50 75 100 MilesPerdido
Walker Ridge
SE Green CanyonPhoenix
Independence
VKGS
All rights reserved. Enterprise Products Partners L.P. 25
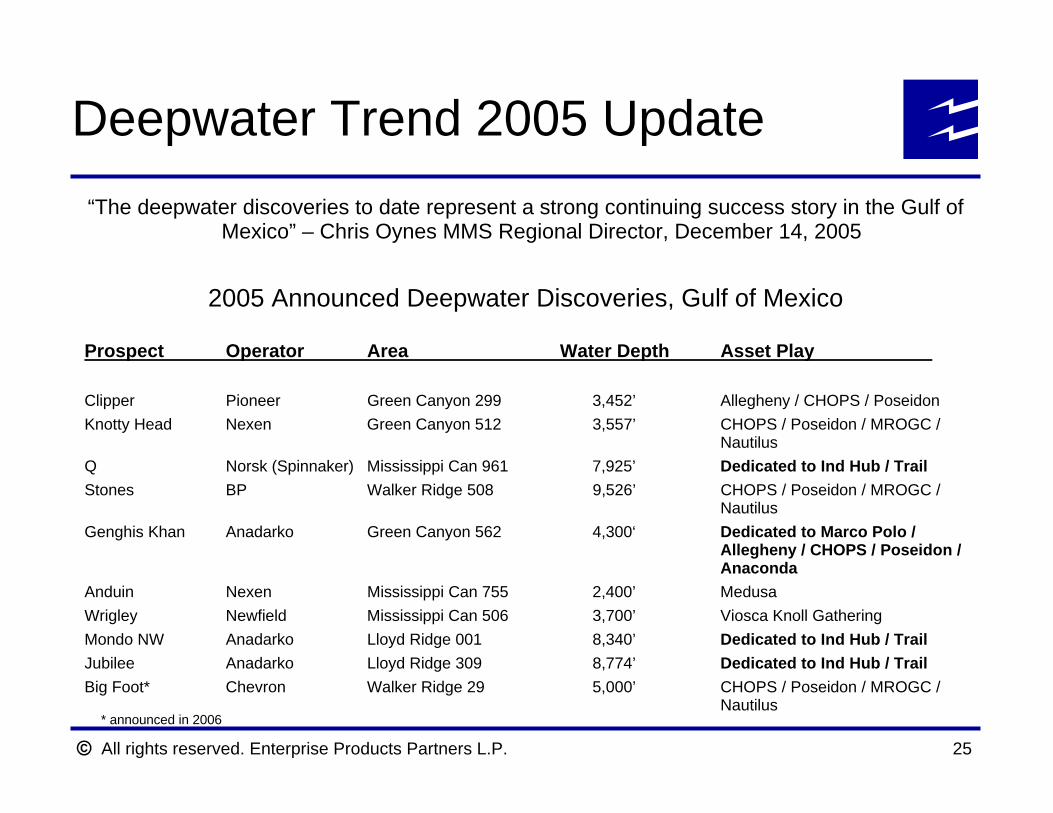
Deepwater Trend 2005 Update“The deepwater discoveries to date represent a strong continuing success story in the Gulf of
Mexico” – Chris Oynes MMS Regional Director, December 14, 2005
2005 Announced Deepwater Discoveries, Gulf of Mexico
Prospect Operator Area Water Depth Asset Play
Clipper Pioneer Green Canyon 299 3,452’ Allegheny / CHOPS / PoseidonKnotty Head Nexen Green Canyon 512 3,557’ CHOPS / Poseidon / MROGC /
NautilusQ Norsk (Spinnaker) Mississippi Can 961 7,925’ Dedicated to Ind Hub / TrailStones BP Walker Ridge 508 9,526’ CHOPS / Poseidon / MROGC /
NautilusGenghis Khan Anadarko Green Canyon 562 4,300‘ Dedicated to Marco Polo /
Allegheny / CHOPS / Poseidon / Anaconda
Anduin Nexen Mississippi Can 755 2,400’ MedusaWrigley Newfield Mississippi Can 506 3,700’ Viosca Knoll GatheringMondo NW Anadarko Lloyd Ridge 001 8,340’ Dedicated to Ind Hub / TrailJubilee Anadarko Lloyd Ridge 309 8,774’ Dedicated to Ind Hub / TrailBig Foot* Chevron Walker Ridge 29 5,000’ CHOPS / Poseidon / MROGC /
Nautilus* announced in 2006
All rights reserved. Enterprise Products Partners L.P. 26
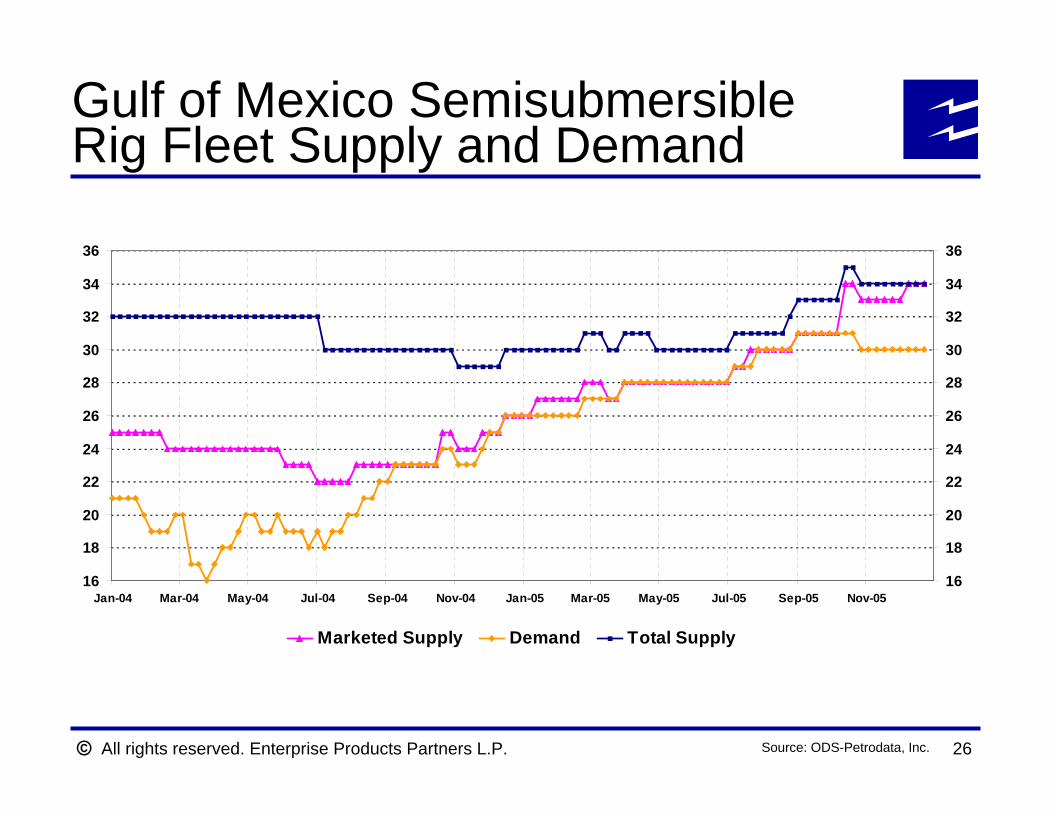
Gulf of Mexico Semisubmersible Rig Fleet Supply and Demand
16
18
20
22
24
26
28
30
32
34
36
Jan-04 Mar-04 May-04 Jul-04 Sep-04 Nov-04 Jan-05 Mar-05 May-05 Jul-05 Sep-05 Nov-0516
18
20
22
24
26
28
30
32
34
36
Marketed Supply Demand Total Supply
Source: ODS-Petrodata, Inc.
All rights reserved. Enterprise Products Partners L.P. 27
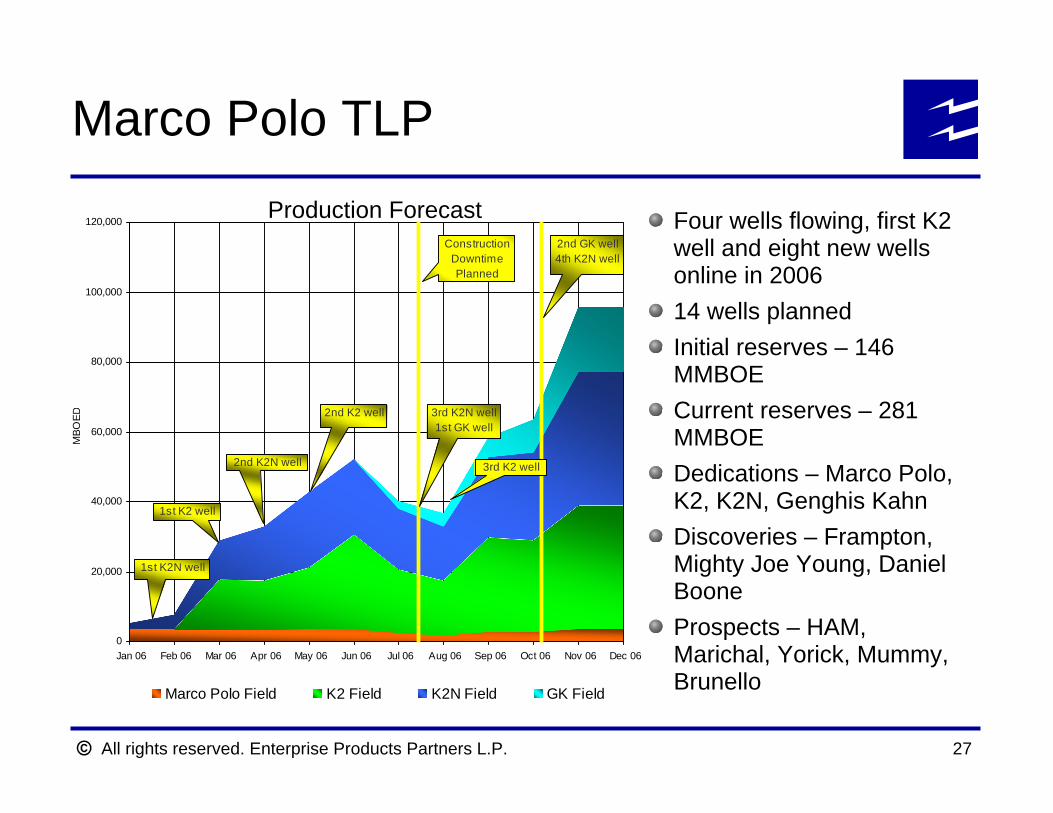
Marco Polo TLP
0
20,000
40,000
60,000
80,000
100,000
120,000
Jan 06 Feb 06 Mar 06 Apr 06 May 06 Jun 06 Jul 06 Aug 06 Sep 06 Oct 06 Nov 06 Dec 06
MBO
ED
Marco Polo Field K2 Field K2N Field GK Field
1st K2N well
1st K2 well
2nd K2N well
3rd K2N well1st GK well
2nd GK well4th K2N well
ConstructionDowntime Planned
2nd K2 well
3rd K2 well
Four wells flowing, first K2 well and eight new wells online in 200614 wells plannedInitial reserves – 146 MMBOECurrent reserves – 281 MMBOEDedications – Marco Polo, K2, K2N, Genghis KahnDiscoveries – Frampton, Mighty Joe Young, Daniel BooneProspects – HAM, Marichal, Yorick, Mummy, Brunello
Production Forecast
All rights reserved. Enterprise Products Partners L.P. 28
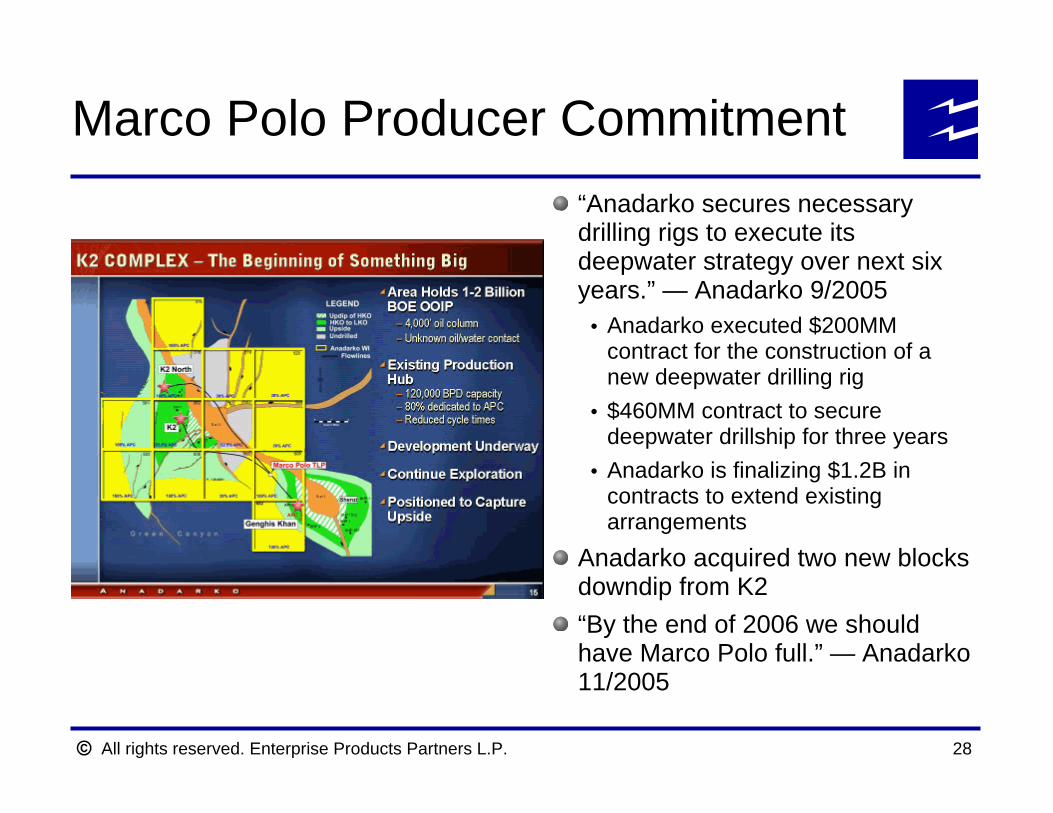
Marco Polo Producer Commitment“Anadarko secures necessary drilling rigs to execute its deepwater strategy over next six years.” — Anadarko 9/2005
Anadarko executed $200MM contract for the construction of a new deepwater drilling rig$460MM contract to secure deepwater drillship for three yearsAnadarko is finalizing $1.2B in contracts to extend existing arrangements
Anadarko acquired two new blocks downdip from K2“By the end of 2006 we should have Marco Polo full.” — Anadarko 11/2005
All rights reserved. Enterprise Products Partners L.P. 29
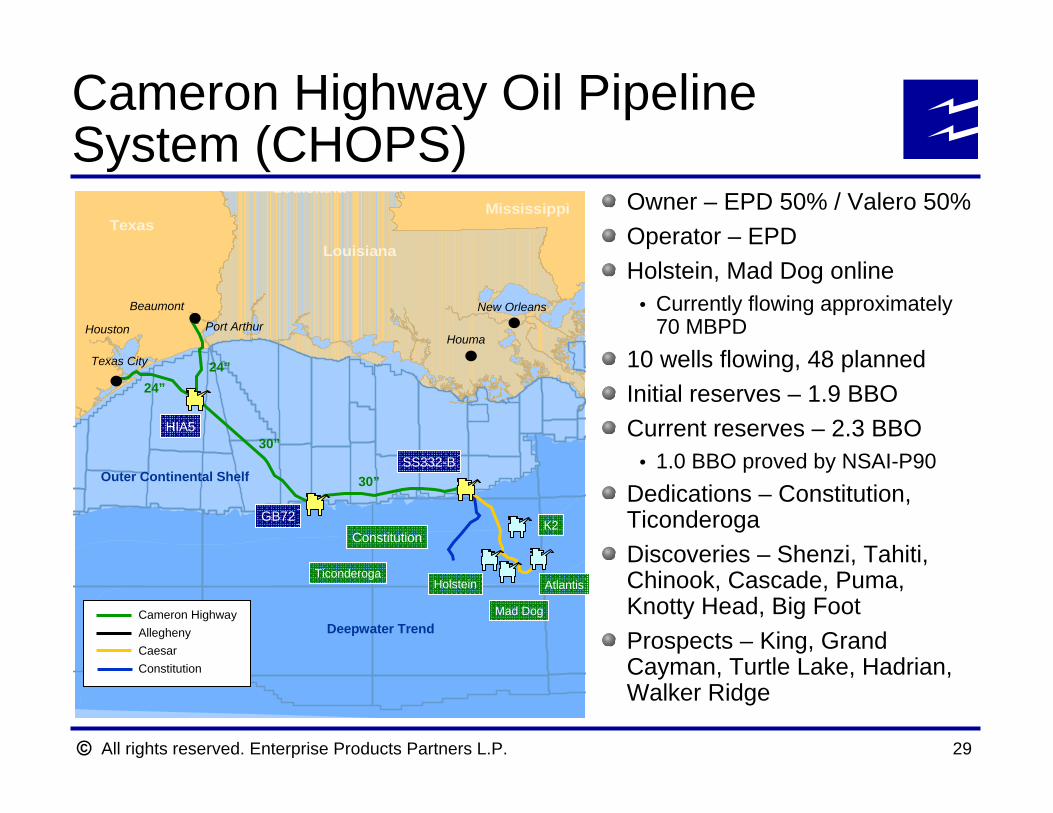
Cameron Highway Oil Pipeline System (CHOPS)
Texas
Louisiana
Louisiana
Mississippi
Deepwater Trend
Holstein Atlantis
Mad Dog
Port Arthur
Texas City
Houston
Beaumont
Houma
New Orleans
GB72
HIA5
SS332-BOuter Continental Shelf
24”24”
30”
30”
Constitution
Ticonderoga
Cameron HighwayAlleghenyCaesarConstitution
K2
Owner – EPD 50% / Valero 50%Operator – EPDHolstein, Mad Dog online
Currently flowing approximately 70 MBPD
10 wells flowing, 48 plannedInitial reserves – 1.9 BBOCurrent reserves – 2.3 BBO
1.0 BBO proved by NSAI-P90Dedications – Constitution, TiconderogaDiscoveries – Shenzi, Tahiti, Chinook, Cascade, Puma, Knotty Head, Big FootProspects – King, Grand Cayman, Turtle Lake, Hadrian, Walker Ridge
All rights reserved. Enterprise Products Partners L.P. 30
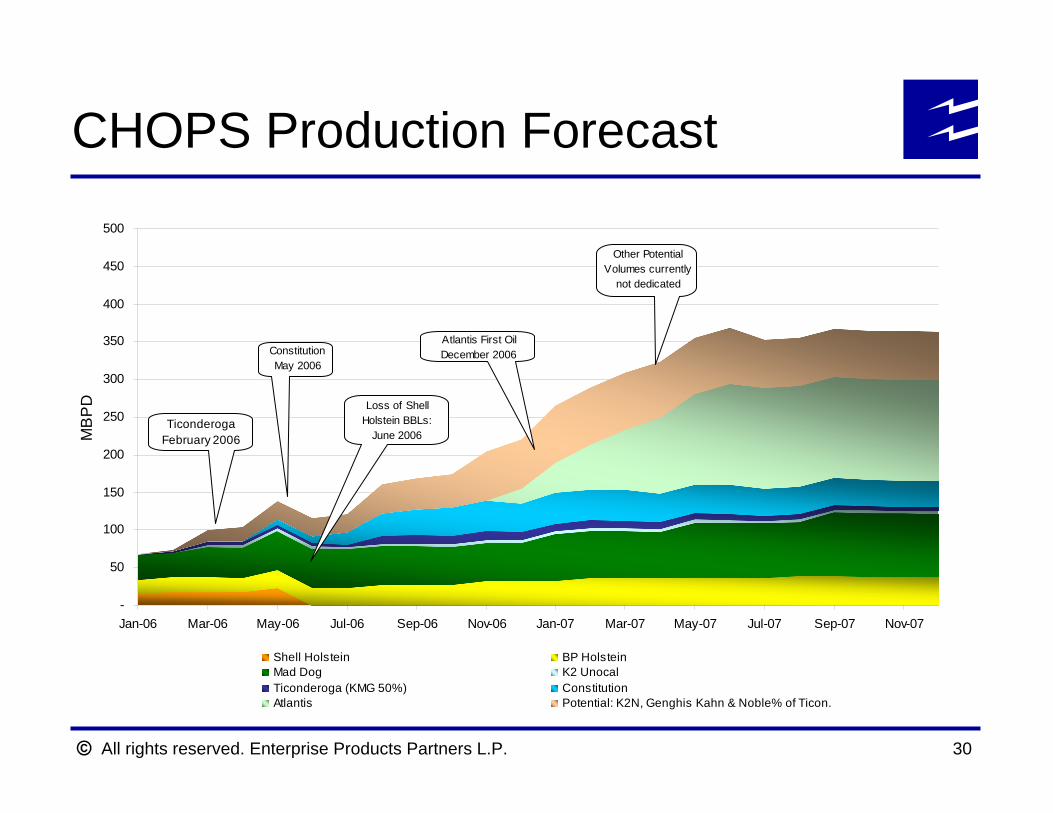
CHOPS Production Forecast
-
50
100
150
200
250
300
350
400
450
500
Jan-06 Mar-06 May-06 Jul-06 Sep-06 Nov-06 Jan-07 Mar-07 May-07 Jul-07 Sep-07 Nov-07
MB
PD
Shell Holstein BP HolsteinMad Dog K2 UnocalTiconderoga (KMG 50%) ConstitutionAtlantis Potential: K2N, Genghis Kahn & Noble% of Ticon.
Atlantis First OilDecember 2006
TiconderogaFebruary 2006
ConstitutionMay 2006
Other Potential Volumes currently
not dedicated
Loss of Shell Holstein BBLs:
June 2006
All rights reserved. Enterprise Products Partners L.P. 31
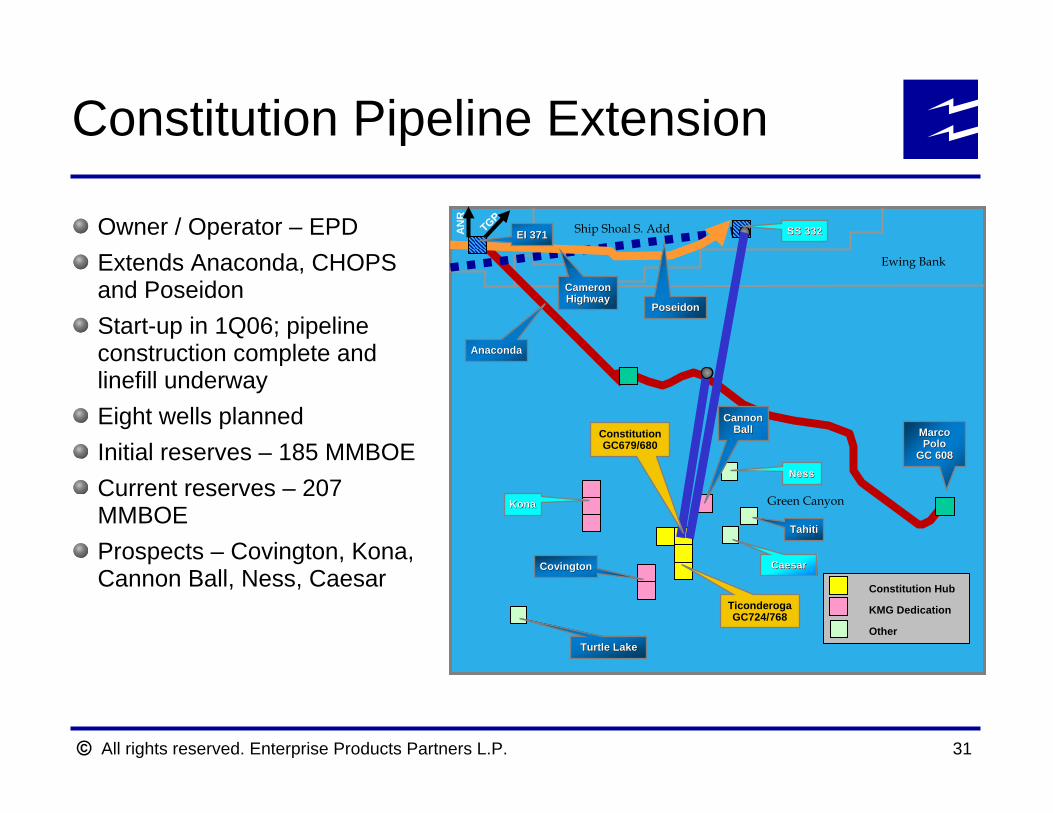
Constitution Pipeline Extension
Owner / Operator – EPDExtends Anaconda, CHOPS and PoseidonStart-up in 1Q06; pipeline construction complete and linefill underwayEight wells plannedInitial reserves – 185 MMBOECurrent reserves – 207 MMBOEProspects – Covington, Kona, Cannon Ball, Ness, Caesar
Green Canyon
Ewing Bank
Ship Shoal S. Add
Marco Marco PoloPolo
GC 608GC 608
AnacondaAnaconda
CameronCameronHighwayHighway
PoseidonPoseidon
KonaKona
CovingtonCovington
ConstitutionGC679/680
SS 332SS 332AN
R
EI 371EI 371TGP
Caesar Caesar
Tahiti Tahiti
Turtle LakeTurtle Lake
Constitution Hub
KMG Dedication
Other
TiconderogaGC724/768
NessNess
CannonCannonBallBall
All rights reserved. Enterprise Products Partners L.P. 32
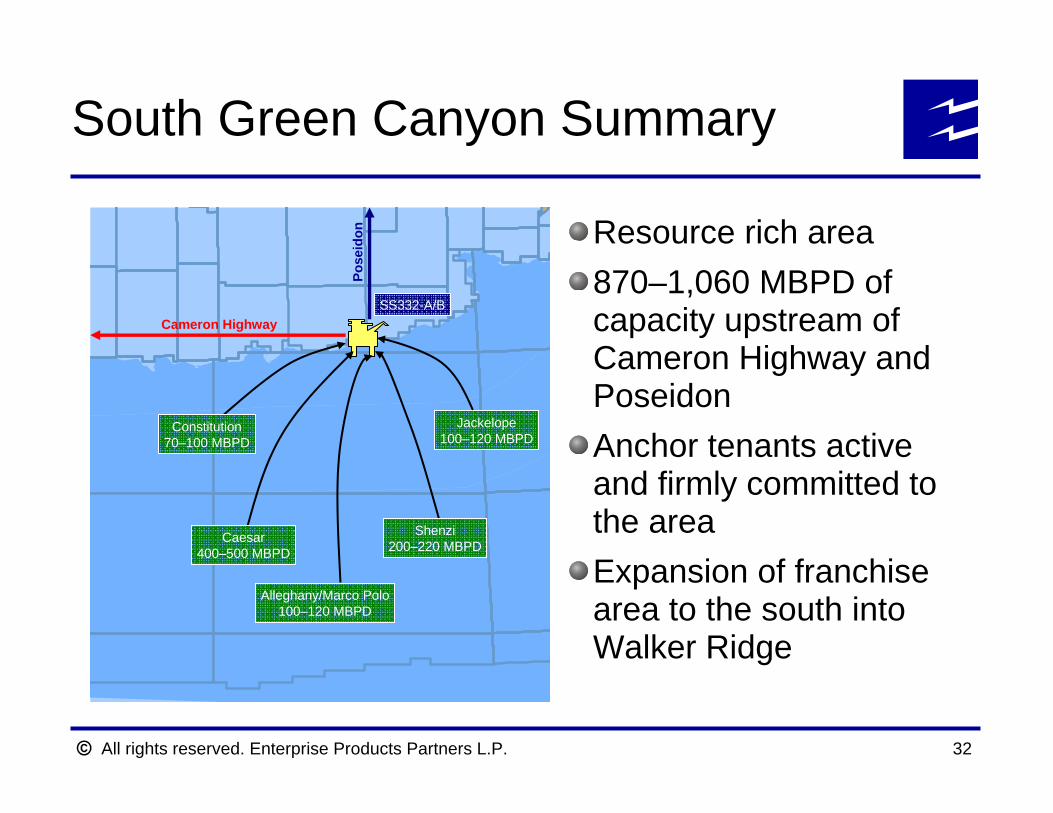
South Green Canyon Summary
Cameron HighwaySS332-A/B
Pose
idon
Constitution70–100 MBPD
Caesar400–500 MBPD
Alleghany/Marco Polo100–120 MBPD
Shenzi200–220 MBPD
Jackelope100–120 MBPD
Resource rich area870–1,060 MBPD of capacity upstream of Cameron Highway and PoseidonAnchor tenants active and firmly committed to the areaExpansion of franchise area to the south into Walker Ridge
All rights reserved. Enterprise Products Partners L.P. 33
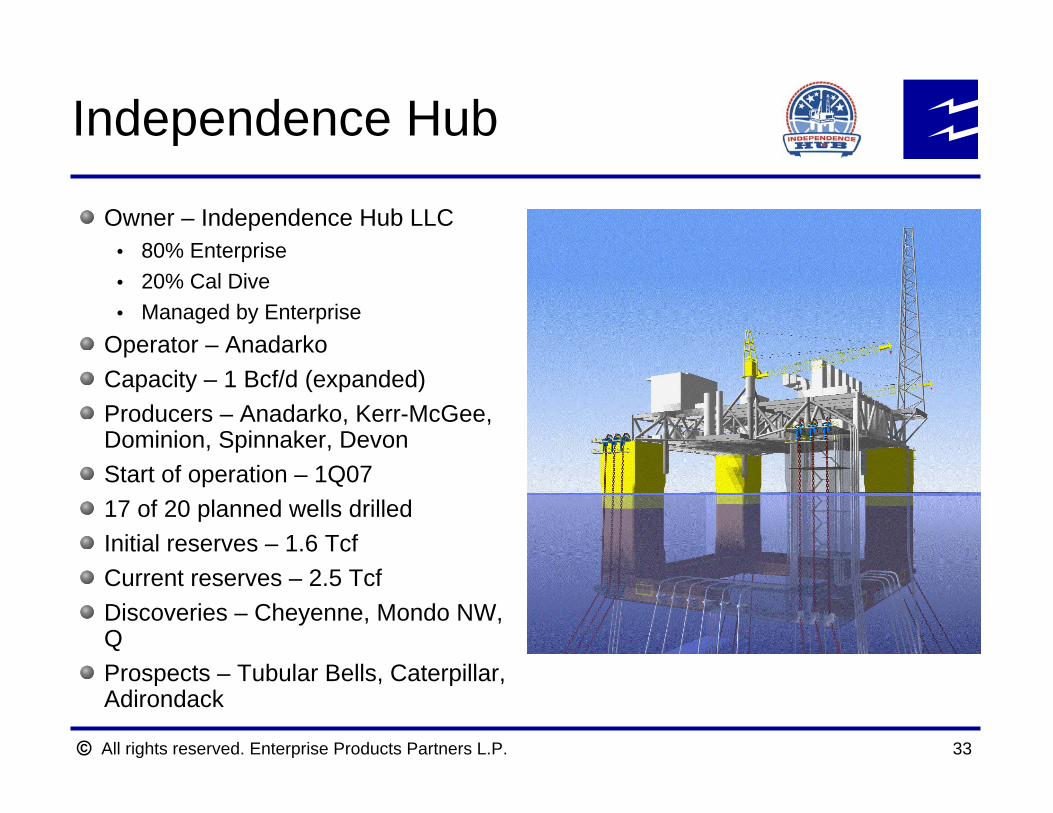
Independence Hub
Owner – Independence Hub LLC80% Enterprise20% Cal DiveManaged by Enterprise
Operator – AnadarkoCapacity – 1 Bcf/d (expanded)Producers – Anadarko, Kerr-McGee, Dominion, Spinnaker, DevonStart of operation – 1Q0717 of 20 planned wells drilledInitial reserves – 1.6 TcfCurrent reserves – 2.5 TcfDiscoveries – Cheyenne, Mondo NW, QProspects – Tubular Bells, Caterpillar, Adirondack
All rights reserved. Enterprise Products Partners L.P. 34
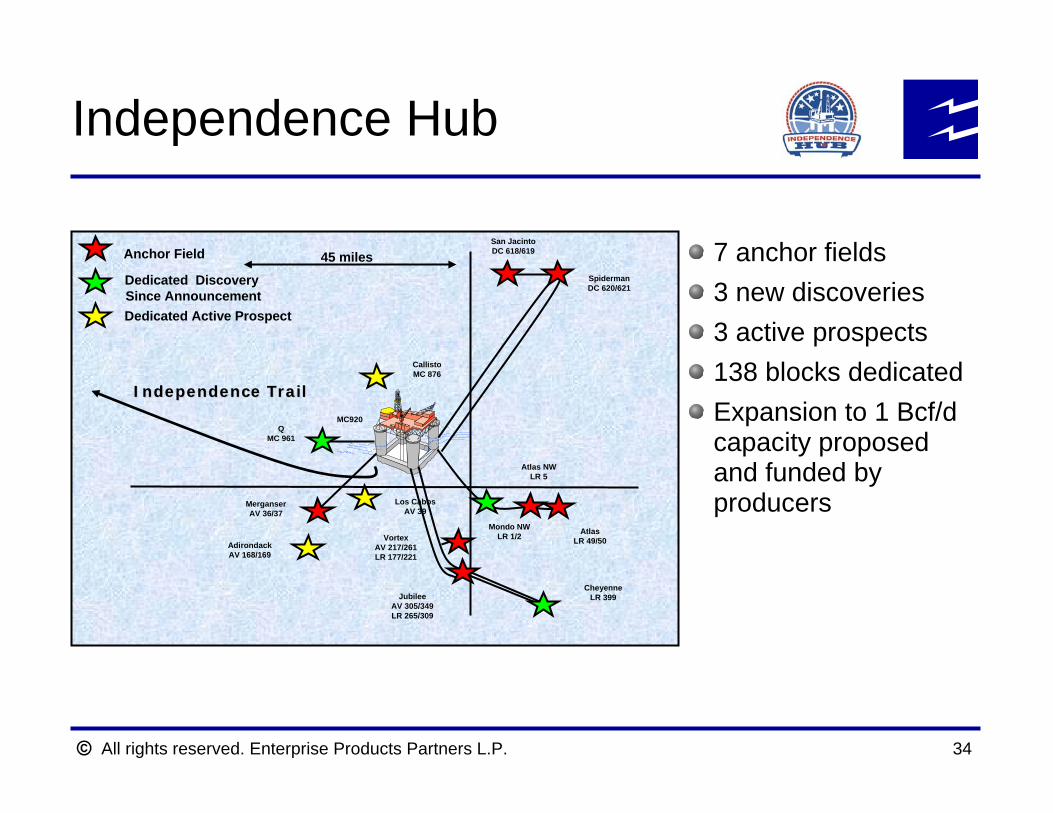
Independence Hub
SpidermanDC 620/621
San JacintoDC 618/619
MerganserAV 36/37
VortexAV 217/261LR 177/221
JubileeAV 305/349LR 265/309
Atlas NWLR 5
Anchor Field
MC920
Mondo NWLR 1/2
CheyenneLR 399
AtlasLR 49/50
Independence TrailIndependence Trail
45 miles
CallistoMC 876
Dedicated Discovery Since AnnouncementDedicated Active Prospect
QMC 961
AdirondackAV 168/169
Los CabosAV 39
7 anchor fields3 new discoveries3 active prospects138 blocks dedicatedExpansion to 1 Bcf/dcapacity proposed and funded by producers
All rights reserved. Enterprise Products Partners L.P. 35
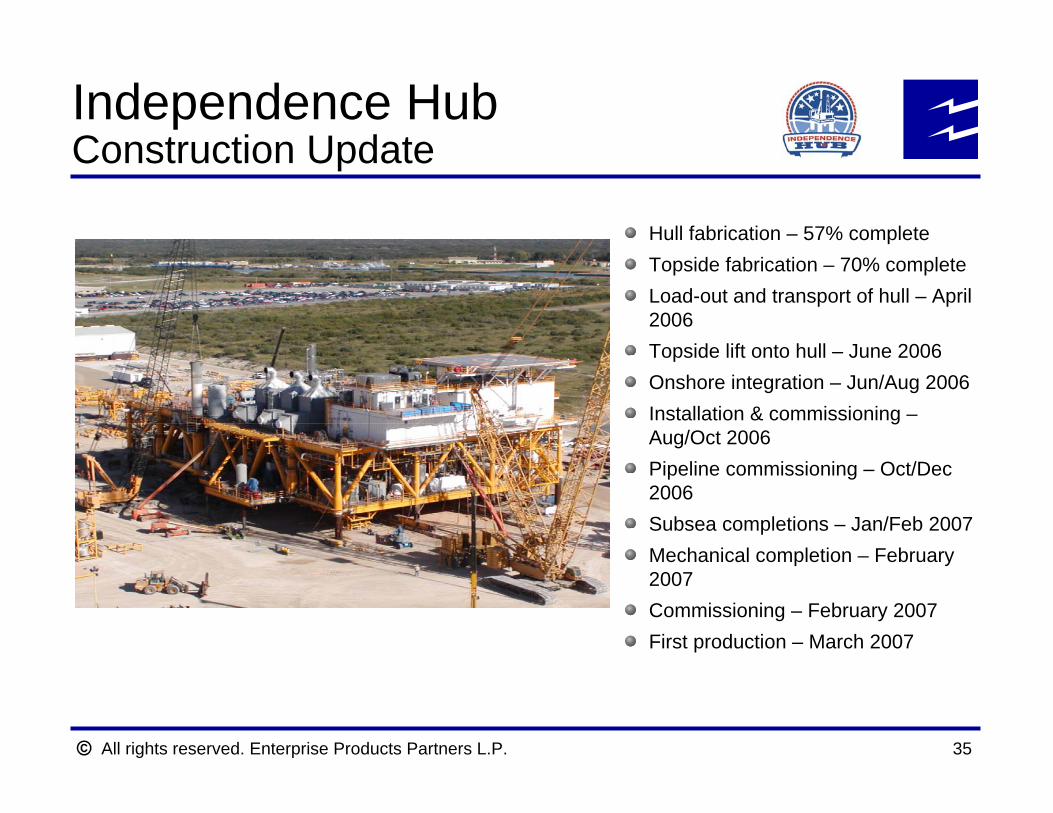
Independence Hub Construction Update
Hull fabrication – 57% completeTopside fabrication – 70% completeLoad-out and transport of hull – April 2006Topside lift onto hull – June 2006Onshore integration – Jun/Aug 2006Installation & commissioning –Aug/Oct 2006Pipeline commissioning – Oct/Dec 2006Subsea completions – Jan/Feb 2007Mechanical completion – February 2007Commissioning – February 2007First production – March 2007
All rights reserved. Enterprise Products Partners L.P.
Financial Overview
All rights reserved. Enterprise Products Partners L.P. 37
40%
7%
4% 7%
42%
Onshore Pipelines & ServicesNGL Pipelines & ServicesPetrochemical ServicesOffshore Pipelines & ServicesOther
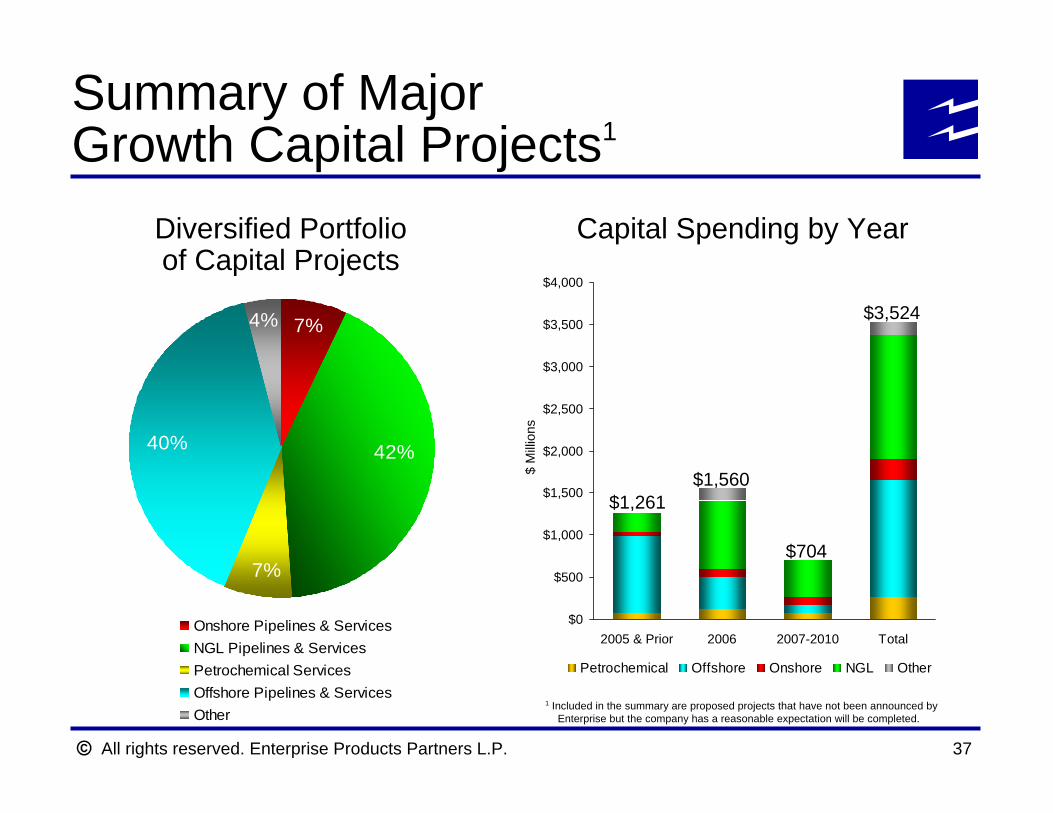
Diversified Portfolio of Capital Projects
Capital Spending by Year
Summary of Major Growth Capital Projects1
1 Included in the summary are proposed projects that have not been announced by Enterprise but the company has a reasonable expectation will be completed.
$0
$500
$1,000
$1,500
$2,000
$2,500
$3,000
$3,500
$4,000
2005 & Prior 2006 2007-2010 Total
$ M
illion
s
Petrochemical Offshore Onshore NGL Other
$1,261$1,560
$704
$3,524
All rights reserved. Enterprise Products Partners L.P. 38
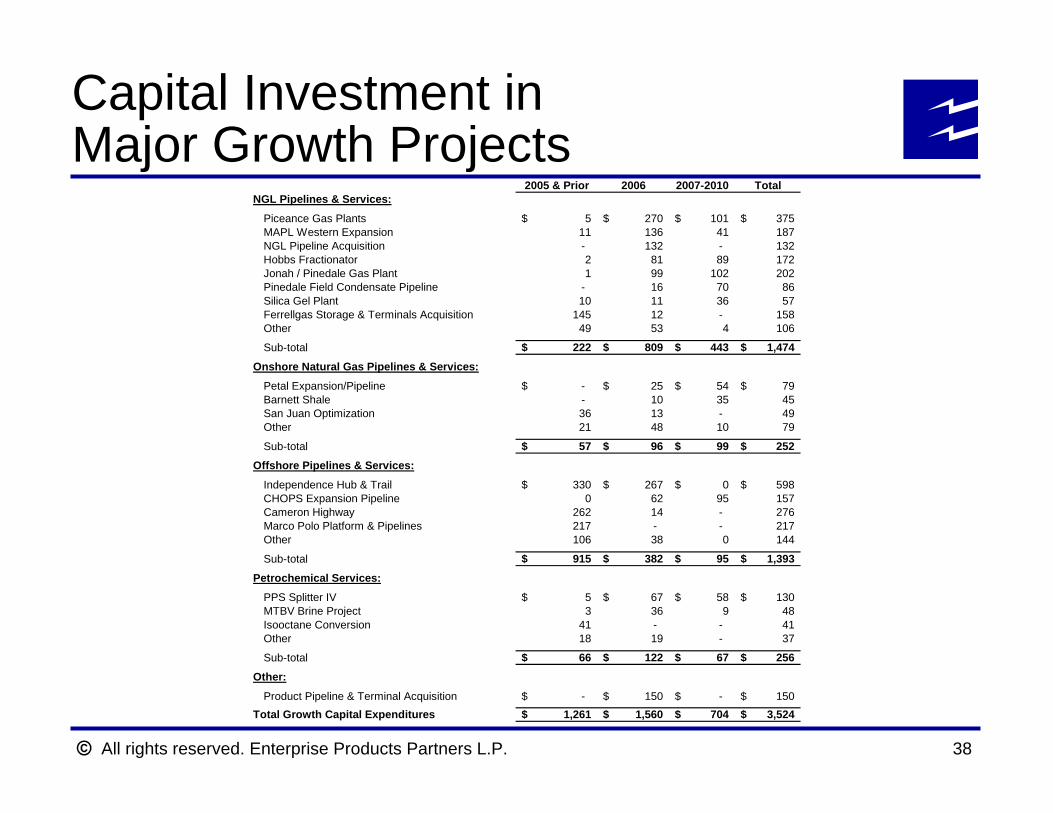
Capital Investment in Major Growth Projects
2005 & Prior 2006 2007-2010 TotalNGL Pipelines & Services:
Piceance Gas Plants 5$ 270$ 101$ 375$ MAPL Western Expansion 11 136 41 187 NGL Pipeline Acquisition - 132 - 132 Hobbs Fractionator 2 81 89 172 Jonah / Pinedale Gas Plant 1 99 102 202 Pinedale Field Condensate Pipeline - 16 70 86 Silica Gel Plant 10 11 36 57 Ferrellgas Storage & Terminals Acquisition 145 12 - 158 Other 49 53 4 106
Sub-total 222$ 809$ 443$ 1,474$
Onshore Natural Gas Pipelines & Services:
Petal Expansion/Pipeline -$ 25$ 54$ 79$ Barnett Shale - 10 35 45 San Juan Optimization 36 13 - 49 Other 21 48 10 79
Sub-total 57$ 96$ 99$ 252$ Offshore Pipelines & Services:
Independence Hub & Trail 330$ 267$ 0$ 598$ CHOPS Expansion Pipeline 0 62 95 157 Cameron Highway 262 14 - 276 Marco Polo Platform & Pipelines 217 - - 217 Other 106 38 0 144
Sub-total 915$ 382$ 95$ 1,393$
Petrochemical Services:
PPS Splitter IV 5$ 67$ 58$ 130$ MTBV Brine Project 3 36 9 48 Isooctane Conversion 41 - - 41 Other 18 19 - 37
Sub-total 66$ 122$ 67$ 256$
Other:
Product Pipeline & Terminal Acquisition -$ 150$ -$ 150$ Total Growth Capital Expenditures 1,261$ 1,560$ 704$ 3,524$
All rights reserved. Enterprise Products Partners L.P. 39
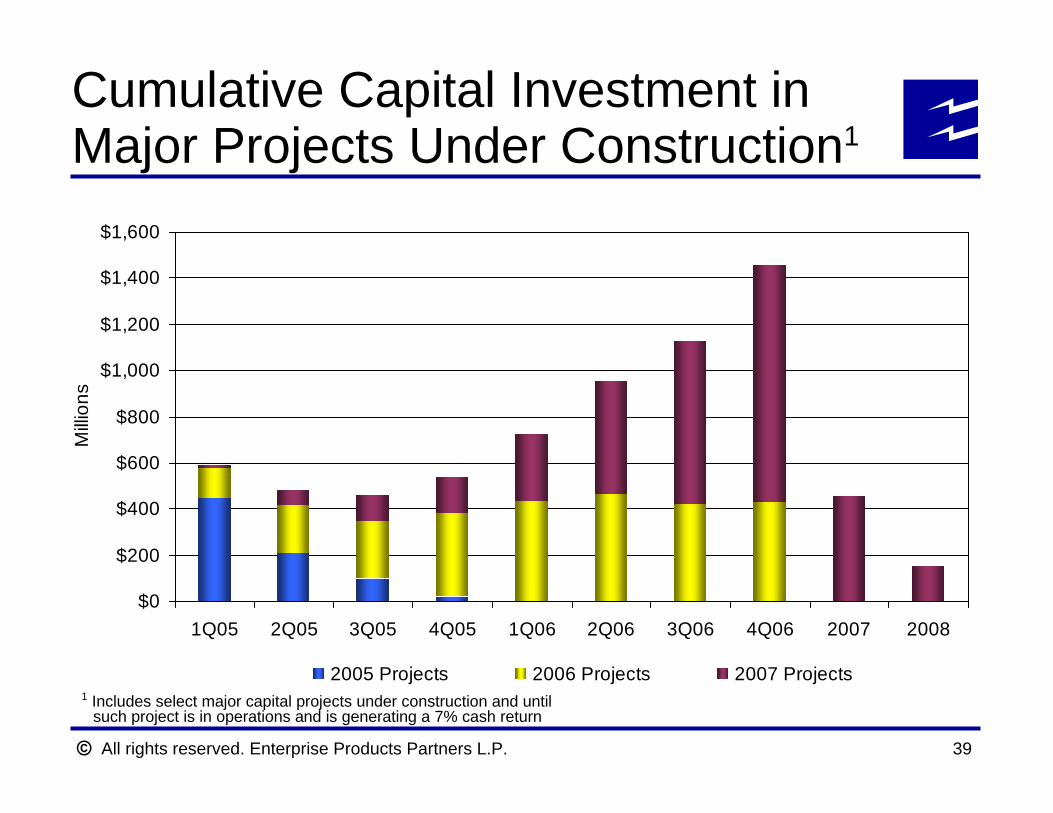
Cumulative Capital Investment in Major Projects Under Construction1
$0
$200
$400
$600
$800
$1,000
$1,200
$1,400
$1,600
1Q05 2Q05 3Q05 4Q05 1Q06 2Q06 3Q06 4Q06 2007 2008
Milli
ons
2005 Projects 2006 Projects 2007 Projects1 Includes select major capital projects under construction and until
such project is in operations and is generating a 7% cash return
All rights reserved. Enterprise Products Partners L.P. 40
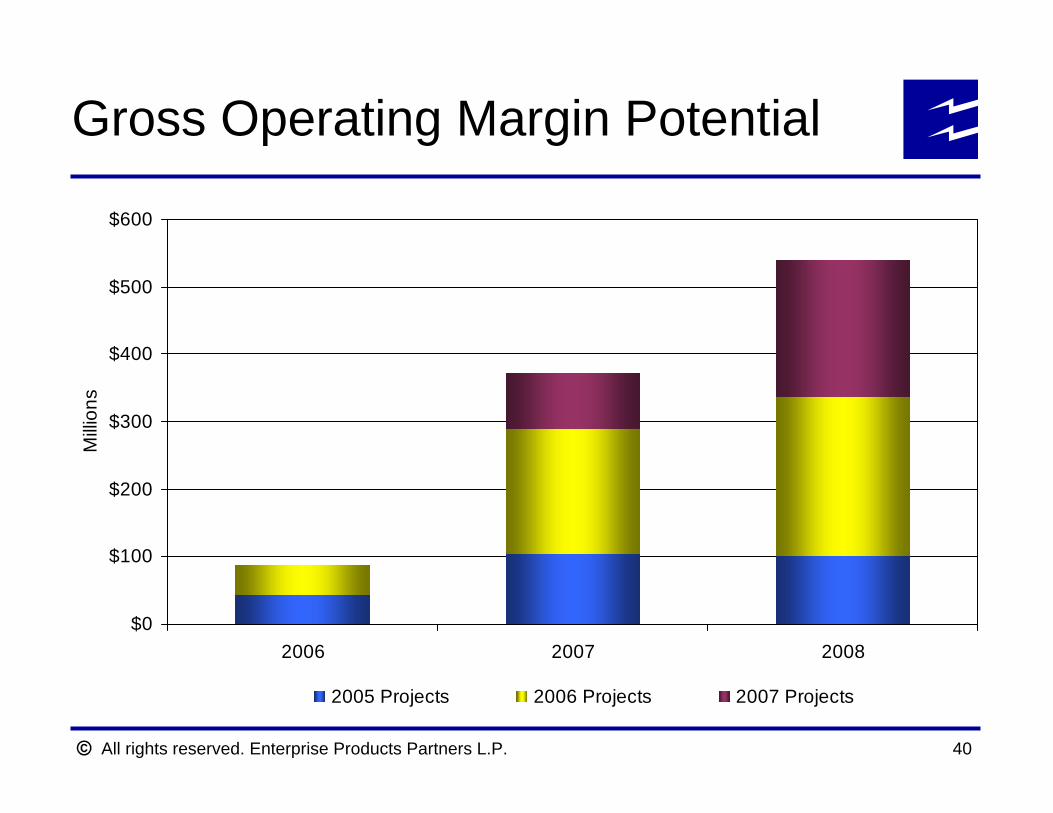
Gross Operating Margin Potential
$0
$100
$200
$300
$400
$500
$600
2006 2007 2008
Milli
ons
2005 Projects 2006 Projects 2007 Projects
All rights reserved. Enterprise Products Partners L.P.
Cost of Capital Evaluationfor Publicly Traded Partnerships
All rights reserved. Enterprise Products Partners L.P. 42
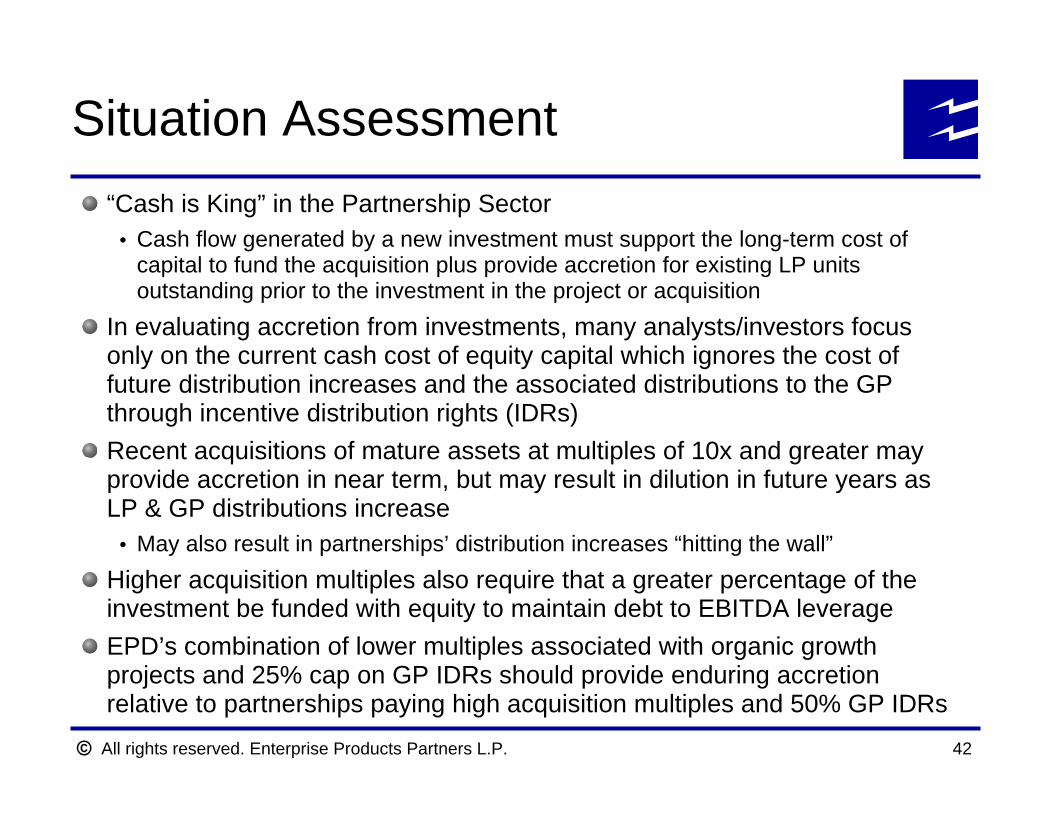
Situation Assessment“Cash is King” in the Partnership Sector
Cash flow generated by a new investment must support the long-term cost of capital to fund the acquisition plus provide accretion for existing LP units outstanding prior to the investment in the project or acquisition
In evaluating accretion from investments, many analysts/investors focus only on the current cash cost of equity capital which ignores the cost of future distribution increases and the associated distributions to the GP through incentive distribution rights (IDRs)Recent acquisitions of mature assets at multiples of 10x and greater may provide accretion in near term, but may result in dilution in future years as LP & GP distributions increase
May also result in partnerships’ distribution increases “hitting the wall”Higher acquisition multiples also require that a greater percentage of the investment be funded with equity to maintain debt to EBITDA leverageEPD’s combination of lower multiples associated with organic growth projects and 25% cap on GP IDRs should provide enduring accretion relative to partnerships paying high acquisition multiples and 50% GP IDRs
All rights reserved. Enterprise Products Partners L.P. 43
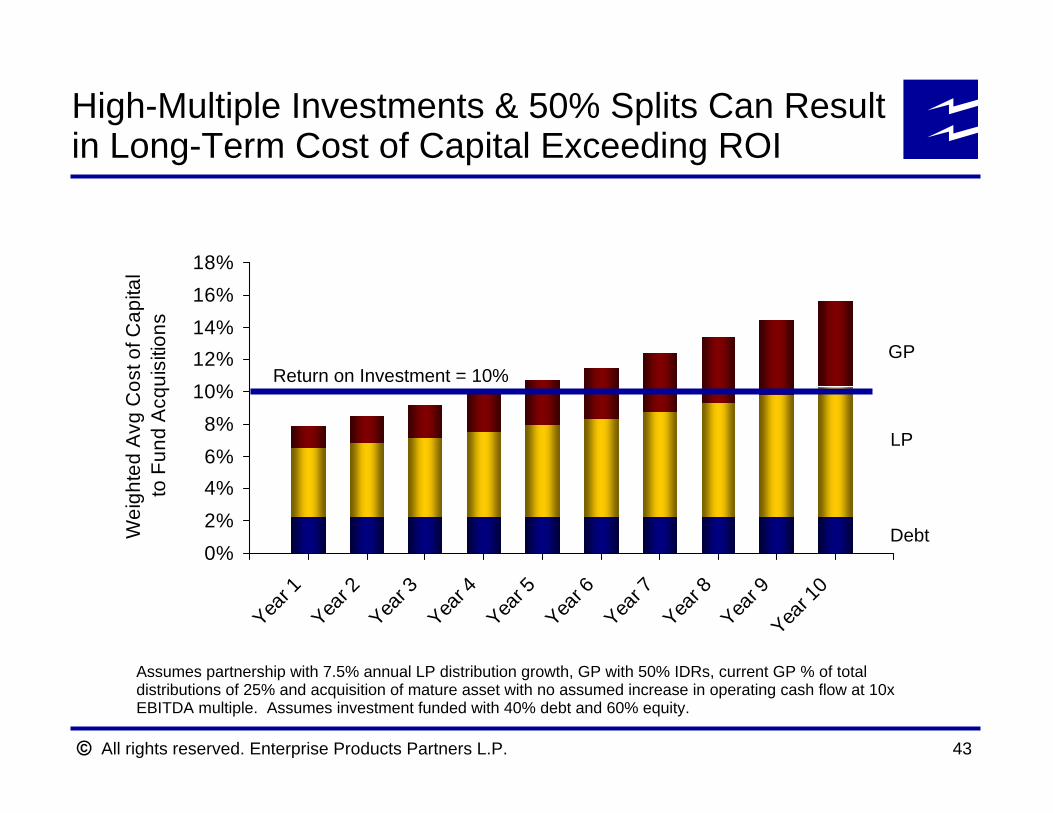
Assumes partnership with 7.5% annual LP distribution growth, GP with 50% IDRs, current GP % of total distributions of 25% and acquisition of mature asset with no assumed increase in operating cash flow at 10x EBITDA multiple. Assumes investment funded with 40% debt and 60% equity.
0%2%4%6%8%
10%12%14%16%18%
Year 1
Year 2
Year 3
Year 4
Year 5
Year 6
Year 7
Year 8
Year 9
Year 1
0
Wei
ghte
d A
vg C
ost o
f Cap
ital
to F
und
Acq
uisi
tions
Return on Investment = 10%GP
LP
Debt
High-Multiple Investments & 50% Splits Can Result in Long-Term Cost of Capital Exceeding ROI
All rights reserved. Enterprise Products Partners L.P. 44
75%71%67%
60%
50%
33%
0%0%
20%
40%
60%
80%
100%
4.0x 6.0x 8.0x 10.0x 12.0x 14.0x 16.0x
Cash Flow Multiple of Investment
% o
f Inv
estm
ent F
unde
d w
ith E
quity
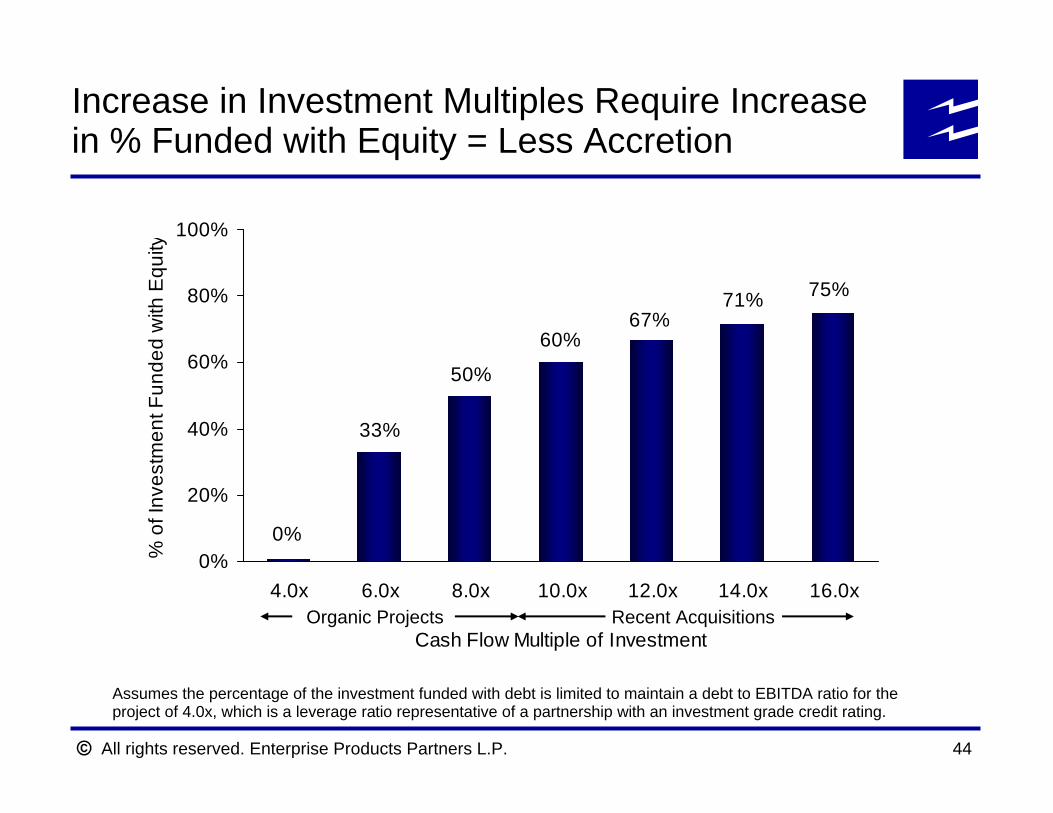
Assumes the percentage of the investment funded with debt is limited to maintain a debt to EBITDA ratio for the project of 4.0x, which is a leverage ratio representative of a partnership with an investment grade credit rating.
Recent AcquisitionsOrganic Projects
Increase in Investment Multiples Require Increase in % Funded with Equity = Less Accretion
All rights reserved. Enterprise Products Partners L.P. 45
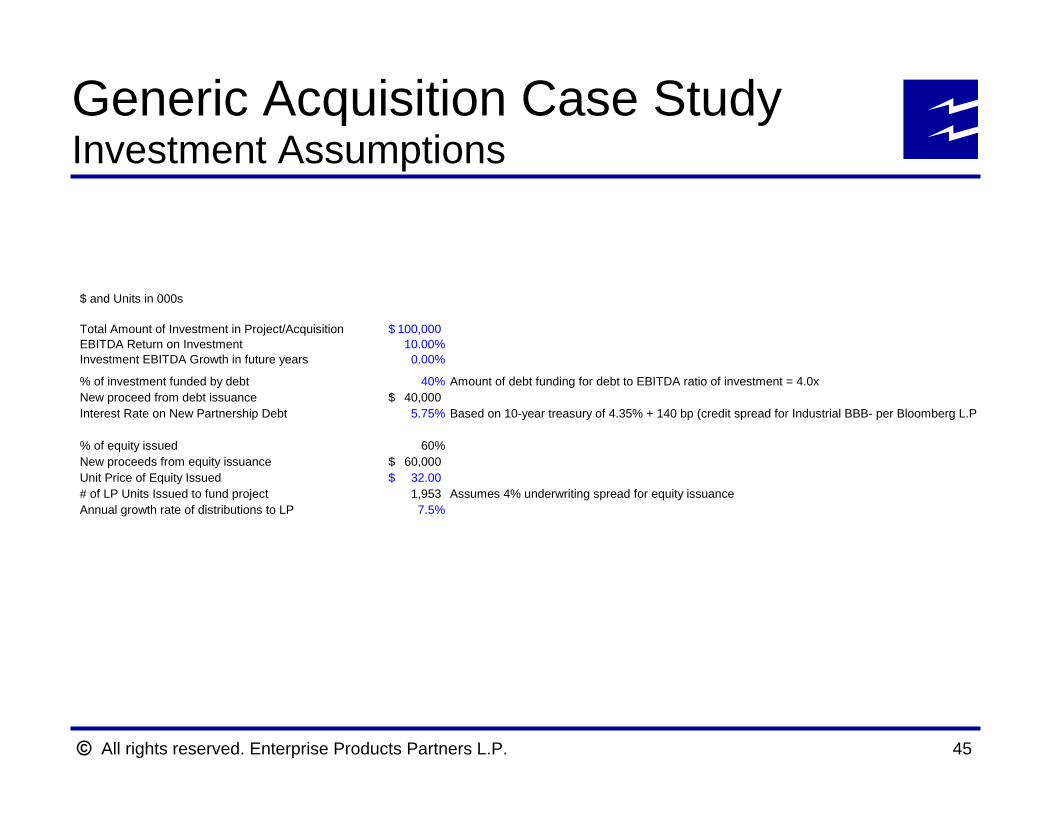
Generic Acquisition Case StudyInvestment Assumptions
$ and Units in 000s
Total Amount of Investment in Project/Acquisition 100,000$ EBITDA Return on Investment 10.00%Investment EBITDA Growth in future years 0.00%
% of investment funded by debt 40% Amount of debt funding for debt to EBITDA ratio of investment = 4.0xNew proceed from debt issuance 40,000$ Interest Rate on New Partnership Debt 5.75% Based on 10-year treasury of 4.35% + 140 bp (credit spread for Industrial BBB- per Bloomberg L.P.
% of equity issued 60%New proceeds from equity issuance 60,000$ Unit Price of Equity Issued 32.00$ # of LP Units Issued to fund project 1,953 Assumes 4% underwriting spread for equity issuanceAnnual growth rate of distributions to LP 7.5%
All rights reserved. Enterprise Products Partners L.P. 46
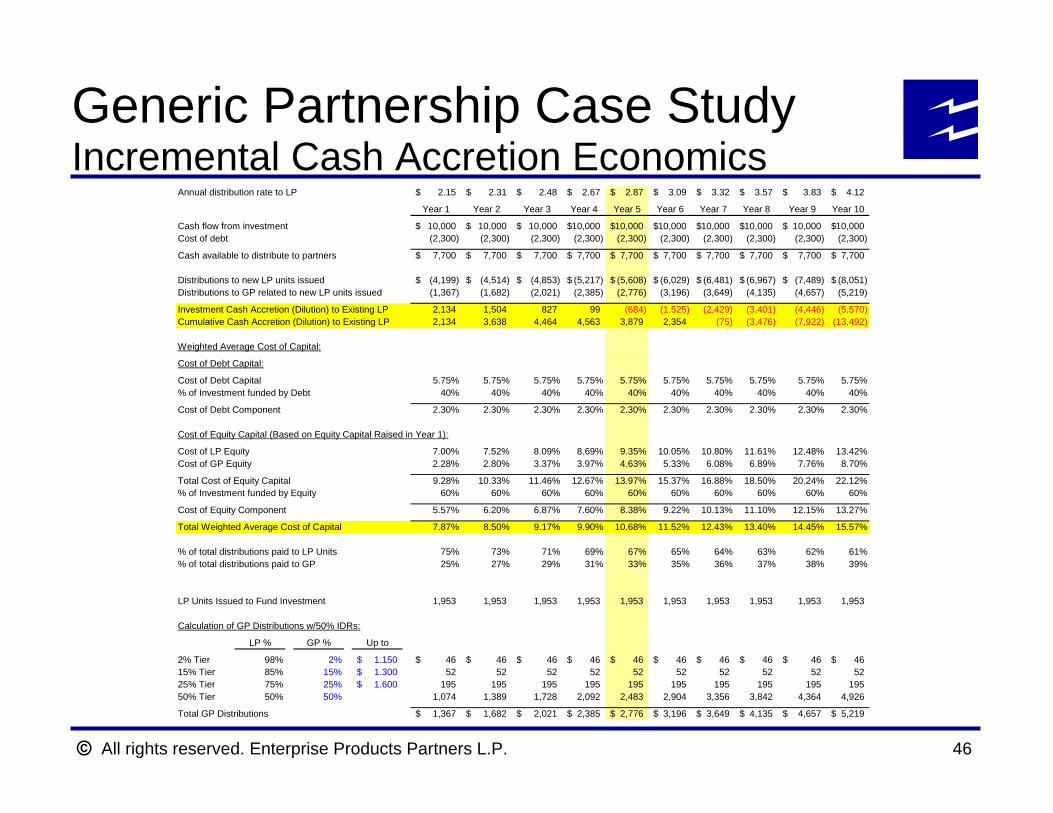
Generic Partnership Case StudyIncremental Cash Accretion Economics
Annual distribution rate to LP 2.15$ 2.31$ 2.48$ 2.67$ 2.87$ 3.09$ 3.32$ 3.57$ 3.83$ 4.12$
Year 1 Year 2 Year 3 Year 4 Year 5 Year 6 Year 7 Year 8 Year 9 Year 10
Cash flow from investment 10,000$ 10,000$ 10,000$ 10,000$ 10,000$ 10,000$ 10,000$ 10,000$ 10,000$ 10,000$ Cost of debt (2,300) (2,300) (2,300) (2,300) (2,300) (2,300) (2,300) (2,300) (2,300) (2,300)
Cash available to distribute to partners 7,700$ 7,700$ 7,700$ 7,700$ 7,700$ 7,700$ 7,700$ 7,700$ 7,700$ 7,700$
Distributions to new LP units issued (4,199)$ (4,514)$ (4,853)$ (5,217)$ (5,608)$ (6,029)$ (6,481)$ (6,967)$ (7,489)$ (8,051)$ Distributions to GP related to new LP units issued (1,367) (1,682) (2,021) (2,385) (2,776) (3,196) (3,649) (4,135) (4,657) (5,219)
Investment Cash Accretion (Dilution) to Existing LP 2,134 1,504 827 99 (684) (1,525) (2,429) (3,401) (4,446) (5,570)Cumulative Cash Accretion (Dilution) to Existing LP 2,134 3,638 4,464 4,563 3,879 2,354 (75) (3,476) (7,922) (13,492)
Weighted Average Cost of Capital:
Cost of Debt Capital:
Cost of Debt Capital 5.75% 5.75% 5.75% 5.75% 5.75% 5.75% 5.75% 5.75% 5.75% 5.75%% of Investment funded by Debt 40% 40% 40% 40% 40% 40% 40% 40% 40% 40%
Cost of Debt Component 2.30% 2.30% 2.30% 2.30% 2.30% 2.30% 2.30% 2.30% 2.30% 2.30%
Cost of Equity Capital (Based on Equity Capital Raised in Year 1):
Cost of LP Equity 7.00% 7.52% 8.09% 8.69% 9.35% 10.05% 10.80% 11.61% 12.48% 13.42%Cost of GP Equity 2.28% 2.80% 3.37% 3.97% 4.63% 5.33% 6.08% 6.89% 7.76% 8.70%
Total Cost of Equity Capital 9.28% 10.33% 11.46% 12.67% 13.97% 15.37% 16.88% 18.50% 20.24% 22.12%% of Investment funded by Equity 60% 60% 60% 60% 60% 60% 60% 60% 60% 60%
Cost of Equity Component 5.57% 6.20% 6.87% 7.60% 8.38% 9.22% 10.13% 11.10% 12.15% 13.27%
Total Weighted Average Cost of Capital 7.87% 8.50% 9.17% 9.90% 10.68% 11.52% 12.43% 13.40% 14.45% 15.57%
% of total distributions paid to LP Units 75% 73% 71% 69% 67% 65% 64% 63% 62% 61%% of total distributions paid to GP 25% 27% 29% 31% 33% 35% 36% 37% 38% 39%
LP Units Issued to Fund Investment 1,953 1,953 1,953 1,953 1,953 1,953 1,953 1,953 1,953 1,953
Calculation of GP Distributions w/50% IDRs:
LP % GP % Up to
2% Tier 98% 2% 1.150$ 46$ 46$ 46$ 46$ 46$ 46$ 46$ 46$ 46$ 46$ 15% Tier 85% 15% 1.300$ 52 52 52 52 52 52 52 52 52 52 25% Tier 75% 25% 1.600$ 195 195 195 195 195 195 195 195 195 195 50% Tier 50% 50% 1,074 1,389 1,728 2,092 2,483 2,904 3,356 3,842 4,364 4,926
Total GP Distributions 1,367$ 1,682$ 2,021$ 2,385$ 2,776$ 3,196$ 3,649$ 4,135$ 4,657$ 5,219$
All rights reserved. Enterprise Products Partners L.P. 47
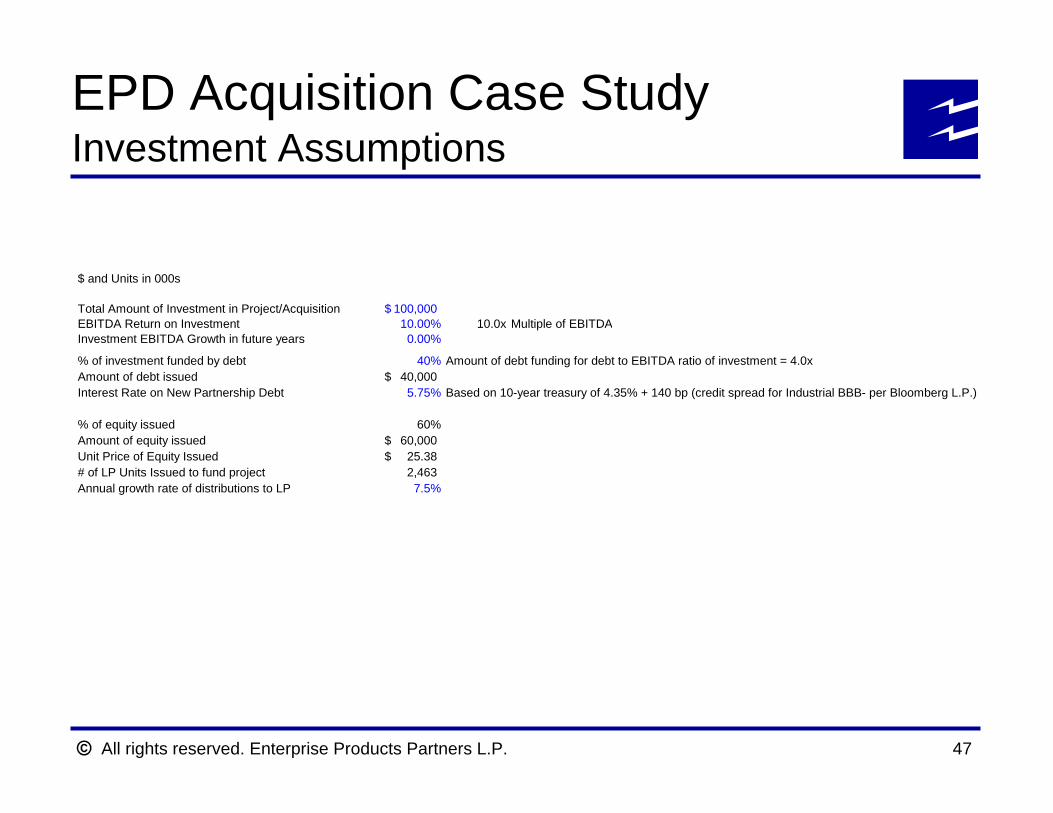
EPD Acquisition Case StudyInvestment Assumptions
$ and Units in 000s
Total Amount of Investment in Project/Acquisition 100,000$ EBITDA Return on Investment 10.00% 10.0x Multiple of EBITDAInvestment EBITDA Growth in future years 0.00%
% of investment funded by debt 40% Amount of debt funding for debt to EBITDA ratio of investment = 4.0xAmount of debt issued 40,000$ Interest Rate on New Partnership Debt 5.75% Based on 10-year treasury of 4.35% + 140 bp (credit spread for Industrial BBB- per Bloomberg L.P.)
% of equity issued 60%Amount of equity issued 60,000$ Unit Price of Equity Issued 25.38$ # of LP Units Issued to fund project 2,463 Annual growth rate of distributions to LP 7.5%
All rights reserved. Enterprise Products Partners L.P. 48
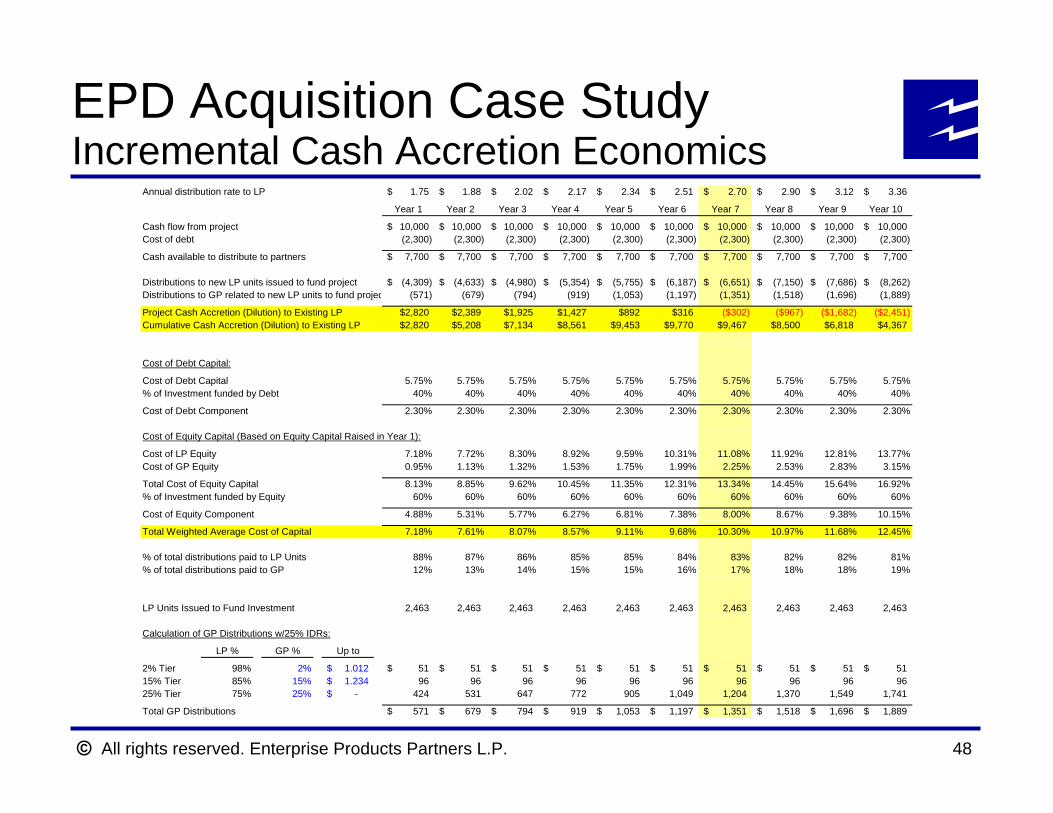
EPD Acquisition Case StudyIncremental Cash Accretion Economics
Annual distribution rate to LP 1.75$ 1.88$ 2.02$ 2.17$ 2.34$ 2.51$ 2.70$ 2.90$ 3.12$ 3.36$
Year 1 Year 2 Year 3 Year 4 Year 5 Year 6 Year 7 Year 8 Year 9 Year 10
Cash flow from project 10,000$ 10,000$ 10,000$ 10,000$ 10,000$ 10,000$ 10,000$ 10,000$ 10,000$ 10,000$ Cost of debt (2,300) (2,300) (2,300) (2,300) (2,300) (2,300) (2,300) (2,300) (2,300) (2,300)
Cash available to distribute to partners 7,700$ 7,700$ 7,700$ 7,700$ 7,700$ 7,700$ 7,700$ 7,700$ 7,700$ 7,700$
Distributions to new LP units issued to fund project (4,309)$ (4,633)$ (4,980)$ (5,354)$ (5,755)$ (6,187)$ (6,651)$ (7,150)$ (7,686)$ (8,262)$ Distributions to GP related to new LP units to fund projec (571) (679) (794) (919) (1,053) (1,197) (1,351) (1,518) (1,696) (1,889)
Project Cash Accretion (Dilution) to Existing LP $2,820 $2,389 $1,925 $1,427 $892 $316 ($302) ($967) ($1,682) ($2,451)Cumulative Cash Accretion (Dilution) to Existing LP $2,820 $5,208 $7,134 $8,561 $9,453 $9,770 $9,467 $8,500 $6,818 $4,367
Cost of Debt Capital:
Cost of Debt Capital 5.75% 5.75% 5.75% 5.75% 5.75% 5.75% 5.75% 5.75% 5.75% 5.75%% of Investment funded by Debt 40% 40% 40% 40% 40% 40% 40% 40% 40% 40%
Cost of Debt Component 2.30% 2.30% 2.30% 2.30% 2.30% 2.30% 2.30% 2.30% 2.30% 2.30%
Cost of Equity Capital (Based on Equity Capital Raised in Year 1):
Cost of LP Equity 7.18% 7.72% 8.30% 8.92% 9.59% 10.31% 11.08% 11.92% 12.81% 13.77%Cost of GP Equity 0.95% 1.13% 1.32% 1.53% 1.75% 1.99% 2.25% 2.53% 2.83% 3.15%
Total Cost of Equity Capital 8.13% 8.85% 9.62% 10.45% 11.35% 12.31% 13.34% 14.45% 15.64% 16.92%% of Investment funded by Equity 60% 60% 60% 60% 60% 60% 60% 60% 60% 60%
Cost of Equity Component 4.88% 5.31% 5.77% 6.27% 6.81% 7.38% 8.00% 8.67% 9.38% 10.15%
Total Weighted Average Cost of Capital 7.18% 7.61% 8.07% 8.57% 9.11% 9.68% 10.30% 10.97% 11.68% 12.45%
% of total distributions paid to LP Units 88% 87% 86% 85% 85% 84% 83% 82% 82% 81%% of total distributions paid to GP 12% 13% 14% 15% 15% 16% 17% 18% 18% 19%
LP Units Issued to Fund Investment 2,463 2,463 2,463 2,463 2,463 2,463 2,463 2,463 2,463 2,463
Calculation of GP Distributions w/25% IDRs:
LP % GP % Up to
2% Tier 98% 2% 1.012$ 51$ 51$ 51$ 51$ 51$ 51$ 51$ 51$ 51$ 51$ 15% Tier 85% 15% 1.234$ 96 96 96 96 96 96 96 96 96 96 25% Tier 75% 25% -$ 424 531 647 772 905 1,049 1,204 1,370 1,549 1,741
Total GP Distributions 571$ 679$ 794$ 919$ 1,053$ 1,197$ 1,351$ 1,518$ 1,696$ 1,889$
All rights reserved. Enterprise Products Partners L.P. 49
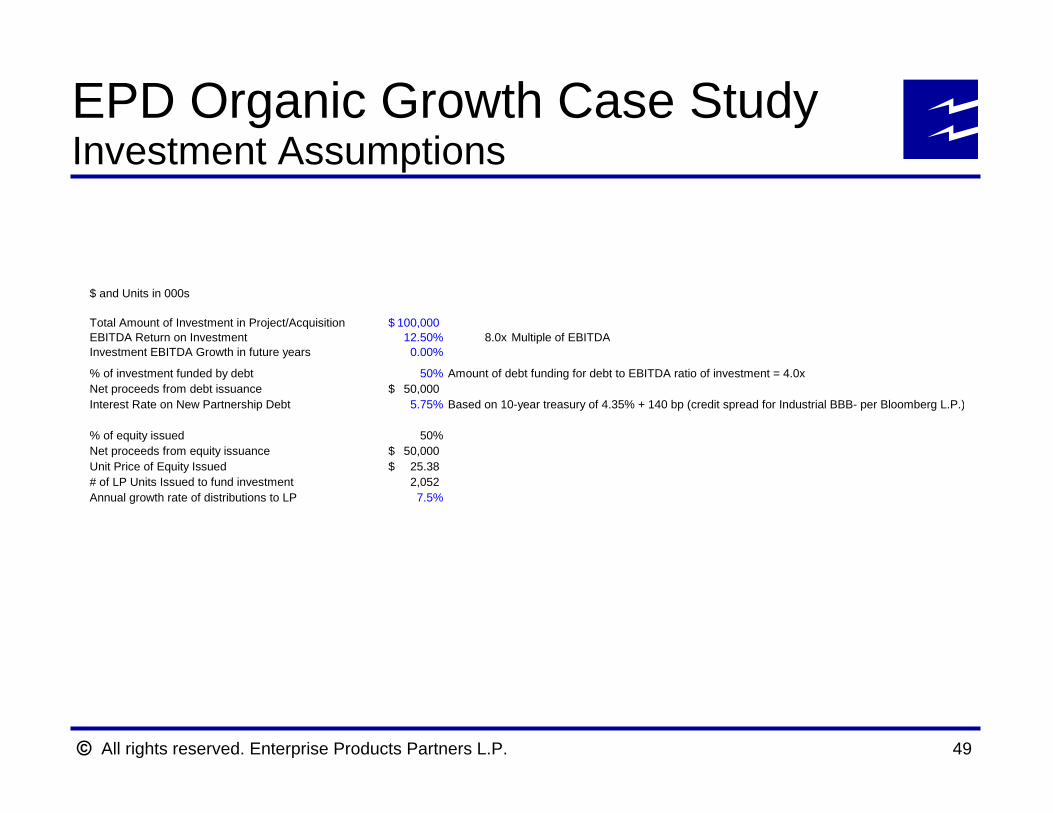
EPD Organic Growth Case StudyInvestment Assumptions
$ and Units in 000s
Total Amount of Investment in Project/Acquisition 100,000$ EBITDA Return on Investment 12.50% 8.0x Multiple of EBITDAInvestment EBITDA Growth in future years 0.00%
% of investment funded by debt 50% Amount of debt funding for debt to EBITDA ratio of investment = 4.0xNet proceeds from debt issuance 50,000$ Interest Rate on New Partnership Debt 5.75% Based on 10-year treasury of 4.35% + 140 bp (credit spread for Industrial BBB- per Bloomberg L.P.)
% of equity issued 50%Net proceeds from equity issuance 50,000$ Unit Price of Equity Issued 25.38$ # of LP Units Issued to fund investment 2,052 Annual growth rate of distributions to LP 7.5%
All rights reserved. Enterprise Products Partners L.P. 50
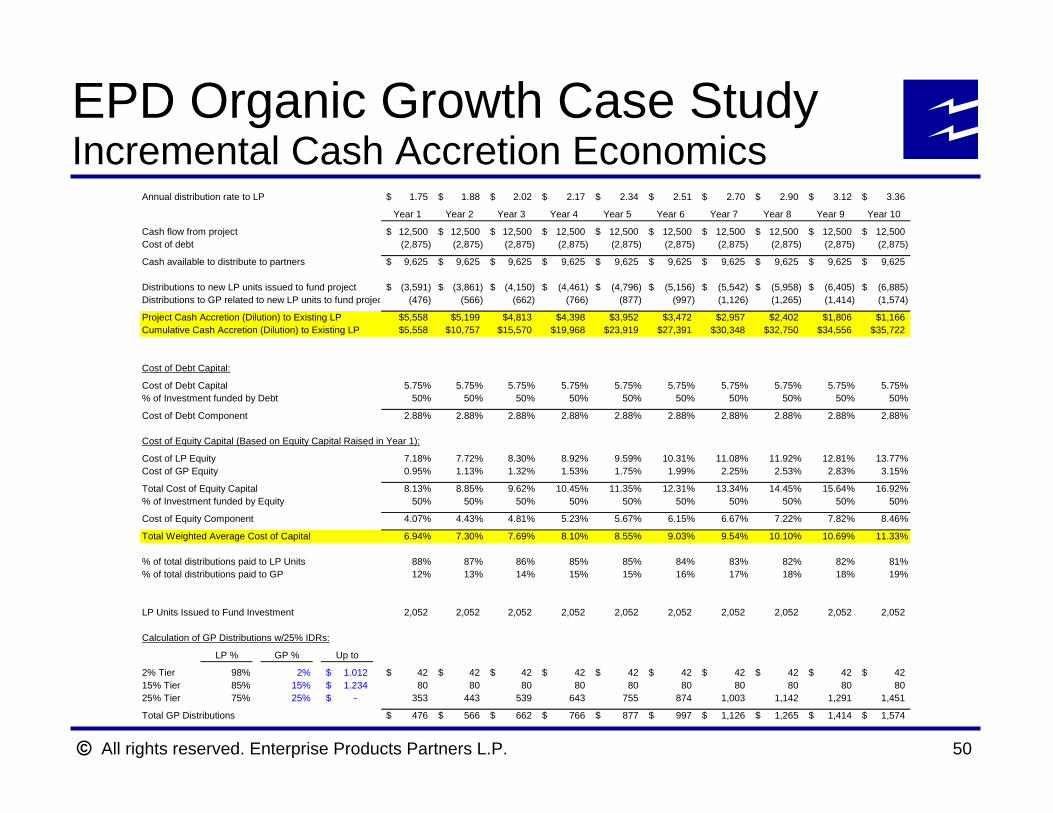
EPD Organic Growth Case StudyIncremental Cash Accretion Economics
Annual distribution rate to LP 1.75$ 1.88$ 2.02$ 2.17$ 2.34$ 2.51$ 2.70$ 2.90$ 3.12$ 3.36$
Year 1 Year 2 Year 3 Year 4 Year 5 Year 6 Year 7 Year 8 Year 9 Year 10
Cash flow from project 12,500$ 12,500$ 12,500$ 12,500$ 12,500$ 12,500$ 12,500$ 12,500$ 12,500$ 12,500$ Cost of debt (2,875) (2,875) (2,875) (2,875) (2,875) (2,875) (2,875) (2,875) (2,875) (2,875)
Cash available to distribute to partners 9,625$ 9,625$ 9,625$ 9,625$ 9,625$ 9,625$ 9,625$ 9,625$ 9,625$ 9,625$
Distributions to new LP units issued to fund project (3,591)$ (3,861)$ (4,150)$ (4,461)$ (4,796)$ (5,156)$ (5,542)$ (5,958)$ (6,405)$ (6,885)$ Distributions to GP related to new LP units to fund projec (476) (566) (662) (766) (877) (997) (1,126) (1,265) (1,414) (1,574)
Project Cash Accretion (Dilution) to Existing LP $5,558 $5,199 $4,813 $4,398 $3,952 $3,472 $2,957 $2,402 $1,806 $1,166Cumulative Cash Accretion (Dilution) to Existing LP $5,558 $10,757 $15,570 $19,968 $23,919 $27,391 $30,348 $32,750 $34,556 $35,722
Cost of Debt Capital:
Cost of Debt Capital 5.75% 5.75% 5.75% 5.75% 5.75% 5.75% 5.75% 5.75% 5.75% 5.75%% of Investment funded by Debt 50% 50% 50% 50% 50% 50% 50% 50% 50% 50%
Cost of Debt Component 2.88% 2.88% 2.88% 2.88% 2.88% 2.88% 2.88% 2.88% 2.88% 2.88%
Cost of Equity Capital (Based on Equity Capital Raised in Year 1):
Cost of LP Equity 7.18% 7.72% 8.30% 8.92% 9.59% 10.31% 11.08% 11.92% 12.81% 13.77%Cost of GP Equity 0.95% 1.13% 1.32% 1.53% 1.75% 1.99% 2.25% 2.53% 2.83% 3.15%
Total Cost of Equity Capital 8.13% 8.85% 9.62% 10.45% 11.35% 12.31% 13.34% 14.45% 15.64% 16.92%% of Investment funded by Equity 50% 50% 50% 50% 50% 50% 50% 50% 50% 50%
Cost of Equity Component 4.07% 4.43% 4.81% 5.23% 5.67% 6.15% 6.67% 7.22% 7.82% 8.46%
Total Weighted Average Cost of Capital 6.94% 7.30% 7.69% 8.10% 8.55% 9.03% 9.54% 10.10% 10.69% 11.33%
% of total distributions paid to LP Units 88% 87% 86% 85% 85% 84% 83% 82% 82% 81%% of total distributions paid to GP 12% 13% 14% 15% 15% 16% 17% 18% 18% 19%
LP Units Issued to Fund Investment 2,052 2,052 2,052 2,052 2,052 2,052 2,052 2,052 2,052 2,052
Calculation of GP Distributions w/25% IDRs:
LP % GP % Up to
2% Tier 98% 2% 1.012$ 42$ 42$ 42$ 42$ 42$ 42$ 42$ 42$ 42$ 42$ 15% Tier 85% 15% 1.234$ 80 80 80 80 80 80 80 80 80 80 25% Tier 75% 25% -$ 353 443 539 643 755 874 1,003 1,142 1,291 1,451
Total GP Distributions 476$ 566$ 662$ 766$ 877$ 997$ 1,126$ 1,265$ 1,414$ 1,574$
All rights reserved. Enterprise Products Partners L.P. 51
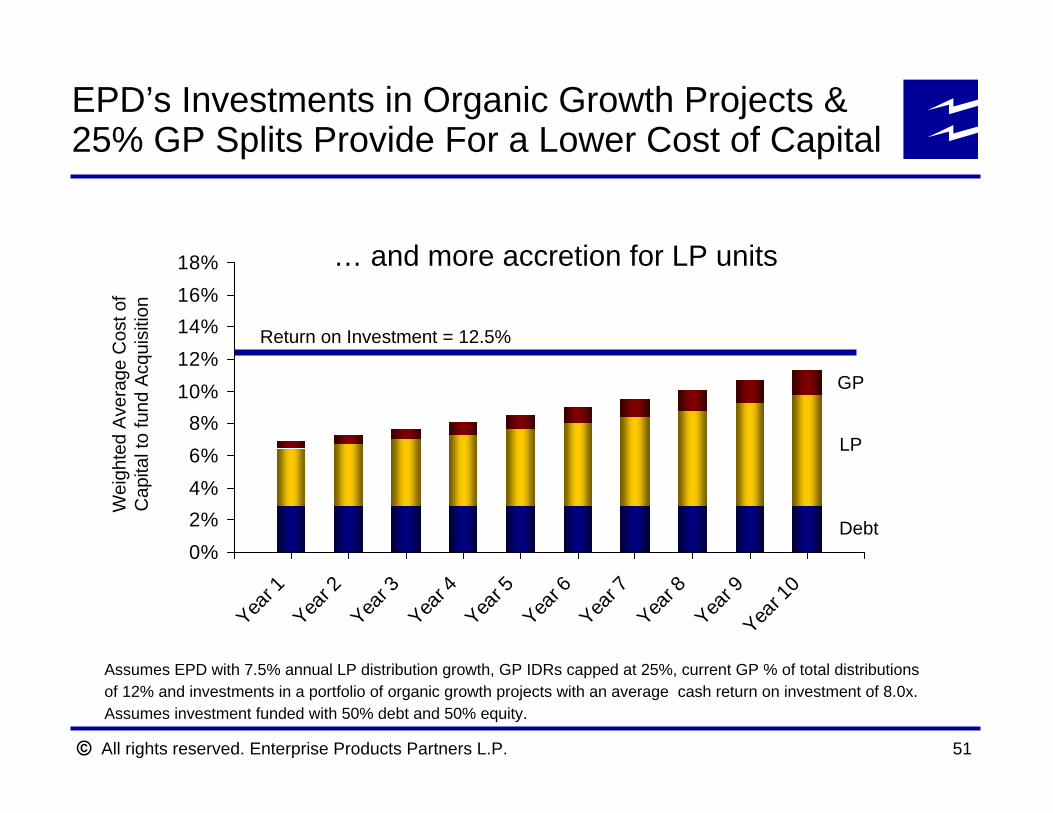
Assumes EPD with 7.5% annual LP distribution growth, GP IDRs capped at 25%, current GP % of total distributionsof 12% and investments in a portfolio of organic growth projects with an average cash return on investment of 8.0x.Assumes investment funded with 50% debt and 50% equity.
EPD’s Investments in Organic Growth Projects & 25% GP Splits Provide For a Lower Cost of Capital
Wei
ghte
d A
vera
ge C
ost o
f C
apita
l to
fund
Acq
uisi
tion
Return on Investment = 12.5%
GP
LP
Debt
… and more accretion for LP units
0%2%4%6%8%
10%12%14%16%18%
Year 1
Year 2
Year 3
Year 4
Year 5
Year 6
Year 7
Year 8
Year 9
Year 1
0
All rights reserved. Enterprise Products Partners L.P. 52
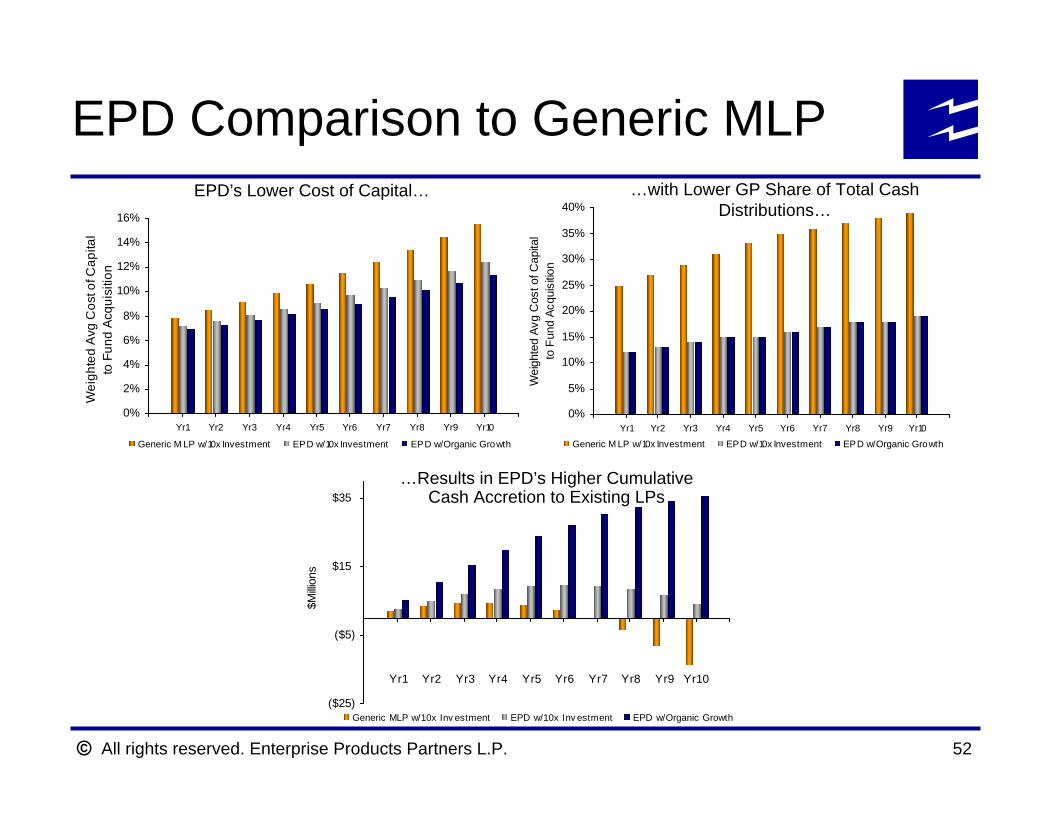
EPD Comparison to Generic MLP
0%
2%
4%
6%
8%
10%
12%
14%
16%
Yr1 Yr2 Yr3 Yr4 Yr5 Yr6 Yr7 Yr8 Yr9 Yr10
Wei
ghte
d A
vg C
ost o
f Cap
ital
to F
und
Acqu
isiti
on
Generic M LP w/10x Investment EPD w/10x Investment EPD w/Organic Growth
EPD’s Lower Cost of Capital…
0%
5%
10%
15%
20%
25%
30%
35%
40%
Yr1 Yr2 Yr3 Yr4 Yr5 Yr6 Yr7 Yr8 Yr9 Yr10
Wei
ghte
d Av
g C
ost o
f Cap
ital
to F
und
Acqu
isitio
n
Generic M LP w/10x Investment EPD w/10x Investment EPD w/Organic Growth
…with Lower GP Share of Total Cash Distributions…
($25)
($5)
$15
$35
Yr1
Yr2
Yr3
Yr4
Yr5
Yr6
Yr7
Yr8
Yr9
Yr10
$Milli
ons
Generic MLP w/10x Inv estment EPD w/10x Inv estment EPD w/Organic Growth
…Results in EPD’s Higher Cumulative Cash Accretion to Existing LPs
All rights reserved. Enterprise Products Partners L.P. 53
Financial Objectives
EPD is in a major construction phase that began in 2005 that is expected to provide significant growth in gross operating margin beginning in 4Q2006Higher cash flow on organic capital investment coupled with lower GP splits capped at 25% should provide for attractive total returnCapital investment funded by an appropriate mix of debt and equity consistent with our long-term leverage objective (debt to EBITDA of 4.0x or less) after projects are in commercial operationsMeasured LP distribution growth during construction phase with 2006 goal of 7.5%