Embed Size (px)
Citation preview

Interim Results 31 March 2011
VISIT OUR WEBSITE
www.enterpriseinns.com

Neil Smith
Chief Financial Officer
1

Financial performance 6 months to 31 March 2011
Interim Results 2011 2
EBITDA pre exceptional items £179m (H1 2010 - £204m)
Average net income per pub flat at £31.2k (H1 2010 - down 3%)
Profit before tax & exceptional items £74m (H1 2010 - £86m)
Adjusted EPS 10.8p (H1 2010 - 12.6p)
£138m proceeds from disposals
Strong cash generation has reduced net debt by £175m in six months
Forward start facility commenced 16 May 2011 at £625m
Drawn bank debt of £545m

Profit & loss EBITDA reduction of 12% partially offset by interest cost savings
Interim Results 2011 3
6 months to
31 March 2011
6 months to
31 March 2010
Year to
30 Sept
2010
£m Pre
excep Excep Total
Pre
excep Excep Total Total
EBITDA 179 - 179 204 (4) 200 400
Depreciation (7) - (7) (7) - (7) (13)
Operating profit 172 - 172 197 (4) 193 387
Property - (13) (13) - 6 6 (190)
Interest (98) - (98) (111) 3 (108) (228)
Profit before Tax 74 (13) 61 86 5 91 (31)
Taxation (20) 30 10 (23) 14 (9) 57
Profit after Tax 54 17 71 63 19 82 26
Adjusted EPS (p) 10.8 12.6 25.9
Weighted average no. of shares (m) 499.0 498.3 498.6
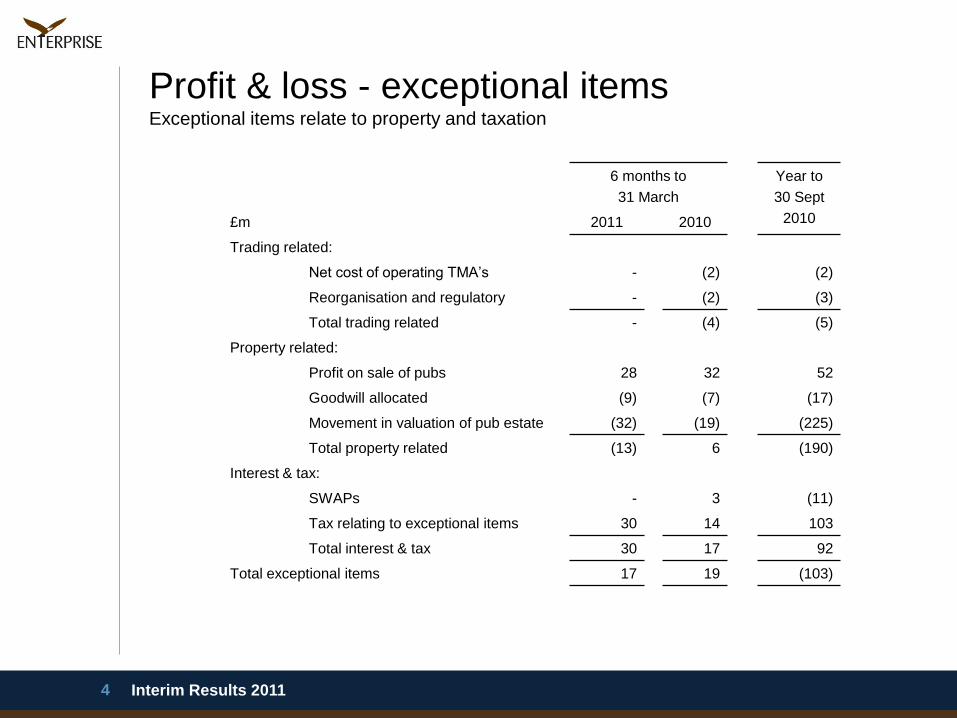
Profit & loss - exceptional items Exceptional items relate to property and taxation
Interim Results 2011 4
6 months to
31 March
Year to
30 Sept
2010 £m 2011 2010
Trading related:
Net cost of operating TMA’s - (2) (2)
Reorganisation and regulatory - (2) (3)
Total trading related - (4) (5)
Property related:
Profit on sale of pubs 28 32 52
Goodwill allocated (9) (7) (17)
Movement in valuation of pub estate (32) (19) (225)
Total property related (13) 6 (190)
Interest & tax:
SWAPs - 3 (11)
Tax relating to exceptional items 30 14 103
Total interest & tax 30 17 92
Total exceptional items 17 19 (103)
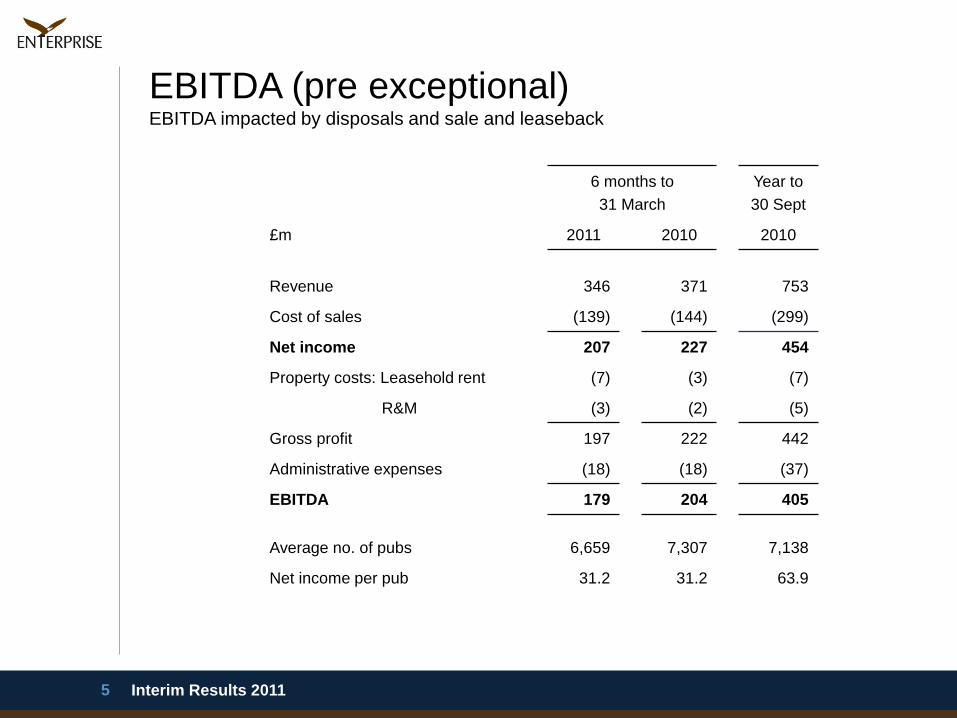
EBITDA (pre exceptional) EBITDA impacted by disposals and sale and leaseback
Interim Results 2011 5
6 months to
31 March
Year to
30 Sept
£m 2011 2010 2010
Revenue 346 371 753
Cost of sales (139) (144) (299)
Net income 207 227 454
Property costs: Leasehold rent (7) (3) (7)
R&M (3) (2) (5)
Gross profit 197 222 442
Administrative expenses (18) (18) (37)
EBITDA 179 204 405
Average no. of pubs 6,659 7,307 7,138
Net income per pub 31.2 31.2 63.9

Net income analysis Margins impacted by increased discounts
Interim Results 2011 6
£m Beer,
cider
& fabs
Contractual
discounts
Net
beer, cider
& fabs
Rental
income
Discretionary
concessions
Wines,
spirits &
minerals
Machines & other Total
H1 2011
Turnover 261 (31) 230 103 (8) 15 6 346
Cost of sales (127) - (127) - - (12) - (139)
Net income 134 (31) 103 103 (8) 3 6 207
51.3% 44.8% 59.8%
H1 2010
Turnover 270 (26) 244 110 (7) 17 7 371
Cost of sales (131) - (131) - - (13) - (144)
Net income 139 (26) 113 110 (7) 4 7 227
51.5% 46.3% 61.2%
82% of pubs now receive a contractual or discretionary wet discount
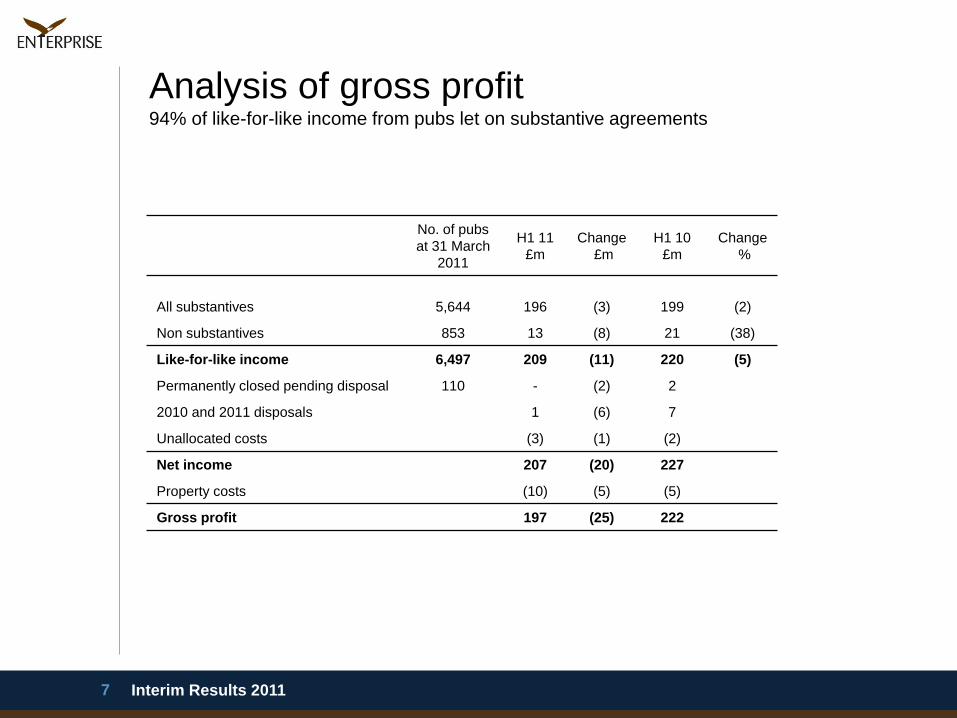
Analysis of gross profit 94% of like-for-like income from pubs let on substantive agreements
Interim Results 2011 7
No. of pubs
at 31 March
2011
H1 11
£m
Change
£m
H1 10
£m
Change
%
All substantives 5,644 196 (3) 199 (2)
Non substantives 853 13 (8) 21 (38)
Like-for-like income 6,497 209 (11) 220 (5)
Permanently closed pending disposal 110 - (2) 2
2010 and 2011 disposals 1 (6) 7
Unallocated costs (3) (1) (2)
Net income 207 (20) 227
Property costs (10) (5) (5)
Gross profit 197 (25) 222
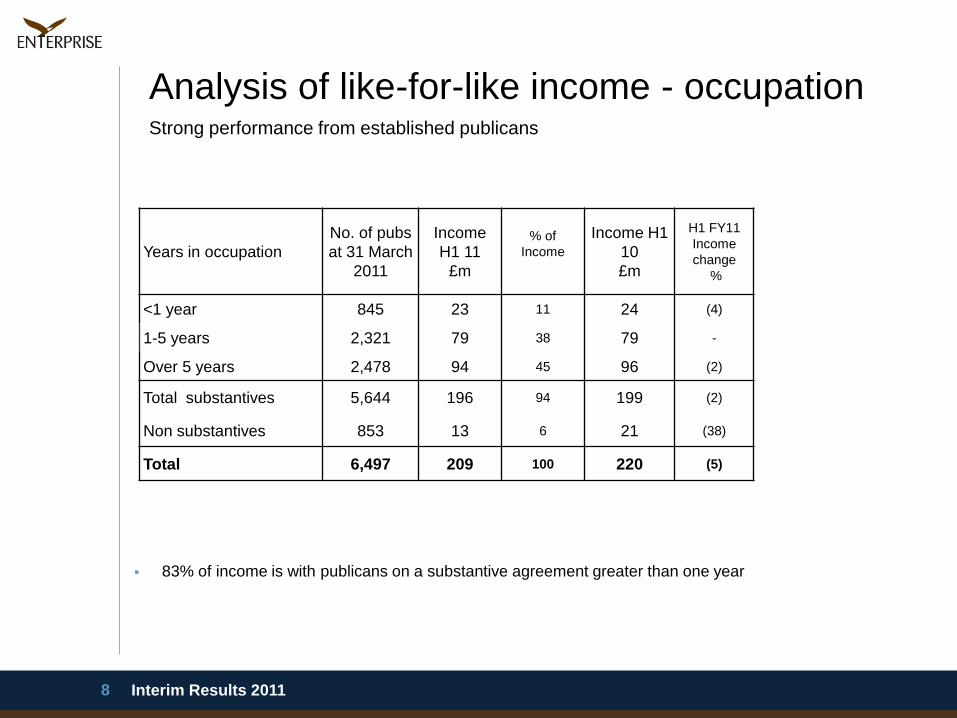
Analysis of like-for-like income - occupation Strong performance from established publicans
Interim Results 2011 8
Years in occupation
No. of pubs
at 31 March
2011
Income
H1 11
£m
% of
Income
Income H1
10
£m
H1 FY11
Income
change
%
<1 year 845 23 11 24 (4)
1-5 years 2,321 79 38 79 -
Over 5 years 2,478 94 45 96 (2)
Total substantives 5,644 196 94 199 (2)
Non substantives 853 13 6 21 (38)
Total 6,497 209 100 220 (5)
83% of income is with publicans on a substantive agreement greater than one year

Substantive like-for-like income - geography
South remains resilient but north continues to be challenged
Interim Results 2011 9
Location
No. of
pubs at
31 March
2011
% of
pubs
Income
H1 11
£m
% of
Income
Income
H1 10
£m
H1 11
Income
change %
North 1,730 31 58 30 61 (5)
Midlands 1,518 27 50 25 51 (2)
South 2,396 42 88 45 87 1
Total 5,644 100 196 100 199 (2)
70% of substantive income in midlands and south geographies

Cash flow statement Strong cash generation of £174m
Interim Results 2011 10
6 months to
31 March
Year to
30 Sept
£m 2011 2010 2010
Operating profit 172 193 387
Operating cash inflow 173 198 410
Interest (96) (108) (219)
Tax (11) (26) (43)
Free cash flow pre investment 66 64 148
Capital expenditure (30) (27) (55)
Disposals 138 131 270
Cash generation 174 168 363
Non cash items 1 6 11
Movement in Group net debt 175 174 374

Disposals £138m of cash generated from disposals
Interim Results 2011 11
6 months to
31 March
Year to
30 Sept
£m 2011 2010 2010
Non viable pubs:
No of pubs 212 261 579
Net cash proceeds 47 82 158
Net profit/(loss) on sale 9 16 21
Sale and leaseback:
No of pubs 71 26 71
Net cash proceeds 91 49 112
Net profit/(loss) on sale 19 16 31

Balance sheet Debt reduction continuing
Interim Results 2011 12
As at 31 March As at
30 Sept
£m 2011 2010 2010
Goodwill & investments 383 402 392
Pubs & other assets 4,881 5,289 5,015
Net debt (3,130) (3,505) (3,305)
Net other liabilities (152) (153) (158)
Deferred tax (505) (584) (537)
Net assets 1,477 1,449 1,407

Debt structure Group net debt reduced by £175m during H1 2011
Interim Results 2011 13
As at 31 March As at 30
Sept
£m 2011 2010 2010
Bank debt (545) (792) (686)
Unique securitised bonds (1,466) (1,536) (1,501)
Corporate bonds (1,185) (1,185) (1,185)
Cash 101 114 108
Underlying Group net debt (3,095) (3,399) (3,264)
Issue costs and fair value adjustments (35) (106) (41)
Group net debt (3,130) (3,505) (3,305)

Bank facility New forward start facility (FSF) agreed in May 2010
Interim Results 2011 14
At 31 March 2011 the old bank facility remained in place, although cancelled down to £625m
New FSF of £625m - commenced 16 May 2011
Initial margin of 3.5% pa on Tranche A and 4.5% on Tranche B
Tranche A - £419m expires December 2013
Tranche B - £206m expires December 2012, £48m already cancelled
Restrictions on dividend payments whilst Tranche B is drawn
Repayment and cancellation of Tranche B planned well in advance of expiry date
No change to financial covenants

Financial covenants Comfortable headroom
Interim Results 2011 15
As at 31 March
Covenant 2011 2010
Bank facility
Net debt:EBITDA 6.50x 5.75x 6.17x
Interest cover 2.00x 2.69x 2.53x
First charge asset cover 1.00x 1.78x 1.54x
Total property assets cover 1.50x 2.69x 2.18x
Unique securitisation
Debt service cover 1.10x 1.75x 1.64x
Net worth (£m) 150 1,220 1,296
Corporate bonds
Required to be supported by £1.9bn of assets and £135m annual income

Simon Townsend
Chief Operating Officer
16

Interim Results 2011 17
Trading update Continued progress in enhancing estate quality
Proactive management and investment
Flexible solutions to optimise income
New Code of Practice
Focus on sustainable publican profitability

Operating performance Key indicators stable despite market challenges
Interim Results 2011 18
Average net income per pub flat (H1 2010 - down 3%)
Total discretionary support increased to £8m (H1 2010 - £7m)
Rate of business failures reduced
380 rent reviews completed at an average annual reduction of 1.6%
61% of substantive agreements linked to RPI
87% of estate let on substantive agreements (H1 2010 - 86%)
Average length of occupation is over 5 years
Overdue balances and bad debts reduced

Recent external pressures on pubs Impact on publican profitability over past three years
Interim Results 2011 19
Duty on beer up 35%
Gas and electricity bills up 23%
Water bills up 8%
Minimum wage up 6%
National insurance up 1%
Business rates up 12%
Additional cost and burden of regulation
Source: British Beer and Pub Association
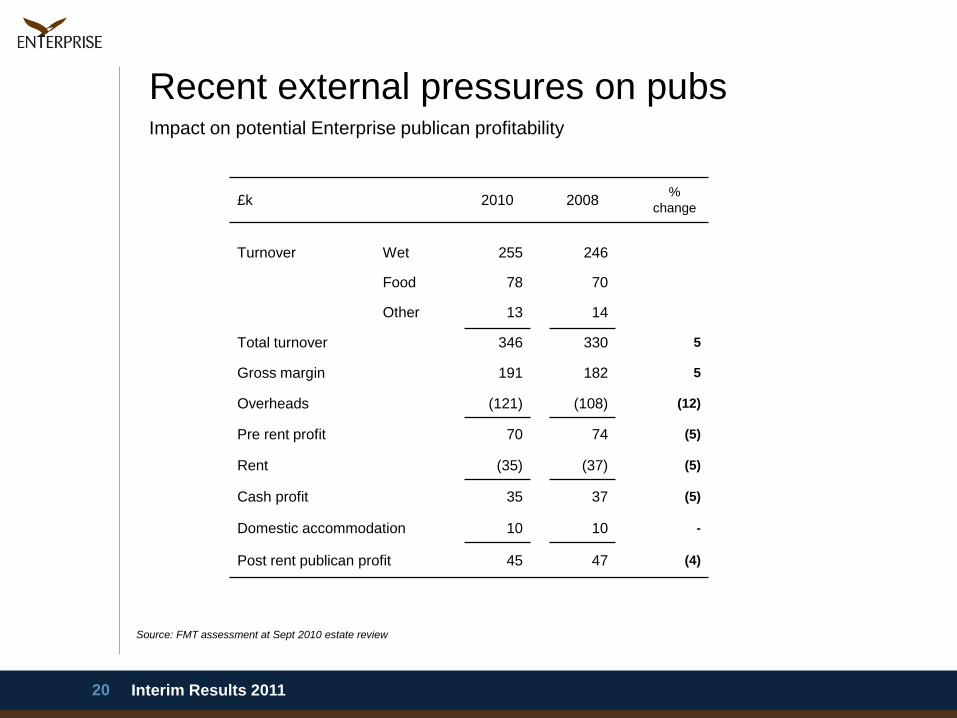
Recent external pressures on pubs Impact on potential Enterprise publican profitability
Interim Results 2011 20
£k 2010 2008 %
change
Turnover Wet 255 246
Food 78 70
Other 13 14
Total turnover 346 330 5
Gross margin 191 182 5
Overheads (121) (108) (12)
Pre rent profit 70 74 (5)
Rent (35) (37) (5)
Cash profit 35 37 (5)
Domestic accommodation 10 10 -
Post rent publican profit 45 47 (4)
Source: FMT assessment at Sept 2010 estate review
Proactive management and investment Focus on retail standards
Interim Results 2011 21
Negotiated surrender of agreements
Stringent conditions for financial support
Defined retail templates for low cost investments
• Value proposition
• Opportunities for growth in food
£30m of capital investment in 800 schemes in H1
1,000 sites identified for investment in H2

Interim Results 2011 22
Average weekly turnover - pre investment £0k / post investment £17k and growing
Investment - £510k
Investment highlights Tivoli, Cheltenham

Interim Results 2011 23
Average weekly turnover - pre investment £1k / post investment £6k and growing
Investment - £215k
Investment highlights Bull, Sedbergh

Interim Results 2011 24
Investment highlights Cross Hands, Bristol
Average weekly turnover - pre investment £3k / post investment £12k and growing
Investment - £270k

Code of Practice A template for successful business relationships
Interim Results 2011 25
Launched October 2010
Enhanced disclosure, pre-entry training and due diligence requirements
Lifetime of the agreement
Dispute resolution and BII mediation
Mandatory in all new agreements - 97% take-up in substantive estate
Submit for annual reaccreditation
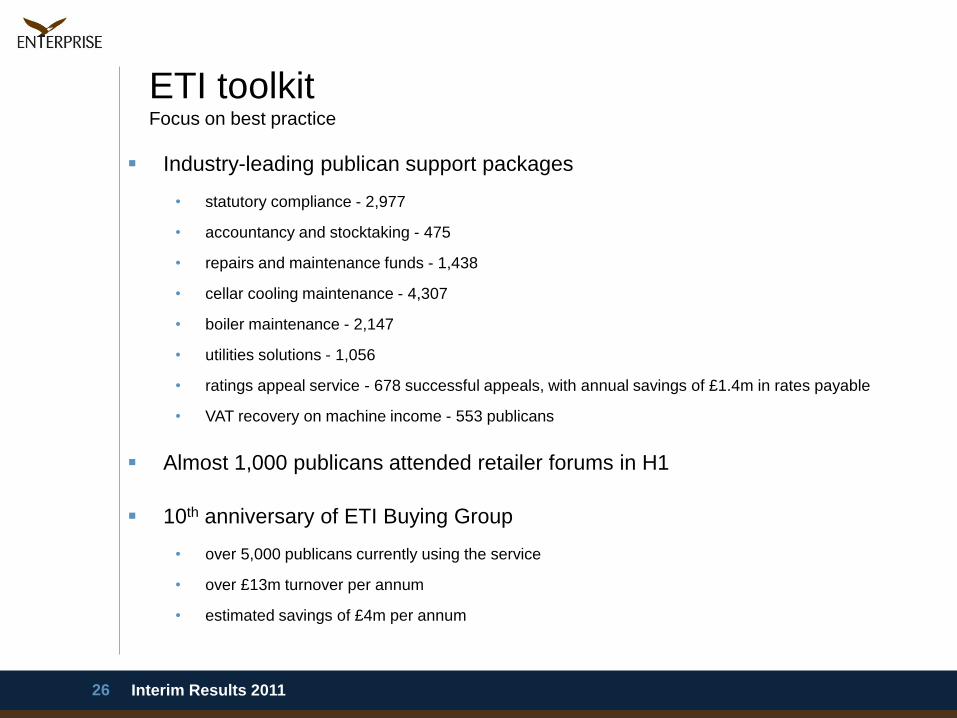
ETI toolkit Focus on best practice
Interim Results 2011 26
Industry-leading publican support packages
• statutory compliance - 2,977
• accountancy and stocktaking - 475
• repairs and maintenance funds - 1,438
• cellar cooling maintenance - 4,307
• boiler maintenance - 2,147
• utilities solutions - 1,056
• ratings appeal service - 678 successful appeals, with annual savings of £1.4m in rates payable
• VAT recovery on machine income - 553 publicans
Almost 1,000 publicans attended retailer forums in H1
10th anniversary of ETI Buying Group
• over 5,000 publicans currently using the service
• over £13m turnover per annum
• estimated savings of £4m per annum
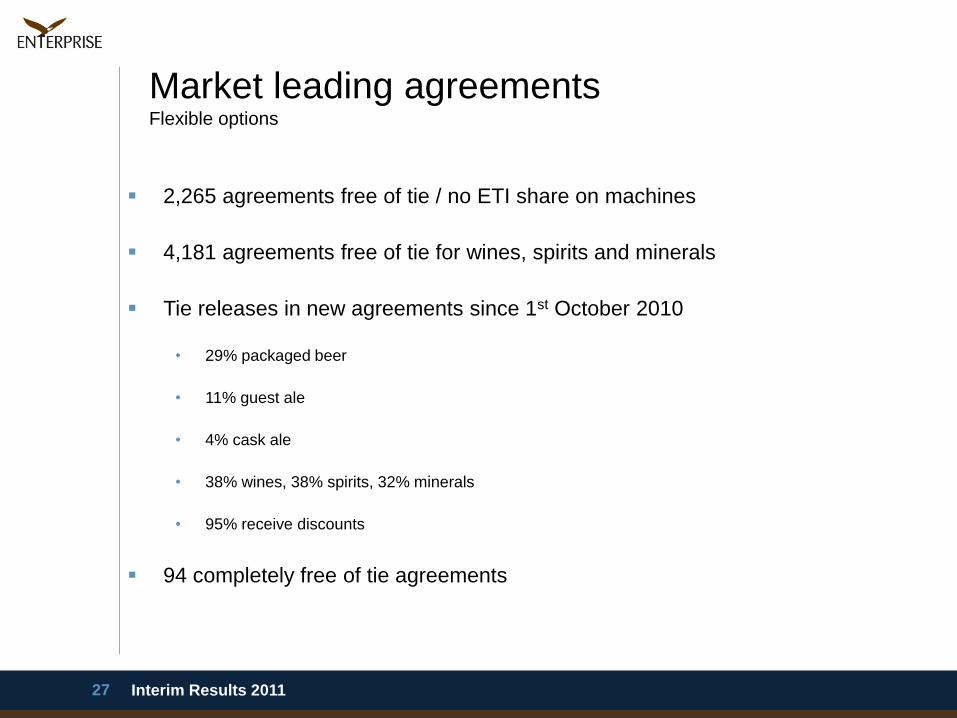
Market leading agreements Flexible options
Interim Results 2011 27
2,265 agreements free of tie / no ETI share on machines
4,181 agreements free of tie for wines, spirits and minerals
Tie releases in new agreements since 1st October 2010
• 29% packaged beer
• 11% guest ale
• 4% cask ale
• 38% wines, 38% spirits, 32% minerals
• 95% receive discounts
94 completely free of tie agreements

ETI publican survey Encouraging result but more to go for
Interim Results 2011 28
Relationship with Enterprise - 82% satisfaction
Relationship with their regional manager - 83% satisfaction
Publicans using regular promotions package - 75%

Ted Tuppen
Chief Executive
29
Interim results Summary
Interim Results 2011 30
Solid progress despite significant headwinds
Core estate continues to perform well in a tough environment
Accelerated disposal programme drawing to a close
Comfortable headroom on all covenants and new forward start facility
Our actions have protected profitability for publicans
Focus on like-for-like profit growth and sustainable returns to shareholders

QUESTIONS
www.enterpriseinns.com
31