Embed Size (px)
Citation preview

Data Warehouse User Guide Degrees Reports
Last Revised: 07/31/14

UG-Data Warehouse Degrees Report FINAL
REVISION CONTROL
Document Title: Data Warehouse Degrees Reports User Guide Author: IT Training & Support File Reference: UG-Data_Warehouse_Degrees_Reports.docx
Revision History
Revision Date Revised By Summary of Revisions Section(s) Revised 8/15/12 Lori Arthur Added verbiage for degree count and data refresh Click here to enter
Revision Date
7/31/14 Lori Arthur-Carmichael
Updated with screenshots for 11g
Review / Approval History
Review Date Reviewed By Action (Reviewed, Recommended or Approved) 3/27/12 Maria Mezhinsky Approved
8/15/12 Maria Mezhinsky Approved
7/31/14 Joe Luzzi Approved
Last Revised: 7/31/14 Page ii

UG-Data Warehouse Degrees Report FINAL
Table of Contents Page
1.0 Degrees Dashboard Overview ....................................................................................................................... 4
1.1 Important Information About These Reports ........................................................................................... 4
1.2 Available Reports .................................................................................................................................... 4
1.3 Accessing the Degrees Reports ............................................................................................................. 5
2.0 Degrees Awarded By Major ........................................................................................................................... 6
Running the Report ................................................................................................................................. 6
Reading the Charts ................................................................................................................................. 8
Degree Charts ......................................................................................................................................... 9
Gender Charts ....................................................................................................................................... 10
Reading the Tables ............................................................................................................................... 11
Reading the Degree and Gender Tables .............................................................................................. 12
Reading the Major Detail Charts & Tables ............................................................................................ 13
3.0 Second Major Associated with Degrees Awarded .................................................................................... 18
Running the Report ............................................................................................................................... 18
Reading the Charts ............................................................................................................................... 20
Degree Charts ....................................................................................................................................... 21
Gender Charts ....................................................................................................................................... 22
Reading the Tables ............................................................................................................................... 23
Reading the Degree and Gender Tables .............................................................................................. 23
Reading the Second Major Detail Charts & Tables .............................................................................. 24
4.0 Minor Associated with Degrees Awarded .................................................................................................. 29
Running the Report ............................................................................................................................... 29
Reading the Charts ............................................................................................................................... 31
Degree Charts ....................................................................................................................................... 32
Gender Charts ....................................................................................................................................... 33
Reading the Tables ............................................................................................................................... 34
Reading the Degree and Gender Tables .............................................................................................. 34
Reading the Minor Detail Charts & Tables ............................................................................................ 35
Last Revised: 7/31/14 Page iii

UG-Data Warehouse Degrees Report FINAL
1.0 Degrees Dashboard Overview
This user guide assumes basic knowledge of Data Warehouse. User guides and tutorials on the basic features of Data Warehouse are available at the IT Training website: http://www.fullerton.edu/ittraining/peoplesoft/dw.
Data in the Data Warehouse is refreshed nightly; therefore all Data Warehouse reports reflect numbers/information as of the previous night.
1.1 Important Information About These Reports The Degree reports allow users to obtain information on the various degrees awarded by the university each term and the majors and minors associated with each degree.
• Information for all degrees awarded since Fall 1990 are available; information for degrees awarded before Fall 1990 may not be available.
• The degree types included in these reports include bachelor’s, master’s, and doctoral degrees; certificates awarded by the university are not included.
• When an individual student was awarded both a Bachelor’s of Science (B.S.) and a Bachelor’s of Arts (B.A.) degree, each degree is counted separately in the degrees awarded total.
• To obtain a listing of all Commencement-eligible students, include the fall, spring, and summer semesters in the search criteria. For example, to obtain a list of all students who were eligible to attend Commencement 2012 held on May 19-20, 2012, include degrees awarded for fall 2011, spring 2012, and summer 2012 in the search criteria.
• The default terms for each report are the last three (3) completed terms.
1.2 Available Reports The following reports are currently available for the Degrees dashboard:
• Degrees Awarded By Major: The Degrees Awarded By Major report shows charts and tables for all degrees awarded for the term(s) selected. The charts provide a visual representation of the data. The tables show the number of degrees awarded for each academic career and each degree type. Users can click on a degree type to get a breakdown of the degree by major. Note: when an individual student had a double major, only their first major will show in this report; information on their second major will appear on the Second Major Associated with Degrees Awarded report.
• Second Major Associated with Degrees Awarded: The Second Major Associated with Degrees Awarded report shows charts and tables for all second majors associated with the degrees awarded for the term(s) selected. The charts provide a visual representation of the data. The tables show the number of second majors associated with degrees awarded for each academic career and each degree type. Users can click on a degree type to get a breakdown of the degree by major. Note: when an individual student had a double major, only their second major will show in this report; information on their first major will appear on the Degrees Awarded By Major report.
• Minor Associated with Degrees Awarded: The Minor Associated with Degrees Awarded report shows charts and tables of all minors associated with the degrees awarded for the term(s) selected. The charts provide a visual representation of the data. The tables show the number of minors associated with degrees awarded for each academic career and each degree type. Users can click on a degree type to get a breakdown of the degree by minor.
Last Revised: 7/31/14 Page 4 of 39

UG-Data Warehouse Degrees Report FINAL
1.3 Accessing the Degrees Reports Processing Steps Screen Shots Step 1: From the Data Warehouse homepage, click on the Dashboards menu.
Step 2: In the CSU Reports section, select Admissions.
Last Revised: 7/31/14 Page 5 of 39

UG-Data Warehouse Degrees Report FINAL
2.0 Degrees Awarded By Major
The Degrees Awarded By Major report shows charts and tables for all degrees awarded for the term(s) selected. The charts provide a visual representation of the data. The tables show the number of degrees awarded for each academic career and each degree type. Users can click on a degree type to get a breakdown of the degree by major.
When an individual student had a double major, only their first major will show in this report; information on their second major will appear on the Second Major Associated with Degrees Awarded report.
Processing Steps Screen Shots
Running the Report Step 1: On the Degrees dashboard, click on Degrees Awarded By Major.
Step 2: The report will automatically run with your personal settings if you have set them up. If you have not set up your personal settings, the report will show information for the default terms.
The default terms are the last three (3) completed terms.
Step 3: To change the terms that appear on the report, click on the drop-down menu.
Last Revised: 7/31/14 Page 6 of 39
UG-Data Warehouse Degrees Report FINAL
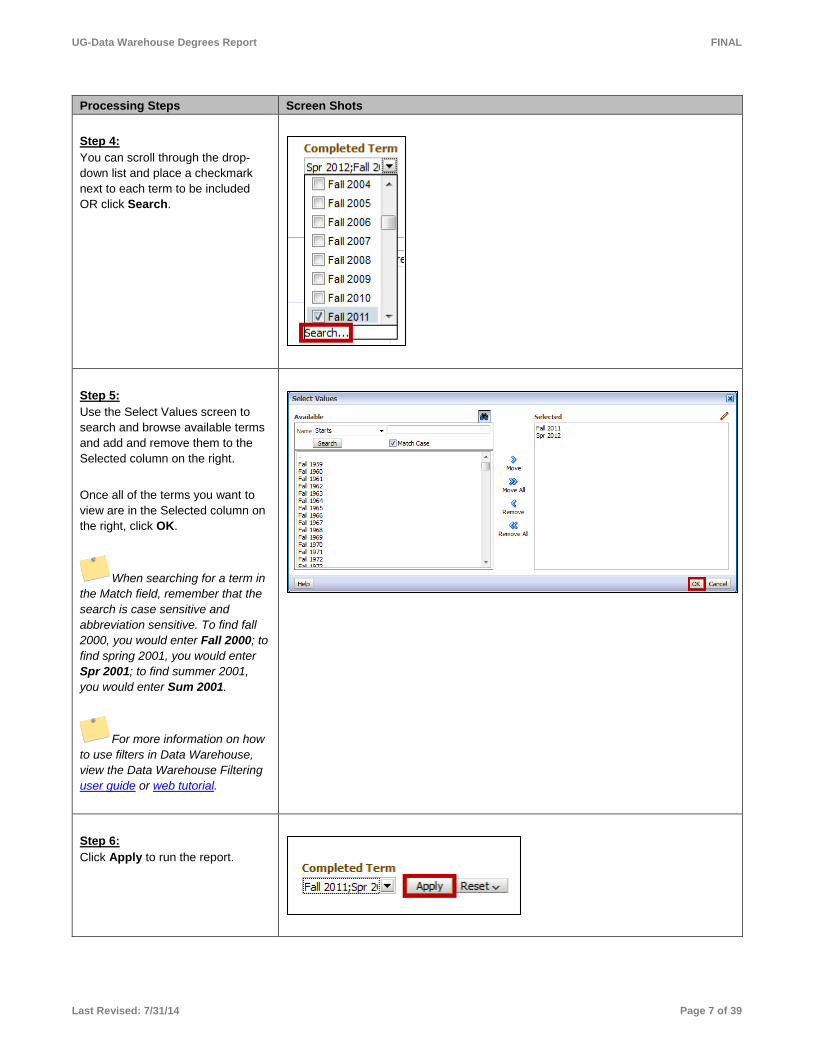
Processing Steps Screen Shots Step 4: You can scroll through the drop-down list and place a checkmark next to each term to be included OR click Search.
Step 5: Use the Select Values screen to search and browse available terms and add and remove them to the Selected column on the right. Once all of the terms you want to view are in the Selected column on the right, click OK.
When searching for a term in the Match field, remember that the search is case sensitive and abbreviation sensitive. To find fall 2000, you would enter Fall 2000; to find spring 2001, you would enter Spr 2001; to find summer 2001, you would enter Sum 2001.
For more information on how to use filters in Data Warehouse, view the Data Warehouse Filtering user guide or web tutorial.
Step 6: Click Apply to run the report.
Last Revised: 7/31/14 Page 7 of 39

UG-Data Warehouse Degrees Report FINAL
Processing Steps Screen Shots Step 6a: It may take several minutes for your data to appear. While the system is working to provide your results, you may see a “Searching” message.
Step 7: The updated report appears.
Reading the Charts
Degree counts on this report reflect the number of degrees awarded, not the number of students who received degrees; a single student may have been awarded multiple degrees. The default setting for the charts (and tables below) is by degree. Use the drop-down menu in between the two charts to view the charts and tables broken down by gender.
Last Revised: 7/31/14 Page 8 of 39

UG-Data Warehouse Degrees Report FINAL
Processing Steps Screen Shots
Degree Charts The degree chart on the left of the screen shows the number of degrees awarded by completed term. The legend at the bottom of the chart shows which degrees are represented by the colored bars. Hovering your mouse over a bar on the graph will show you its value; clicking on the bar will take you to the detail screen which is covered later in this guide.
The chart on the right of the screen shows the total number of degrees awarded for each selected term for each type of degree. The legend at the bottom of the chart shows which terms are represented by the colored bars.
This graph serves as a comparison for the graph on the left.
Last Revised: 7/31/14 Page 9 of 39

UG-Data Warehouse Degrees Report FINAL
Processing Steps Screen Shots
Gender Charts The gender chart on the left of the screen shows the number of degrees awarded by completed term. The legend at the bottom of the chart shows which gender population and degree type is represented by the colored bars.
The chart on the right of the screen shows the total number of degrees awarded for each selected term for each type of degree. The legend at the bottom of the chart shows which terms are represented by the colored bars.
This graph serves as a comparison for the graph on the left.
Last Revised: 7/31/14 Page 10 of 39

UG-Data Warehouse Degrees Report FINAL
Processing Steps Screen Shots
Reading the Tables
Degree counts on this report reflect the number of degrees awarded, not the number of students who received degrees; a single student may have been awarded multiple degrees. The default setting for the tables (and the charts above) is by degree. Use the drop-down menu in between the two charts at the top of the screen to view the charts and tables broken down by gender.
Last Revised: 7/31/14 Page 11 of 39

UG-Data Warehouse Degrees Report FINAL
Processing Steps Screen Shots
Reading the Degree and Gender Tables The degree and gender tables present the same information; however, the gender table includes a breakdown of the degree totals by gender. The degree table is organized into the following columns: • Academic Career: indicates the
type of degree program. • Degree: indicates the degree
type. • Description: the full name of the
degree. • Degrees Awarded: the total
number of degrees awarded broken down by term.
• Total: the total number of degrees for all terms selected.
There are also subtotals for each degree and academic career.
Last Revised: 7/31/14 Page 12 of 39

UG-Data Warehouse Degrees Report FINAL
Processing Steps Screen Shots The gender table is organized into the following columns: • Academic Career: indicates the
type of degree program. • Degree: indicates the degree
type. • Description: the full name of the
degree. • Gender: indicates the gender
population. • Degrees Awarded: the total
number of degrees awarded broken down by term.
• Total: the total number of degrees for all terms selected.
There are also subtotals for each degree and academic career.
Reading the Major Detail Charts & Tables Step 1: To view a breakdown of the degree totals by major, click on a degree type.
Last Revised: 7/31/14 Page 13 of 39

UG-Data Warehouse Degrees Report FINAL
Processing Steps Screen Shots Step 2: Select the information you wish to sort the details by: degree or gender.
Regardless of which sort type you choose from the drop-down menu in between the charts, you will be able to choose either of these two sort types when viewing details.
Reading the Major Detail Charts & Tables By Degree The Degrees Awarded By Major Details page appears with a chart and a table showing detail by major and sorted by degree.
The Degrees Awarded by Major Details Chart sorted by degree shows the specific majors associated with the degrees awarded for the term(s) selected. The terms that you selected do not appear on the chart. You can hover your mouse over a bar in the graph to view the number of degrees awarded for that major.
Last Revised: 7/31/14 Page 14 of 39

UG-Data Warehouse Degrees Report FINAL
Processing Steps Screen Shots The Degrees Awarded by Major Details table sorted by degree is organized into the following columns: • Academic Career: indicates the
type of degree program. • Degree: indicates the degree
type. • Academic Plan: indicates the
name of the major. • Degrees Awarded: the total
number of degrees awarded broken down by term.
• Total: the total number of degrees for all terms selected.
To return to the main report page, click Return at the bottom left of the page.
Last Revised: 7/31/14 Page 15 of 39

UG-Data Warehouse Degrees Report FINAL
Processing Steps Screen Shots
Reading the Major Detail Charts & Tables By Gender The Degrees Awarded By Major Details page appears with a chart and a table showing detail by major and sorted by gender.
The Degrees Awarded by Major Details Chart sorted by gender shows the specific majors associated with the degrees awarded for the term(s) selected. The terms that you selected do not appear on the chart. You can hover your mouse over a bar in the graph to view the number of degrees awarded for that major.
Last Revised: 7/31/14 Page 16 of 39

UG-Data Warehouse Degrees Report FINAL
Processing Steps Screen Shots The Degrees Awarded by Major Details table sorted by gender is organized into the following columns: • Academic Career: indicates the
type of degree program. • Degree: indicates the degree
type. • Academic Plan: indicates the
name of the major. • Gender: indicates the gender
population. • Degrees Awarded: the total
number of degrees awarded broken down by term.
• Total: the total number of degrees for all terms selected.
To return to the main report page, click Return at the bottom left of the page.
Last Revised: 7/31/14 Page 17 of 39

UG-Data Warehouse Degrees Report FINAL
3.0 Second Major Associated with Degrees Awarded
The Second Major Associated with Degrees Awarded report shows charts and tables for all second majors associated with the degrees awarded for the term(s) selected. The charts provide a visual representation of the data. The tables show the number of second majors associated with degrees awarded for each academic career and each degree type. Users can click on a degree type to get a breakdown of the degree by major.
When an individual student had a double major, only their second major will show in this report; information on their first major will appear on the Degrees Awarded By Major report.
Processing Steps Screen Shots
Running the Report Step 1: On the Degrees dashboard, click on Second Major Associated with Degrees Awarded.
Step 2: The report will automatically run with your personal settings if you have set them up. If you have not set up your personal settings, the report will show information for the default terms.
The default terms are the last three (3) completed terms.
Step 3: To change the terms that appear on the report, click on the drop-down menu.
Last Revised: 7/31/14 Page 18 of 39

UG-Data Warehouse Degrees Report FINAL
Processing Steps Screen Shots Step 4: You can scroll through the drop-down list and place a checkmark next to each term to be included OR click Search.
Step 5: Use the Select Values screen to search and browse available terms and add and remove them to the Selected column on the right. Once all of the terms you want to view are in the Selected column on the right, click OK.
When searching for a term in the Match field, remember that the search is case sensitive and abbreviation sensitive. To find fall 2000, you would enter Fall 2000; to find spring 2001, you would enter Spr 2001; to find summer 2001, you would enter Sum 2001.
For more information on how to use filters in Data Warehouse, view the Data Warehouse Filtering user guide or web tutorial.
Step 6: Click Apply to run the report.
Last Revised: 7/31/14 Page 19 of 39

UG-Data Warehouse Degrees Report FINAL
Processing Steps Screen Shots Step 6a: It may take several minutes for your data to appear. While the system is working to provide your results, you may see a “Searching” message.
Step 7: The updated report appears.
Reading the Charts
Degree counts on this report reflect the number of degrees awarded, not the number of students who received degrees; a single student may have been awarded multiple degrees. The default setting for the charts (and tables below) is by degree. Use the drop-down menu in between the two charts to view the charts and tables broken down by gender.
Last Revised: 7/31/14 Page 20 of 39

UG-Data Warehouse Degrees Report FINAL
Processing Steps Screen Shots
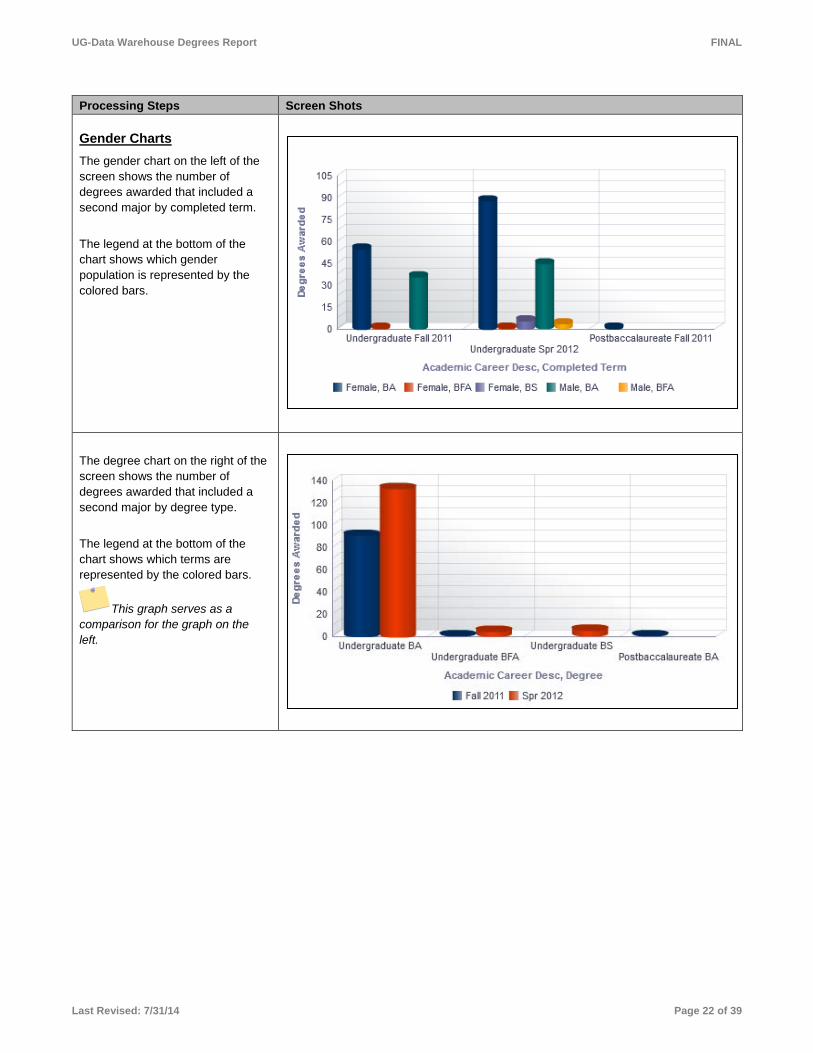
Degree Charts Both degree charts are showing you the same information, but the data is organized slightly differently. The degree chart on the left of the screen shows the number of degrees awarded that included a second major by completed term. The legend at the bottom of the chart shows which degrees are represented by the colored bars. Hovering your mouse over a bar on the graph will show you its value; clicking on the bar will take you to the detail screen which is covered later in this guide.
The degree chart on the right of the screen shows the number of degrees awarded that included a second major by degree type. The legend at the bottom of the chart shows which terms are represented by the colored bars.
Last Revised: 7/31/14 Page 21 of 39
UG-Data Warehouse Degrees Report FINAL
Processing Steps Screen Shots
Gender Charts The gender chart on the left of the screen shows the number of degrees awarded that included a second major by completed term. The legend at the bottom of the chart shows which gender population is represented by the colored bars.
The degree chart on the right of the screen shows the number of degrees awarded that included a second major by degree type. The legend at the bottom of the chart shows which terms are represented by the colored bars.
This graph serves as a comparison for the graph on the left.
Last Revised: 7/31/14 Page 22 of 39

UG-Data Warehouse Degrees Report FINAL
Processing Steps Screen Shots
Reading the Tables
Degree counts on this report reflect the number of degrees awarded, not the number of students who received degrees; a single student may have been awarded multiple degrees. The default setting for the tables (and the charts above) is by degree. Use the drop-down menu in between the two charts at the top of the screen to view the charts and tables broken down by gender.
Reading the Degree and Gender Tables The degree and gender tables present the same information; however, the gender table includes a breakdown of the degree totals by gender. The degree table is organized into the following columns: • Academic Career: indicates the
type of degree program. • Degree: indicates the degree
type. • Description: the full name of the
degree. • Degrees Awarded: the total
number of degrees awarded broken down by term.
• Total: the total number of degrees for all terms selected.
Last Revised: 7/31/14 Page 23 of 39

UG-Data Warehouse Degrees Report FINAL
Processing Steps Screen Shots The gender table is organized into the following columns: • Academic Career: indicates the
type of degree program. • Degree: indicates the degree
code. • Description: the full name of the
degree. • Gender: indicates the gender
population. • Degrees Awarded: the total
number of degrees awarded broken down by term.
• Total: the total number of degrees for all terms selected.
Reading the Second Major Detail Charts & Tables Step 1: To view a breakdown of the degree totals by major, click on a degree type.
Step 2: Select the information you wish to sort the details by: degree or gender.
Regardless of which sort type you choose from the drop-down menu in between the charts, you will be able to choose either of these two sort types when viewing details.
Last Revised: 7/31/14 Page 24 of 39

UG-Data Warehouse Degrees Report FINAL
Processing Steps Screen Shots
Reading the Second Major Detail Charts & Tables By Degree The Second Major Associated With Degrees Awarded Details page appears with a chart and a table showing detail by major and sorted by degree.
The Second Major Associated With Degrees Awarded Details Chart sorted by degree shows the specific majors associated with the degrees awarded for the term(s) selected. The terms that you selected do not appear on the chart. You can hover your mouse over a bar in the graph to view the number of degrees awarded for that major.
Last Revised: 7/31/14 Page 25 of 39

UG-Data Warehouse Degrees Report FINAL
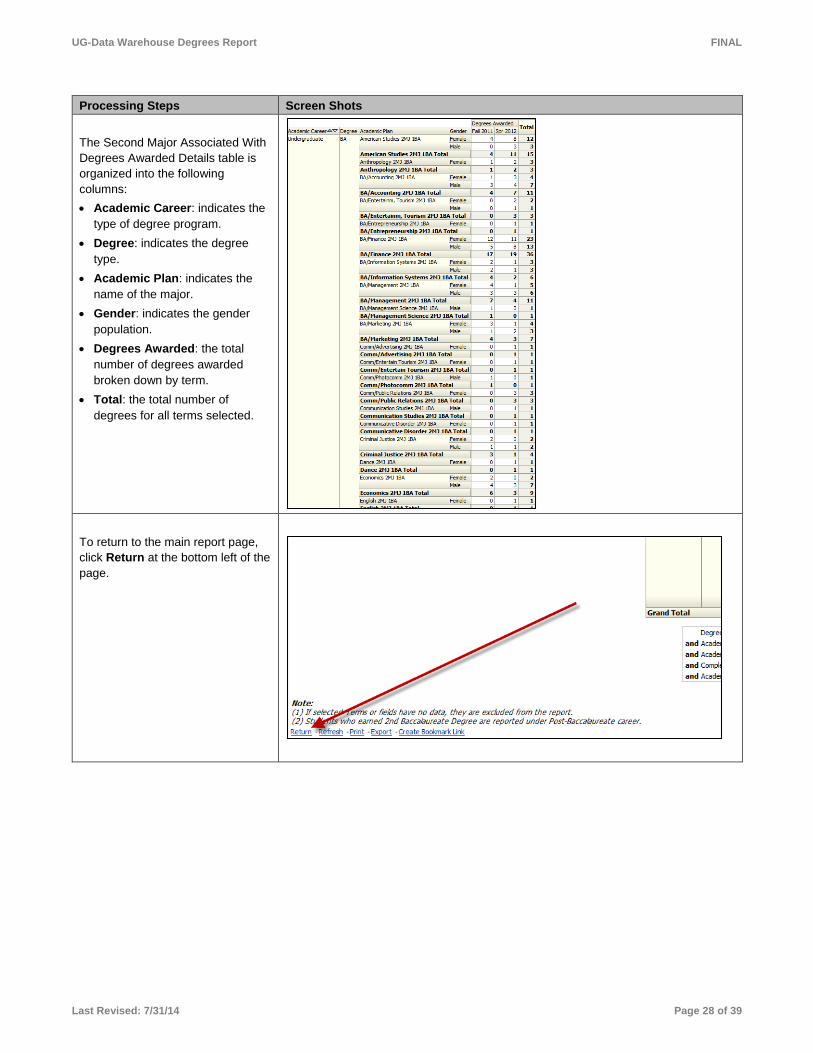
Processing Steps Screen Shots The Second Major Associated With Degrees Awarded Details table is organized into the following columns: • Academic Career: indicates the
type of degree program. • Degree: indicates the degree
type. • Academic Plan: indicates the
name of the major. • Degrees Awarded: the total
number of degrees awarded broken down by term.
• Total: the total number of degrees for all terms selected.
Last Revised: 7/31/14 Page 26 of 39

UG-Data Warehouse Degrees Report FINAL
Processing Steps Screen Shots To return to the main report page, click Return at the bottom left of the page.
Reading the Second Major Detail Charts & Tables By Gender The Second Major Associated With Degrees Awarded Details page appears with a chart and a table showing detail by major and sorted by gender.
The Second Major Associated With Degrees Awarded Details Chart sorted by gender shows the specific majors associated with the degrees awarded for the term(s) selected. The terms that you selected do not appear on the chart. You can hover your mouse over a bar in the graph to view the number of degrees awarded for that major.
Last Revised: 7/31/14 Page 27 of 39
UG-Data Warehouse Degrees Report FINAL
Processing Steps Screen Shots The Second Major Associated With Degrees Awarded Details table is organized into the following columns: • Academic Career: indicates the
type of degree program. • Degree: indicates the degree
type. • Academic Plan: indicates the
name of the major. • Gender: indicates the gender
population. • Degrees Awarded: the total
number of degrees awarded broken down by term.
• Total: the total number of degrees for all terms selected.
To return to the main report page, click Return at the bottom left of the page.
Last Revised: 7/31/14 Page 28 of 39

UG-Data Warehouse Degrees Report FINAL
4.0 Minor Associated with Degrees Awarded
The Minor Associated with Degrees Awarded report shows charts and tables of all minors associated with the degrees awarded for the term(s) selected. The charts provide a visual representation of the data. The tables show the number of minors associated with degrees awarded for each academic career and each degree type. Users can click on a degree type to get a breakdown of the degree by minor.
Processing Steps Screen Shots
Running the Report Step 1: On the Degrees dashboard, click on Minor Associated with Degrees Awarded.
Step 2: The report will automatically run with your personal settings if you have set them up. If you have not set up your personal settings, the report will show information for the default terms.
The default terms are the last three (3) completed terms.
Step 3: To change the terms that appear on the report, click on the drop-down menu.
Last Revised: 7/31/14 Page 29 of 39

UG-Data Warehouse Degrees Report FINAL
Processing Steps Screen Shots Step 4: You can scroll through the drop-down list and place a checkmark next to each term to be included OR click Search.
Step 5: Use the Select Values screen to search and browse available terms and add and remove them to the Selected column on the right. Once all of the terms you want to view are in the Selected column on the right, click OK.
When searching for a term in the Match field, remember that the search is case sensitive and abbreviation sensitive. To find fall 2000, you would enter Fall 2000; to find spring 2001, you would enter Spr 2001; to find summer 2001, you would enter Sum 2001.
For more information on how to use filters in Data Warehouse, view the Data Warehouse Filtering user guide or web tutorial.
Step 6: Click Apply to run the report.
Last Revised: 7/31/14 Page 30 of 39

UG-Data Warehouse Degrees Report FINAL
Processing Steps Screen Shots Step 6a: It may take several minutes for your data to appear. While the system is working to provide your results, you may see a “Searching” message.
Step 7: The updated report appears.
Reading the Charts
Degree counts on this report reflect the number of degrees awarded, not the number of students who received degrees; a single student may have been awarded multiple degrees. The default setting for the charts (and tables below) is by degree. Use the drop-down menu in between the two charts to view the charts and tables broken down by gender.
Last Revised: 7/31/14 Page 31 of 39

UG-Data Warehouse Degrees Report FINAL
Processing Steps Screen Shots
Degree Charts Both degree charts are showing you the same information, but the data is organized slightly differently. The degree chart on the left of the screen shows the number of degrees awarded that included a minor by completed term. The legend at the bottom of the chart shows which degrees are represented by the colored bars. Hovering your mouse over a bar on the graph will show you its value; clicking on the bar will take you to the detail screen which is covered later in this guide.
The degree chart on the right of the screen shows the number of degrees awarded that included a minor by degree type. The legend at the bottom of the chart shows which terms are represented by the colored bars.
Last Revised: 7/31/14 Page 32 of 39

UG-Data Warehouse Degrees Report FINAL
Processing Steps Screen Shots
Gender Charts The gender chart on the left of the screen shows the number of degrees awarded that included a minor by completed term. The legend at the bottom of the chart shows which gender population is represented by the colored bars.
The degree chart on the right of the screen shows the number of degrees awarded that included a minor by degree type. The legend at the bottom of the chart shows which terms are represented by the colored bars.
This graph serves as a comparison for the graph on the left.
Last Revised: 7/31/14 Page 33 of 39

UG-Data Warehouse Degrees Report FINAL
Processing Steps Screen Shots
Reading the Tables
Degree counts on this report reflect the number of degrees awarded, not the number of students who received degrees; a single student may have been awarded multiple degrees. The default setting for the tables (and the charts above) is by degree. Use the drop-down menu in between the two charts at the top of the screen to view the charts and tables broken down by gender.
Reading the Degree and Gender Tables The degree and gender tables present the same information; however, the gender table includes a breakdown of the degree totals by gender. The degree table is organized into the following columns: • Academic Career: indicates the
type of degree program. • Degree: indicates the degree
type. • Description: the full name of the
degree. • Degrees Awarded: the total
number of degrees awarded that included a minor broken down by term.
• Total: the total number of degrees for all terms selected.
Last Revised: 7/31/14 Page 34 of 39

UG-Data Warehouse Degrees Report FINAL
Processing Steps Screen Shots The gender table is organized into the following columns: • Academic Career: indicates the
type of degree program. • Degree: indicates the degree
type. • Description: the full name of the
degree. • Gender: indicates the gender
population. • Degrees Awarded: the total
number of degrees awarded that included a minor broken down by term.
• Total: the total number of degrees for all terms selected.
Reading the Minor Detail Charts & Tables Step 1: To view a breakdown of the degree totals by minor, click on a degree code.
Step 2: Select the information you wish to sort the details by: degree or gender.
Regardless of which sort type you choose from the drop-down menu in between the charts, you will be able to choose either of these two sort types when viewing details.
Last Revised: 7/31/14 Page 35 of 39

UG-Data Warehouse Degrees Report FINAL
Processing Steps Screen Shots
Reading the Minor Detail Charts & Tables By Degree The Minor Associated With Degrees Awarded Details page appears with a chart and a table showing detail by minor and sorted by degree.
The Minor Associated With Degrees Awarded Details Chart sorted by degree shows the specific minors associated with the degrees awarded for the term(s) selected. The terms that you selected do not appear on the chart. You can hover your mouse over a bar in the graph to view the number of degrees awarded for that major.
Last Revised: 7/31/14 Page 36 of 39

UG-Data Warehouse Degrees Report FINAL
Processing Steps Screen Shots The Minor Associated with Degrees Awarded Details table is organized into the following columns: • Academic Career: indicates the
type of degree program. • Degree: indicates the degree
type. • Minor: the name of the minor. • Degrees Awarded: the total
number of degrees awarded broken down by term.
• Total: the total number of degrees for all terms selected.
Last Revised: 7/31/14 Page 37 of 39

UG-Data Warehouse Degrees Report FINAL
Processing Steps Screen Shots To return to the main report page, click Return at the bottom left of the page.
Reading the Minor Detail Charts & Tables By Gender The Minor Associated With Degrees Awarded Details page appears with a chart and a table showing detail by minor and sorted by gender.
The Minor Associated With Degrees Awarded Details Chart sorted by degree shows the specific minors associated with the degrees awarded for the term(s) selected. The terms that you selected do not appear on the chart. You can hover your mouse over a bar in the graph to view the number of degrees awarded for that major.
Last Revised: 7/31/14 Page 38 of 39

UG-Data Warehouse Degrees Report FINAL
Processing Steps Screen Shots The Minor Associated with Degrees Awarded Details table is organized into the following columns: • Academic Career: indicates the
type of degree program. • Degree: indicates the degree
type. • Minor: the name of the minor. • Gender: indicates the gender
population. • Degrees Awarded: the total
number of degrees awarded broken down by term.
• Total: the total number of degrees for all terms selected.
To return to the main report page, click Return at the bottom left of the page.
Last Revised: 7/31/14 Page 39 of 39