Embed Size (px)
Citation preview
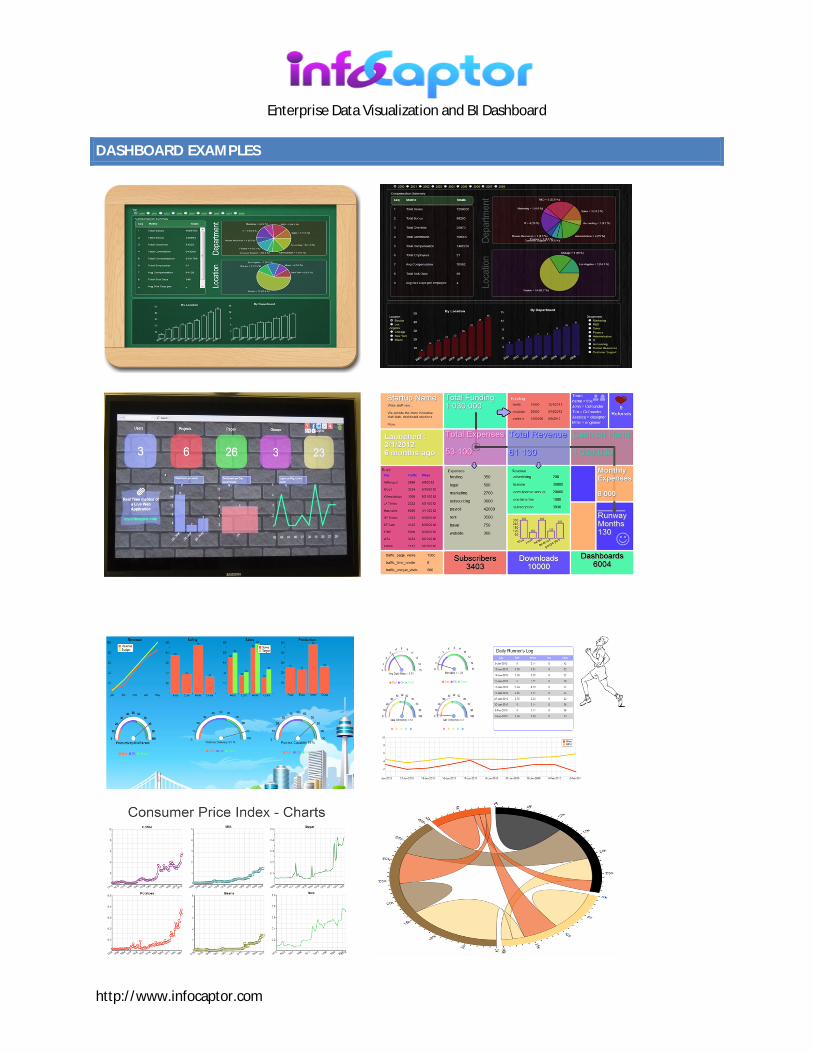
Enterprise Data Visualization and BI Dashboard
http://www.infocaptor.com
Strengths Key Features and Benefits
Ad-hoc Visualization and Data Discovery
The application is web based and can be installed on any windows or linux server. There is no need to install anything on the desktop.
Drag and Drop Visual Analyzer for self-service data exploration Work with data from flat files, Excel or SQL databases. Takes only few clicks from data to final dashboards. Various visual, sound, and motion alert mechanisms on important KPI changes. STATIC views that can be refreshed when needed. Dynamic and interactive views for users to select filters and see live data changes
Prototyping Mockups Dashboards
Unique dashboard editor unlike any other vendor. Provides a prototyping and flowcharting engine for quick dashboard mockups Free style placement of widgets [no restrictive grids] Prebuilt widgets for building modern infographic style dashboards Modern visualizations and extremely easy to build dashboards
Collaboration Sharing dashboards directly on internet with URL or private sharing within team Projects and user groups for collaborative work Embed dashboard or individual widgets LIVE on any web page.
Integration Integrates data extracts from multiple databases, HTML sources and any web service, thereby eliminating any manual data collection and entry
HTML5 standards allow dashboards rendered on any modern browser including mobile devices and tablets.
Directly embed dashboards and charts on third party sites, portals and SharePoint pages.
Social connectors to get common metrics from Facebook/twitter HTTP POST/GET data access to interface with any outside world API
Security Enterprise user access control mechanism. Public or private dashboards. Integrates with LDAP or Active Directory
Visualizations Comprehensive library from pivot tables to bars, stacks,area and scatter plots Hierarchical visualizations such as Circle pack, Treemap, sunburst and cluster charts Trellis and small multiples Create fully contained dashboards with static data or connect to live databases.
Deployment options
Companies/Organizations can install and host it within their own network/firewall Available as a Cloud service at https://my.infocaptor.com Free Data visualization service
https://my.infocaptor.com/free_data_visualization.php
Enterprise Data Visualization and BI Dashboard
http://www.infocaptor.com
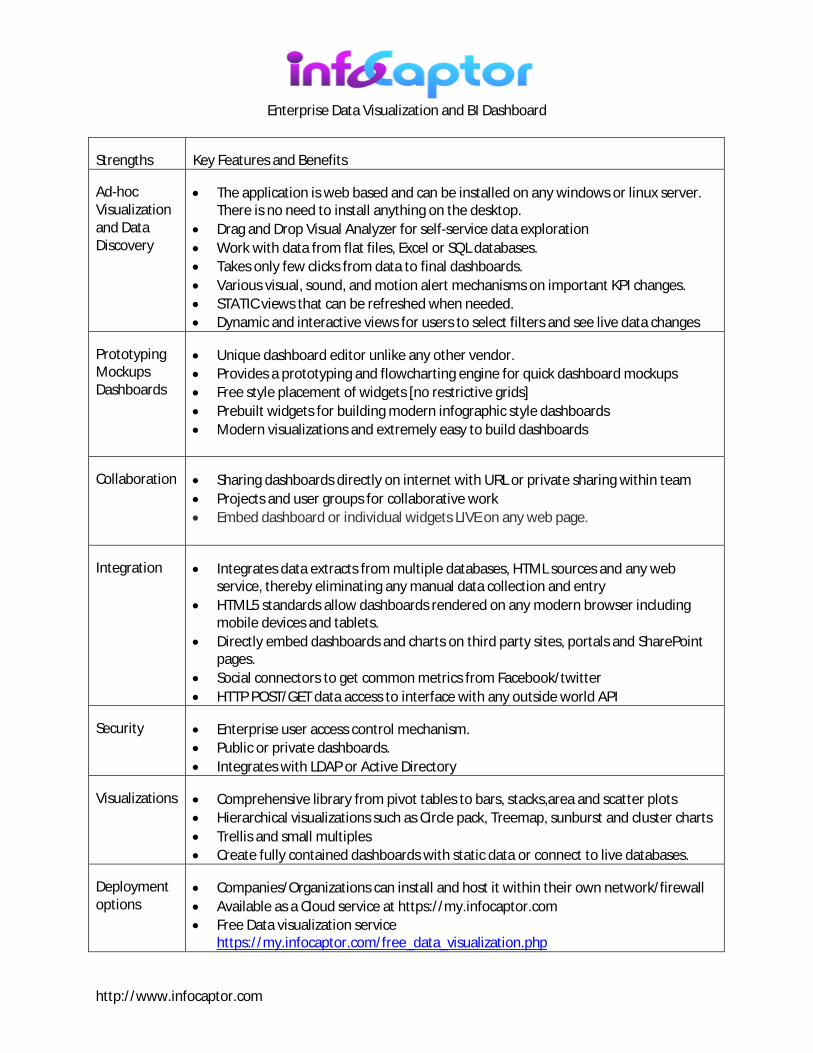
SAMPLE VISUALIZATIONS
This section provides samples of visualizations that can be created using InfoCaptor Enterprise Solution.
Pivot Grids
Hierarchical Display/ Dynamic Rollup and Drill down Pivot Grids
Enterprise Data Visualization and BI Dashboard
http://www.infocaptor.com
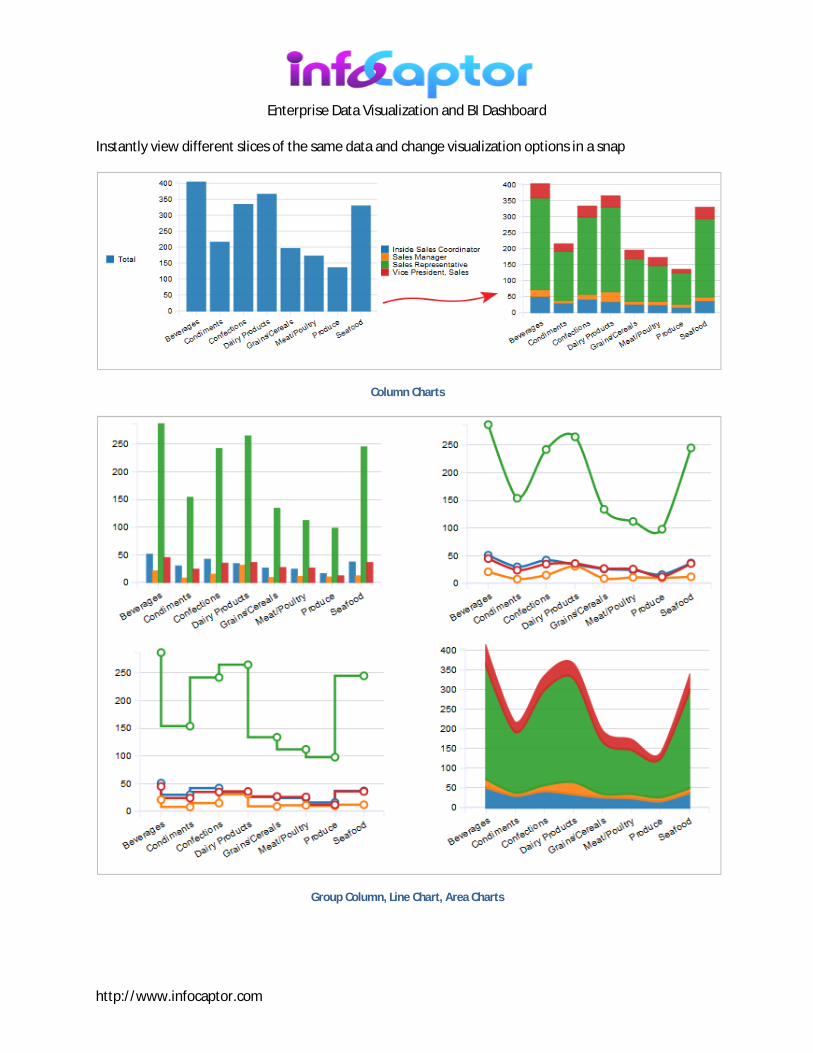
Instantly view different slices of the same data and change visualization options in a snap
Column Charts
Group Column, Line Chart, Area Charts
Enterprise Data Visualization and BI Dashboard
http://www.infocaptor.com
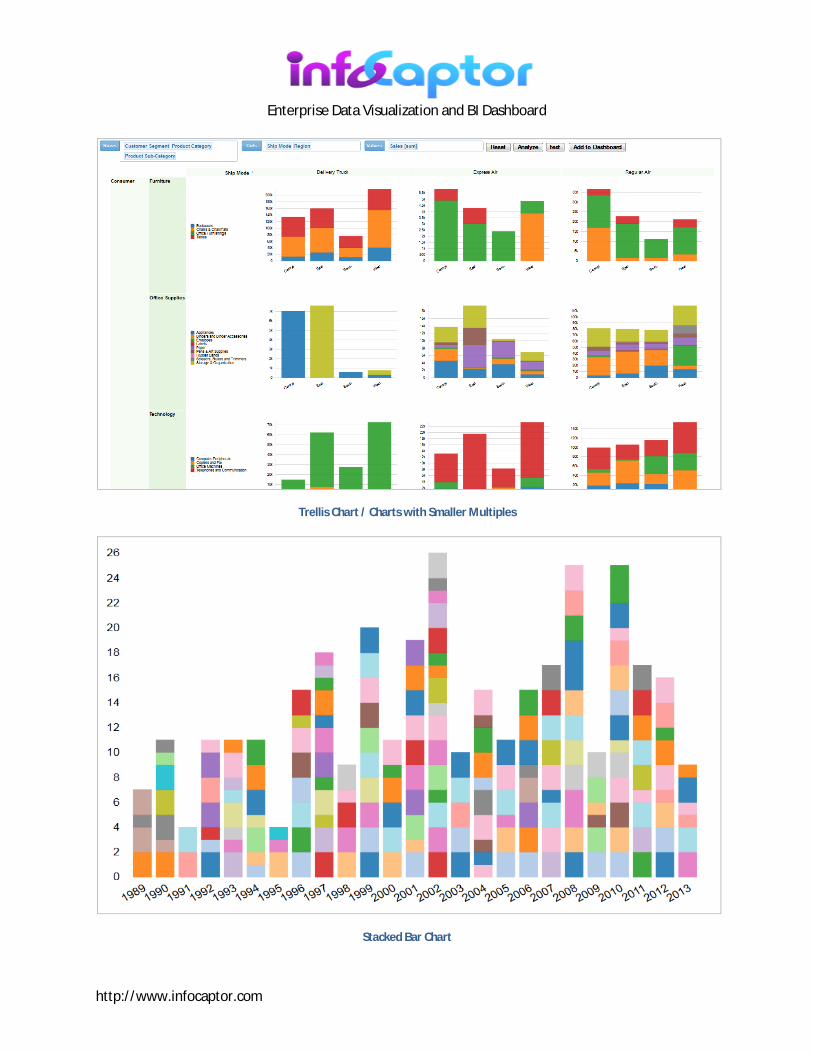
Trellis Chart / Charts with Smaller Multiples
Stacked Bar Chart
Enterprise Data Visualization and BI Dashboard
http://www.infocaptor.com
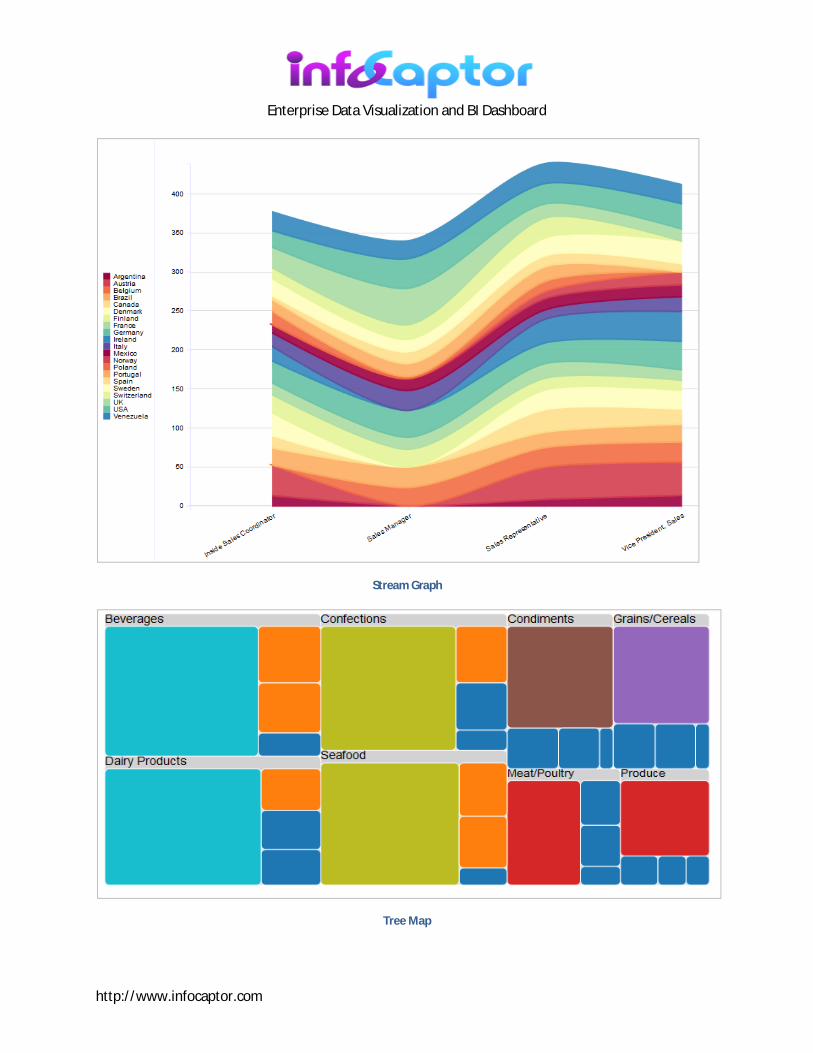
Stream Graph
Tree Map
Enterprise Data Visualization and BI Dashboard
http://www.infocaptor.com
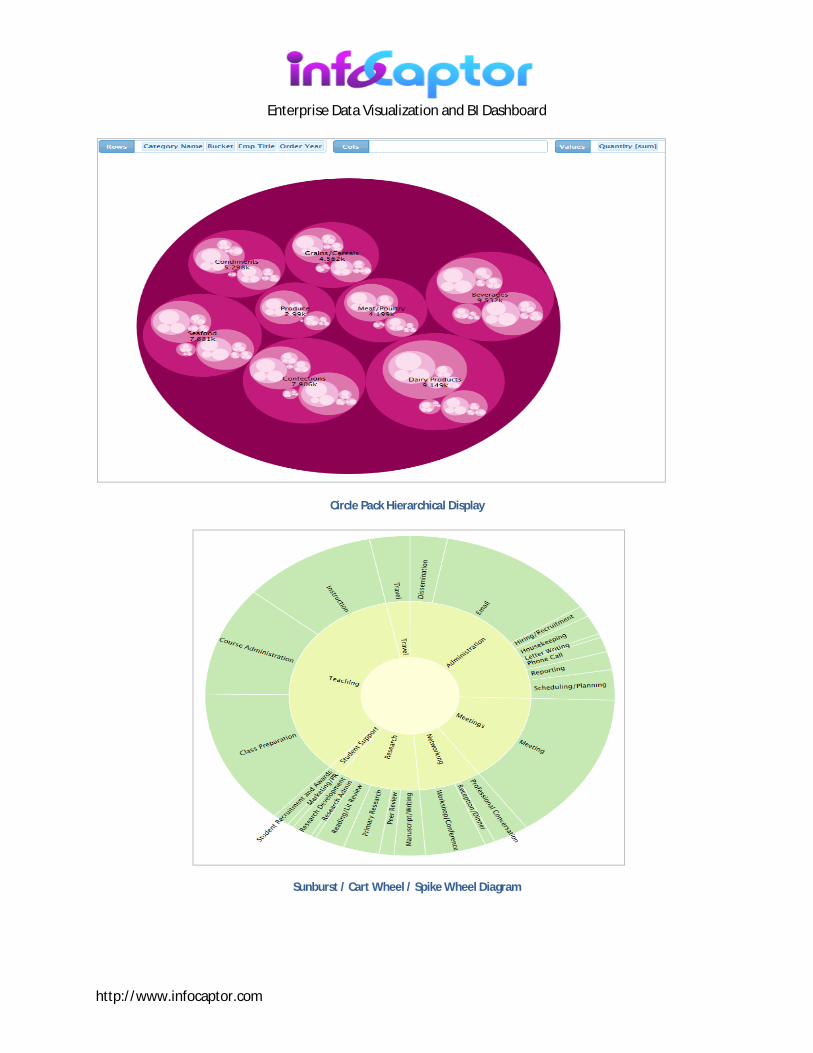
Circle Pack Hierarchical Display
Sunburst / Cart Wheel / Spike Wheel Diagram
Enterprise Data Visualization and BI Dashboard
http://www.infocaptor.com
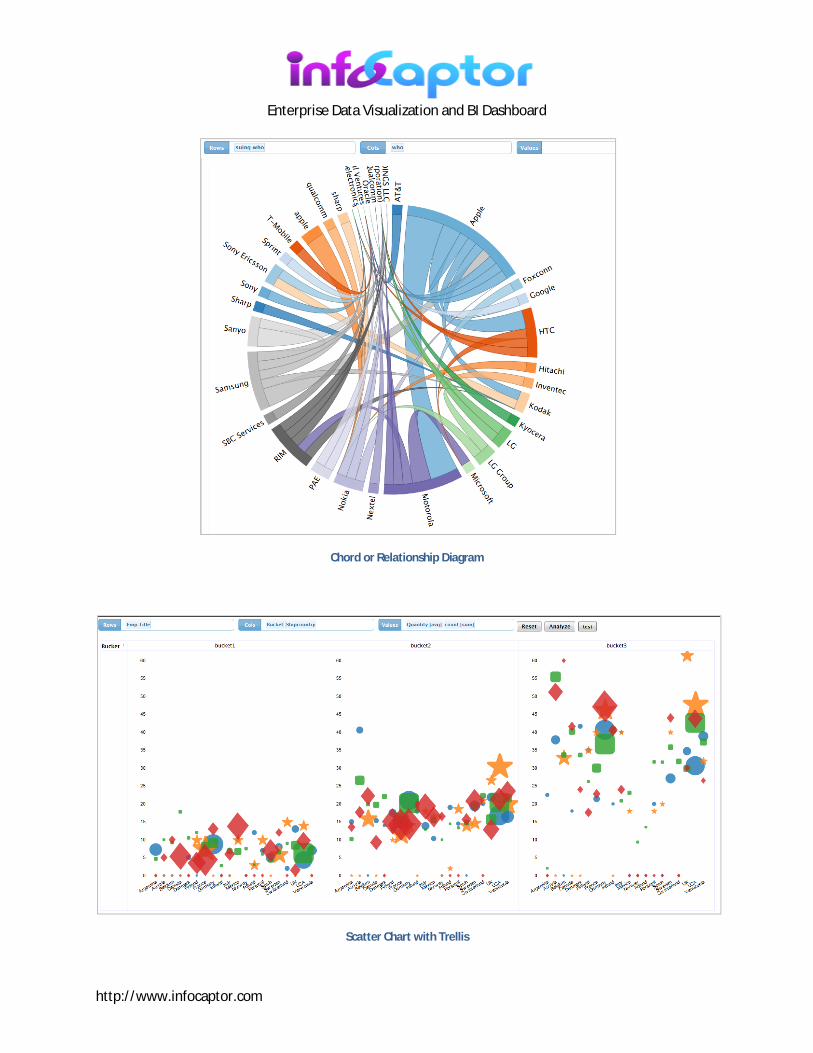
Chord or Relationship Diagram
Scatter Chart with Trellis
Enterprise Data Visualization and BI Dashboard
http://www.infocaptor.com
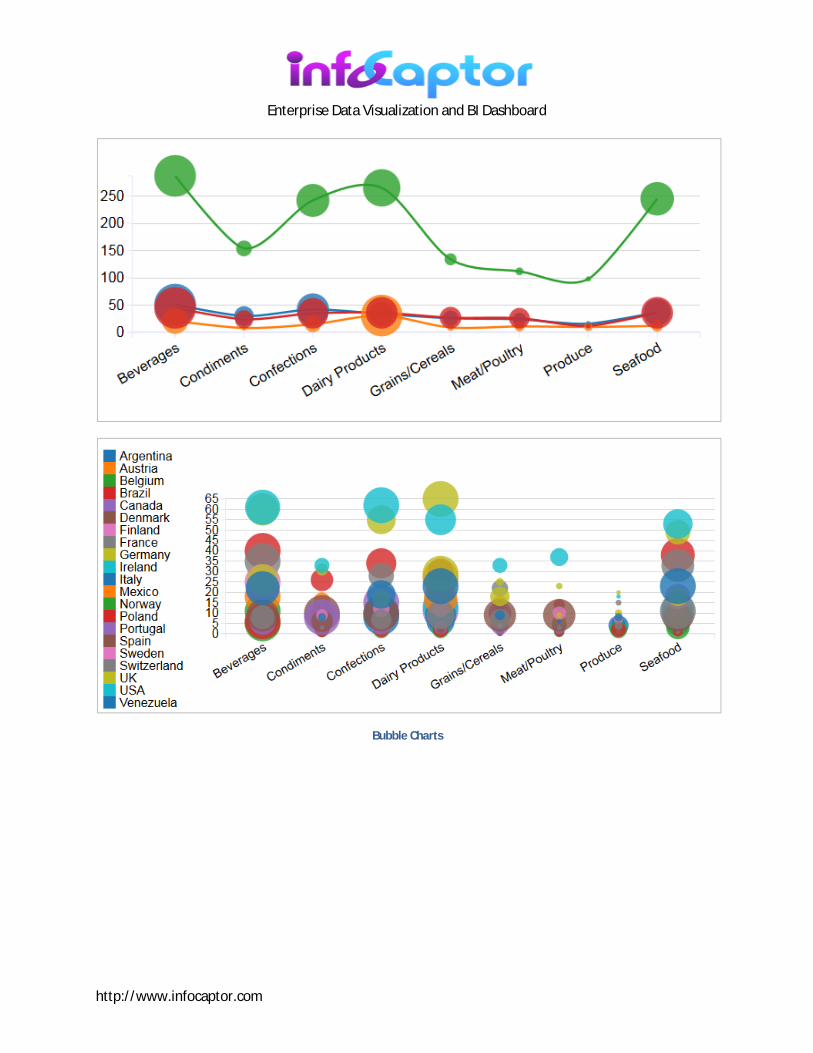
Bubble Charts
Enterprise Data Visualization and BI Dashboard
http://www.infocaptor.com
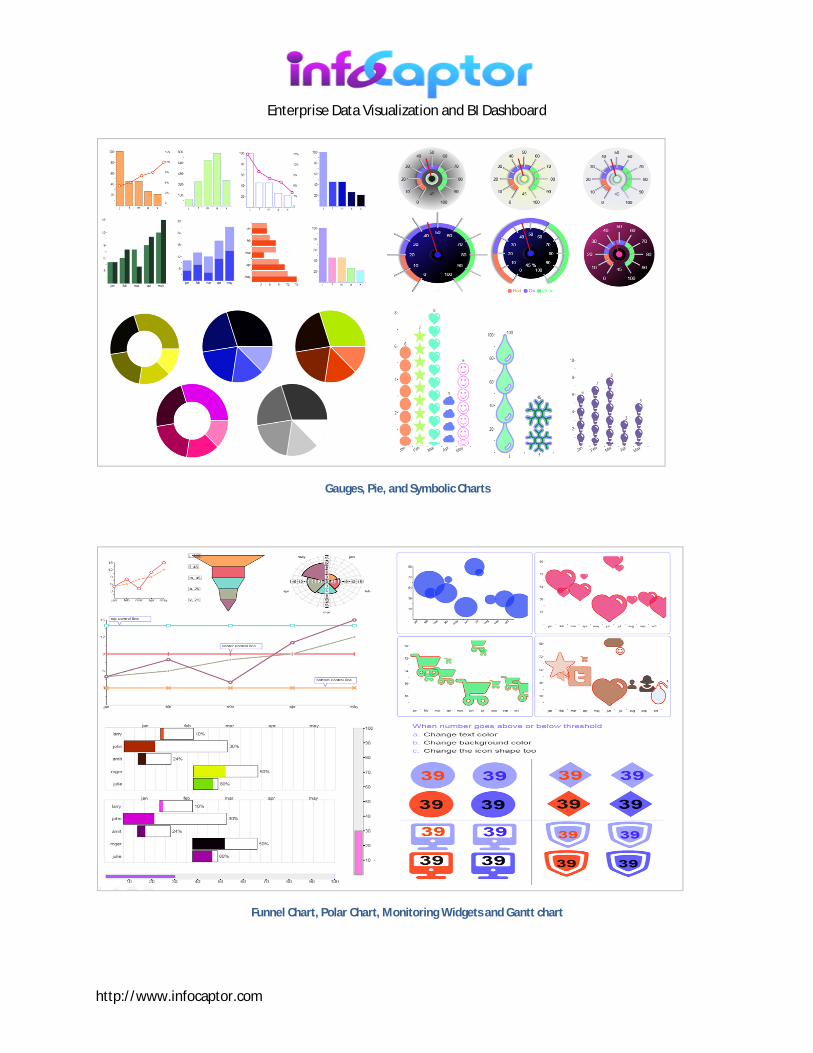
Gauges, Pie, and Symbolic Charts
Funnel Chart, Polar Chart, Monitoring Widgets and Gantt chart
Enterprise Data Visualization and BI Dashboard
http://www.infocaptor.com
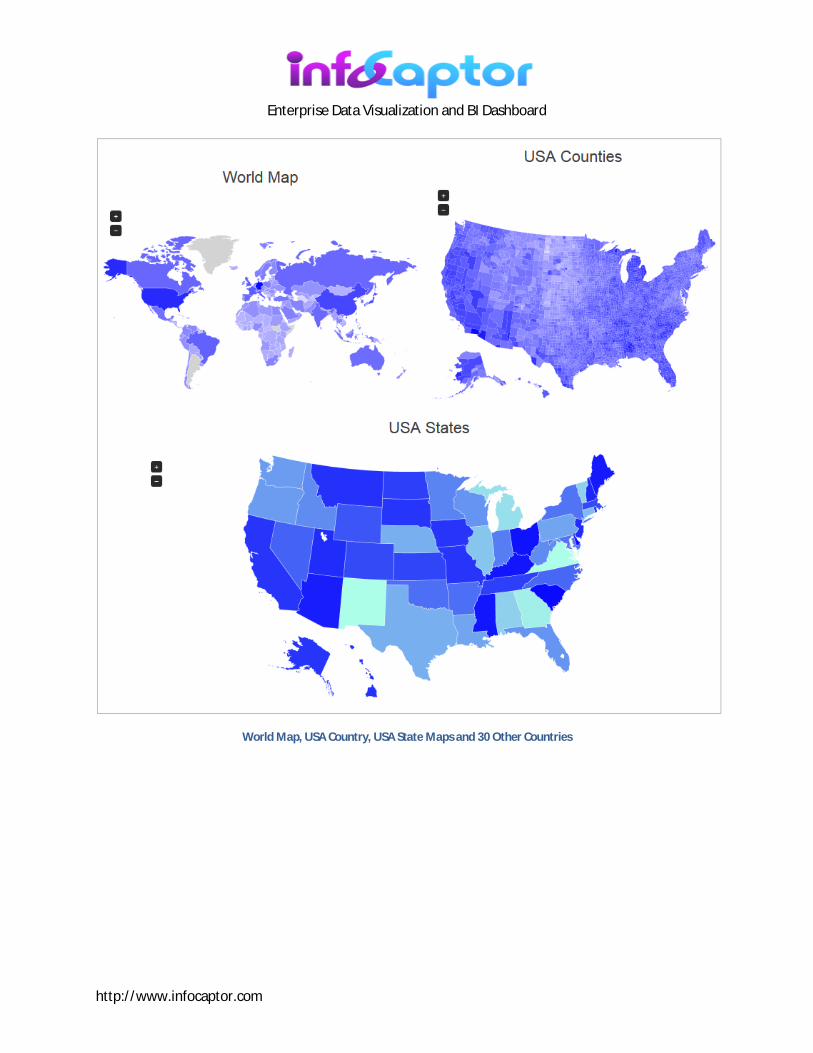
World Map, USA Country, USA State Maps and 30 Other Countries
Enterprise Data Visualization and BI Dashboard
http://www.infocaptor.com
DASHBOARD EXAMPLES