Embed Size (px)
Citation preview
ENTERPRISE DASHBOARD USERMANUAL T-Systems International GmbH Version 1.36 Last revised 10/19/2021 Status Released

2
PUBLICATION DETAILS
PUBLISHED BY
T-Systems International GmbH Open Telekom Cloud Hahnstraße 43d, 60528 Frankfurt am Main
Filename Document number Document name
Enterprise Dashboard User Manual na Enterprise Dashboard User Manual
Version Last revised Status
1.36 Oct. 25, 21 Released
Dashboard Squad
3
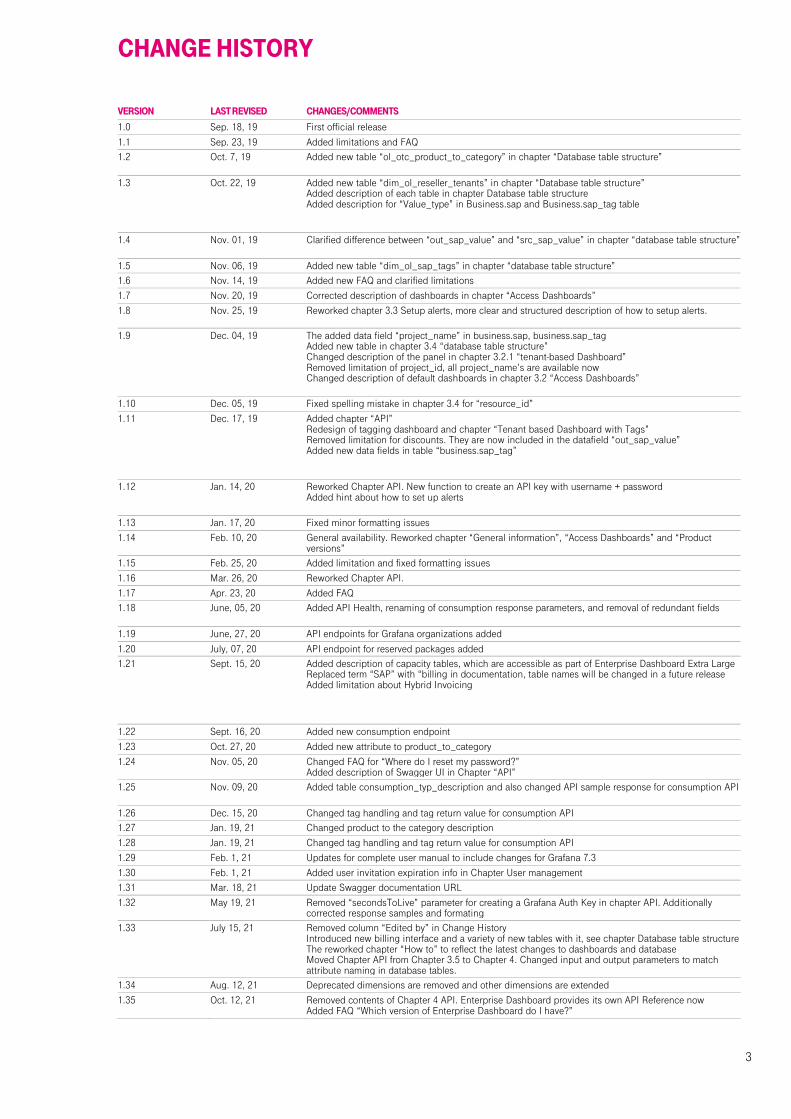
CHANGE HISTORY
VERSION LAST REVISED CHANGES/COMMENTS
1.0 Sep. 18, 19 First official release
1.1 Sep. 23, 19 Added limitations and FAQ
1.2 Oct. 7, 19 Added new table “ol_otc_product_to_category” in chapter “Database table structure”
1.3 Oct. 22, 19 Added new table “dim_ol_reseller_tenants” in chapter “Database table structure” Added description of each table in chapter Database table structure Added description for “Value_type” in Business.sap and Business.sap_tag table
1.4 Nov. 01, 19 Clarified difference between “out_sap_value” and “src_sap_value” in chapter “database table structure”
1.5 Nov. 06, 19 Added new table “dim_ol_sap_tags” in chapter “database table structure”
1.6 Nov. 14, 19 Added new FAQ and clarified limitations
1.7 Nov. 20, 19 Corrected description of dashboards in chapter “Access Dashboards”
1.8 Nov. 25, 19 Reworked chapter 3.3 Setup alerts, more clear and structured description of how to setup alerts.
1.9 Dec. 04, 19 The added data field “project_name” in business.sap, business.sap_tag Added new table in chapter 3.4 “database table structure” Changed description of the panel in chapter 3.2.1 “tenant-based Dashboard” Removed limitation of project_id, all project_name’s are available now Changed description of default dashboards in chapter 3.2 “Access Dashboards”
1.10 Dec. 05, 19 Fixed spelling mistake in chapter 3.4 for “resource_id”
1.11 Dec. 17, 19 Added chapter “API” Redesign of tagging dashboard and chapter “Tenant based Dashboard with Tags” Removed limitation for discounts. They are now included in the datafield “out_sap_value” Added new data fields in table “business.sap_tag”
1.12 Jan. 14, 20 Reworked Chapter API. New function to create an API key with username + password Added hint about how to set up alerts
1.13 Jan. 17, 20 Fixed minor formatting issues
1.14 Feb. 10, 20 General availability. Reworked chapter “General information”, “Access Dashboards” and “Product versions”
1.15 Feb. 25, 20 Added limitation and fixed formatting issues
1.16 Mar. 26, 20 Reworked Chapter API.
1.17 Apr. 23, 20 Added FAQ
1.18 June, 05, 20 Added API Health, renaming of consumption response parameters, and removal of redundant fields
1.19 June, 27, 20 API endpoints for Grafana organizations added
1.20 July, 07, 20 API endpoint for reserved packages added
1.21 Sept. 15, 20 Added description of capacity tables, which are accessible as part of Enterprise Dashboard Extra Large Replaced term “SAP” with “billing in documentation, table names will be changed in a future release Added limitation about Hybrid Invoicing
1.22 Sept. 16, 20 Added new consumption endpoint
1.23 Oct. 27, 20 Added new attribute to product_to_category
1.24 Nov. 05, 20 Changed FAQ for “Where do I reset my password?” Added description of Swagger UI in Chapter “API”
1.25 Nov. 09, 20 Added table consumption_typ_description and also changed API sample response for consumption API
1.26 Dec. 15, 20 Changed tag handling and tag return value for consumption API
1.27 Jan. 19, 21 Changed product to the category description
1.28 Jan. 19, 21 Changed tag handling and tag return value for consumption API
1.29 Feb. 1, 21 Updates for complete user manual to include changes for Grafana 7.3
1.30 Feb. 1, 21 Added user invitation expiration info in Chapter User management
1.31 Mar. 18, 21 Update Swagger documentation URL
1.32 May 19, 21 Removed “secondsToLive” parameter for creating a Grafana Auth Key in chapter API. Additionally corrected response samples and formating
1.33 July 15, 21 Removed column “Edited by” in Change History Introduced new billing interface and a variety of new tables with it, see chapter Database table structure The reworked chapter “How to” to reflect the latest changes to dashboards and database Moved Chapter API from Chapter 3.5 to Chapter 4. Changed input and output parameters to match attribute naming in database tables.
1.34 Aug. 12, 21 Deprecated dimensions are removed and other dimensions are extended
1.35 Oct. 12, 21 Removed contents of Chapter 4 API. Enterprise Dashboard provides its own API Reference now Added FAQ “Which version of Enterprise Dashboard do I have?”

4
5
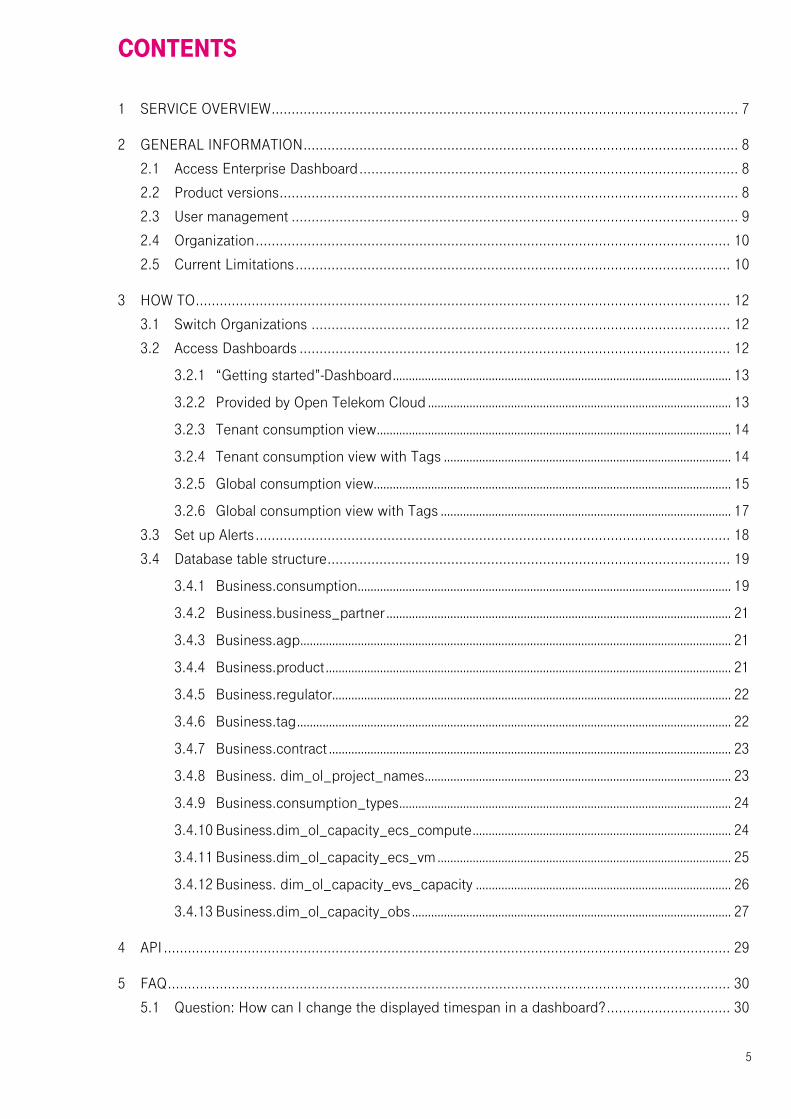
CONTENTS
1 SERVICE OVERVIEW ..................................................................................................................... 7
2 GENERAL INFORMATION ............................................................................................................. 8
2.1 Access Enterprise Dashboard ............................................................................................... 8
2.2 Product versions ................................................................................................................... 8
2.3 User management ................................................................................................................ 9
2.4 Organization ....................................................................................................................... 10
2.5 Current Limitations ............................................................................................................. 10
3 HOW TO ...................................................................................................................................... 12
3.1 Switch Organizations ......................................................................................................... 12
3.2 Access Dashboards ............................................................................................................ 12
3.2.1 “Getting started”-Dashboard .......................................................................................................... 13
3.2.2 Provided by Open Telekom Cloud ............................................................................................... 13
3.2.3 Tenant consumption view ............................................................................................................... 14
3.2.4 Tenant consumption view with Tags .......................................................................................... 14
3.2.5 Global consumption view................................................................................................................ 15
3.2.6 Global consumption view with Tags ........................................................................................... 17
3.3 Set up Alerts ....................................................................................................................... 18
3.4 Database table structure ..................................................................................................... 19
3.4.1 Business.consumption ..................................................................................................................... 19
3.4.2 Business.business_partner ............................................................................................................ 21
3.4.3 Business.agp ....................................................................................................................................... 21
3.4.4 Business.product ............................................................................................................................... 21
3.4.5 Business.regulator ............................................................................................................................. 22
3.4.6 Business.tag ........................................................................................................................................ 22
3.4.7 Business.contract .............................................................................................................................. 23
3.4.8 Business. dim_ol_project_names ................................................................................................ 23
3.4.9 Business.consumption_types ........................................................................................................ 24
3.4.10 Business.dim_ol_capacity_ecs_compute ................................................................................. 24
3.4.11 Business.dim_ol_capacity_ecs_vm ............................................................................................ 25
3.4.12 Business. dim_ol_capacity_evs_capacity ................................................................................ 26
3.4.13 Business.dim_ol_capacity_obs .................................................................................................... 27
4 API .............................................................................................................................................. 29
5 FAQ ............................................................................................................................................. 30
5.1 Question: How can I change the displayed timespan in a dashboard? ............................... 30
6
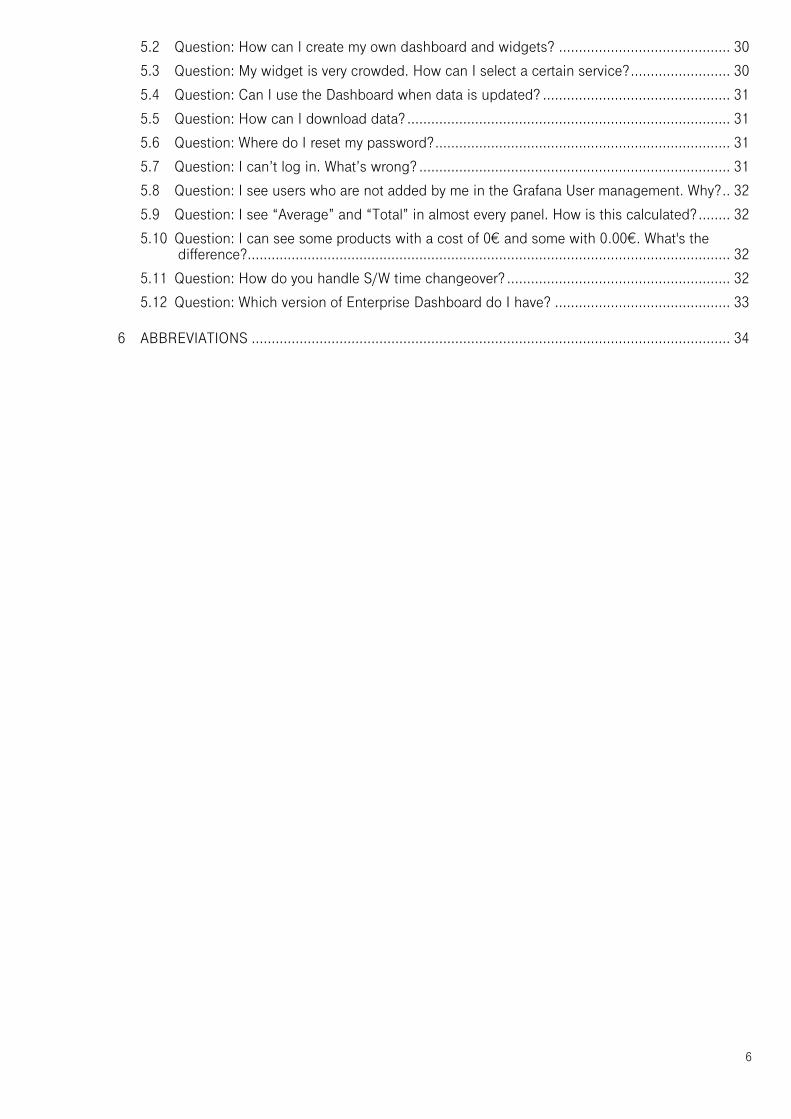
5.2 Question: How can I create my own dashboard and widgets? ........................................... 30
5.3 Question: My widget is very crowded. How can I select a certain service? ......................... 30
5.4 Question: Can I use the Dashboard when data is updated? ............................................... 31
5.5 Question: How can I download data? ................................................................................. 31
5.6 Question: Where do I reset my password? .......................................................................... 31
5.7 Question: I can’t log in. What’s wrong? .............................................................................. 31
5.8 Question: I see users who are not added by me in the Grafana User management. Why? .. 32
5.9 Question: I see “Average” and “Total” in almost every panel. How is this calculated? ........ 32
5.10 Question: I can see some products with a cost of 0€ and some with 0.00€. What's the difference? ......................................................................................................................... 32
5.11 Question: How do you handle S/W time changeover? ........................................................ 32
5.12 Question: Which version of Enterprise Dashboard do I have? ............................................ 33
6 ABBREVIATIONS ........................................................................................................................ 34

7
1 SERVICE OVERVIEW
Enterprise Dashboard is a web-based Dashboard that gives you access to your billing data. It allows you to check your spendings for your used Open Telekom Cloud infrastructure. Enterprise Dashboard provides you dedicated views for specific tenants and their cost drivers. It will also allow you to monitor your spendings on a payer level. This means that all costs for each of your tenants assigned to you as a payer are visible within one Dashboard. Grafana 7.3 is currently used. Feel free to check the documentation of Grafana as well, if you’re missing certain functionalities within this user manual. Please check the following link: https://grafana.com/docs/grafana/v7.3/
8
2 GENERAL INFORMATION
2.1 Access Enterprise Dashboard
Enterprise Dashboard can be accessed by visiting the following URL:
▪ https://enterprise-dashboard.otc-service.com To enter Enterprise Dashboard you need to enter your credentials. Your email and password are required. You will receive an invitation for Enterprise Dashboard, once the order is confirmed and processed. With this invitation, you can set the password of your user account. Your email and password are case-sensitive. Please check upper and lower cases before clicking Log In. *Note* Enterprise Dashboard is offered via Direct sales only. Please contact either your contractual partner to set up your access or contact [email protected]
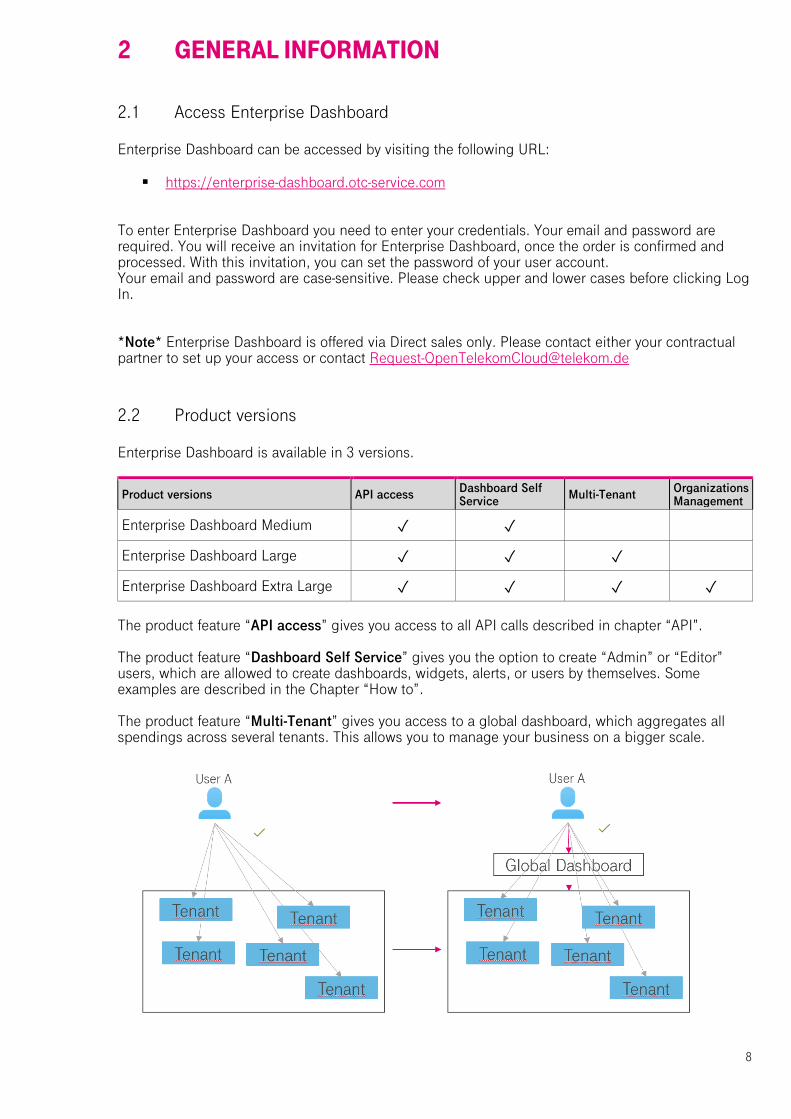
2.2 Product versions
Enterprise Dashboard is available in 3 versions.
Product versions API access Dashboard Self Service
Multi-Tenant Organizations Management
Enterprise Dashboard Medium ✓ ✓
Enterprise Dashboard Large ✓ ✓ ✓
Enterprise Dashboard Extra Large ✓ ✓ ✓ ✓
The product feature “API access” gives you access to all API calls described in chapter “API”. The product feature “Dashboard Self Service” gives you the option to create “Admin” or “Editor” users, which are allowed to create dashboards, widgets, alerts, or users by themselves. Some examples are described in the Chapter “How to”. The product feature “Multi-Tenant” gives you access to a global dashboard, which aggregates all spendings across several tenants. This allows you to manage your business on a bigger scale.
9
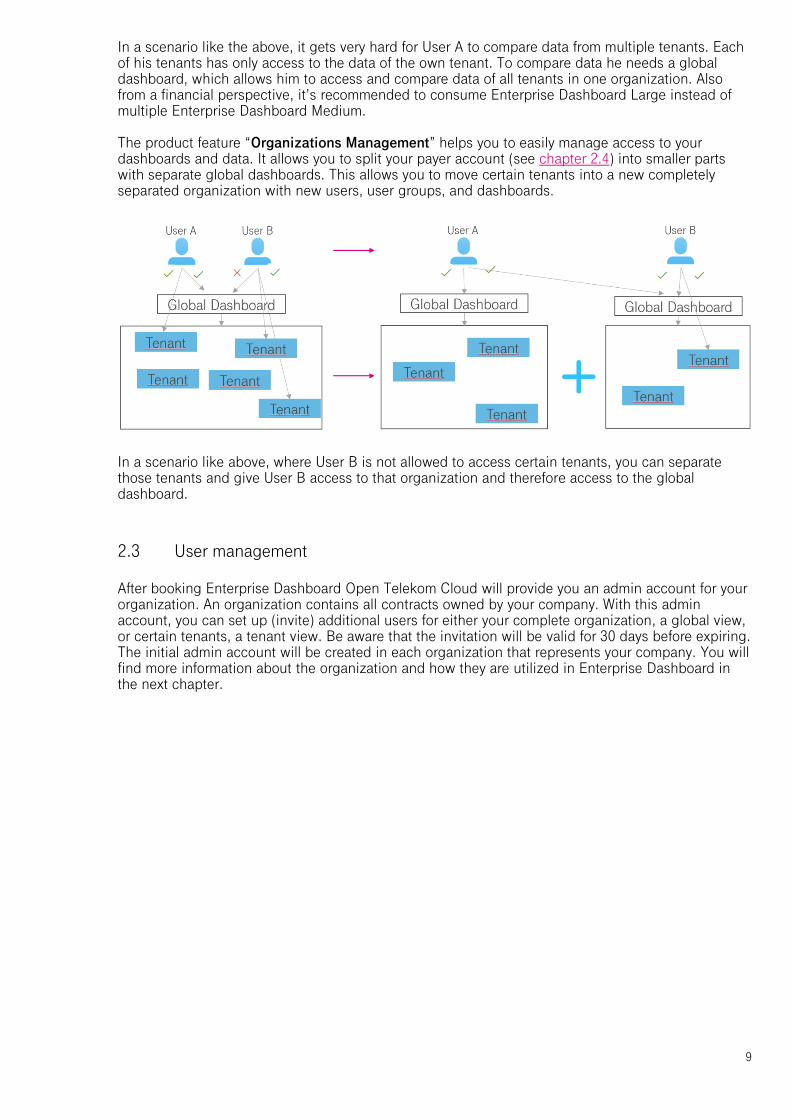
In a scenario like the above, it gets very hard for User A to compare data from multiple tenants. Each of his tenants has only access to the data of the own tenant. To compare data he needs a global dashboard, which allows him to access and compare data of all tenants in one organization. Also from a financial perspective, it’s recommended to consume Enterprise Dashboard Large instead of multiple Enterprise Dashboard Medium. The product feature “Organizations Management” helps you to easily manage access to your dashboards and data. It allows you to split your payer account (see chapter 2.4) into smaller parts with separate global dashboards. This allows you to move certain tenants into a new completely separated organization with new users, user groups, and dashboards.
In a scenario like above, where User B is not allowed to access certain tenants, you can separate those tenants and give User B access to that organization and therefore access to the global dashboard.
2.3 User management
After booking Enterprise Dashboard Open Telekom Cloud will provide you an admin account for your organization. An organization contains all contracts owned by your company. With this admin account, you can set up (invite) additional users for either your complete organization, a global view, or certain tenants, a tenant view. Be aware that the invitation will be valid for 30 days before expiring. The initial admin account will be created in each organization that represents your company. You will find more information about the organization and how they are utilized in Enterprise Dashboard in the next chapter.

10
The following user groups are available in an organization: Usergroup name Usergroup permissions
Admin
Can do everything scoped to the organization. For example:
▪ Add & Edit data sources. ▪ Add & Edit organization users & teams. ▪ Create API Keys
Editor
▪ Can create and modify dashboards & alert rules. This can be disabled on specific folders and dashboards.
▪ Cannot create or edit data sources nor invite new users.
Viewer
▪ View any dashboard. This can be disabled on specific folders and dashboards.
▪ Cannot create or edit dashboards nor data sources.
You can check your permissions within your user preferences. Click on your user icon, select “Preferences” and you will find a list of all organizations you are part of and which permissions you have.
2.4 Organization
Enterprise Dashboard is utilizing Grafana’s built in organization feature, to separate your individual tenants (or in financial terms your contracts) from each other. Open Telekom Cloud will give you depending on your Enterprise Dashboard version access to either a single or multiple/all tenants. Your organization is split into several Grafana organizations, depending on the number of tenants you are currently using. In the following there are some examples:
▪ If you have one tenant, you should use the medium version and will have one Grafana organization, representing the billing data of your contract
▪ If you have at least two contracts, you should use the large version and will have three Grafana organizations. A global organization, including the global dashboard, and one organization for each individual contract
▪ If you have at least three contracts and want to group them individually on not per default all in one global dashboard, you should use the extra-large version of the dashboard. You will receive some global dashboards, depending on your preferences.
This allows you to set up either dedicated user accounts within Enterprise Dashboard to view just one tenant, or an overall view if you grant them access to your global dashboard.
2.5 Current Limitations
In the following you will see a list of current limitations:
▪ Billing data is updated once per day around 8 am (GMT +2) ▪ Billing Data is available up to the day before the current date. On Tuesday you can see data up until
Monday ▪ Alerting for queries using Grafana variables (for example $tenant from Tenant Switcher, used in Payer
based Dashboard) is not supported in Grafana ▪ VAT or other taxes are not included in Enterprise Dashboard

11
▪ Enterprise Dashboard cannot be ordered in T-Systems eShop
12
3 HOW TO
3.1 Switch Organizations
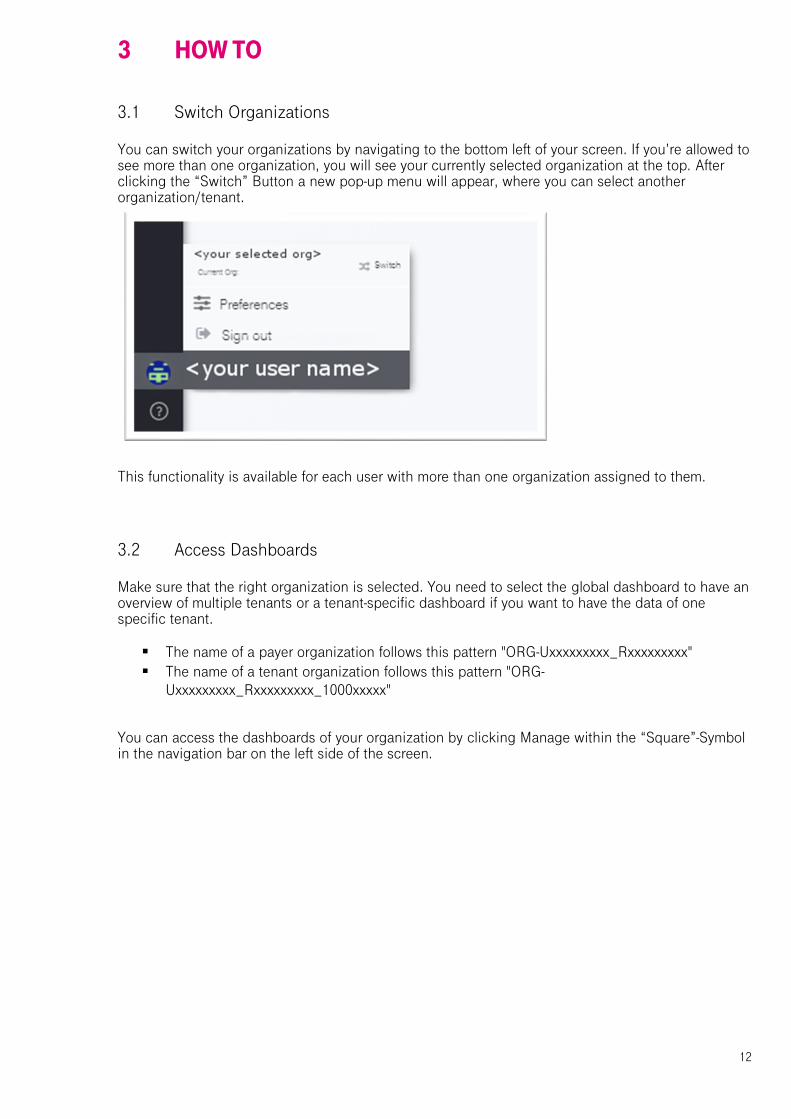
You can switch your organizations by navigating to the bottom left of your screen. If you’re allowed to see more than one organization, you will see your currently selected organization at the top. After clicking the “Switch” Button a new pop-up menu will appear, where you can select another organization/tenant.
This functionality is available for each user with more than one organization assigned to them.
3.2 Access Dashboards
Make sure that the right organization is selected. You need to select the global dashboard to have an overview of multiple tenants or a tenant-specific dashboard if you want to have the data of one specific tenant.
▪ The name of a payer organization follows this pattern "ORG-Uxxxxxxxxx_Rxxxxxxxxx" ▪ The name of a tenant organization follows this pattern "ORG-
Uxxxxxxxxx_Rxxxxxxxxx_1000xxxxx"
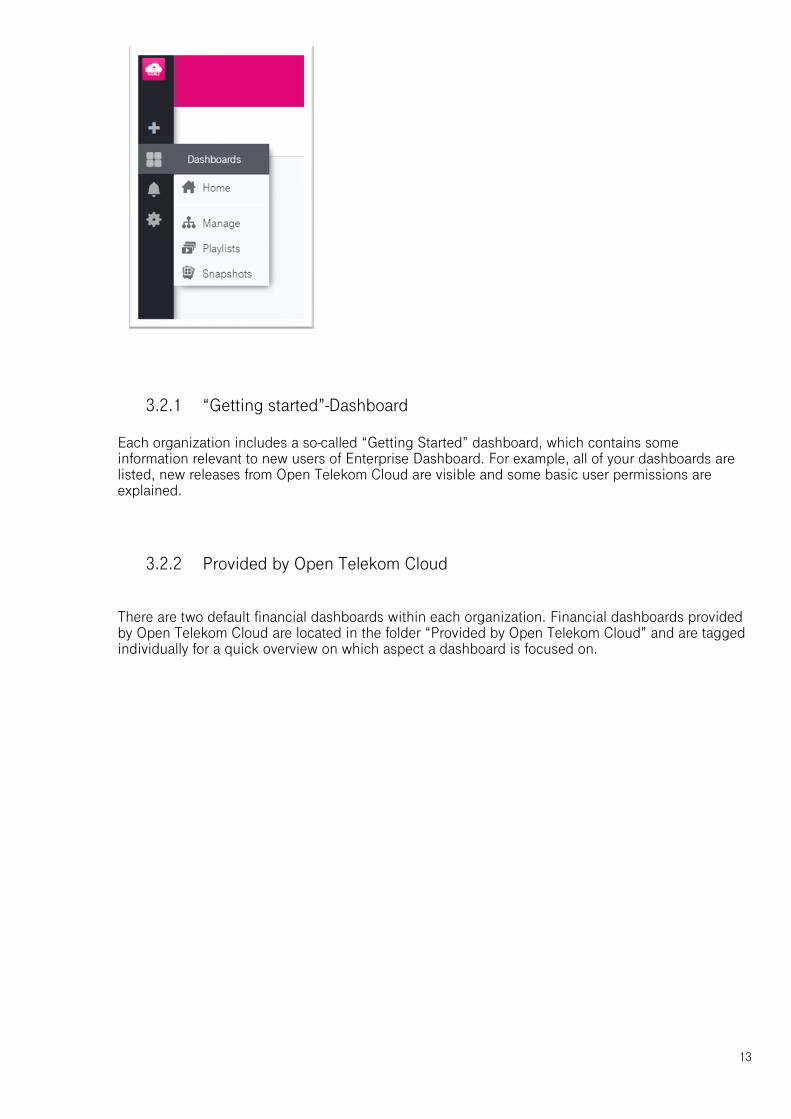
You can access the dashboards of your organization by clicking Manage within the “Square”-Symbol in the navigation bar on the left side of the screen.
13
3.2.1 “Getting started”-Dashboard
Each organization includes a so-called “Getting Started” dashboard, which contains some information relevant to new users of Enterprise Dashboard. For example, all of your dashboards are listed, new releases from Open Telekom Cloud are visible and some basic user permissions are explained.
3.2.2 Provided by Open Telekom Cloud
There are two default financial dashboards within each organization. Financial dashboards provided by Open Telekom Cloud are located in the folder “Provided by Open Telekom Cloud” and are tagged individually for a quick overview on which aspect a dashboard is focused on.
14
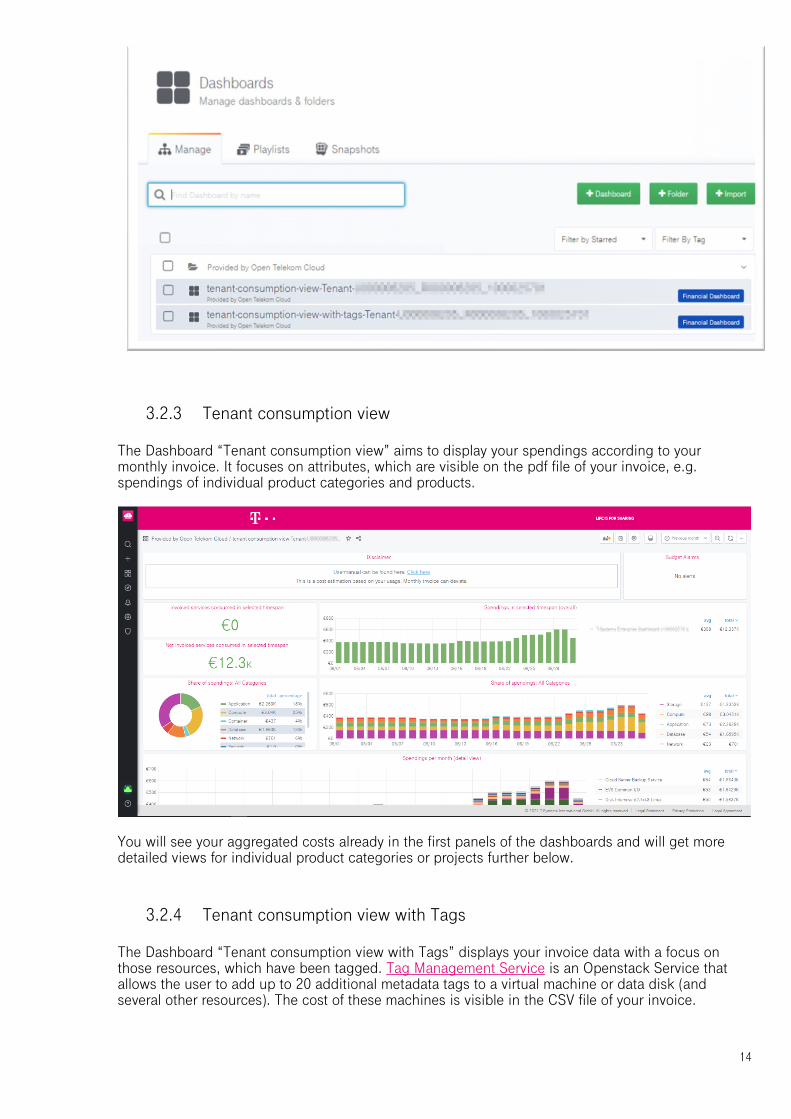
3.2.3 Tenant consumption view
The Dashboard “Tenant consumption view” aims to display your spendings according to your monthly invoice. It focuses on attributes, which are visible on the pdf file of your invoice, e.g. spendings of individual product categories and products.
You will see your aggregated costs already in the first panels of the dashboards and will get more detailed views for individual product categories or projects further below.
3.2.4 Tenant consumption view with Tags
The Dashboard “Tenant consumption view with Tags” displays your invoice data with a focus on those resources, which have been tagged. Tag Management Service is an Openstack Service that allows the user to add up to 20 additional metadata tags to a virtual machine or data disk (and several other resources). The cost of these machines is visible in the CSV file of your invoice.
15
You can select either specific Tag Key and Value combinations or display all of them. For example, you can select the Tag Key “CCE-Dynamic-Provisioning-Node” to see your Container Costs within Open Telekom Cloud. Elastic Cloud Servers spawned within a Cloud Container Engine Node have this Key-Value Pair attached to it.
According to your selection, the dashboard panels will display the costs accordingly.
More detailed views for each selected Tag Key-Value combinations can be found further below in the dashboard.
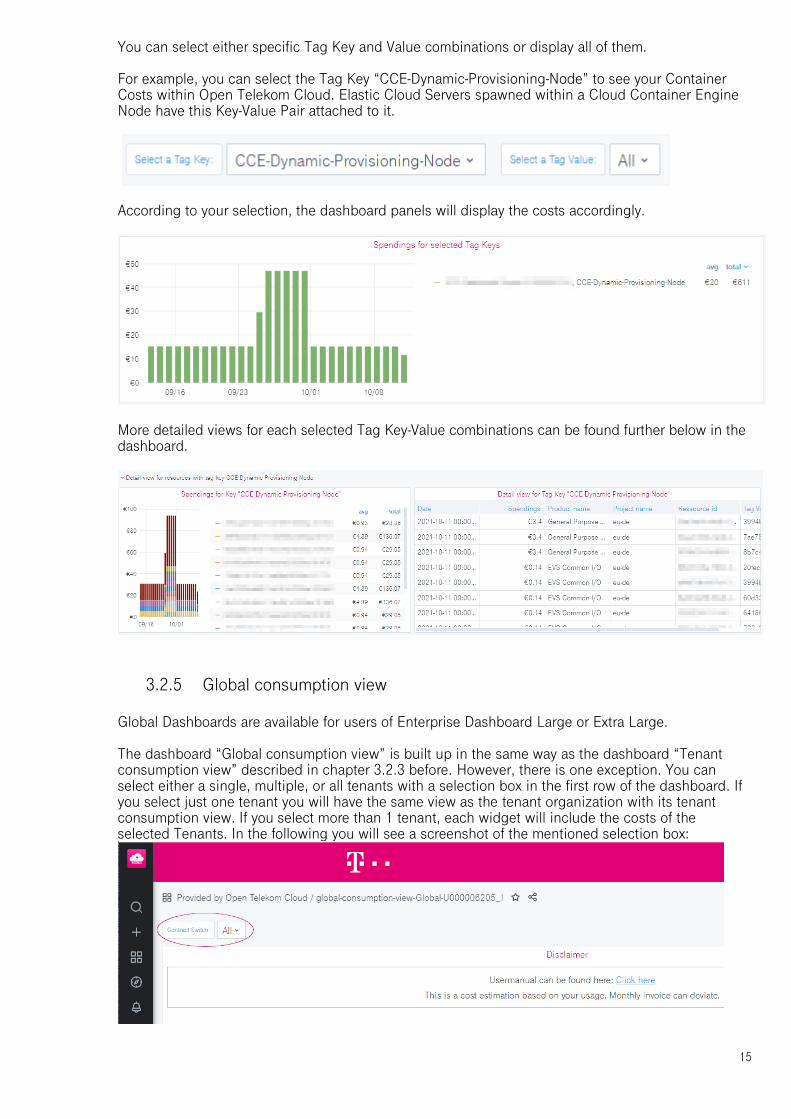
3.2.5 Global consumption view
Global Dashboards are available for users of Enterprise Dashboard Large or Extra Large. The dashboard “Global consumption view” is built up in the same way as the dashboard “Tenant consumption view” described in chapter 3.2.3 before. However, there is one exception. You can select either a single, multiple, or all tenants with a selection box in the first row of the dashboard. If you select just one tenant you will have the same view as the tenant organization with its tenant consumption view. If you select more than 1 tenant, each widget will include the costs of the selected Tenants. In the following you will see a screenshot of the mentioned selection box:

16
17
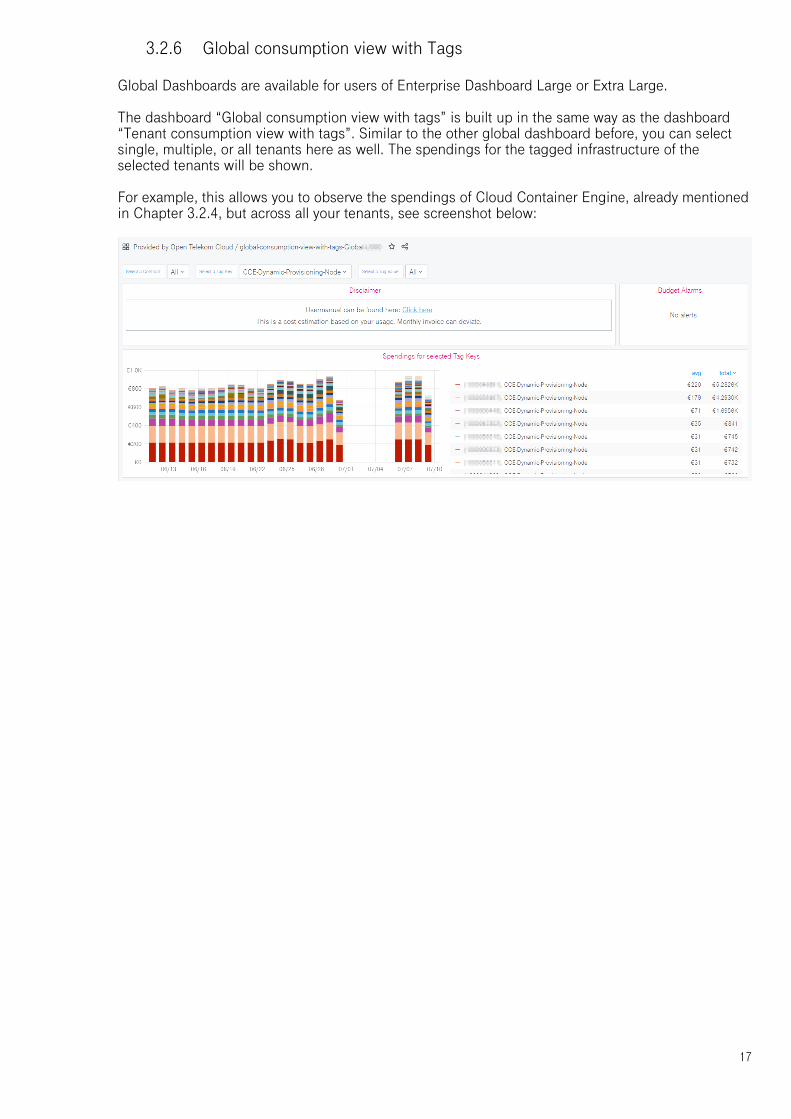
3.2.6 Global consumption view with Tags
Global Dashboards are available for users of Enterprise Dashboard Large or Extra Large. The dashboard “Global consumption view with tags” is built up in the same way as the dashboard “Tenant consumption view with tags”. Similar to the other global dashboard before, you can select single, multiple, or all tenants here as well. The spendings for the tagged infrastructure of the selected tenants will be shown. For example, this allows you to observe the spendings of Cloud Container Engine, already mentioned in Chapter 3.2.4, but across all your tenants, see screenshot below:
18
3.3 Set up Alerts
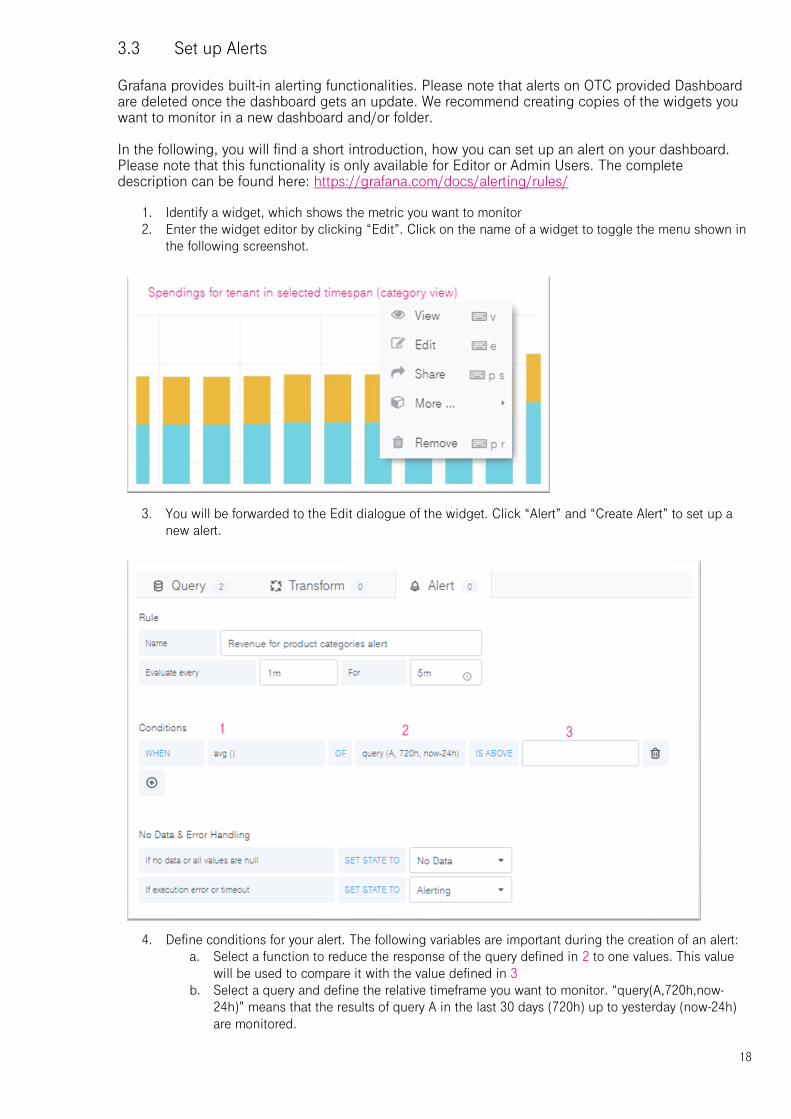
Grafana provides built-in alerting functionalities. Please note that alerts on OTC provided Dashboard are deleted once the dashboard gets an update. We recommend creating copies of the widgets you want to monitor in a new dashboard and/or folder. In the following, you will find a short introduction, how you can set up an alert on your dashboard. Please note that this functionality is only available for Editor or Admin Users. The complete description can be found here: https://grafana.com/docs/alerting/rules/
1. Identify a widget, which shows the metric you want to monitor 2. Enter the widget editor by clicking “Edit”. Click on the name of a widget to toggle the menu shown in
the following screenshot.
3. You will be forwarded to the Edit dialogue of the widget. Click “Alert” and “Create Alert” to set up a
new alert.
4. Define conditions for your alert. The following variables are important during the creation of an alert:
a. Select a function to reduce the response of the query defined in 2 to one values. This value will be used to compare it with the value defined in 3
b. Select a query and define the relative timeframe you want to monitor. “query(A,720h,now-24h)” means that the results of query A in the last 30 days (720h) up to yesterday (now-24h) are monitored.
19
c. Define a statement to compare with. The alarm gets fired if the average (see a) of the defined query (see b) is above 350
5. Select a notification channel that will be used to get notified if the alarm is fired.
You can create alarms and notification channels as Editor or Admin of an organization. Ask your organization administrator for permission if you want to use this.
3.4 Database table structure
Enterprise Dashboard uses a PostgreSQL 10 Database which has certain tables to use. The tables are described in the following. Based on those tables you can create your own widgets and queries. The creation of new widgets and dashboards is available for Editor or Admin Users of an organization.
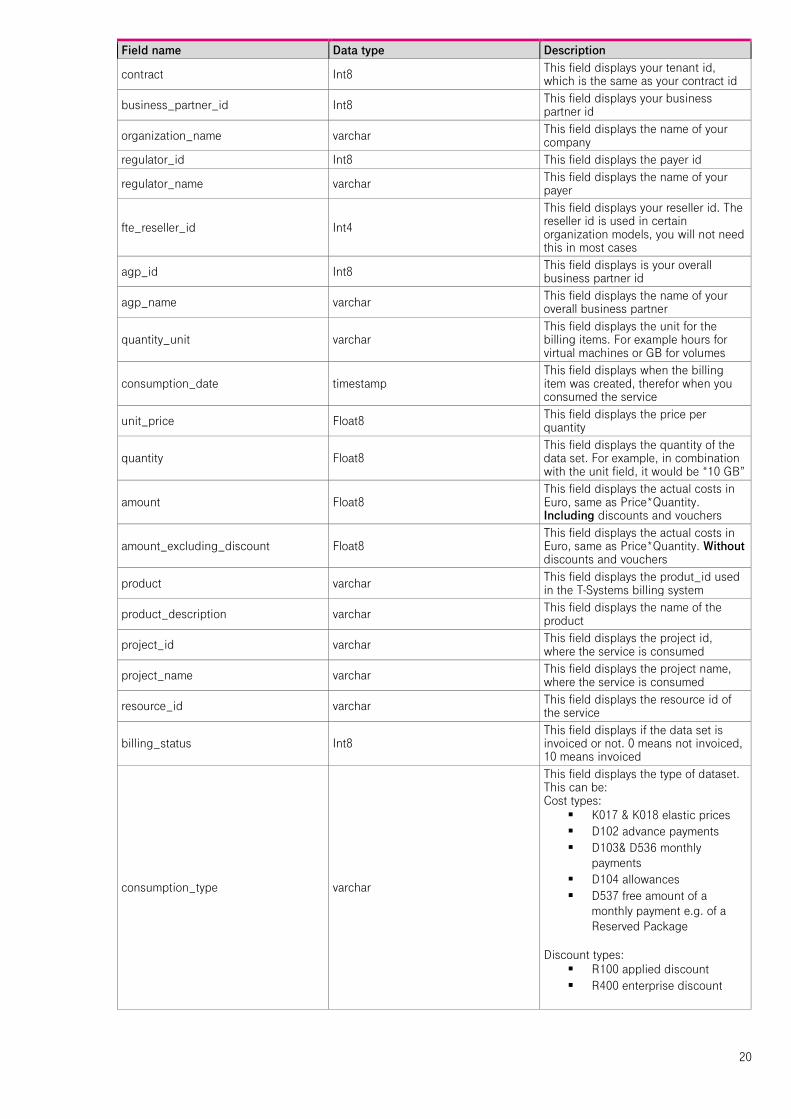
3.4.1 Business.consumption
This table represents your billing data according to your Open Telekom Cloud invoice (except limitations listed in chapter Current Limitations)
20
Field name Data type Description
contract Int8 This field displays your tenant id, which is the same as your contract id
business_partner_id Int8 This field displays your business partner id
organization_name varchar This field displays the name of your company
regulator_id Int8 This field displays the payer id
regulator_name varchar This field displays the name of your payer
fte_reseller_id Int4
This field displays your reseller id. The reseller id is used in certain organization models, you will not need this in most cases
agp_id Int8 This field displays is your overall business partner id
agp_name varchar This field displays the name of your overall business partner
quantity_unit varchar This field displays the unit for the billing items. For example hours for virtual machines or GB for volumes
consumption_date timestamp This field displays when the billing item was created, therefor when you consumed the service
unit_price Float8 This field displays the price per quantity
quantity Float8 This field displays the quantity of the data set. For example, in combination with the unit field, it would be “10 GB”
amount Float8 This field displays the actual costs in Euro, same as Price*Quantity. Including discounts and vouchers
amount_excluding_discount Float8 This field displays the actual costs in Euro, same as Price*Quantity. Without discounts and vouchers
product varchar This field displays the produt_id used in the T-Systems billing system
product_description varchar This field displays the name of the product
project_id varchar This field displays the project id, where the service is consumed
project_name varchar This field displays the project name, where the service is consumed
resource_id varchar This field displays the resource id of the service
billing_status Int8 This field displays if the data set is invoiced or not. 0 means not invoiced, 10 means invoiced
consumption_type varchar
This field displays the type of dataset. This can be: Cost types:
▪ K017 & K018 elastic prices ▪ D102 advance payments ▪ D103& D536 monthly
payments ▪ D104 allowances ▪ D537 free amount of a
monthly payment e.g. of a Reserved Package
Discount types: ▪ R100 applied discount ▪ R400 enterprise discount
21
Field name Data type Description
contract_name varchar
This field displays the name of your tenant/company. This name can be additionally configured within FTE. Please get in contact with the dashboard squad for this.
hash32 varchar Unique identifier for a row
region varchar Indicates the name of the region to which a resource belongs, e.g. eu-de
hash_key varchar Key for internal purposes
sales_chanel varchar original column not existing, we calculate it with FTE data
fte_ea_name varchar original column not existing, we calculate it with FTE data
fte_tenant_contract varchar original column not existing, we calculate it with FTE data
3.4.2 Business.business_partner
Field name Data type Description
business_partner_id numeric This field displays your business partner id
business_partner_name varchar This field displays your business partner name
valid_from timestamp This field displays the date from which the data set is valid
valid_to timestamp This field displays the date to which the data set is valid
3.4.3 Business.agp
Field name Data type Description
contract numeric This field displays your tenant id, which is the same as your contract id
agp_id varchar This field displays is your overall business partner id
agp_name varchar This field displays the name of your overall business partner
valid_from timestamp This field displays the date from which the data set is valid
valid_to timestamp This field displays the date to which the data set is valid
3.4.4 Business.product
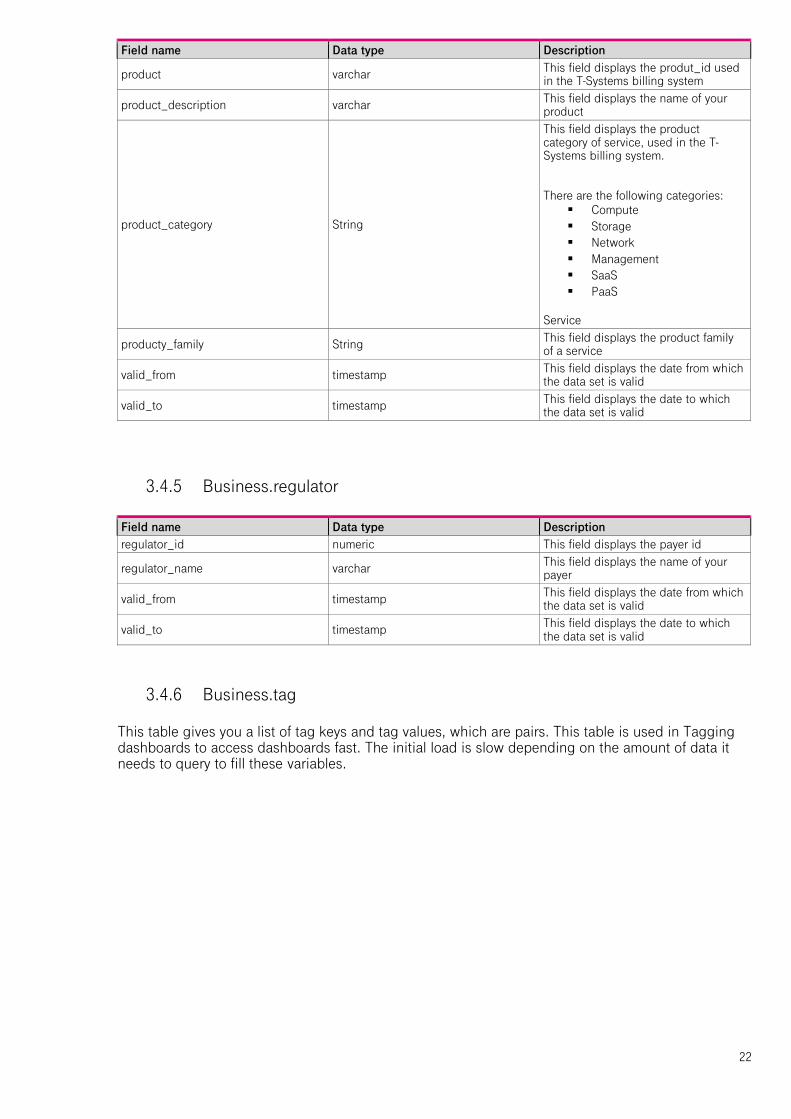
22
Field name Data type Description
product varchar This field displays the produt_id used in the T-Systems billing system
product_description varchar This field displays the name of your product
product_category String
This field displays the product category of service, used in the T-Systems billing system. There are the following categories:
▪ Compute ▪ Storage ▪ Network ▪ Management ▪ SaaS ▪ PaaS
Service
producty_family String This field displays the product family of a service
valid_from timestamp This field displays the date from which the data set is valid
valid_to timestamp This field displays the date to which the data set is valid
3.4.5 Business.regulator
Field name Data type Description
regulator_id numeric This field displays the payer id
regulator_name varchar This field displays the name of your payer
valid_from timestamp This field displays the date from which the data set is valid
valid_to timestamp This field displays the date to which the data set is valid
3.4.6 Business.tag
This table gives you a list of tag keys and tag values, which are pairs. This table is used in Tagging dashboards to access dashboards fast. The initial load is slow depending on the amount of data it needs to query to fill these variables.
23
Field name Data type Description
contract numeric This field displays your tenant id, which is the same as your contract id
reseller_id numeric
This field displays your reseller id. The reseller id is used in certain organization models, you will not need this in most cases
hash32 varchar Key for internal purposes
tag_key varchar This field displays the tag keys which are used in your infrastructure
tag_value varchar This field displays the tag values which are used in your infrastructure
valid_from timestamp This field displays the date from which the data set is valid
valid_to timestamp This field displays the date to which the data set is valid
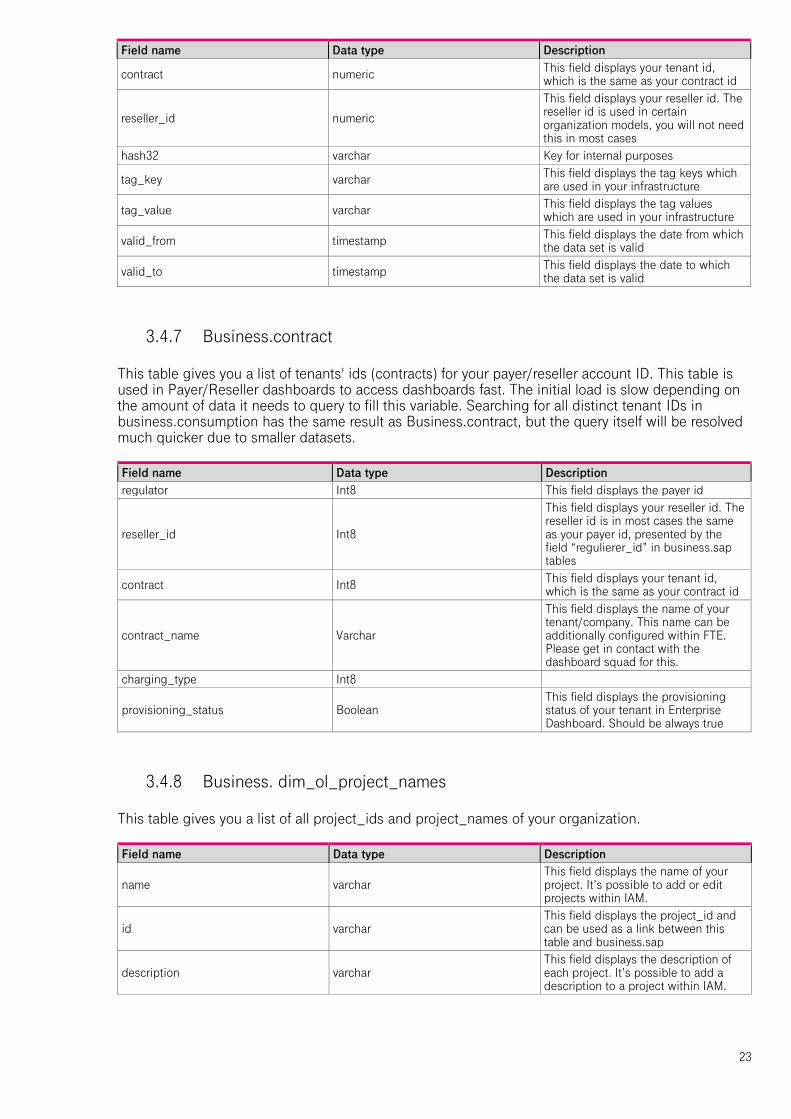
3.4.7 Business.contract
This table gives you a list of tenants' ids (contracts) for your payer/reseller account ID. This table is used in Payer/Reseller dashboards to access dashboards fast. The initial load is slow depending on the amount of data it needs to query to fill this variable. Searching for all distinct tenant IDs in business.consumption has the same result as Business.contract, but the query itself will be resolved much quicker due to smaller datasets. Field name Data type Description
regulator Int8 This field displays the payer id
reseller_id Int8
This field displays your reseller id. The reseller id is in most cases the same as your payer id, presented by the field “regulierer_id” in business.sap tables
contract Int8 This field displays your tenant id, which is the same as your contract id
contract_name Varchar
This field displays the name of your tenant/company. This name can be additionally configured within FTE. Please get in contact with the dashboard squad for this.
charging_type Int8
provisioning_status Boolean This field displays the provisioning status of your tenant in Enterprise Dashboard. Should be always true
3.4.8 Business. dim_ol_project_names
This table gives you a list of all project_ids and project_names of your organization. Field name Data type Description
name varchar This field displays the name of your project. It’s possible to add or edit projects within IAM.
id varchar This field displays the project_id and can be used as a link between this table and business.sap
description varchar This field displays the description of each project. It’s possible to add a description to a project within IAM.
24
Object Storage is displayed as “MOS”. Object Storage is a global service and has a unique ID, which can not be found within IAM. This project_id has the project_name “MOS”.
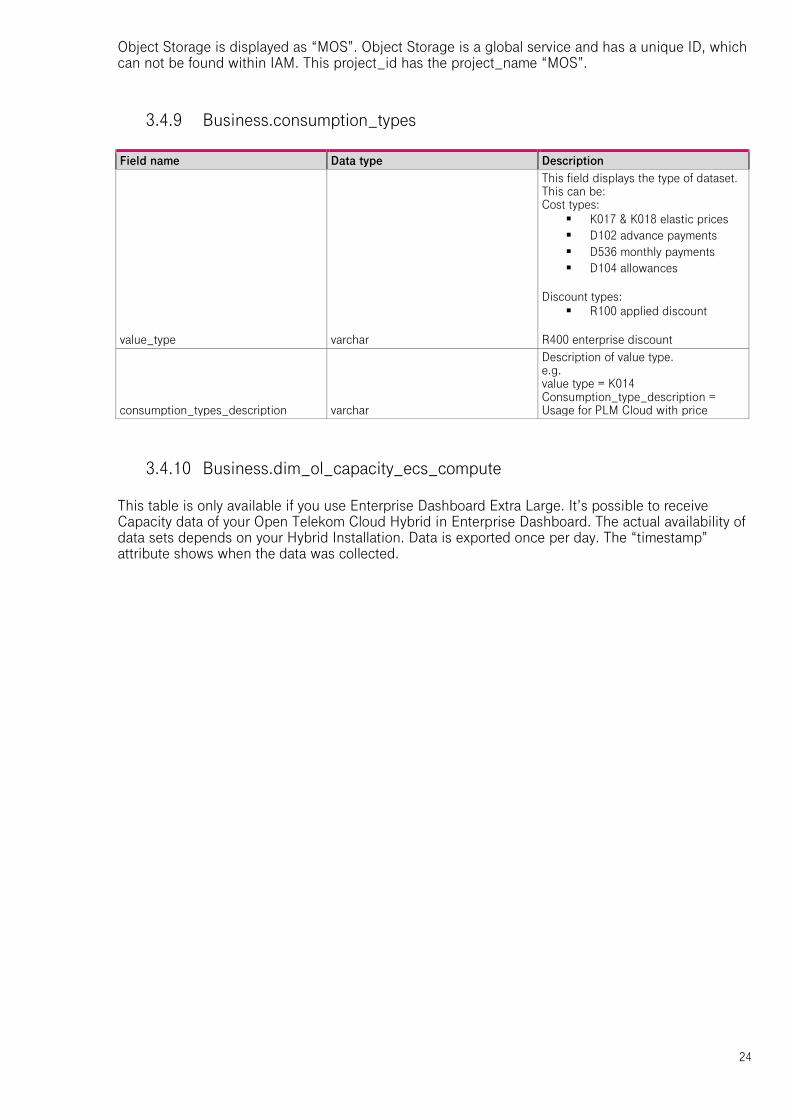
3.4.9 Business.consumption_types
Field name Data type Description
value_type varchar
This field displays the type of dataset. This can be: Cost types:
▪ K017 & K018 elastic prices ▪ D102 advance payments ▪ D536 monthly payments ▪ D104 allowances
Discount types: ▪ R100 applied discount
R400 enterprise discount
consumption_types_description varchar
Description of value type. e.g. value type = K014 Consumption_type_description = Usage for PLM Cloud with price
3.4.10 Business.dim_ol_capacity_ecs_compute
This table is only available if you use Enterprise Dashboard Extra Large. It’s possible to receive Capacity data of your Open Telekom Cloud Hybrid in Enterprise Dashboard. The actual availability of data sets depends on your Hybrid Installation. Data is exported once per day. The “timestamp” attribute shows when the data was collected.
25
Field name Data type Description
service varchar
Indicates the service name, which identifies the service to which a resource belongs
timestamp timestamp Indicates the time stamp in Unix format, e.g. 1598306400000
region varchar Indicates the name of the region to which a resource belongs, e.g. eu-de
az varchar Indicates the name of the AZ to which a resource belongs, e.g. eu-de-01
zone varchar Indicates the POD to which a resource belongs
cluster varchar Indicates the cluster to which a resource belongs.
host varchar None
resource_type varchar Indicates the resource type, e.g. s2
type varchar
Indicates the data type. ECS resource data types are as follows:
vCpu, memory, vGpu, and vmTotal
total float8
Indicates the total number of resources (vCPU: number; Memory: TB; vGPU: number).
used float8
Indicates the number of the used resources (vCPU: number; Memory: TB; vGPU: number).
free float8
Indicates the number of the remaining resources (vCPU: number; Memory: TB; vGPU: number).
allocated float8
Indicates the number of the allocated resources (vCPU: number; Memory: TB; vGPU: number).
spot_allocated float8 None
containerAllocated float8 None
available float8
Indicates the number of the available resources (vCPU: number; Memory: TB; vGPU: number).
used_ratio float8 Indicates the resource usage.
allocated_ratio float8 Indicates the resource allocation rate.
over_subscription_ratio float8 None
additional_info varchar None
region_id varchar Indicates the region ID to which a resource belongs.
az_id varchar Indicates the ID of the AZ to which a resource belongs
zone_type varchar Indicates the resource type to which a resource belongs
Host_group varchar None
host_total int4 Number of resources in total
etl_created timestamp Displays when this data set was created
3.4.11 Business.dim_ol_capacity_ecs_vm
This table is only available if you use Enterprise Dashboard Extra Large. It’s possible to receive Capacity data of your Open Telekom Cloud Hybrid in Enterprise Dashboard. The actual availability of data sets depends on your Hybrid Installation. Data is exported once per day. The “timestamp” attribute shows when the data was collected.
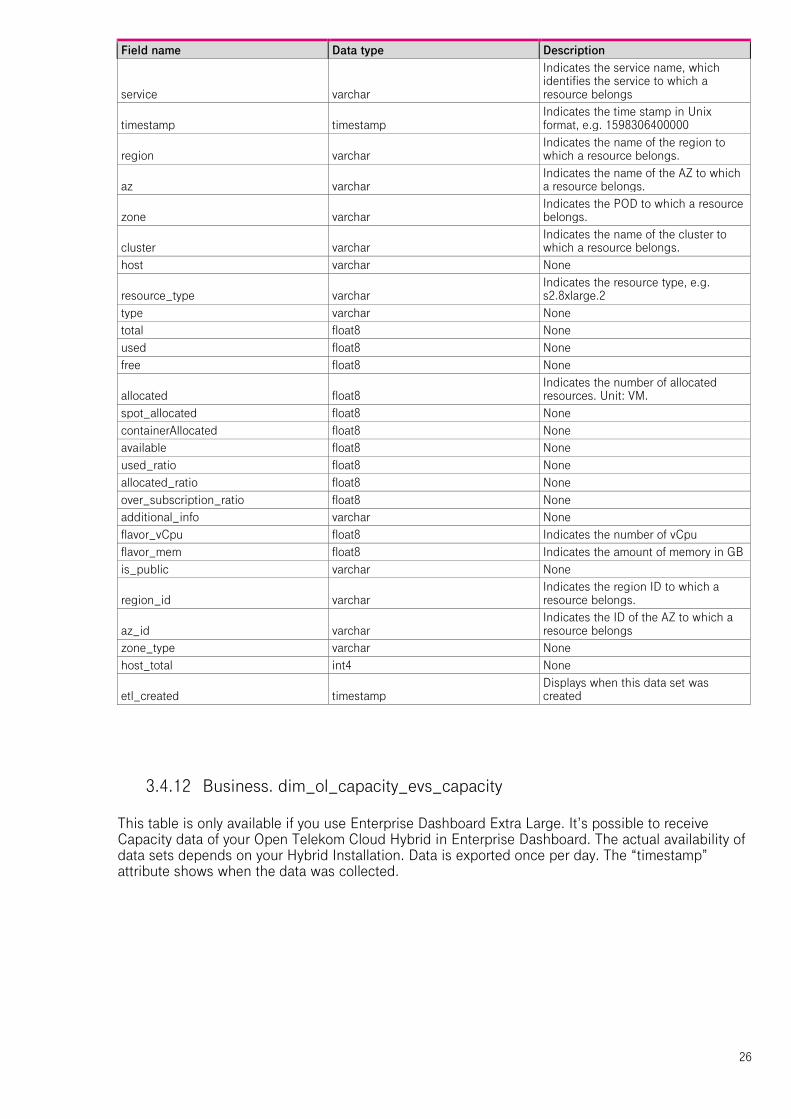
26
Field name Data type Description
service varchar
Indicates the service name, which identifies the service to which a resource belongs
timestamp timestamp Indicates the time stamp in Unix format, e.g. 1598306400000
region varchar Indicates the name of the region to which a resource belongs.
az varchar Indicates the name of the AZ to which a resource belongs.
zone varchar Indicates the POD to which a resource belongs.
cluster varchar Indicates the name of the cluster to which a resource belongs.
host varchar None
resource_type varchar Indicates the resource type, e.g. s2.8xlarge.2
type varchar None
total float8 None
used float8 None
free float8 None
allocated float8 Indicates the number of allocated resources. Unit: VM.
spot_allocated float8 None
containerAllocated float8 None
available float8 None
used_ratio float8 None
allocated_ratio float8 None
over_subscription_ratio float8 None
additional_info varchar None
flavor_vCpu float8 Indicates the number of vCpu
flavor_mem float8 Indicates the amount of memory in GB
is_public varchar None
region_id varchar Indicates the region ID to which a resource belongs.
az_id varchar Indicates the ID of the AZ to which a resource belongs
zone_type varchar None
host_total int4 None
etl_created timestamp Displays when this data set was created
3.4.12 Business. dim_ol_capacity_evs_capacity
This table is only available if you use Enterprise Dashboard Extra Large. It’s possible to receive Capacity data of your Open Telekom Cloud Hybrid in Enterprise Dashboard. The actual availability of data sets depends on your Hybrid Installation. Data is exported once per day. The “timestamp” attribute shows when the data was collected.
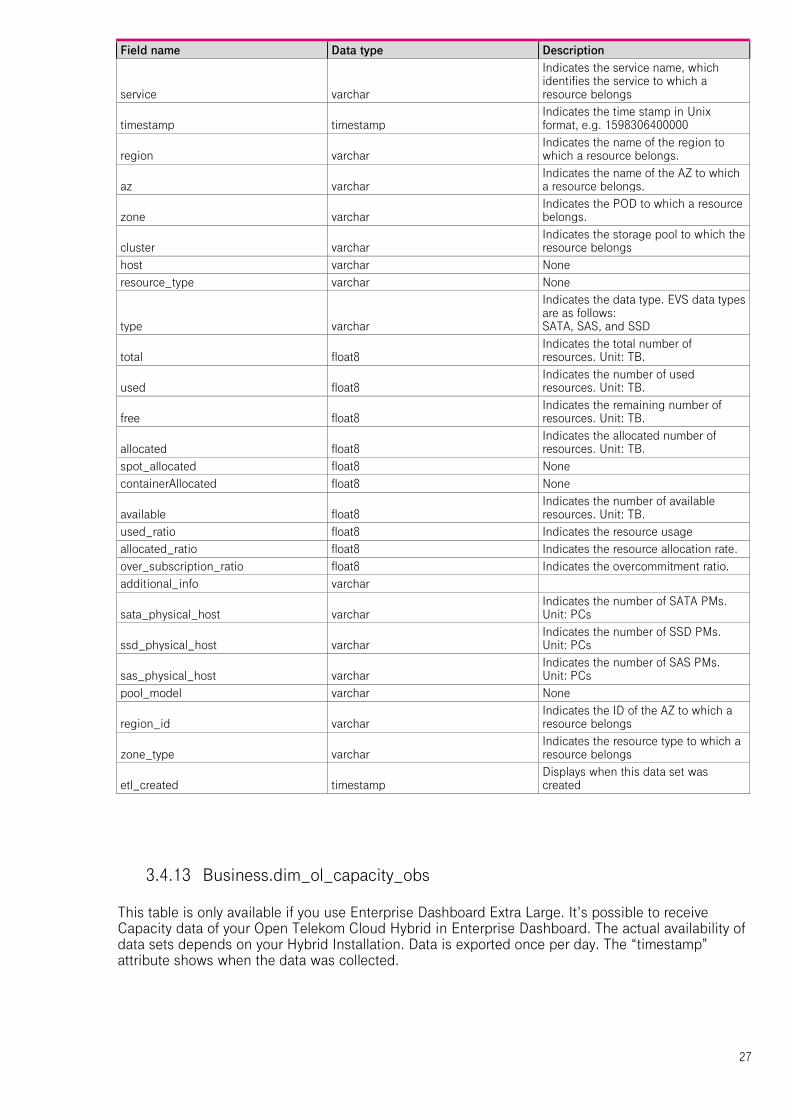
27
Field name Data type Description
service varchar
Indicates the service name, which identifies the service to which a resource belongs
timestamp timestamp Indicates the time stamp in Unix format, e.g. 1598306400000
region varchar Indicates the name of the region to which a resource belongs.
az varchar Indicates the name of the AZ to which a resource belongs.
zone varchar Indicates the POD to which a resource belongs.
cluster varchar Indicates the storage pool to which the resource belongs
host varchar None
resource_type varchar None
type varchar
Indicates the data type. EVS data types are as follows: SATA, SAS, and SSD
total float8 Indicates the total number of resources. Unit: TB.
used float8 Indicates the number of used resources. Unit: TB.
free float8 Indicates the remaining number of resources. Unit: TB.
allocated float8 Indicates the allocated number of resources. Unit: TB.
spot_allocated float8 None
containerAllocated float8 None
available float8 Indicates the number of available resources. Unit: TB.
used_ratio float8 Indicates the resource usage
allocated_ratio float8 Indicates the resource allocation rate.
over_subscription_ratio float8 Indicates the overcommitment ratio.
additional_info varchar
sata_physical_host varchar Indicates the number of SATA PMs. Unit: PCs
ssd_physical_host varchar Indicates the number of SSD PMs. Unit: PCs
sas_physical_host varchar Indicates the number of SAS PMs. Unit: PCs
pool_model varchar None
region_id varchar Indicates the ID of the AZ to which a resource belongs
zone_type varchar Indicates the resource type to which a resource belongs
etl_created timestamp Displays when this data set was created
3.4.13 Business.dim_ol_capacity_obs
This table is only available if you use Enterprise Dashboard Extra Large. It’s possible to receive Capacity data of your Open Telekom Cloud Hybrid in Enterprise Dashboard. The actual availability of data sets depends on your Hybrid Installation. Data is exported once per day. The “timestamp” attribute shows when the data was collected.

28
Field name Data type Description
service varchar
Indicates the service name, which identifies the service to which a resource belongs
timestamp timestamp Indicates the time stamp in Unix format, e.g. 1598306400000
region varchar Indicates the name of the region to which a resource belongs.
az varchar None
zone varchar None
cluster varchar Indicates the cluster to which a resource belongs.
host varchar None
resource_type varchar None
type varchar None
total float8 Indicates the total number of resources. Unit: TB.
used float8 Indicates the remaining number of resources. Unit: TB.
free float8 Indicates the remaining number of resources. Unit: TB.
allocated float8 None
spot_allocated float8 None
containerAllocated float8 None
available float8 None
used_ratio float8 Indicates the resource usage.
allocated_ratio float8 None
over_subscription_ratio float8 None
additional_info varchar None
logic_total varchar Indicates the total logic capacity. Unit: TB.
logic_used varchar
Indicates the number of used logic. Unit: TB.
zone_type varchar
host_total int4
etl_created timestamp Displays when this data set was created

29
4 API
Please refer to the Enterprise Dashboard API Reference
30
5 FAQ
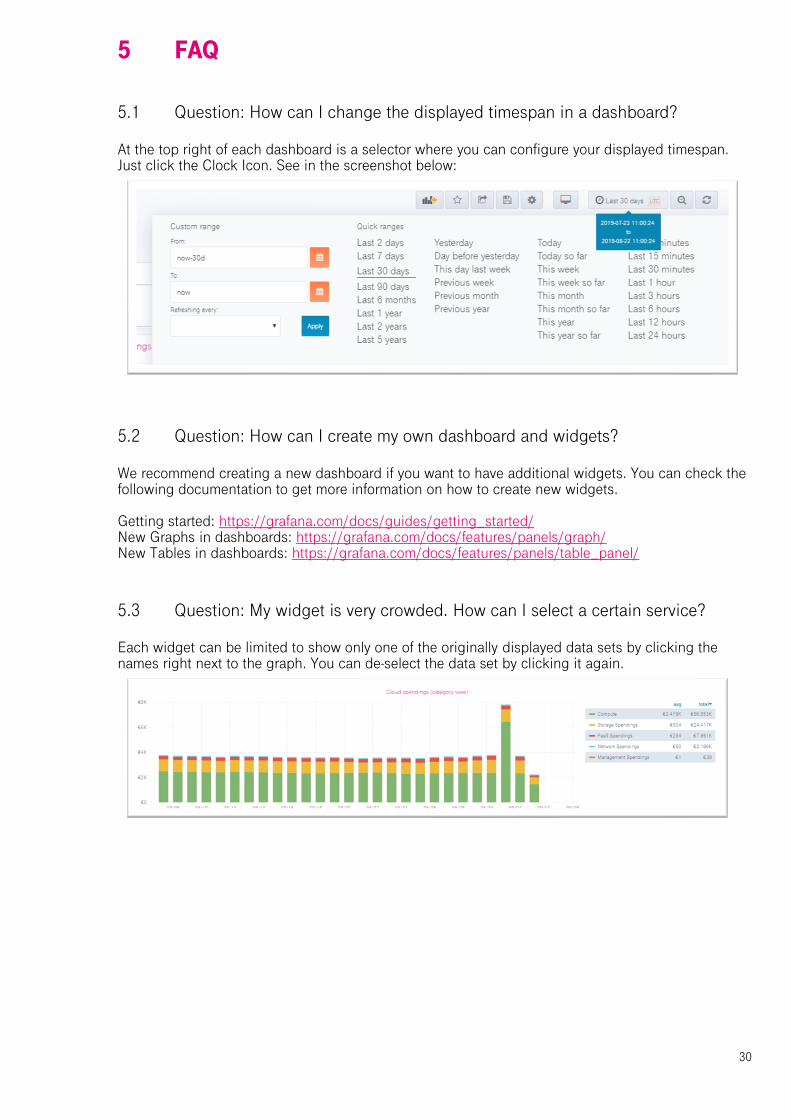
5.1 Question: How can I change the displayed timespan in a dashboard?
At the top right of each dashboard is a selector where you can configure your displayed timespan. Just click the Clock Icon. See in the screenshot below:
5.2 Question: How can I create my own dashboard and widgets?
We recommend creating a new dashboard if you want to have additional widgets. You can check the following documentation to get more information on how to create new widgets. Getting started: https://grafana.com/docs/guides/getting_started/ New Graphs in dashboards: https://grafana.com/docs/features/panels/graph/ New Tables in dashboards: https://grafana.com/docs/features/panels/table_panel/
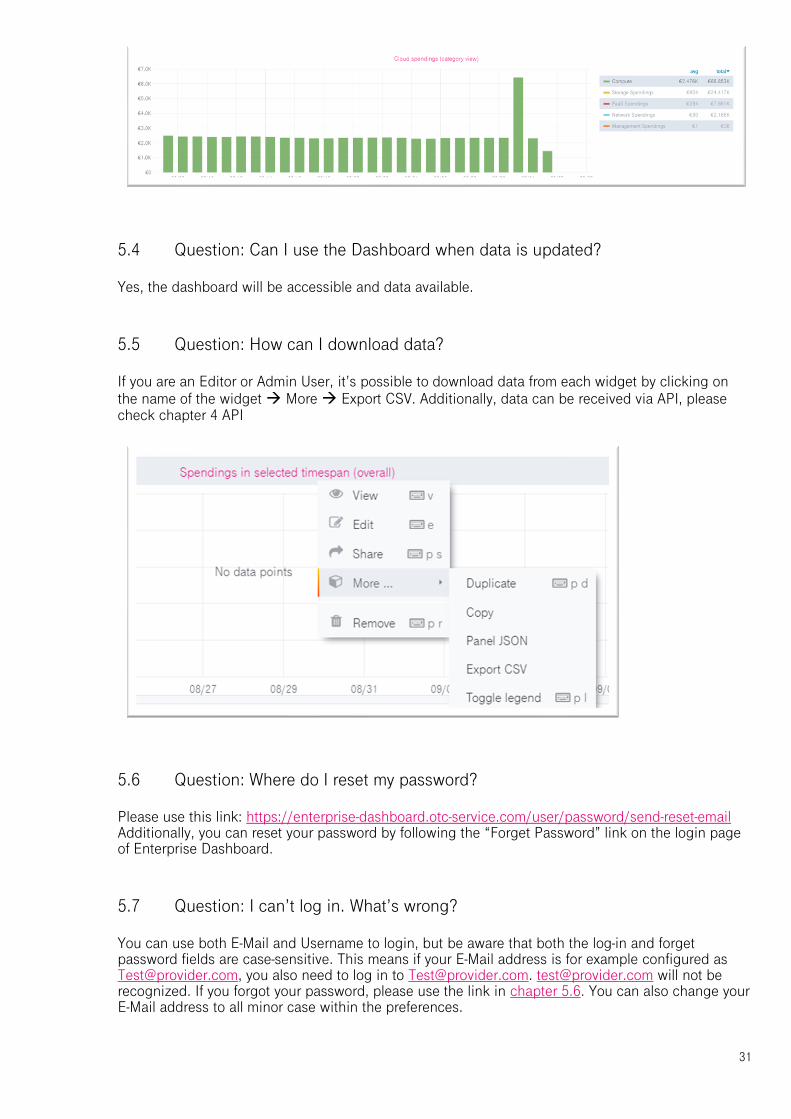
5.3 Question: My widget is very crowded. How can I select a certain service?
Each widget can be limited to show only one of the originally displayed data sets by clicking the names right next to the graph. You can de-select the data set by clicking it again.
31
5.4 Question: Can I use the Dashboard when data is updated?
Yes, the dashboard will be accessible and data available.
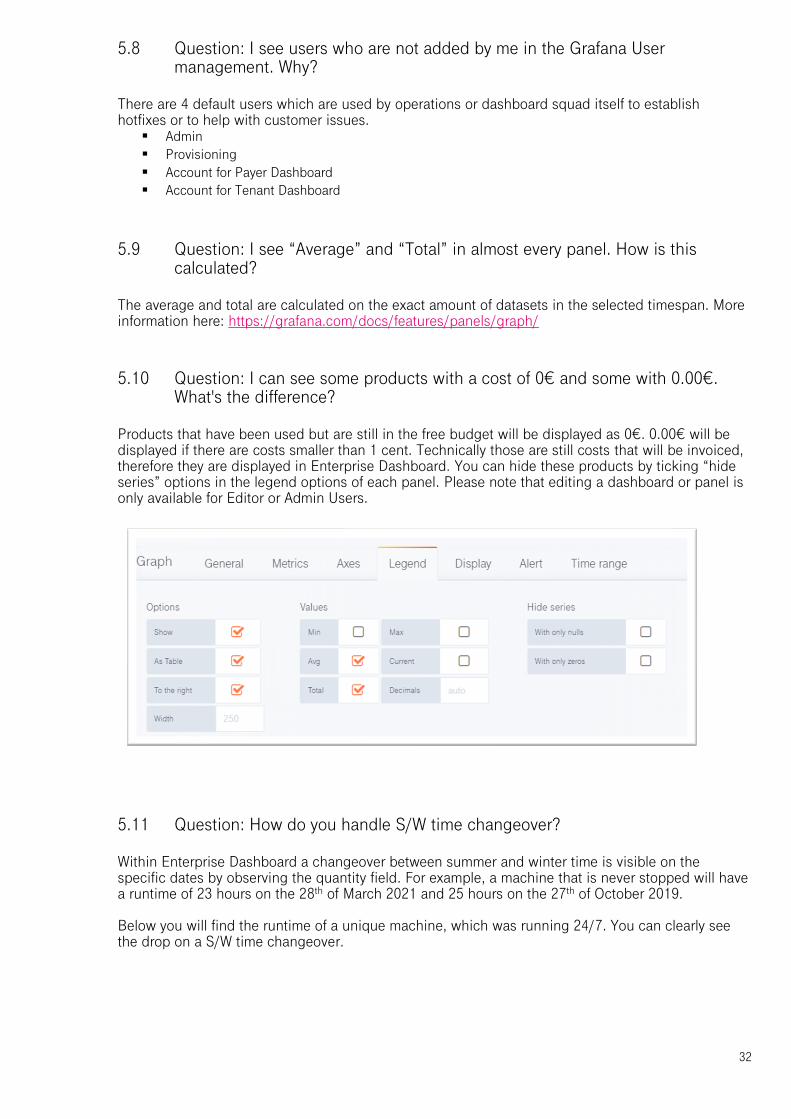
5.5 Question: How can I download data?
If you are an Editor or Admin User, it’s possible to download data from each widget by clicking on the name of the widget → More → Export CSV. Additionally, data can be received via API, please check chapter 4 API
5.6 Question: Where do I reset my password?
Please use this link: https://enterprise-dashboard.otc-service.com/user/password/send-reset-email Additionally, you can reset your password by following the “Forget Password” link on the login page of Enterprise Dashboard.
5.7 Question: I can’t log in. What’s wrong?
You can use both E-Mail and Username to login, but be aware that both the log-in and forget password fields are case-sensitive. This means if your E-Mail address is for example configured as [email protected], you also need to log in to [email protected]. [email protected] will not be recognized. If you forgot your password, please use the link in chapter 5.6. You can also change your E-Mail address to all minor case within the preferences.
32
5.8 Question: I see users who are not added by me in the Grafana User management. Why?
There are 4 default users which are used by operations or dashboard squad itself to establish hotfixes or to help with customer issues.
▪ Admin ▪ Provisioning ▪ Account for Payer Dashboard ▪ Account for Tenant Dashboard
5.9 Question: I see “Average” and “Total” in almost every panel. How is this calculated?
The average and total are calculated on the exact amount of datasets in the selected timespan. More information here: https://grafana.com/docs/features/panels/graph/
5.10 Question: I can see some products with a cost of 0€ and some with 0.00€. What's the difference?
Products that have been used but are still in the free budget will be displayed as 0€. 0.00€ will be displayed if there are costs smaller than 1 cent. Technically those are still costs that will be invoiced, therefore they are displayed in Enterprise Dashboard. You can hide these products by ticking “hide series” options in the legend options of each panel. Please note that editing a dashboard or panel is only available for Editor or Admin Users.
5.11 Question: How do you handle S/W time changeover?
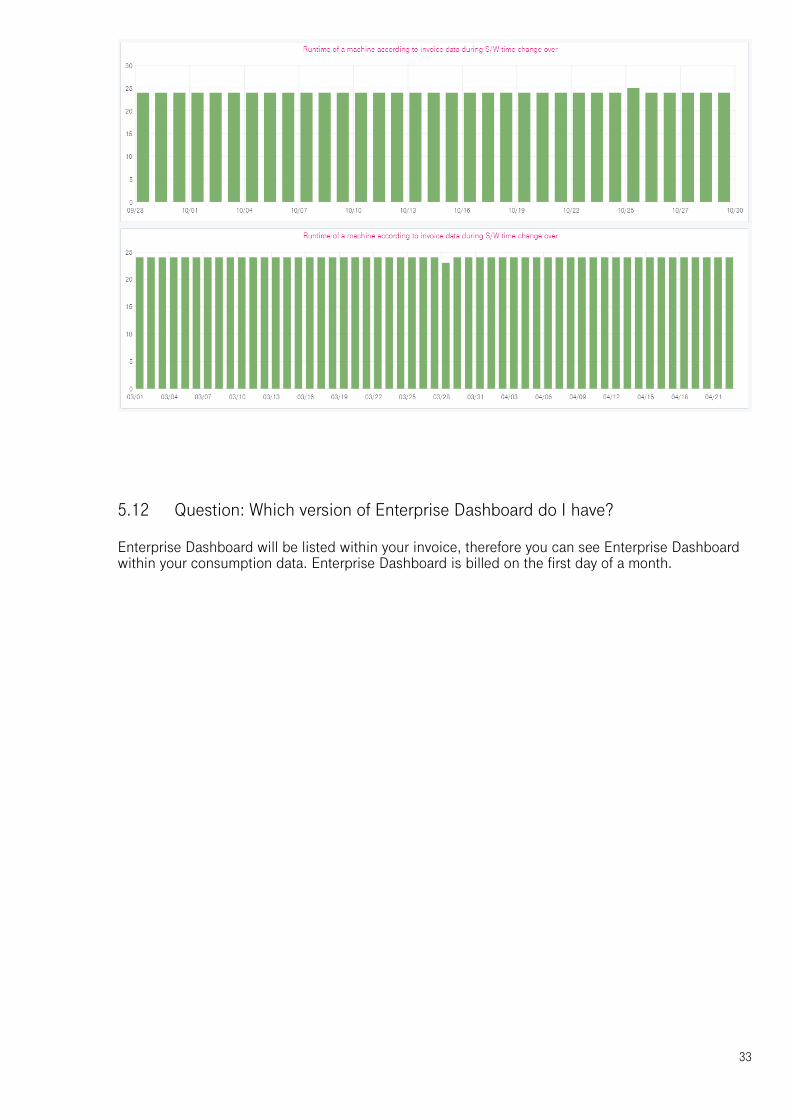
Within Enterprise Dashboard a changeover between summer and winter time is visible on the specific dates by observing the quantity field. For example, a machine that is never stopped will have a runtime of 23 hours on the 28th of March 2021 and 25 hours on the 27th of October 2019. Below you will find the runtime of a unique machine, which was running 24/7. You can clearly see the drop on a S/W time changeover.
33
5.12 Question: Which version of Enterprise Dashboard do I have?
Enterprise Dashboard will be listed within your invoice, therefore you can see Enterprise Dashboard within your consumption data. Enterprise Dashboard is billed on the first day of a month.
34
6 ABBREVIATIONS
No special abbreviations are used in this document. If you want to have a look at generally used abbreviations in Open Telekom Cloud, please check the Help Center: https://docs.otc.t-systems.com/en-us/glossary/index.html
Contact T-Systems International GmbH Hahnstraße 43d
60528 Frankfurt am Main
Email: [email protected]
Internet: www.open-telekom-cloud.com