Embed Size (px)
Citation preview
Standards in Genomic Sciences (2011) 5:69-85 DOI:10.4056/sigs.2104875
The Genomic Standards Consortium
Complete genome sequence of “Enterobacter lignolyticus” SCF1 Kristen M. DeAngelis1,2, Patrik D’Haeseleer1,3, Dylan Chivian4,5, Julian L. Fortney1, Jane Khudyakov2,3, Blake Simmons2,6, Hannah Woo1,2, Adam P. Arkin4,5, Karen Walston Davenport7, Lynne Goodwin7, Amy Chen8, Natalia Ivanova8, Nikos C. Kyrpides8, Konstantinos Mavromatis8, Tanja Woyke8, Terry C. Hazen1,2 1Ecology Department, Lawrence Berkeley National Laboratory, Berkeley CA USA 2Microbial Communities Group, Deconstruction Division, Joint BioEnergy Institute,
Emeryville CA USA 3Lawrence Livermore National Laboratory, Livermore CA USA 4Physical Biosciences Division, Lawrence Berkeley National Laboratory, Berkeley CA USA 5Technologies Division, Joint BioEnergy Institute, Emeryville CA USA 6Sandia National Lab, Livermore CA USA 7Los Alamos National Laboratory, Los Alamos NM USA 8Department of Energy Joint Genome Institute, Walnut Creek CA USA
Corresponding author: Kristen M. DeAngelis ([email protected])
Keywords: Anaerobic lignin degradation, tropical forest soil isolate, facultative anaerobe
In an effort to discover anaerobic bacteria capable of lignin degradation, we isolated “Ente-robacter lignolyticus” SCF1 on minimal media with alkali lignin as the sole source of carbon. This organism was isolated anaerobically from tropical forest soils collected from the Short Cloud Forest site in the El Yunque National Forest in Puerto Rico, USA, part of the Luquillo Long-Term Ecological Research Station. At this site, the soils experience strong fluctuations in redox potential and are net methane producers. Because of its ability to grow on lignin anae-robically, we sequenced the genome. The genome of “E. lignolyticus” SCF1 is 4.81 Mbp with no detected plasmids, and includes a relatively small arsenal of lignocellulolytic carbohy-drate active enzymes. Lignin degradation was observed in culture, and the genome revealed two putative laccases, a putative peroxidase, and a complete 4-hydroxyphenylacetate degra-dation pathway encoded in a single gene cluster.
Abbreviations: EMBL- European Molecular Biology Laboratory, NCBI- National Center for Biotechnology Information (Bethesda, MD, USA), RDP- Ribosomal Database Project (East Lansing, MI, USA)
Introduction One of the biggest barriers to efficient lignocellu-lose deconstruction is the problem of lignin, both occluding the action of cellulases and as wasteful lignin by-products. Tropical forest soils are the sites of very high rates of decomposition, accom-panied by very low and fluctuating redox potential conditions [1,2]. Because early stage decomposi-tion is typically dominated by fungi and the free-radical generating oxidative enzymes phenol oxi-dase and peroxidase [3,4], we targeted anaerobic tropical forest soils with the idea that they would be dominated by bacterial rather than fungal de-composers. To discover organisms that were ca-pable of breaking down lignin without the use of
oxygen free radicals, we isolated “Enterobacter lignolyticus” SCF1 under anaerobic conditions us-ing lignin as the sole carbon source. In addition to this, it has been observed to withstand high con-centrations of ionic liquids [5], and thus was tar-geted for whole genome sequencing.
Organism information “E. lignolyticus” SCF1 was isolated from soil col-lected from the Short Cloud Forest site in the El Yunque experimental forest, part of the Luquillo Long-Term Ecological Research Station in Luquil-lo, Puerto Rico, USA (Table 1). Soils were diluted in water and inoculated into roll tubes containing
“Enterobacter lignolyticus” SCF1
70 Standards in Genomic Sciences
MOD-CCMA media with alkali lignin as the source of carbon. MOD-CCMA media consists of 2.8 g L-1 NaCl, 0.1 g L-1 KCl, 27 mM MgCl2, 1 mM CaCl2, 1.25 mM NH4Cl, 9.76 g L-1 MES, 1.1 ml L-1 K2HPO4, 12.5 ml L-1 trace minerals [19,20], and 1 ml L-1 Thauer’s vitamins [21]. Tubes were incubated at room temperature for up to 12 weeks, at which point the colony was picked, grown in 10% tryptic soy broth (TSB), and characterized. When grown on 10% TSB agar plates, SCF1 colo-nies are translucent white, slightly irregular in shape with wavy margins, and have a shiny smooth surface. SCF1 was determined to be a non-sporulating strain based on a Pasteurization test. To do this, a suspension of SCF1 cells was heated at 80°C for 10 minutes. 5μl of heated culture and non-heated control culture were both spotted onto 10% TSB agar and incubated for growth for 3 days at room temperature. The non-heated cells
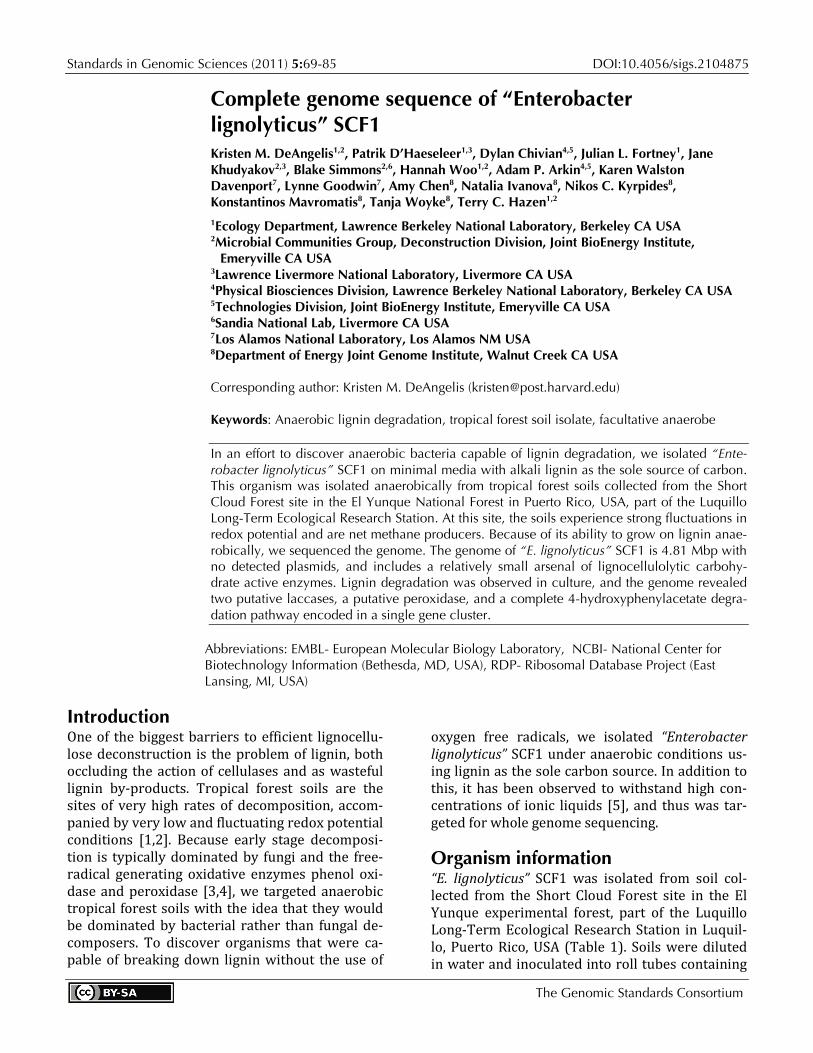
grew while the heated culture did not, indicating the absence of heat-resistant spores. For initial genotyping and for validating the isola-tion, the small subunit ribosomal RNA gene was sequenced by Sanger sequencing using the uni-versal primers 8F and 1492R [22].The 16S rRNA sequence places “Enterobacter lignolyticus” SCF1 in the family Enterobacteriaceae. However, 16S rRNA sequence is not sufficient to clearly define the evolutionary history of this region of the Gammaproteobacteria, and initially led to the in-correct classification of “E. lignolyticus” SCF1 as a member of the Enterobacter cloacae species. We have rectified its phylogenetic placement using the MicrobesOnline species tree [23], which is generated using 69 single-copy near-universal protein families [24] aligned by MUSCLE [25] with tree construction using FastTree-2 [26] (Figure 1).
Figure 1. Phylogenetic tree highlighting the position of “Enterobacter lignolyticus” SCF1 rela-tive to other type and non-type strains within the Enterobacteriaceae. Strains shown are those within the Enterobacteriaceae having corresponding NCBI genome project ids listed within [27]. The tree is based on a concatenated MUSCLE alignment [25] of 69 near-universal sin-gle-copy COGs (COGs 12, 13, 16, 18, 30, 41, 46, 48, 49, 52, 60, 72, 80, 81, 86, 87, 88, 89, 90, 91, 92, 93, 94, 96, 97, 98, 99, 100, 102, 103, 104, 105, 124, 126, 127, 130, 143, 149, 150, 162, 164, 172, 184, 185, 186, 197, 198, 200, 201, 202, 215, 237, 244, 256, 284, 441, 442, 452, 461, 504, 519, 522, 525, 528, 532, 533, 540, 541, 552). The tree was constructed using FastTree-2 [26] using the JTT model of amino acid evolution [28]. FastTree-2 infers ap-proximate maximum-likelihood phylogenetic placements and provides local support values based on the Shimodaira-Hasegawa test [29]. Solid circles represent local support values over 90% and open circles over 80%. Erwinia tasmaniensis was used as an outgroup.
DeAngelis et al.
http://standardsingenomics.org 71
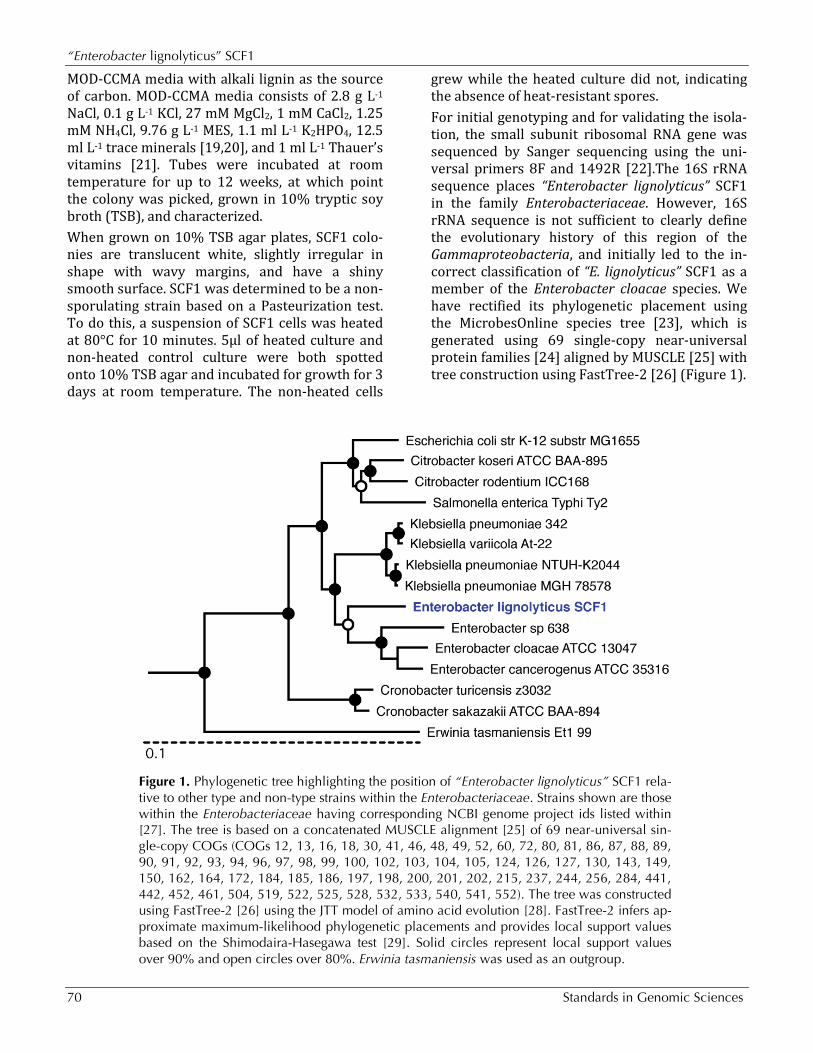
Table 1. Classification and general features of “Enterobacter lignolyticus” SCF1
MIGS ID Property Term Evidence code
Current classification
Domain Bacteria TAS[6]
Phylum Proteobacteria TAS[7]
Class Gammaproteobacteria TAS[8,9]
Order Enterobacteriales TAS[10]
Family Enterobacteriaceae TAS[11-13]
Genus Enterobacter TAS[11,13-16]
Species “Enterobacter lignolyticus”
Strain SCF
Gram stain negative NAS
Cell shape rod IDA
Motility motile via flagella IDA
Sporulation non-sporulating IDA
Temperature range Mesophile
Optimum temperature 30°C
Carbon source glucose, xylose, others; see Table 8 IDA
MIGS-6 Habitat Soil collected from a subtropical lower montane wet forest
TAS [17]
MIGS-6.3 Salinity
Can tolerate up to 0.75 M NaCl, 1 M KCl, 0.3 M NaOAc, 0.3 M KOAc. Growth in 10% trypticase soy broth is improved with 0.125 M NaCl
TAS [5]
MIGS-22 Oxygen facultative aerobe; grows well under completely oxic and anoxic conditions
IDA
MIGS-15 Biotic relationship free-living IDA
MIGS-14 Pathogenicity no
MIGS-4 Geographic location Luquillo Experimental Forest, Puerto Rico IDA
MIGS-5 Sample collection time July 2009 IDA
MIGS-4.1 Latitude 18.268N IDA
MIGS-4.2 Longitude 65.760 W IDA
MIGS-4.3 Depth 10 cm IDA
MIGS-4.4 Altitude 1027 msl IDA
Evidence codes - IDA: Inferred from Direct Assay; TAS: Traceable Author Statement (i.e., a direct report exists in the literature); NAS: Non-traceable Author Statement (i.e., not directly observed for the living, isolated sample, but based on a generally accepted property for the species, or anecdotal evidence). These evidence codes are from the Gene Ontology project [18].
“Enterobacter lignolyticus” SCF1
72 Standards in Genomic Sciences
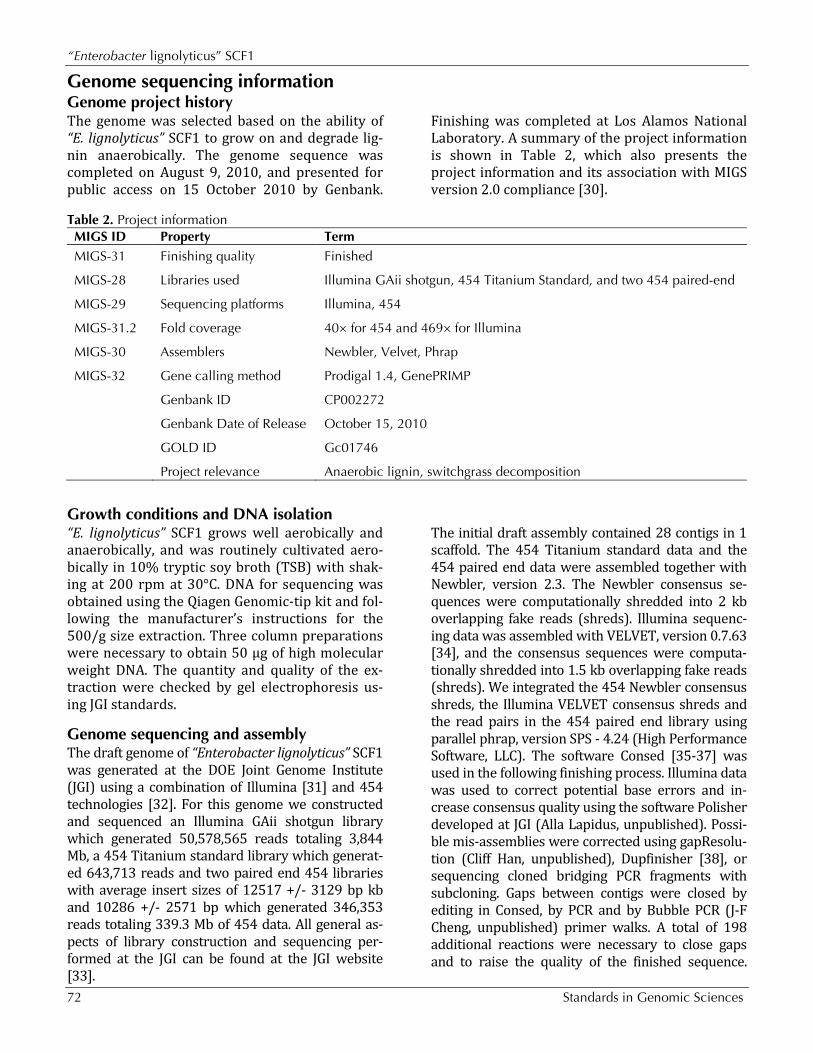
Genome sequencing information Genome project history The genome was selected based on the ability of “E. lignolyticus” SCF1 to grow on and degrade lig-nin anaerobically. The genome sequence was completed on August 9, 2010, and presented for public access on 15 October 2010 by Genbank.
Finishing was completed at Los Alamos National Laboratory. A summary of the project information is shown in Table 2, which also presents the project information and its association with MIGS version 2.0 compliance [30].
Table 2. Project information MIGS ID Property Term MIGS-31 Finishing quality Finished
MIGS-28 Libraries used Illumina GAii shotgun, 454 Titanium Standard, and two 454 paired-end
MIGS-29 Sequencing platforms Illumina, 454
MIGS-31.2 Fold coverage 40× for 454 and 469× for Illumina
MIGS-30 Assemblers Newbler, Velvet, Phrap
MIGS-32 Gene calling method Prodigal 1.4, GenePRIMP
Genbank ID CP002272
Genbank Date of Release October 15, 2010
GOLD ID Gc01746
Project relevance Anaerobic lignin, switchgrass decomposition
Growth conditions and DNA isolation “E. lignolyticus” SCF1 grows well aerobically and anaerobically, and was routinely cultivated aero-bically in 10% tryptic soy broth (TSB) with shak-ing at 200 rpm at 30°C. DNA for sequencing was obtained using the Qiagen Genomic-tip kit and fol-lowing the manufacturer’s instructions for the 500/g size extraction. Three column preparations were necessary to obtain 50 μg of high molecular weight DNA. The quantity and quality of the ex-traction were checked by gel electrophoresis us-ing JGI standards.
Genome sequencing and assembly The draft genome of “Enterobacter lignolyticus” SCF1 was generated at the DOE Joint Genome Institute (JGI) using a combination of Illumina [31] and 454 technologies [32]. For this genome we constructed and sequenced an Illumina GAii shotgun library which generated 50,578,565 reads totaling 3,844 Mb, a 454 Titanium standard library which generat-ed 643,713 reads and two paired end 454 libraries with average insert sizes of 12517 +/- 3129 bp kb and 10286 +/- 2571 bp which generated 346,353 reads totaling 339.3 Mb of 454 data. All general as-pects of library construction and sequencing per-formed at the JGI can be found at the JGI website [33].
The initial draft assembly contained 28 contigs in 1 scaffold. The 454 Titanium standard data and the 454 paired end data were assembled together with Newbler, version 2.3. The Newbler consensus se-quences were computationally shredded into 2 kb overlapping fake reads (shreds). Illumina sequenc-ing data was assembled with VELVET, version 0.7.63 [34], and the consensus sequences were computa-tionally shredded into 1.5 kb overlapping fake reads (shreds). We integrated the 454 Newbler consensus shreds, the Illumina VELVET consensus shreds and the read pairs in the 454 paired end library using parallel phrap, version SPS - 4.24 (High Performance Software, LLC). The software Consed [35-37] was used in the following finishing process. Illumina data was used to correct potential base errors and in-crease consensus quality using the software Polisher developed at JGI (Alla Lapidus, unpublished). Possi-ble mis-assemblies were corrected using gapResolu-tion (Cliff Han, unpublished), Dupfinisher [38], or sequencing cloned bridging PCR fragments with subcloning. Gaps between contigs were closed by editing in Consed, by PCR and by Bubble PCR (J-F Cheng, unpublished) primer walks. A total of 198 additional reactions were necessary to close gaps and to raise the quality of the finished sequence.
DeAngelis et al.
http://standardsingenomics.org 73
The total size of the genome is 4,814,049 bp and the final assembly is based on 191.3 Mb of 454 draft data, which provided an average 40× cover-age of the genome, and 2249.8 Mb of Illumina draft data, which provided an average 469× coverage of the genome; the coverage from different technolo-gies is reported separately because they have dif-ferent error patterns.
Genome annotation Protein coding genes were identified using Prodi-gal [39] and tRNA, rRNA and other RNA genes us-ing tRNAscan-SE [40], RNAmmer [41] and Rfam [42] as part of the ORNL genome annotation pipe-line followed by a round of manual curation using the JGI GenePRIMP pipeline [43]. The predicted CDSs were translated and used to search the Na-tional Center for Biotechnology Information (NCBI) nonredundant database, UniProt, TIGR-Fam, Pfam, PRIAM, KEGG, COG, and InterPro data-bases. Additional gene prediction analysis and functional annotation were performed within the Integrated Microbial Genomes - Expert Review (IMG-ER) platform [44] using the JGI standard an-notation pipeline [45,46].
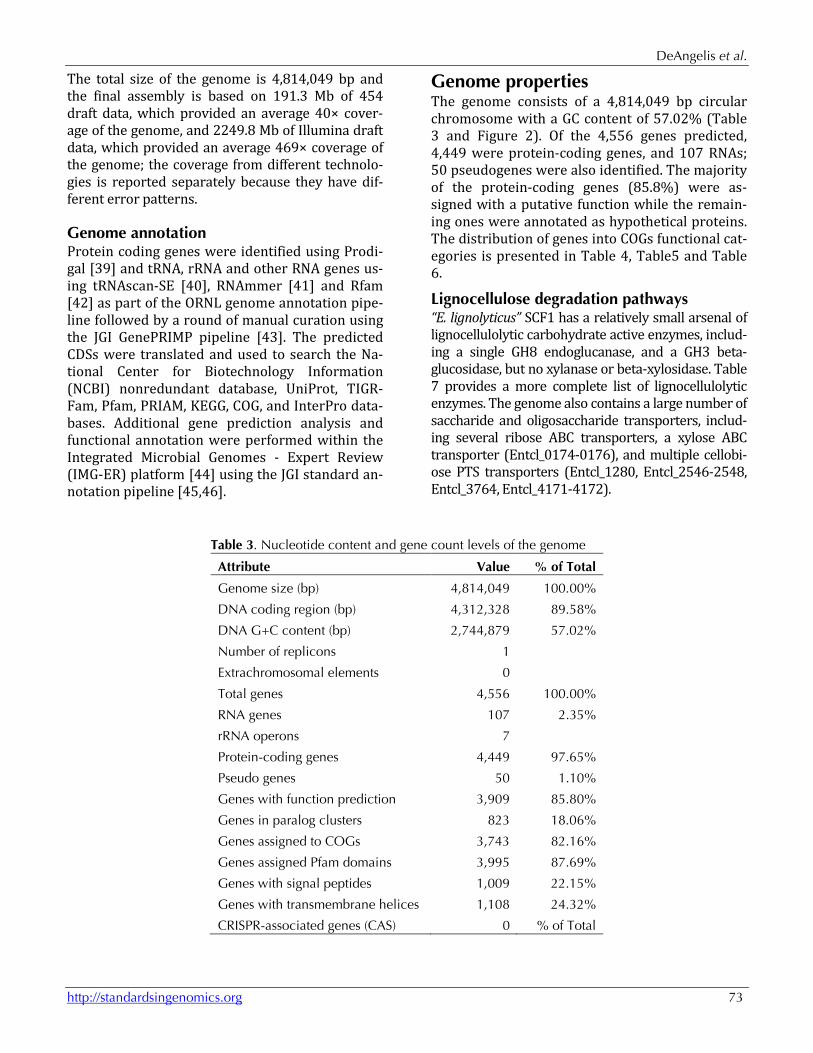
Genome properties The genome consists of a 4,814,049 bp circular chromosome with a GC content of 57.02% (Table 3 and Figure 2). Of the 4,556 genes predicted, 4,449 were protein-coding genes, and 107 RNAs; 50 pseudogenes were also identified. The majority of the protein-coding genes (85.8%) were as-signed with a putative function while the remain-ing ones were annotated as hypothetical proteins. The distribution of genes into COGs functional cat-egories is presented in Table 4, Table5 and Table 6.
Lignocellulose degradation pathways “E. lignolyticus” SCF1 has a relatively small arsenal of lignocellulolytic carbohydrate active enzymes, includ-ing a single GH8 endoglucanase, and a GH3 beta-glucosidase, but no xylanase or beta-xylosidase. Table 7 provides a more complete list of lignocellulolytic enzymes. The genome also contains a large number of saccharide and oligosaccharide transporters, includ-ing several ribose ABC transporters, a xylose ABC transporter (Entcl_0174-0176), and multiple cellobi-ose PTS transporters (Entcl_1280, Entcl_2546-2548, Entcl_3764, Entcl_4171-4172).
Table 3. Nucleotide content and gene count levels of the genome
Attribute Value % of Total
Genome size (bp) 4,814,049 100.00%
DNA coding region (bp) 4,312,328 89.58%
DNA G+C content (bp) 2,744,879 57.02%
Number of replicons 1 Extrachromosomal elements 0 Total genes 4,556 100.00%
RNA genes 107 2.35%
rRNA operons 7 Protein-coding genes 4,449 97.65%
Pseudo genes 50 1.10%
Genes with function prediction 3,909 85.80%
Genes in paralog clusters 823 18.06%
Genes assigned to COGs 3,743 82.16%
Genes assigned Pfam domains 3,995 87.69%
Genes with signal peptides 1,009 22.15%
Genes with transmembrane helices 1,108 24.32%
CRISPR-associated genes (CAS) 0 % of Total
“Enterobacter lignolyticus” SCF1
74 Standards in Genomic Sciences
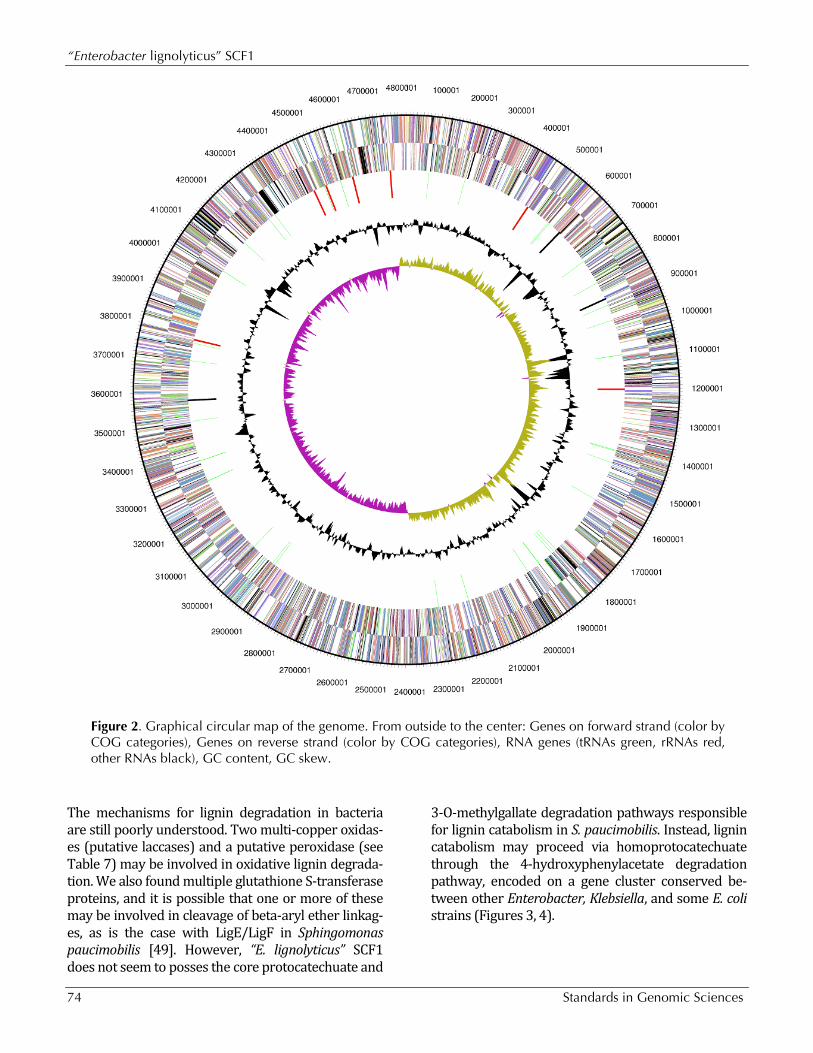
Figure 2. Graphical circular map of the genome. From outside to the center: Genes on forward strand (color by COG categories), Genes on reverse strand (color by COG categories), RNA genes (tRNAs green, rRNAs red, other RNAs black), GC content, GC skew.
The mechanisms for lignin degradation in bacteria are still poorly understood. Two multi-copper oxidas-es (putative laccases) and a putative peroxidase (see Table 7) may be involved in oxidative lignin degrada-tion. We also found multiple glutathione S-transferase proteins, and it is possible that one or more of these may be involved in cleavage of beta-aryl ether linkag-es, as is the case with LigE/LigF in Sphingomonas paucimobilis [49]. However, “E. lignolyticus” SCF1 does not seem to posses the core protocatechuate and
3-O-methylgallate degradation pathways responsible for lignin catabolism in S. paucimobilis. Instead, lignin catabolism may proceed via homoprotocatechuate through the 4-hydroxyphenylacetate degradation pathway, encoded on a gene cluster conserved be-tween other Enterobacter, Klebsiella, and some E. coli strains (Figures 3, 4).
DeAngelis et al.
http://standardsingenomics.org 75
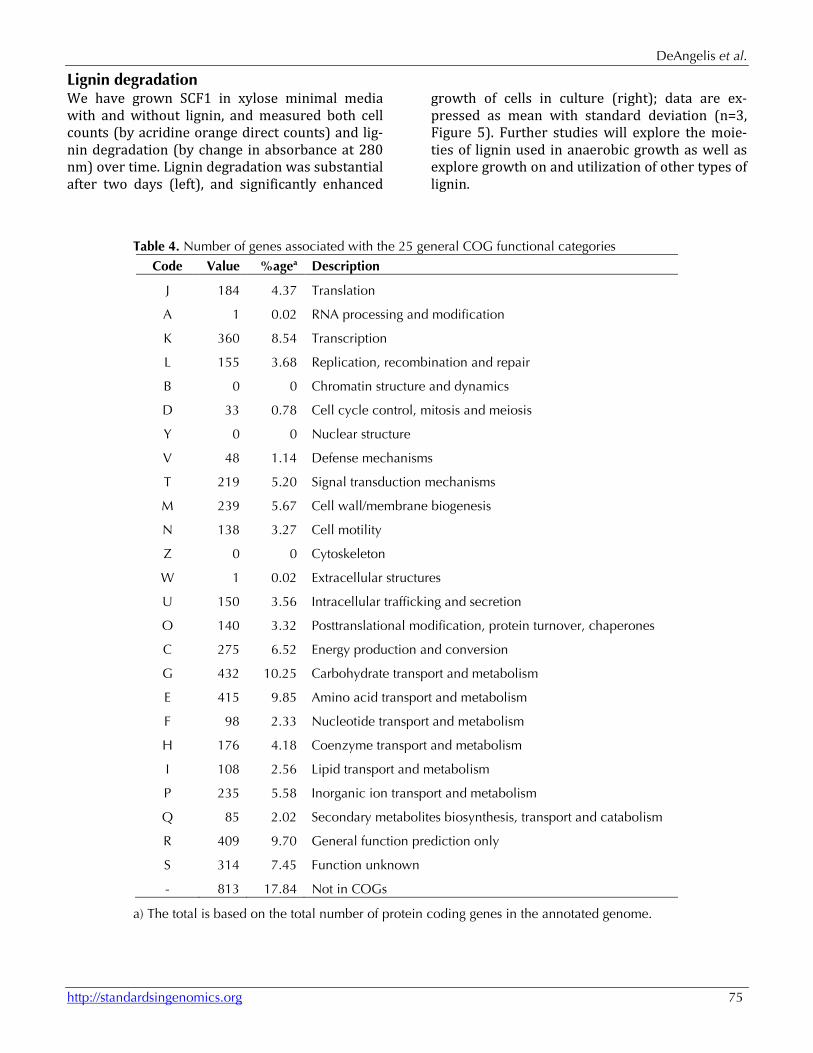
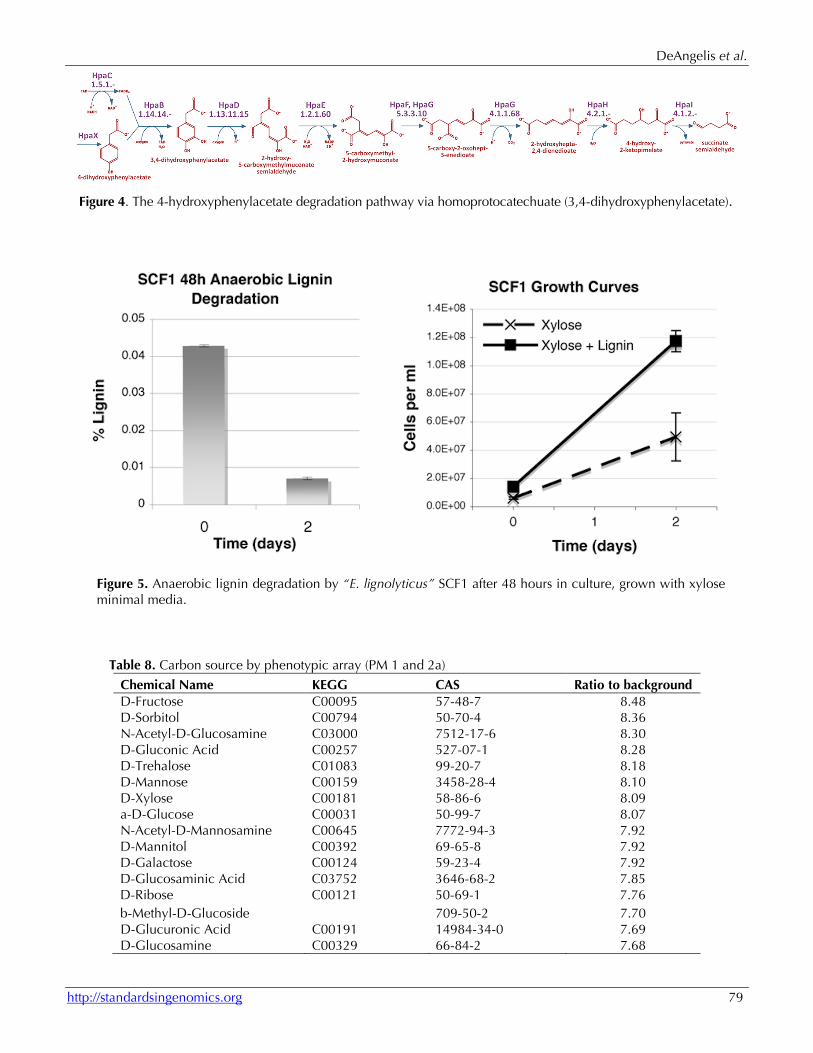
Lignin degradation We have grown SCF1 in xylose minimal media with and without lignin, and measured both cell counts (by acridine orange direct counts) and lig-nin degradation (by change in absorbance at 280 nm) over time. Lignin degradation was substantial after two days (left), and significantly enhanced
growth of cells in culture (right); data are ex-pressed as mean with standard deviation (n=3, Figure 5). Further studies will explore the moie-ties of lignin used in anaerobic growth as well as explore growth on and utilization of other types of lignin.
Table 4. Number of genes associated with the 25 general COG functional categories
Code Value %agea Description
J 184 4.37 Translation
A 1 0.02 RNA processing and modification
K 360 8.54 Transcription
L 155 3.68 Replication, recombination and repair
B 0 0 Chromatin structure and dynamics
D 33 0.78 Cell cycle control, mitosis and meiosis
Y 0 0 Nuclear structure
V 48 1.14 Defense mechanisms
T 219 5.20 Signal transduction mechanisms
M 239 5.67 Cell wall/membrane biogenesis
N 138 3.27 Cell motility
Z 0 0 Cytoskeleton
W 1 0.02 Extracellular structures
U 150 3.56 Intracellular trafficking and secretion
O 140 3.32 Posttranslational modification, protein turnover, chaperones
C 275 6.52 Energy production and conversion
G 432 10.25 Carbohydrate transport and metabolism
E 415 9.85 Amino acid transport and metabolism
F 98 2.33 Nucleotide transport and metabolism
H 176 4.18 Coenzyme transport and metabolism
I 108 2.56 Lipid transport and metabolism
P 235 5.58 Inorganic ion transport and metabolism
Q 85 2.02 Secondary metabolites biosynthesis, transport and catabolism
R 409 9.70 General function prediction only
S 314 7.45 Function unknown
- 813 17.84 Not in COGs
a) The total is based on the total number of protein coding genes in the annotated genome.
“Enterobacter lignolyticus” SCF1
76 Standards in Genomic Sciences
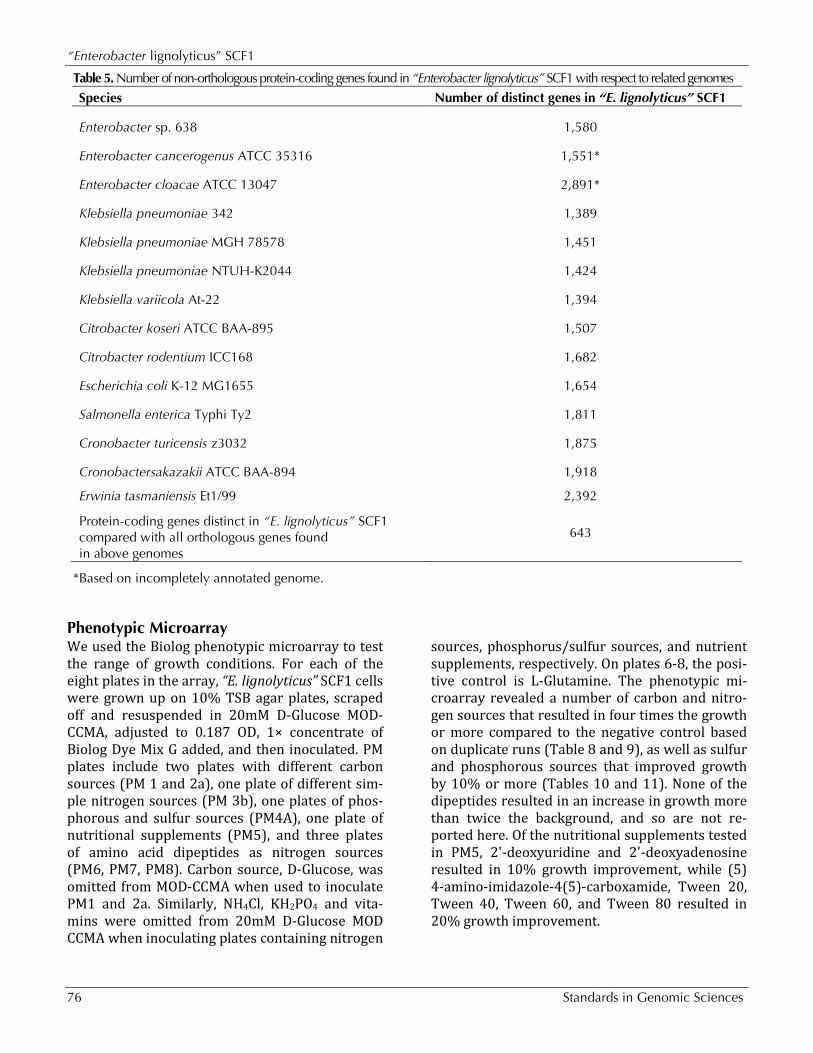
Table 5. Number of non-orthologous protein-coding genes found in “Enterobacter lignolyticus” SCF1 with respect to related genomes
Species Number of distinct genes in “E. lignolyticus” SCF1
Enterobacter sp. 638 1,580
Enterobacter cancerogenus ATCC 35316 1,551*
Enterobacter cloacae ATCC 13047 2,891*
Klebsiella pneumoniae 342 1,389
Klebsiella pneumoniae MGH 78578 1,451
Klebsiella pneumoniae NTUH-K2044 1,424
Klebsiella variicola At-22 1,394
Citrobacter koseri ATCC BAA-895 1,507
Citrobacter rodentium ICC168 1,682
Escherichia coli K-12 MG1655 1,654
Salmonella enterica Typhi Ty2 1,811
Cronobacter turicensis z3032 1,875
Cronobactersakazakii ATCC BAA-894 1,918
Erwinia tasmaniensis Et1/99 2,392
Protein-coding genes distinct in “E. lignolyticus” SCF1 compared with all orthologous genes found in above genomes
643
*Based on incompletely annotated genome.
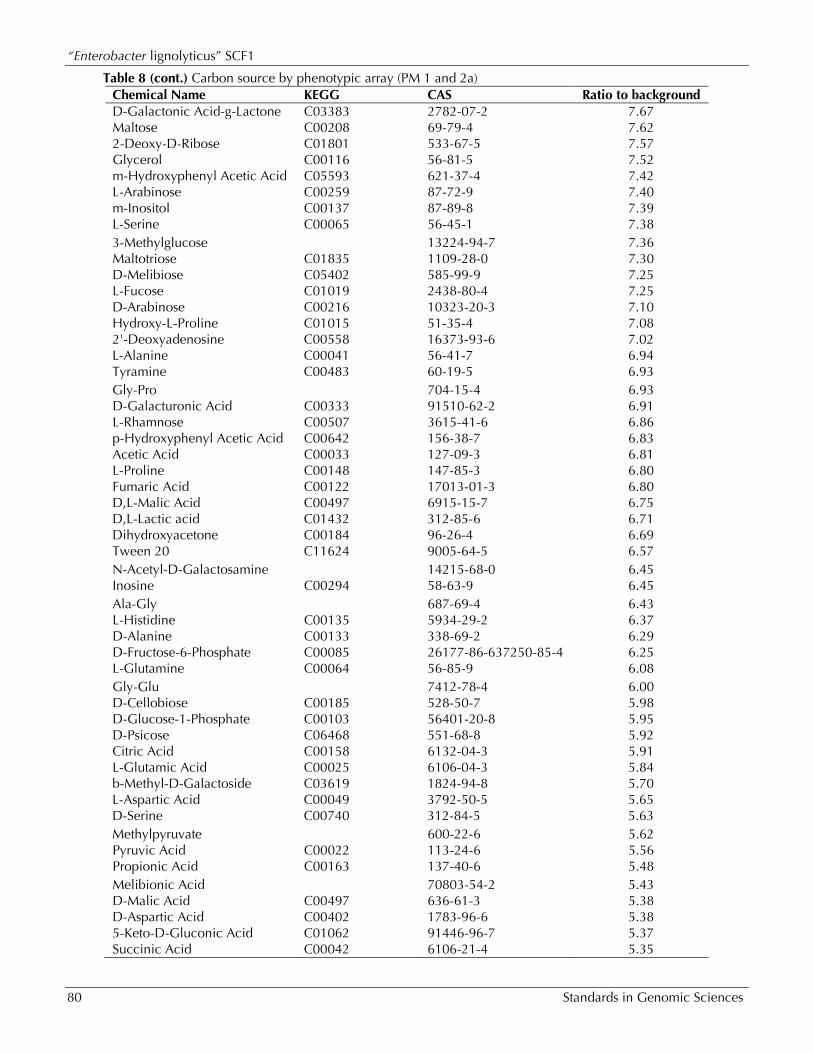
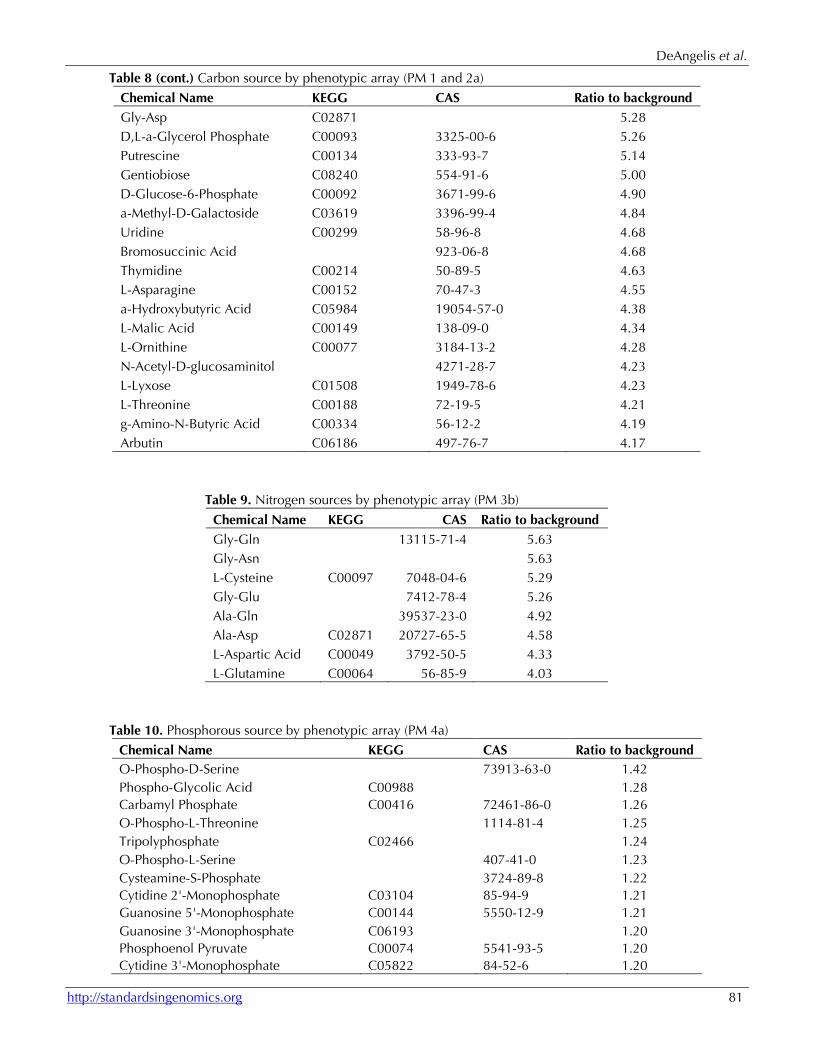
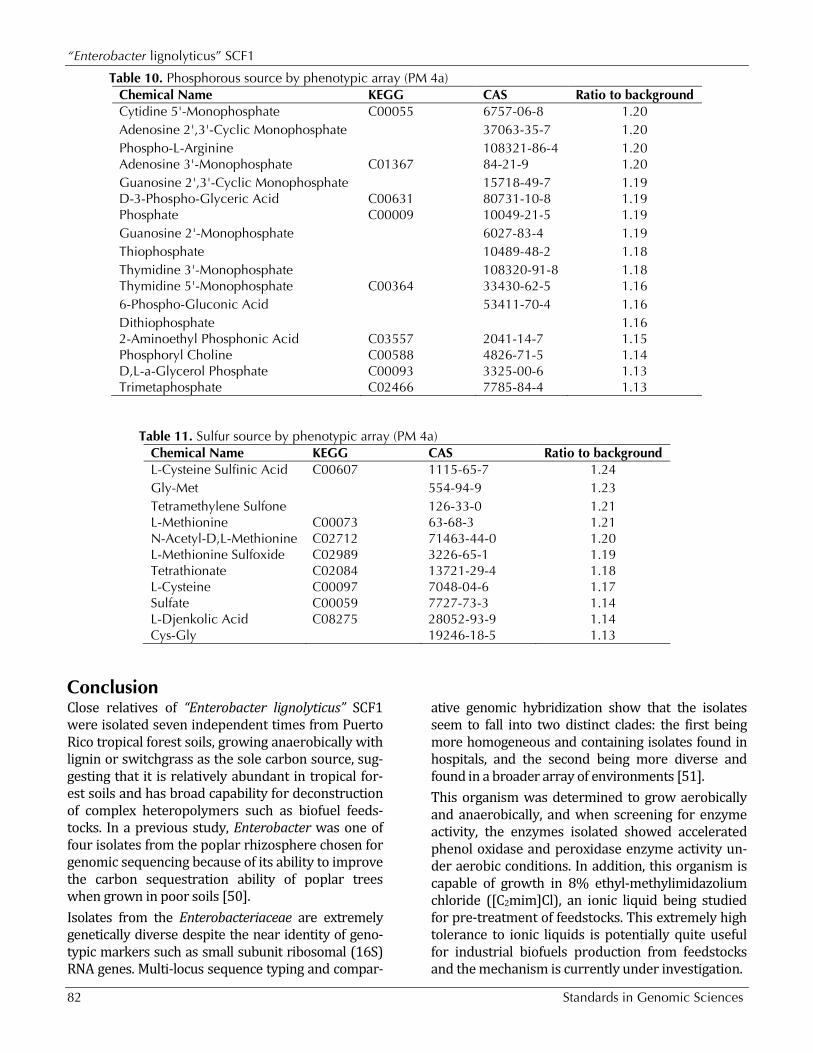
Phenotypic Microarray We used the Biolog phenotypic microarray to test the range of growth conditions. For each of the eight plates in the array, “E. lignolyticus” SCF1 cells were grown up on 10% TSB agar plates, scraped off and resuspended in 20mM D-Glucose MOD-CCMA, adjusted to 0.187 OD, 1× concentrate of Biolog Dye Mix G added, and then inoculated. PM plates include two plates with different carbon sources (PM 1 and 2a), one plate of different sim-ple nitrogen sources (PM 3b), one plates of phos-phorous and sulfur sources (PM4A), one plate of nutritional supplements (PM5), and three plates of amino acid dipeptides as nitrogen sources (PM6, PM7, PM8). Carbon source, D-Glucose, was omitted from MOD-CCMA when used to inoculate PM1 and 2a. Similarly, NH4Cl, KH2PO4 and vita-mins were omitted from 20mM D-Glucose MOD CCMA when inoculating plates containing nitrogen
sources, phosphorus/sulfur sources, and nutrient supplements, respectively. On plates 6-8, the posi-tive control is L-Glutamine. The phenotypic mi-croarray revealed a number of carbon and nitro-gen sources that resulted in four times the growth or more compared to the negative control based on duplicate runs (Table 8 and 9), as well as sulfur and phosphorous sources that improved growth by 10% or more (Tables 10 and 11). None of the dipeptides resulted in an increase in growth more than twice the background, and so are not re-ported here. Of the nutritional supplements tested in PM5, 2'-deoxyuridine and 2'-deoxyadenosine resulted in 10% growth improvement, while (5) 4-amino-imidazole-4(5)-carboxamide, Tween 20, Tween 40, Tween 60, and Tween 80 resulted in 20% growth improvement.
DeAngelis et al.
http://standardsingenomics.org 77
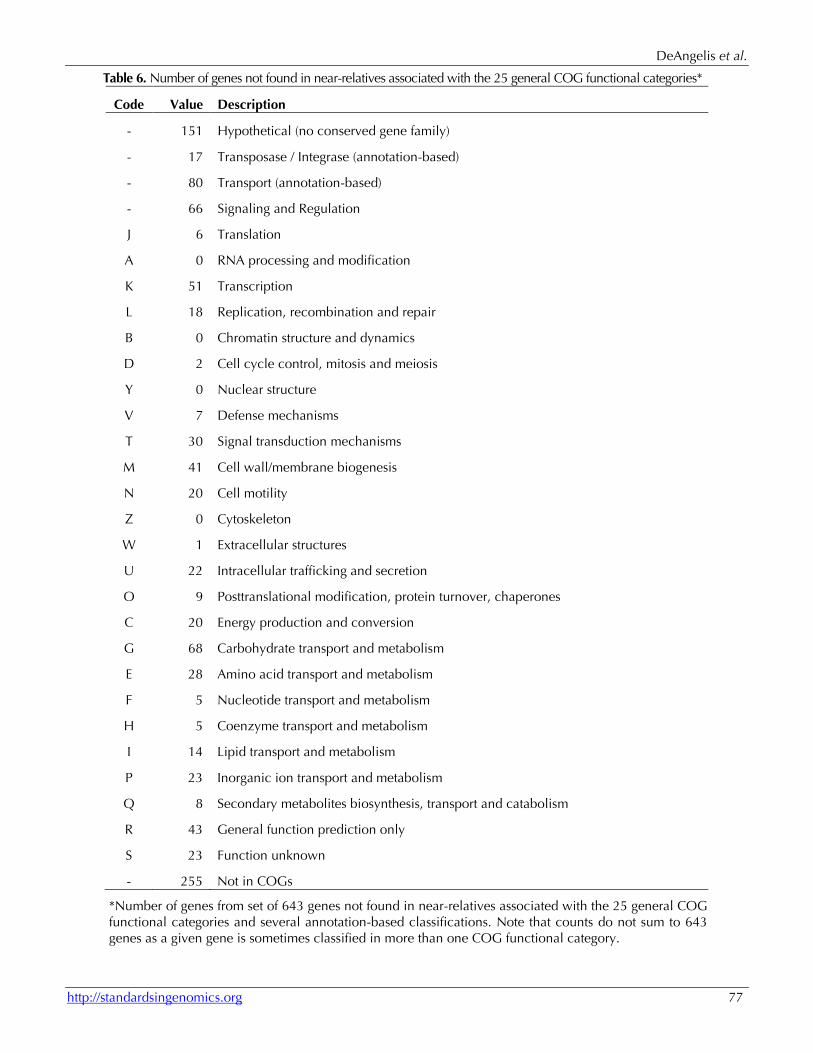
Table 6. Number of genes not found in near-relatives associated with the 25 general COG functional categories*
Code Value Description
- 151 Hypothetical (no conserved gene family)
- 17 Transposase / Integrase (annotation-based)
- 80 Transport (annotation-based)
- 66 Signaling and Regulation
J 6 Translation
A 0 RNA processing and modification
K 51 Transcription
L 18 Replication, recombination and repair
B 0 Chromatin structure and dynamics
D 2 Cell cycle control, mitosis and meiosis
Y 0 Nuclear structure
V 7 Defense mechanisms
T 30 Signal transduction mechanisms
M 41 Cell wall/membrane biogenesis
N 20 Cell motility
Z 0 Cytoskeleton
W 1 Extracellular structures
U 22 Intracellular trafficking and secretion
O 9 Posttranslational modification, protein turnover, chaperones
C 20 Energy production and conversion
G 68 Carbohydrate transport and metabolism
E 28 Amino acid transport and metabolism
F 5 Nucleotide transport and metabolism
H 5 Coenzyme transport and metabolism
I 14 Lipid transport and metabolism
P 23 Inorganic ion transport and metabolism
Q 8 Secondary metabolites biosynthesis, transport and catabolism
R 43 General function prediction only
S 23 Function unknown
- 255 Not in COGs
*Number of genes from set of 643 genes not found in near-relatives associated with the 25 general COG functional categories and several annotation-based classifications. Note that counts do not sum to 643 genes as a given gene is sometimes classified in more than one COG functional category.
“Enterobacter lignolyticus” SCF1
78 Standards in Genomic Sciences
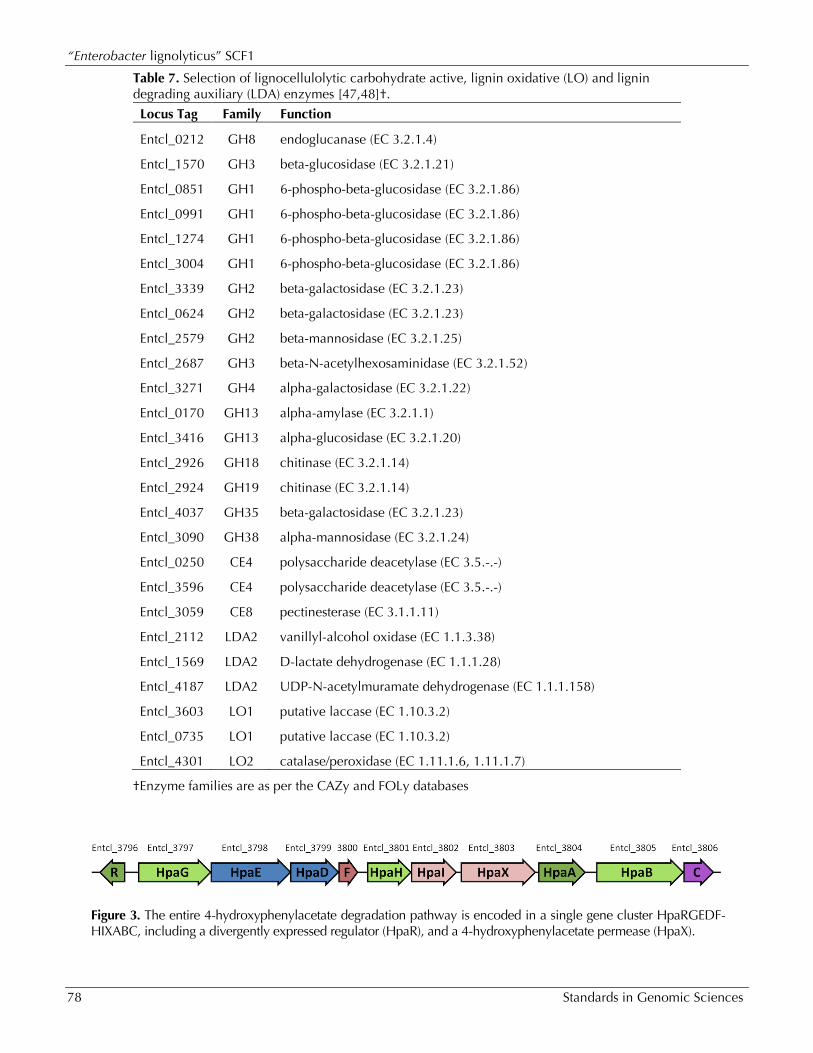
Table 7. Selection of lignocellulolytic carbohydrate active, lignin oxidative (LO) and lignin degrading auxiliary (LDA) enzymes [47,48]†.
Locus Tag Family Function
Entcl_0212 GH8 endoglucanase (EC 3.2.1.4)
Entcl_1570 GH3 beta-glucosidase (EC 3.2.1.21)
Entcl_0851 GH1 6-phospho-beta-glucosidase (EC 3.2.1.86)
Entcl_0991 GH1 6-phospho-beta-glucosidase (EC 3.2.1.86)
Entcl_1274 GH1 6-phospho-beta-glucosidase (EC 3.2.1.86)
Entcl_3004 GH1 6-phospho-beta-glucosidase (EC 3.2.1.86)
Entcl_3339 GH2 beta-galactosidase (EC 3.2.1.23)
Entcl_0624 GH2 beta-galactosidase (EC 3.2.1.23)
Entcl_2579 GH2 beta-mannosidase (EC 3.2.1.25)
Entcl_2687 GH3 beta-N-acetylhexosaminidase (EC 3.2.1.52)
Entcl_3271 GH4 alpha-galactosidase (EC 3.2.1.22)
Entcl_0170 GH13 alpha-amylase (EC 3.2.1.1)
Entcl_3416 GH13 alpha-glucosidase (EC 3.2.1.20)
Entcl_2926 GH18 chitinase (EC 3.2.1.14)
Entcl_2924 GH19 chitinase (EC 3.2.1.14)
Entcl_4037 GH35 beta-galactosidase (EC 3.2.1.23)
Entcl_3090 GH38 alpha-mannosidase (EC 3.2.1.24)
Entcl_0250 CE4 polysaccharide deacetylase (EC 3.5.-.-)
Entcl_3596 CE4 polysaccharide deacetylase (EC 3.5.-.-)
Entcl_3059 CE8 pectinesterase (EC 3.1.1.11)
Entcl_2112 LDA2 vanillyl-alcohol oxidase (EC 1.1.3.38)
Entcl_1569 LDA2 D-lactate dehydrogenase (EC 1.1.1.28)
Entcl_4187 LDA2 UDP-N-acetylmuramate dehydrogenase (EC 1.1.1.158)
Entcl_3603 LO1 putative laccase (EC 1.10.3.2)
Entcl_0735 LO1 putative laccase (EC 1.10.3.2)
Entcl_4301 LO2 catalase/peroxidase (EC 1.11.1.6, 1.11.1.7)
†Enzyme families are as per the CAZy and FOLy databases
Figure 3. The entire 4-hydroxyphenylacetate degradation pathway is encoded in a single gene cluster HpaRGEDF-HIXABC, including a divergently expressed regulator (HpaR), and a 4-hydroxyphenylacetate permease (HpaX).
DeAngelis et al.
http://standardsingenomics.org 79
Figure 4. The 4-hydroxyphenylacetate degradation pathway via homoprotocatechuate (3,4-dihydroxyphenylacetate).
Figure 5. Anaerobic lignin degradation by “E. lignolyticus” SCF1 after 48 hours in culture, grown with xylose minimal media.
Table 8. Carbon source by phenotypic array (PM 1 and 2a)
Chemical Name KEGG CAS Ratio to background D-Fructose C00095 57-48-7 8.48 D-Sorbitol C00794 50-70-4 8.36 N-Acetyl-D-Glucosamine C03000 7512-17-6 8.30 D-Gluconic Acid C00257 527-07-1 8.28 D-Trehalose C01083 99-20-7 8.18 D-Mannose C00159 3458-28-4 8.10 D-Xylose C00181 58-86-6 8.09 a-D-Glucose C00031 50-99-7 8.07 N-Acetyl-D-Mannosamine C00645 7772-94-3 7.92 D-Mannitol C00392 69-65-8 7.92 D-Galactose C00124 59-23-4 7.92 D-Glucosaminic Acid C03752 3646-68-2 7.85 D-Ribose C00121 50-69-1 7.76 b-Methyl-D-Glucoside 709-50-2 7.70 D-Glucuronic Acid C00191 14984-34-0 7.69 D-Glucosamine C00329 66-84-2 7.68
“Enterobacter lignolyticus” SCF1
80 Standards in Genomic Sciences
Table 8 (cont.) Carbon source by phenotypic array (PM 1 and 2a) Chemical Name KEGG CAS Ratio to background D-Galactonic Acid-g-Lactone C03383 2782-07-2 7.67 Maltose C00208 69-79-4 7.62 2-Deoxy-D-Ribose C01801 533-67-5 7.57 Glycerol C00116 56-81-5 7.52 m-Hydroxyphenyl Acetic Acid C05593 621-37-4 7.42 L-Arabinose C00259 87-72-9 7.40 m-Inositol C00137 87-89-8 7.39 L-Serine C00065 56-45-1 7.38 3-Methylglucose 13224-94-7 7.36 Maltotriose C01835 1109-28-0 7.30 D-Melibiose C05402 585-99-9 7.25 L-Fucose C01019 2438-80-4 7.25 D-Arabinose C00216 10323-20-3 7.10 Hydroxy-L-Proline C01015 51-35-4 7.08 2'-Deoxyadenosine C00558 16373-93-6 7.02 L-Alanine C00041 56-41-7 6.94 Tyramine C00483 60-19-5 6.93 Gly-Pro 704-15-4 6.93 D-Galacturonic Acid C00333 91510-62-2 6.91 L-Rhamnose C00507 3615-41-6 6.86 p-Hydroxyphenyl Acetic Acid C00642 156-38-7 6.83 Acetic Acid C00033 127-09-3 6.81 L-Proline C00148 147-85-3 6.80 Fumaric Acid C00122 17013-01-3 6.80 D,L-Malic Acid C00497 6915-15-7 6.75 D,L-Lactic acid C01432 312-85-6 6.71 Dihydroxyacetone C00184 96-26-4 6.69 Tween 20 C11624 9005-64-5 6.57 N-Acetyl-D-Galactosamine 14215-68-0 6.45 Inosine C00294 58-63-9 6.45 Ala-Gly 687-69-4 6.43 L-Histidine C00135 5934-29-2 6.37 D-Alanine C00133 338-69-2 6.29 D-Fructose-6-Phosphate C00085 26177-86-637250-85-4 6.25 L-Glutamine C00064 56-85-9 6.08 Gly-Glu 7412-78-4 6.00 D-Cellobiose C00185 528-50-7 5.98 D-Glucose-1-Phosphate C00103 56401-20-8 5.95 D-Psicose C06468 551-68-8 5.92 Citric Acid C00158 6132-04-3 5.91 L-Glutamic Acid C00025 6106-04-3 5.84 b-Methyl-D-Galactoside C03619 1824-94-8 5.70 L-Aspartic Acid C00049 3792-50-5 5.65 D-Serine C00740 312-84-5 5.63 Methylpyruvate 600-22-6 5.62 Pyruvic Acid C00022 113-24-6 5.56 Propionic Acid C00163 137-40-6 5.48 Melibionic Acid 70803-54-2 5.43 D-Malic Acid C00497 636-61-3 5.38 D-Aspartic Acid C00402 1783-96-6 5.38 5-Keto-D-Gluconic Acid C01062 91446-96-7 5.37 Succinic Acid C00042 6106-21-4 5.35
DeAngelis et al.
http://standardsingenomics.org 81
Table 8 (cont.) Carbon source by phenotypic array (PM 1 and 2a)
Chemical Name KEGG CAS Ratio to background Gly-Asp C02871 5.28 D,L-a-Glycerol Phosphate C00093 3325-00-6 5.26 Putrescine C00134 333-93-7 5.14 Gentiobiose C08240 554-91-6 5.00 D-Glucose-6-Phosphate C00092 3671-99-6 4.90 a-Methyl-D-Galactoside C03619 3396-99-4 4.84 Uridine C00299 58-96-8 4.68 Bromosuccinic Acid 923-06-8 4.68 Thymidine C00214 50-89-5 4.63 L-Asparagine C00152 70-47-3 4.55 a-Hydroxybutyric Acid C05984 19054-57-0 4.38 L-Malic Acid C00149 138-09-0 4.34 L-Ornithine C00077 3184-13-2 4.28 N-Acetyl-D-glucosaminitol 4271-28-7 4.23 L-Lyxose C01508 1949-78-6 4.23 L-Threonine C00188 72-19-5 4.21 g-Amino-N-Butyric Acid C00334 56-12-2 4.19 Arbutin C06186 497-76-7 4.17
Table 9. Nitrogen sources by phenotypic array (PM 3b)
Chemical Name KEGG CAS Ratio to background Gly-Gln 13115-71-4 5.63 Gly-Asn 5.63 L-Cysteine C00097 7048-04-6 5.29 Gly-Glu 7412-78-4 5.26 Ala-Gln 39537-23-0 4.92 Ala-Asp C02871 20727-65-5 4.58 L-Aspartic Acid C00049 3792-50-5 4.33 L-Glutamine C00064 56-85-9 4.03
Table 10. Phosphorous source by phenotypic array (PM 4a)
Chemical Name KEGG CAS Ratio to background O-Phospho-D-Serine 73913-63-0 1.42 Phospho-Glycolic Acid C00988 1.28 Carbamyl Phosphate C00416 72461-86-0 1.26 O-Phospho-L-Threonine 1114-81-4 1.25 Tripolyphosphate C02466 1.24 O-Phospho-L-Serine 407-41-0 1.23 Cysteamine-S-Phosphate 3724-89-8 1.22 Cytidine 2'-Monophosphate C03104 85-94-9 1.21 Guanosine 5'-Monophosphate C00144 5550-12-9 1.21 Guanosine 3'-Monophosphate C06193 1.20 Phosphoenol Pyruvate C00074 5541-93-5 1.20 Cytidine 3'-Monophosphate C05822 84-52-6 1.20
“Enterobacter lignolyticus” SCF1
82 Standards in Genomic Sciences
Table 10. Phosphorous source by phenotypic array (PM 4a) Chemical Name KEGG CAS Ratio to background Cytidine 5'-Monophosphate C00055 6757-06-8 1.20 Adenosine 2',3'-Cyclic Monophosphate 37063-35-7 1.20 Phospho-L-Arginine 108321-86-4 1.20 Adenosine 3'-Monophosphate C01367 84-21-9 1.20 Guanosine 2',3'-Cyclic Monophosphate 15718-49-7 1.19 D-3-Phospho-Glyceric Acid C00631 80731-10-8 1.19 Phosphate C00009 10049-21-5 1.19 Guanosine 2'-Monophosphate 6027-83-4 1.19 Thiophosphate 10489-48-2 1.18 Thymidine 3'-Monophosphate 108320-91-8 1.18 Thymidine 5'-Monophosphate C00364 33430-62-5 1.16 6-Phospho-Gluconic Acid 53411-70-4 1.16 Dithiophosphate 1.16 2-Aminoethyl Phosphonic Acid C03557 2041-14-7 1.15 Phosphoryl Choline C00588 4826-71-5 1.14 D,L-a-Glycerol Phosphate C00093 3325-00-6 1.13 Trimetaphosphate C02466 7785-84-4 1.13
Table 11. Sulfur source by phenotypic array (PM 4a) Chemical Name KEGG CAS Ratio to background L-Cysteine Sulfinic Acid C00607 1115-65-7 1.24 Gly-Met 554-94-9 1.23 Tetramethylene Sulfone 126-33-0 1.21 L-Methionine C00073 63-68-3 1.21 N-Acetyl-D,L-Methionine C02712 71463-44-0 1.20 L-Methionine Sulfoxide C02989 3226-65-1 1.19 Tetrathionate C02084 13721-29-4 1.18 L-Cysteine C00097 7048-04-6 1.17 Sulfate C00059 7727-73-3 1.14 L-Djenkolic Acid C08275 28052-93-9 1.14 Cys-Gly 19246-18-5 1.13
Conclusion Close relatives of “Enterobacter lignolyticus” SCF1 were isolated seven independent times from Puerto Rico tropical forest soils, growing anaerobically with lignin or switchgrass as the sole carbon source, sug-gesting that it is relatively abundant in tropical for-est soils and has broad capability for deconstruction of complex heteropolymers such as biofuel feeds-tocks. In a previous study, Enterobacter was one of four isolates from the poplar rhizosphere chosen for genomic sequencing because of its ability to improve the carbon sequestration ability of poplar trees when grown in poor soils [50]. Isolates from the Enterobacteriaceae are extremely genetically diverse despite the near identity of geno-typic markers such as small subunit ribosomal (16S) RNA genes. Multi-locus sequence typing and compar-
ative genomic hybridization show that the isolates seem to fall into two distinct clades: the first being more homogeneous and containing isolates found in hospitals, and the second being more diverse and found in a broader array of environments [51]. This organism was determined to grow aerobically and anaerobically, and when screening for enzyme activity, the enzymes isolated showed accelerated phenol oxidase and peroxidase enzyme activity un-der aerobic conditions. In addition, this organism is capable of growth in 8% ethyl-methylimidazolium chloride ([C2mim]Cl), an ionic liquid being studied for pre-treatment of feedstocks. This extremely high tolerance to ionic liquids is potentially quite useful for industrial biofuels production from feedstocks and the mechanism is currently under investigation.
DeAngelis et al.
http://standardsingenomics.org 83
Acknowledgements The work conducted in part by the U.S. Department of Energy Joint Genome Institute and in part by the Joint BioEnergy Institute (http://www.jbei.org) supported
by the U. S. Department of Energy, Office of Science, Office of Biological and Environmental Research, under Contract No. DE-AC02-05CH11231.
References 1. Parton W, Silver WL, Burke IC, Grassens L, Har-
mon ME, Currie WS, King JY, Adair EC, Brandt LA, Hart SC, et al. Global-scale similarities in ni-trogen release patterns during long-term decom-position. Science 2007; 315:361-364. PubMed
2. Cusack DF, Chou WW, Yang WH, Harmon ME, Silver WL. Controls on long-term root and leaf lit-ter decomposition in neotropical forests. Glob Change Biol 2009; 15:1339-1355.
3. Paul EA, Clark FE. Soil microbiology and bioche-mistry, Second edition. In: Paul EA, Clark FE, edi-tors. Soil microbiology and biochemistry, Second edition. 1250 Sixth Ave., San Diego, California 92101; 14 Belgrave Square, 24-28 Oval Road, London NW1 70X, England, UK: Academic Press, Inc.; Academic Press Ltd.; 1996. p xiii+340.
4. Freeman C, Ostle N, Kang H. An enzymic 'latch' on a global carbon store - A shortage of oxygen locks up carbon in peatlands by restraining a sin-gle enzyme. Nature 2001; 409:149. PubMed
5. Khudyakov J, D’Haeseleer P, Borglin SE, DeAn-gelis KM, Woo HH, Lindquist, EA, Hazen TC, Simmons BA, Thelen MP. Global transcriptome response to ionic liquid by a tropical rain forest soil bacterium, “Enterobacter lignolyticus” SCF1PNAS plus 2011. In press.
6. Woese CR, Kandler O, Wheelis ML. Towards a natural system of organisms: Proposal for the do-mains Archaea, Bacteria and Eucarya. Proc Natl Acad Sci USA 1990; 87:4576-4579. PubMed
7. Garrity GM, Bell JA, Lilburn T. Phylum XIV. Pro-teobacteria phyl. nov. In: Garrity GM, Brenner DJ, Krieg NR, Staley JT (eds), Bergey's Manual of Sys-tematic Bacteriology, Second Edition, Volume 2, Part B, Springer, New York, 2005, p. 1.
8. List Editor. Validation of publication of new names and new combinations previously effec-tively published outside the IJSEM. List no. 106. Int J Syst Evol Microbiol 2005; 55:2235-2238.
9. Garrity GM, Bell JA, Lilburn T. Class III. Gamma-proteobacteria class. nov. In: Garrity GM, Brenner DJ, Krieg NR, Staley JT (eds), Bergey's Manual of Systematic Bacteriology, Second Edition, Volume 2, Part B, Springer, New York, 2005, p. 1.
10. Garrity GM, Holt JG. Taxonomic Outline of the Archaea and Bacteria. In: Garrity GM, Boone DR, Castenholz RW (eds), Bergey's Manual of Syste-matic Bacteriology, Second Edition, Volume 1, Springer, New York, 2001, p. 155-166.
11. Skerman VBD, McGowan V, Sneath PHA. Ap-proved Lists of Bacterial Names. Int J Syst Bacte-riol 1980; 30:225-420.
12. Rahn O. New principles for the classification of bacteria. Zentralbl Bakteriol Parasitenkd Infek-tionskr Hyg 1937; 96:273-286.
13. Judicial Commission. Conservation of the family name Enterobacteriaceae, of the name of the type genus, and designation of the type species OPINION NO. 15. Int Bull Bacteriol Nomencl Taxon 1958; 8:73-74.
14. Hormaeche E, Edwards PR. A proposed genus Enterobacter. Int Bull Bacteriol Nomencl Taxon 1960; 10:71-74.
15. Sakazaki R. Genus VII. Enterobacter Hormaeche and Edwards 1960, 72; Nom. cons. Opin. 28, Jud. Comm. 1963, 38. In: Buchanan RE, Gibbons NE (eds), Bergey's Manual of Determinative Bac-teriology, Eighth Edition, The Williams and Wil-kins Co., Baltimore, 1974, p. 324-325.
16. Editorial Board. OPINION 28 Rejection of the Bacterial Generic Name Cloaca Castellani and Chalmers and Acceptance of Enterobacter Hor-maeche and Edwards as a Bacterial Generic Name with Type Species Enterobacter cloacae (Jordan) Hormaeche and Edwards. Int Bull Bacte-riol Nomencl Taxon 1963; 13:38.
17. DeAngelis KM, Silver WL, Thompson AW, Fire-stone MK. Microbial communities acclimate to recurring changes in soil redox potential status. Environ Microbiol 2010; 12:3137-3149. PubMed
18. Ashburner M, Ball CA, Blake JA, Botstein D, But-ler H, Cherry JM, Davis AP, Dolinski K, Dwight SS, Eppig JT, et al. Gene ontology: tool for the un-ification of biology. The Gene Ontology Consor-tium. Nat Genet 2000; 25:25-29. PubMed
19. Tschech A, Pfennig N. Growth-Yield Increase Linked to Caffeate Reduction in Acetobacterium-Woodii. Arch Microbiol 1984; 137:163-167.
“Enterobacter lignolyticus” SCF1
84 Standards in Genomic Sciences
20. Widdel F, Kohring GW, Mayer F. Studies on Dis-similatory Sulfate-Reducing Bacteria That De-compose Fatty-Acids. 3. Characterization of the Filamentous Gliding Desulfonema-Limicola gen-nov sp-nov, and Desulfonema-Magnum Sp-Nov. Arch Microbiol 1983; 134:286-294.
21. Janssen PH, Schuhmann A, Morschel E, Rainey FA. Novel anaerobic ultramicrobacteria belong-ing to the Verrucomicrobiales lineage of bacterial descent isolated by dilution culture from anoxic rice paddy soil. Appl Environ Microbiol 1997; 63:1382-1388. PubMed
22. Wilson KH, Blitchington RB, Greene RC. Amplifi-cation of bacterial-16S ribosomal DNA with po-lymerase chain-reaction. J Clin Microbiol 1990; 28:1942-1946. PubMed
23. Dehal PS, Joachimiak MP, Price MN, Bates JT, Baumohl JK, Chivian D, Friedland GD, Huang KH, Keller K, Novichkov PS, et al. MicrobesOn-line: an integrated portal for comparative and functional genomics. Nucleic Acids Res 2010; 38:D396-D400. PubMed
24. Ciccarelli FD, Doerks T, von Mering C, Creevey CJ, Snel B, Bork P. Toward automatic reconstruc-tion of a highly resolved tree of life. Science 2006; 311:1283-1287. PubMed
25. Edgar RC. MUSCLE: multiple sequence alignment with high accuracy and high throughput. Nucleic Acids Res 2004; 32:1792-1797. PubMed
26. Price MN, Dehal PS, Arkin AP. FastTree 2-Approximately Maximum-Likelihood Trees for Large Alignments. PLoS ONE 2010; 5:e9490. PubMed
27. Garrity GM, Lilburn TG, Cole JR, Harrison SH, Euzeby J, Tindall BJ. The Taxonomic Outline of Bacteria and Archaea version 7.7. Michigan State University Board of Trustees; 2007.
28. Jones DT, Taylor WR, Thornton JM. The rapid generation of mutant data matrices from protein sequences. Comput Appl Biosci 1992; 8:275-282. PubMed
29. Shimodaira H, Hasegawa M. Multiple compari-sons of log-likelihoods with applications to phy-logenetic inference. Mol Biol Evol 1999; 16:1114-1116.
30. Field D, Garrity G, Gray T, Morrison N, Selengut J, Sterk P, Tatusova T, Thomson N, Allen MJ, An-giuoli SV, et al. The minimum information about a genome sequence (MIGS) specification. Nat Biotechnol 2008; 26:541-547. PubMed
31. Bennett S. Solexa Ltd. Pharmacogenomics 2004; 5:433-438. PubMed
32. Margulies M, Egholm M, Altman WE, Attiya S, Bader JS, Bemben LA, Berka J, Braverman MS, Chen YJ, Chen ZT, et al. Genome sequencing in microfabricated high-density picolitre reactors. Nature 2005; 437:376-380. PubMed
33. DOE Joint Genome Institute. http://www.jgi.doe.gov/.
34. Zerbino DR, Birney E. Velvet: Algorithms for de novo short read assembly using de Bruijn graphs. Genome Res 2008; 18:821-829. PubMed
35. Ewing B, Hillier L, Wendl MC, Green P. Base-calling of automated sequencer traces using phred. I. Accuracy assessment. Genome Res 1998; 8:175-185. PubMed
36. Ewing B, Green P. Base-calling of automated se-quencer traces using phred. II. Error probabilities. Genome Res 1998; 8:186-194. PubMed
37. Gordon D, Abajian C, Green P. Consed: A graph-ical tool for sequence finishing. Genome Res 1998; 8:195-202. PubMed
38. Han C, Chain P. Finishing repeat regions auto-matically with Dupfinisher. In: Arabnia HR, Vala-far J, editors. Proceedings of the 2006 internation-al Conference on Bioinformatics and Computa-tional Biology: CSREA Press; 2006. p 141-146.
39. Hyatt D, Chen GL, LoCascio PF, Land ML, Lari-mer FW, Hauser LJ. Prodigal: prokaryotic gene recognition and translatin initiation site identifica-tion. BMC Bioinformatics 2010; 11:119. PubMed
40. Lowe TM, Eddy SR. tRNAscan-SE: A program for improved detection of transfer RNA genes in ge-nomic sequence. Nucleic Acids Res 1997; 25:955-964. PubMed
41. Lagesen K, Hallin P, Rodland EA, Staerfeldt HH, Rognes T, Ussery DW. RNAmmer: consistent and rapid annotation of ribosomal RNA genes. Nucle-ic Acids Res 2007; 35:3100-3108. PubMed
42. Gardner PP, Daub J, Tate J, Moore BL, Osuch IH, Griffiths-Jones S, Finn RD, Nawrocki EP, Kolbe DL, Eddy SR, et al. Rfam: Wikipedia, clans and the "decimal" release. Nucleic Acids Res 2011; 39:D141-D145. PubMed
43. Pati A, Ivanova NN, Mikhailova N, Ovchinnikova G, Hooper SD, Lykidis A, Kyrpides NC. Gene-PRIMP: a gene prediction improvement pipeline for prokaryotic genomes. Nat Methods 2010; 7:455-457. PubMed
DeAngelis et al.
http://standardsingenomics.org 85
44. Markowitz VM, Mavromatis K, Ivanova NN, Chen IMA, Chu K, Krypides NC. IMG ER: a system tool for microbial genome annotation expert review and curation. Bioinformatics 2009; 25:2271-2278. PubMed
45. Mavromatis K, Ivanova NN, Chen IMA, Szeto E, Markowitz VM, Kyrpides NC. The DOE-JGI Stan-dard Operating Procedure for the Annotations of Microbial Genomes. Stand Genomic Sci 2009; 1:63-67. PubMed
46. User Guide IMG. https://img.jgi.doe.gov/er/doc/userGuide.pdf
47. Cantarel BL, Coutinho PM, Rancurel C, Bernard T, Lombard V, Henrissat B. The Carbohydrate-Active EnZymes database (CAZy): an expert re-source for Glycogenomics. Nucleic Acids Res 2009; 37:D233-D238. PubMed
48. Levasseur A, Plumi F, Coutinho PM, Rancurel C, Asther M, Delattre M, Henrissat B, Pontarotti P, Record E. FOLy: An integrated database for the classification and functional annotation of fungal
oxidoreductases potentially involved in the de-gradation of lignin and related aromatic com-pounds. Fungal Genet Biol 2008; 45:638-645. PubMed
49. Masai E, Katayama Y, Fukuda M. Genetic and biochemical investigations on bacterial catabolic pathways for lignin-derived aromatic compounds. Biosci Biotechnol Biochem 2007; 71:1-15. PubMed
50. Taghavi S, Garafola C, Monchy S, Newman L, Hoffman A, Weyens N, Barac T, Vangronsveld J, van der Lelie D. Genome Survey and Characteri-zation of Endophytic Bacteria Exhibiting a Benefi-cial Effect on Growth and Development of Poplar Trees. Appl Environ Microbiol 2009; 75:748-757. PubMed
51. Paauw A, Caspers MPM, Schuren FHJ, Leverstein-van Hall MA, Deletoile A, Montijn RC, Verhoef J, Fluit AC. Genomic Diversity within the Entero-bacter cloacae Complex. PLoS ONE 2008; 3:e3018. PubMed