Embed Size (px)
Citation preview

Entering Data for Analysis
Annie HerbertMedical Statistician
Research & Development Support UnitSalford Royal (Hope) Hospitals NHS Foundation Trust
[email protected] 0161 20 64567
Sept 2009 (v.2)

Timetable
Time Task
60 mins
Presentation
(Trust Library
Meeting Room)
20 mins Coffee Break
90 minsPractical Tasks
(Trust Library IT Room)

Outline
ENTERING DATA:• Data Format• Missing Data• Anonymity
STATSDIRECT:• Layout• Re-coding Variables• Transforming Variables• Categorising Variables

Spreadsheets

Things to remember:
Variable names:• Keep short• SPSS : No spaces, may use underscore,
e.g. ‘dose_1’
Categories:• Give each category a numerical code
e.g. medical = 1, surgical = 2, other = 3

Format
• No mixture of variables per column
e.g. blood pressure, rather than 180/60 have a column for diastolic and a column for systolic
• Format columns for dates, money, etc.
e.g. two decimal places for money
• Make sure that the program recognises whether the variables are continuous or categorical

Units• Do not enter with data
• May put in variable name e.g. ‘weight_kg’
• No mixtures of units per column
e.g. in 100’s and then switch to in 1000’s
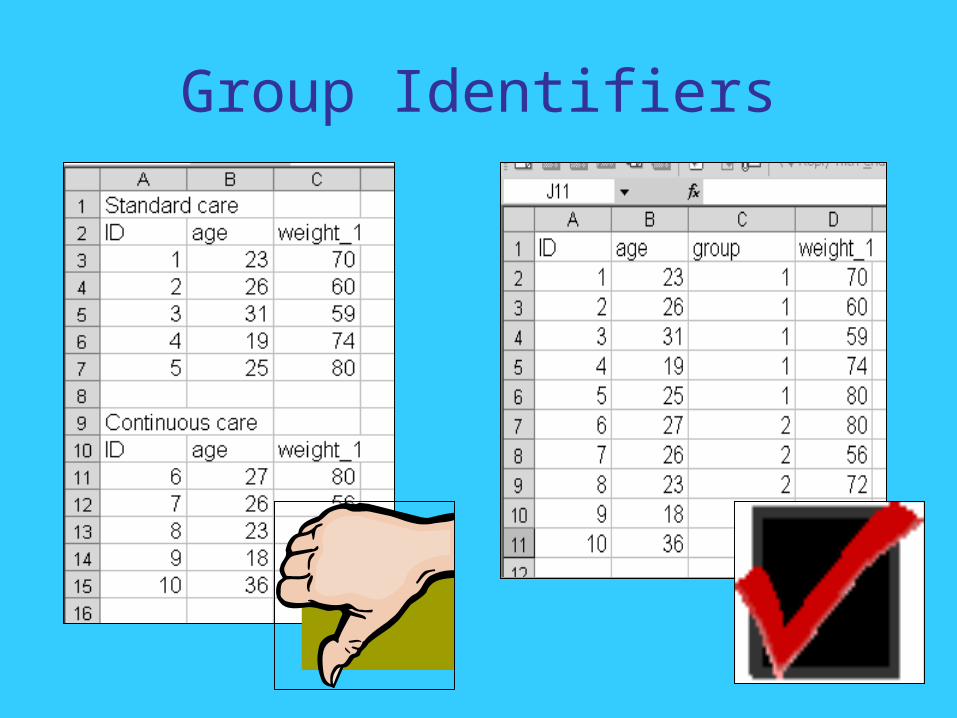
Group Identifiers

Missing Data
• StatsDirect : use ‘*’
• SPSS : use invalid value, e.g. ‘999’ for age
• If not using ‘*’, make sure that the package identifies such values as missing and not a real observation

Anonymity
• Each patient/unit in the study should be given a unique ID code
• Nobody outside the care-team should be able to identify the patient (e.g. statistician)
• Violation of Data Protection Act if carrying identifiable data on disc/CD/laptop

Transforming Data
Definition: Making a new variable by applying a formula to one (or more) existing variables.
Uses:• Calculating a new variable,e.g. the difference between pain at 6 months and pain
at baseline.
• Changing units,e.g. turning days into weeks.
• Taking natural logarithms in attempting to make data symmetric.

Recoding Data
Definition: Changing existing numbers into different ones
Uses:• Changing text to numbers,
e.g., Female = 0, Male = 1
• Changing a coding system,e.g., Female = 1 -> 0, Male = 2 -> 1
• Combining categories, e.g., Strongly Disagree = 0 & Disagree = 1
-> Negative Response = 0 Agree = 2 & Strongly Agree = 3
-> Positive Response = 1

Categorising Data
Definition: Converting a continuous variable to a categorical one.
E.g., Less than 30 years = 130-50 years = 251 years and over = 3

Special Types of Study
Questionnaires:• One row per questionnaire• One or many columns per question,
depending on number of answer options
Repeated Measures:• One row per person• One column per measure• Seek statistical advice

Available PackagesPackage Advantages Disadvantages
SPSS
• Journal-quality graphs
• Difficult to use at first• Expensive• Need license
StatsDirect• Easy to use • Cheap
• Need license
Excel
• Comes with Microsoft Office• Good for data entry
• Not good for statistical analyses

StatsDirect

Data can be entered and stored in a ‘Workbook’:

Plots, tables and analysescan be shown in a ‘Report’:

You can work between many workbooks and reports at a time:

Analyses are carried out using the menu headings:

A prompt will appear at each stage:

You’ll be asked to select the relevant data:

Transforming Variables (1):
1)2)
3) 4)

Transforming Variables (2):
5)
6)

Recoding Variables (1):
1)
2)
3)

Recoding Variables (2):
4)
5) 6)
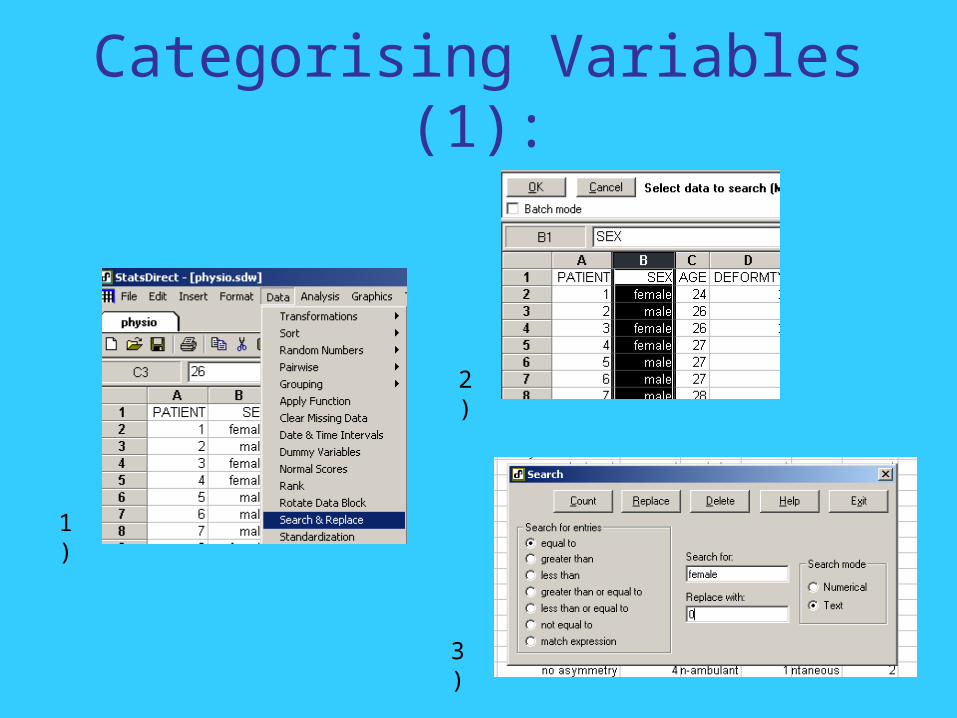
Categorising Variables (1):
1)
2)
3)
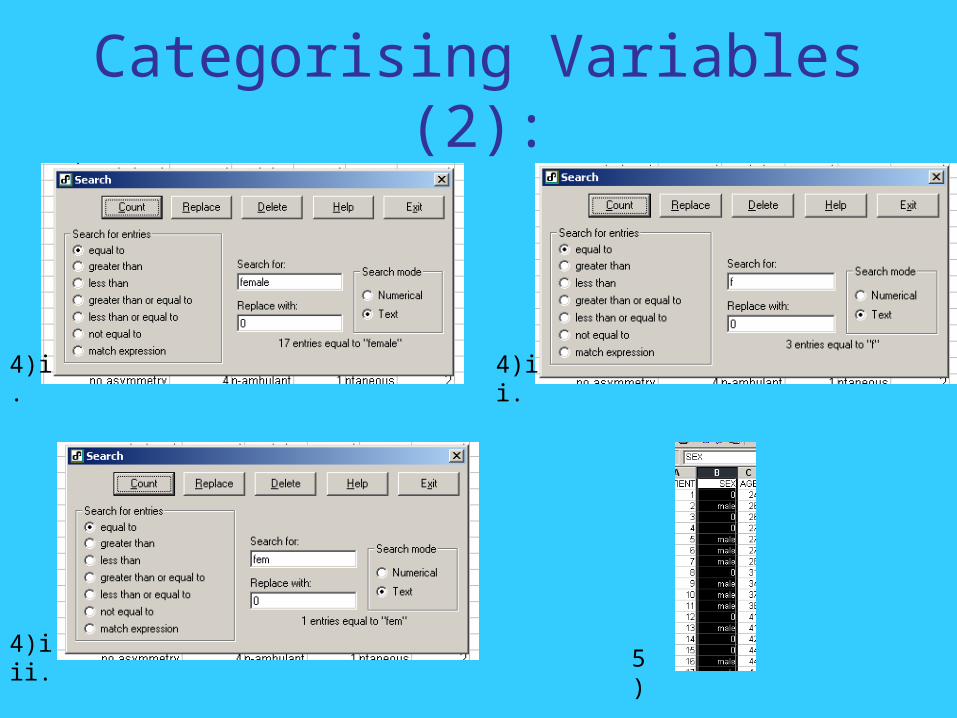
Categorising Variables (2):
4)i.
5)
4)ii.
4)iii.