Embed Size (px)
Citation preview

ENTERGY NUCLEAR NORTHEAST JAMES A. FITZPATRICK NUCLEAR POWER PLANT
P.O. BOX 110 LYCOMING, NY 13093
DOCUMENT TRANSMITTAL AND RECEIPT ACKNOWLEDGEMENT FORM
DATE: February 20, 2002 CONTROLLED COPY NUMBER: 34
TO:
FROM:
U.S.N.R.C. Document Center/Washington, DC
CATHY IZYK - EMERGENCY PLANNING DEPARTMENT
SUBJECT: EMERGENCY PLAN AND IMPLEMENTING PROCEDURES
Enclosed are revisions to your assigned copy of the JAFNPP Emergency Plan and Implementing Procedures. Please remove and DISCARD the old pages. Insert the attached, initial and date this routing sheet and return the completed routing sheet to Cathy Izyk in the Emergency Planning Department within 15 days. If this transmittal is not returned within 15 days, your name will be removed from the controlled list.
VOLUME 1 Update List Dated N/A _______
DOCUMENT PAGES REV. # INITIALS/DATE
NIA
VOLUME 2 Update List Dated N/A DOCUMENT PAGES REV. # INITIALS/DATE
N/A
VOLUME 3 Update List Dated February 2, 2002 DOCUMENT PAGES REV. # INITIALS/DATE
EAP-42 REPLACE ALL 16 SAP-10 REPLACE ALL 10
F
Date of Issue:
EMERGENCY PLAN IMPLEMENTING PROCEDURESNOLUME 3 UPDATE LIST CONTROLLED COPY #3•4
February 20. 2002
N/A TABLE OF CONTENTS REV. 23 12/98 N/A
EAP-26 PLANT DATA ACQUISITION SYSTEM REV. 11 02/98 Informational ACCESS ESTIMATION OF POPULATION DOSE
EAP-27 WITHIN 10 MILE EMERGENCY PLANNING REV. 9 02/98 Informational ZONE
EAP-28 EMERGENCY RESPONSE DATA SYSTEM REV. 6 07/00 Reference (ERDS) ACTIVATION
EAP-29 EOF VENTILATION ISOLATION DURING REV. 5 02/98 Informational AN EMERGENCY
EAP-30 EMERGENCY TERMINATION AND REV. 0 12/98 Informational TRANSITION TO RECOVERY*
EAP-31 RECOVERY MANAGER* REV. 1 07/01 Informational
EAP-32 RECOVERY SUPPORT GROUP* REV. 8 02/02 Informational
EAP-33 DEVELOPMENT OF A RECOVERY ACTION REV. 0 12/98 Informational PLAN* ACCEPTANCE OF ENVIRONMENTAL
EAP-34 SAMPLES AT THE EOF/EL DURING AN 02/98 Informational EMERGENCY
EAP-35 EOF TLD ISSUANCE DURING AN REV.6 02/98 Informational EMERGENCY
EAP-36 ENVIRONMENTAL LABORATORY USE REV. 4 02/98 Informational DURING AN EMERGENCY SECURITY OF THE EOF AND EL DURING
EAP-37 DRILLS, EXERCISES AND ACTUAL 07/01 Informational EVENTS
EAP-39 DELETED (02/95)
EAP-40 DELETED (02/98)
EAP-41 DELETED (12/85)
EAP-42 OBTAINING METEOROLOGICAL DATA REV. 16 02/02 Informational
EAP-43 EMERGENCY FACILITIES LONG TERM REV. 54 11/01 Informational STAFFING
EAP-44 CORE DAMAGE ESTIMATION REV. 4 02/98 Informational
EMERGENCY RESPONSE DATA SYSTEM EAP-45 (ERDS CONFIGURATION CONTROL REV. 6 07/00 Informational
PROGRAM)
SAP- 1 MAINTAINING EMERGENCY REV. 15 02/00 Informational PREPAREDNESS
EMERGENCY EQUIPMENT INVENTORY REV. 33 10/01 Reference
Page 1 of 2
EMERGENCY COMMUNICATIONS REV. 70 09/01 Reference TESTIN G_______________________________ _______________ _________________

EMERGENCY PLAN IMPLEMENTING PROCEDURES/VOLUME 3 UPDATE LIST
Date of Issue: February 20, 2002
NYS/OSWEGO COUNTY EMERGENCY PREPAREDNESS PHOTO IDENTIFICATION CARDS
REV. 8 03/00
SAP-5 DELETED (3/98)
SAP-6 DRILL/EXERCISE CONDUCT REV. 16 01/01 Informational SAP-7 MONTHLY SURVEILLANCE PROCEDURE Informational
FOR ON-CALL EMPLOYEES REV. 35 11/00
SAP-8 PROMPT NOTIFICATION SYSTEM Informational FAILURE/SIREN SYSTEM FALSE REV. 12 10/01 ACTIVATION
SAP-9 DELETED (02/94)
SAP-10 METEOROLOGICAL MONITORING REV. 10 02/02 Informational SYSTEM SURVEILLANCE
SAP- 11 EOF DOCUMENT CONTROL REV. 10 08/00 Informational
SAP-13 EOF SECURITY AND FIRE ALARM Informational SYSTEMS DURING NORMAL OPERATIONS REV. 3 03/98
SAP-14 DELETED (02/95)
SAP-15 DELETED (11/92)
SAP-16 UTILIZING EPIC IDT TERMINALS FROM Informational DESTINY SYSTEM REV. 3 02/98
SAP-17 EMERGENCY RESPONSE DATA SYSTEM Continuous (ERDS) QUARTERLY TESTING REV. 7 07/00
SAP-19 SEVERE WEATHER REV. 4 01/01 Informational
SAP-20 EMERGENCY PLAN ASSIGNMENTS REV. 19 01/01 Informational SAP-21 DELETED (04/01)
SAP-22 EMERGENCY PLANNING PROGRAM SELF Informational ASSESSMENT REV. 1 10/98
Page 2 of 2

ENTERGY NUCLEAR NORTHEAST JAMES A. FITZPATRICK NUCLEAR POWER PLANT
EMERGENCY PLAN IMPLEMENTING PROCEDURE
OBTAINING METEOROLOGICAL DATA EAP-42
REVISION 16
REVIEWED BY: PLANT OPERATING REVIEW COMMITTEE
MEETING NO. N/A DATE: N/A
APPROVED BY:RESPONSIBLE PROCEDURE OWNER
EFFECTIVE DATE:
FIRST ISSUE ID
O62� 90 o2�/ VI
FULL REVISION El LIMITED REVISION Z
PERIODIC REVIEW DUE DATE:
DATE:
***************************** *****************************
* INFORMATIONAL USE * * TSR *
* * CY * ADMINISTRATIVE * VCONTROLLED COPY #*b
A , a,4-,
FEBRUARY 2003

OBTAINING METEOROLOGICAL DATA* EAP-42
REVISION SUMMARY SHEET
REV. NO.
16 0 Deleted the words Niagara Mohawk due to their company change.
* In section 4.4.2 - updated the information to check when attempting to obtain data from the strip chart recorders and deleted the section following 4.4.3.
* Added Attachment 7 that shows atmospheric stability. 15 0 Added NIMO Mete contact information to sections 4.6.1
and 4.5.3. * An adjustment was made to the cover sheet to reflect
the company name change. 14 0 Added the TSC as an alternate location for performing
forecasting of mete data. * In section 4.2.2., deleted step G, and changed its
test to a NOTE prior to step 4.2.B. 13 0 On Attachment 1, in the EDAMS box, changed "F4" for
requery to select "Requery" with the mouse. Also in same box deleted If "locked up" or stalled, Attachment 3 for recovery.
12 0 Section 4.2 is changed to incorporate the new windows design of EDAMS and the method to obtain Met data.
* Original Attachment 3 was deleted, this attachment is no longer needed with the windows version. It is being replaced with a new Attachment 3 titled "Guide For Using EDAMS Computer To Obtain Meteorology Data".
11 0 ACTS 24234 - no order of priority is delineated in this revision.
0 ACTS 24237 - level of use changed to "informational" - part of review and revision for consistency with AP-02.04.
* Reformat per AP-02.01, Rev. 5. * Major revision of this procedure to remove LA100 as
met. data source and added flowchart as quick reference guide.
Rev. No. 16 Page 2 of 21

OBTAINING METEOROLOGICAL DATA*
TABLE OF CONTENTS
PAGESECTION
1.0
2.0
3.0
4.0
4.1
4.2
4.3
4.4
4.5
4.6
5.0
PURPOSE ...............................................
REFERENCES ............................................
INITIATING EVENTS .....................................
PROCEDURE .............................................
Description of Available Methods ......................
Obtaining Meteorological Data from EDAMS ..............
Obtaining Meteorological Data from Niagara Mohawk .....
Obtaining Meteorological Data from Analog Strip Charts
Obtaining Meteorological Information From Other SourceE
Meteorological Forecasting ............................
ATTACHMENTS ...........................................
1. MET DATA ACQUISITION QUICK REFERENCE FLOWCHART .....
2. OBTAINING METEOROLOGICAL DATA FOR
MANUAL COMPUTER INPUT ..............................
3. GUIDE FOR USING EDAMS COMPUTER TO
OBTAIN METEOROLOGY DATA ............................
4. ANALOG WIND SPEED AND DIRECTION
RECORDERS D, G AND J ...............................
5. RECORDER "K .........................................
6. CLASSIFICATION OF ATMOSPHERIC STABILITY ............
7. EXAMPLES OF ATMOSPHERIC STABILITY ..................
Page 3 of 21
.4
.4
.4
.4
.5
.6
.7
12
13
13
14
15
16
17
18
19
20
EAP-42
Rev. No. 16

OBTAINING METEOROLOGICAL DATA*
1.0 PURPOSE
This procedure provides instructions for accessing meteorological data in the Control Room, Technical Support Center, or Emergency Operations Facility and includes provisions for long-term forecasting.
2.0 REFERENCES
None
2.1 Developmental References
2.1.1 EAP-4, DOSE ASSESSMENT CALCULATIONS*
2.1.2 Emergency Dose Assessment Model System (EDAMS) System Design Specification
3.0 INITIATING EVENTS
3.1.1 An emerqency has been declared in accordnce iii-l T7\T
3.1.2
2, CLASSIFICATION OF EMERGENCY Conditions, or
EAP-4, DOSE ASSESSMENT CALCULATIONS, has been implemented.
PROCEDURE
Description of Available Methods
Meteorological data is available from the following sources:
A. Emergency Dose Assessment Modeling System (EDAMS)
B. Nine Mile Point Units 1 or 2 Control Rooms
C. Analog strip charts in Control Room or Technical Support Center
D. Any JAF Networked PC
E. National Weather Service
Page 4 of 21
4.0
4.1
EAP-42
Rev. No. 16

OBTAINING METEOROLOGICAL DATA* EAP-42
The general methodology involved would concern providing
meteorological data dependent on type of release. An elevated
release (stack) would utilize 200' level data; and if
unavailable, would progress in decreasing order to 100', 30'
and backup tower data (90'). Likewise, a ground release (any
other than stack) would utilize 30' level data, and if
unavailable, would progress in increasing order to 100', 200'
and backup tower data (90').
This list does not delineate a required order of priority but
provides a listing of resources based on accessibility
timeliness and accuracy of 15 minute averaged data.
NOTE: Flowchart (Attachment 1) is provided as a quick
reference and may be utilized by the operator familiar
with the body of this procedure.
It is optional to record met data on Attachment 2, Obtaining
Meteorological Data for Manual Computer Input; this may provide
some convenience.
4.2 Obtaining Meteorological Data from EDAMS
4.2.1 If the EDAMS computer is on-line:
A. The computer will automatically requery the met
system and update the data every 15 minutes on the
quarter hour (eg. 1300, 1315, 1330, etc.). A beep
may be heard when the update occurs.
B. When recording data, the operator should confirm
the time and date displayed are the most current
(ie. within the last 15 minutes of the current
time).
C. The operator may select "Requery" to ensure the
most current data is displayed.
4.2.2 If EDAMS is NOT on-line, log onto the system as
follows:
NOTE: Attachment 3 may be used to guide the operator
through the steps to activate the EDAMS computer and
obtain meteorological data.
A. Ensure black switch on CR or TSC meteorological
panels is positioned to the Niagara Mohawk ("B")
position.
Rev. No. 16 Page 5 of 21

OBTAINING METEOROLOGICAL DATA*
NOTE: Select "Continue" at the plant picture screen.
B. Energize the EDAMS computer power strip to provide power to the computer, monitor and printer.
C. Select the "Login" icon from the EDAMS icons and select "Continue" at the plant picture screen.
D. Select the appropriate menu item based on your location as follows:
Location: Menu Choice
CR Direct Connect to Met Data TSC Direct Connect to Met Data EOF Automatic Dial-in to Met Data
E. When the login routine finishes, close the login screen by selecting "OK".
F. From the EDAMS icons, select "Emergency Met Report".
G. Select "James A. FitzPatrick" and "Both" for unit and release height, then select "OK". The emergency meteorology data will be displayed.
H. Ensure that "Continuous Requery?" is enabled.
I. The computer will automatically requery the met system and update the data every 15 minutes on the quarter hour (eg. 1300, 1315, 1330, etc.). A beep may be heard when the update occurs.
4.3 Obtaining Meteorological Data from Nine Mile
4.3.1 From the Control Room, use the direct line phone to Unit 1 or 2 Control Room and request latest 15 minute averaged data.
4.3.2 If for some reason direct line unavailable, from TSC or EOF, use a commercial phone with one of the following numbers:
A. NMPl: 349-2841, 349-2842 or 349-2843
B. NMP2: 349-2168, 349-2169 or 349-2170
Rev. No. 16 Page 6 of 21
EAP-42

OBTAINING METEOROLOGICAL DATA*
4.4 Obtaining Meteorological Data from Analog Strip Charts
4.4.1 Description of analog strip charts and information available.
There are four (4) analog strip chart recorders available in the Control room and TSC to provide meteorological data.
Each of the three recorders (D, G, J) have two channels (A and B) to provide wind speed and direction.
Channel A = wind speed in mph (0-100 mph) traced
Channel B =
Recorder
onleft
wind direction in degrees (5400 range) traced on right
K is provided for stability class determination.
A Provides temperature in 'F at 30' level
B Provides AT in 'F from 30' to 100' level
C Provides AT in 'F from 30' to 200' level
D Selectable sigma theta (wind direction variation)
Trace D has four selectable channels to trace for:
A High main tower (200')
B Mid main tower (100')
C Low main tower (30')
D Backup tower (90')
Page 7 of 21
Recorders used for wind speed and direction
D Main Tower 200' level
G JAF Backup Tower 90' level
J Main Tower 30' or 100' level (selector switch provided)
Recorder K has the following four traces:
EAP-42
Rev. No. 16

OBTAINING METEOROLOGICAL DATA*
4.4.2 Before attempting to obtain data from any of the strip chart recorders, ensure they are functioning by verifying the date and time on the display is correct. The strip chart runs at 1"/hr. Time indicated is Eastern Standard Time.
4.4.3 When manually retrieving meteorological data, primary concern is given to wind speed and direction, and to the stability class at particular elevations, dependent on the type of release.
4.4.4 In order to properly estimate the last 15 minutes on the strip chart, measure the last 1/4" of data for each parameter, if not readily visible, and/or the chart has not already been advanced, do so in order to average the last 15 minutes of data properly. Obtain a minimum of 4 data points within that 1/4' of chart and average.
4.4.5 Meteorological data for a Ground or both a Ground and Elevated release are to be determined as follows:
A. There are 3 recorders, which record wind speed and direction (Recorders D, G, and J) . For each chart, wind speed (the left trace) is labeled Channel A and is in MPH (the range is 0 to 100 MPH and spans the left side of the chart) and wind direction (the right trace) is labeled Channel B and is in degrees (the range is 0 to 540 degrees and spans the right side of the chart). Consult Attachment 4.
To obtain wind direction and speed for a ground or ground and elevated release, you must first determine whether the Recorder "J" toggle switch is set for 30 or 100 foot (Main Tower). If it is set for 30 foot (Main), average the wind speed and direction as per step 4.4.5.
If the Recorder "J" toggle switch is set for 100 foot (Main Tower) and/or there is no 30 foot data, adhere to the following hierarchy of substeps:
1. Average the wind speed and direction as per step 4.4.5 for Recorder "G", which is meteorological data for the JAF Back-up Tower 90 foot level.
Rev. No. 16
EAP-42
Page 8 of 21

OBTAINING METEOROLOGICAL DATA* EAP-42
2. If Recorder "G" is inoperable average the wind speed and direction as per step 4.4.5 for Recorder "D", which is meteorological data for the Main Tower 200 foot level.
3. If both Recorder "G & D" are inoperable average the wind speed and direction as per step 4.4.5 for Recorder "J" which is meteorological data for either the 30 or 100 foot Main Tower levels, as determined by the toggle switch position.
4. If NO strip chart wind speed and direction data is available, proceed to section 4.5 after completing 4.4.8.
4.4.6 Meteorological data for an elevated release is to be determined as follows:
A. There are 3 recorders, which record wind speed and direction (Recorders D, G and J) . For each chart, wind speed (the left trace) is labeled Channel A and is in MPH (the range is 0 to 100 MPH, and spans the left side of the chart) and wind direction (the right trace) is labeled Channel B and is in degrees (the range is 0 to 540 degrees and spans the right side of the chart). Consult Attachment 4.
To obtain wind speed and direction for an elevated release, adhere to the following substeps:
1. Average the wind speed and direction as per step 4.4.5 for Recorder "D", which is
meteorological data for the Main Tower 200 foot level.
Rev. No. 16 Page 9 of 21

OBTAINING METEOROLOGICAL DATA* EAP-42
2. If Recorder "D" is inoperable average the wind speed and direction as per step 4.4.5 for Recorder "G", which is meteorological data for the JAF Back-up Tower 90 foot level.
3. If both Recorder "D & G" are inoperable average the wind speed and direction as per step 4.4.5 for Recorder "ill which is meteorological data for either the 30 or 100 foot Main Tower levels, as determined by the toggle switch position.
4. If NO strip chart wind speed and direction data is available, proceed to section 4.5 after completing 4.4.8.
4.4.7 To determine stability class for either a ground or elevated release, you must utilize Recorder "K" information, which contains 4 channels that span the full chart:
A. Trace labeled "A" provides ambient temperature, on a -40 to +110 scale and indicates the current temperature in degrees F at the Main Tower 30 foot level.
B. Trace "B" provides temperature difference (delta T) between the 30 and 100 foot level on the Main Tower, and is on the -8 to +20 scale in degrees F.
C. Trace "C" provides temperature difference between the 30 and 200 foot level on the Main Tower, and is on the same -8 to +20 scale in degrees F.
Rev. No. 16 Page 10 of 21

OBTAINING METEOROLOGICAL DATA*
D. Trace "D" provides sigma theta (wind direction variation), on a scale of 0 to 30 degrees, at a level dependant on the switch position on the front of the TIGRAPH recording panel:
Switch Position Level Tower
A 200 ft. Main (Primary)
B 100 ft. Main (Primary)
C 30 ft. Main (Primary)
D 90 ft. JAF (Back-up)
Consult Attachment 5.
4.4.8 To derive stability class for either a ground or elevated release, or both, utilize Attachment 4 and adhere to the following hierarchy of substeps:
A. Average the trace "D" (sigma theta) on Recorder "K", utilizing the 0 to 30 scale, as per step 4.4.5, noting the switch position, and consulting Attachment 6 to determine letter stability class.
NOTE: If data is invalid, you may want to switch another switch position to get the most representative data (for the next 15 minute average). For example, for an elevated release you should utilize switch position A, then B, D and finally C, and for a ground release, the progression is C, B, D and then A.
B. If Trace "D" is unavailable, average the Trace "C" (temperature difference 30 - 200 foot) on Recorder "K", utilizing the -8 to +20 degree F scale as per step 4.4.5 and consulting Attachment 6 to determine letter stability class.
C. If Traces "D" and "C" are unavailable, average the Trace "B" (temperature difference 30 - 100 foot) on Recorder "K", utilizing the -8 to +20 degree F scale as per step 4.4.5 and consulting Attachment 6 to determine letter stability class.
Rev. No. 16 Page 11 of 21
EAP-42

OBTAINING METEOROLOGICAL DATA* EAP-42
D. If Traces 'D", "C' and "B" are unavailable, estimate stability by comparing wind direction and speed traces to the samples posted on the side of the TIGRAPH 200 housing and/or utilizing the "Atmospheric Stability Characterization" table on Attachment 6.
E. If All Recorders are unavailable for meteorological data, proceed to section 4.5.
4.5 Obtaining Meteorological Information From Other Sources
4.5.1 If meteorological data is not obtained via the primary method (digital) or secondary method (analog strip charts) information on local wind speed and direction, and stability class can be obtained through other sources.
4.5.2 Meteorological data is also available from any JAF networked PC.
4.5.3 Nine Mile Meteorological Data
A. Telephone the Nine Mile Point Nuclear Station #1 Control Room via the "hot line" or dial phone, and request pertinent meteorological data needed.
B. In addition, supplemental information may be obtained through Nine Mile via their Meteorological Building. Contact one of the following people for assistance:
Tom Galetta - 349-2715 (Office) *Pager # 1193 Joe Blakeley - 349-1179 (Office) *Pager # 1040
* To access the NIMO pager call 1-800-732-4365
4.5.4 National Weather Service Meteorological Data
Data may be obtained via telephone on 716-565-0014. Indicate what meteorological data is needed and note the source of the information.
4.5.5 Stability Estimation
Consult Attachment 6 and estimate stability class via a characterization of the local meteorological conditions.
Rev. No. 16 Page 12 of 21

OBTAINING METEOROLOGICAL DATA* EAP-42
4.6 Meteorological Forecasting
Meteorological forecasting capabilities during an emergency at JAF will be handled from the EOF (primary) or TSC (alternate) by assigned personnel using the Internet or an on-line service.
4.6.1 For assistance in forecasting, contact one of the following people:
Tom Galetta - 349-2715 (Office) *Pager # 1193 Joe Blakeley - 349-1179 (Office) *Pager # 1040
* To access the NIMO pager call 1-800-732-4365
4.6.2 Assigned personnel will establish a connection with the Internet or on-line service to become familiar with the current and forecast weather situation.
4.6.3 Assigned personnel will provide JAF Dose Assessment Group a weather forecast.
4.6.4 Provide weather condition and forecast updates until the event requiring support is formally terminated. The frequency of updates will be based upon factors such as the variability of weather conditions and the needs of JAF emergency personnel.
5.0 ATTACHMENTS
1. MET DATA ACQUISITION QUICK REFERENCE FLOWCHART
2. OBTAINING METEOROLOGICAL DATA FOR MANUAL COMPUTER INPUT
3. GUIDE FOR USING EDAMS COMPUTER TO OBTAIN METEOROLOGY DATA
4. ANALOG WIND SPEED AND DIRECTION, RECORDERS D, G AND J
5. RECORDER "K"
6. CLASSIFICATION OF ATMOSPHERIC STABILITY
7. EXAMPLES OF ATMOSPHERIC STABILITY
Page 13 of 21Rev. No. 16

OBTAINING METEOROLOGICAL DATA* EAP-42
ATTACHMENT 1
MET DATA ACQUISITION QUICK REFERENCE FLOWCHART
Rev. No. 16 Page 14 of 21

OBTAINING METEOROLOGICAL DATA FORMANUAL COMPUTER INPUT
Page 1 of 1
Time:
Release Type:
Meteorology
Wind Speed: MPH @ ft. level on
Other (Specify)
Wind Direction: deg. @ ft level on
Other (Specify)
Stability Class: (A - G)
Method: (Sigma Theta
(Temp. Difference
(Temp. Difference
wind variation)
- 30 - 200 ft)
- 30 - 100 ft)
Estimation
Other (Specify)
Additional information
Date:
Tower
Tower
EAP-42 OBTAINING METEOROLOGICAL ATTACHMENT 2 Rev. No. 16 DATA* Page 15 of 21

OBTAINING METEOROLOGICAL DATA* EAP-42
ATTACHMENT 3 Page 1 of 1 GUIDE FOR USING EDAMS COMPUTER TO
OBTAIN METEOROLOGY DATA
1. If in the CR or TSC, then ensure black switch on met panels is set to
Niagara Mohawk "B " position.
2. Ensure power to computer, monitor, and printer.
3. Select the "Login" icon from the EDAMS icons.
4. Select "Continue" at the plant picture screen.
5. For the CR or TSC select "Direct Connect to Met Data". For EOF select "Automatic Dial-in to Met Data".
6. When prompted, following login, select " Ok".
7. From the EDAMS icons select "E mergency Met Report".
8. Select "Continue" at the plant picture screen.
9. Select "Jam es A. FitzPatrick" and "Both ", then select "Ok".
10. If a stack release is occurring, or projected, then utilize Elevated data.
11. If a release from any source other than the stack is occurring, or projected, then utilize Ground data.
12. If no release is occurring, or projected, then utilize Elevated data.
13. If no data is available from the EDAMS computer, then utilize EAP-42 to obtain meteorological data from other sources.
Rev. No. 16 Page 16 of 21

H
0
H
(3) f2
CN
7
04
H
U CD 0
0 0
H
H
m 0
171
40
At*.
I0 u H
Cf_)
H
0
04
5l-
IL
Hq p
Up H
N
it!
CD
Cl)
0 U
m0
-H
cl
0
................................................................................................
44.................
I�.j
d �
V
..
........ ... .. " ......" . 4... i f-iiL
0
zb
...........

OBTAINING METEOROLOGICAL DATA* EAP-42
ATTACHMENT 5 RECORDER "K"
"1 Ici ~ -, :
DGF
"" E
• . .70 * _zT--."
S.- . ... -. .. . . .. . .
1 1r
- -:EF
IE 1. 34-
'Ti
71.
j * 4 1 rý
1,2 14 1 i'8 20
70 1)0 9 )
L--: U
* t-S•r" S . t
Page 18 of 21
Page 1 of 1
22
I
Rev. No. 16

OBTAINING METEOROLOGICAL DATA*
ATTACHMENT G
CLASSIFICATION OF ATMOSPHERIC STABILITY
Page 1 of 1
CLASSIFICATION OF ATMOSPHERIC STABILITY BY THE VERTICAL TEMPERATURE DIFFERENCE
AND BY THE STANDARD DEVIATION OF THE HORIZONTAL WIND DIRECTION TYPING SCHEMES
STABILITY CLASSIFICATION
Extremely unstable
Moderately unstable
Slightly unstable
Neutral
Slightly stable
Moderately stable
Extremely stable
STABILITY CLASSIFICATION
Extremely unstable
Moderately unstable
Slightly unstable
Neutral
Slightly stable
Moderately stable
.xtremely stable
PASQUILL CATEGORIES
A
B
C
D
E
F
G
Temperature Change with
height °c/100m*
AT/Az •< -1.9
-1.9 < AT/Az _< -1.7
-1.7 < AT/Az • -1.5
-1.5 < AT/Az • -0.5
-0.5 < AT/Az •< 1.5
1.5 < AT/AZ < 4.0
4.0 < AT/Az
PASQUILL Temperature Change with CATEGORIES height 0F/70 Feet**
A
B
C
D
E
F
G
AT/Az • -0.73
-0.73 < AT/Az • -0.65
-0.65 < AT/Az • -0.58
-0.58 < AT/Az -0.19
-0.19 < AT/Az • 0.58
0.58 < AT/Az • 1.53 1.53 < AT/AZ
'0 degrees
nO Ž_ 22.5 22.5 > G O> 17.5
17.5 > GO Ž 12.5
12.5 > nO Ž 7.5
7.5 > GO Ž 3.8 3.8 > nO Ž 2.1
2.1 > nO
'0 degrees Median Value
25.0 20.0
15.0
10.0
5.0
2.5
1.7
Temperature Change with
height 0F/170 Feet t
AT/AZ • -1.77
-1.77 < AT/Az < -1.59
-1.59 < AT/Az • -1.40
-1.40 < AT/Az -0.47
-0.47 < AT/Az • 1.40
1.40 < AT/Az • 3.73
3.73 < AT/Az
ATMOSPHERIC
STABILITY CHARACTERI ZATION
A MID-AFTERNOON ONLY, WITH CLEAR SKIES OR SKIES WITH VERY FEW THIN CLOUDS; LATE
SPRING TO EARLY FALL, WINDS USUALLY ARE BELOW 6 MILES PER HOUR.
B LATE MORNING TO MID-AFTERNOON ONLY, WITH CLEAR OR PARTLY CLOUDY SKIES; MID-SPRING
TO MID-FALL, WINDS ARE USUALLY BELOW 9 MILES PER HOUR.
C LATE MORNING TO LATE AFTERNOON ONLY , WITH PARTLY CLOUDY SKIES; SPRING THROUGH
FALL, WINDS ARE USUALLY BELOW 11 MILES PER HOUR.
D ALL DAYTIME, WITH OVERCAST OR PARTLY CLOUDY SKIES OR EARLY MORNING AND LATE
AFTERNOON WITH CLEAR OR PARTLY CLOUDY SKIES, ALL NIGHT TIME WITH OVERCAST SKIES OR
PARTLY CLOUDY, YEAR AROUND, WINDS ARE MODERATE TO HIGH (GREATER THAN 6 MILES PER
HOUR).
E NIGHT TIME ONLY, WITH THIN OVERCAST OR PARTLY CLOUDY SKIES ALL YEAR AROUND, WINDS
LESS THAN 10 MILES PER HOUR.
F NIGHT TIME ONLY, WITH CLEAR TO PARTLY CLOUDY SKIES, ALL YEAR AROUND, WINDS LESS
THAN 7 MILES PER HOUR.
G NIGHT TIME ONLY, WITH CLEAR SKIES OR VERY FEW THIN CLOUDS, ALL YEAR AROUND, WINDS
LESS THAN 5 MILES PER HOUR.
* PER NRC REGULATORY GUIDE 1.123
ADJUSTED TO CORRESPOND TO THE AT MEASURED BETWEEN THE 30-FOOT AND 100ST LEVELS.
t ADJUSTED TO CORRESPOND TO THE AT MEASURED BETWEEN THE 30-FOOT AND 200FOOT LEVELS.
Page 19 of 21
EAP-42
Rev. No. 16

OBTAINING METEOROLOGICAL DATA*
ATTACHMENT 7 EXAMPLES OF ATMOSPHERIC STABILITY
Page 1 of 2
° 7i4BROOKHAVEN CLASS 1
i) f. 1 0 i lift
STABILITY:
PASQUILL
VERY UNSTABLE
AWIND SPEED WIND DIRECTION
J.21 N
WIND SPEED WIND DIRECTION
PASQUILL B, C
BROOKHAVEN CLASS 2
STABILITY: UNSTABLE
AUGUST 1983
Page 20 of 21
.1I/I
14
$ D : i
i
EAP-42
yJ
Rev. No. 1 6

OBTAINING METEOROLOGICAL DATA*
Attachment 7
EXAMPLES OF ATMOSPHERIC STABILITY PAGE 2 OF 2
BROOKHAVEN CLASS 3
STABILITY: NEUTRAL
PASQUILL D, E
BROOKHAVEN CLASS 4
STABILITY: STABLE
AUGUST 1983
PASQUILL
tF
-j-
WIND SPEEFD WIND DIRECTION
. ..
iL = 03 * II: • £ _.-•.=-..
I .-- o i . . . .
*1• *1]: i " ! : • • 0 .... , .. • .< . . . . ......
rP S -i ; ; i Si t'4 f i
0 40/ o O' 10 24F, G
Page 21 of 21
EAP-42
Rev. No. 16

ENTERGY NUCLEAR NORTHEAST
JAMES A. FITZPATRICK NUCLEAR POWER PLANT
EMERGENCY PLAN IMPLEMENTING PROCEDURE
METEOROLOGICAL MONITORING SYSTEM SURVEILLANCE SAP-10
REVISION 10
REVIEWED BY: PLANT OPERATING REVIEW COMMITTEE
MEETING NO. N/A DATE:
APPROVED BY: DATE: 7 ~'~-c
EFFECTIVE DATE:
FIRST ISSUE 0
)(L �J) O�
FULL REVISION [] LIMITED REVISION LI
PERIODIC REVIEW DUE DATE:
N/A
***************************** *****************************
* INFORMATIONAL USE * * TSR *
* ADMINISTRATIVE * CONTROLLED COPY #
** * ** **** ****** *****

METEOROLOGICAL MONITORING SYSTEM SURVEILLANCE*
REVISION SUMMARY SHEET
REV. NO. 10 * Added 2.2.3 regarding JAF Manual.
0 In section 4.10 - Changed twenty-four hours to twelve quarter hour.
* Moved paper replacement instructions from section 4.12 to separate section, 5.0, and re-numbered remaining steps.
0 In new section 5.0, re-formatted steps and added steps to take to install/work the take-up roller.
* The note preceding step 4.13, changed the times for clarification.
* In section 4.12.1 - added statement depress the MENU/ALT channels switch to obtain self test and status chart printout.
& In section 4.12 - changed hour to time
* Removed section 4.16.4
* In section 4.18 - added statement "this will be completed on either the CR or TSC attachment, not both.
* On Attachment 1 - removed incorrect step references.
9 e Add requirements for checking the MDAS PC output to ERDS.
e Added: meteorological data acquisition system operability in section 1.0
* In section 4.6.6, added information regarding JAF networked computers.
* In section 4.17, added steps to facilitate comparison of the MDAS PC data with the JAF computer output.
0 On attachment 1, page 2 of 2, added MDAS PC checkoffs.
0 Changed RES to Rad Protection, editorial change only.
Page 2 of 22
SAP-10
Rev. No. 10

METEOROLOGICAL MONITORING SYSTEM SURVEILLANCE* SAP-10
TABLE OF CONTENTS
PAGE
PURPOSE ...............................
REFERENCES ............................
INITIATING EVENTS .....................
PROCEDURE .............................
ATTACHMENTS ...........................
1. METEOROLOGICAL MONITORING SYSTEM
SECTION
1.0
2.0
3.0
4.0
5.0
Page 3 of 22
SURVEILLANCE
................. 4
................. 4 .L...o.. . .. . i
S.... 4
... 19
... 20
Rev. No. 10

METEOROLOGICAL MONITORING SYSTEM SURVEILLANCE*
1.0 PURPOSE
The purpose of this procedure is to provide for a quarterly operation and inspection check on the meteorological recorders located in the Control Room and Technical Support Center with computer output from the Constellation (formally Niagara Mohawk) Meteorological System. In addition, the strip chart paper shall be replaced as needed (at approximately four-week intervals). This procedure also provides for a routine surveillance of the emergency dose assessment operability and Meteorological Data Acquisition System (MDAS) operability.
2.0 REFERENCES
2.1 Performance References
2.1.1 EAP-42, OBTAINING METEOROLOGICAL DATA
2.2 Developmental References
2.2.1 IMP-17.10, METEOROLOGY STRIP CHART RECORDER ROUTINE MAINTENANCE AND CALIBRATION
2.2.2 Operations and Maintenance Manual for the NMPCNYPA Meteorological Data Acquisition System
2.2.3 JAF Manual No. W130-0223, Binder W10,Westronics Series 2100
2.2.4 Regulatory Guide 1.23
3.0 INITIATING EVENTS
None
4.0 PROCEDURE
4.1 The Radiation Protection (RP) Manager shall assign a RP Technician to perform this surveillance which includes:
4.1.1 Evaluate the quality and validity of the data being gathered.
4.1.2 Assess the status of the site instrumentation and equipment.
4.1.3 Document and distribute all significant information for use in historical analysis.
Rev. No. 10 Page 4 of 22
SAP-10

METEOROLOGICAL MONITORING SYSTEM SURVEILLANCE*
4.1.4 Determine if unscheduled maintenance is required.
4.2 Direct comparisons of each recorder channel and 17 MDAS-PC3 data are to be performed on a quarterly basis with computer output obtained the same day.
4.3 Data will be collected from recorders in both the Control Room and the Technical Support Center. Assure recorders are operating on Eastern Standard Time.
4.4 In addition, the purpose of this procedure is to assess and document the "usability" of the meteorological data on the recorders as well as the computer. Through this procedure, analysis of the data will yield pertinent information on whether data received is good, bad, suspect, or not available.
4.5 Attachment 1, Meteorological Monitoring System Surveillance, must be completed to document the comparison of data.
4.6 In addition, record any pertinent information concerning the recorder data as well as the computer data on the Attachment 1, Meteorological Monitoring System Surveillance. Record all occurrences at each recorder location which may be of significance to later analysis of
the data or in the operational and maintenance history of any equipment used in this analysis. Record items such as the following:
4.6.1 Paper replacement, repairs and/or calibrations of all equipment.
4.6.2 A description of "NO" or "unsat" entries (indicating no data, or abnormal operation) on Attachment 1, Meteorological Monitoring System Surveillance and action taken, if any.
4.6.3 A description of conditions pertinent to suspect or invalid data.
4.6.4 A description of abnormal conditions.
4.6.5 A brief summary of other tasks performed.
4.6.6 Information which may be helpful or necessary in analyzing meteorological conditions and instrument performance (i.e. Met. tower instruments out of service due to high winds, lightning, etc.).
Rev. No. 10 Page 5 of 22
SAP-10

METEOROLOGICAL MONITORING SYSTEM SURVEILLANCE*
4.7 From a JAF networked computer (PC) print the Meteorological Data Screen from the Plant Parameters selection as follows:
4.7.1 Select "start" then "programs" then "plant information" then "plant parameters".
4.7.2 From the "screens" menu, select "weather".
4.7.3 Click "print" to obtain the printout.
4.7.4 This will provide the required MDAS PC data for comparison to the Meteorological Computer printout.
4.8 From the TSC, perform the following:
Obtain a meteorological computer printout from the Nine Mile Point METE system. (The printout gives average hourly values from all towers for the past 24 hours.) To do this, perform the following steps:
NOTE: Should the LA-100 stall or otherwise lock up during operation, Ctrl-Y will reset the system.
4.8.1 Ensure at least 15 minutes has passed since obtaining the METE printout from step 4.7, above.
4.8.2 Place switch on Black Box Modem labeled LA-100 to the NiMo position.
4.8.3 Press the "RETURN" key on the LA-100 terminal.
4.8.4 Output will be the Nine Mile Point/JAF Meteorological Menu.
4.8.5 Utilize the username and password located on the terminal.
4.8.6 Enter one (1), for Emergency Dispersion Report.
4.8.7 During printout, the "RETURN" key may have to be pressed several times in order to continue the printing process.
4.8.8 This will be followed by the Nine Mile Point/JAF Meteorological menu.
Page 6 of 22
SAP-10
Rev. No. 10

METEOROLOGICAL MONITORING SYSTEM SURVEILLANCE*
4.9 Once the meteorological computer printouts have been
obtained, become familiar with their contents and format.
Note which digits correctly represent the parameter of
interest and which numbers represent column dividers on the printout.
4.10 The printouts provide twelve quarter "hour" averages;
locate where each quarter hour is represented (standard time) in the first column headed by "TIME AVG."
4.11 Choose the quarter hour average on the printout that will
be utilized for all data comparisons, preferably an average
two to three hours earlier than the time of performing this
procedure. Make sure there is sufficient valid data across the chosen row.
4.12 Enter the date and hour chosen on Attachment 1, noting the
computer is on Eastern Standard Time (EST) . Use this same
quarter hour average for both the TSC and Control Room surveillance.
NOTE: Make sure the same quarter hour average contains valid data in the second half of the printout for
the "JAF/Backup Tower Parameters" and "Inland Tower Parameters."
4.13 The following steps apply to each recorder inspected (D, G,
J and K) in the Control Room and the Technical Support Center):
4.13.1 To replace the strip chart paper, refer to section 5.0.
4.13.2 Record whether date and time are being printed properly and the time corresponds to Eastern Standard Time.
NOTE: Recorder speed is set at one inch/hour, and time
is documented on the strip chart once every two hours.
4.13.3 Inspect the scales utilized on the recorders to
see if they are labeled A and B on recorders D, G
and J. In the case of Recorder K, there are four scales (A, B, C and D) all of which are not readily visible.
Rev. No. 10 Page 7 of 22
SAP-10

METEOROLOGICAL MONITORING SYSTEM SURVEILLANCE*
4.13.4 Record any abnormal conditions on Attachment 1 under Remarks/Comments. If corrective action must be taken, record the problem and refer to the Maintenance and Calibration Procedures (IMP 17.10).
4.13.5 Locate the time frame on the strip chart that is being evaluated. This is where you will obtain a 15 minute average of the chart trace to compare the computer printout with.
NOTE: It is important to understand the 15 minute average being utilized on the computer printout is the average calculated for the previous 15 minutes and is represented in Eastern Standard Time. For example, the 15 minute average for 10:00 is the average from 9:45 to 10:00 EST.
4.14 The following steps facilitate comparison of Recorder "D" Data with the NIMO/JAF computer output;
4.14.1 If chart paper was replaced, indicate on Attachment 1.
4.14.2 Indicate on Attachment 1 if recorder Date and Time were correct.
4.14.3 Average both wind speed and wind direction on the strip chart on Recorder D for the time being scrutinized. Record the as found values on Attachment 1.
4.14.4 Using the computer printout, locate the 200 ft. wind speed average for the time being evaluated. Take care in recording the value (either a 1 or 2 digit number). Record the target values on Attachment 1.
4.14.5 Using the computer printout, locate the 200 ft. wind direction average for the time being evaluated. Take care in recording the value (either a 1 or 2 digit number). Record the target values on Attachment 1.
4.14.6 Compare as found values with target values.
Rev. No. 10 Page 8 of 22
SAP-10

METEOROLOGICAL MONITORING SYSTEM SURVEILLANCE*
4.14.7 Wind direction values should agree within ±10.0 of
arc, and wind speed values should agree within ±3.0 MPH.
4.14.8 Check, as applicable, either SAT or UN-SAT on Attachment 1.
4.15 The following steps facilitate comparison of Recorder "G"I Data with JAF computer output;
4.15.1 Repeat 4.13.1 through 4.13.5, for recorder "G."
4.15.2 If chart paper was replaced, indicate on Attachment 1.
4.15.3 Indicate on Attachment 1 if recorder Date and Time were correct.
4.15.4 Average both wind speed and wind direction on the strip chart on Recorder G for the time being scrutinized. Record the as found values on Attachment 1.
4.15.5 Using the computer printout, locate the 200 ft. wind speed average for the time being evaluated. Take care in recording the value (either a 1 or 2 digit number). Record the target values on Attachment 1.
4.15.6 Using the computer printout, locate the 200 ft. wind direction average for the time being evaluated. Take care in recording the value (either a 1 or 2 digit number). Record the target values on Attachment 1.
4.15.7 Compare as found values with target values.
4.15.8 Wind direction values should agree within ±10.0 of
arc, and wind speed values should agree within ±3.0 MPH.
4.15.9 Check, as applicable, either SAT or UN-SAT on Attachment 1.
4.16 The following steps facilitate comparison of Recorder "J" Data with JAF computer output;
4.16.1 Repeat 4.13.1 through 4.13.5, for Recorder "J."
Rev. No. 10 Page 9 of 22
SAP-10

METEOROLOGICAL MONITORING SYSTEM SURVEILLANCE*
4.16.2 If chart paper was replaced, indicate on Attachment 1.
4.16.3 Indicate on Attachment 1 if recorder Date and Time were correct.
4.16.4 Note the position of the toggle switch (located between Recorders J and K) for Recorder J. Indicate either the 30 or 100 foot switch position on Attachment 1.
4.16.5 Average both wind speed and wind direction on the strip chart on Recorder J for the time being scrutinized. Record the as found values on Attachment 1.
4.16.6 Using the computer printout, locate wind speed average for the time being evaluated based upon the toggle switch mode (30ft or 100ft) . Take care in recording the value (either a 1 or 2 digit number). Record the target values on Attachment 1.
4.16.7 Using the computer printout, locate wind direction average for the time being evaluated based upon the toggle switch mode (30ft or 100ft) . Take care in recording the value (either a 1 or 2 digit number). Record the target values on Attachment 1.
4.16.8 Compare as found values with target values.
4.16.9 Wind direction values should agree within ±10.0 of arc, and wind speed values should agree within ±3.0 MPH.
4.16.10 Check, as applicable, either SAT or UN-SAT on Attachment 1.
4.17 The following steps facilitate comparison of Recorder "K" Data with JAF computer output;
4.17.1 Repeat 4.13.1 through 4.13.5 for Recorder "K."
4.17.2 If chart paper was replaced, indicate on Attachment 1.
4.17.3 Indicate on Attachment 1 if recorder Date and Time were correct.
4.17.4 Record the switch position and the respective measured parameter on Attachment 1.
Page 10 of 22
SAP-10
Rev. No. 10
METEOROLOGICAL MONITORING SYSTEM SURVEILLANCE*
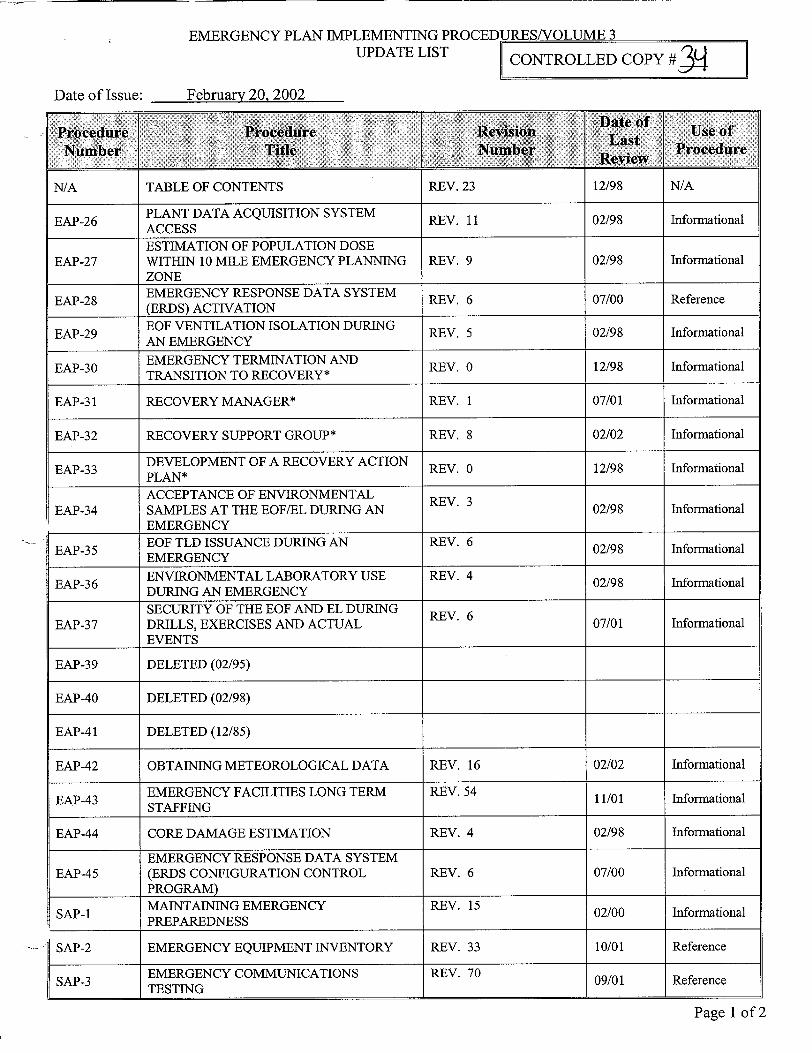
4.17.5 Carefully inspect the strip chart for Recorder K
and note the various scales;
"* All four scales may not be visible (unless the paper has been extracted for paper replacement).
"* Channel A scale represents the temperature scale.
"* Channel B represents the scale for the 30-100 ft. temperature difference.
"* Channel C represents the scale for the 30-200 ft. temperature difference.
"* Channel D represents the scale for sigma theta (wind variation).
NOTE: The traces for each channel are labeled. Channels
B and C scales are equivalent. Read the values directly.
4.17.6 Locate all four scales (A-D) and carefully determine the 15 minute average for each scale and
parameter being evaluated at the time chosen.
4.17.7 Record on Attachment 1 the following as found values:
* Temperature (Channel A)
0 30-100 ft. temperature difference (Channel B)
* 30-200 ft. temperature difference (Channel C)
* Sigma theta for the appropriate switch position (Channel D).
NOTE: When recording temperature difference, record to the nearest tenth.
4.17.8 Using the computer printout, locate temperature, the temperature difference between 30 and 100 foot
and the temperature difference between 30 and 200
foot on the printout for the time chosen. Record the target values on Attachment 1
Rev. No. 10 Page 11 of 22
SAP-10

METEOROLOGICAL MONITORING SYSTEM SURVEILLANCE*
4.17.9 Note switch position for Recorder K (A, B, C or D) . This switch determines which sigma theta (or wind direction variation) is being measured:
"* "Al denotes the 200 ft. Sigma theta
"* "B" denotes the 100 ft. Sigma theta
"* "C" denotes the 30 ft. Sigma theta
"I "D" represents the JAF backup Sigma theta at 90
ft.
4.17.10 Based upon the switch position, locate the appropriate Sigma theta from the computer printout for the 15 minute average being utilized for the data comparison. Record the target value to the nearest tenth.
4.17.11 Compare as found values with target values:
"* Temperature values should agree within ±2.0°F
"• Both temperature difference values should agree within ±1.0 F.
* Sigma theta (or wind direction variation) values should agree within ±20 of arc.
4.17.12 Check, as applicable, either SAT or UN-SAT on Attachment 1.
4.18 Repeat 4.12 through 4.17 for the recorders in the Technical Support Center.
4.19 The following steps facilitate comparison of the MDAS PC data, obtained in step 4.7, with the computer printout.
4.19.1 Record the following as found meteorological parameters from the MDAS PC printout (Plant Parameter Weather Data) on Attachment 2:
Page 12 of 22
SAP-10
Rev. No. 10

METEOROLOGICAL MONITORING SYSTEM SURVEILLANCE*
* 200 ft. Wind Speed
* 200 ft. Wind Direction
* 200 ft. Sigma Theta
* 30 ft. Wind Speed
* 30 ft. Wind Direction
* 30 ft. Sigma Theta
* 30 ft. Absolute Temperature
4.19.2 Using the computer printout, locate the
corresponding parameters from step 4.19.1 for the
time period shown on the MDAS printout. Take care
in recording the value (either a 1 or 2 digit number). Record the target values on Attachment 2.
4.19.3 Compare as found values with target values:
"* Wind direction values should agree within ±10.0 of arc.
"* Wind speed values should agree within ±3.0 MPH.
"* Sigma theta values should agree within ± 2 of arc.
"* Temperature should agree within ± 2F.
4.19.4 Check, as applicable, either SAT or UN-SAT on Attachment 2.
4.20 Attachment 1 and Attachment 2 shall be completed for the
Control Room recorders, MDAS PC and Technical Support Center recorders; then submitted for review by the
Emergency Planning Coordinator or designee.
4.21 Obtain an Emergency Meteorological Report using EDAMS (see EAP-42, Obtaining Meteorological Data).
4.21.1 Ensure time and date are correct (time should be within 15 minutes of real time).
4.21.2 Obtain a printout of the "Last 15 Minute Emergency
Meteorological Report Data" and attach it to the
surveillance.
Rev. No. 10 Page 13 of 22
SAP-10

METEOROLOGICAL MONITORING SYSTEM SURVEILLANCE*
5.0 PAPER REPLACEMENT
5.1.1 Turn the printer OFF as follows:
"* Press the MENU key on the front panel;
"* Use Up or Down Arrow key to scroll to PRINTER ON/OFF and press the ENTER key;
"* Use the Up or Down Arrow key to scroll to OFF and press the ENTER key.
5.1.2 Open the recorder and press the Chart Magazine Release Latch, Figure 1.
5.1.3 Remove the Chart Magazine, Figure-i.
-CHART WAGAZINE
CHART MACAZIN RELEASE LAMCM
Chart Magazine and Release Latch
5.1.4 Remove the take-up reel by pressing lightly on the clutch flange, Figure-2.
Take.-up Reel Removal
Page 14 of 22
�JTCH KAWO. y _/l~- -7
SAP-10
Rev. No. 10
METEOROLOGICAL MONITORING SYSTEM SURVEILLANCE*
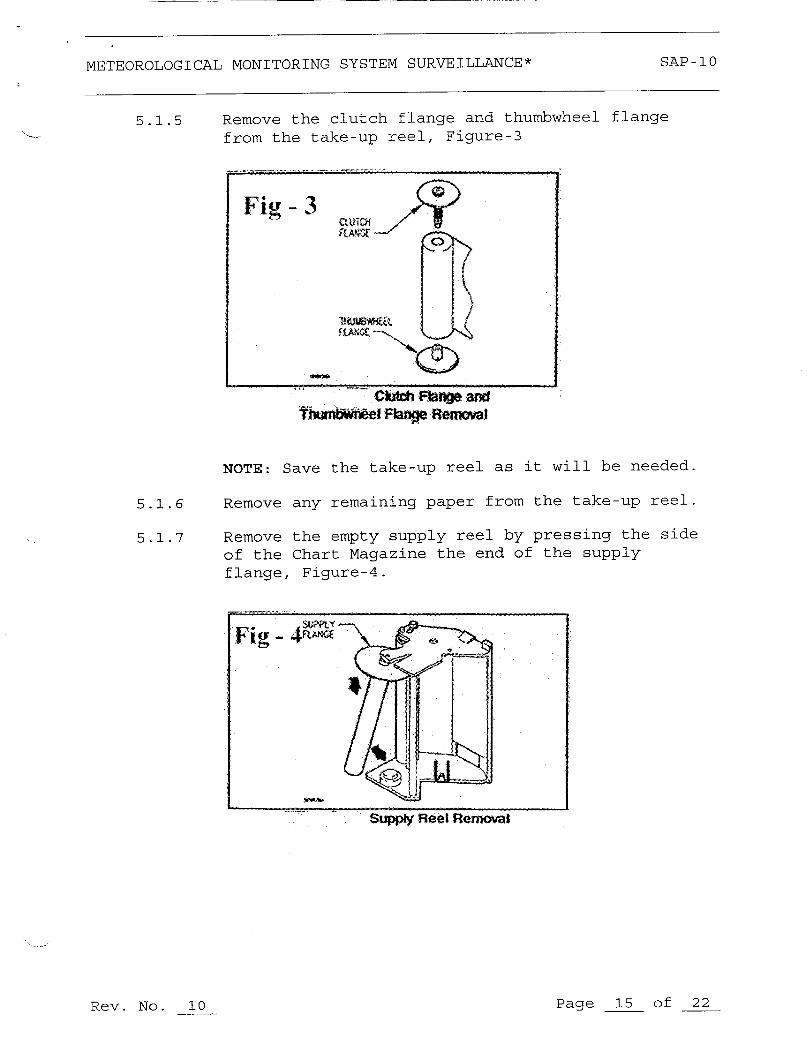
Remove the clutch flange and thumbwheel flange from the take-up reel, Figure-3
5.1.5
5.1.6
5.1.7
NOTE: Save the take-up reel as it will be needed.
Remove any remaining paper from the take-up reel.
Remove the empty supply reel by pressing the side of the Chart Magazine the end of the supply flange, Figure-4.
Supply Reel Removal
Page 15 of 22
Fig- 3 4AUTC
Thu�0�& �AKCL
Chtch Flange and lTnIjrWl Flange Removal
Fig - 4
SAP-10
Rev. No. 10

METEOROLOGICAL MONITORING SYSTEM SURVEILLANCE*
5.1.8
5.1.9
Remove the supply flange form the supply reel, Figure-5.
Suppy Flange Remml
Remove a new roll of paper from the box and release the tape (Paper Stock #J0170999).
5.1.10 Fold the edges of the new roll toward the center to forma point, Figure-6.
FoWed Paper Edges5.1.11 Insert the supply flange onto the new roll.
Page 16 of 22
Fig- 5
SAP-10
Rev. No. 10

METEOROLOGICAL MONITORING SYSTEM SURVEILLANCE*
5.1.12 Install the supply roll into the Chart Magazine by inserting the end with the supply flange first, Figure-7.
Replacing Supply Rol
5.1.13 Route the chart paper back and under the guide rod, Figure-8.
Chart Paper Rotn
5.1.14 Wrap the paper around the Chart Magazine, Figure9.
Page 17 of 22
Fig- 7 FLN<
iFig - 8
SAP-10
Rev. No. 10

METEOROLOGICAL MONITORING SYSTEM SURVEILLANCE* SAP-10
5.1.15 Insert the pointed end of the chart paper into the take-up reel, Figure-10.
5.1.16 Reinsert the clutch flange and thumbwheel flange into the take-up reel, Figure-10.
Clutch Flange and Thurb iee Flange Replacement
5.1.17 Insert the thumbwheel flange end of take-up reel into the slotted end of the Chart Magazine and rotate clutch flange end into place, Figure-11.
F - I ItCLUTCH4 FLANG -7
Inserting Take-up Reel
Page 18 of 22Rev. No. 10

METEOROLOGICAL MONITORING SYSTEM SURVEILLANCE*
5.1.18 Reinsert the Chart Magazine into the Recorder.
5.1.19 Turn the thumbwheel flange to ensure the paper is taut.
5.1.20 Close the Recorder door.
5.1.21 Turn the printer ON as follows:
"* Press the MENU key on the front panel;
"* Use Up or Down Arrow key to scroll to PRINTER ON/OFF and press the ENTER key;
"* Use the Up or Down Arrow key to scroll to ON and press the ENTER key.
5.1.22 Initial, date and record the strip chart ID and location on the new strip chart roll just replaced.
5.1.23 Inspect the paper for print quality.
5.1.24 Label the spent paper roll with the following:
"* Date
"* Time
"* Recorder letter
"• Location of Recorder (CTRL Rm or TSC)
5.1.25 Return the spent paper to Emergency Planning.
6.0 ATTACHMENTS
1. METEOROLOGICAL MONITORING SYSTEM SURVEILLANCE
2. MDAS PC SURVEILLANCE
Rev. No. 10 Page 19 of 22
SAP-10

METEOROLOGICAL MONITORING SYSTEM SURVEILLANCE*
METEOROLOGICAL MONITORING SYSTEM SURVEILLANCE
SAP-10
Page 1 of
Location: Technical Support Center / Control Room
Date: and hour chosen for comparison EST (am/pm)
RECORDER D
As Sat Un-sat Recorder "D" Target Found +/- (,') (v)
200 ft. Wind Speed (MPH) 3.0 200 ft. Wind Direction (Degrees) 10 o
Date and Time Proper?
Recorder D Returned to Normal
RECORDER Q
As Sat Un-sat Recorder "G" Target Found +/-7 (10(¢
90 ft. Wind Speed (MPH)
90 ft. Wind Direction (Degrees)
Strip Chart Paper Replaced?
Date and Time Proper?
Recorder G Returned to Normal
3.04 -
10 A
7,, /
7, 7
Remarks/Comments:
SAP-10 METEOROLOGICAL MONITORING ATTACHMENT 1 Rev. No. 10 SYSTEM SURVEILLANCE* Page 20 of 22
(circle one)

METEOROLOGICAL MONITORING SYSTEM SURVEILLANCE*
METEOROLOGICAL MONITORING SYSTEM SURVEILLANCE Page 2 of 2
RECORDER J
Toggle Switch Position: 30 ft 100 ft (circle one)
As Sat Un-sat Recorder "J" Target Found +/- (1) (v')
Wind Speed (MPH) 3.0
Wind Direction (Degrees) 10o Strip Chr aprRplcd Date and Time Proper?.
Recorder J Returned to Normal
RECORDER K
Switch Position: A-=200 B=100 C=30 D=JAF Backup (Circle One)
As Sat Un-sat Recorder "K" Target Found +/-(1) (,.
Temperature (Degrees F) 20o
30-100 ft. Temp. Diff. (Degrees F) 10o
30-200 ft. Temp. Diff. (Degrees F) 10
Siama Theta (Dearee Arc) 20
Strip Chart Paper Replaced?
Date and Time Proper?
Recorder K Returned to Normal
Remarks/Comments:
Date: Completed by:
Date: Review by:
SAP-10 METEOROLOGICAL MONITORING ATTACHMENT 1
Rev. No. 10 SYSTEM SURVEILLANCE* Page 21 of 22
SAP-10
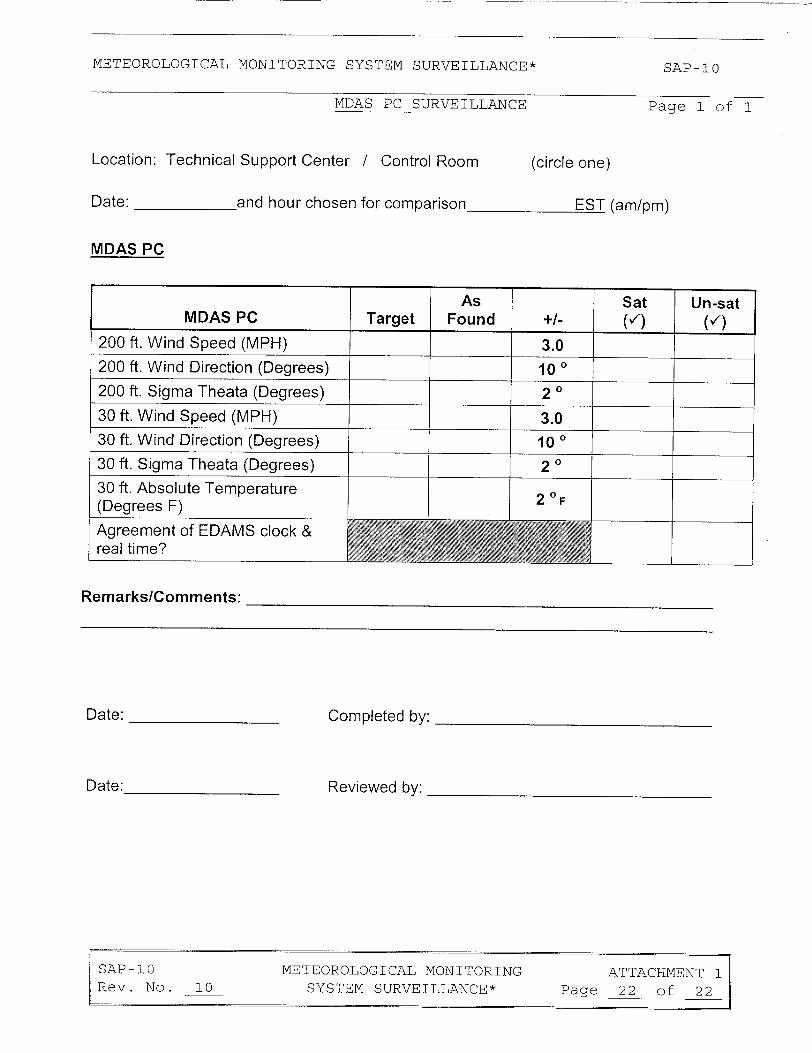
METEOROLOGICAL MONITORING SYSTEM SURVEILLANCE* SP1
MDAS PC SURVEILLANCE
Location: Technical Support Center / Control Room
Page 1 of 1
(circle one)
Date: and hour chosen for comparison EST (am/pm)
MDAS PC
As Sat Un-sat MDAS PC Target Found +/- (v') (v')
200 ft. Wind Speed (MPH) 3.0 200 ft. Wind Direction (Degrees) 10 0 200 ft. Sigma Theata (Degrees) 20 30 ft. Wind Speed (MPH) 3.030 ft. Wind Direction (Degrees)
30 ft. Sigma Theata (Degrees)
30 ft. Absolute Temperature (Degrees F)
± + 4 4 1 ____
_________________ -I4 _________________ 4 _______ L
Agreement of EDAMS clock & real time?
Remarks/Comments:
Date: Completed by:
Reviewed by:Date:
100
20
2 0 F
SAP-10 METEOROLOGICAL MONITORING ATTACHMENT 1 Rev. No. 10 SYSTEM SURVEILLANCE* Page 22 of 22
SAP-10