Embed Size (px)
Citation preview

© 2018 QUANTA TECHNOLOGY, LLC
QUANTA TECHNOLOGY, LLC 4020 WESTCHASE BOULEVARD, SUITE 300, RALEIGH, NC 27607 USA
Oakland | Chicago | Boston | Toronto
www.Quanta-Technology.com
Quanta Technology, LLC is a wholly-owned subsidiary of Quanta Services, Inc. (NYSE: PWR)
PREPARED FOR: American Coalition for Clean Coal
Electricity (ACCCE)
REPORT DATE: April 23, 2018
PREPARED BY:
Henry Chao
(518) 598-4796
Hisham Othman
(919) 334-3078
Ensuring Reliability and
Resilience
A Case Study of the PJM Power Grid

ENSURING RELIABILITY AND RESILIENCE –
A CASE STUDY OF THE PJM POWER GRID
CONFIDENTIAL/PROPRIETARY © 2018 QUANTA TECHNOLOGY, LLC PAGE ii
Report Contributors:
Henry Chao
Tom Gentile
Robert Hass
Len Januzik
Tony Jiang
Hisham Othman
Ehsan Raoufat
ENSURING RELIABILITY AND RESILIENCE –
A CASE STUDY OF THE PJM POWER GRID
CONFIDENTIAL/PROPRIETARY © 2018 QUANTA TECHNOLOGY, LLC PAGE iii
Key Terms:
Reliability Adequacy and Security are two key aspects of reliability that broadly
ensure the continued operation of the system over a broad spectrum
of System conditions and following a wide range of probable
Contingencies.
Transmission Security Planning and Operating the system in a way that anticipates the
possibility of failure of key system elements in order to minimize the
loss of service to large groups of customers, to not cause any area of
the Interconnected system to become unstable and lose its integrity,
and to not cause generation or transmission equipment to operate
outside their normal limits.
Resource Adequacy Addresses the amount of capacity needed to serve a forecasted
peak load while meeting the required Loss of Load Expectation
(LOLE) criterion. The LOLE criterion defines the adequacy of capacity
that ensures that load cannot exceed available capacity, on
average, more than one day in 10 years.
Resilience The capability of an energy system to tolerate disturbances and to
continue to deliver energy services to consumers. Resilience, in the
context of the bulk electric system, relates to preparing for, operating
through and recovering from a high-impact, low-frequency event.
Fuel-Secure The capability of the resource to store fuel on-site in order to limit the
exposure to a single common event, and maintain its ability to deliver
maximum energy output, independent of the external fuel delivery
infrastructure.
Thermal Overload Power flows above transmission conductor thermal limits.
Grid Stability The ability to balance power generation and power consumption
dynamically in real time and to maintain system frequency within
acceptable limits.
Energy-Only Resource Refers to a generation resource that either did not offer or was not
selected in the capacity auction, and thus does not have the
obligation to generate electricity when requested (i.e., Capacity
Performance), but can bid into the energy market.
Single-Fuel Gas Unit A generator whose sole fuel source is natural gas, and which does
not have an on-site fuel storage capability.

ENSURING RELIABILITY AND RESILIENCE –
A CASE STUDY OF THE PJM POWER GRID
CONFIDENTIAL/PROPRIETARY © 2018 QUANTA TECHNOLOGY, LLC PAGE iv
TABLE OF CONTENTS
List of Figures ............................................................................................................................... v
List of Tables ................................................................................................................................ v
ABSTRACT ...................................................................................................................... vi
EXECUTIVE SUMMARY.................................................................................................... 1
1 STUDY SCOPE, ASSUMPTIONS, AND PROCEDURE .................................................. 7
1.1 Scope ................................................................................................................................. 7
1.2 Assumptions ..................................................................................................................... 10
1.3 Procedure ........................................................................................................................ 12
2 TRANSMISSION SECURITY CHALLENGES ............................................................... 14
3 RESOURCE ADEQUACY CHALLENGES .................................................................. 20
4 CONCLUDING REMARKS....................................................................................... 24
APPENDIX A: PJM RESOURCES, AT-RISK COAL, AND GAS CAPACITY ..................... 25
APPENDIX B: RESOURCE ADEQUACY DATA AND MODELING .................................. 31
APPENDIX C: REPORT CONTRIBUTOR BIOS ................................................................. 34
ENSURING RELIABILITY AND RESILIENCE –
A CASE STUDY OF THE PJM POWER GRID
CONFIDENTIAL/PROPRIETARY © 2018 QUANTA TECHNOLOGY, LLC PAGE v
List of Figures
Figure 1-2. Coal Capacity Retirement Studied ...................................................................... 12
Figure 2-1. Overloads in the PJM Footprint (Scenario 1-3) .................................................... 17
Figure 2-2. Utilities with Load Shedding to Mitigate Overloads (Scenario 1-3) .................. 18
Figure A-1. Capacity and Average Heat Rate of Coal Fleet .............................................. 28
Figure B-1. PJM Operating Companies and Capacity Auction Areas ............................... 31
Figure B-2. PJM Resource Analysis Model ............................................................................... 32
List of Tables
Table 1-1. Load and Resources for Winter and Summer Scenarios....................................... 9
Table 2-1. Transmission Security Violations and Mitigations for Winter Reference Cases . 15
Table 2-2. Transmission Contingency Analysis for Summer Base Cases– Scenarios 7-9 .... 16
Table 2-3. Transmission Contingency Analysis for Winter Base Cases– Scenario 4-6......... 16
Table 3-1. Summary of LOLE in Each Scenario ....................................................................... 21
Table A-1. PJM’s Area Resource Model .................................................................................. 27
Table B-1. PJM’s Seasonal Resources by Fuel Type ............................................................... 33

ENSURING RELIABILITY AND RESILIENCE –
A CASE STUDY OF THE PJM POWER GRID
CONFIDENTIAL/PROPRIETARY © 2018 QUANTA TECHNOLOGY, LLC PAGE vi
ABSTRACT
The power industry’s currently-mandated reliability standards, while robust, don’t entirely
address the current and near-future1 challenges facing the industry as a whole. Certain
deficiencies (blind spots) in the power industry’s reliability practices may have led many
to believe that the power grid is more resilient and reliable than it actually is. For instance,
current reliability standards fail to consider such combined events as fuel unavailability
(e.g., natural gas pipeline disruptions, extreme and prolonged cold or hot weather, or
other emergency situations such as hurricanes or earthquakes) plus coal/nuclear
generation capacity retirement. And while market pressures and public policy changes
will likely make some of these retirements inevitable over the long run, the power industry
must recognize that much of the power grid’s current resilience and reliability comes from
the presence of these on-site fuels (oil, coal, nuclear). It is therefore vital that, during the
transition to our energy future, we don’t “pull the rug out” from under the mechanisms
that are currently helping to provide the reliability and resilience necessary for a well-
functioning grid.
This report provides insight on the various issues facing the electric power industry as it
investigates the reliability and resilience issues highlighted by the DOE and FERC. Taking
into consideration the many comments filed with FERC by various parties, this report
focuses on one particularly useful approach in analyzing the resilience of the power grid.
This is an independent report by the authors at Quanta Technology, supported by
funding from the ACCCE. The report, however, reflects the analysis and judgment of the
authors only.
1 Near Term is 1-4 years from current time.

ENSURING RELIABILITY AND RESILIENCE –
A CASE STUDY OF THE PJM POWER GRID
CONFIDENTIAL/PROPRIETARY © 2018 QUANTA TECHNOLOGY, LLC PAGE 1
EXECUTIVE SUMMARY
To understand the reliability and resilience issues facing the electric grid, it is important to
establish certain terms and concepts. One of the most important concepts to understand
is fuel security. Electricity generation from coal is considered “fuel-secure” because the
fuel (coal) can be kept on-site, and is always available for electricity generation.
Electricity generated from natural gas, on the other hand, is not considered fuel-secure
because the supply of natural gas used for electricity generation is being delivered “just-
in-time” (i.e., not stored on-site) and often being delivered using interruptible pipeline
capacity, making it vulnerable to interruptions or disruptions. Similarly, renewable
resources (wind, solar, etc.) cannot be stored on-site and are, obviously, inconsistent in
their energy production from one hour or day to the next due to the intermittent nature
of the energy resource. (And while energy storage may someday be able to contribute
significantly to reliability and resilience, that day is many years in the future.)
As such, the rapid introduction of renewables and an increased reliance on natural gas
as an economic fuel source for generating electricity provide significant opportunities for
– as well as significant risks to – North American electric power systems and electric power
markets. Put simply, these new sources of electricity have created a condition of
oversupply, which in turn lowers prices, which in turn threatens the viability of certain types
of electricity generation. As a result, fuel-secure generation capacity, such as coal, is
dwindling, and with it, some of the electric grid’s reliability and resilience.
This report explores whether electric grid reliability and resilience could be threatened by
“prematurely” retiring fuel-secure coal electricity generation. By performing analyses on
a number of different scenarios for the PJM grid, the study demonstrates that the current
electric grid could violate the industry’s reliability standards if coal capacity retirement is
accelerated and natural gas electric generation experiences a sustained curtailment.
This report considers two scenarios of accelerated coal retirements out of the existing
61 GW of coal capacity in PJM: 15 GW (25%) and 30 GW (50%), selected based on unit
age, efficiency, and size.
The North American Electric Reliability Corporation (NERC), together with its regional
reliability entities, sets and enforces mandatory reliability standards (i.e., the performance
requirements for the electric power industry). The electric grid is deemed reliable if the
reliability standards are met. The reliability standards do, of course, set forth reliability
criteria and influence system design, but the current system design fails to address such
issues as fuel security, and the reliability consequences of such issues have been

ENSURING RELIABILITY AND RESILIENCE –
A CASE STUDY OF THE PJM POWER GRID
CONFIDENTIAL/PROPRIETARY © 2018 QUANTA TECHNOLOGY, LLC PAGE 2
demonstrated in this study. Over-reliance on non-fuel secure resources might ultimately
jeopardize the reliability of the system.
In contrast to the grid reliability standards, there currently are not any resilience standards
for the bulk electric system. The industry loosely deems grid resilience as the ability of the
electric system to withstand and recover from unexpected disturbances outside the
design conditions, including but not limited to extreme weather events that disrupt power
supply on a large scale. Simply put, the level of resilience reflects the extent of
redundancy embedded within the electric grid beyond what the design criteria for
reliability require.
The current state of capacity oversupply in the power markets has a masking effect with
regards to grid reliability and resilience risk. As the markets move towards a capacity
equilibrium, the grid is being left with a higher proportion of less-fuel-secure and energy-
limited generators. This could quickly create numerous issues in terms of unsolved or
unmitigated contingencies, which could eventually lead to a much less reliable electric
grid. The resulting concerns might include a need for extensive transmission upgrades
and tremendous stress on the natural gas supply and delivery. Increased demand for
natural gas could further stress supply issues and exacerbate transmission security and
resource adequacy concerns as we face increased fuel unavailability and/or insufficient
capacity to serve the load.
GRID SECURITY CHALLENGES
Currently, NERC reliability standards for grid planning do not consider the inventory of
resources for the production of electric generation to support transmission security, as
long as a generator is accepted by the power market as capacity resource. That is, the
risk of fuel unavailability, interruption, and disruption is not incorporated into the
assessment for transmission security. This is a significant problem that has been given very
little consideration. The natural gas vulnerability discussions in recent years
notwithstanding, fuel security is not explicitly factored into the testing of future grid
reliability and resilience.
Among the nine scenarios studied for this report (see Table 1-1), six were screened for
transmission security criteria violations wherein single and multiple electric transmission
element contingencies were simulated. Under these scenarios, almost all of the utilities
serving PJM’s 13 states and the District of Columbia experienced certain levels of thermal
overload under the contingency conditions (i.e., power flows above transmission
conductor thermal limits). Some of the overloads were able to be mitigated by
generation dispatch (put simply, locating and rerouting alternative sources of electricity),
ENSURING RELIABILITY AND RESILIENCE –
A CASE STUDY OF THE PJM POWER GRID
CONFIDENTIAL/PROPRIETARY © 2018 QUANTA TECHNOLOGY, LLC PAGE 3
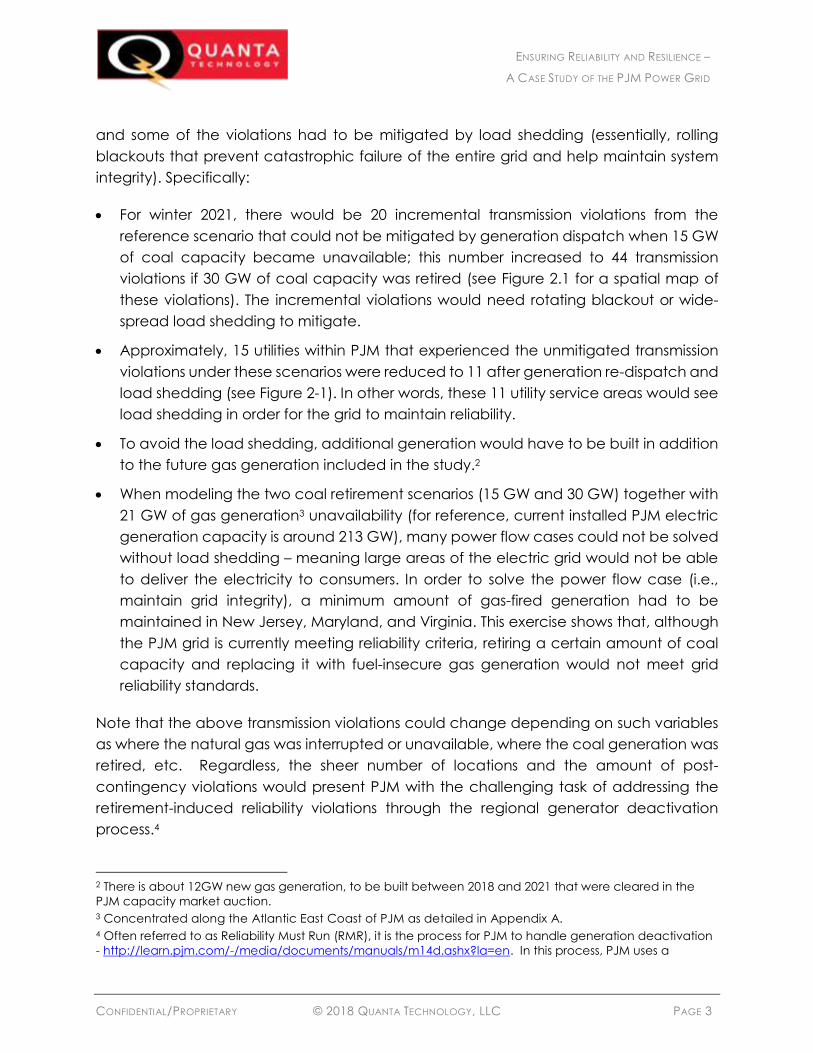
and some of the violations had to be mitigated by load shedding (essentially, rolling
blackouts that prevent catastrophic failure of the entire grid and help maintain system
integrity). Specifically:
For winter 2021, there would be 20 incremental transmission violations from the
reference scenario that could not be mitigated by generation dispatch when 15 GW
of coal capacity became unavailable; this number increased to 44 transmission
violations if 30 GW of coal capacity was retired (see Figure 2.1 for a spatial map of
these violations). The incremental violations would need rotating blackout or wide-
spread load shedding to mitigate.
Approximately, 15 utilities within PJM that experienced the unmitigated transmission
violations under these scenarios were reduced to 11 after generation re-dispatch and
load shedding (see Figure 2-1). In other words, these 11 utility service areas would see
load shedding in order for the grid to maintain reliability.
To avoid the load shedding, additional generation would have to be built in addition
to the future gas generation included in the study.2
When modeling the two coal retirement scenarios (15 GW and 30 GW) together with
21 GW of gas generation3 unavailability (for reference, current installed PJM electric
generation capacity is around 213 GW), many power flow cases could not be solved
without load shedding – meaning large areas of the electric grid would not be able
to deliver the electricity to consumers. In order to solve the power flow case (i.e.,
maintain grid integrity), a minimum amount of gas-fired generation had to be
maintained in New Jersey, Maryland, and Virginia. This exercise shows that, although
the PJM grid is currently meeting reliability criteria, retiring a certain amount of coal
capacity and replacing it with fuel-insecure gas generation would not meet grid
reliability standards.
Note that the above transmission violations could change depending on such variables
as where the natural gas was interrupted or unavailable, where the coal generation was
retired, etc. Regardless, the sheer number of locations and the amount of post-
contingency violations would present PJM with the challenging task of addressing the
retirement-induced reliability violations through the regional generator deactivation
process.4
2 There is about 12GW new gas generation, to be built between 2018 and 2021 that were cleared in the
PJM capacity market auction. 3 Concentrated along the Atlantic East Coast of PJM as detailed in Appendix A. 4 Often referred to as Reliability Must Run (RMR), it is the process for PJM to handle generation deactivation
- http://learn.pjm.com/-/media/documents/manuals/m14d.ashx?la=en. In this process, PJM uses a

ENSURING RELIABILITY AND RESILIENCE –
A CASE STUDY OF THE PJM POWER GRID
CONFIDENTIAL/PROPRIETARY © 2018 QUANTA TECHNOLOGY, LLC PAGE 4
It is worth pointing out that not all generation technologies provide the same level of
essential reliability services to the electric grid in terms of stabilizing inertia, voltage
support, ramping, and frequency regulation. For instance (though not studied for this
report), the synthetic inertia provided by the inverters used by wind and solar generators
does not have magnetic inertia to sustain large electrical short-circuit disturbances, and
thus cannot recover voltage as fast as large generating units. At the current stage of
technology, keeping the generators running ensures enough rotating synchronous
torque in the grid, which is critical for grid stability.
CHALLENGES TO MAINTAIN ADEQUATE GENERATION RESOURCES
As the generation mix moves away from on-site fuel and toward “just-in-time” fuel
delivery, ignoring fuel security issues is problematic. The current industry practice for
measuring generator performance is flawed,5 as the data reporting and generator
performance calculations explicitly ignore fuel unavailability. This omission can lead to
over-estimation of the true performance of the generation resources, resulting in a less-
reliable or resource-inadequate electric grid.
As shown in Table 3-1, if the fuel security issue was recognized in the resource adequacy
assessment of PJM, any small amount of coal capacity retirement in PJM could lead to
a reliability criterion violation6 and result in more frequent loss-of-load services than the
reliability criterion allows. As the amount (and location) of coal plant retirement increased
to 15 and 30 GW, the loss-of-load frequency increased to 0.4 day and 0.6 day per year,
or 4 times and 6 times worse than the reliability criterion, respectively. Specifically:
standard set of criteria to identify potential transmission system problems due to a specific generator
retiring. To keep the grid reliable, PJM orders transmission upgrades or additions to be built by Transmission
Owners, to accommodate generating plant retirements. 5 A generator’s reliability performance is measured by Generator Equivalent Forced Outage Rate under
demand, (EFORd) based on its operating records. Currently, NERC practice treats fuel supply unavailability
or interruption as “outside of management control” events that have no bearing on the generator
performance. For example, during the recent cold snap some gas generation in PJM was still considered to
be reliable reserve capacity, because it was not dispatched (called to run) by PJM due to high gas
prices. High gas prices caused this gas generation to offer in to the energy market at prices higher than
coal generation, causing coal generation to be dispatched ahead of gas generation, and the expensive
gas generation to remain offline. Since, this gas generation was not dispatched by PJM and remained
offline because of its high price, there is no way of knowing whether it could have obtained fuel, if PJM had
called it to run. 6 A system is resource adequate if the probability of having sufficient transmission and generation to meet
expected demand. The corresponding reliability standard, which is expressed as a loss-of-load expectation
(“LOLE”), requires an involuntary load disconnection event not more than one day every 10 years, or 0.1
day per year. That is, any wide spread loss-of-load of 300 MW or greater that lasts 3 to 24 hours is
considered one event. One MW of generation on average will serve 1000 to 1500 homes.

ENSURING RELIABILITY AND RESILIENCE –
A CASE STUDY OF THE PJM POWER GRID
CONFIDENTIAL/PROPRIETARY © 2018 QUANTA TECHNOLOGY, LLC PAGE 5
For winter 2021, there would be 0.18 day of expected loss-of-load events, which
violates the reliability criterion of 0.1 day.
If 15 GW of coal was retired, the loss-of-load events would increase to 0.421 day under
the same condition as above.
If 30 GW coal was retired, the loss-of-load events would increase to 0.575 day.
Ignoring fuel security makes the 0.18 day LOLE mentioned above appear to be
0.00023 day, as the current market condition mistakenly estimates.
When 15 GW coal is retired, even if the fuel security was ignored, there was still a
reliability violation at 0.114 day.
The resource adequacy situations demonstrated in this study explain the importance of
fuel secure resources in support of the needed resilience measures that the power
industry needs urgently. The level of grid resilience can be gauged by the amount of coal
retirement, the severity of the gas unavailability and interruption that the grid is capable
of mitigating.
DISCUSSIONS
Necessary time to address
constructing new generation and
transmission. As coal plants
continue to retire, a major issue is
that the replacement resources
are unlikely to be in the same
locations or to have the same level
of fuel security. Therefore, the timing and location of the necessary infrastructure to
reliably serve the load need to be given careful consideration. Our results show that
premature retirement of coal resources not only negatively impacts resources
adequacy, but also results in a new pattern of transmission violations. This observation is
reflective of the value of these resources to grid reliability and resilience. Preventing wide-
spread transmission grid overloads resulting from coal retirements (in combination with
gas vulnerability) would likely require electric transmission and gas pipeline upgrades that
could easily take over 10 years to complete and cost billions of dollars.
Coal capacity needed for reliability and resilience for the interim. There are existing
planning rules in all RTO regions that govern the retirement of any plant. However, it may
be difficult to delay a retirement, especially when the resource has a compelling
Premature retirement of coal resources
not only negatively impacts resource
adequacy, but also results in a new
pattern of transmission violations.

ENSURING RELIABILITY AND RESILIENCE –
A CASE STUDY OF THE PJM POWER GRID
CONFIDENTIAL/PROPRIETARY © 2018 QUANTA TECHNOLOGY, LLC PAGE 6
economic reason to proceed with
the retirement. What is not clear is
this: how much coal capacity is
needed in the interim? Our
preliminary findings indicate that,
under certain scenarios, the PJM
grid could be challenged with
even a small amount of coal
retirement, depending upon the
location and amount, as well as the availability of fuel-secure gas-fired generation to
replace the retired capacity. A systematic study for each RTO region would have to be
conducted individually, in addition to studying the system as a whole.
Reliability standards and market rules should be revised to recognize fuel security to
maintain grid reliability and retain system resilience. Since there is no resilience standard
in the industry, the organized markets cannot price the system resilience requirements in
the energy market, nor can the markets price resilience requirements outside of the
reliability standard to reflect long-term infrastructure costs. On a larger scale, if the
reliability planning design conditions incorporate resilience for fuel vulnerability under
extreme contingency conditions, the markets could systematically recognize, and plan
for catastrophic events. Although this study has focused on winter conditions, other
extreme contingencies should include Category 4 and 5 hurricanes, earthquakes, and
any other catastrophic event that may trigger natural gas supply interruptions that cause
multiple gas-fired plants to suffer outages.
The PJM grid could be challenged with
even a small amount of coal retirement,
depending upon the location and
amount, as well as the availability of fuel-
secure gas-fired generation to replace
the retired capacity.

ENSURING RELIABILITY AND RESILIENCE –
A CASE STUDY OF THE PJM POWER GRID
CONFIDENTIAL/PROPRIETARY © 2018 QUANTA TECHNOLOGY, LLC PAGE 7
1 STUDY SCOPE, ASSUMPTIONS, AND PROCEDURE
The reliability standards established by the power industry and the North American
Electric Reliability Corporation (NERC) require the electric grid to be operated to meet
standards over a broad spectrum of grid conditions and under a wide range of probable
contingencies. With the advancement of public policies and technologies, the
underlying grid conditions and contingencies have changed – particularly in terms of
generation mix and level of fuel security. While some leading Regional Transmission
Organizations (RTOs) have begun investigating system resilience and the impact of
current industry practices and modeling assumptions on the level of system resilience,7,8
there is a need for a more thorough and quantitative review of how the electric grid is
meeting the reliability standards.
1.1 Scope
Using industry standard practices and an electric power grid model, this study was able
to confirm that the PJM grid is reliable in terms of both transmission security and resource
adequacy9, particularly under the current capacity oversupply condition. Transmission
security refers to the ability of the electric grid to withstand disturbances such as electric
short circuits or unanticipated loss of system components during power delivery.
Resource adequacy refers to the ability of the power system to supply electricity to
consumers at all times – accounting for scheduled and unscheduled outages of
generation resources. The reliability standards define the design conditions and form the
basis of redundancy embedded in the power grid.
However, when many of the coal
generators (as modeled in the PJM
grid) were retired, and many natural
gas generators failed to generate
when needed, this study identified
scenarios in which the grid could not
meet the reliability criteria for
maintaining transmission security. A
similar result was obtained when fuel
7 http://www.pjm.com/-/media/library/reports-notices/special-reports/20170330-pjms-evolving-resource-
mix-and-system-reliability.ashx 8 https://iso-ne.com/static-assets/documents/2018/01/20180117_operational_fuel-security_analysis.pdf
9 Adequacy: The ability of the electric system to supply the aggregate electrical demand and energy
requirements of the end-use customers at all times, taking into account scheduled and reasonably
expected unscheduled outages of system elements (Glossary of Terms Used in NERC Reliability Standards).
When many of the coal generators (as
modeled in the PJM grid) were retired,
and many natural gas generators failed
to generate when needed, this study
identified scenarios in which the grid
could not meet the reliability criteria for
maintaining transmission security.
ENSURING RELIABILITY AND RESILIENCE –
A CASE STUDY OF THE PJM POWER GRID
CONFIDENTIAL/PROPRIETARY © 2018 QUANTA TECHNOLOGY, LLC PAGE 8
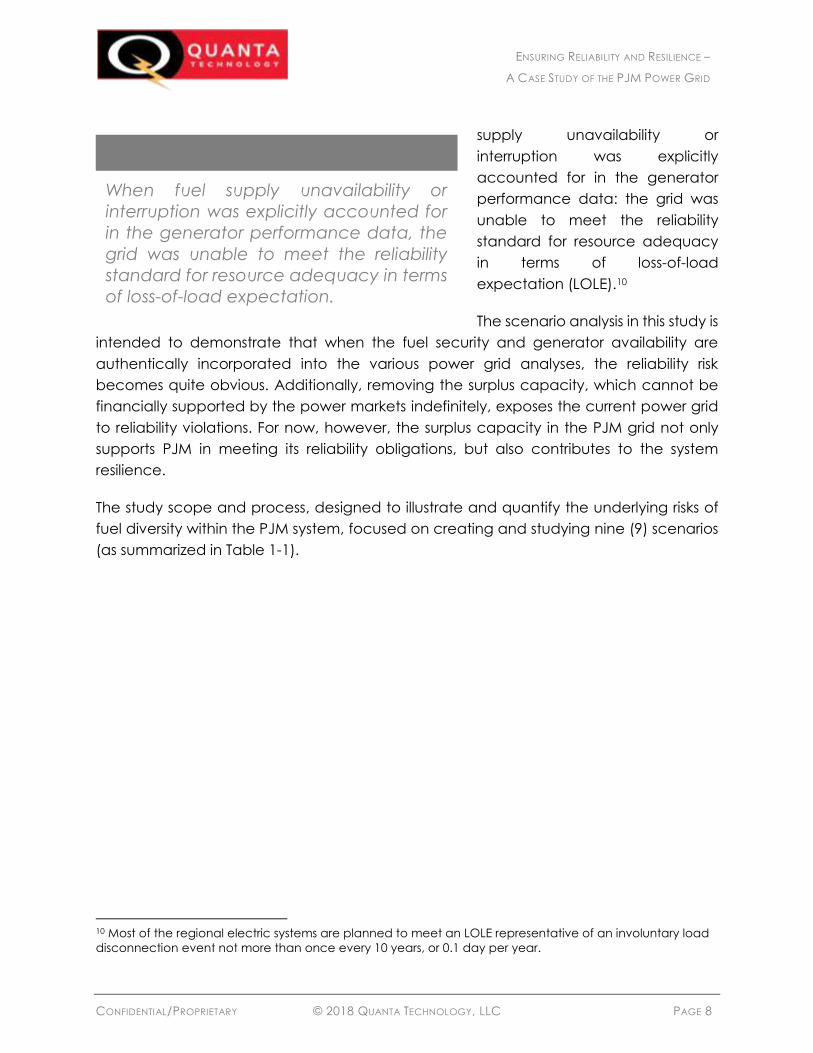
supply unavailability or
interruption was explicitly
accounted for in the generator
performance data: the grid was
unable to meet the reliability
standard for resource adequacy
in terms of loss-of-load
expectation (LOLE).10
The scenario analysis in this study is
intended to demonstrate that when the fuel security and generator availability are
authentically incorporated into the various power grid analyses, the reliability risk
becomes quite obvious. Additionally, removing the surplus capacity, which cannot be
financially supported by the power markets indefinitely, exposes the current power grid
to reliability violations. For now, however, the surplus capacity in the PJM grid not only
supports PJM in meeting its reliability obligations, but also contributes to the system
resilience.
The study scope and process, designed to illustrate and quantify the underlying risks of
fuel diversity within the PJM system, focused on creating and studying nine (9) scenarios
(as summarized in Table 1-1).
10 Most of the regional electric systems are planned to meet an LOLE representative of an involuntary load
disconnection event not more than once every 10 years, or 0.1 day per year.
When fuel supply unavailability or
interruption was explicitly accounted for
in the generator performance data, the
grid was unable to meet the reliability
standard for resource adequacy in terms
of loss-of-load expectation.

ENSURING RELIABILITY AND RESILIENCE –
A CASE STUDY OF THE PJM POWER GRID
CONFIDENTIAL/PROPRIETARY © 2018 QUANTA TECHNOLOGY, LLC PAGE 9
Table 1-1. Load and Resources for Winter and Summer Scenarios
Table notes:
i. Scenario 1 (Winter Reference Case with Gas Vulnerability) models likely levels of
resources for the winter in Year 2021, assuming all current coal capacity remains
in 2021, but with recognition of possible natural gas unavailability and interruption,
to reflect the experience of the most recent five winter seasons.
ii. Scenarios 2 and 3 assume 15 GW and 30 GW of coal retirement, respectively,
based on Scenario 1 to gauge if the grid can meet reliability standards.
iii. Scenario 4 reflects the markets’ current expectations, which largely ignore
generation reduction of natural gas generation due to fuel vulnerability. It is meant
to replicate the level of LOLE as currently deemed true and accepted in the PJM
region.
iv. Scenarios 5 and 6 use Scenario 4 as a baseline and are designed to test whether
the grid is resource-adequate enough to “keep the lights on” in the event of 15
and 30 GW of coal capacity retirement, respectively.
v. Scenarios 7, 8, and 9 are technically similar to Scenarios 4, 5, and 6 for resource
adequacy analysis but use a summer reference case instead.
vi. Gas Capacity Unavailability of 21 GW during Winter Months – In the resource
adequacy study, the 21GW of energy-only gas generators were removed from
the PJM system model, as they are not accepted as capacity resources in
2020/2021 to support grid reliability. For transmission security studies, a
geographically targeted (Atlantic East Coast) 21GW of generation resources were
removed from the study models to mimic an extreme cold weather event.
Transmission Security Screening & Resource Adequacy Analysis
Resource Adequacy Analyses
Transmission Security Screening & Resource Adequacy Analysis
Scenario1 Winter Reference Case with 21GW Gas Outages
Scenario2 S1 + 15GW Coal Retirement
Scenario3 S1 + 30GW Coal Retirement
Scenario4 Winter Reference Case Only
Scenario5 S4 + 15GW Coal Retirement
Scenario6 S4+ 30GW Coal Retirement
Scenario7 Summer Reference Case Only (No gas outage)
Scenario8 S7 + 15GW Coal Retirement
Scenario9 S7+ 30GW Coal Retirement
Coal Retirements 0 15,000 MW
30,000 MW
0 15,000 MW
30,000 MW
0 15,000 MW
30,000 MW
Gas MWs Not Available 21,000 MW 21,000 MW 21,000 MW 0 0 0 0 0 0
Additional Probable Gas MWs Unavailable (non-firm gas, HILF events, etc.) in Resource Adequacy Analysis
10,000 to 35,000
MW
10,000 to 35,000
MW
10,000 to 35,000
MW
N/A N/A N/A N/A N/A N/A
Additional Probable Coal MWs Unavailable in Resource Adequacy Analysis
8,000 MW 4,000 MW 2,000 MW N/A N/A N/A N/A N/A N/A
Winter Peak Load 142,471 142,471 142,471 142,471 142,471 142,471 N/A N/A N/A
Summer Peak Load N/A N/A N/A N/A N/A N/A 160,893 160,893 160,893
PJM Generation 212,509 212,509 212,509 212,509 212,509 212,509 212,509 212,509 212,509
PJM Imports 4,000 4,000 4,000 4,000 4,000 4,000 4,000 4,000 4,000 Demand Response (only in Resource Adequacy Analysis)
7,800 7,800 7,800 7,800
7,800 7,800 7,800 7,800 7,800

ENSURING RELIABILITY AND RESILIENCE –
A CASE STUDY OF THE PJM POWER GRID
CONFIDENTIAL/PROPRIETARY © 2018 QUANTA TECHNOLOGY, LLC PAGE 10
vii. Probable Gas Capacity Unavailability of 10 to 35 GW – This is to simulate gas
generator reliability attributes probabilistically in order to capture gas pipeline
infrastructure facility interruptions under stressed conditions, which expose the
electric industry to high risks of loss-of-load services. This probable gas
unavailability is not designed to simulate one specific pipeline or compressor
station event, but a group of events that may affect one or multiple gas
equipment and result in a probable gas generation resource outage.
viii. Probable Coal Capacity Unavailability of 2 to 8 GW – This is to reflect the coal
generation performance in the winter months as reported in by PJM. When the
system has higher coal capacity (as in Scenario 1), the coal capacity forced
outages could reach the 8000-MW level. As the system is losing coal capacity
(e.g., 15,000 and 30,000 MW in Scenarios 2 and 3), the coal capacity forced
outages would likely reduce to 4000 and 2000 MW, respectively.
1.2 Assumptions
In addition to the scenario description above, several key assumptions were made about
the PJM system including:
Where did the power flow base cases come from? Base cases for the power flow analysis
are publically available from FERC (the FERC 715 power flow cases filed by PJM).
Where was the resource adequacy model prepared? The PJM model data were
extracted from the commercially available ABB Ventyx 2017 Spring PROMOD model for
2021. The model was calibrated to provide the standard level of LOLE of 0.1 day/year
when PJM is at its target reserve margin of 16.6% for 2021 as defined by PJM.
What years and seasons were studied? Peak summer 2021 and winter 2020/2021
What assumptions were made about replacement capacity? Currently, PJM has enough
capacity to afford losing over 30GW capacity as shown by PJM capacity auction for
2021, including some to-be-built gas fired generation. The study assumed the gas supply
situation is the same as today, not better or worse, without having to update and analyze
gas pipeline capability in the study. Nuclear and renewables were fixed at the PJM
capacity auction level throughout the study.
What assumptions were made in derating gas units and what was the basis for those
assumptions? Based on natural gas studies publically available11,12 and the PJM fuel
security study13, a list of gas units with and without firm contracts was created. For
11 http://www.nerc.com/pa/RAPA/ra/Reliability%20Assessments%20DL/NERC_SPOD_11142017_Final.pdf 12 EIPC Study report at http://www.eipconline.com/gas-electric-documents.html 13 PJM’S EVOLVING RESOURCE MIX AND SYS. RELIABILITY (Mar. 30, 2017), http://www.pjm.com/-
/media/library/reports-notices/special-reports/20170330-pjms-evolving-resource-mix-and-system-
reliability.ashx

ENSURING RELIABILITY AND RESILIENCE –
A CASE STUDY OF THE PJM POWER GRID
CONFIDENTIAL/PROPRIETARY © 2018 QUANTA TECHNOLOGY, LLC PAGE 11
example, approximately two-thirds of the gas fired capacity in PJM has firm gas but a
certain amount was not able to generate during the recent five winters due to failure in
the gas pipeline systems, and almost none of the gas units served by Local Distribution
Companies (LDCs) in metropolitan areas have firm gas, but some rely on liquid dual fuel
under gas shortage conditions. These non-firm gas and firm gas capacities were
calibrated according to the actual performances during the past five winter seasons. The
calibrated generator performances were then used in the Monte Carlo simulation for
resource adequacy assessment.
How did the analysis take into account imports of power from other regions? The study
kept the imports constant at the level of the BRA 2021 auction, recognizing that this could
be an optimistic assumption. For instance, there will be a time when import is urgently
needed under emergency conditions in some parts of PJM, but the adjacent regions
cannot provide the assistance to the right place for the right amount. The loss of a
pipeline may also present challenging aspects of resources sharing between the regions.
How did the analysis take into account dual-fuel capability of gas-fired units? Dual-fuel
capacity served by interruptible gas supply was treated as part of the interruptible gas
capacity, to address scenarios of prolonged events or weather conditions and/or
exceeding environmental limits.
Did the analysis address potential longer-term impacts of drawing down gas storage?
The gas supply issue was not analyzed. Pipeline constraints are the major problem as of
now and in the foreseeable future; not so much storage and production in the PJM area.
However, when the entire generation fleet becomes heavily dependent on natural gas,
gas storage and gas production during high demand winter seasons can be tight and
trigger a fuel supply problem. Those units with non-firm contracts will be first impacted
during a supply shortage, just like they are today when a pipeline becomes constrained.
The study did not address the long-term draw-down of gas storage because arguably,
most pipelines are partially loaded in the summer and thus able to replenish the storage
in preparation for the winter season.
How and where was the coal capacity assumed to be retired in the study? – There are
approximately 61 GW of coal units of various sizes in every area of PJM except in the
service territories of Jersey Central Power & Light Company and Public Service Electric &
Gas Company. Shown in Figure 1-1 are the areas where all of the coal plants in PJM are
located and how the areas are adjusted to achieve the retirement of 15 GW and 30 GW
of coal throughout PJM. The coal units were retired based on age, generation efficiency,
and size. Other generation resources were scaled up proportionally to offset the coal
retirements in the study. Gas was not curtailed in the summer scenarios, but was for winter
scenarios. See Appendix A for details.

ENSURING RELIABILITY AND RESILIENCE –
A CASE STUDY OF THE PJM POWER GRID
CONFIDENTIAL/PROPRIETARY © 2018 QUANTA TECHNOLOGY, LLC PAGE 12
Figure 1-1. Coal Capacity Retirement Studied
1.3 Procedure
This study analyzed possible system performance in terms of transmission security and
resource adequacy with nine scenarios. The study’s base case is taken from PJM system
representation in 2021, which reflects variables at levels that can reasonably happen in
PJM. Three “combination” scenarios, Scenario 1-3, represent a range of resource mixes
in the 2021 timeframe given current trends – the Reference case with 21GW of gas
generation capacity excluded, and two coal retirement scenarios representing differing
levels of grid reliability and resilience.
Among the Scenarios 1-6, just one of the two fuel type capacity variables was adjusted
(one at a time) down from the reference case level to assess relative compliance with
reliability standards. For example, three scenarios were developed to show the effects of
increased coal retirements together with gas generation interruptions, and the other
three were developed to show the effects of increased coal retirements without gas
interruption. Due to a capacity oversupply situation currently in the PJM market, no extra
new capacity was added; imports were held constant.

ENSURING RELIABILITY AND RESILIENCE –
A CASE STUDY OF THE PJM POWER GRID
CONFIDENTIAL/PROPRIETARY © 2018 QUANTA TECHNOLOGY, LLC PAGE 13
The fuel security risk was evident by comparing Scenarios 1-3 to Scenarios 4-6. Obviously,
Scenarios 1-3 focused on large-area, long-duration outages, considered herein as long
lasting winter cold snaps, or single types of fuel interruptions that last several days or
longer and extend over multiple service areas or states. The LOLE analysis was performed
based on random multi-area generation outages through Monte Carlo simulations;
Appendix B describes the process further.
In the transmission security analysis, single and multiple outages of major energy facilities
for the winter season were performed, and their impacts on the reliability were statistically
analyzed. The assessment included the following conditions:
P0: All facilities in service
P1: N-1 outage of a generator, circuit, or transformer
P2: N-1 outage of a line due to a fault, bus section fault, or internal breaker fault
P3: N-1-1 outage of a generator followed by system adjustments, and then a P1/P2
event
P4: A multiple contingent event caused by a stuck breaker for a P1 event or a bus
section outage
P5: A multiple contingent event caused by delayed clearing for a P1 event or a
bus section outage
P6: N-1-1 outage, P1 event followed by system adjustment followed by a second
P1/P2 event
P7: N-2 the loss of any two circuits on a common structure for 1 mile or more

ENSURING RELIABILITY AND RESILIENCE –
A CASE STUDY OF THE PJM POWER GRID
CONFIDENTIAL/PROPRIETARY © 2018 QUANTA TECHNOLOGY, LLC PAGE 14
2 TRANSMISSION SECURITY CHALLENGES
TPL-001-4 is used as the basis to analyze the reliability impacts of the potential retirement
of approximately 15 GW and 30 GW of coal units. TPL-004-1 is the NERC minimum
mandatory reliability requirement standard. The default assumption of the standard is
that the needed generators are always available even though, currently, some natural
gas-fired generators do not have firm gas delivery contracts. This underlying assumption
can lead to an insecure and unreliable transmission grid. This is particularly true if the coal
capacity is retired and the replacement generators are not in the right locations, not
sized appropriately, or if there is gas supply insecurity.
The grid security was analyzed by simulating N-1 contingencies, with single and multiple
element contingencies. The severity of the contingencies is measured by the amount of
load curtailment after exhausting all possible generation dispatch with fuel secure
resources. The result is summarized in Table 2-1 to 2-3 below, while the detailed results are
included in Appendix B.
The specific scenario assumptions are:
Scenario 1 Winter
Reference Case
Scenario 2 Winter Case
with 15GW Coal Retirement
Scenario 3 Winter Case
with 30GW Coal Retirement
Scenario 4 Winter
Reference Case Only
(No gas outages)
Scenario 5 S4 + 15GW
Coal Retirement
Scenario 6 S4+ 30GW
Coal Retirement
Scenario 7 Summer
Reference Case Only
(No gas outage)
Scenario 8 S7 + 15GW
Coal Retirement
Scenario 9 S7+ 30GW
Coal Retirement
Gas Not Available 21GW 21GW 15GW - - - - - -
Additional Probable Gas
MWs Unavailable (non-firm gas,
HILF events, etc.)
- - - - - - - - -

ENSURING RELIABILITY AND RESILIENCE –
A CASE STUDY OF THE PJM POWER GRID
CONFIDENTIAL/PROPRIETARY © 2018 QUANTA TECHNOLOGY, LLC PAGE 15
Table 2-1. Transmission Security Violations and Mitigations for Winter Reference Cases
(Scenarios 1-3)
Utility Service TerritoryNumber of
Violations
Regional
Generation
Redispatch
(MW)
Load Curtailment
Necessary?
Allegheny Power 5 93 - 102 Yes
American Electric Power 4 - 5 671 - 943 Yes
Atlantic City Electric Company Must Run* 0 - 158
Baltimore Gas & Electric Company 2 - 10 302 - 307 Yes
Commonwealth Edison Co. 13 - 23 140 - 373 Yes
Dayton Power & Light Co. 0 - 143
Delmarva Power & Light Company 4* 270 - 426 Yes
Duke Energy Kentucky 754 - 841 Yes
Duquesne Light Company 81 - 84 Yes
East Kentucky Power Coop. 3 - 7 201 - 224 Yes
FirstEnergy ATSI 3 273 - 689
Jersey Central Power & Light Company 1 -3*
Metropolitan Edison Company Must Run* 41 - 44 Yes
PECO Energy Company 0 - 2 0 - 271
Pennsylvania Electric Company 9 - 192 Yes
Pennsylvania Power & Light Company 0 - 2 204 - 271
Potomac Electric Power Company 134 - 293 Yes
Public Service Electric & Gas Company 10 - 11*
UGI Corporation 0 - 1 0 - 169
Virginia Electric Power Company Must Run* 55 - 117
PJM 45 - 76 8 - 2,405 Partially
Note *: Some gas fired generators must be kept running in order to solve the power flow cases.
Thermal Violations and Severity

ENSURING RELIABILITY AND RESILIENCE –
A CASE STUDY OF THE PJM POWER GRID
CONFIDENTIAL/PROPRIETARY © 2018 QUANTA TECHNOLOGY, LLC PAGE 16
Table 2-2. Transmission Contingency Analysis for Summer Base Cases– Scenarios 7-9
Number of Security Violations
Scenario 7 Scenario 8 Scenario 9
American Electric Power 5 7 5
Duke Energy Kentucky 0 1 2
Duquesne Light Company 0 1 1
Commonwealth Edison Co. 1 1 1
PJM 0 0 1
Metropolitan Edison Company 0 2 2
Pennsylvania Power & Light Company 1 1 1
Potomac Electric Power Company 2 4 4
Baltimore Gas & Electric Company 0 6 6
Delmarva Power & Light Company 0 3 0
Virginia Power Company 0 0 2
East Kentucky Power Coop. 0 0 1
Total Number of Violations 9 26 26
Table 2-3. Transmission Contingency Analysis for Winter Base Cases– Scenario 4-6
Number of Security Violations
Scenario 4 Scenario 5 Scenario 6
Allegheny Power 0 1 3
American Electric Power 1 2 2
Commonwealth Edison Co. 1 0 0
PJM 0 1 1
Pennsylvania Electric Company 0 2 4
Metropolitan Edison Company 2 8 9
Pennsylvania Power & Light Company 0 3 5
Potomac Electric Power Company 0 0 3
Baltimore Gas & Electric Company 7 14 14
Delmarva Power & Light Company 2 3 2
East Kentucky Power Coop. 3 2 0
Duke Energy Kentucky 1 1 1
Total Number of Violations 17 37 44

ENSURING RELIABILITY AND RESILIENCE –
A CASE STUDY OF THE PJM POWER GRID
CONFIDENTIAL/PROPRIETARY © 2018 QUANTA TECHNOLOGY, LLC PAGE 17
Figure 2-1. Overloads in the PJM Footprint (Scenario 1-3)
ENSURING RELIABILITY AND RESILIENCE –
A CASE STUDY OF THE PJM POWER GRID
CONFIDENTIAL/PROPRIETARY © 2018 QUANTA TECHNOLOGY, LLC PAGE 18
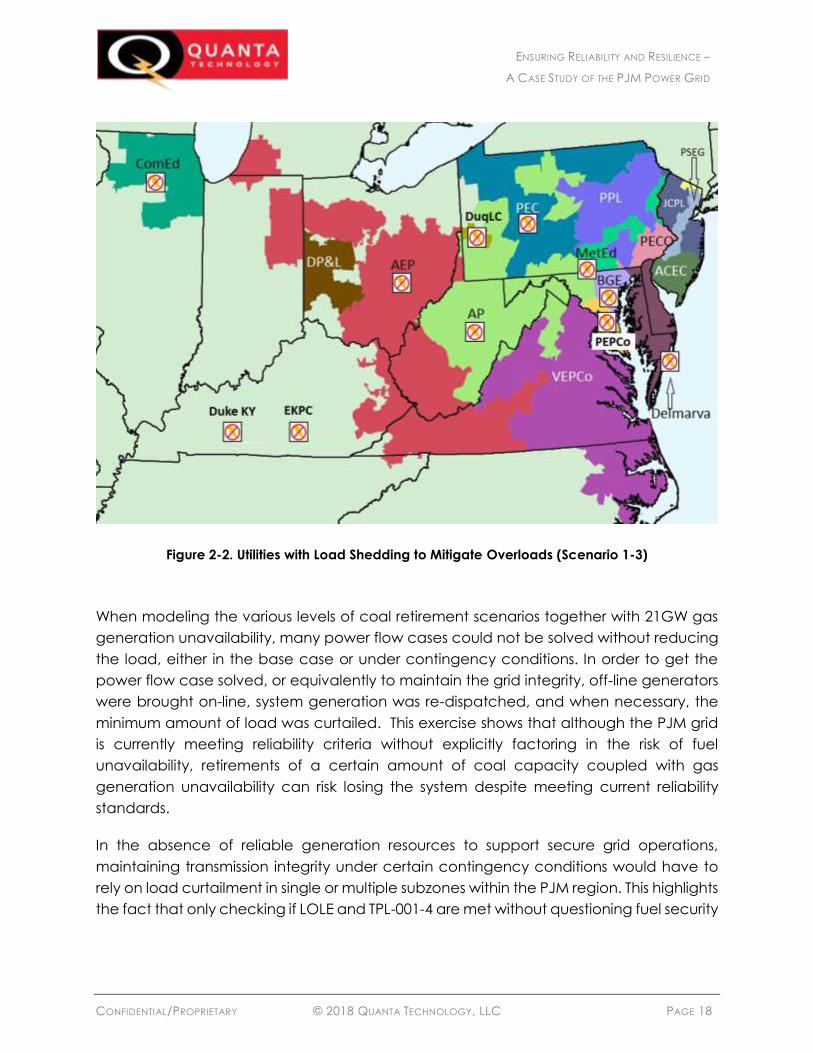
Figure 2-2. Utilities with Load Shedding to Mitigate Overloads (Scenario 1-3)
When modeling the various levels of coal retirement scenarios together with 21GW gas
generation unavailability, many power flow cases could not be solved without reducing
the load, either in the base case or under contingency conditions. In order to get the
power flow case solved, or equivalently to maintain the grid integrity, off-line generators
were brought on-line, system generation was re-dispatched, and when necessary, the
minimum amount of load was curtailed. This exercise shows that although the PJM grid
is currently meeting reliability criteria without explicitly factoring in the risk of fuel
unavailability, retirements of a certain amount of coal capacity coupled with gas
generation unavailability can risk losing the system despite meeting current reliability
standards.
In the absence of reliable generation resources to support secure grid operations,
maintaining transmission integrity under certain contingency conditions would have to
rely on load curtailment in single or multiple subzones within the PJM region. This highlights
the fact that only checking if LOLE and TPL-001-4 are met without questioning fuel security

ENSURING RELIABILITY AND RESILIENCE –
A CASE STUDY OF THE PJM POWER GRID
CONFIDENTIAL/PROPRIETARY © 2018 QUANTA TECHNOLOGY, LLC PAGE 19
for generation would mask the fact that the grid could meet these criteria but still has
serious resilience problems.
Although this study focused on the thermal capability aspects of the transmission security,
the grid as a whole must also obtain certain other attributes allowing it to provide
essential reliability services, which were not studied here. Additional studies are required
to assess the impact of gas fuel insecurity or early retirement of fuel-secure coal resources
on the resilience of the system. Among the additional security attributes are the following
critical categories:
Voltage support (the ability of system resources to maintain real power across the
transmission grid through the use of reactive power sources such as generators
connected to the system, capacitors, reactors, etc.). Voltage on the system must be
maintained within an acceptable voltage bandwidth in normal operations and
following a contingency on the system.
Frequency management (the ability of the system to maintain a system frequency
within a technical tolerance at all times). Frequency is a function of the match
between generation output and load on the system, and requires constant
balancing, or load following by generation resources that can increase and
decrease output instantaneously.
Stabilizing inertia. Related to the frequency issue, but included as part of the Essential
Reliability Services as defined by NERC, is the stabilizing inertia that large generators
such as coal generating units provide. It is important to note that the synthetic inertia
provided by wind and solar PV does not have magnetic inertia to sustain large short-
circuit electrical disturbances, and thus, cannot recover voltage as fast as large
baseload units.

ENSURING RELIABILITY AND RESILIENCE –
A CASE STUDY OF THE PJM POWER GRID
CONFIDENTIAL/PROPRIETARY © 2018 QUANTA TECHNOLOGY, LLC PAGE 20
3 RESOURCE ADEQUACY CHALLENGES
LOLE is utilized to quantify the impact of potential interruptions in gas supplies or
retirements of coal units. A detailed description of the model is in Appendix B.
The approach that is followed in this analysis to assess the resilience of the system is as
follows:
Assess the PJM LOLE for system conditions that mimic recent PJM Winter experiences
– Scenario 1.
Assess the PJM LOLE with all system resources including both capacity and energy-
only resources – Scenario 4 and 7.
Assess PJM LOLE with coal retirements of 15GW and 30GW levels, with winter gas
generation performance derating – Scenarios 2 and 3.
Assess the most optimistic LOLEs by ignoring gas vulnerability – Scenarios 4 - 9.
The results are summarized in Table 3-1 and plotted in Figure 3-1. Note that a reliability
level of 0.1 day/year is the industry standard planning target for LOLE value. The resource
adequacy of the system is highly sensitive to peak load during the summer months, and
to the availability of gas supplies during the winter months.
The PJM system with all resources (capacity and energy) available during all months of
the year shows a healthy LOLE indicating abundance of resources. However, this study
stressed the system by investigating nine scenarios with the following observations:
The potential retirement of coal resources while the natural gas resources are fuel
secure and available to generate at rated capacities. Even under this optimal
assumption, the results show the resource adequacy criterion is violated with the LOLE
for the PJM region at 0.114 day/year (or slightly worse than the reliability criterion)
when 15GW of coal plants are retired (Scenario 5 and 8 for Winter and Summer
respectively), and worsen to 0.238 (or roughly 1 day in 4 years) when 30GW are retired
(Scenario 6 and 9 for Winter and Summer respectively).
Potential gas supply interruptions in winter while all available resources are at rated
capacities. This scenario shows the LOLE of the PJM system exceeds 0.1 day/year
when the 21GW of energy-only gas units are not available and additional probable
gas interruptions can disrupt gas fired generation. During winter 2017/2018, PJM
operated the gas portfolio at 29GW out of the total of 80GW of capacity resources,
indicating significant interruptions and either gas unavailability or extremely tight

ENSURING RELIABILITY AND RESILIENCE –
A CASE STUDY OF THE PJM POWER GRID
CONFIDENTIAL/PROPRIETARY © 2018 QUANTA TECHNOLOGY, LLC PAGE 21
supplies (exhibited by high gas prices reaching $130/MMBTU as compared to normal
levels around $3/MMBTU). This scenario is reflected by the Scenario 1 results; similarly,
for the Polar Vertex events in 2014 and 2015 when the low frequency extreme winter
weather hit the PJM region very hard, two years in a row.
For winter 2021 (Scenario 1), most likely there would be 0.18 day of expected loss-of-
load events violating the reliability criterion of 0.1 day.
If 15GW coal was retired (Scenario 2), the loss-of-load events would increase to 0.421
day under the same condition as above.
If 30GW coal was retired (Scenario 3), the loss-of-load events would increase to 0.575
day.
If the fuel security was ignored (Scenario 4), the 0.18 day above would be fallaciously
“improved” to 0.00023 day, as the current market condition mistakenly deems.
The 2018 cold snap was milder than the Polar Vertex event. But, with the existing coal
capacity in the system, the grid was much less challenged although the gas generation
resources were operated at 29-30GW level (almost 50% below the level that cleared the
PJM capacity market).
Table 3-1. Summary of LOLE in Each Scenario
Scenario 1 Winter
Reference Case
without 21GW
Energy-Only Gas
Scenario 2 Winter Case
with 15GW Coal Retirement and without
21GW Energy-Only
Gas
Scenario 3 Winter Case
with 30GW Coal Retirement and without
21GW Energy-Only
Gas
Scenario 4 Winter
Reference Case Only
(No gas outages)
Scenario 5 S4 + 15GW
Coal Retirement
Scenario 6 S4+ 30GW
Coal Retirement
Scenario 7 Summer
Reference Case Only
(No gas outage)
Scenario 8 S7 + 15GW
Coal Retirement
Scenario 9 S7+ 30GW
Coal Retirement
Energy-Only Gas Not Available
21GW 21GW 21GW - - - - - -
Additional Probable Gas
MWs Unavailable (non-firm gas,
HILF events, etc.)
35GW 25GW 10GW - - - - - -
LOLE (day/year) 0.181 0.421 0.575 0.00023 0.114 0.236 0.00023 0.114 0.236
An Additional scenario was studied to illustrate the impact of coal retirements and gas
vulnerability:
- With 15GW of coal retirements and without the 21GW of energy-only gas units,
and with an additional 10GW of probable gas outages, the LOLE is 0.127. This
analysis in addition to Scenario 8 above (which shows the system exhausting its

ENSURING RELIABILITY AND RESILIENCE –
A CASE STUDY OF THE PJM POWER GRID
CONFIDENTIAL/PROPRIETARY © 2018 QUANTA TECHNOLOGY, LLC PAGE 22
capacity in the summer without any gas outages) illustrates that PJM would have
a capacity shortage if 15GW of coal units would retire, even without any adverse
events impacting the gas infrastructure. To ensure resilience against events similar
in nature to the recent winter experiences, PJM’s ability to tolerate further
retirement of coal generation is significantly diminished.
These additional results clearly indicate that PJM, if coal retirements continue, will lose its
resilience to gas outages.
Figure 3-1: Resource Adequacy (LOLE) – Impact of Gas Availability and Coal Retirement
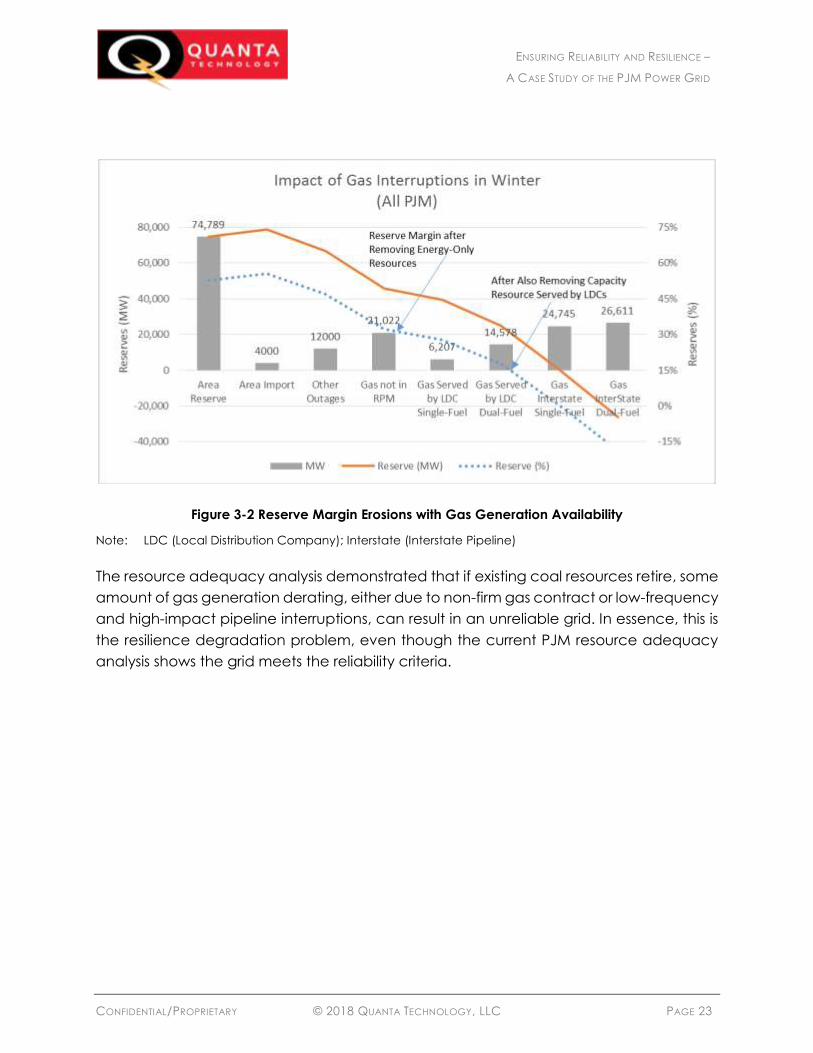
One important observation from the scenarios analyzed is that the reserve margin of PJM
during the winter peak day is highly affected by the gas availability. Figure 3-2 shows the
system reserves in MW and %. The reserve margins, assuming all generation and import
are available, is at 55%. After accounting for unplanned outages of coal and oil units at
levels that have been observed during recent winter events (12 GW), the reserve margin
drops to 47%. Peeling off the gas units that did not clear the capacity market (21 GW)
drops the reserve margin to 32%. However, if the gas demand is high, to the point of
interrupting almost all (20.2 GW) gas supplies served by local distribution companies
(LDCs) to generation plants, the reserve margin drops to a borderline level of 18%. Any
further loss of generation of any type due to retirements or unexpected Interstate gas
pipeline system disruptions can lead to inadequate resources to keep the lights on. So,
at this level of system redundancy or resilience, unavailability of any type of capacities
within PJM may trigger resource adequacy concerns during peak Winter days. This is
depicted in Figure 3-2.
ENSURING RELIABILITY AND RESILIENCE –
A CASE STUDY OF THE PJM POWER GRID
CONFIDENTIAL/PROPRIETARY © 2018 QUANTA TECHNOLOGY, LLC PAGE 23
Figure 3-2 Reserve Margin Erosions with Gas Generation Availability
Note: LDC (Local Distribution Company); Interstate (Interstate Pipeline)
The resource adequacy analysis demonstrated that if existing coal resources retire, some
amount of gas generation derating, either due to non-firm gas contract or low-frequency
and high-impact pipeline interruptions, can result in an unreliable grid. In essence, this is
the resilience degradation problem, even though the current PJM resource adequacy
analysis shows the grid meets the reliability criteria.

ENSURING RELIABILITY AND RESILIENCE –
A CASE STUDY OF THE PJM POWER GRID
CONFIDENTIAL/PROPRIETARY © 2018 QUANTA TECHNOLOGY, LLC PAGE 24
4 CONCLUDING REMARKS
Premature retirement of coal resources not only negatively impacts resource adequacy,
but also transmission security. When fuel supply unavailability or interruption was explicitly
accounted for in the generator performance data, the grid was unable to meet the
reliability standard for resource adequacy in terms of loss-of-load expectation. When
many of the col generators (as modeled in the PJM grid) were retired, and many natural
gas generators failed to generate when needed, this study identified scenarios in which
the grid could not meet the reliability criteria for maintaining transmission security.
While competition and public policies have replaced regulation in some segments of the
industry as the means of ensuring reasonable price levels, maintaining the resilience of
the entire electric grid has become more complicated with the divided responsibility. At
the current generation supply level, reliability standards are maintained in the short-term,
supported by the capacity market mechanisms that induce sufficient prices for
adequate generation to serve the load. For grid operations, it is expected that the
generation retained by the markets can generate upon request by grid operators. Any
deviation from this expectation (for instance, due to fuel insecurity), can lead to grid
reliability concerns as demonstrated in this study.
Long-term infrastructure-related system resilience has not been effectively addressed by
the current reliability standards and practices, or factored into the market mechanisms.
As a result, losing the current level of fuel-secure capacity would present a threat to
reliability. Regulatory oversight and market designs on the value of fuel security are
necessary to ensure the grid reliability and resilience that consumers have long come to
expect.
ENSURING RELIABILITY AND RESILIENCE –
A CASE STUDY OF THE PJM POWER GRID
CONFIDENTIAL/PROPRIETARY © 2018 QUANTA TECHNOLOGY, LLC PAGE 25
APPENDIX A: PJM RESOURCES, AT-RISK COAL, AND GAS CAPACITY
PJM GENERATION RESOURCES
The system resources that are considered in this study were obtained from production
cost model issued by ABB Ventyx, and are summarized in Table A-1. The table shows the
maximum capacity of each type of generation by operating company within PJM. The
total system resources are 231,640MW including 9,119MW of Demand Response and
222,521MW of generation assets. After adjusting the wind and solar capacity factors, the
system resources will total 220,583MW, out of which 189,035MW (86%) cleared the PJM
capacity auction for 2020/2021 and provided a reserve margin of 23.3%. The capacity
auction cleared a total of unforced capacity (UCAP) of 165GW in addition to 14GW of
resources that were cleared in previous auctions for 2018-2020. The 179GW of UCAP
when adjusted to maximum capacity of each resource compares well to the 189GW
found in the Ventyx database
Table A-1 summarizes all the resources by fuel type and operating company.
Due to the rising prevalence of gas generation resources, further analysis of their fuel
supply is warranted. The 93GWs of gas generation resources in PJM are further classified
as follows:
- 21GW are energy-only resources, and 72GW are capacity performance resources
for the 2020-2021 auction.
- Of the 72GW capacity performance resources, our analysis indicates that
approximately 21GW are served by LDCs and 51GW are served by interstate
pipelines:
o Of the 21GW served by LDCs, 6GW are single-fuel and 15GW are dual-fuel.
o Of the 51GW served by interstate pipelines, 25GW are single-fuel while
26GW are dual-fuel.
o Of the 72GW capacity resources, 31GW are single-fuel and 41GW are dual-
fuel.
COAL RETIREMENT SCENARIOS
The coal capacity of 61GW is mainly located in Pennsylvania, Ohio, Virginia, and Illinois
within AEP, Penelec, First Energy, Alleghany Power, Dominion Virginia Power, and Com
Edison service territories. The fleet weighted average heat rate of the 175 coal
genertaors is 9.7 MMBTU/MWh (the higher the heat rate, the worse the generating

ENSURING RELIABILITY AND RESILIENCE –
A CASE STUDY OF THE PJM POWER GRID
CONFIDENTIAL/PROPRIETARY © 2018 QUANTA TECHNOLOGY, LLC PAGE 26
efficiency), and the weighted average age is 43 years. The distribution of the coal
capacity is shown in Figure A-1.
Two coal retirement scenarios were selected for this study:
Phase 1 Coal Retirements
a. Units with Heat Rate above 10 MMBTU/MWh.
b. This included 94 units with a total capacity of 15,604 MW.
Phase 2 Coal Retirements
a. Units with Heat Rate above 9.5 MMBTU/MWh and age higher than 35 years.
b. This included 28 additional units, such that the total retired capacity of Phases 1
and 2 reach 30,166MW.

ENSURING RELIABILITY AND RESILIENCE –
A CASE STUDY FOR THE PJM POWER GRID
CONFIDENTIAL/PROPRIETARY © 2018 QUANTA TECHNOLOGY, LLC PAGE 27
Table A-1. PJM’s Area Resource Model
Max Capacity (MW) Coal Gas Nuclear Hydro Oil Other Solar Wind Storage DR
Total
Available
Resources
Total Gen
Resources
Gas
Cleared
the RPM
Gas Didn’t
Clear the
RPM
Gas Cleared
RPM Served
by LDC
(Single Fuel)
Gas Cleared
RPM Served
by LDC (Dual
Fuel)
Gas Cleared
RPM Served
by
InterState
(Single Fuel)
Gas Cleared
RPM Served
by
InterState
(Dual Fuel)
Coal
Retire
Phase 1
Coal
Retire
Phase 2
Gas
Derating
Allegheny Power 5,420 3,423 203 10 24 105 1,030 689 10,903 9,252 1,799 1,623 0 306 0 1,494 329 2,747
American Electric Power 17,347 13,793 2,191 882 74 188 139 3,676 255 1,748 40,294 35,260 12,377 1,416 1,416 0 4,726 6,235 2,610 4,615
Atlantic Electric 636 1,594 188 14 118 353 2,903 2,521 632 962 141 182 98 211 636 636 412
Baltimore Gas & Electric Company 2,141 734 1,734 670 70 75 1,160 6,585 5,377 734 0 341 394 0 0 330 520 491
Commonwealth Edison Co. 3,905 12,508 10,649 30 188 385 38 3,605 1,264 32,570 28,146 12,326 182 3,456 601 5,333 2,935 3,577 3,905
Dayton Power & Light Co. 2,940 1,577 114 9 4 200 4,845 4,668 1,577 0 125 1,199 0 254 1,170 2,940
Delmarva Power & Light Company 430 4,415 786 185 240 6,055 5,904 3,381 1,034 0 1,840 880 660 430 430 2,514
Duke Energy Kentucky 600 600 600 0 0 0 0 0 0 0 600
Duke Energy Ohio 2,414 1,957 2 161 52 394 4,979 4,585 694 1,263 0 674 0 20 604 604
Duquesne Light Company 588 245 1,872 46 21 1 2,774 2,773 245 0 0 245 0 0 0 588
East Kentucky Power Coop. 1,687 1,032 247 19 2,985 2,985 1,032 0 0 0 0 1,032 510 810
FirstEnergy ATSI 5,558 4,691 2,176 4 394 98 42 301 742 14,006 12,976 2,542 2,149 703 676 390 773 52 2,162
Jersey Central Power & Light Company 2,671 637 83 82 239 453 4,165 4,014 2,619 52 0 1,434 375 809 0 0 2,009
Metropolitan Edison Company 128 3,046 829 20 854 130 5,006 5,006 3,036 10 0 810 853 1,373 128 128 1,620
PECO Energy Company 17 4,231 4,682 572 1,850 189 17 0 1,071 12,629 12,618 3,378 853 0 146 3,232 0 17 17 1,336
Pennsylvania Electric Company 6,174 1,901 117 107 27 1,086 513 257 10,183 8,981 1,773 128 26 0 1,727 20 339 3,303
Pennsylvania Power & Light Company 3,846 7,292 2,620 716 293 138 31 273 836 16,045 14,952 4,819 2,473 0 1,130 1,973 1,715 823 823 3,997
Potomac Electric Power Company 2,459 4,036 6 856 148 17 120 7,642 7,527 1,344 2,692 0 230 780 334 1,497 2,116 1,745
Public Service Electric & Gas Company 8,128 3,500 13 54 182 236 2 1,252 13,366 11,964 5,480 2,648 0 2,213 1,652 1,615 0 0 3,642
UGI Corporation 1,237 1,237 1,237 0 1,237 0 0 0 0 0 0
Virginia Power Company 4,871 14,653 3,708 655 2,125 610 1,149 317 3,003 777 31,868 30,092 12,356 2,297 0 2,499 2,726 7,131 2,552 3,223 5,241
Total Available Resources 61,160 93,163 34,598 3,513 8,828 2,551 2,453 10,962 5,295 9,119 231,640 211,439 72,141 21,022 6,207 14,578 24,745 26,611 15,604 30,166 23,007
Adjusting Solar & Wind Capacity 61,160 93,163 34,598 3,513 8,828 2,551 932 1,425 5,295 9,119 220,583
Existing Resources In 2020/2021 RPM 56,474 72,141 34,598 2,765 7,749 1,251 165 778 5,295 7,820 189,035

ENSURING RELIABILITY AND RESILIENCE –
A CASE STUDY FOR THE PJM POWER GRID
CONFIDENTIAL/PROPRIETARY © 2018 QUANTA TECHNOLOGY, LLC PAGE 28
Figure A-1. Capacity and Average Heat Rate of Coal Fleet
GAS DE-RATING SCENARIOS
Gas interruptions during peak winter months play a critical role in determining the
reliability and resilience of PJM system. The probability and amount of gas interruptions
is influenced by many factors, among them are the commercial gas supply
arrangements (firm or non-firm), the supplier’s core business (LDC or Interstate pipeline),
the backup fuel (single or dual fuel), and the location within PJM (East Coast or Midwest).
The potential range of gas interruptions in PJM is wide depending on the prevailing
conditions or instigating events. The following are a few examples of potential gas
interruptions:
- Commercial Interruptions: The 21GW of energy-only resources have non-firm
supplies and can be rendered unavailable during any gas supply constraint.
- Downstream Events: Congestion in the gas distribution networks may force local
gas distribution companies (LDCs) to prioritize supplies to their customer’s heating
needs, and interrupt supplies to power plants (up to 21GW of probable gas
interruptions).
- Upstream High Impact Low Frequency (HILF) Events: Up to 31GW of single fuel
units might be interrupted, and a portion of the 41GW dual-fuel might also be
8
9
10
11
12
13
14
0
1000
2000
3000
4000
5000
6000
3 9 14 19 23 25 27 29 31 34 37 39 41 43 45 47 49 51 53 55 57 59 61 63 65 67 70 76 88
Hea
t R
ate
(MM
BTU
/MW
h)
Cap
acit
y (M
W)
Age (Yrs)
Coal Units Capacity and HR by Age
Capacity MW Avg HR

ENSURING RELIABILITY AND RESILIENCE –
A CASE STUDY FOR THE PJM POWER GRID
CONFIDENTIAL/PROPRIETARY © 2018 QUANTA TECHNOLOGY, LLC PAGE 29
interrupted for prolonged events, as the liquid fuel supplies are exhausted or
environmental constraints are reached.
Although one can simulate the gas pipeline infrastructure and assess the impact of single
or multiple contingencies on gas generation, this type of analysis requires detailed
proprietary information beyond the scope of this study. Instead, this study judiciously
selected levels of gas interruptions for each scenario of the transmission security and
resource adequacy studies in order to illustrate the impact on PJM reliability.
Gas Derating for Transmission Security Analysis:
Transmission security analysis, being deterministic, requires the simulation of a specific
scenario which is characterized by a specific generation portfolio, load level, and
transmission grid. This study guided the analysis to mimic a gas supply interruption
scenario driven by a heightened demand for gas along the Atlantic East Coast. Gas
generation resources (21GW) were taken out service if they met the following criteria:
- Units are not designated as “Must Run”
- Located in the service territories of one of the following utilities: Dominion,
Baltimore Gas & Electric, Delmarva Power & Light, Atlantic Electric, Jersey Central
Power & Light, Pennsylvania Power & Light, PECO Energy, Potomac Electric Power,
Public Service Electric & Gas, and Metropolitan Edison.
- Either an Energy-Only resource, or supplied by a local gas distribution company
(LDC).
For the study scenarios that examined early retirement of 30GW of coal resources, the
power flow models could not handle the outage of all 21GW of gas units due to severe
localized voltage violations especially in NJ, which was resolved by re-instating several of
the gas units in NJ thus limiting the gas outages to only 15GW.
Gas Derating for Resource Adequacy Analysis:
Gas-fired generator capabilities were discounted to reflect their under-performance
during the past 5 winters if they met one or more of the following criteria:
Units are not designated as “Must Run”.
Units that did not clear the PJM capacity market for 2020/2021 were removed from
the analysis (Scenarios 1-3).
The outage rates of units that cleared the PJM capacity market for 2020/2021 were
increased so that, on average, a target level of gas resource capacity is removed

ENSURING RELIABILITY AND RESILIENCE –
A CASE STUDY FOR THE PJM POWER GRID
CONFIDENTIAL/PROPRIETARY © 2018 QUANTA TECHNOLOGY, LLC PAGE 30
from service. The outage rate increase was higher for units served by interruptible gas
supplies. This probable gas unavailability is designed to simulate a group of events
that may affect one or multiple gas equipment (pipeline, compressor stations, storage
facilities, etc.) and result in a probable gas generation resource outage.

ENSURING RELIABILITY AND RESILIENCE –
A CASE STUDY FOR THE PJM POWER GRID
CONFIDENTIAL/PROPRIETARY © 2018 QUANTA TECHNOLOGY, LLC PAGE 31
APPENDIX B: RESOURCE ADEQUACY DATA AND MODELING
The capacity auction grouped resources into five areas as EMAAC, MAAC, Rest of RTO,
COMED, and DEOK, as shown in Figure B-1. Figure B-2 details the maximum capacity of
generation resources and peak load in each of the five areas, along with the transmission
transfer capability between the areas. The gas generation resources are shown as both
total in the areas as well as the ones that cleared the auction. This data formed the basis
for the Loss-of-load Expectation (LOLE) calculations in Task3.
Figure B-1. PJM Operating Companies and Capacity Auction Areas

ENSURING RELIABILITY AND RESILIENCE –
A CASE STUDY FOR THE PJM POWER GRID
CONFIDENTIAL/PROPRIETARY © 2018 QUANTA TECHNOLOGY, LLC PAGE 32
Figure B-2. PJM Resource Analysis Model
The LOLE calculations were conducted with only resources that cleared the PJM auction
for 2020-2021 to demonstrate an expected level of LOLE of 0.1 day per year. The seasonal
resources were included in the model as shown in Table B-1 for each month taking into
account planned maintenance activities, peak load levels (50/50 forecast), and
capacity adjustments for Summer ICAP.

ENSURING RELIABILITY AND RESILIENCE –
A CASE STUDY FOR THE PJM POWER GRID
CONFIDENTIAL/PROPRIETARY © 2018 QUANTA TECHNOLOGY, LLC PAGE 33
Table B-1. PJM’s Seasonal Resources by Fuel Type

ENSURING RELIABILITY AND RESILIENCE –
A CASE STUDY FOR THE PJM POWER GRID
CONFIDENTIAL/PROPRIETARY © 2018 QUANTA TECHNOLOGY, LLC PAGE 34
APPENDIX C: REPORT CONTRIBUTOR BIOS
Henry Chao, PhD, EXECUTIVE ADVISOR, Vice President, RTO/ISO Markets, General
Administration, has over 25 years of leadership and technical management
experience in delivering technology solutions and professional services to the electric
utility industry with a focus on system planning, operations, engineering, project
development, markets, and regulations. Dr. Chao has a strong academic
background, including a PhD in Electrical Engineering from Georgia Tech and
Executive MBA training programs at Duke and Harvard.
Thomas J. Gentile, PE, EXECUTIVE ADVISOR, Vice President Transmission Strategy, brings
40 years of experience and proven leadership skills in the Power Systems field in the
areas of Transmission and Distribution planning, analysis, engineering, new technology
development, and customer interactions. He has been responsible for managing the
areas of Transmission and Resource Planning, R&D, Contracts, Tariffs, Contract
Administration and Billing, Data Services, OASIS, Coordination with NEPOOL and
NYISO, and other transmission issues related to industry, regional, and national
restructuring, as well as interfacing with RTOs/ISOs and regulatory agencies. Mr.
Gentile has participated in various planning, operating, and market committees at
NERC, NPCC, and ISO-NE.
Robert Haas, Senior Advisor, Transmission, has almost 30 years of experience in the
electric power industry. As an experienced power systems engineer, he has studied
several interconnections to the power transmission system to determine what
upgrades, if any, are needed. His expertise includes power flow, voltage, and stability
in the real-time and planning horizons with additional experience in Energy
Management Systems, Information Technology support, and power line construction
design. Robert is also experienced with the power system software packages
including PSS/E, MUST, Alternative Transient Program (ATP), ASPEN, and PowerWorld.
Len Januzik, EXECUTIVE ADVISOR, Industry Expert, Transmission, has over 35 years of
progressive experience in several areas of power system planning and operations. His
qualifications include years of hands–on power system analysis experience in both
transmission and generation expansion. He has both national and regional industry
committee participation experience through NERC and has developed and
implemented numerous aspects of transmission open access methods and
procedures. Mr. Januzik’s expertise includes utility economic analysis, electric system
risk analysis, infrastructure protection, and heuristic modeling algorithms, among
many others.

ENSURING RELIABILITY AND RESILIENCE –
A CASE STUDY FOR THE PJM POWER GRID
CONFIDENTIAL/PROPRIETARY © 2018 QUANTA TECHNOLOGY, LLC PAGE 35
Xinyu Tony Jiang, PhD, SENIOR ENGINEER, Transmission, has almost 10 years of experience
in the electric power industry. His experience includes power system synchrophasor
applications, state estimation methods, electromechanical mode damping analysis,
and transmission system studies. Before joining Quanta Technology, Tony worked as a
Graduate Research Assistant at Rensselaer Polytechnic Institute, where he worked
with utility companies to develop new power systems software applications and
computation methods.
Hisham Othman, PhD, EXECUTIVE ADVISOR, Vice President, Transmission and Regulatory,
has almost 30 years of technical and managerial experience in the electricity sector
with strong emphasis on power system dynamics and controls, flexible AC
transmission, operational IT, grid integration of renewables and energy storage, and
business strategy and startup. Hisham leads the transmission and regulatory
compliance consulting services team, providing advanced power system technical
and economic studies to help customers address their evolving and challenging
business needs.
Ehsan Raoufat, PhD, SENIOR ENGINEER, Transmission, has 8 years of experience in power
system dynamics, stability and control, smart grids modeling and control, distributed
energy resources (DER) integration, and data analytics. Before joining Quanta
Technology, Ehsan worked as a graduate research assistant at CURENT, a National
Science Foundation (NSF) Department of Energy (DOE) Engineering Research Center
(ERC) for Ultra-wide-area Resilient Electric Energy Transmission Networks. Ehsan was
also an intern with the Electric Power Board in 2016 and NEC Laboratories America in
2017.