Embed Size (px)
Citation preview

ENSTARGROUP.COM
Realising Value
Enstar Group Limited
June 29, 2017
2017 Investor Day Meeting

ROBERT CAMPBELL CHAIRMAN OF THE BOARD
Opening Remarks
2

Investor Day June 2017 | enstargroup.com
Disclaimer
3
IMPORTANT INFORMATION REGARDING FORWARD-LOOKING STATEMENTS
This presentation, and oral statements made with respect to information contained in this presentation, may include certain forward-looking statements regarding our views with respect to our business, operations, loss reserves, strategy, investment portfolio, economic model, and our expected performance for future periods, as well as the insurance market and industry conditions. These statements are intended as “forward-looking statements” under the Private Securities Litigation Reform Act of 1995. Actual results may materially differ from those set forth in the forward-looking statements. You may identify forward-looking statements by the use of words such as “believe,” “expect,” “plan,” “intend,” “anticipate,” “estimate,” “predict,” “potential,” “may,” “should,” “could,” “will” or other words or expressions of similar meaning, although not all forward-looking statements contain such terms.
Forward-looking statements involve significant risks and uncertainties, including risks of changing market conditions in the overall economy and the industry, the success of implementing our strategies, the adequacy of our loss reserves, the regulatory environment, current and future litigation, the success of new acquisitions, competitive pressures, loss of key personnel, risks relating to our active underwriting businesses, our liquidity and other factors detailed in our Annual Report on Form 10-K and our other reports filed from time to time with the Securities and Exchange Commission (“SEC”).
Any forward-looking statement you see or hear during the presentation reflects Enstar Group Limited’s current views with respect to future events and is subject to these and other risks, uncertainties and assumptions. If any of these risks or uncertainties materialize, or if our underlying assumptions prove to be incorrect, actual results may vary significantly from what we projected. You are cautioned not to place undue reliance on these forward-looking statements, which speak only as of the date on which they are made. The date of this presentation is June 29, 2017 and Enstar does not undertake to update or keep it accurate after such date.
NON-GAAP MEASURES AND FINANCIAL INFORMATION
Certain financial and underwriting measures, including the combined ratios and loss ratios that we present for our Atrium and StarStone businesses are “non-GAAP” financial measures as defined by Regulation G. We use these figures to provide more complete information regarding the underwriting results of these businesses. In our “Key Components of the Income Statement” slide, figures presented include amounts attributable to discontinued operations, which are accounted for separately on our consolidated statement of earnings prepared in accordance with US GAAP. Reconciliations to the most directly comparable GAAP financial measures (if any) are provided in the Appendices at the end of this presentation. This presentation is available on our website at https://investor.enstargroup.com/download-library.
The credit ratings described herein are provided by third parties, A.M. Best, Standard and Poor's and Fitch Ratings, and are subject to certain limitations and disclaimers. For information on these ratings, refer to the rating agencies' websites and other publications.
For more complete information about Enstar Group Limited, you should read our reports filed with the SEC. You may get these documents for free through EDGAR on the SEC website at www.sec.gov, which you may also access through our website at https://investor.enstargroup.com/investor-relations.

Investor Day June 2017 | enstargroup.com
Our Executive Management Team
4
Dominic SilvesterChief Executive Officer
Paul O’SheaPresident
Orla GregoryChief Operating Officer
Mark SmithChief Financial Officer

Investor Day June 2017 | enstargroup.com 5
1
2
3
4
5
6
7
Today’s Agenda
Opening Remarks Bob Campbell
Company Overview and Strategic Initiatives Dominic Silvester
Mergers & Acquisitions Paul O’Shea
Active Underwriting Paul O’Shea
Operations Orla Gregory
Financial Overview Mark Smith
Q&A and Closing Remarks Bob Campbell

Investor Day June 2017 | enstargroup.com 6
Concluding ThoughtsCreating long-term value
Delivering long-term value and shareholder return remains our Board’s top priority
We entered 2017 with significant
momentum
Record-high net earnings
Robust business model
Investable assets now constitute over
$400 per share
Successful growth through acquisitions
which remains our cornerstone
Welcomed new members to our Board
bringing fresh views and insight
DOMINIC SILVESTERCHIEF EXECUTIVE OFFICER
Company Overview and Strategic Initiatives
7

Investor Day June 2017 | enstargroup.com
A Multifaceted Insurance Group
8
Solid Financial Performance
Enduring Business Model
Continuous Achievement

Investor Day June 2017 | enstargroup.com
2016 Group Performance
9
$54.7m 1st Quarter 2017 Net Earnings
GROWING NET EARNINGS
$264.8mNet earnings
Up more than 20%from 2015
Investor Day June 2017 | enstargroup.com
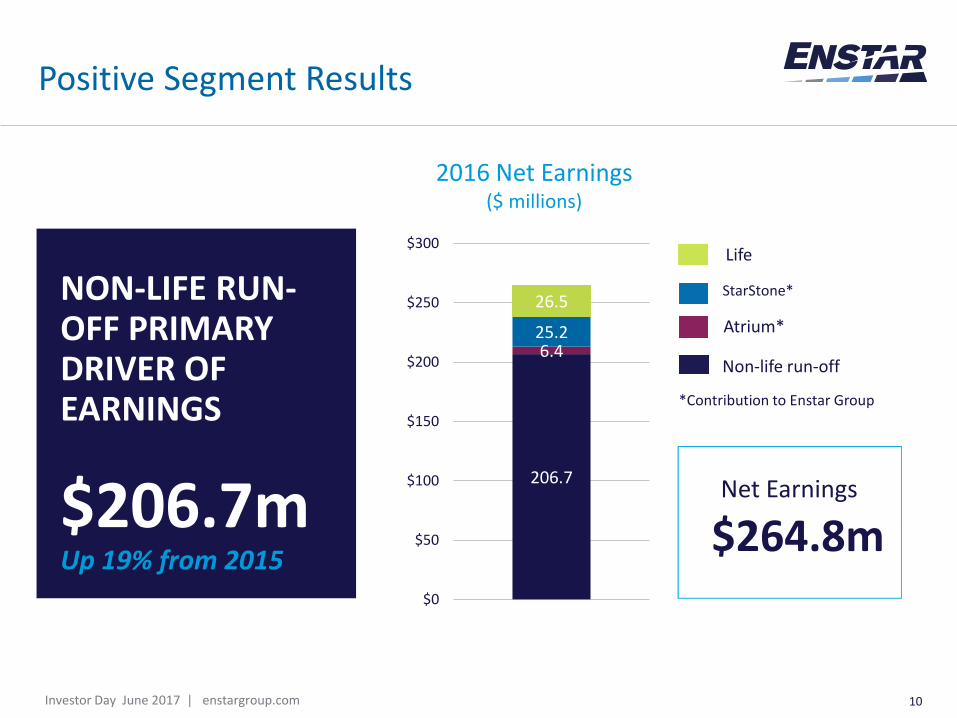
Positive Segment Results
10
Net Earnings
Life
StarStone*
Atrium*
Non-life run-off
206.7
6.425.2
26.5
$0
$50
$100
$150
$200
$250
$300
*Contribution to Enstar Group
$264.8m
2016 Net Earnings ($ millions)
NON-LIFE RUN-OFF PRIMARY DRIVER OF EARNINGS
$206.7mUp 19% from 2015

Investor Day June 2017 | enstargroup.com
Growing Book Value Per Share
11
$143.68Book value per shareDecember 31, 2016
$31.85$36.92
$45.18
$58.06
$71.68
$82.97
$93.30
$105.20
$119.22
$129.65
$143.68
2006 2007 2008 2009 2010 2011 2012 2013 2014 2015 2016

Investor Day June 2017 | enstargroup.com
Financial Strength
12
0
2,000
4,000
6,000
8,000
10,000
12,000
14,000
16,000
2012 2013 2014 2015 2016 Q1 2017
(in
$ m
illio
ns)
Total Assets Cash & Investments Loss Reserves Net Book Value
Balance sheet growth

Investor Day June 2017 | enstargroup.com 13
$4.0bn2016 – Q1 2017Total acquired reserves
Acquisitions Make Us Stronger
OTHER
$314m gross reserves
Recent transactions with world-class partners
ALLIANZ
$1.1bn gross reserves
RSA
$1.3bn gross reserves
DANA
$240m gross reserves
QBE
$1bn gross reserves

Investor Day June 2017 | enstargroup.com
Introducing KaylaRe
14
HillhouseProvides Investment
Management Services
Hillhouse43.5%
KaylaRe Holdings Ltd.(Bermuda)
KaylaRe Management TeamNick Packer CEO Alan Turner CFO Chris Harris CUO
KaylaRe Ltd.(Bermuda)
Trident8.1%
Enstar Limited Provides Services through Service
Agreement
Enstar Group LimitedThrough its subsidiary Cavello Bay
(Bermuda)48.4%

Investor Day June 2017 | enstargroup.com
Principal Shareholders
15
CPP Investment Board and CPPIB Epsilon LP
Hillhouse Capital Management
Akre Capital Management, LLC
Stone Point Capital LLC
Beck, Mack & Oliver LLC
Corsair Capital LLC
The Vanguard Group, Inc.
BlackRock Institutional Trust Company
Hotchkis and Wiley Capital Management, LLC
Fidelity Management & Research Company
Enstar Executive Management
We consider ourstrategic investors,like our clients, astrue partners in ourbusiness.
Investor Day June 2017 | enstargroup.com
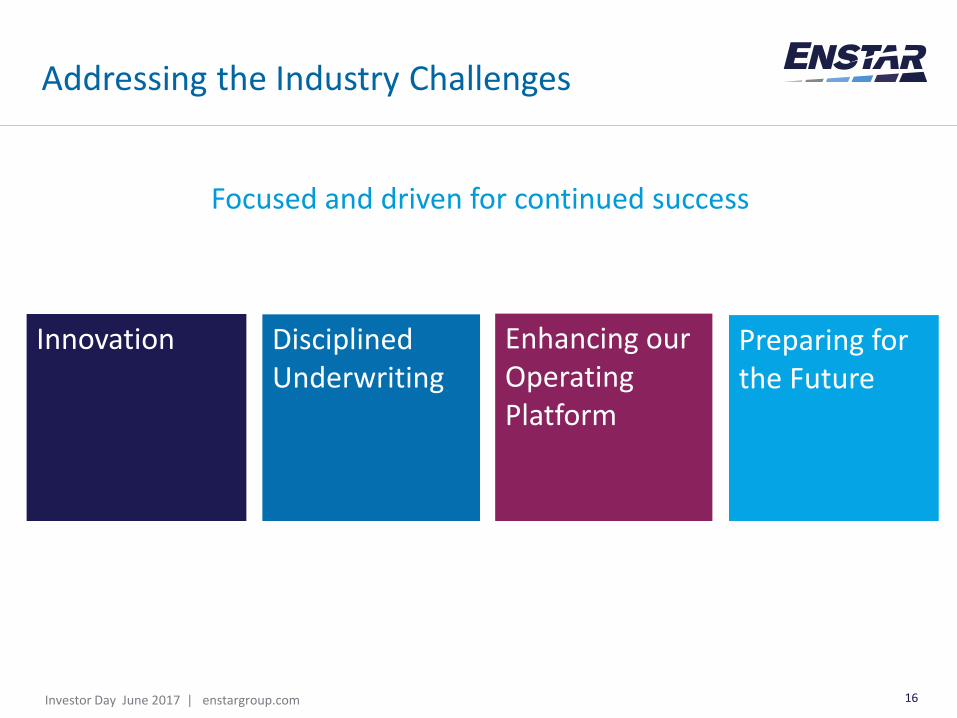
Addressing the Industry Challenges
16
Preparing for the Future
Enhancing our Operating Platform
Disciplined Underwriting
Innovation
Focused and driven for continued success

PAUL O’SHEAPRESIDENT
Mergers & AcquisitionsActive Underwriting
17

Investor Day June 2017 | enstargroup.com18
Proven Record of Acquiring Liabilities
Assets $m
Gross Reserves Acquired $m
2007 and prior 2,892 2,324
2008 3,578 2,349
2009 251 194
2010 1,577 1,358
2011 2,098 1,966
2012 411 411
2013 3,660 2,635
2014 2,534 1,292
2015 2,692 2,361
2016 1,846 1,636
YTD 2017 2,320 2,320
Total $23,859 $18,846
Acquired Total Assets and Gross Reserves by Year

Investor Day June 2017 | enstargroup.com
Recent Transactions
19
Dana
$320m Gross undiscounted reserves
$101m Net discounted reserves
RSA
£1,046m Gross total reserves
£928mNet reserves
QBE
$1,019m Gross total reserves
$447mNet reserves

Investor Day June 2017 | enstargroup.com
Pipeline, Competition and Outlook
20
Pipeline remains strong with a number of targets under review
Expertise and capabilities across
diverse Lines
Strong regulatory reputation
Secure business partner
Pricing drivers: Economics &
Strategy
Prolonged low interest rate environment
Increased regulation
CompetitionP&C rates remain under pressure

Investor Day June 2017 | enstargroup.com
Active Underwriting
21
Active Underwriting Combined Gross Written Premium of $1 Billion
Global specialty insurer
Led by Demian Smith
Geographic Split of Insured: 60% US and 40% ROW
31%
24%
24%
13%
8%
Gross Written Premiums by Products 2016
Casualty
Property
Marine
Workers'Compensation
Aerospace
$854.7m
One of the most successful agencies in Lloyd’s
Led by Richard Harries
Provides diverse speciality insurance offerings
27%
15%
14%
11%
10%
10%
6%
5% 2%
Gross Written Premiums by Products 2016
P&C Binding Authorities
Liability
Marine
Non-Marine D&F
Accident & Health
Reinsurance
Aviation
Upstream Energy
Terrorism
$143mCorporate member
(25% of S609)

Investor Day June 2017 | enstargroup.com
Why have we been successful?
22
The success of Enstar is a product of the entire company.
Operations, claims and acquisition teams are
key to the acquisition process
Cranmore and Paladin provide significant
additional expertise
Active underwriting business provides greater
transaction flexibility
Strong relationships with joint venture
partners
Willingness to seek new opportunities

ORLA GREGORYCHIEF OPERATING OFFICER
Operations
23

Investor Day June 2017 | enstargroup.com
Executing our strategy
24
Global Vision & Strategy
Improved resource allocation
Strategic alignment
Manage growth effectively
Innovate, motivate and inspire
Investor Day June 2017 | enstargroup.com
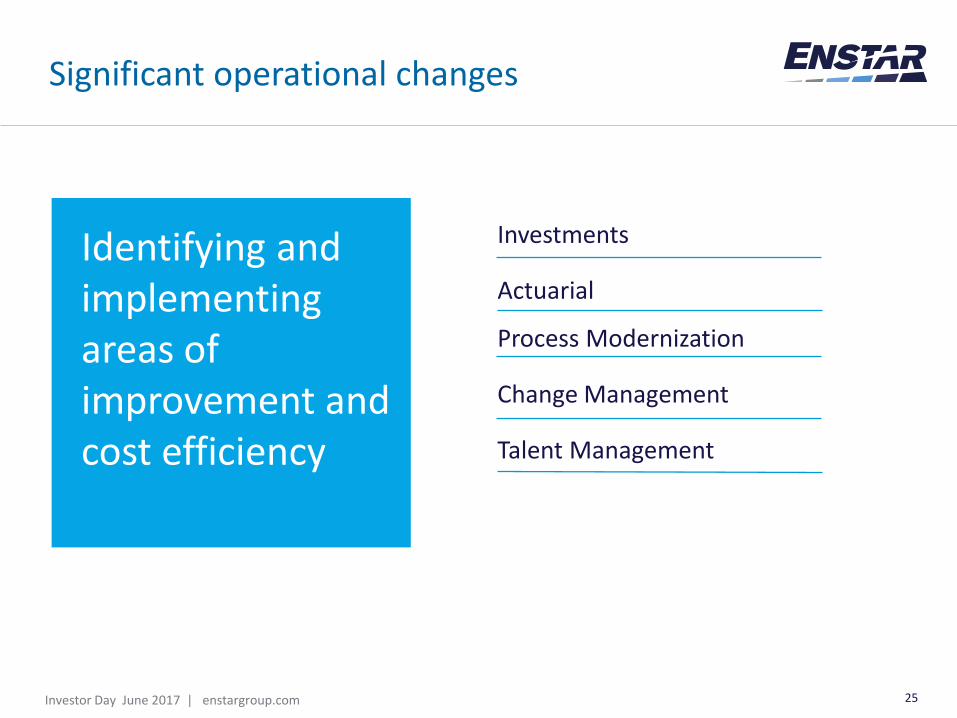
Significant operational changes
25
Identifying and implementing areas of improvement and cost efficiency
Investments
Actuarial
Process Modernization
Change Management
Talent Management
Investor Day June 2017 | enstargroup.com 26
Investments
On-shoring the management team
Welcomed new Chief Investment Officer
Consolidated investment managers
East Coast operational efficiencies
Restructure Investment Management structure

Investor Day June 2017 | enstargroup.com 27
Actuarial
Welcomed new Group Chief Actuary
Implemented Target Operating Model
Developing in-house reserving capability
Review of our global Actuarial function

Investor Day June 2017 | enstargroup.com 28
Process Modernisation
Significant investment in our process designs and technology platforms
Large scale project for Enstar
Touches many areas of business including Finance, Claims, Underwriting, Actuarial
Now placed to transition new business more quicklyand effectively

Investor Day June 2017 | enstargroup.com 29
Change Management
Change is the nature of our business
New Governance Structure in place to address change
Continued improvement in internal communications
Supports strong collaboration across our group

Investor Day June 2017 | enstargroup.com 30
Talent Management
Attracting and developing future talent
Talent development and succession
planning high priority
Nick Packer now CEO of KaylaRe
Orla Gregory now Chief Operating Officer
David Atkins, Enstar EU CEO and Paul
Brockman, Enstar US CEO stepped into
leadership roles
Mark Smith to transition CFO
responsibilities to successor Guy Bowker Jan
2018

Investor Day June 2017 | enstargroup.com
Claims Management, Consultancy & Advisory
31
INSURANCE & REINSURANCE AUDIT & CONSULTANCY
Specialist insurance and reinsurance consultancy group
Provides due diligence to Enstar’s Merger & Acquisitions team
PROACTIVE MANAGEMENT STRATEGIES
Disciplined and Professional Claims Management
Managing Third Party Administrators (TPAs)
MANAGED CARESERVICES
Provider of medical bill review, utilization review, physician case
management and related services
Servicing $2.4bn of Enstar’sworkers’ compensation reserves
Total Enstar Group net claims paid of $912 million in 2016

MARK SMITHCHIEF FINANCIAL OFFICER
Financial Overview
32

Investor Day June 2017 | enstargroup.com 33
Investments
Loss Reserves
Drivers of Income
Financial Resources
Capital Requirements
Finance

Investor Day June 2017 | enstargroup.com
Key Drivers of the Income Statement
34
2016($ thousands)
2015($ thousands)
Movement
310,826 330,560 (19,734)
182,829 207,189 (24,360)
459,656 426,307 33,349
305,684 116,716 188,968
*The information on this slide is presented for illustrative purposes only, and is not in conformity with US GAAP requirements for the presentation of a statement of earnings, nor does it include all components of net earnings. The figures above include amounts attributable to discontinued operations, which are accounted for separately on our consolidated statement of earnings prepared in accordance with US GAAP. Please refer to Appendix B for a reconciliation to US GAAP. This table should not be used as a substitute for the statement of earnings set forth in our Form 10-K filings with the SEC for the periods referenced.
*
Underwriting Income Run-Off
Underwriting Income Live
G & A Expenses
Investment Income

Investor Day June 2017 | enstargroup.com
Investment Portfolio
Total Investment Portfolio($ thousands)
Q1 2017 2016 2015
Fixed Maturities (1)
7,301,704 86% 5,873,592 83% 5,115,926 81%
Risk Assets 1,171,619 14% 1,163,745 17% 1,224,855 19%
Total Investments(1)
8,473,323 100% 7,037,337 100% 6,337,978 100%
Shareholders’ Equity / Risk Assets as % of Shareholders’ Equity
2,864,866 41% 2,802,312 42% 2,516,872 49%
Duration (including cash) 3.27 years 2.56 years 1.81 years
Net Investment income 48,739 185,463 122,564
Net Realized and unrealized gains (losses)
58,519 77,818 (41,523)
Book Yield 2.17% 2.17% 1.64%
Financial Statement Portfolio Return
1.20% 3.09% 1.09%
35
(1) Includes Funds Held – Directly Managed.
Investor Day June 2017 | enstargroup.com
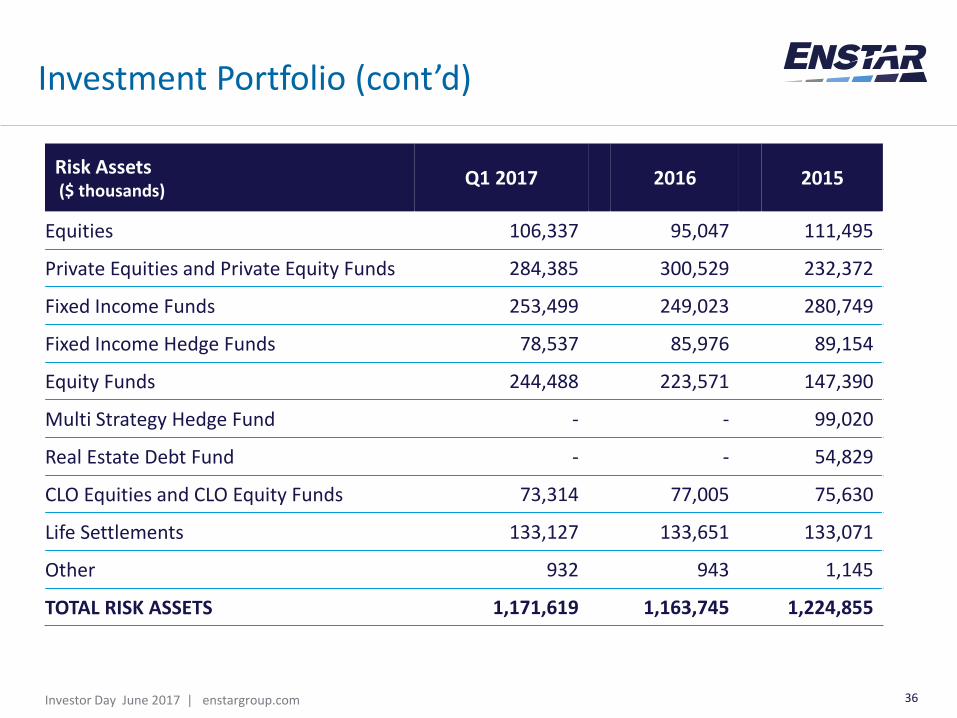
Investment Portfolio (cont’d)
36
Risk Assets($ thousands)
Q1 2017 2016 2015
Equities 106,337 95,047 111,495
Private Equities and Private Equity Funds 284,385 300,529 232,372
Fixed Income Funds 253,499 249,023 280,749
Fixed Income Hedge Funds 78,537 85,976 89,154
Equity Funds 244,488 223,571 147,390
Multi Strategy Hedge Fund - - 99,020
Real Estate Debt Fund - - 54,829
CLO Equities and CLO Equity Funds 73,314 77,005 75,630
Life Settlements 133,127 133,651 133,071
Other 932 943 1,145
TOTAL RISK ASSETS 1,171,619 1,163,745 1,224,855

Investor Day June 2017 | enstargroup.com
Loss Reserves
37
83% Non-Life Run Off remains our core
business
Significant increase in Asbestos &
Environmental in Q1 - RSA and
Dana
Continued growth in Workers’
Compensation in Q1 - QBE
Gross Reserves Q1 2017 2016 2015
Non‐Life Run‐Off (NLRO) 6,478,150 83% 4,716,363 79% 4,585,454 80%
Atrium 212,123 3% 212,122 4% 201, 017 4%
StarStone 1,070,314 14% 1,059,382 18% 933,678 16%
Total Loss Reserves 7,760,587 100% 5,987,867 100% 5,720,149 100%

Investor Day June 2017 | enstargroup.com
Capital, Liquidity & Leverage
Enstar Group debt (millions) / capital ratio
38
$6
0.2
$3
91
.5
$2
55
.0
$2
45
.3
$2
42
.7
$1
07
.4
$4
52
.4
$3
20
.0
$5
99
.8 $6
73
.6 $7
30
.8
11.8%
31.0%
19.2%
16.8%
12.6%
5.7%
18.6%
11.3%
19.2%
19.3%
20.3%
0%
5%
10%
15%
20%
25%
30%
35%
2007 2008 2009 2010 2011 2012 2013 2014 2015 2016 1Q2017
$0
$100
$200
$300
$400
$500
$600
$700
Total Debt mns Debt / (Debt + Shareholders' Equity)
20%-30%target debt to capital range
Enstar has long-term issuer investment grade credit ratings:
• S&P (BBB-) stable outlook • Fitch (BBB) stable outlook• “A-” A.M. Best Financial Strength
Rating for StarStone
Initial public debt offering Q1 2017 $350m, 5 year, 4.5%
Investor Day June 2017 | enstargroup.com
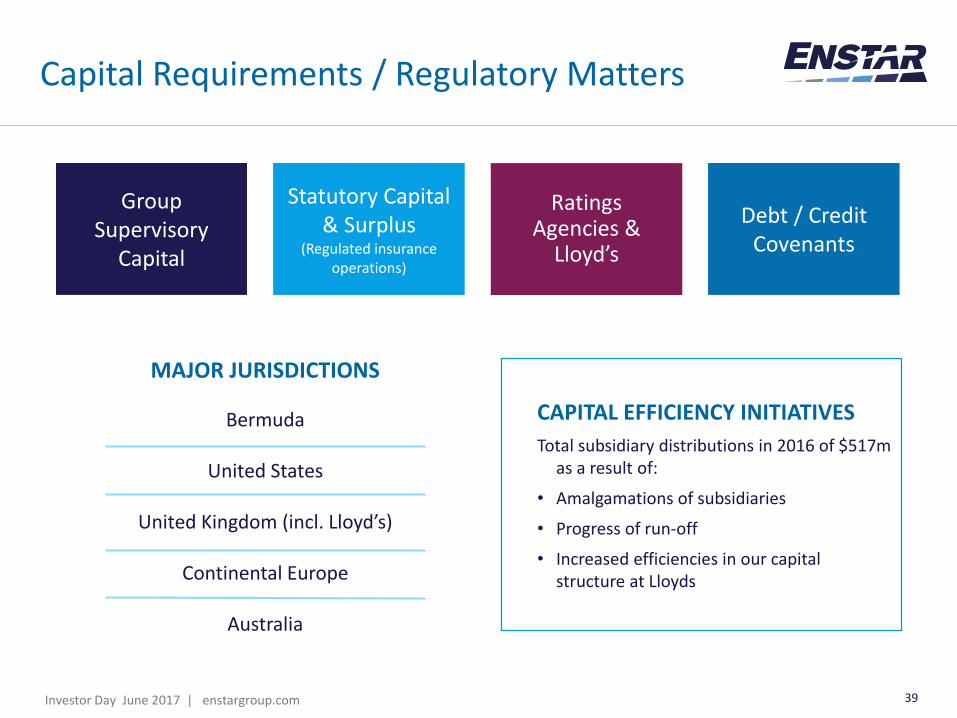
Capital Requirements / Regulatory Matters
39
Statutory Capital & Surplus
(Regulated insurance operations)
Group Supervisory
Capital
Debt / Credit Covenants
Ratings Agencies &
Lloyd’s
MAJOR JURISDICTIONS
Bermuda
United States
United Kingdom (incl. Lloyd’s)
Continental Europe
Australia
CAPITAL EFFICIENCY INITIATIVES
Total subsidiary distributions in 2016 of $517m as a result of:
• Amalgamations of subsidiaries
• Progress of run-off
• Increased efficiencies in our capital structure at Lloyds

Closing Remarks / Q&A
40

Investor Day June 2017 | enstargroup.com
Appendix A – Non-GAAP Financial Measures
41
IMPORTANT INFORMATION ABOUT NON-GAAP FINANCIAL MEASURES
In presenting our results for the Atrium and StarStone segments, we discuss the loss ratio, acquisition cost ratio, other operating expense ratio, and the combined ratio of our active underwriting operations within these segments. While we consider these measures to be non-GAAP, management believes that these ratios provide the most meaningful measure for understanding our underwriting profitability. These non-GAAP measures may be defined or calculated differently by other companies. There are no comparable GAAP measures to our insurance ratios.
The loss ratio is calculated by dividing net incurred losses and LAE by net premiums earned. The acquisition cost ratio is calculated by dividing acquisition costs by net premiums earned. The other operating expense ratio is calculated by dividing other operating expenses by net earned premiums. The combined ratio is the sum of the loss ratio, the acquisition cost ratio and the other operating expense ratio. The ratios exclude expenses related to the holding companies, which we believe is the most meaningful presentation because these expenses are not incremental and/or directly related to the individual underwriting operations.
In the loss ratio, the excluded net premiums earned and net incurred losses and LAE of the holding companies relate to the amortization of our fair value adjustments associated with the liabilities for unearned premiums and losses and LAE acquired on acquisition date. Fair value purchase accounting adjustments established at the date of acquisition are recorded by the holding companies.
In Atrium’s other operating expense ratio, the excluded holding company general and administrative expenses relate to amortization of the definite-lived intangible assets. The excluded salaries and benefits expenses relate to Atrium Underwriters Limited ("AUL") managing agency employee salaries, benefits, bonuses and current year share grant costs. The excluded AUL general and administrative expenses relate to expenses incurred in managing the syndicate, and eliminated items represent Atrium 5’s share of the fees and commissions paid to AUL. We believe it is a more meaningful presentation to exclude the costs in managing the syndicate because they are principally funded by the profit commission fees earned from Syndicate 609, which is a revenue item not included in the insurance ratios.
In StarStone’s other operating expense ratio for 2016, the excluded general and administrative expenses relate to the amortization of the definite-lived intangible assets, and acquisition-related expenses, in each case recorded at the holding company level. In StarStone’s other operating expense ratio for 2015, the excluded general and administrative expenses relate to management fee expenses charged by our Non-life Run-off segment primarily related to our costs incurred in managing StarStone, the amortization of the definite-lived intangible assets, and acquisition-related expenses, in each case recorded at the holding company level.

Investor Day June 2017 | enstargroup.com
Appendix B – Reconciliation of the Key Components of the Income Statement
42
1) “Underwriting income – Runoff” represents the income we earn from our underwriting operations in our Non-life Run-off and Life and Annuities Segments. It consists of “Net premiums earned,” “Fees and commission income,” and “Other income” LESS “Net incurred losses and LAE,” “Life and annuity policy benefits” (in the case of our Life and Annuities Segment), and “Acquisition costs” as reported on our GAAP Statements of Earnings for each segment in our most recent Annual Report on Form 10-K.
2) “Underwriting income – Active” represents the income we earn from our underwriting operations in our Atrium and StarStone Segments. It consists of “Net premiums earned,” “Fees and commission income,” and “Other income” LESS “Net incurred losses and LAE,” and “Acquisition costs” as reported on our GAAP Statements of Earnings for each segment in our most recent Annual Report on Form 10-K.
The Key Components of the Income Statement are derived from our consolidated GAAP Statement of Earnings pursuant to the formulas above.
GAAP Earnings
2016 2015
Per GAAP
Gross-up of Discontinued
operations Total Per GAAP
Gross-up of Discontinued
operations Total
INCOME
Net premiums earned $823,514 $69,089 $892,603 (A) $753,744 $85,327 $839,071 (D)
Fees and commission income 39,364 - 39,364 (A) 39,347 - 39,347 (D)
Net investment income 185,463 38,140 223,603 (B) 122,564 35,404 157,968 (E)
Net realized and unrealized gains (losses) 77,818 4,263 82,081 (B) -41,523 271 -41,252 (E)
Other income 4,836 1,912 6,748 (A) 30,328 7,690 38,018 (D)
1,130,995 113,404 1,244,399 904,460 128,692 1,033,152
EXPENSES
Net incurred losses and LAE 174,099 - 174,099 (A) 104,333 - 104,333 (D)
Life and annuity policy benefits -2,038 76,594 74,556 (A) -546 97,472 96,926 (D)
Acquisition costs 186,569 9,836 196,405 (A) 163,716 13,712 177,428 (D)
General and administrative expenses 423,734 14,416 438,150 (C) 389,159 13,886 403,045 (F)
Interest expense 20,642 - 20,642 (C) 19,403 - 19,403 (F)
Net foreign exchange losses (gains) 665 199 864 (C) 3,373 486 3,859 (F)
803,671 101,045 904,716 679,438 125,556 804,994
EARNINGS BEFORE INCOME TAXES 327,324 12,359 339,683 225,022 3,136 228,158
INCOME TAXES -34,874 -396 -35,270 -12,650 -5,167 -17,817
NET EARNINGS FROM CONTINUING OPS 292,450 11,963 304,413 212,372 -2,031 210,341
NET EARNINGS FROM DISCONTINUING OPS 11,963 -11,963 - -2,031 2,031 -
NET EARNINGS 304,413 - 304,413 210,341 - 210,341
Less: Net earnings attributable to noncontrolling interest -39,606 - -39,606 9,950 - 9,950
NET EARNINGS ATTRIBUTABLE TO ENSTAR GROUP LIMITED $264,807 - $264,807 $220,291 - $220,291
Summary Non-GAAP amounts:
2016 2015
Underwriting income - Runoff $310,826 $330,560
Underwriting income - Active $182,829 $207,189
Total underwriting income Σ(A)= $493,655 Σ(D)= $537,749
less: Salaries and G&A Σ(C)= $459,656 Σ(F)= $426,307
Net investment income Σ(B)= $305,684 Σ(E)= $116,716
Earnings before income taxes $339,683 $228,158