Embed Size (px)
Citation preview
Seton Hall UniversityeRepository @ Seton HallSeton Hall University Dissertations and Theses(ETDs) Seton Hall University Dissertations and Theses
Fall 2015
Enrollment Management: Structure and DecisionParticipationLauren Haddad FriedmanSeton Hall University, [email protected]
Follow this and additional works at: https://scholarship.shu.edu/dissertations
Part of the Educational Assessment, Evaluation, and Research Commons, EducationalLeadership Commons, and the Higher Education Administration Commons
Recommended CitationFriedman, Lauren Haddad, "Enrollment Management: Structure and Decision Participation" (2015). Seton Hall UniversityDissertations and Theses (ETDs). 2134.https://scholarship.shu.edu/dissertations/2134
ENROLLMENT MANAGEMENT: STRUCTURE AND DECISION PARTICIPATION
by
LAUREN HADDAD FRIEDMAN
Dissertation Committee
Joseph Stetar, Ph.D. Mentor
Robert Kelchen, Ph.D.
Lillian Ortiz, Ed.D.
Submitted in Partial Fulfillment
of the Requirements for the Degree
Doctor of Philosophy
Seton Hall University
2015

ii
© Copyright by Lauren Haddad Friedman, 2015
All Rights Reserved
iii
iv
ABSTRACT
Once a novel strategy adopted by a limited number of private colleges, enrollment management
(EM) is now a standard practice for most institutions in American higher education. The units
engaged in EM and strategic enrollment management (SEM) serve as change agents in support
of student recruitment, retention and graduation. Over time, the units supporting EM have
expanded from admissions to include financial aid, advising, the registrar and institutional
research. As a result of this expansion, structural models developed in the 1980s provide little
insight into the team organization that EM has become. Using data collected in a survey
instrument administered to 680 mid-level directors of public and private colleges and universities
accredited by Middle States Commission on Higher Education and the New England Association
of Schools and Colleges, this study developed a new model for researching enrollment
management systems. The research identified information on respondents’ engagement in EM
and their participation in the decision-making processes of their institutions. Results from the
survey indicate that mid-level managers actively engaged in enrollment management are more
likely to be involved in decision making than similarly situated mid-level managers with little to
no engagement in enrollment management. Leadership of today’s colleges and universities can
benefit from these data-based findings that decision participation was impacted by formalization
of the EM environment, centralization of authority (such as an EM division) and respondents’
interactions with other institutional units.
Keywords: change management, data management, decision making, decision participation,
enrollment management, higher education, leadership, SEM, work organization, work teams

v
DEDICATION
To the one and only,
Gibran Steven Mathewson,
my much loved son:
I celebrate your curiosity and your independence.
I am confident you will go places.
I know you will have fun getting there.
vi
ACKNOWLEDGEMENTS
A successful path to the doctorate relies on the guidance and kindness of many
individuals. This public acknowledgement of their contributions and support comes at the end of
the journey. Yet, it was the actions of these many supporters that sustained me along the way
and without which this journey would have ended far short of its goal.
My thanks go out to the faculty at Seton Hall University. My immense respect and
appreciation are offered to my dissertation mentor, Dr. Joseph Stetar. His gentle guidance lent
clarity to the work; no small feat! Kudos are extended to my committee members - Dr. Robert
Kelchen for nudging the work to its conclusion, and Dr. Lillian Ortiz, for keeping my eye on the
prize. I will hold forever the memories of my faculty advisor Dr. Martin Finkelstein (you are
still my favorite teacher of all time) and Dr. Rong Chen (your standards for excellence infuse the
work of your students throughout their time at the university and beyond). Additionally, my
gratitude to Dr. Eunyoung Kim for going the extra mile to help me and her other students to find
the success we seek and to Dr. Daniel Gutmore for his support of my organizational research
even though I wasn’t a student in his program. Thank you to Dr. Elaine Walker and Dr. Rebecca
Cox for their collaborating on this program and setting me along this path with solid course work
that enabled me to stay the course. To Roger Boetsch, many thanks for the care and detail with
which he reviewed this manuscript. May each of you continue to have success in your endeavors.
My thanks to the many faculty supporting the University of Hartford Masters in Public
Administration program, notably retired Dean, Dr. James Fairfield-Sonn and, posthumously,
Connecticut icon Sandra Biloon. A special thanks to Associate Dean, Dr. Farhad Rassekh,
professor and friend, who supported me when I first expressed this goal, but took care that I

vii
understood the required commitment. My thanks to faculty at the University of Connecticut
Masters in Survey Research program, notably Dr. Jennifer Dineen and Dr. Thomas Craemer.
To my faculty at Wesleyan University: Dr. Nancy Schwartz who wanted to see me
publish, Dr. Richard Elphick who let me audit his graduate courses over the summer, Dr. Andrei
Markovits (now at University of Michigan) who took me on as his teaching assistant and,
posthumously, to my advisor Dr. Philip Hallie, many thanks across the years.
To my professional mentors from my time at Naugatuck Valley Community College and
Eastern Connecticut State University: Presidents, Dr. Daisy Cocco De Filippis and Dr. Elsa
Núñez and Provosts, Dr. Estela López and Dr. Rhona Free (now President, University of St
Joseph), I offer my heartfelt appreciation for their many years of support.
To my closest colleagues, my dear friends: Dr. Katy Kleis-Carbone, Dr. Lisa Rodrigues-
Doolabh, and Dr. Philip Segan, our oasis of sanity got me “over the top”.
My loving thanks to the Connecticut Baha’i Chorale for the cherished times we shared
producing sacred music. Special thanks to Anne Alleva, Yolanda Bonnick, Adair Luciani and
Sharon Dixon Peay: with you I always found my place of peace.
To my parents, Judith and Peter Haddad (what a team!): I treasure your ever-present love
which gave me the blessings of confidence and aspiration, the foundation for every success in
my life.
To my siblings Audrey and Peter and their families: so much love and patience were
given to me by you all. Without you in my life, I could not have completed this personal
marathon.

viii
To my son, Gibran Mathewson: You have been there for it all. For the sacrifices this
entailed, I thank you my Lille-ven.
To my husband, my closest friend and partner, Stanton Friedman: When we met I told
you I would be tackling a doctorate and that it would take time away from our relationship. You
responded that Dr. and Mr. Friedman sounded just fine. Your love and support has never
wavered. You are my rock.
ix
TABLE OF CONTENTS
ABSTRACT…………………………………………………………….………………………..iv
DEDICATION…………………………………………………………………………………….v
ACKNOWLEDGEMENTS…………………………………………………...……………….....vi
LIST OF TABLES………………………………………………………………………………..xi
LIST OF FIGURES………………………………………………………………………….......xii
CHAPTER I: INTRODUCTION……..………………………………………………...………...1
Enrollment Management: A Shift in Perspective……………………………………........1
Historical Context of the Enrollment Management Revolution………………………......2
Statement of the Problem……………………………………………………………….....4
Purpose of the Study………………………………………………………………………8
Research Questions………………………………………………......................................9
Significance of the Study………………………………………………….…………......10
CHAPTER II: LITERATURE REVIEW………...………………………………………….......12
Enrollment Management Functions…………………………………………….……......13
Enrollment Management Structures…………………………………………………......16
Enrollment Management Practitioners………………………………………………......19
Enrollment Management Teams………………………………………………................22
CHAPTER III: METHODS……….………………………………………………...……..….....31
Research Design…………………………………………………………...…………......32
Population and Sample……………………………………………...…….…………......34
Data Collection………………………………………………………...….…………......37
Variables………………………………………………….………………………….......40
Data Analysis………………………………………………….……………..………......43
Limitations of the Study………………………………………………..….…………......49
CHAPTER IV: RESULTS………………………...…………………..………………...…….....51
Descriptive Statistics…………………………………….…………………...………......51
Findings for Research Question 1……………….……………………..………………...53
Findings for Research Question 2………………………..………………………..…......55
Summary Statement on Findings………………………………………….…………......69
CHAPTER V: CONCLUSIONS AND IMPLICATIONS………..…………………...…….......70
x
REFERENCES………………………………………………………………………….…….....76
APPENDICES…………………………………………...……………………………..…....…100
Appendix A: Survey Instrument………………...……………...……..……………..…100
Appendix B: Variable Coding Guide………………...………...………………………108
xi
LIST OF TABLES
Table 1 Enrollment Management Article Counts by Publication and Topic …………….87
Table 2 Respondent Profile by Headcounts..….……………...…………………….…….88
Table 3 Respondent Profile as a Percentage of All Responding to the Survey…….…….89
Table 4 Engagement in Enrollment Management by Respondent Characteristic Reported
as a Percentage of All Respondents Sharing that Characteristic…………...…....90
Table 5 Decision Participation by Respondent Characteristic Reported as a Percentage of
All Respondents Sharing that Characteristic……………………...……….…….91
Table 6 Required Sample Size for Standard and Subset Samples by Mediating Variable.92
Table 7 Crosstabs Analyses: Results for Engagement in Enrollment Management and
Decision Participation by Mediating Variable: Authority ……………...……….93
Table 8 Crosstabs Analyses: Engagement in Enrollment Management & Decision
Participation by Mediating Variable: Formalization ………………………..….….94
Table 9 Crosstabs Analyses: Engagement in Enrollment Management & Decision
Participation by Mediating Variable: Interaction ……………….……..…….……..95
xii
LIST OF FIGURES
Figure 1 Population Pyramid for Engagement and Decision Scores…………..…….……96
Figure 2 Histogram of Respondents’ Decision Scores…………….………………………97
Figure 3 Histogram of Respondents’ Formalization Scores………………………………98
Figure 4 Histogram of Respondents’ Interaction Scores……………..………….……..…99
1
Chapter I
INTRODUCTION
Enrollment Management: A Shift in Perspective
Setting sail for the New World, Christopher Columbus was navigating a course through
uncharted waters. So it was for enrollment managers in American higher education as they made
the journey from gatekeeper to strategic partner (Henderson, 2008; Hossler, 1984). Whereas
Columbus, in his search for new trade routes, relied on his investors’ beliefs that the earth was
round, enrollment managers in the competitive environment of the 1970s “altered the frame of
reference that college and university administrators use to view the students as well as the
institution” (Hossler, 1986, p 11).
More specifically, colleges shifted their admission practices from gatekeeping, that is,
applying a myriad of qualifying characteristics aimed to eliminate the majority of applicants
(Steinberg, 2003), to aggressively recruiting targeted groups of students in competition with
other institutions (Riehl, 1982). Over the past four decades, American institutions of higher
education have expanded their enrollment management activities beyond admissions functions to
include the registrar’s office, financial aid, institutional research, and student advising
(Bontrager, 2004a). These siloed, function-based units, which traditionally operated independent
of one another, evolved into a student services team, collaborating to facilitate recruitment,
retention, and the graduation of students (Dolence,1998; Hossler & Kalsbeek, 2013).
In support of this transition, enrollment managers have become agents for change within
their institutions (Behn, 1983; Black, 2001). As illustrated by Hossler (1986), for some colleges,
enrollment management resulted in the adaptation of existing structures and processes. For
others, enrollment management developed new structures under a planned, incremental process:
2
a “rational” evolution (p. 57). For a third group, the changes undertaken were transformational.
As the architects of these transitions, enrollment managers developed structures and decision-
making processes that support change management. Although significant research has been
conducted related to the organizational structures that support enrollment management efforts,
there has been little investigation of the connections between those organizational structures and
the processes, notably the decision-making processes, which support change within institutions
that have developed an enrollment management enterprise.
Historical Context of the Enrollment Management Revolution
As “an assertive approach to ensuring the steady supply of qualified students required to
maintain institutional vitality” (Kemerer, Baldridge & Green, 1982, p.21), the practice of
enrollment management arose in the United States during the 1970s in response to three forces
impacting the higher education—(a) industry expansion, (b) a projected decline in college
enrollment, and (c) increasing consumer control of the marketplace, more commonly described
as student choice.
Industry Expansion
Fueled by government investment, the total number of colleges in the United States
nearly doubled between 1900 and 1950 - growing from 977 institutions at the turn of the century
to 1,851 institutions following WWII (Snyder, 1993). The pace of expansion accelerated as a
program of federal financial aid was established and the community college sector became
integral to America’s system of higher education (Cohen & Brawer, 2003). By 1980, the number
of colleges and universities in the United States had more than tripled, growing to 3,152
institutions (Snyder, 1993).
3
In the three decades that followed, the number of institutions grew at a much slower pace,
approximately 10-12% in each decade - rising to 4726 institutions in 2013 (NCES, 2015a). Most
of the growth (89%) experienced in this 30 year period occurred in the for-profit segment of the
higher education industry (NCES, 2015a). As a consequence of this growth, for-profit
institutions grew from a negligible 5% of the marketplace in 1980 to a substantial 31% of the
industry in 2013, while the growth for public and private institutions remained stagnant (NCES,
2015a). The increased competitive presence of for-profit institutions has had significant
impacton the higher education marketplace, notably in the area of marketing and recruitment
(Deming, Goldin & Katz, 2011).
Projected Decline in College Enrollments
Declining high school enrollments gave rise to concerns that college attendance would
decline (Coomes, 2000). The resulting reduction in tuition revenues was expected to have
negative results for the financial stability of the industry and its institutions (Boulding, 1975).
From 1950 to 1970, the number of students enrolled in public high schools more than doubled
rising from 5.7 million to 13 million students. Throughout the 1980s, high school enrollments
declined, hitting a low of 11.4 million in 1990. Thereafter, 9th to 12th grade enrollments rose at
a slower pace, reaching 14.7 million in recent years (NCES, 2015b). This decline was reflected
in college enrollments which remained relatively stagnant since 1980, with growth of 12% from
1980-89, 10% from 1990-99, and 9% from 2000-09 (NCES, 2015c). As a consequence,
admissions officers were tasked with actively and effectively marketing their institutions in an
increasingly competitive market (Lewison & Hawes, 2007).
4
Student Choice
Concurrent to the downward shift in high school enrollments, the federal government,
under the Higher Education Amendments of 1972, changed the distribution of financial aid
monies, transferring control of these funds from the colleges and universities by placing the
funds directly into the hands of the student. The resulting portability of federal financial aid
facilitated a student’s choice among an increased number of colleges and assisted a student’s
transfer from one college to another (Thelin, 2011). This change in policy gave the student more
financial power in the college selection process and, thereby, drastically altered the relationship
between the suppliers of college education and their consumers (Gladieux, 1995).
Managing Change
Faced with the challenge of student choice in an environment that had experienced an
increase in institutions and a decline in enrollments, America’s colleges and universities were
forced to change the way they did business (Coomes, 2000). Enrollment management was
identified as the vehicle for making that change (Black, 2001; Henderson, 2001). Just as
institutions took various paths to produce change, such as adaptation and evolution or
transformation (Hossler, 1986), the shape and size of their enrollment management enterprise
varied from one institution to the next (Dolence, 1996).
Statement of the Problem
As increasing numbers of American colleges and universities were building their
enrollment management efforts in the 1970s and 80s, the assimilation of new and developing
enrollment management activities into existing organizational operations presented a major
challenge for the individuals responsible for managing this change (Hossler, 1984, 1986).
Foremost among the obstacles to effective organization was coordinating siloed student services
5
units to produce a cohesive series of actions that effectively recruited and enrolled students
(Hossler, 1986). Furthermore, those administrators most often tasked with enrollment
management (i.e. admissions officers), commonly lacked the expertise and the authority needed
to integrate existing systems and structures in a systematic way (Henderson, 2008). As a result,
there were no methodical approaches for building the earliest enrollment management systems.
The Need for New Models
In response to the haphazard environment in which these early enrollment management
efforts were established, Kemerer, Baldridge and Green (1982) developed a framework that
grouped existing structures along a continuum of four organizational models. These models
drew attention to the need to develop effective structures and they provided enrollment managers
with a range of alternatives for building an enrollment management enterprise that was in
keeping with the cultural norms of their individual institutions. The models ranged from:
1. the loosely coupled advisory committee with a broad base of participation,
without an assignment of authority, or accountability, to any individual or group,
2. a coordinator who interacts with individual members of the effort, relying on
informal relationships, essentially the “goodwill” of constituent units that make up the
enrollment management team,
3. a matrix which provides structured cooperation among units, notably across
divisional lines, with provisional leadership from a management level individual housed
in one of the divisions, and
4. the formal hierarchical enrollment management division, which represents a
change in the organizational structure of the institution and permanent assignment of
responsibility to one individual.
6
In the decades since their development, these models have provided a framework for
much of the current research on enrollment management. Specifically, the Kemerer, Baldridge,
and Green (1982) models were developed to support the establishment of enrollment
management systems and current research has successfully captured the expansion of enrollment
management as a practice by all types of institutions. Over time, researchers identified specific
organizational characteristics that distinguished these models from one another, notably the level
of institutional restructuring required and the level of coupling between functional units
participant to the enrollment management effort (Hossler, 1986). In addition, scholarly
discussion has expanded to include the impact of institutional culture and the location of
leadership on the establishment of enrollment management efforts (Bontrager, 2004a, b).
Despite these advances, the 1980s models used in current research remain unchanged,
and some critical questions remain unanswered about the effectiveness of specific models
(Hossler & Kalsbeek, 2013). As the practice of enrollment management has expanded beyond
admissions and marketing to include retention, graduation and career services, enrollment
managers are still seeking evidence based approaches to integrating the units engaged in
enrollment management (Schulz & Lucido, 2011a). As a consequence of several decades of
developments within enrollment management, the Kemerer, Baldridge, and Green models
(1982), which helped to establish the enrollment management enterprise, serve less well for
understanding the operation of 21st century enrollment management systems (Black, 2004).
In conclusion, the Kemerer, Baldridge, and Green models (1982) contributed much to the
development of enrollment management efforts, providing a common language as the number of
colleges and universities engaged in enrollment management grew to include more than 80% of
the industry (Schulz & Lucido, 2011c). However, these models, effective as tools for developing
7
enrollment management structures, did little to support the management of those structures
(Henderson, 2005). As stated by Hossler and Kalsbeek (2013), “To date, we have no empirical
evidence as to whether the structure and composition of enrollment management units influences
their effectiveness” (p. 6).
Developing New Structural Models
In developing new structural models, scholars can look to existing research, to gain
insight and information to inform those new models. From a strategic standpoint, enrollment
management is a set of activities put in motion to achieve a specific and measurable set of
outcomes (Dolence, 1996). In this way, enrollment management supports the business end of
higher education, responsive to both the financial well-being of the institution and to external
measures of performance (Hossler & Kalsbeek, 2013). In the context of the education
environment, however, there are philosophical considerations related to the mission and vision of
an institution that must be preserved (Bontrager, 2004a). Developing decision processes that
support the integration of these perspectives is, therefore, critical to an effective enrollment
management system. In developing new models for understanding the methods, techniques and
tools that support managers’ effective direction of their enrollment management systems, it is
necessary to reframe the structure of the enrollment management enterprise to include these
decision processes.
Scholars have identified that the structural frame of an enrollment management enterprise
goes beyond the collection of units that comprise that enterprise, or the location of the authority
structures that support the enrollment management effort, to include policies and processes
employed by that effort (Black, 2004). Additionally, researchers have considered the role that
political and cultural elements of institutional environments have in shaping the policies and
8
processes within institutions (Bontrager, 2004a, b). Research has not, however, fully explored
the nature of those processes, notably the participant interactions that support the development of
policies, the establishment of goals or the resolution of problems - those very factors which
represent the operational heart of institutional change.
By their nature, enrollment management systems operate at the cusp of the external
environment and the internal workings of the college. In practical terms, enrollment managers
use these systems to position and leverage the assets of an institution in the competitive higher
education marketplace, and routinely make connections between consumer interests and
specialized units of the college (e.g. admissions and financial aid). Managing institutional
change within enrollment management systems, therefore, requires a balance between top-down
approaches that capture external goals and shared governance, which serves both to maintain the
integrity of the institution’s academic core (Birnbaum, 2003) and, ultimately, as a source of
legitimacy for decisions made (Eckel, 2000). Although the participative approach to decision
making is perceived as a means to balance external influences and internal values (Gilmour,
1991; Hagedorn & Van Slette, 2006), it is unclear if a participative approach is compatible with
other structural elements of the enrollment management enterprise, notably the trend toward
centralized authority in the form of the enrollment management division (Schulz & Lucido,
2011c).
Purpose of the Study
The purpose of this study was to confirm the use of participative decision-making
practices in enrollment management and to explore if these practices are influenced by elements
of organizational structure. The results of a qualitative study — undertaken from September
2012 through June 2013, during which I conducted semi-structured interviews with 45 senior
9
enrollment managers (i.e. deans and vice presidents), from colleges and universities accredited
by the Middle States Commission on Higher Education and the New England Association of
Schools and Colleges, with undergraduate enrollments ranging between 5,000 and 15,000
students — identified that senior managers perceived themselves to be adopting participative
management practices. Specifically, more than 70% of senior level enrollment managers in the
study described decision-making processes based on the inclusion of unit directors in creating
change, setting goals, solving problems, or making operational decisions related to the
enrollment management effort. Nearly 25% of the managers interviewed indicated that
generating discussion to make decisions took the majority of their time.
Research Questions
To confirm these participative practices, I developed a survey that was administered to
collect the perceptions of mid-level managers, specifically directors of admissions, advising,
financial aid, institutional research and the registrar, regarding their participation in decision
making at their colleges and universities. This survey tool investigated the activities of these
mid-level administrators and identified those who actively supported enrollment management
along with those with little to no involvement in enrollment management, to determine the extent
to which these administrators were participating in the decision processes at their institutions.
The research questions that guided the study are as follows:
Research Question 1: To what extent do mid-level college administrators engaged in
enrollment management perceive themselves to be participating in the decision-making
processes of their institutions?
10
Research Question 2: Is there a relationship between structural elements of the
enrollment management effort – specifically, centralization of authority, formalization
and participant interaction - and decision participation by mid-level college
administrators?
A quantitative analysis of the data collected through this survey instrument was
conducted in order to explore whether mid-level administrators are engaged in enrollment
management and if these managers are participating in decision making at their institutions.
Additional survey items captured data about structural elements, notably authority, interaction,
and formalization. The survey questionnaire was distributed electronically to directors of
admissions, advising, financial aid, institutional research and records or registration from the
same set of institutions utilized in the 2012-13 qualitative study: those public and private
colleges and universities accredited by the Middle States Commission on Higher Education
(Middle States) and the New England Association of Schools and Colleges (NEASC), which
enroll between 5,000 to 15,000 undergraduates.
Significance of the Study
To advance managers’ understandings of enrollment management systems, it is critical to
reframe these systems, to expand research perspectives beyond organizational considerations and
characteristics, and to view the enrollment management enterprise as an operational entity or
work group housed within the institution it serves. At present, the models applied to enrollment
management focus on organizational elements related to restructuring, coupling and political
culture. This approach restricts researchers’ abilities to evaluate the impact of operational
11
dimensions common to work groups, notably the level to which mid-level managers are
participant to the decision-making processes that guide their work.
This study proposes a framework for understanding the connections between enrollment
management systems, the structures that support these systems and the relationship those
structures have to the decision-making processes that support the enrollment management effort.
Research into these facets of the enrollment management enterprise will advance enrollment
managers’ understandings of operating these systems in the cohesive, effective manner the
profession demands. In other words, this study will lend detail to the map by which enrollment
managers can chart their course.
12
Chapter II
LITERATURE REVIEW
The practice of enrollment management and the systems that support this practice
evolved in an environment where action and results are critical components of the work. Two
categories of literature developed to support the manager tasked with producing “optimum”
enrollments (Dolence, 1996, p 15). The largest body of literature pertains to the functions that
comprise an enrollment management enterprise. A smaller set of publications addresses the
development of structures that support the enrollment management effort. Neither group offers
information on managing enrollment management systems or developing decision processes that
support these systems. In short, the literature focuses on the management of student enrollments
not management of the enrollment team.
Although enrollment practitioners are calling for information on these management issues
(Schulz & Lucido, 2011a), this gap in the research persists. Additionally, scholars have
expressed concerns regarding a broad range of unintended outcomes arising from
mismanagement of the enrollment enterprise, including the subversion of institutional values
(Kraatz, Ventresca & Deng, 2010), the reversal or reinvention of an enrollment management
effort coincident with changes in leadership personnel (Bontrager 2004b) and restricted access to
higher education for under-represented groups of students (Hossler, 2004).
By looking to literature on organizational structure, the models for enrollment
management can be expanded to include a broader range of characteristics that are common to
work organizations. These expanded models would support research that assists the enrollment
management professional in building structures and decision processes that support effective
enrollment management teams.
13
Enrollment Management Functions
The research that has examined the functions that comprise an enrollment management
effort demonstrates the evolution of enrollment management from a policy to a practice to a
profession (Henderson, 2001). In the early years of enrollment management, the aim of the
literature was to support a paradigm shift which defined college attendance as a product that
could be branded and marketed to a targeted group of consumers (Ingersoll, 1988).
This perspective informed the definitions of enrollment management that guided the
practice. The definitions presented in scholarly literature include: “a process, or an activity, that
influences the size, the shape and the characteristics of a student body” (Hossler, 1984, p. 6); “a
comprehensive process designed to help an institution achieve and maintain the optimum
recruitment, retention, and graduation rates of students, where “optimum” is defined within the
academic context of the institution” (Dolence, 1996, p. 16); a “systematic set of activities
designed to enable educational institutions to exert more influence over their student
enrollments” (Penn, 1999, p.5). This literature legitimized the policy of marketing in higher
education and promoted the role of admissions officers as recruiters (Dolence, 1993; Henderson,
2008; Hershey 1981; Hossler 1986).
As growing numbers of institutions adopted the policy of managing enrollments, issues
of practice became increasingly important. Various studies, conducted over several decades,
demonstrated that enrollment managers are (a) commonly recruited from narrowly defined
administrative roles, notably admissions, and (b) tasked with integrating the activities of other
highly specialized units, such as marketing, financial aid, advising, and institutional research,
into an enrollment management effort (Dolence, 1993; Henderson, 2008; Hossler, 1984;
Huddleston 2005; Niles, 2012; Schulz & Lucido, 2011a).
14
A large body of literature was developed to familiarize these administrators with the
functions of other specialists. The emphasis on the functional units that comprise enrollment
management is evident in the array of articles published in enrollment management’s two
preeminent publications: The Enrollment Management Review and the Enrollment Management
Journal. The majority of articles appearing in these publications are written from an admissions
perspective. From 2007-2008, marketing was an emphasis. This trend seems to have tapered off
in 2008, and it was nonexistent from 2010 -2011. The absorption of additional specializations,
notably financial aid and advising, into enrollment management is also evident, along with the
integration of data as a critical component. The article topics appearing in these publications
between the 2007 Winter issue through the final issue in Winter 2011 are presented in Table 1.
As the practice of enrollment management became commonplace in the 1980s, the
number of components integral to enrollment management grew, the enterprise increased in
complexity, and the practice evolved into a profession (Ingersoll, 1988). Case studies of
enrollment management efforts at specific colleges were published to encourage informed
practice among a broad range of institutions. These case studies provided details on the
experiences at some individual colleges that installed enrollment management efforts. The aim
of these studies was to demonstrate that enrollment management was doable and required no
specific construct, but could be applied in a manner unique to each college. The position that
enrollment management would take different forms at each college contributed to the delay in
development of a body of literature that would support management of the systems themselves.
The case studies highlight the integration of admissions, advising, financial aid,
institutional research and marketing (Dolence, 1996; Hossler, 1990; Huddleson, 2005) into the
enrollment management enterprise with a focus on the need to include an ever-widening range of
15
functions (Bontrager, 2004a). However, the trend toward the accumulation of administrative
units represented a hit-or-miss process which Dolence (1996), portrayed as a “false start”
characterized by “a process that is more fire, ready, aim than…ready, aim, fire” (p. 23). In this
period, adaptability of the enrollment management structure to the needs of individual
institutions was the primary target. The need to create a cohesive enrollment management engine
meant a void in expertise, or as Behn (1983) suggested, an opportunity for colleges to develop
change leadership. At present, there has been little literature or research to address this void.
Within the case studies literature is a niche group associated with strategic enrollment
management or SEM. This literature highlights the need to navigate the political environment
and cultural climate of each institution (Beals, 1996; Bontranger, 2004b; Siglar, 1996; Whiteside,
1996). Frameworks for strategic planning that had been applied to the institution as a whole,
were readily adaptable to the enrollment management organization (Hossler, 1990; Rowley,
Lujan & Dolence, 1997). Literature on strategic enrollment management supported the
management-by-objectives approach that translated external objectives into internal goals
(Hundrieser, 2012). With the focus on measurable outcomes, notably retention and graduation,
enrollment managers advanced in the organizational hierarchy to become strategic partners
(Henderson, 2008) with assigned responsibility for managing innovations and other changes to
practices and policies in support of student recruitment, retention and graduation (Black, 2001).
Although the literature moved towards a discussion of management issues, this discussion
focused on establishing an enrollment management effort, notably gaining support and
establishing goals for the effort, rather than managing the resultant components or developing
processes that supported the activities of the enterprise.
16
Enrollment Management Structures
Literature on the functional components of enrollment management has assisted
practitioners to pull together those units most critical to the enrollment goals of their institutions.
However, as demonstrated by Pugh, Hickson, and Hinings (1969), the structuring of a work
organization such as an enrollment management system requires more than the integration of
specialized units. Additional dimensions related to concentration of authority and line control of
workflow are critical to the effective operation of these systems. Although the models—
committee, coordinator, matrix and division— provided by Kemerer, Baldridge, and Green
(1982) address organizational factors related to concentration of authority, the operational
aspects of that authority have not been addressed in the literature. Structural elements that
support line control of workflow, notably operational decision-making processes, have been
similarly neglected.
Interpretations of the Model
For the most part, with little variation in description, the majority of researchers have
merely adopted the Kemerer, Baldridge, and Green (1982) models without interpretation or
extension. Consequently, current research on enrollment management structure has produced
two types of results: (a) frequency distributions of specific organizational models within certain
systems, regions or sectors of higher education, and (b) case studies of the successes or failures
experienced by institutions, depending on the fit between the model selected and the cultural or
political atmosphere in which the enrollment enterprise was established. This latter segment of
the research emphasizes political buy-in while neglecting the operational aspects of concentrated
authority and line control of work flow.
17
Hossler (1986), in his discussion of the Kemerer, Baldridge, and Green (1982) models,
introduced two continua related to centralization of authority—specifically, the tight or loose
coupling of units within each of the models and the level of organizational restructuring
undertaken to develop the model. Although effectiveness of the models was the focus of
Hossler’s research, the impacts of these institutional characteristics on decision-making
processes were not addressed.
More recently Bontrager (2004a), in his discussion of enrollment management structure,
suggested that the selection of a particular model reflects the political and cultural climate of the
institution. Bontrager positioned the Kemerer, Baldridge, and Green models relative to the
commitment of an institution to change (low to high) and the expertise of the person leading the
effort (less to more). Bontrager posited that the division structure represents the highest level of
commitment to change and the highest level of expertise, and concluded that this form was the
most effective.
Bontrager (2004a) introduced three additional dimensions to consider when studying
systems: institutional type, composition, and philosophical alignment. For the most part,
Bontrager focused on the organizational aspects of these dimensions. Although he framed
institutional types as public and private, Bontrager raised the issue of reporting lines, with the
statement that “where formal reporting lines do not exist, strong communication links [and]
formalized relationships must be established …with direct ties to institutional mission, academic
program, and student success” (p. 15). However, since 2004 when Bontrager made these
observations regarding communication and formalized relationships, there has been no research
to capture the activities or processes that support these necessary relationships.
18
Also, Bontrager (2004a) introduced composition as an organizational characteristic.
Using the chronology of institutional activities related to the student’s enrollment cycle,
Bontrager described the composition of an enrollment management effort as a range of activities
beginning with pre-college programs and ending with alumni relations. In accordance with
strategic enrollment management techniques, specifically the “cradle to grave” approach
introduced by Dolence (1998, p. 71), Bontrager focused on the centrality of various specialized
units to the effective operation of an enrollment management enterprise. He observed that “such
structure suggests a limited view of the enrollment management concept, characterizing it as a
grouping of services rather than management of goals and strategies” (p. 15). Although
Bontrager highlighted the need to connect enrollment activities with strategic goals, he stopped
short of suggesting that enrollment managers develop the skills and knowledge needed to engage
functional units in the development of goals and strategies.
Lastly, Bontrager (2004a) added philosophical alignment to the dimensions of an
enrollment management system. He expressed concern that the cross-functional nature of
enrollment management makes organizational fit complex. For Bontrager, the approaches that
might be taken by academic units are quite different from the approaches that could be taken by
student services units. He emphasized that academic units are more likely to be aligned with
“top-level decision makers” (p. 16).
Kalsbeek (2006) expanded on this discussion of philosophical alignment in a pre-
conference paper submitted to the American Association of College Registrars and Admissions
Officers (AACRAO). Described by the author as a “thought experiment,” the paper presented
the viewpoint that “the variety of (enrollment management) structures currently in place across
the landscape of American colleges and universities do not seem to be directly tied or explained
19
by differences in institutional mission, values, strategy, or type” (p. 5). Kalsbeek argued that
organization structure is an outcome of the strategic orientation of an institution, specifically its
approach to its marketplace. According to Kalsbeek, this orientation can be described as
administrative, student-focused, academic, or market-centered. He suggested that the differences
in orientation serve to explain the structural differences among colleges. In his third article on
the topic of enrollment management structure, Kalsbeek (2007) centered his discussion on
Jungian theories of decision making, specifically the impact of perception on information
collection and the impact of judgment on analysis. Kalsbeek extended the variations in
individual thinking processes to decision processes within institutions. Kalsbeek’s typology,
with its four organizational orientations, aligns in many ways with Bontrager’s (2004) assertion
that differences in philosophical perspectives produce variations in organizational structure.
One critical difference between Bontrager and Kalsbeek is their contrasting theories on
the forces that impact organizational structure. According to Bontrager, philosophical alignment
is the result of internal factors such as mission and values along with the cultural and political
climate within the institution, whereas Kalsbeek’s organizational orientation is the product of
external factors, specifically “the higher education marketplace and an institution’s competitive
market position” (Kalsbeek, 2006, p 5). Although both Bontrager and Kalsbeek suggested that
different approaches and outcomes might result from differences in the decision processes
utilized in an enrollment management effort, neither explored how those processes are
represented within the enrollment management enterprise, for example, the groups that
participate in decision making.
20
Enrollment Management Practitioners
More recently, as the number of institutions engaged in enrollment management has risen
to more than 80% of the industry (Schulz & Lucido, 2011c), literature supported by practitioner-
based survey research and interview studies has proliferated.
Survey Research
Numerous studies with senior level enrollment managers and some studies with mid-level
functional administrators have been conducted to capture the expansion and perceived
effectiveness of enrollment management activities at various groups of institutions. Various
facets of enrollment management have been considered ranging from leadership styles to
preferred models for enrollment management structure.
Hughes (2005) conducted research on leadership styles among enrollment managers
using the classifications transactional and transformational. The findings were that enrollment
managers did not have a predilection towards either of the two styles. In other words, enrollment
managers appeared equally likely to lead their teams through a top down reward-punishment
style or an adaptive participative style “ascribed with effecting change by influencing values,
attitudes and behaviors…converting followers into leaders…work[ing] with followers to
enhance performance and generate creative solutions to complex problems” (Hughes, 2005, p.
8). However, the structure of the enrollment management enterprise was not a factor that
informed Hughes’s study.
Abston (2010) used a survey of community college administrators to capture perceived
availability, importance and the effectiveness of the various constituent units that comprise
enrollment management in the community college system in Alabama. The survey instrument
used in his study provides a description of the Kemerer, Baldridge, and Green models that
21
captured reporting relationships and functional units, but did not address these elements
individually. One finding from the study was that certain groups of administrators identified
more closely with specific organizational models (e.g. chief academic officers who responded to
the survey were the most likely to select a coordinator model as being similar to their
institution’s model and. directors of admissions were most likely to select a division as being
similar).
Cesarini (2011) conducted a similar study with 4-year institutions in Ohio and expanded
the inquiry into existent and preferred organizational models for enrollment management. Data
from the Ohio study shows that although most colleges utilized the division model, academic
administrators favored less centralized forms of enrollment management structures.
Everett (2012) surveyed financial aid directors from 4-year institutions regarding their
perceptions of the effectiveness of the enrollment models developed by Kemerer, Baldridge, and
Green (1982). One significant finding from this study is that financial aid directors perceived the
division model to be the most effective. The research focused on the functional elements
represented within the four models (i.e. committee, coordinator, matrix, and division), but did
not capture the structural elements present in the models. As a result, no conclusions could be
drawn about the relationship between the perceptions of financial aid directors and the structural
elements that differentiate the models.
Interview Studies
Schulz and Lucido (2009, 2011a, b, c) conducted numerous interview-based studies
related to institutional efforts and enrollment managers perceptions. In a study that looked at
centralization of enrollment systems, Schulz and Lucido (2009, 2011c) viewed centralization as
an organizational behavior. Their study captured the factors that influence the institution’s choice
22
to centralize rather than the impact of that choice on the decision processes of the enrollment
management enterprise.
In another study, Schulz and Lucido, (2011b) looked at the sources of information
available to enrollment managers regarding managing their enrollment systems, noting that their
primary sources were commercial vendors. The researchers raised numerous concerns about the
impact of external influences, noting the need to find “the proper balance between educational
values and commercial practices” (p. 20). Although Schulz and Lucido’s research raised
important issues, it did not capture these choices as the outcome of decision-making processes.
As a consequence, the researchers suggested changing the choices being made by institutions,
but not the decision processes by which those choices were made.
In a third study, Schulz and Lucido (2011a) captured the concerns of enrollment
managers regarding their professional development, with the highest level of concern related to
managing the units and the personnel that directly support the enrollment management effort.
The area of experience that was most valuable to these managers was “working within an
institution that strategically coordinates a variety of individual units using a holistic approach to
enrollment management” (p. 18). Having gained this emphasis from the enrollment managers,
the research failed to capture the reasons this experience was considered valuable.
Enrollment Management Teams
The literature on enrollment management does not capture information about the full
range of structures that guide the governance and decision-making processes that impact the
operation, and therefore the success, of the enrollment management enterprise. Two of the
challenges to developing this research are the need for theories that accommodate a range of
governance modes and a definition of decision making that permits comparisons among
23
institutions. More specifically, it is known that college and university environments are a
complex mix for managers because these environments require a balancing act between the
interests of internal and external stakeholders. As a consequence, there is a range of governance
modes that operate within higher education, anchored on one end by shared governance —which
is guided by internal areas of expertise—and, on the other end, by the management-by-
objectives approaches that routinely integrate externally-driven goals into the decision- making
processes of the institution. Enrollment managers—who are sitting at the cusp of the internal
and external environments—experience the pressures that arise when they try to reconcile the
goals of both spheres. Given the constancy of these pressures and the need to develop structures
and processes that accommodate these pressures, it is critical that researchers expand their work
to address the challenges enrollment managers face when managing their teams. As observed by
Adrianna Kezar in the foreword to Gayle, Tewarie and White’s (2011) book on university
governance, although there is a lack of consensus regarding effective practices, there is
agreement that current practices are failing American institutions.
“Tension is growing between traditional academic governance and corporate
approaches to decision-making, with most commentators concluding that neither
approach in its current form will successfully meet the challenges of today’s
environment. (p. ii)”
Although enrollment management literature is not currently addressing these issues, there are
sources of literature, notably from organizational theory, which can provide appropriate models.
Team Configurations
Bolman and Deal’s (2008) discussion of team configurations provides a framework for
understanding how decision-making models impact enrollment management efforts. A shared
24
governance structure engages all members of the college community based on their functional
areas. This structure is akin to the “all channel network” where “decisions require touching
multiple bases” (Bolman & Deal, p. 104). According to the authors “this arrangement works
well if a task is amorphous or complicated, but it is slow and inefficient for a simpler
undertaking” (p. 105), For the goal-directed, time sensitive work undertaken in enrollment
management, shared governance is too unwieldy to produce results.
In contrast, management-by-objectives is similar to the “one-boss” arrangement that
keeps subordinates isolated from one another (Bolman & Deal, 2008 p 102). This arrangement
permits, but discourages, a two-way conversation about goals. As a consequence of reduced
feedback, “Subordinates quickly become frustrated when directives they receive are poorly timed
or ill-suited to a situation” (Bolman & Deal, 2008, p 103). Additionally, given the level of
interaction required among team members to effect enrollment management activities, the one-
boss arrangement creates communication hurdles that disrupt cohesive action.
Participative management techniques require a decision-making structure similar to the
“circle network,” described by Bolman and Deal (2008, p 105) as lateral and sequential wherein
“Each person has to deal directly with only two others.” In a circle network, communication is
constantly occurring, notably information is exchanged and feedback is received. With the many
factors that can obstruct or propel student success, a participative decision-making structure can
be more responsive than shared governance or management by objectives.
Structure and Function
In their discussion of organizational structures comprised of units based on operational
functions, Bess and Dee (2008a) highlighted some potential disadvantages that may arise
including: reducing knowledge of other functional units, hindering cooperation and coordination
25
between functional units, and elevating decision making to senior managers. Using enrollment
management teams as their example, Bess and Dee stated “In spite of the apparent logic of the
conclusions about organizing by function, current organizational design research is exploring
whether functional forms are effective in every case” and, citing Hackman (1990), Bess and Dee
continued, “Instead, teams of different kinds of experts completing a set of specialized tasks may
be better than many whole departments of different kinds of specialists” (p. 217). From this
discussion, it is clear that Bess and Dee viewed the enrollment management enterprise of
colleges and universities as a work group or team.
Bess and Dee (2008a) connected function and structure, and noted that project-based
work teams “require communication among different departments and projects to improve the
linkages across the system and to induce a more organization wide orientation and focus” (p.
220), thereby necessitating a shift in organizational structure. Although the authors asserted that
centralized structures hinder decision participation, they acknowledged that, in colleges and
universities, both “centralized and decentralized decisions can be made hierarchically or with
much participation” (p. 214).
Decision Making
In their discussion of decision making, Bess and Dee (2008a, p. 212) highlighted a
schema developed by Helsabeck (1973) wherein decision activities are divided into four basic
functions: allocation of authority, allocation of resources, acquisition of resources, and
production. When plotted against two criteria, centricity and participation, production decisions
at both the institution and the unit level ranked high in participation regardless of centricity.
With the exception of unit level resource acquisition, the other decision activities required low
levels of participation. This demonstrates that operational decisions are best made among a
26
broad range of staff at the production or line-level, while organizational decisions—such as
allocation of authority and allocation of resources—require a reduced level of participation.
Consequently when looking at the effectiveness of work teams, it is critical to consider various
elements of structure, including the decision processes that support the team’s activities.
In their article on decision making, Morris, Greenwood, and Fairclough (2010)
highlighted the characteristics of professional service firms and contrasted these organizations
with the more labor-capital intensive organizations that are commonly studied when looking at
decision making in organizations. As described by the authors, professional service firms are
founded on the application of specialized areas of knowledge to specific client contexts. In this
way, the activities of professional service firms mirror the role that an enrollment management
enterprise plays within a college or university.
Management of these firms is also similar to that of an enrollment management
enterprise. Morris, Greenwood, and Fairclough (2010) suggested that the successful professional
service firm (PSF) is often led by a manager who can “build the consensus needed to form
agreements about the decisions a PSF needs to make in order to remain competitive” (p. 302).
Additionally the authors present that, “The traditional means of addressing the challenges posed
by the professional, institutional and technical requirements of professional service has been
through the use of an organizational form which emphasizes collegial forms of governance” (p.
284) and “professional partnerships” (p. 285).
Morris, Greenwood, and Fairclough (2010) further asserted that professional service
firms provide an opportunity to explore non-strategic or routine decision making (e.g.
operational decisions) in their statement “Although these small (non-strategic) decisions were
27
not of great import for the long-term direction of the organization, they were not always as
‘trivial’ or inconsequential as implied by the state of existing decision-making research” (p. 290).
The authors claimed that “collective” decision practices are sometimes replaced with
more formal structures and bureaucratic controls, but observed that, despite such changes,
“managers must still deal with a diverse set of autonomous professionals whose working
agreement requires the establishment of consensus” (Morris, Greenwood, & Fairclough, 2010, p.
301).
Marshall Sashkin (1986) advanced the theory that managers can design or construct
workplace conditions that will support participative management practices. He endorsed
participative management claiming that participation promoted the acceptance of goals and,
consequently, greater likelihood of achieving those goals. Sashkin also discussed the limits of
management research that focused on individual aims and performance rather than groups and
organizational processes, notably “organizational approaches to improvement” (p. 73). When
applying these participative practices to organizational change and the decision processes of
work groups (e.g. enrollment management teams), the decision activities highlighted in
Sashkin’s (1982) research include: setting goals, developing decision alternatives, solving
problems, and creating change. As a means to establish a definition for decision making in work
organizations, these four decision activities are a good core from which to start.
Structural Elements of Work Organizations
Having established an understanding of work teams and their decision-making processes,
it remains to review literature relative to the structural elements of work organizations.
Mintzberg (1979) provided a perspective on organizations that captured concepts critical to
projects and work groups such as enrollment management teams, and stated “The structure of an
28
organization can be defined simply as the sum total of the ways in which it divides its labor into
distinct tasks and then achieves coordination among them” (p.2). The early enrollment
management literature that focused on functions supported the assignment of specific roles and
distinct tasks to units and individuals that are engaged in the management of enrollments for an
institution, but failed to address the coordination of these functions.
Existing organizational models (coordinator, committee, matrix and division), even with
the advanced interpretations contributed by Hossler (1986) and Bontrager (2004a), fall short of
explaining how enrollment managers can achieve the level of collaboration required among those
functional units. Even for institutions without formal centralization of the enrollment
management effort, “coordination” and “cooperation” along with cohesion in a variety of
decision-making processes is reported as desirable (Schulz & Lucido, 2011c, p.31). Therefore, a
greater understanding of these processes and of the connections between decision making and
structural dimensions is critical to developing effective enrollment management systems.
Pugh, Hickson, and Hinings (1969) developed a taxonomy of work organization
structures which provides a framework for discussing the characteristics that differentiate one
organization from another, specifically (a) the structuring of activities within the organization,
(b) the level to which authority is concentrated and (c) the line control of workflow. Identified in
this taxonomy, and in support of these three dimensions are elements related to: (a)
specialization of functions, (b) the standardization of procedures, (c) centralization of authority,
(d) formalization of operations, and (e) decision making, notably as it relates to line control of
workflow.
To the extent that an enrollment management enterprise represents a team effort among
specialized units with standardized procedures (e.g., admissions, financial aid, and advising),
29
most aspects of structure related to specialization and standardization are evident in the
composition of the work group. The level to which authority is centralized is also evident based
on the committee, coordinator, matrix, or division models that house the enrollment management
effort. However, two of the supporting elements from Pugh, Hickson, and Hinings’ (1969)
taxonomy, the formalization of operations and line control of decision making, are not addressed
in the existing enrollment management models. Prior studies on enrollment management have
suggested that these structural elements impact the decision processes and, consequently, the
outcomes, of an enrollment management system (Bontrager, 2004a; Schulz & Lucido, 2009).
In summary, although the centralization of authority and the structuring of activities are
captured in the literature on enrollment management, the impacts of these elements have not
been explored. Additionally, other critical elements of structure have been neglected. Those
elements related to line control of workflow, notably formalization and production level decision
making, have not been the subject of enrollment management research. Without greater
understanding of these aspects of enrollment management structure, determining effective
methods for managing the enrollment management team will remain elusive.
To expand the research into the operational aspects of enrollment management, two gaps
in the literature must be addressed. Initially, a reframing of enrollment management structure is
needed to address a broader range of research questions, notably questions pertaining to the
strategic coordination of production-level units and the impact of decision-making practices on
the holistic management of these units. One avenue for such research is provided through
studies of organizational behavior that focus on teams. With most institutions of all types now
engaged in the management of their enrollments, survey instruments have become a primary
source of information supporting studies of managers’ perceptions, attitudes and practices.
30
These instruments can be used to collect information regarding structural elements supporting a
new framework for analysis.
To further researchers’ understandings of managing these teams, a working definition for
decision-making that is applicable to enrollment management must be developed. Research on
organizational management provides some guidance into definitions of decision making that
pertain to project or production-based interactions among institutional units. The use of
qualitative and quantitative methods, notably interviews and survey tools applied among decision
participants, could support the development of this definition.
31
Chapter III
METHODS
This chapter outlines the overall research design for the project and the research
methodologies applied to each of the research questions addressed in this study.
The purpose of this study was to explore the use of participative decision-making
practices in enrollment management and to see if these practices are influenced by other
elements of organizational structure. In this study, I presented a framework for understanding the
connections between enrollment management systems, notably the structures that support these
systems, and the decision-making processes within an institution. Research into these facets of
the enrollment management enterprise was undertaken to advance enrollment managers’
understandings of operating these systems in the cohesive, effective manner the profession
demands.
The framework for this study was built on theories of decision participation in work
environments that capture both operational and structural elements of work teams and the
organizations that support them. This approach combined the organizational taxonomy
developed by Pugh, Hickson, and Hinings (1969) with the models introduced by Kemerer,
Baldridge, and Green (1982). Additionally, it incorporated the theoretical advances of
enrollment management scholars, such as Hossler (1986) and Bontrager (2004a), within the
context of the profession as captured in the research by Schulz and Lucido (2009, 2011 a, b, c).
The methodologies for measuring decision participation were anchored in theories developed by
Sashkin (1986) and were informed by the more recent work of Bolman and Deal (2008) on team
configurations and Bess and Dee (2008) regarding organizational structure and function.
32
An ancillary goal of the study was to develop a new approach for researching the
enrollment management enterprise—an approach that facilitates the application of organizational
theories to this aspect of higher education management through the exploration of the structures
of enrollment management in the context of enrollment management processes and activities. As
a result, the measures employed in this study were developed specifically to advance an
understanding of the enrollment management effort as an amalgamated work organization
comprised of multiple independently functioning units. The aim of the research was to provide a
broad range of input, from each of the units known to sustain enrollment management, informing
the results of this study.
The primary instrument for data collection was a survey that was administered to mid-
level college administrators from units known to support enrollment management efforts—
specifically, directors and managers from the offices of admissions, advising, financial aid,
institutional research, and the registrar.
Research Design
In developing this study, a sequential exploratory model was employed in which
qualitative data informed a quantitative study (Creswell, 2009). The qualitative approach was
used in the first phase of exploration because a core characteristic of qualitative methodology is
the ability to adapt data collection as new-found understandings emerge (Charmaz, 2006;
LeCompte & Schensul, 1999). Beginning with semi-structured interviews conducted between
2012 and 2013 with 45 senior managers involved in enrollment management, the qualitative
study explored the changes that occurred within institutions of higher education in tandem with
the integration of an enrollment management effort. The results of this research raised questions
33
regarding decision participation by mid-level managers. These questions regarding decision
participation are at the core of this survey research:
Research Question 1: To what extent do mid-level college administrators engaged in
enrollment management perceive themselves to be participating in the decision-making
processes of their institutions?
Research Question 2: Is there a relationship between structural elements of the
enrollment management effort—specifically, centralization of authority, participant
interaction and formalization— and decision participation by mid-level administrators?
This second phase of research explored the decision activities of mid-level college
administrators in tandem with structural elements common to work organizations. A survey
instrument was developed to collect information regarding whether those administrators formally
engaged in enrollment management perceived themselves to be participating in the decision-
making processes of their institution. The study also explored whether this perception was
impacted by the structure of the enrollment management effort. More specifically, the survey
instrument captured information related to three aspects of the respondent’s circumstances: (a)
engagement in enrollment management, (b) participation in decision making, and (c)
characteristics of the respondent’s institution including the authority, formalization, and
participant interaction present in that enrollment management effort.
Population and Sample
The sampling frame for this survey study initially represented the same population of
institutions as the sampling frame applied to the earlier interview research. Specifically, the
sample of senior managers used in the qualitative study was drawn from those colleges and
34
universities, accredited by the Middle States Commission on Higher Education and the New
England Association of Schools and Colleges, which enrolled between 5,000 to 15,000
undergraduates. These institutions ranged from the most highly selective private institutions to
open enrollment community colleges. The interview study found that nearly 70% of senior
enrollment managers discussed their efforts to establish decision participation processes centered
around the inclusion of mid-level managers. This study found that these efforts were prevalent
among all types of institutions: public or private, 2-year or 4-year, selective or open enrollment.
Furthermore, the study found that, for 25% of the participants, these efforts took the majority of
the managers work time.
Given these findings, the same 130 institutions provided the core population of mid-level
managers that received the survey instrument in this second phase of exploratory research. The
strategy for expanding the study population was to survey mid-level managers from similar
institutions in two states, specifically Ohio and Virginia, both contiguous to the regional core. A
total of 680 individuals, approximately five from each institution were asked to participate,
specifically the directors of admissions, financial aid, student advising, institutional research and
the registrar’s office. The institutions were identified though their accreditation agency websites.
The mid-level managers were identified through their institutional websites.
Population Parameters
There were several considerations that guided the selection of the population that
supported the interview research conducted in 2012-13. Whenever possible, the interviews were
conducted in person; therefore proximity to the principal investigator’s work and school
activities was the primary factor in the decision to limit the population to colleges and
universities accredited by NEASC and Middle States. Additionally, only those managers from
35
colleges and universities with undergraduate enrollments that ranged from 5,000 to 15,000
students were included in the population. The decision to exclude institutions with enrollments
of less than 5,000 and institutions with more than 15,000 undergraduates was made because the
size of a student population could dictate the choices available to an institution regarding their
enrollment management effort. For example, smaller institutions might not have the resources
available to develop a stand-alone division and larger institutions might utilize a program-based
enrollment management effort rather than an institution-wide approach. The study sought to
identify practices selected when, apart from unpredictable constraints, a full range of choices was
available. Consequently, only those managers employed at mid-size institutions were included
in the study. The interview study also excluded enrollment management at the graduate level
because graduate programs typically conduct program-based recruitment of students and this
study aimed to understand changes that occurred at the institutional level. Lastly, enrollment
management practices are unique to each college or university based on the individual
characteristics of the institution and its response to its environment. As a consequence, there was
no way to develop a representative sample from any group of institutions. Therefore, managers
from all 150 mid-size institutions were included in the sample.
Sample
A total of 680 mid-level administrators from 150 institutions were sent a link to the
survey. They included directors of admissions, advising, financial aid, institutional research, and
records or registration from the 130 original colleges and universities, supplemented by an
additional 20 institutions that were identified when the survey administration was expanded. The
entire population was surveyed.
36
The following states were represented in the sample frame: Connecticut, Delaware,
Maine, Maryland, Massachusetts, New Hampshire, New Jersey, New York, Ohio, Pennsylvania,
Rhode Island, Vermont, Virginia and Washington, DC. The survey responses were collected
anonymously; therefore, it cannot be confirmed that institutions from each of the states were
included. However, through the use of two separate survey links, it is known that institutions
from both accrediting agencies were represented in the results. To maintain the highest possible
levels of anonymity for each respondent, all responses from both links were combined prior to
any review, cleaning, or screening of the data.
The overall population of 680 mid-level directors produced 197 completed surveys for a
response rate of 29%. The initial 130 institutions produced 152 surveys; the additional 20
institutions produced 45 surveys. From the completed surveys, 14 surveys were excluded from
the study, leaving a total of 183 surveys. Thirteen individuals were removed because they
identified themselves as senior managers who reported to the president of the college. One other
respondent was removed because this person answered only three survey items
The respondents to the survey reported institutional characteristics that closely reflected
the institutional composition of the studied geographic region. The characteristics reported to the
Integrated Postsecondary Education Data System (IPEDS) by mid-size institutions in the region,
as compared to the survey results, were as follows: public institutions - 70% IPEDS versus 72%
survey, private institutions - 28% versus 27%, and for profit institutions - 2% versus. 1%; 2-year
institutions were 40% versus 40% and 4-year institutions were 60% versus 60% (NCES, 2015d).
Functional representation was less evenly distributed. Based on the approximately 150 surveys
sent to each of the five functional areas— admissions, financial aid, institutional research,
registrar and student advising— the highest rates of response were generated by admissions
37
(25%) and institutional research (29%). Financial Aid (17%), registration (15%) and student
advising (15%) made up the second tier. The Director of Admissions and Financial Aid position
was a combined function at about 20% of the colleges and universities represented in the
sampling frame. Additionally, there were respondents (18%) who selected an alternative
functional category; specifically, these respondents were evenly distributed between the
categories of enrollment management and other. Overall the work area breakdown for the 183
respondents was admission/marketing (20%), enrollment management (8%), financial aid (14%),
institutional research (23%) records or registration (13%), student advising (12%) and other
(10%). (see Tables 2 and 3.)
Data Collection
The data were collected from mid-level managers working in those units of colleges and
universities which, as indicated by the literature, commonly participate in enrollment
management efforts. The overall aim of the data collection was to gain a broad perspective on
the engagement of mid-level managers in enrollment management and their participation in
decision-making processes. The instrument used to collect the data was a survey that was
administered through a link sent in an email to each of the managers. The managers, along with
their email contact information, were identified through individual office listings on the websites
of their institutions. Specifically, the survey was sent to individuals listed as directors of
admissions, advising, financial aid, institutional research, or as the registrar. The request to
participate was sent twice to all identified mid-level managers. Emails were re-sent a third time if
the person was on vacation or leave. For individuals who had retired or taken new positions, the
alternative contact was utilized when provided. Of the emails sent, there were only five email
addresses that returned without redress options.
38
Survey Instrument
The survey instrument included a total of 37 items and was designed to collect
information that supported the research questions. This included items intended to measure (a)
the respondent’s engagement in enrollment management (independent variable), (b) the
respondent’s participation in decision making (dependent variable), and (c) three potential
mediating factors related to the institution’s enrollment management effort, specifically levels of
(a) authority, (b) formalization, and (c) participant interactions with institutional units. For all
but one of these items (authority), a scale was developed using multiple survey items.
Additionally, the survey instrument collected data on respondent demographics and institutional
characteristics. A copy of the survey is provided in Appendix A.
Reliability and validity of the survey instrument. When conducting research using a
survey instrument, the conclusions drawn from the data rely on the validity and the reliability of
the survey items that populate the variables used in the study. Survey items have validity if they
fully measure the attitudes or attributes (e.g. decision participation) they were intended to
measure (Stangor, 2006). The measures (survey items) used in a survey instrument are
considered to have reliability if they consistently produce the same results under multiple
applications, essentially multiple administrations of the survey. Additionally, items that comprise
a scale should be internally consistent, producing similar results for related items (Pallant, 2010).
For this project, which is using a previously untested tool, tests demonstrating reliability and
validity were critical to the value of the conclusions drawn.
Validity. The validity of the survey instrument was tested through a pilot survey
administered to a total of 20 mid-level administrators, 5 each from one public community
college, one public 4-year college, one private 4-year college and one for-profit institution. To
39
determine face and content validity, feedback was solicited from the administrators to determine
if any questions were confusing, misunderstood or if any measures were incomplete. A
comparison of answers among similar survey items was used to evaluate construct validity.
Construct validity was likewise tested after full administration of the survey.
Reliability. Reliability of the survey instrument while in pilot was tested by manually
comparing the responses to survey items against similar or related survey items. Due to the
small number of items (<10) that comprised the scales in the survey, it was determined that
Cronbach’s alpha might not serve as an adequate test of reliability (Tang & Cui, 2013).
Therefore, after full administration of the survey, I tested for reliability using mean inter-item
correlation values. As recommended by Clark and Watson (1995 p. 316)—and in accord with
research conducted by Briggs and Cheek (1986) and Green (1978)— I sought values that ranged
from.15 to .50. All scales developed from the survey responses and used in the analysis fell
within acceptable values after being tested using mean inter-item correlation. Results of these
tests are discussed in the Data Analysis section of Chapter III.
One item (Question 7) from the survey was removed from the analysis due to the low
level of response to this item. Although there were no missing values to this item, nearly half of
the survey respondents (46%) replied that they were “not sure” what resources had been assigned
to support enrollment management. I determined that the dearth of affirmative responses would
undermine the value of any findings.
Variables
I developed five variables for analysis in this study. A copy of the Variable Coding
Guide is provided in Appendix B.
40
Engagement in Enrollment Management
The independent variable, respondents’ engagement in enrollment management, was
identified based on a respondent indicating, in Question 20, that s/he is (a) formally supportive of
Enrollment Management efforts:
as the director of my work area,
as a member of an Enrollment Management Division,
as a member of a Formal Committee for enrollment management,
as an advisor or consultant (not a member) of a Formal Committee,
as a member of an enrollment management Work Group/Team,
as a participant to informal discussions about enrollment, or
not involved in enrollment management.
and, in Question 24, (b) actively involved in enrollment management activities:
follow instructions about enrollment management goals and policies,
identify problems related to enrollment management efforts,
produce data related to enrollment management activities and outcomes,
report to senior leadership about enrollment management activities,
solve problems related to enrollment management activities,
make decisions about enrollment management goals and policies,
coordinate enrollment management activities, or
n/a or not sure.
The responses to Question 20 were used to divide the survey participants into two groups, those
with formal engagement in enrollment management (Group A) and those with informal or no
engagement in enrollment management (Group B). In addition, the survey respondents assigned
41
to Group A were further determined to be actively engaged in enrollment management activities
from their responses to Question 24.
Participation in Decision Making
The dependent variable, respondent’s participation in decision making, was measured by
the response to Question 12, the level to which s/he exerts control over the work product and,
additionally, the responses to Questions 15 through 19, whether s/he is involved with:
setting goals,
solving problems,
facilitating change,
creating policies or decision options, or with
strategic planning for the institution.
One point was awarded for each decision activity for which the respondent reported
involvement, with one additional point awarded for a response that indicated that s/he exerted
control over their work product. A scale or participation score that ranged from 0-6 was
developed from responses to these survey items. This scale was used to identify respondents’
levels of decision participation.
Institutional Characteristics
Characteristics of the enrollment management effort at each respondent’s institution were
identified based on the respondent indicating various elements of authority, formalization and
participant interaction. These institutional characteristics were explored as mediating variables
that might impact decision participation among those respondents engaged in enrollment
management.
42
Authority. The survey item that captured leadership, Question 6, was used to measure
levels of centralization of authority. Although only this one dichotomously-coded item was used
to reflect centralized authority, the responses to Question 23—regarding the functions of the
enrollment management work group or team—were reviewed to confirm that decision-making
activities were associated with the indicated authority. Results from the responses to Question 6
were used to produce three definitions for centralized authority. In Round 1, centralized
authority was limited to those environments characterized by an enrollment management
division. In Round 2, centralized authority was limited to enrollment management efforts led by
a senior manager in academic affairs or student services. In Round 3, the definition of centralized
authority was expanded to include the enrollment management division plus those enrollment
management efforts led by a senior manager in academic affairs or student services.
Formalization. Aspects of formalization were combined to form a composite variable
which included the length of time an enrollment management effort was in place, the existence
of written goals and plans, and the level and type of leadership assigned to enrollment
management. A fourth element originally slated for inclusion, the types of resources assigned to
the enrollment management effort, was excluded from the analysis due to a high level of “not
sure” responses (46%). Therefore, the scale developed to reflect varied levels of formalization
consisted of Questions 4 through 6 with potential scores ranging from 0 to 9. For each element of
the scale, a point value ranging from 1 to 3 points was assigned based on the extent to which the
item had been formalized. The most formalized items (e.g. a written plan) received 3 points,
while the least formalized items (e.g. a general effort with no goals) received 1 point. A 0 was
awarded if the respondent indicated there was no item supporting the element (e.g. no plan or
goals).
43
Participant interaction. The level of participant interaction was measured by the
responses to Questions 8 through 11, which asked about the frequency with which the
respondent interacted with various sectors of the institution, including academic and instructional
staff, student services, and administration. The most frequent interaction (i.e. daily) received 4
points, while the least frequent interaction (i.e. less than monthly) received 1 point. A 0 was
awarded if the respondent indicated there was no interaction. A scale or interaction score that
ranged from 0 to16 was developed from responses to the survey items.
Data Analysis
For this exploratory study, which used a new approach to analyzing the enrollment
management enterprise, I determined to keep the project smaller, with the same regional scope as
the prior qualitative research. From the 680 surveys sent to mid-level administrators, a total of
183 respondents provided data that was used in the analysis of the survey results. Sample sizes
were tested and this response was determined sufficient to analyze the results of the survey with
adequate precision.
Data Cleaning and Screening
After the initial review and removal of 14 surveys, the remaining 183 surveys were
screened for work and institutional characteristics that might skew the results. For example, was
the length of time a respondent was in a position or the level of selectivity of the institution
associated with the dependent variable, decision participation, or the independent variable,
engagement in enrollment management? Were respondent work areas associated with decision
making or active engagement in enrollment management? A set of respondent profiles was
developed to assess relationships between respondent characteristics and the variables under
study. The Tables 2 and 3 show the demographic and work characteristics for the respondents
44
and their institutions while Tables 4 and 5 provide details about the respondents’ engagement in
enrollment management and decision participation.
The analysis of the profiles showed that incidence rates for engagement in enrollment
management (see Table 4) and incidence rates for decision participation (see Table 5) were
similar across the categories for related work and institutional characteristics. For time in
position all segments reported 50% engagement in enrollment management; for decision
participation these segments ranged from 58 to 65%. Results for time with institution ranged
from 49% to 58% for engagement in enrollment management and 57 to 60% for decision
participation.
For several institutional characteristics, the results were also closely aligned. By degree
levels, engagement in enrollment management was reported by about 50% of all respondents and
decision participation was reported by about 60% of all respondents. By recruitment region,
respondents reported engagement in enrollment management that ranged from 57% to 62% and
decision participation with the same range 57% to 62%. Respondents from public institutions
reported higher levels of engagement in enrollment management than did respondents from
private (54% vs. 41%) and higher levels of decision participation (62% vs. 54%).
Results by institutional selectivity produced a broader range of outcomes for engagement
in enrollment management. Specifically, engagement in enrollment management was reported
by 40% of the respondents who worked for highly selective institutions, 49% for those working
for open enrollment institutions, and 53% for those working for selective institutions; decision
participation reported by respondents working for these institutions was 67%, 58% and 65%
respectively. It is interesting to note that the percentage of respondents engaged in enrollment
management was lower for highly selective institutions, yet decision participation was reported
45
at higher levels whereas respondents from open enrollment institutions were more likely to be
engaged in enrollment management, but less likely to report decision participation. In contrast,
respondents from selective institutions reported both higher levels of engagement in enrollment
management and higher levels of decision participation.
Engagement in enrollment management varied widely among the work areas reported by
respondents, ranging from 30% for institutional research to 85% for enrollment management.
Decision participation hovered near 50% for admissions (47%), financial aid (52%), and student
advising (50%). Higher rates of decision participation were reported by institutional research
(65%) and registration (69%). The highest levels of decision participation were reported among
those respondents who selected the alternative functional categories of enrollment management
(71%) and other (75%). Although some patterns appeared which showed promise for the
research, there was no evidence that these relationships would compromise the analysis of the
survey results.
Analytical Tools
Relative risk was selected as the primary tool for analysis, given that it was a cohort
study and that the rate of exposure to enrollment management among the participants was
expected to be high (McNutt, Wu, Xue & Haffner, 2003; Viera, 2008). Based on standard a
priori analytical practices for sample size calculations (Creswell, 2013), exposure to enrollment
management was estimated to be 50% in advance of the study. Analysis of the surveys found
50% as the actual rate of exposure to engagement in enrollment management.
In a cohort study aimed to gauge relative risk, the researcher measures the likelihood of
contracting a condition by comparing the proportion of those exposed who contracted the
condition with the proportion of the unexposed who contracted the condition. In the context of
46
this study: Are mid-level administrators exposed to engagement in enrollment management more
or less likely to contract the condition decision participation than those similarly situated mid-
level managers who had not been exposed to engagement in enrollment management? Relative
risk additionally accommodates mediating factors in the environment, such as those introduced
in this study: the centralization of authority, formalization of the enrollment management efforts
and interactions by the survey respondents with various units of their institution.
Reliability and Validity of the Measures Employed in the Study
This study tested four hypotheses related to the two research questions of this study. The
measures for the independent, dependent, and mediating variables used in the study were
developed initially as scales and then recoded dichotomously. Reliability was tested for each of
the scales using mean inter-item correlation. The mean inter-item correlations for each scale fell
between .15 and .50 (Clark & Watson, 1995) as follows: engagement (r=.452), decision
participation (r=.325), formalization (r=.229), and interaction (r=.291). Although Cronbach’s
alpha was not directly used to measure reliability due to the small number of items in each scale,
the scales were adjusted based on contributions to Cronbach’s alpha. For engagement in
enrollment management, it was determined that “follow instructions about enrollment
management goals and policies” should be removed because this element was a poor fit for the
scale: the response to this item suppressed Cronbach’s alpha. The scale that was originally
designed to capture centralization of authority failed to measure the construct; consequently it
was determined that the response to one survey item, Question 6, regarding the leadership of the
enrollment management effort, should be used with the qualification that enrollment
management activities were associated with that leadership (Question 23).
47
Research Questions and Hypotheses
Hypotheses were developed for each of the research questions. For the first research
question, a hypothesis was developed to test relationships between the dependent variable and
the independent variable. This relationship was tested further in the context of the three
mediating variables, as noted in a second research question. Therefore, the analysis of the
second research question consisted of three separate hypotheses.
Research Question 1: To what extent do mid-level college administrators engaged in
enrollment management perceive themselves to be participating in the decision-making
processes of their institutions?
H0E:: engagement in enrollment management has no impact on decision participation by mid-
level college administrators.
Research Question 2: Is there a relationship between structural elements of the
enrollment management effort – specifically, centralization of authority, formalization and
participant interaction - and decision participation by mid-level college administrators?
HA: Centralization of authority within the enrollment management effort has no impact on
decision participation among mid-level college administrators.
HF: Level of formalization of the enrollment management effort has no impact on decision
participation among mid-level college administrators.
HI: Level of interaction among participants of the enrollment management effort has no
impact on decision participation among mid-level college administrators.
Samples Testing
For Research Question 1, an independent samples t-test was conducted for the
development of decision participation by those respondents actively engaged in enrollment
48
management (Group A, n = 92) and those with little to no engagement in enrollment
management (Group B, n = 91). Respondents to the survey indicated that engagement in
enrollment management was accompanied by higher levels of decision participation (see Figure
1). The independent samples t-test indicated that the difference between the Group A ( = 4.24,
= 1.79) and Group B ( = 3.37, = 1.90) was statistically significant (p = .002). Because the
Group A response data were not normally distributed a Mann-Whitney U test was performed.
This test indicated that the mean difference was significant (p = .001). Using the following
calculation, required sample size = (1.96 * σ / ME)2 where σ = 1.84 and ME = .267, the
required sample size was found to be 182 respondents. Therefore, the sample (n = 183) was
determined adequate to analyze the results of the survey with adequate precision.
For Research Question 2, the required sample sizes were calculated, within the context of
subset data, and filtered for each of the mediating variables. For the calculation of required
sample size, an assumed relative risk of 2.0 was used with a confidence level of .95 and power of
.80. The sample size requirements for the mediating subsets were tested using a calculator
provided by the AusVet Animal Health Services through their project that was funded by the
Australian Biosecurity Cooperative Research Centre (Sergeant, 2015). This calculator captures
expected incidence of a condition in the unexposed. Known incidence rates based on actual
survey responses were captured for survey participants who not been exposed to active
engagement in enrollment management, specifically Group B respondents, who had contracted
the condition of decision participation. The analytical technique applied in this study was relative
risk: the comparison of an event happening in Group A versus Group B based on exposure to an
element in the environment of Group A. This method accommodated the analysis of the small
sample sizes produced by the subsets for mediating variables. With 1 exception, all sample sizes
49
were determined adequate to support the analysis. In Round 3 of the analysis for decentralized
authority, the precision of the relative risk analysis was compromised due to a very small sample
size for Group A (n = 8). Incidence rates along with the required and actual sample sizes for each
of the subsets are reported in Table 6.
In addition to an analysis of the sample size requirements, crosstabs were generated for
each of the mediating variables: authority (see Table 7), formalization (see Table 8) and
interaction (see Table 9). Differences in decision participation were reported by respondents
actively engaged in formal enrollment management as compared to respondents with informal or
no engagement in enrollment management. This held true for all environments explored in the
study.
Limitations of the Study
The survey was distributed to all directors of admissions, financial aid, institutional
research, registration and student advising employed by the colleges and universities listed in the
Middle States and NEASC membership rosters that met the enrollment characteristic of 5,000 to
15,000 undergraduates. Consequently, the results of this study cannot be applied to institutions
of higher education that do not meet these parameters. The survey was administered through a
link sent by email to director email addresses collected from the websites of the member
institutions. Although this approach was expected to provide broad participation in the survey,
this participation was impacted by the recency of the data posted on the institutional websites.
Additionally, bias (i.e. under-coverage) in the data could result from the schedules of some
institutions dependent on their semester cycle (e.g. colleges with three 15-week semesters) and
the activities of these functional units at the time the survey was administered. Participation in
50
the study was voluntary, so selection bias might impact the data generated from the survey
instrument.
As the first exploratory study of its type, analysis of the data from the study could not be
set into the context of prior studies. Consequently, there were no reference standards by which
to set probabilities for participation in engagement in enrollment management or decision
participation. Similarly, the likelihood of the mediating environmental conditions being present
in a college or university was unknown with regard to authority, formalization or interaction. In
this manner, the absence of prior research constrained some aspects of analysis. As a
consequence, although findings could be made based on observed incidence rates among
respondents to the survey, the incidence rates for the general population of mid-level college
administrators remain unknown.
51
Chapter 4
RESULTS
The results from the survey provided information on the current state of enrollment
management efforts for the institutions captured in the study along with data developed to
support the analysis of the relationship between engagement in enrollment management and
decision participation. Although the responses from the survey were anonymous, the response
rate of 29% supports the descriptive statistics which indicated that the information collected
produced a broad based response representing the geographic region captured by the study,
primarily colleges and universities accredited by the Middle States Commission on Higher
Education and the New England Association of Colleges and Universities.
Descriptive Statistics
Respondents
Respondents to the survey were primarily White females with 30 to 60 years of age, who
were employed full time at public, state system, 4-year institutions with more than 5 years
working at their current institution and more than 5 years in their current position. Overall, most
respondents identified themselves as White, Non-Hispanic (83%), female (62%). With regard to
age, 41% of respondents identified themselves as 46 to 60 years of age (41%) and 39% of
respondents identified themselves as 30 to 45 years of age (39%). A smaller percentage reported
61 or more years of age (14%), while only 9 respondents reported 29 or fewer years of age (5%).
Nearly all respondents worked full time (98%). Two-thirds of respondents (67%) reported more
than 5 years at their current institution and nearly half reported they had held their current
position for more than five years (49%). The distribution of respondents across the targeted
52
work areas was as follows: admission/marketing (20%), enrollment management (8%), financial
aid) (14%), institutional research (23%) records or registration (13%), student advising (12%)
and other (10%).
Institutions
Respondents reported institutional degree levels as 4-years (60%) or 2-years (40%), and
reported affiliations as public (72%) or private (28%). Their institutions had various missions,
and respondent selections were distributed as follows: state system (66%); served populations
including Black/Hispanic-serving and religious-affiliated institutions (9%) or other (25%). When
respondents described the selectivity levels of their institutions, their responses were distributed
as: open enrollment (51%), selective (41%) and highly selective (8%) When categorizing the
recruitment region of their institution, respondents listed: in-state (74%), regional (11%),
national (11%) and on-line (4%). Most institutions had more than 4 mid-level positions from
among the work areas contacted. The overall average for number of contacts per institution was
4.53 (680 emails/150 institutions).
Enrollment Management Efforts
Reported leadership of the enrollment management unit was distributed as follows:
enrollment division director (60% of respondents), senior manager in student services (15%),
senior manager in academic affairs (8%), formal committee (7%), coordinator (5%), and no
formal leadership (5%). There were no missing values. More than one-third of all respondents
indicated that their institution had a written plan (37%), while a similar number of respondents
indicated that their institution had a set of goals but no written plan (39%). The remaining
respondents reported a general enrollment effort, but no set goals (20%) or no enrollment plan
(4%). The number of years for enrollment management efforts was distributed among the
53
respondents as follows: 10 years or more (33%), 6 to 9 years (20%), 2 to 5 years (29%), less
than 2 years (10%), no organized enrollment effort (8%).
These descriptive statistics are provided by headcounts in Table 2 and by percentages in
Table 3.
Findings for Research Question 1
This survey study was developed as the second phase of an exploratory study of changes
that occurred for American institutions of higher education that adopted the practice of
enrollment management. From a series of interviews conducted from 2012-13 with senior level
managers leading enrollment management efforts, I was able to identify that these senior
managers were introducing mid-level managers into the decision processes at their institutions. I
decided to collect information from mid-level managers regarding their engagement in
enrollment management—identified as the independent variable—and the mid-level managers’
participation in the decision-making processes—identified as the dependent variable of this
study. The first research question and the associated hypothesis were developed to explore this
idea.
Research Question 1: To what extent do mid-level college administrators engaged in
enrollment management perceive themselves to be participating in the decision-making
processes of their institutions?
H0E:: engagement in enrollment management has no impact on decision participation by
mid-level college administrators.
Engagement in Enrollment Management
The independent variable, engagement in enrollment management, was measured through
survey items 20 and 24 and this information was used to place respondents in one of two groups.
54
Group A (n = 92) consisted of those respondents who were formally engaged and active in
enrollment management, and Group B (n = 91) that consisted of those respondents who were not
formally engaged and active in enrollment management. All survey participants were assigned
to Group A or B (no missing values). It was found that the average number of enrollment
management activities engaged in by Group A respondents ( = 4.43) was more than double that
of Group B respondents ( = 1.95).
Decision Participation
The dependent variable, decision participation, was measured through survey items 15
through 19 and item 12. Participation was scored for all 183 respondents (no missing values).
The range of scores was 0 to 6 points. The mean score ( = 3.81 and the median (Mdn=4.0)
were used to generate two groups. Respondents scoring 4 or more (n = 109) were coded as
having higher levels of decision participation and those scoring less than 4 (n = 74) were coded
as having lower levels of decision participation. These scores were skewed to the higher end of
the range (see Figure 2). The mode of the results was at 6 points, the maximum number of
points on the scale; approximately 25% of the respondents received this score. An independent
samples t-test demonstrated that the difference between Group A ( = 4.24, = 1.79) and Group
B ( = 3.37, = 1.90) was statistically significant (p = .002). Because Group A response data
were not normally distributed, a Mann-Whitney U test was performed; this test also indicated the
mean difference was significant (p = .001).
This exploratory study found that 71% of Group A respondents contracted decision
participation while the incidence among Group B respondents was 48%. In terms of relative
risk, mid-level administrators engaged in formal enrollment management efforts were 63% more
likely to participate in decision making at their institution (RR = 1.634) than those mid-level
55
managers with informal or no engagement in enrollment management. The relative risk of
decision participation for Group B (RR = .636) was 36% lower (1 - .636). Note that as relative
risk values move farther from 1, risk increases; as relative risk values move closer to 1, risk
decreases. A relative risk value of 1 indicates that risk is equal for both groups. Using a z score
of 1.96 and a confidence level of 95%, the resulting confidence interval for relative risk for
Group A was 1.166 to 2.292 and for Group B was .477 to .846. This indicates that the higher
level of relative risk found for Group A is statistically significant, because the confidence
interval does not include the value 1. Additionally, results of Chi square tests indicated this
finding was statistically significant (r = .002; Fishers Exact = .003). For the purpose of
analyzing the results of the survey, notably when making situational comparisons using the
mediating variables mentioned in research question 2, these incidence rates and levels of relative
risk were considered the standard level for each group.
As a result of these analyses, the null hypotheses developed for Research Question 1 was
rejected. Survey responses suggest that there is a positive relationship between engagement in
enrollment management and decision participation among mid-level managers. Additionally the
data confirms the claim of senior level enrollment managers, developed through the interview
study conducted in 2012-13, that these mid-level managers are participating in decision making.
Findings for Research Question 2
To gain greater understanding of the institutional factors that facilitated or suppressed
decision participation, notably those factors related to the enrollment management effort, the
second research question was developed, along with three hypotheses regarding potential
mediating variables.
56
Research Question 2: Is there a relationship between structural elements of the
enrollment management effort— specifically, centralization of authority, formalization and
participant interaction—and decision participation by mid-level college administrators?
HA: Centralization of authority within the enrollment management effort has no impact
on decision participation among mid-level college administrators.
HF: Level of formalization of the enrollment management effort has no impact on
decision participation among mid-level college administrators.
HI: Level of interaction among participants of the enrollment management effort has no
impact on decision participation among mid-level college administrators.
Findings for the Authority Hypotheses
The scale originally developed to measure centralization of authority was found not to
measure the construct. The original indicator, Question 21, regarding the number of stakeholders
for enrollment management had a negative relationship with centralization of leadership.
Centralized enrollment management efforts had higher numbers of reported stakeholders while
less centralized efforts had fewer stakeholders. For efforts led by senior managers of academic
affairs or student services, the average number of stakeholders reported by respondents was 4.78.
For efforts led by enrollment management division heads, the average number of stakeholders
reported by respondents was 4.63. For efforts led by coordinators and committees, the average
number of stakeholders reported by respondents was 4.05. For those respondents reporting no
enrollment management efforts, the average number of stakeholders reported was 1.36
stakeholders. The counted list of stakeholders included a total of ten options: (a) directors of
various work areas, (b) deans/VPs/directors responsible for enrollment management, (c) formal
committees for enrollment management, (d) institutional research or other data units, (e)
57
instructional faculty or staff, (f) the president of the college, (g) the senior management team or
president’s cabinet, (h) a board of trustees or system office or (i) other. The tenth option, not
sure, was not calculated in the count of stakeholders.
Without a secondary survey result to support the measure for authority, the analysis of
authority structures was conducted using three scenarios: Round 1, Round 2, and Round 3.
Centralized authority. During Round 1, I reviewed decision participation within
enrollment management efforts that were led by an enrollment management division (n = 110).
Respondents actively engaged (Group A, n = 62) in enrollment management efforts led by an
enrollment management division declined to 35% more likely (RR = 1.345) to be involved in
decision making than those not engaged. For Group B respondents working at institutions with a
division structure (n = 48), risk of decision participation increased to 28% less likely (RR =
.720). Although the difference in decision participation between groups was not shown to be
statistically significant for respondents working in environments led by an enrollment
management division, this may be because the difference between the groups decreased when
authority was centralized within a division.
During Round 2, I reviewed decision participation where the enrollment management
effort was led by senior managers in academic affairs or by senior managers in student services.
For respondents working in these environments (n = 41), those engaged in enrollment
management (Group A, n = 22) had a 24% greater risk (RR = 1.236) for participation in decision
making for their institution than those not engaged in enrollment management (Group B, n = 19,
RR = .793). It is important to note that the senior manager scenario showed an even greater
decline in risk for Group A and a greater increase for Group B. In other words, the differences
between the groups became smaller with a senior manager leading the enrollment management
58
team. The differences in relative risk between Group A and Group B were not statistically
significant. This may be due to both the decline in differences and the small expected sample
(<7) for some of the cells.
During Round 3, I reviewed decision participation where the enrollment management
effort was led by an enrollment management division or by senior managers in academic affairs
or by senior managers in student services. For respondents working in these environments (n =
151): those engaged in enrollment management (Group A, n = 84) had a 32% greater risk (RR =
1.315) for participation in decision making for their institution than Group B (n = 67, RR = .727)
respondents. This difference was not shown to be statistically significant, perhaps in part because
the differences between groups were smaller under centralized leadership.
In all three centralized scenarios, participants in Group A reported a large decrease from
the standard level of relative risk for decision participation when the leadership of the enrollment
management effort was more centralized. In contrast, participants in Group B reported a sizable
increase from the standard level of relative risk for decision participation when authority was
centralized. On average, for members of Group A, the risk for decision participation declined
from 65% more likely to only 30% more likely. The risk for members of Group B increased from
36% less likely to only 25% less likely. The difference between the groups went from being
larger and statistically significant before controlling for the authority structure to a smaller
difference that was not demonstrated to be statistically significant when centralized authority was
taken into account.
Decision participation incidence rates for Group A and Group B provide valuable insight
regarding the overall results for respondents. Group A respondents reported little change in
incidence rates in centralized environments. Specifically in Rounds 1, 2, and 3, the Group A
59
rates were 69%, 68%, and 69% respectively as compared to the Group A standard rate of 71%.
For Group B respondents, incidence rates rose 6-10 percentage points, or an average 16%, in
centralized environments. Specifically in Rounds 1, 2, and 3, the Group B rates were 54%, 58%,
and 55% respectively as compared to the Group B standard rate of 48%.
In short, although the differences between groups were not shown to be statistically
significant, incidence rates demonstrated that the differences between Group A and Group B
were reduced in the centralized environment. This could mean that enrollment management
efforts with centralized leadership provide a leveling influence on decision participation,
eliminating differences between the groups.
Decentralized authority. For those respondents working in decentralized authority
environments, in the Round 1 analysis during which all leadership structures other than an
enrollment management division were considered to be decentralized (n = 73), the Group A
respondents (n = 30) were at more than twice the risk (RR = 2.269) for decision participation
than were the Group B respondents (n = 43, RR = .594). However, as reported in Round 1 for
centralized authority, the absence (or presence) of an enrollment management division was not
shown to have any statistically significant association with the differences in decision
participation for Groups A and B.
For Round 2, all enrollment management efforts not led by senior managers in academic
affairs or student services (n = 142) were considered decentralized. The Group A respondents (n
= 70) were at a 78% greater risk (RR = 1.777) for decision participation than the Group B
respondents (n = 72, RR = .601). The difference between groups A and B was determined to be
statistically significant as indicated by Chi square test results (r = .002; Fishers Exact = .002)
60
Additionally, the 95% confidence interval was 1.195 to 2.643 for Group A and .436 to .830 for
Group B.
For Round 3 in decentralized environments, specifically all respondents who did not
report an enrollment management effort led by a division head or senior manager, the survey
data generated results indicating that relative risk for decision participation for Group A (n = 8)
was 9 times the risk of Group B (n = 24). However, the sample represented by this subset (n =
32) was too small to support further analysis of the results, notably several cells had expected
counts of fewer than 5 respondents.
In all three decentralized scenarios, the participants in Group A reported an increase from
the standard level of relative risk for decision participation when the leadership of the enrollment
management effort was less centralized. However, based on incidence rates (see Table 6), it
appears this difference arose from lower decision participation among Group B respondents
rather than increased participation among Group A respondents. Specifically, Group A
respondents reported incidence levels of 73%, 71%, and 88% in Rounds 1, 2, and 3 while Group
B reported rates of 42%, 46%, and 30% respectively. It was only in the Round 2 decentralized
authority that the difference between groups was indicated to be statistically significant.
However, it should be noted that the results for Round 2 mirrored the overall standard results.
Specifically, incidence rates were little changed for the groups when the decentralized authority
environment was given consideration. Members of Group A had a standard incidence rate of
71% and reported a situational incidence rate of 71% for Round 2 decentralized. Members of
Group B had a standard incidence rate of 48% and reported a situational incidence rate of 46%
for Round 2 decentralized. Consequently, although relative risk was increased for Group A
under this scenario (RR = 1.777 vs. RR = 1.634), and despite this outcome generating a
61
statistically significant result, it was unclear whether lack of leadership by a senior manager has
any substantial impact decision participation for Groups A and B. Note, the only real change in
Round 2 decentralized was a decline of 2 percentage points in the incidence rate for Group B
respondents.
Within group differences. For both groups, most respondents worked in an enrollment
management environment led by an enrollment management division. This represented 67% of
Group A respondents and 53% of Group B respondents or 60% of all survey respondents. As to
enrollment management efforts led by senior managers, this environment was represented by
24% of Group A respondents and 21% of Group B respondents or 22% of all survey
respondents. When combined, as provided in the Round 3 analysis, approximately 90% of
Group A and 75% of Group B respondents or 82% of all survey respondents worked in a
centralized work environment.
For Group A, incidence rates indicated that there was little difference in decision
participation whether the enrollment management environment was centralized or decentralized.
The standard incidence rate for the group before consideration of mediating factors was 71%.
Under centralized authority, the incidence rate for Group A ranged from 68 to 69%. Under
decentralized authority the incidence rate ranged from 71-73%, with the exception of Round 3
results of 88% which represented only 8 respondents. When converted to relative risk statistics,
these small differences within Group A were not shown to be statistically significant.
For Group B, incidence rates indicated that there was a difference in decision
participation when the enrollment management environment was centralized or decentralized.
The standard incidence rate for the group before consideration of mediating factors was 48%.
Under centralized authority, the incidence rate for Group B ranged from 54 to 58%. Under
62
decentralized authority the incidence rate ranged from 42 to 46 %, with the exception of Round
3, which represented 24 respondents or 30%. The within group differences were found to be
statistically significant only for Round 3. Group B respondents working for an institution with a
centralized enrollment management effort (n = 67) were 32% more likely to participate in
decision making (RR=1.317) than Group B respondents working for an institution with a
decentralized environment (n = 24, RR = .44). These results were statistically significant (r =
.028; Fishers Exact = .034) with relative risk falling within the 95% confidence interval of 1.025
to 1.693 for Group B centralized and .202 to .958 for Group B decentralized.
In summary, there is evidence that centralization of authority may be a factor that impacts
differences in decision participation. Although decision participation was little changed for
Group A under the varied levels of centralization, there were sizable differences in decision
participation rates reported for Group B under all centralized scenarios when compared with the
Group B standard rates. These differences increased when compared to the Group B decision
participation rates identified in a decentralized environment. Whereas Group A rates had
declined nominally under centralized authority, Group B respondents had significantly higher
levels of decision participation when the enrollment management effort was centralized, even
though these respondents were not engaged in enrollment management activities.
As a result of these analyses, the null hypotheses (HA) developed for the mediating
variable authority was rejected.
Findings for the Formalization Hypotheses
Formalization of the enrollment management effort at a respondent’s institution was
initially scored based on a set of items from Questions 4, 5 and 6, relating to the overall
enrollment management effort. The range of possible scores was 0 to 9 points. The overall
63
score for each respondent was transformed into a dichotomous variable based on the mean score
of 5.97 and the median score of 6. Respondents scoring 6 or more on the scale (n = 115, =
7.29) were considered to be working in a formalized environment while respondents scoring less
than 6 (n = 68, = 3.29) were considered to be working in a non-formalized enrollment
management environment. As indicated by the values for n, the scores were skewed to the
higher end of the range (see Figure 3). The mode of the results was at 7 points; this represented
approximately 19% of all respondents.
Formalized environment. Group A respondents working in formalized enrollment
management environments (n = 65) reported a decrease in their relative risk which declined from
standard levels to 51% (RR = 1.511). For the Group B respondents working in formalized
environments (n = 50) the relative risk for decision participation decreased slightly (RR = .628).
In other words, the risk for decision participation among mid-level managers with informal or no
engagement in enrollment management changed from 36% less likely to 38% less likely than the
risk for Group A. These resulting differences were found to be statistically significant (r = .028;
Fishers Exact = .045). Additionally, tests demonstrated 95% confidence intervals of 1.004 to
2.276 for Group A and .421 to .938 for Group B.
Non-formalized environment. Alternatively, decision participation was near standard
levels for Group A respondents (n = 27) when the enrollment management effort was not
formalized, with those engaged in enrollment management 63% more likely (RR = 1.636) to be
involved in decision making than those not engaged in enrollment management. However, the
risk for decision participation among mid-level managers with informal or no engagement in
enrollment management (Group B: n = 41, RR = .720) rose from 36% less likely to 28% less
64
likely than the risk for Group A, a 33% increase in relative risk. However, these differences in
relative risk were not demonstrated to be statistically significant.
Although relative risk of decision participation was higher for Group A in a less
formalized enrollment management environment as compared to a more formalized
environment, this outcome was most impacted by the increased participation by Group B in
centralized environments. The increased participation by Group B in centralized environments
reduced the differences between groups, depressing the relative risk calculation for Group A.
From the baseline incidence rates experienced among survey participants (Group A = 71%,
Group B = 48%): incidence rates for decision participation actually increased for both groups
(Group A = 75%, Group B = 56%) in the formalized environment and declined for both groups
in the less formalized environment (Group A = 59%, Group B = 39%). The increase in decision
participation for Group B was greater in the formalized environment; specifically Group B
participation rose 8 percentage points or 16% versus the 4 percentage point or 6% increase for
Group A. In the less formalized environment, incidence rates were much lower for both groups,
Group A declined 12 percentage points or 17% while Group B declined 9 percentage points or
19%.
Within group differences. For both groups, most respondents worked in formalized
enrollment management environment. This represented 71% of Group A respondents and 55%
of Group B respondents or 63% of all survey respondents. As to non-formalized enrollment
management efforts, this environment represented 29% of Group A respondents and 45% of
Group B respondents or 37% of all survey respondents.
For Group A, the incidence rates indicated that there was a difference in decision
participation whether the enrollment management environment was formalized or non-
65
formalized. The standard incidence rate for the group before consideration of mediating factors
was 71%. Under a formalized effort, the incidence rate rose slightly for Group A to 75%. Under
a non-formalized effort the incidence rate dropped to 59%. The relative risk among the Group A
respondents was .927 formalized and 2.908 non-formalized. However these within group
differences in relative risk for Group A were not demonstrated to be statistically significant.
For Group B, incidence rates indicated that there was a difference in decision
participation when the enrollment management environment was formalized or non-formalized.
The standard incidence rate for the group before consideration of mediating factors was 48%.
Under a formalized effort, the incidence rate for Group B rose to 56%. Under a non-formalized
effort the incidence rate dropped to 39%. The relative risk among the Group B respondents was
.684 formalized and 1.360 non-formalized. However the within group differences in relative risk
for Group B were not demonstrated to be statistically significant
In summary, formalization levels had a significant association with decision participation
for both Group A and Group B. Statistically significant differences in relative risk were found
between Group A and Group B for respondents reporting higher levels of formalization in their
institutions enrollment management effort. Notably, the data generated by the survey indicate
that higher levels of decision participation occur among Group B participants when the
enrollment management efforts are formalized, even though these respondents are not engaged in
enrollment management. Using incidence rates, survey results indicate that higher levels of
formalization increased decision participation for both groups and lower levels or non-
formalization depressed decision participation for both groups; however, these variations - both
the increases and the decreases in risk - were greater for Group B.
66
As a result of these analyses, the null hypotheses (HF) developed for the mediating
variable formalization was rejected.
Findings for the Interaction Hypotheses
Respondents’ interaction with various units at their institution was initially scored based
on a set of questions relating to interaction with academic affairs, instructional faculty, student
services and administration. Although the range of possible scores for the interaction scale were
0 to 16, results for all respondents ranged from 0 to 12 points. These scores were transformed
into a dichotomous variable based on the mean score of 8.70 and the median score of 9. Those
survey respondents scoring 9 or more on the scale (n = 108, = 10.46) were considered to be
interacting more often while the respondents scoring less than 9 on the scale (n = 75, = 6.16)
were considered to be interacting less often. As indicated by the values for n, the scores were
skewed to the higher end of the range (see Figure 4). The mode of the results was 9 points; this
represented approximately 17% of all respondents. The overall shape of the distribution was
centered at the mode, truncated at 12 points with a secondary peak at 6 points in the lower end
tail.
Higher interaction levels. For individuals experiencing higher levels of interaction, the
difference in decision participation between Group A and Group B was large. Group A (n = 54)
was shown to be more than twice as likely (RR = 2.299) as Group B respondents (n = 54, RR =
.507) to participate in decision making when overall interaction was high. Chi square test results
demonstrated a statistically significant difference in decision participation levels based on higher
levels of interaction (r < .001; Fishers Exact = .001). The 95% confidence interval for relative
risk was 1.347 to 3.926.
67
Lower interaction levels. For survey respondents reporting lower interaction levels,
those respondents with formal engagement in enrollment management (Group A, n = 38) were
shown to be only slightly more likely (RR = 1.14) to be decision participants than those
informally engaged (Group B: n = 37, RR = .875). The difference between groups in
environments characterized by lower interaction levels was not demonstrated to be statistically
significant. This may be because the differences grew smaller in the lower interaction
environment.
For respondents engaged in enrollment management, Group A, higher levels of decision
participation were reported in conjunction with higher levels of interaction and lower levels of
decision participation were reported in conjunction with lower levels of interaction whereas
Group B respondents reported the opposite (see Table 6). Incidence rates demonstrate that
interaction levels were associated with bigger differences within Group A than were found
within Group B. More specifically, Group A respondents reported a 9 percentage point or 13%
increase from baseline decision participation rates under higher interaction levels whereas Group
B decision participation rates were little changed (46% vs. 48%). Group A respondents reported
a 12 percentage point or 17% decrease from baseline decision participation rates under higher
interaction levels whereas Group B decision participation rates were little changed (51% vs.
48%).
Within group differences. For both groups, most respondents worked in environment
characterized by higher interaction levels. This represented 59% of Group A respondents and
59% of Group B respondents or 59% of all survey respondents. As to environments
characterized by lower interaction, this represented 41% of Group A respondents and 41% of
Group B respondents or 41% of all survey respondents.
68
For Group A, incidence rates indicated that there was a difference in decision
participation whether the environment was characterized by higher levels or lower levels of
interaction. The standard incidence rate for the group before consideration of mediating factors
was 71%. Under a higher interaction environment, the incidence rate for Group A rose to 80%
(RR = 1.624). In a lower interaction environment the incidence rate dropped to 58% (RR = .571).
These within group differences for Group A were found to be statistically significant (r = .024;
Fishers Exact = .036). The 95% confidence intervals ranged from 1.08 to 2.643 for Group A for
respondents with high interaction and .360 to .906 for Group A respondents with low interaction.
For Group B, incidence rates indicated that there was a difference in decision
participation when the respondents work environment was characterized by higher levels or
lower levels of interaction. The standard incidence rate for the group before consideration of
mediating factors was 48%. Under a higher interaction environment, the incidence rate for
Group B declined slightly to 46%. Under a lower interaction environment the incidence rate rose
to 51%. However these within group differences for Group B were not demonstrated to be
statistically significant.
In summary, interaction levels had a significant association with decision participation
for both Group A and Group B. Statistically significant differences in relative risk were
reported between Group A and Group B when respondents reported high interaction levels.
Additionally, the differences within Group A were statistically significant when comparing risk
of decision participation in high and low interaction environments. Using incidence rates, the
survey results indicate that the level of interaction had a greater impact on Group A with higher
levels of interaction associated with a 13% increase in decision participation and lower levels of
interaction associated with an 18% decrease in decision participation. In contrast, Group B
69
respondents reported the opposite, a small decrease in decision participation when interaction
levels were high and a similarly small increase in decision participation when interaction levels
were low.
As a result of these analyses, the null hypotheses (HI) developed for the mediating
variable formalization was rejected.
Summary Statement on Findings
The relative risk analysis conducted for Research Question 1 suggests that there is a
relationship between engagement in enrollment management by mid-level college administrators
and participation by those managers in the decision-making practices of their institution.
Furthermore, the survey results regarding this relationship were altered when response data for
each of the mediating variables was introduced into the analysis. There are indications,
therefore, that the levels of centralization, formalization and interaction, as addressed in
Research Question 2, are impacting on the relationship between the independent variable,
engagement in enrollment management, and the dependent variable, decision participation.
70
Chapter V
CONCLUSIONS AND IMPLICATIONS
Enrollment management in American higher education has been evolving since its
inception more than 40 years ago (Coomes, 2000; Hossler & Kalsbeek, 2013). Responsive to
factors in both the external and the internal environment of an institution, enrollment
management became a critical strategy for driving institutional change (Hundrieser, 2012). As a
consequence, the individuals responsible for leading enrollment management teams became
change agents for their institutions (Black, 2001).
The need for effective leadership of the enrollment management enterprise took
enrollment management from a policy and practice to a profession (Henderson, 2001; Schulz &
Lucido, 2011a). The demands of that profession have created a need for advanced scholarly
research which informs the operation of these systems (Schulz & Lucido, 2011b, c). Integrating
current research on existing enrollment management models (Bontrager, 2004a, b; Hossler,1986;
Kemerer, Baldridge & Green, 1982) with theories on organizational structure borrowed from the
field of organizational management (Pugh, Hickson, & Hinings,1969; Sashkin,1986), this study
sought to advance our understanding of the structures that support the operation of enrollment
management systems.
The primary assumption of this study was that enrollment management efforts, in
American institutions of higher education, are shaped by strategies unique to each institution
(Dolence, 1996; Hossler, 1986). Consequently, the shape of the enrollment management effort is
anchored in the decision-making processes by which the institution identifies and pursues its
enrollment goals (Bontrager, 2004a, Gayle, Tewarie, & White, 2011, Kalsbeek, 2007).
Underlying the hypotheses tested in this study was a secondary assumption that these decision
71
processes inform and reflect the structures that support the enrollment management effort
(Bolman & Deal, 2008; Morris, Greenwood, & Fairclough, 2010). More specifically, decision
processes inform and reflect organizational elements such as those highlighted in this study - the
centralization of authority, the level of formalization and the level of interaction among
participants to the enrollment management effort.
Overall the study found that, among the survey respondents, those mid-level managers
who were formally engaged in enrollment management were more likely to participate in the
decision making at their institutions than mid-level managers who were not formally engaged in
enrollment management. The distinction sought by Helsabeck (1973) appears to have been
captured in these results. Specifically, participation in decision processes is not the same as
making decisions. The managers in this study indicated they are actively involved in making
decisions: setting goals, solving problems, facilitating change, creating policies and decision
options. Many participated in strategic planning for their institution.
As reported in the 2013-14 interview study, evidence from the survey suggests that
institutions and senior level enrollment managers are effectively integrating mid-level
administrators into active participation in the decision processes of America’s colleges and
universities, certainly for those institutions that were the focus of this study and possibly for the
industry as a whole. In that enrollment management professionals have indicated a holistic
approach to enrollment management is the most effective path to student success (Schulz &
Lucido, 2011a), practitioners should be further encouraged by these survey results which indicate
participation at the operational or line-level regarding control of work product, along with high
levels of interaction among the separate institutional units, specifically academic affairs, student
services, administration and instructional faculty.
72
This study further supports practitioners in that the research exposed additional structural
considerations impacting the strength of enrollment management teams. Specifically, the
mediating variables explored in the study were found to be impacting on decision participation,
not only among the mid-level managers engaged in enrollment management but rather all mid-
level managers with potential for engagement.
Previous research, notably by Bontrager (2004a) and Henderson (2005), explored the
assumption that the authority structure of enrollment management impacts the effectiveness of an
enrollment management system. However, this research had not explored the nature of those
impacts. In the words of Henderson, “we were looking for whether the institution was reflecting
enrollment management when we should have been looking to ensure that enrollment
management reflected the institution” (pp. 4-5). Based on the results of this survey, some of
these impacts are now known. The survey results show that decision participation, among those
mid-level managers engaged in enrollment management, was suppressed by the presence of
centralized authority in the form of a senior manager or an enrollment management division.
Even though engaged respondents in centralized environments reported a greater number of
stakeholders to the process, their participation in decision making was lower in the more
centralized environment. Alternatively, those mid-level managers who were not formally
engaged saw greater levels of decision participation in the centralized environment. From a
practical perspective, institutions with centralized authority structures, which seek to develop
participative practices, may need to develop new tools for capturing the input of the various
specialized units that make up their enrollment management enterprise.
A second mediating element, the formalization of the enrollment management enterprise
—as measured through length of time in place, the development of a written plan or set goals and
73
the assignment of leadership to a senior level manager— was reported to have improved the
prospects of decision participation by mid-level managers who were not formally engaged in
enrollment management. As suggested by the work of Schulz and Lucido (2009), the drive for
resources and legitimacy required by the enrollment management effort may promote a trend
towards formalization and centralization. The rise in decision participation incidence rates for
those not formally engaged indicates that formalized enrollment management efforts impact
decision participation by the campus community. However, the survey results also indicated that
formalization of the enrollment management enterprise was not accompanied by a change in the
decision participation rates of mid-level managers who were formally engaged in enrollment
management, such as those serving on a formal enrollment management committee. Although
the data generated by the survey did not show a strong correlation between formal engagement
and formalization, common sense suggests a larger study might capture such a relationship.
Furthermore, the survey did not generate the hoped-for response data regarding the acquisition of
resources to support enrollment management. If direct reports on resource allocations had been
integrated with the other elements of formalization, greater clarity regarding the impacts of
formalization may have been gained.
A higher level of interaction with others in various units of the campus—as measured by
the frequency of that interaction—was reported in tandem with a higher level of decision
participation by mid-level managers who were formally engaged in enrollment management, but
not by those who had only informal or no engagement in enrollment management. It is not clear
from this study if interaction is a product, symptom or causal factor in perceived levels of
decision participation by mid-level managers. Recent studies have shown that enrollment
managers are seeking skills in managing these interactions. Notably, Schulz and Lucido (2011a)
74
identified that enrollment managers seek to improve their ability to manage personnel relations,
institutional politics and working with groups comprised of varied stakeholders. By all counts,
interactions among mid-level administrators are impacting on enrollment management processes
and, therefore, have potential for impacting enrollment management outcomes.
These observations lend support to the reports by senior enrollment managers that
indicated increased decision participation by mid-level managers. However, when considering
results from this study, it is important to recall, unlike a medical study that relies on the objective
diagnosis of a condition, this survey instrument captured the perceptions of the respondents.
Senior level enrollment managers who actively integrate mid-level managers into decision
processes may need to highlight that intention if they wish to impact the perceptions and
understanding of decision participants.
This study had two goals. The first goal was to explore claims that higher levels of
decision participation occur as a result of engagement in enrollment management. These claims
appear to have been confirmed and further research would permit a stronger case to be made
supporting those claims. The second goal was to develop a new methodology for analyzing the
structure of the enrollment management enterprise, notably because enrollment management has
become a common practice among American institutions of higher education, but also because
the enterprise serves as a primary change agent within the institution and the industry. This
methodology introduced new factors that the survey results suggest may impact the operation of
the enrollment management enterprise and the leadership of the units that make up the
enrollment management team.
Future research could explore the variety of respondent, work and institutional
characteristics that were captured here, notably the impacts of institutional selectivity which
75
suggested lower levels of engagement among more highly selective institutions, yet high levels
of decision participation for that same group. Elements of decision participation could be more
broadly investigated, including the area of facilitating change and what specific activities that
term represents. Further information could be collected on the mediating variables including
elements of authority, formalization and a more specific understanding of the range of
interactions that occur. Research regarding resource acquisition and deployment would shed
additional light on the management and operation of enrollment management systems.
The results of this study suggest that researchers can learn more about American higher
education enrollment management efforts through expansion of the models used to support this
research. Future studies may build on the factors introduced here or may identify new elements
which impact the enrollment management environment. The insights developed from this
research can be used to address some of the critical questions which prior models left
unanswered. Expansion of the models, to include the operational structure supporting the
enrollment management effort, will move the profession’s development beyond the tools and
techniques for managing student enrollments, shedding light on practices for leading effective
enrollment management teams.

76
References
Abston, B. O. (2010). Administrators’ perceptions of the enrollment management practices at the
comprehensive public associate’s colleges in Alabama (Doctoral dissertation, The
University of Alabama Tuscaloosa).
Beals, E. W. (1996). Design and implementation of an enrollment management program at
Georgia State University. In Dolence, M. (Ed.), Strategic enrollment management: Cases
from the field (pp. 26-35), Washington, DC: American Association of Collegiate
Registrars and Admissions Officers.
Behn, R. D. (1983). The managerial opportunity of enrollment decline, Peabody Journal of
Education, 60(2), 108.
Bess, J. L., & Dee, J. R. (2008). Understanding college and university organization: Theories for
effective policy and practice (Vols. 1-2). Sterling VA: Stylus Publishing, L.L.C.
Black, J. (2001). Garnering resources and building infrastructure In Black, J. (Ed.), The strategic
enrollment management revolution, (pp 3-36), Washington, DC: American Association of
Collegiate Registrars and Admissions Officers.
Black, J. (2004). Defining enrollment management: The structural frame, College and
University, 79(4), 37-39.
Birnbaum, R. (2004). The end of shared governance: Looking ahead or looking back. New
Directions for Higher Education, 2004(127), 5-22.
77
Bolman, L. G., & Deal, T. E. (2008). Reframing organizations: Artistry, choice and leadership.
San Francisco: Jossey-Bass.
Bontrager, B. (2004a). Enrollment management: An introduction to concepts and structures.
College and University, 79(3), 11-16.
Bontrager, B. (2004b). Strategic enrollment management: Core strategies and best practices.
College and University, 79(4), 9-15.
Boulding, K. E. (1975). Viewpoint: The management of decline. Change: The Magazine of
Higher Learning, 7(5), 8-64.
Briggs, S. R., & Cheek, J. M. (1986). The role of factor analysis in the development and
evaluation of personality scales. Journal of personality, 54(1), 106-148.
Cesarini, L. M. (2011). A comparison of academic administrators and enrollment managers
perceptions of undergraduate enrollment management functions at a subset of four-year
public institutions (Doctoral dissertation, Bowling Green State University).
Charmaz, K. (2006). Constructing grounded theory: A practical guide through qualitative
analysis. London: Sage Publication Ltd.
Clark, L. A., & Watson, D. (1995). Constructing validity: Basic issues in objective scale
development. Psychological assessment, 7(3), 309.
Cohen, A. M., & Brawer, F. B. (2003). The American community college. San Francisco: John
Wiley & Sons.
78
Coomes, M. D. (2000). The historical roots of enrollment management. New directions for
student services, 2000(89), 5-18.
Creswell, J. W. (2009). Research design: Qualitative, quantitative, and mixed methods
approaches. New York: Sage Publications.
Creswell, J. W. (2013). Research design: Qualitative, quantitative, and mixed methods
approaches. New York: Sage Publications.
Deming, D. J., Goldin, C., & Katz, L. F. (2011). The for-profit postsecondary school sector:
nimble critters or agile predators? (No. w17710). National Bureau of Economic
Research.
Dolence, M. G. (1993). Strategic enrollment management: A primer for campus administrators.
Washington, DC: American Association of Collegiate Registrars & Admissions Officers.
Dolence, M. G. (1996). AACRAO Strategic Enrollment Management Casebook: Cases from the
Field. Washington, DC: American Association of Collegiate Registrars & Admissions
Officers.
Dolence, M. G. (1998). Strategic enrollment management. Handbook for the college admission
profession, 71-97.
Eckel, P. D. (2000). The role of shared governance in institutional hard decisions: Enabler or
antagonist? The Review of Higher Education, 24(1), 15-39.
79
Everett, T. (2012). Perceptions of the effectiveness of enrollment management models at four-
year private and public Colleges. (Electronic Thesis or Dissertation). Retrieved from
https://etd.ohiolink.edu/ on December 1, 2013.
Gayle, D. J., Tewarie, B., & White Jr, A. Q. (2011). Governance in the twenty-first-century
university: Approaches to effective leadership and strategic management: ASHE-ERIC
Higher Education Report (Vol. 14). Wiley. com.
Gilmour, J. E. (1991). Participative governance bodies in higher education: Report of a national
study. New Directions for Higher Education, 1991(75), 27-39.
Gladieux, L. (1995). Federal student aid policy: A history and an assessment. Retrieved at
https://www2.ed.gov/offices/OPE/PPI/FinPostSecEd/gladieux.html
Green, B. F. (1978). In defense of measurement. American Psychologist,33(7), 664.
Hackman, J. R. (1990). Groups that work (and those that don't): Creating conditions for effective
teamwork. San Francisco: Jossey-Bass
Hagedorn, K. and Van Slette, S. (2006). “Participative Management” versus shared governance:
How much should faculty be involved in management decisions. The New Balancing Act
in the Business of Higher Education, 137-152 .
Helsabeck, R.E. (1973). The compound system: A conceptual framework for effective
decisionmaking in colleges. Berkeley: University of California, Center for Research and
Development in Higher Education.
80
Henderson, S. E. (2001). On the brink of a profession: A history of enrollment management in
higher education. Black, J. (Ed.).(2001). The strategic enrollment management revolution
(3–36). Washington, DC: American Association of Collegiate Registrars and Admissions
Officers.
Henderson, S. E. (2005). Refocusing enrollment management: Losing structure and finding the
academic context. College and University, 80(3), 3.
Henderson, S. E. (2008). Admissions’ evolving role: From gatekeeper to strategic partner. The
College Admissions Officer’s Guide. Washington, DC: American Association of
Collegiate Registrars and Admissions Officers.
Hershey, D. E. (1981). Enrollment, marketing, and retention in the coming decade. Business
Officer.
Higher Education Amendments of 1972, P.L. 92-318, §86 235 (1972). Retrieved from
https://www.govtrack.us/congress/bills/92/s659/text.
Hossler, D. (1984). Enrollment management: An integrated approach. New York: College Board
Publications.
Hossler, D. (1986). Creating effective enrollment management systems. New York: College
Board Publications.
Hossler, D. R. (2004). How enrollment management has transformed–or ruined–higher
education. Chronicle of Higher Education, 34, B3.
81
Hossler, D., & Kalsbeek, D. (2013). Enrollment Management and Managing Enrollments:
Revisiting the Context for Institutional Strategy. Strategic Enrollment Management
Quarterly, 1(1), 5-25.
Huddleston, T. (2001). Building the enrollment management model. The SEM revolution.
Washington, DC: American Association of Registrars and Admissions Officers.
Hughes, T. G. (2005). Identification of leadership style of enrollment management professionals
in post-secondary institutions in the southern United States (Doctoral dissertation, Texas
Tech University).
Hundrieser, J. (2012). Strategic enrollment planning. Coralville, Iowa: Noel-Levitz, Inc.
Ingersoll, R. J. (1988). The enrollment problem: Proven management techniques. American
Council on Education/Macmillan Series on Higher Education. New York: Macmillan
Publishing.
Kalsbeek, D. H. (2006). Some reflections on SEM structures and strategies (part one). College
and University, 81(3), 3-10. Retrieved from
http://search.proquest.com/docview/225594280?accountid=13793
Kalsbeek, D. H. (2007). Reflections on strategic enrollment management structures and
strategies: (part three). College and University, 82(3), 3-9,12. Retrieved from
http://search.proquest.com/docview/225596923?accountid=13793
82
Kemerer, F. R., Baldridge, J. V. and Green K. C. (1982). Strategies for effective enrollment
management. Washington, DC: American Association of State Colleges and
Universities.
Kezar, A. (2011). Foreword. In Gayle, D. J., Tewarie, B., & White Jr, A. Q., Governance in the
twenty-first-century university: Approaches to effective leadership and strategic
management: ASHE-ERIC Higher Education Report (Vol. 14). Wiley. com.
Kraatz, M. S., Ventresca, M. J., & Deng, L. (2010). Precarious values and mundane innovations:
Enrollment management in American liberal arts colleges. Academy Of Management
Journal, 53(6), 1521-1545.
LeCompte, M. D., & Schensul, J. J. (Eds.). (1999). Analyzing and interpreting ethnographic
data. Rowman Altamira.
Lewison, D. M., & Hawes, J. M. (2007). Student target marketing strategies for
universities. Journal of College Admission, 196, 14-19.
McNutt, L. A., Wu, C., Xue, X., & Hafner, J. P. (2003). Estimating the relative risk in cohort
studies and clinical trials of common outcomes. American journal of
epidemiology, 157(10), 940-943.
Mintzberg, H. (1979): The Structuring of Organizations, Englewood Cliffs/NJ: Prentice Hall.
Morris, T., Greenwood, R., & Fairclough, S. (2010). Decision making in professional service
firms. Handbook of Decision Making, 275.
83
National Center for Education Statistics (NCES), (2015a). Digest of Education Statistics: 2013,
Table 317.10 retrieved at http://nces.ed.gov/pubs2015/2015011.pdf on August 6, 2015.
National Center for Education Statistics (NCES), (2015b). Digest of Education Statistics: 2013,
Table 203.10 retrieved at http://nces.ed.gov/pubs2015/2015011.pdf on August 6, 2015.
National Center for Education Statistics (NCES), (2015c). Digest of Education Statistics: 2012,
Table 303.25 retrieved at http://nces.ed.gov/pubs2015/2015011.pdf on August 6, 2015.
National Center for Education Statistics (NCES), (2015d). Integrated Postsecondary Education
Data System retrieved at http://nces.ed.gov/ipeds/datacenter/QueryForm.aspx retrieved
on October 21, 2015.
Niles, S. D. (2012). The chief enrollment officer position: How the hiring process illuminates the
competencies required to lead an enrollment management division.
Pallant, J. (2010). SPSS survival manual: A step by step guide to data analysis using SPSS. New
York: McGraw-Hill International.
Penn, G. (1999). Enrollment Management for the 21st Century: Institutional Goals,
Accountability, and Fiscal Responsibility. ASHE-ERIC Higher Education Report,
Volume 26, Number 7 retrieved at http://files.eric.ed.gov/fulltext/ED430445.pdf on
March 9, 2013.
Pugh, D. S., Hickson, D. J., & Hinings, C. R. (1969). An empirical taxonomy of structures of
work organizations. Administrative Science Quarterly, (1), 115. doi:10.2307/2391367
84
Riehl, R. J. (1982). From gatekeeper to marketing consultant: The admissions officer’s changing
role. College and University, 57(3), 327-329.
Rowley, D. J., Lujan, H.D., Dolence, M. G. (1997). Strategic Change in Colleges and
Universities: Planning to Survive and Prosper. San Francisco: Jossey-Bass
Sashkin, M. (1982). A manager's guide to participative management. AMA Membership
Publications Division, American Management Associations.
Sashkin, M. (1986). Participative management remains an ethical imperative. Organizational
Dynamics, 14(4), 62-75.
Schulz, S. A. & Lucido, J. (2009). Motivation matters: Using a multidimensional theoretical
framework to assess what enrollment structures reveal about institutional priorities
retrieved at http://www.usc.edu/programs/cerpp/docs/SchulzandLucidoASHE09
MotivationMatters-FINALVERSION.pdf on May 5, 2013.
Schulz, S. & Lucido, J. (2011a). Who we are: An in-Depth look at the educational backgrounds,
career paths and development needs of chief admission officers and enrollment managers.
Journal of College Admission, (211), 14-20.
Schulz, S. A., & Lucido, J. A. (2011b). Enrollment Management, Inc.: External Influences on
our practice. Center for Enrollment Research, Policy, and Practice.
Schulz, S. & Lucido, J. (2011c). What enrollment structures reveal about institutional priorities.
Enrollment Management Journal 5(4), 12-44.
85
Sergeant, E. (2015). Epitools epidemiological calculators. AusVet Animal Health Services and
Australian Biosecurity Cooperative Research Centre for Emerging Infectious Disease.
Available at:http://epitools.ausvet.com.au.
Siglar, W. (1996). On the road to enrollment management at the University of Minnesota.
Dolence, M. (Ed.). Strategic Enrollment Management: Cases from the field, Washington,
DC: American Association of Collegiate Registrars and Admissions Officers. 36-53.
Snyder, T. D. (1993). 120 years of American education: A statistical portrait. Washington, DC:
US Dept. of Education, Office of Educational Research and Improvement. National
Center for Education Statistics.
Stangor, C. (2010). Research methods for the behavioral sciences. Boston: Cengage Learning.
Steinberg, J. (2003). The gatekeepers: Inside the admissions process of a premier college. New
York: Penguin.
Tang, W. and Cui, Y. (2013) Internal consistency: Do we really know what it is and how to
assess it? Edmunton: University of Alberta, Center for Research in Applied
Measurement and Evaluation (CRAME) retrieved at
http://www2.education.ualberta.ca/educ/psych/crame/docs/AERA%202013%20-
%20Internal%20Consistency.pdf on March 30, 2014.
Thelin, J. R. (2011). A history of American higher education. Baltimore: JHU Press.
Viera, A. J. (2008). Odds ratios and risk ratios: what's the difference and why does it
matter?. Southern medical journal, 101(7), 730-734.

86
Whiteside, R. (1996). An evolving enrollment management program at Tulane University.
Dolence, M. (Ed.). (1996). Strategic Enrollment Management: Cases from the field.
Washington, DC: American Association of Collegiate Registrars and Admissions
Officers, 54-75.
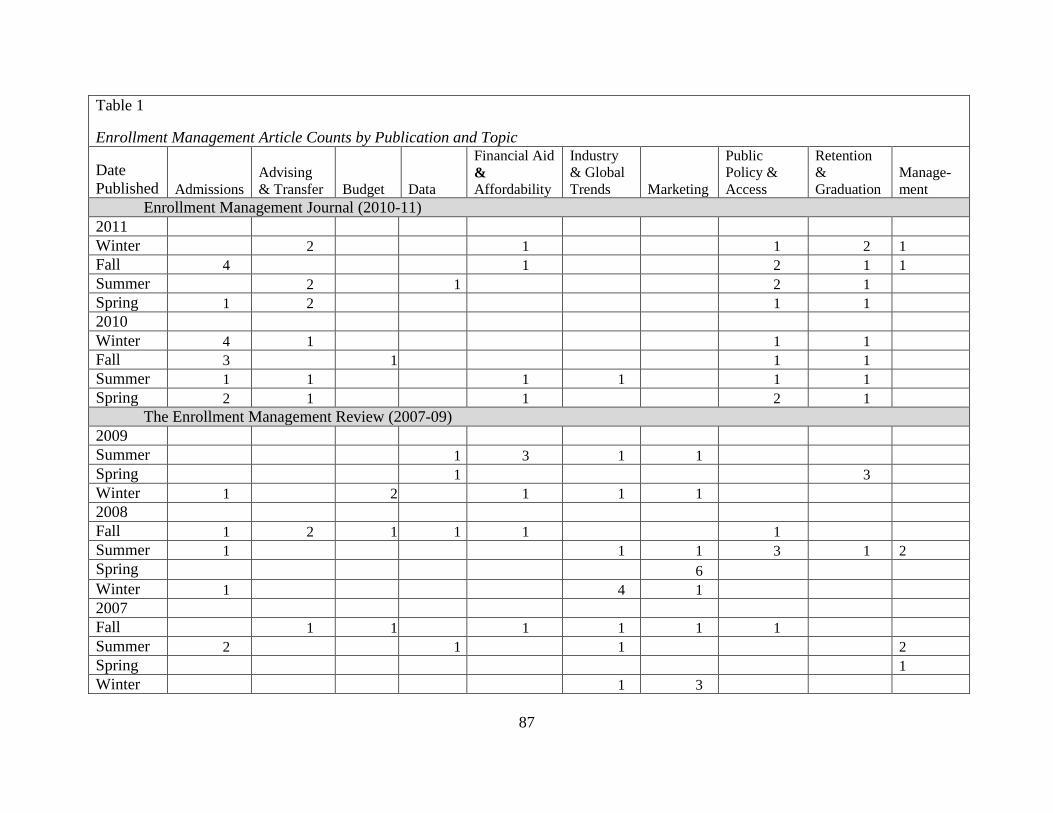
87
Table 1
Enrollment Management Article Counts by Publication and Topic
Date
Published Admissions
Advising
& Transfer Budget Data
Financial Aid
&
Affordability
Industry
& Global
Trends Marketing
Public
Policy &
Access
Retention
&
Graduation
Manage-
ment
Enrollment Management Journal (2010-11)
2011
Winter 2 1 1 2 1
Fall 4 1 2 1 1
Summer 2 1 2 1
Spring 1 2 1 1
2010
Winter 4 1 1 1
Fall 3 1 1 1
Summer 1 1 1 1 1 1
Spring 2 1 1 2 1
The Enrollment Management Review (2007-09)
2009
Summer 1 3 1 1
Spring 1 3
Winter 1 2 1 1 1
2008
Fall 1 2 1 1 1 1
Summer 1 1 1 3 1 2
Spring 6
Winter 1 4 1
2007
Fall 1 1 1 1 1 1
Summer 2 1 1 2
Spring 1
Winter 1 3
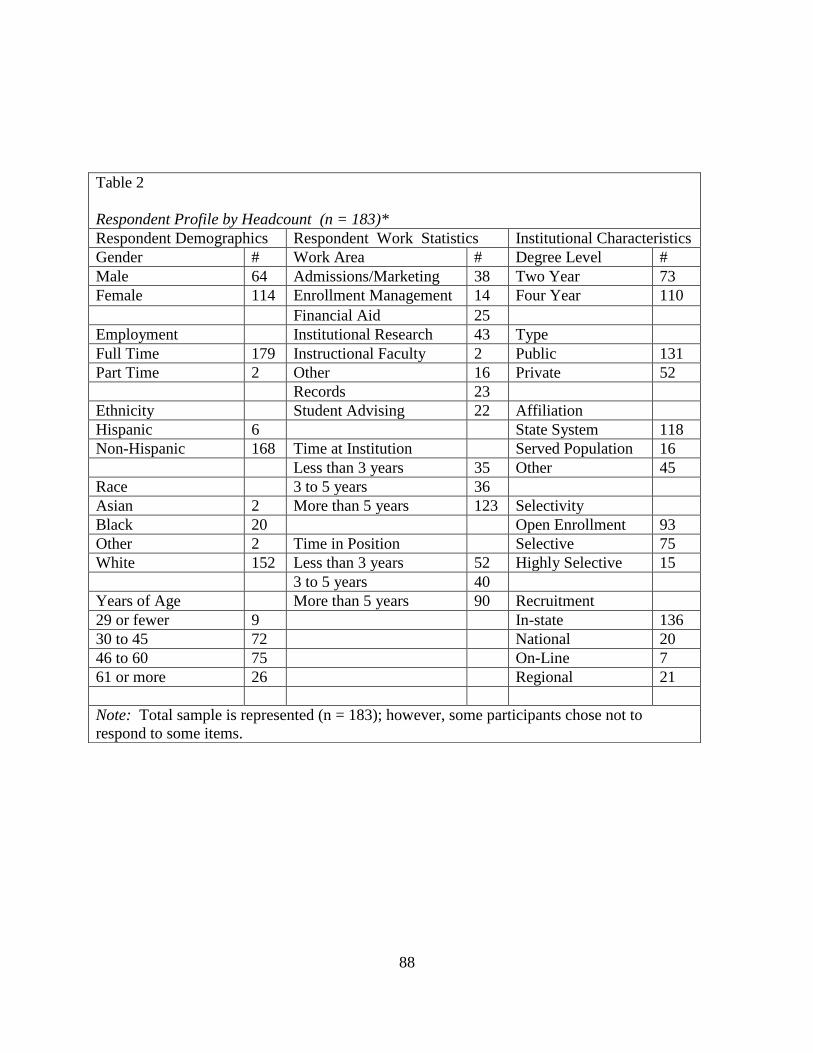
88
Table 2
Respondent Profile by Headcount (n = 183)*
Respondent Demographics Respondent Work Statistics Institutional Characteristics
Gender # Work Area # Degree Level #
Male 64 Admissions/Marketing 38 Two Year 73
Female 114 Enrollment Management 14 Four Year 110
Financial Aid 25
Employment Institutional Research 43 Type
Full Time 179 Instructional Faculty 2 Public 131
Part Time 2 Other 16 Private 52
Records 23
Ethnicity Student Advising 22 Affiliation
Hispanic 6 State System 118
Non-Hispanic 168 Time at Institution Served Population 16
Less than 3 years 35 Other 45
Race 3 to 5 years 36
Asian 2 More than 5 years 123 Selectivity
Black 20 Open Enrollment 93
Other 2 Time in Position Selective 75
White 152 Less than 3 years 52 Highly Selective 15
3 to 5 years 40
Years of Age More than 5 years 90 Recruitment
29 or fewer 9 In-state 136
30 to 45 72 National 20
46 to 60 75 On-Line 7
61 or more 26 Regional 21
Note: Total sample is represented (n = 183); however, some participants chose not to
respond to some items.
89
Table 3
Respondent Profile as a Percentage of All Responding to the Survey*
Respondent Demographics Respondent Work Statistics Institutional Characteristics
Gender % Work Area % Degree Level %
Male 36% Admissions/Marketing 20% Two Year 40%
Female 64% Enrollment Management 8% Four Year 60%
Financial Aid 14%
Employment Institutional Research 23% Type
Full Time 99% Instructional Faculty 1% Public 72%
Part Time 1% Other 9% Private 28%
Records 13%
Ethnicity Student Advising 12% Affiliation
Hispanic 3% State System 66%
Non-Hispanic 97% Time at Institution Served Population 9%
Less than 3 years 18% Other 25%
Race 3 to 5 years 19%
Asian 1% More than 5 years 63% Selectivity
Black 11% Open Enrollment 51%
Other 1% Time in Position Selective 41%
White 86% Less than 3 years 29% Highly Selective 8%
3 to 5 years 22%
Years of Age More than 5 years 49% Recruitment
29 or fewer 5% In-state 74%
30 to 45 40% National 11%
46 to 60 41% On-Line 4%
61 or more 14% Regional 11%
Note: Percents may not sum to 100% due to rounding.
90
Table 4
Engagement in Enrollment Management by Respondent Characteristics Reported as a
Percentage of All Respondents Sharing that Characteristic
Respondent Demographics Respondent Work Statistics Institutional
Characteristics
Gender % Work Area % Degree Level %
Male 60% Admissions/Marketing 71% Two Year 51%
Female 44% Enrollment
Management
85% Four Year 48%
Financial Aid 52%
Employment Institutional Research 30% Type
Full Time 51% Instructional Faculty 0% Public 54%
Part Time 0% Other 25% Private 41%
Records 57%
Ethnicity Student Advising 46% Affiliation
Hispanic 33% State System 53%
Non-Hispanic 52% Time at Institution Served Population 55%
Less than 3 years 50% Other 40%
Race 3 to 5 years 58%
Asian 0% More than 5 years 49% Selectivity
Black 60% Open Enrollment 49%
Other 0% Time in Position Selective 53%
White 51% Less than 3 years 50% Highly Selective 40%
3 to 5 years 50%
Years of Age More than 5 years 50% Recruitment
29 or fewer 56% In-state 59%
30 to 45 50% National 60%
46 to 60 56% On-Line 57%
61 or more 35% Regional 62%
Note: Percents may not sum to 100% due to rounding.
91
Table 5
Decision Participation by Respondent Characteristics Reported as a Percentage of All
Respondents Sharing that Characteristic
Respondent Demographics Respondent Work Statistics Institutional Characteristics
Gender % Work Area % Degree Level %
Male 67% Admissions/Marketing 47% Two Year 60%
Female 55% Enrollment Management 71% Four Year 59%
Financial Aid 52%
Employment Institutional Research 65% Type
Full Time 51% Instructional Faculty 50% Public 62%
Part Time 50% Other 75% Private 54%
Records 69%
Ethnicity Student Advising 50% Affiliation
Hispanic 66% State System 52%
Non-Hispanic 61% Time at Institution Served Population 57%
Less than 3 years 59% Other 51%
Race 3 to 5 years 57%
Asian 100% More than 5 years 60% Selectivity
Black 55% Open Enrollment 58%
Other 0% Time in Position Selective 65%
White 62% Less than 3 years 65% Highly Selective 67%
3 to 5 years 58%
Years of Age More than 5 years 58% Recruitment
29 or fewer 44% In-state 60%
30 to 45 55% National 60%
46 to 60 66% On-Line 57%
61 or more 58% Regional 62%
Note: Percents may not sum to 100% due to rounding.
92
Table 6
Required Sample Sizes for Standard and Subset Samples by Mediating Variable
Variable & Variable
Category
Group
A or B
EM
Engaged
Decision
Participant
Required
sample size
Actual
sample size
Incidence
Level
Qualification
Met
Standard sample Baseline A Y Y 10 92 71% Y
B N Y 10 91 48% Y Authority – Round 1 `
Centralized A Y Y 5 62 69% Y B N Y 5 48 54% Y
Decentralized A Y Y 17 30 73% Y B N Y 17 43 42% Y
Authority – Round 2 Centralized A Y Y 2 22 68% Y
B N Y 2 19 58% Y Decentralized A Y Y 12 70 71% Y
B N Y 12 72 46% Y Authority – Round 3
Centralized A Y Y 4 84 69% Y B N Y 4 67 55% Y
Decentralized A Y Y 40 8 88% N B N Y 40 24 30% N
Formalized Formal A Y Y 3 65 75% Y B N Y 3 50 56% Y Informal A Y Y 22 27 59% Y B N Y 22 41 39% Y
Interaction High A Y Y 12 54 80% Y B N Y 12 54 46% Y Low A Y Y 7 38 58% Y B N Y 7 37 51% Y
Note 1. Calculated using Epitools epidemiological calculators by Sergeant (2015) available at
http://epitools.ausvet.com.au.
Note 2. Standard Sample refers to the results for the sample before mediating variables were introduced.
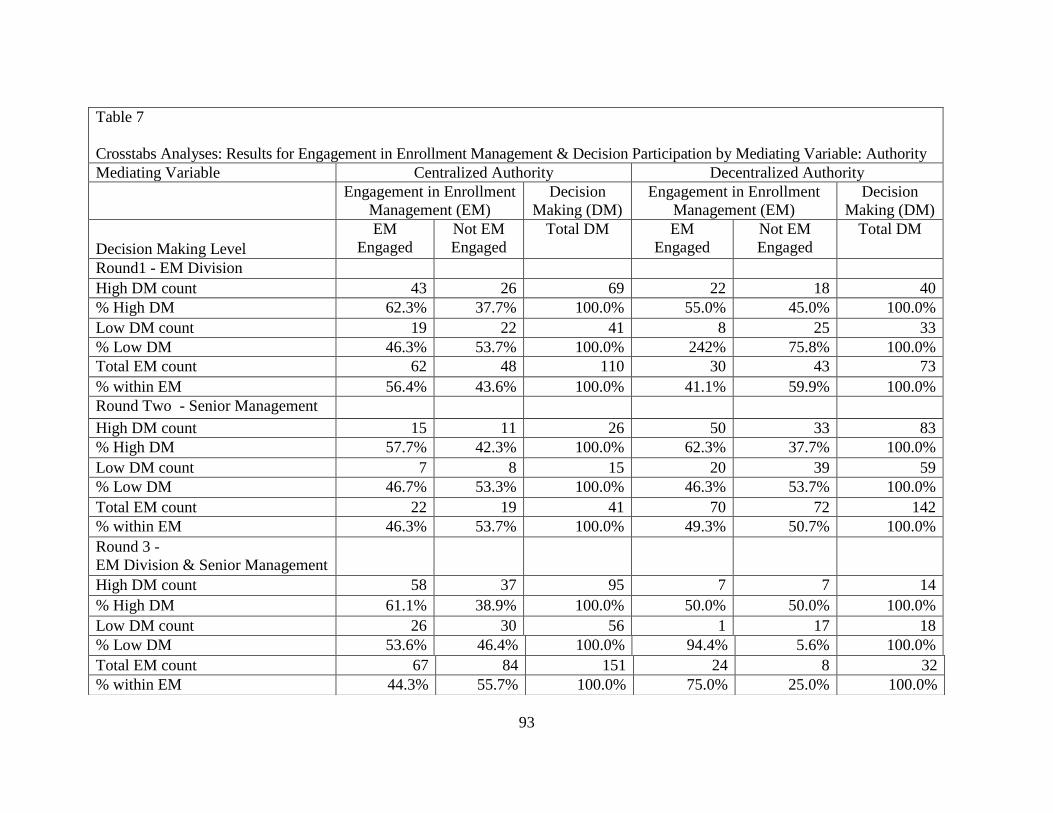
93
Table 7
Crosstabs Analyses: Results for Engagement in Enrollment Management & Decision Participation by Mediating Variable: Authority
Mediating Variable Centralized Authority Decentralized Authority
Engagement in Enrollment
Management (EM)
Decision
Making (DM)
Engagement in Enrollment
Management (EM)
Decision
Making (DM)
Decision Making Level
EM
Engaged
Not EM
Engaged
Total DM EM
Engaged
Not EM
Engaged
Total DM
Round1 - EM Division
High DM count 43 26 69 22 18 40
% High DM 62.3% 37.7% 100.0% 55.0% 45.0% 100.0%
Low DM count 19 22 41 8 25 33
% Low DM 46.3% 53.7% 100.0% 242% 75.8% 100.0%
Total EM count 62 48 110 30 43 73
% within EM 56.4% 43.6% 100.0% 41.1% 59.9% 100.0%
Round Two - Senior Management
High DM count 15 11 26 50 33 83
% High DM 57.7% 42.3% 100.0% 62.3% 37.7% 100.0%
Low DM count 7 8 15 20 39 59
% Low DM 46.7% 53.3% 100.0% 46.3% 53.7% 100.0%
Total EM count 22 19 41 70 72 142
% within EM 46.3% 53.7% 100.0% 49.3% 50.7% 100.0%
Round 3 -
EM Division & Senior Management
High DM count 58 37 95 7 7 14
% High DM 61.1% 38.9% 100.0% 50.0% 50.0% 100.0%
Low DM count 26 30 56 1 17 18
% Low DM 53.6% 46.4% 100.0% 94.4% 5.6% 100.0%
Total EM count 67 84 151 24 8 32
% within EM 44.3% 55.7% 100.0% 75.0% 25.0% 100.0%
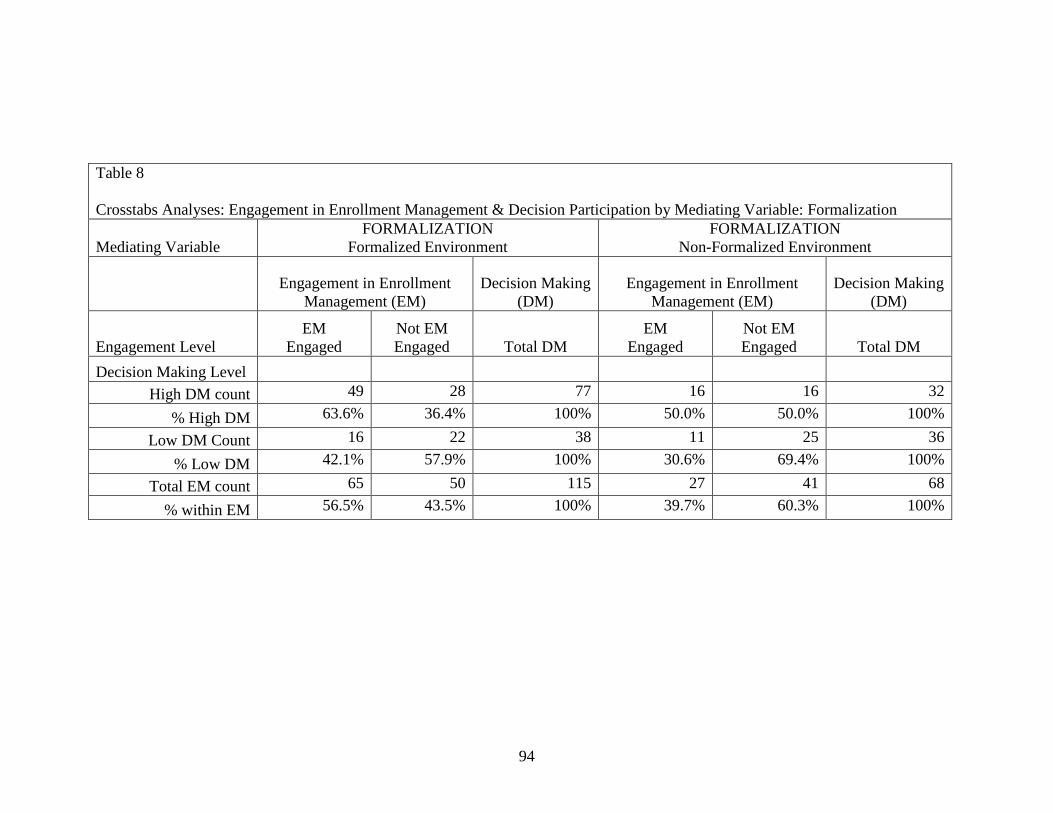
94
Table 8
Crosstabs Analyses: Engagement in Enrollment Management & Decision Participation by Mediating Variable: Formalization
Mediating Variable
FORMALIZATION
Formalized Environment
FORMALIZATION
Non-Formalized Environment
Engagement in Enrollment
Management (EM)
Decision Making
(DM)
Engagement in Enrollment
Management (EM)
Decision Making
(DM)
Engagement Level
EM
Engaged
Not EM
Engaged Total DM
EM
Engaged
Not EM
Engaged Total DM
Decision Making Level
High DM count 49 28 77 16 16 32
% High DM 63.6% 36.4% 100% 50.0% 50.0% 100%
Low DM Count 16 22 38 11 25 36
% Low DM 42.1% 57.9% 100% 30.6% 69.4% 100%
Total EM count 65 50 115 27 41 68
% within EM 56.5% 43.5% 100% 39.7% 60.3% 100%
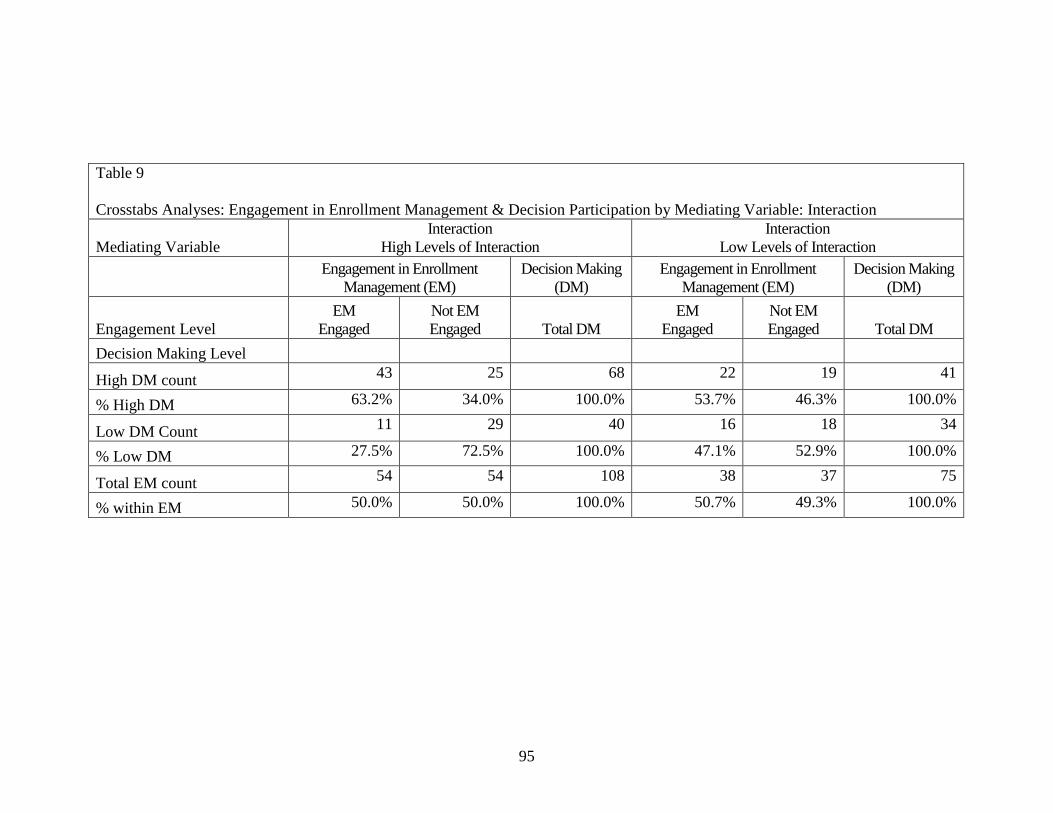
95
Table 9
Crosstabs Analyses: Engagement in Enrollment Management & Decision Participation by Mediating Variable: Interaction
Mediating Variable
Interaction
High Levels of Interaction
Interaction
Low Levels of Interaction
Engagement in Enrollment
Management (EM)
Decision Making
(DM)
Engagement in Enrollment
Management (EM)
Decision Making
(DM)
Engagement Level
EM
Engaged
Not EM
Engaged Total DM
EM
Engaged
Not EM
Engaged Total DM
Decision Making Level
High DM count 43 25 68 22 19 41
% High DM 63.2% 34.0% 100.0% 53.7% 46.3% 100.0%
Low DM Count 11 29 40 16 18 34
% Low DM 27.5% 72.5% 100.0% 47.1% 52.9% 100.0%
Total EM count 54 54 108 38 37 75
% within EM 50.0% 50.0% 100.0% 50.7% 49.3% 100.0%
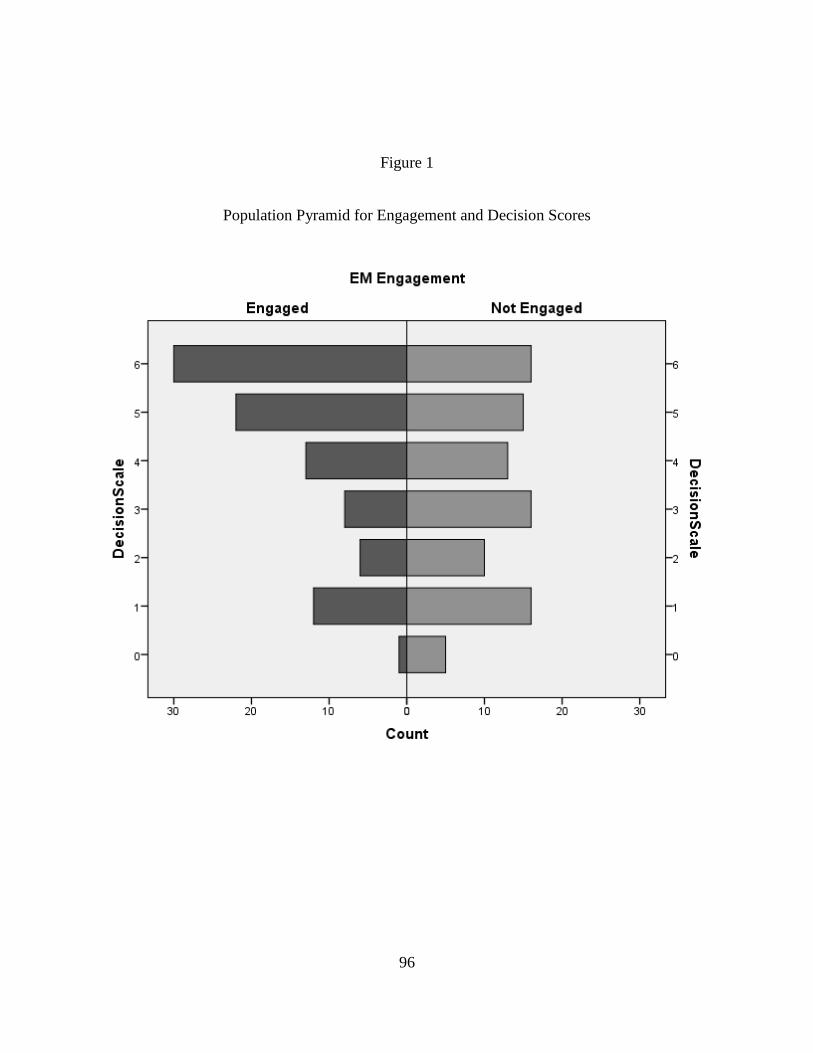
96
Figure 1
Population Pyramid for Engagement and Decision Scores
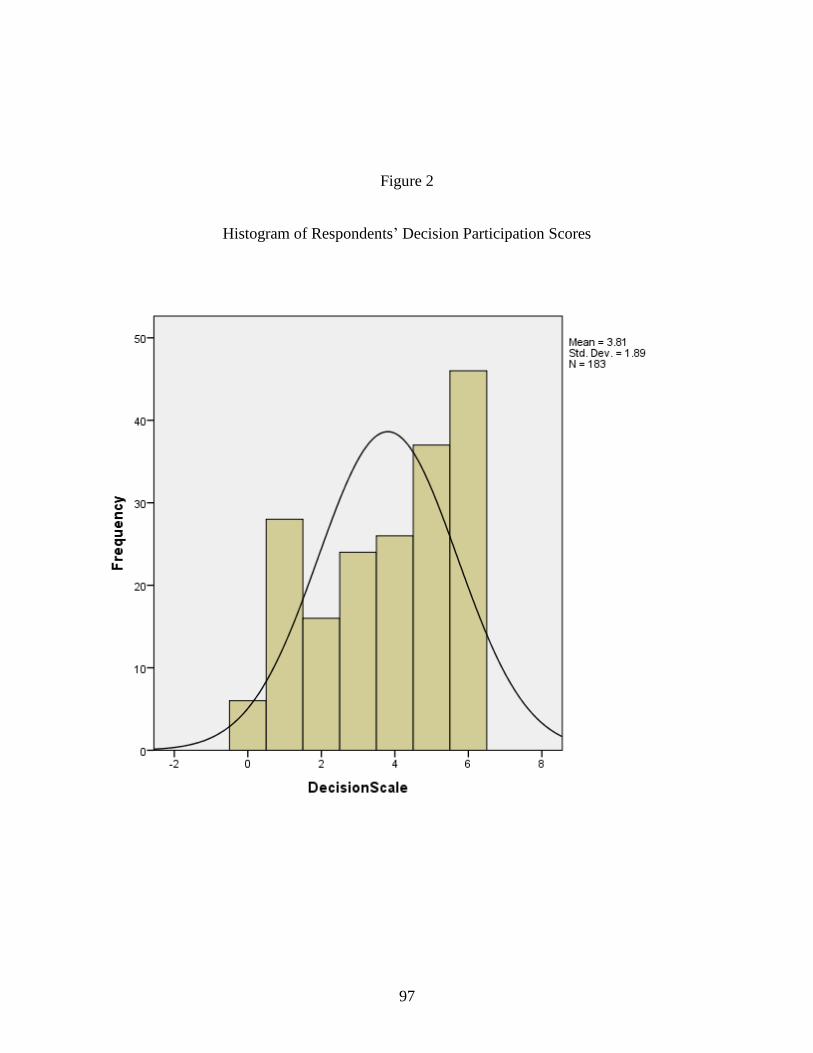
97
Figure 2
Histogram of Respondents’ Decision Participation Scores
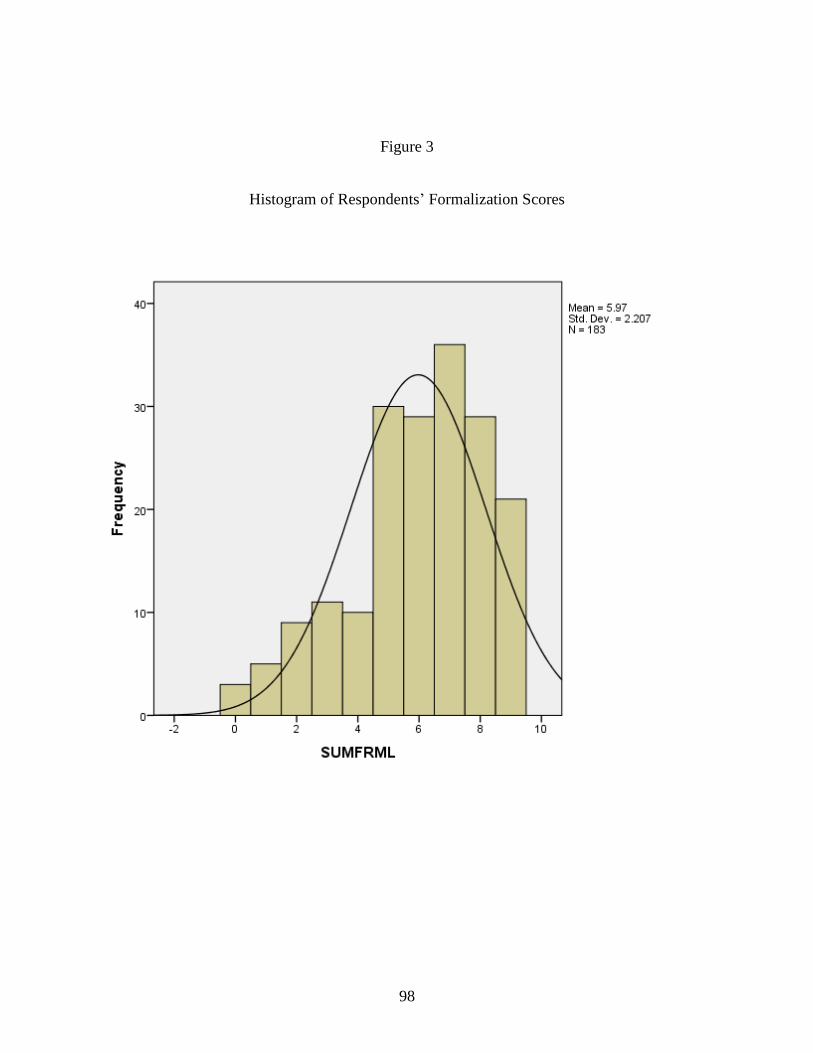
98
Figure 3
Histogram of Respondents’ Formalization Scores
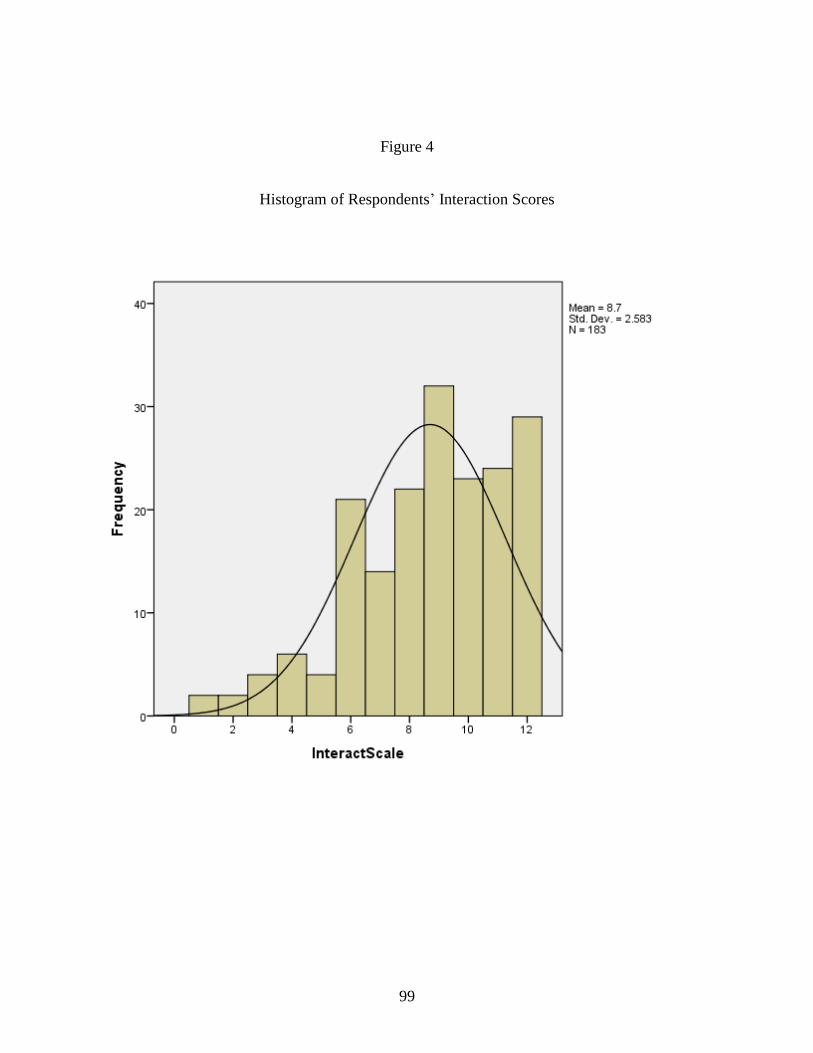
99
Figure 4
Histogram of Respondents’ Interaction Scores
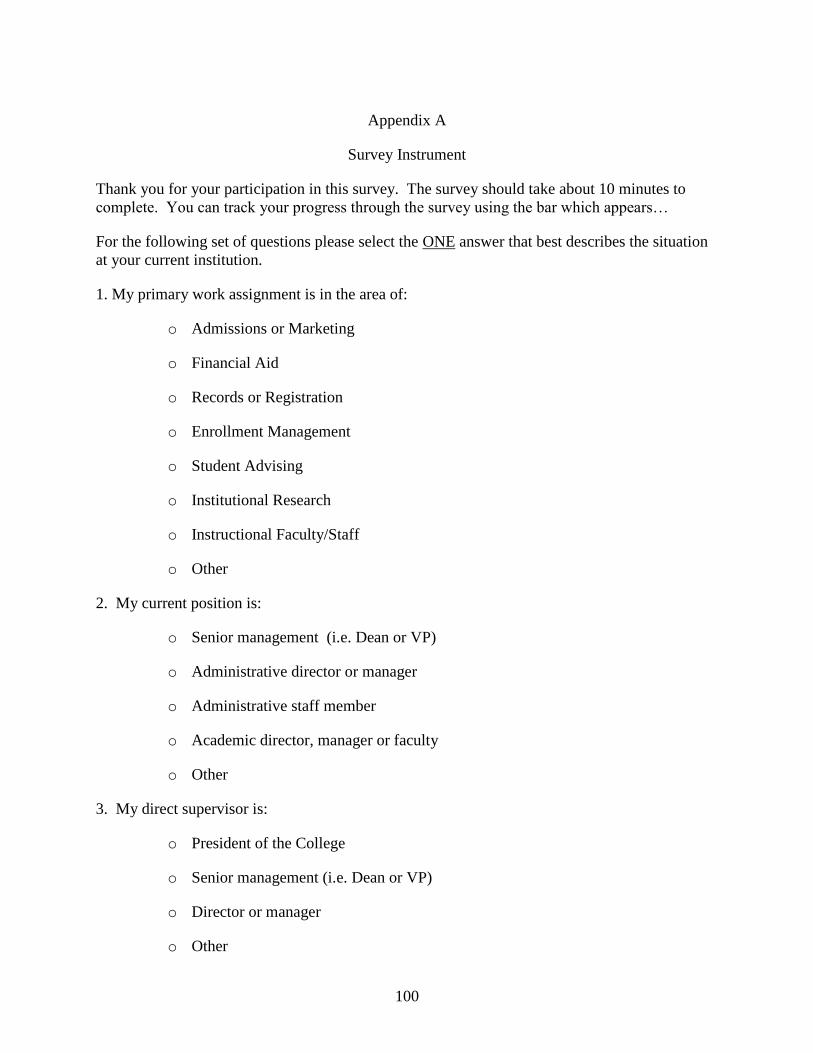
100
Appendix A
Survey Instrument
Thank you for your participation in this survey. The survey should take about 10 minutes to
complete. You can track your progress through the survey using the bar which appears…
For the following set of questions please select the ONE answer that best describes the situation
at your current institution.
1. My primary work assignment is in the area of:
o Admissions or Marketing
o Financial Aid
o Records or Registration
o Enrollment Management
o Student Advising
o Institutional Research
o Instructional Faculty/Staff
o Other
2. My current position is:
o Senior management (i.e. Dean or VP)
o Administrative director or manager
o Administrative staff member
o Academic director, manager or faculty
o Other
3. My direct supervisor is:
o President of the College
o Senior management (i.e. Dean or VP)
o Director or manager
o Other
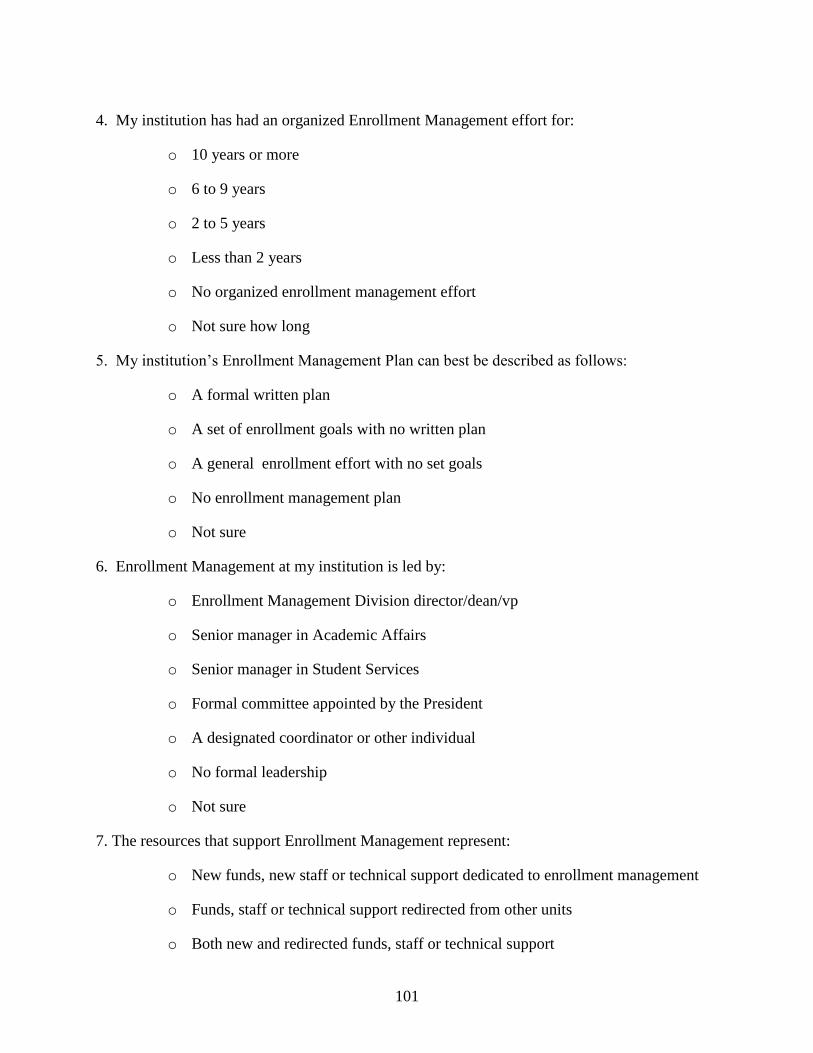
101
4. My institution has had an organized Enrollment Management effort for:
o 10 years or more
o 6 to 9 years
o 2 to 5 years
o Less than 2 years
o No organized enrollment management effort
o Not sure how long
5. My institution’s Enrollment Management Plan can best be described as follows:
o A formal written plan
o A set of enrollment goals with no written plan
o A general enrollment effort with no set goals
o No enrollment management plan
o Not sure
6. Enrollment Management at my institution is led by:
o Enrollment Management Division director/dean/vp
o Senior manager in Academic Affairs
o Senior manager in Student Services
o Formal committee appointed by the President
o A designated coordinator or other individual
o No formal leadership
o Not sure
7. The resources that support Enrollment Management represent:
o New funds, new staff or technical support dedicated to enrollment management
o Funds, staff or technical support redirected from other units
o Both new and redirected funds, staff or technical support
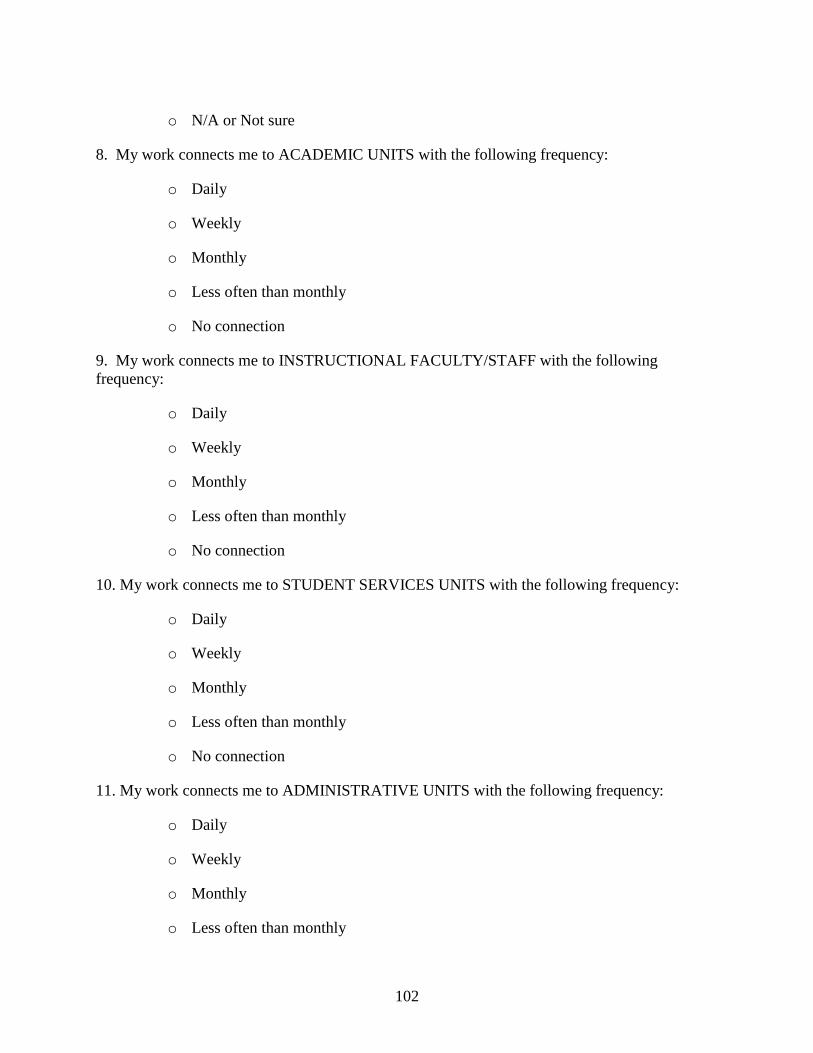
102
o N/A or Not sure
8. My work connects me to ACADEMIC UNITS with the following frequency:
o Daily
o Weekly
o Monthly
o Less often than monthly
o No connection
9. My work connects me to INSTRUCTIONAL FACULTY/STAFF with the following
frequency:
o Daily
o Weekly
o Monthly
o Less often than monthly
o No connection
10. My work connects me to STUDENT SERVICES UNITS with the following frequency:
o Daily
o Weekly
o Monthly
o Less often than monthly
o No connection
11. My work connects me to ADMINISTRATIVE UNITS with the following frequency:
o Daily
o Weekly
o Monthly
o Less often than monthly

103
o No connection
12. Over the past three years, the amount of control I exercise over my work product has:
o Increased
o Decreased
o Remained the same
o No control exercised
13. Over the past three years, the amount of information/data I receive about other work units has:
o Increased
o Decreased
o Remained the same
o No information received
14. Over the past three years, the amount of information/data I provide to other work units has:
o Increased
o Decreased
o Remained the same
o No information provided
15. In my current position, I am directly involved in SETTING GOALS for:
o Both the institution and my work area
o The institution only
o My work area only
o Not involved
16. In my current position, I am directly involved in SOLVING PROBLEMS for:
o Both the institution and my work area
o The institution only
o My work area only
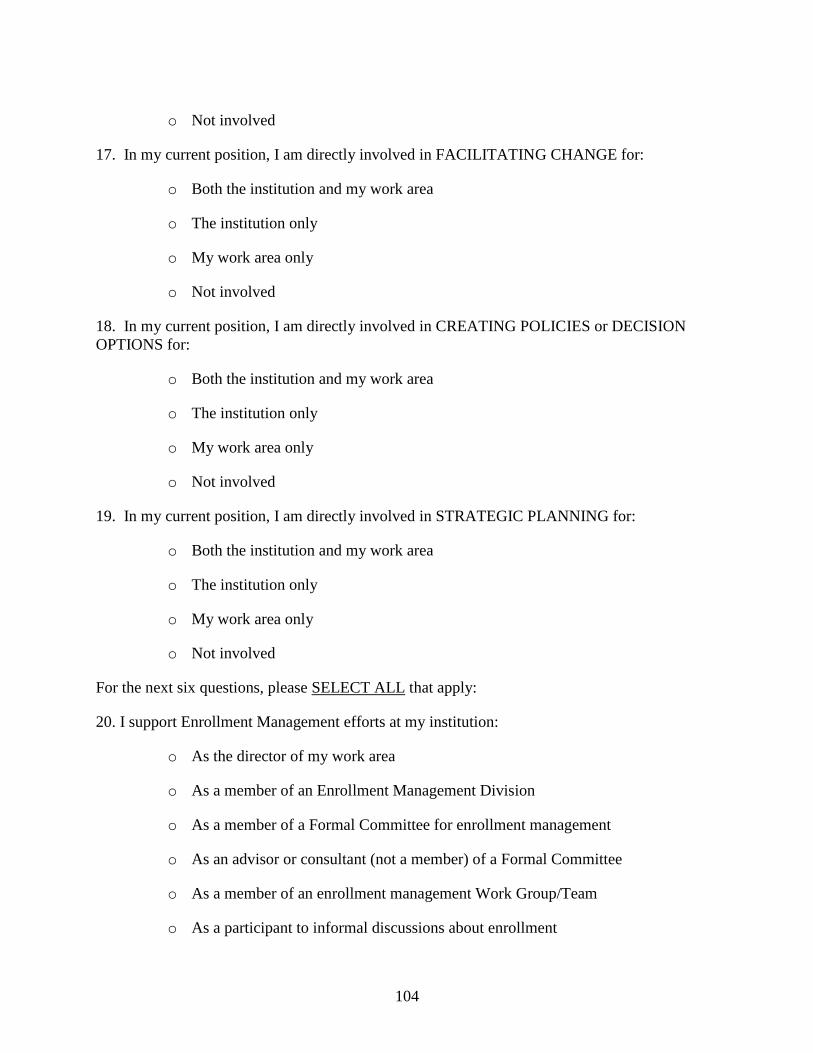
104
o Not involved
17. In my current position, I am directly involved in FACILITATING CHANGE for:
o Both the institution and my work area
o The institution only
o My work area only
o Not involved
18. In my current position, I am directly involved in CREATING POLICIES or DECISION
OPTIONS for:
o Both the institution and my work area
o The institution only
o My work area only
o Not involved
19. In my current position, I am directly involved in STRATEGIC PLANNING for:
o Both the institution and my work area
o The institution only
o My work area only
o Not involved
For the next six questions, please SELECT ALL that apply:
20. I support Enrollment Management efforts at my institution:
o As the director of my work area
o As a member of an Enrollment Management Division
o As a member of a Formal Committee for enrollment management
o As an advisor or consultant (not a member) of a Formal Committee
o As a member of an enrollment management Work Group/Team
o As a participant to informal discussions about enrollment
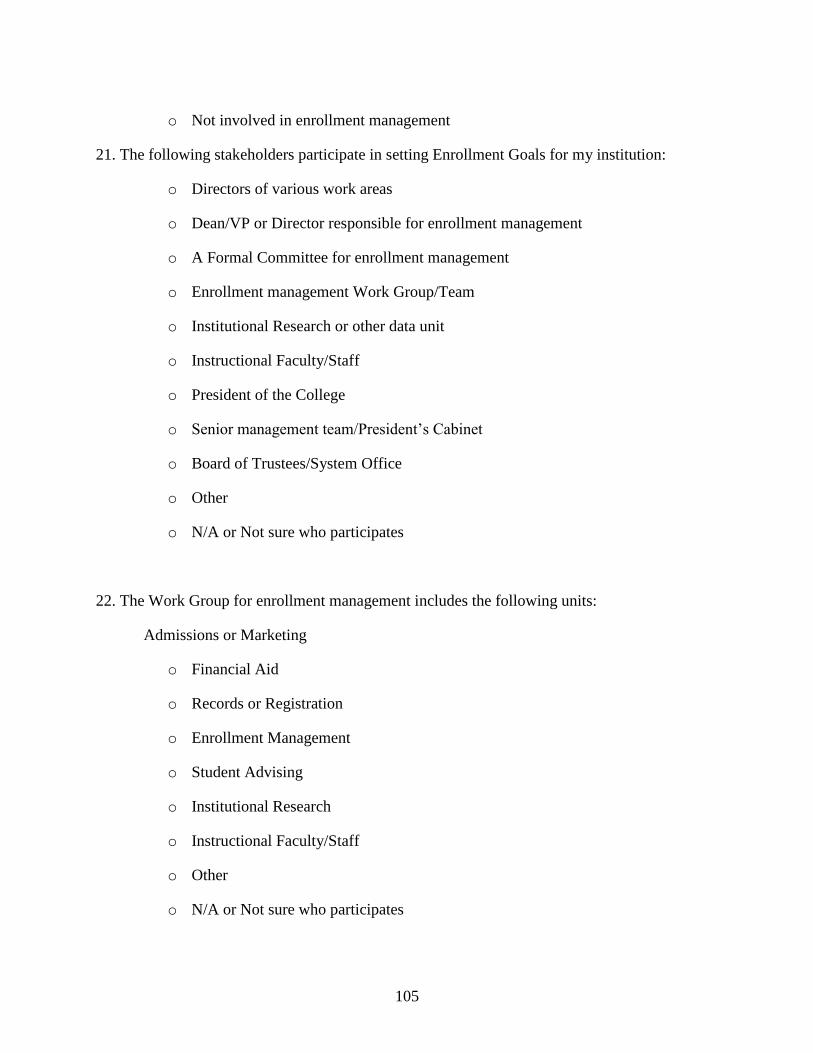
105
o Not involved in enrollment management
21. The following stakeholders participate in setting Enrollment Goals for my institution:
o Directors of various work areas
o Dean/VP or Director responsible for enrollment management
o A Formal Committee for enrollment management
o Enrollment management Work Group/Team
o Institutional Research or other data unit
o Instructional Faculty/Staff
o President of the College
o Senior management team/President’s Cabinet
o Board of Trustees/System Office
o Other
o N/A or Not sure who participates
22. The Work Group for enrollment management includes the following units:
Admissions or Marketing
o Financial Aid
o Records or Registration
o Enrollment Management
o Student Advising
o Institutional Research
o Instructional Faculty/Staff
o Other
o N/A or Not sure who participates
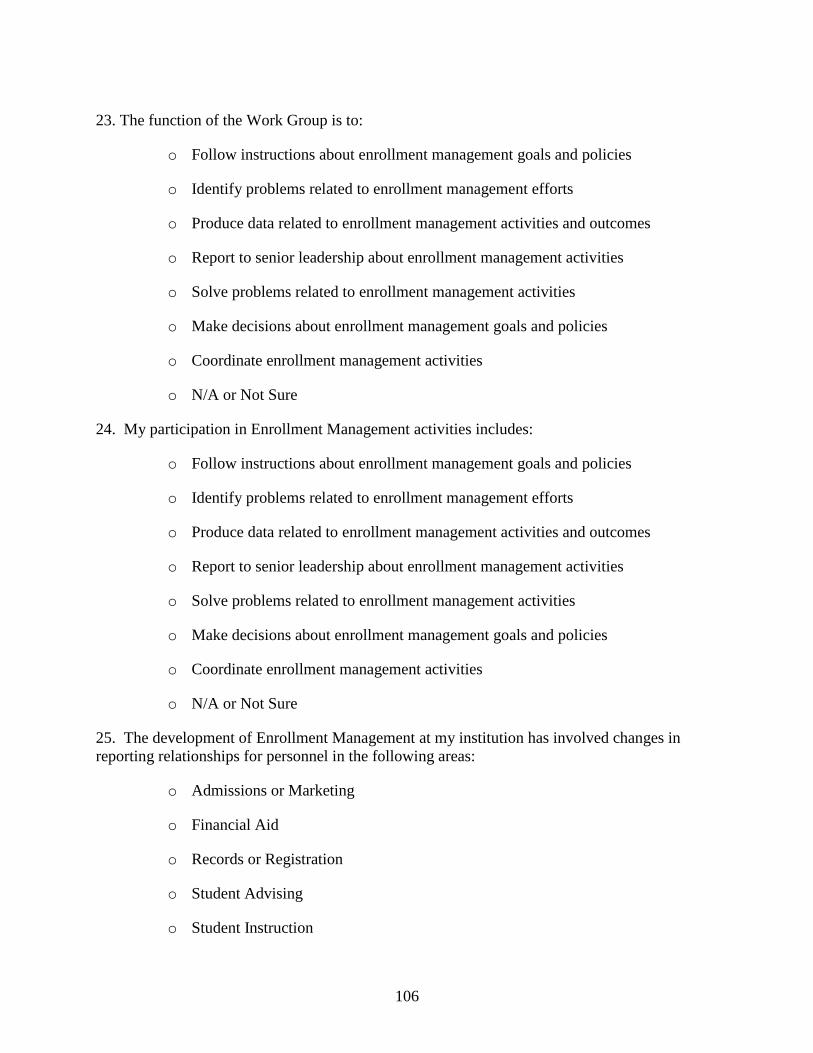
106
23. The function of the Work Group is to:
o Follow instructions about enrollment management goals and policies
o Identify problems related to enrollment management efforts
o Produce data related to enrollment management activities and outcomes
o Report to senior leadership about enrollment management activities
o Solve problems related to enrollment management activities
o Make decisions about enrollment management goals and policies
o Coordinate enrollment management activities
o N/A or Not Sure
24. My participation in Enrollment Management activities includes:
o Follow instructions about enrollment management goals and policies
o Identify problems related to enrollment management efforts
o Produce data related to enrollment management activities and outcomes
o Report to senior leadership about enrollment management activities
o Solve problems related to enrollment management activities
o Make decisions about enrollment management goals and policies
o Coordinate enrollment management activities
o N/A or Not Sure
25. The development of Enrollment Management at my institution has involved changes in
reporting relationships for personnel in the following areas:
o Admissions or Marketing
o Financial Aid
o Records or Registration
o Student Advising
o Student Instruction
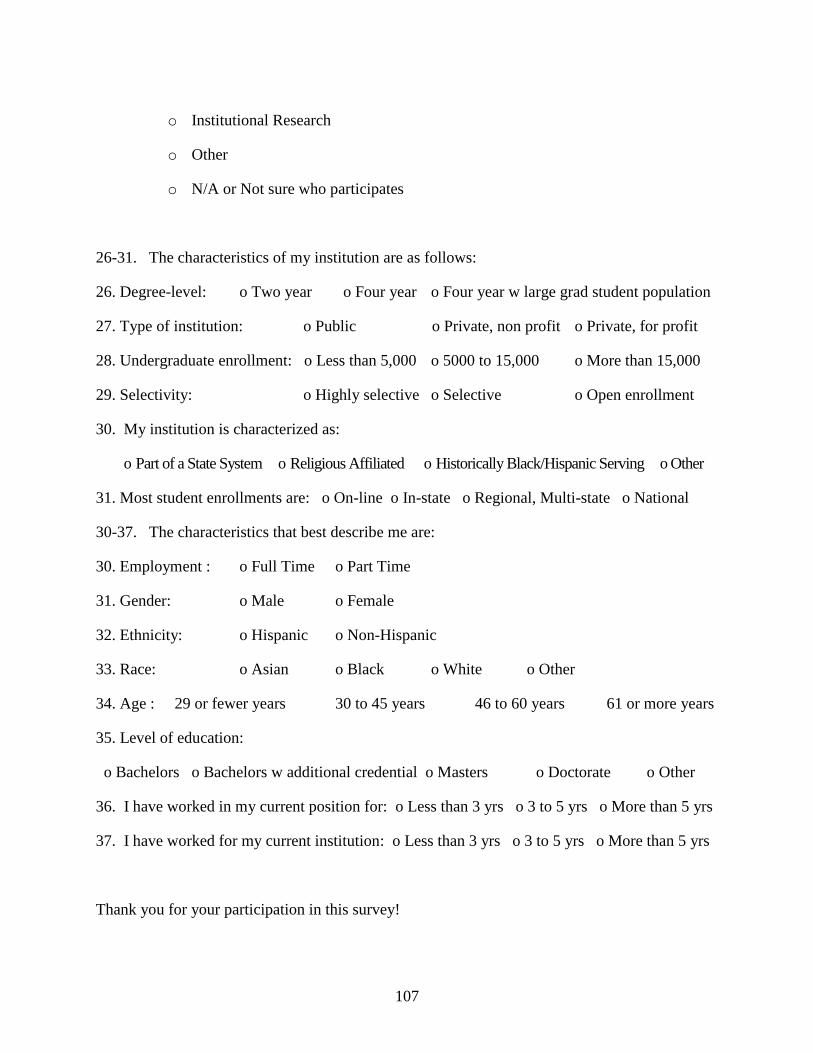
107
o Institutional Research
o Other
o N/A or Not sure who participates
26-31. The characteristics of my institution are as follows:
26. Degree-level: o Two year o Four year o Four year w large grad student population
27. Type of institution: o Public o Private, non profit o Private, for profit
28. Undergraduate enrollment: o Less than 5,000 o 5000 to 15,000 o More than 15,000
29. Selectivity: o Highly selective o Selective o Open enrollment
30. My institution is characterized as:
o Part of a State System o Religious Affiliated o Historically Black/Hispanic Serving o Other
31. Most student enrollments are: o On-line o In-state o Regional, Multi-state o National
30-37. The characteristics that best describe me are:
30. Employment : o Full Time o Part Time
31. Gender: o Male o Female
32. Ethnicity: o Hispanic o Non-Hispanic
33. Race: o Asian o Black o White o Other
34. Age : 29 or fewer years 30 to 45 years 46 to 60 years 61 or more years
35. Level of education:
o Bachelors o Bachelors w additional credential o Masters o Doctorate o Other
36. I have worked in my current position for: o Less than 3 yrs o 3 to 5 yrs o More than 5 yrs
37. I have worked for my current institution: o Less than 3 yrs o 3 to 5 yrs o More than 5 yrs
Thank you for your participation in this survey!
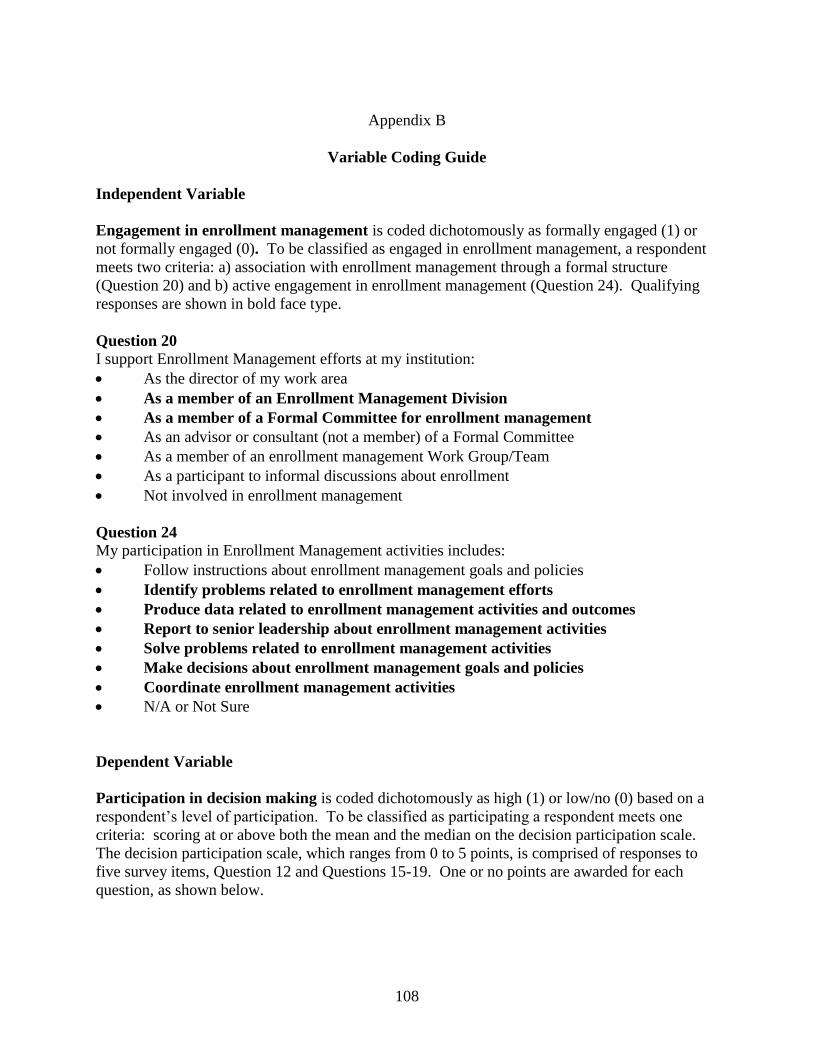
108
Appendix B
Variable Coding Guide
Independent Variable
Engagement in enrollment management is coded dichotomously as formally engaged (1) or
not formally engaged (0). To be classified as engaged in enrollment management, a respondent
meets two criteria: a) association with enrollment management through a formal structure
(Question 20) and b) active engagement in enrollment management (Question 24). Qualifying
responses are shown in bold face type.
Question 20
I support Enrollment Management efforts at my institution:
As the director of my work area
As a member of an Enrollment Management Division
As a member of a Formal Committee for enrollment management
As an advisor or consultant (not a member) of a Formal Committee
As a member of an enrollment management Work Group/Team
As a participant to informal discussions about enrollment
Not involved in enrollment management
Question 24
My participation in Enrollment Management activities includes:
Follow instructions about enrollment management goals and policies
Identify problems related to enrollment management efforts
Produce data related to enrollment management activities and outcomes
Report to senior leadership about enrollment management activities
Solve problems related to enrollment management activities
Make decisions about enrollment management goals and policies
Coordinate enrollment management activities
N/A or Not Sure
Dependent Variable
Participation in decision making is coded dichotomously as high (1) or low/no (0) based on a
respondent’s level of participation. To be classified as participating a respondent meets one
criteria: scoring at or above both the mean and the median on the decision participation scale.
The decision participation scale, which ranges from 0 to 5 points, is comprised of responses to
five survey items, Question 12 and Questions 15-19. One or no points are awarded for each
question, as shown below.
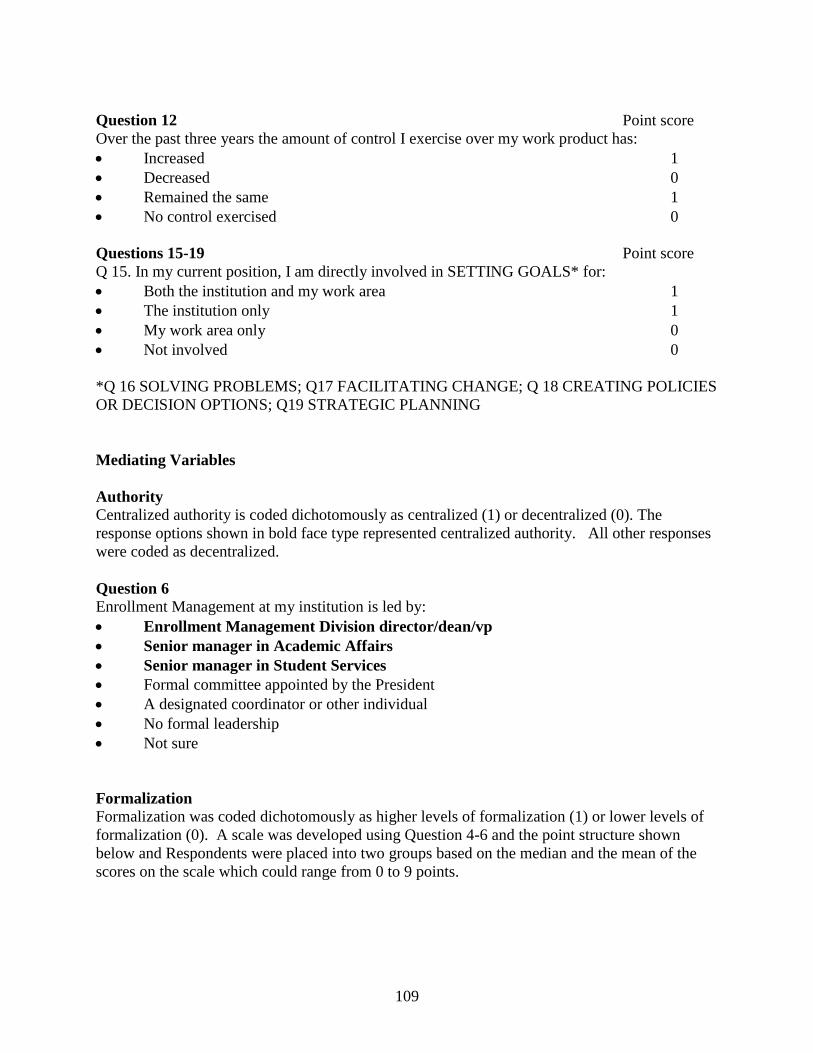
109
Question 12 Point score
Over the past three years the amount of control I exercise over my work product has:
Increased 1
Decreased 0
Remained the same 1
No control exercised 0
Questions 15-19 Point score
Q 15. In my current position, I am directly involved in SETTING GOALS* for:
Both the institution and my work area 1
The institution only 1
My work area only 0
Not involved 0
*Q 16 SOLVING PROBLEMS; Q17 FACILITATING CHANGE; Q 18 CREATING POLICIES
OR DECISION OPTIONS; Q19 STRATEGIC PLANNING
Mediating Variables
Authority
Centralized authority is coded dichotomously as centralized (1) or decentralized (0). The
response options shown in bold face type represented centralized authority. All other responses
were coded as decentralized.
Question 6
Enrollment Management at my institution is led by:
Enrollment Management Division director/dean/vp
Senior manager in Academic Affairs
Senior manager in Student Services
Formal committee appointed by the President
A designated coordinator or other individual
No formal leadership
Not sure
Formalization Formalization was coded dichotomously as higher levels of formalization (1) or lower levels of
formalization (0). A scale was developed using Question 4-6 and the point structure shown
below and Respondents were placed into two groups based on the median and the mean of the
scores on the scale which could range from 0 to 9 points.
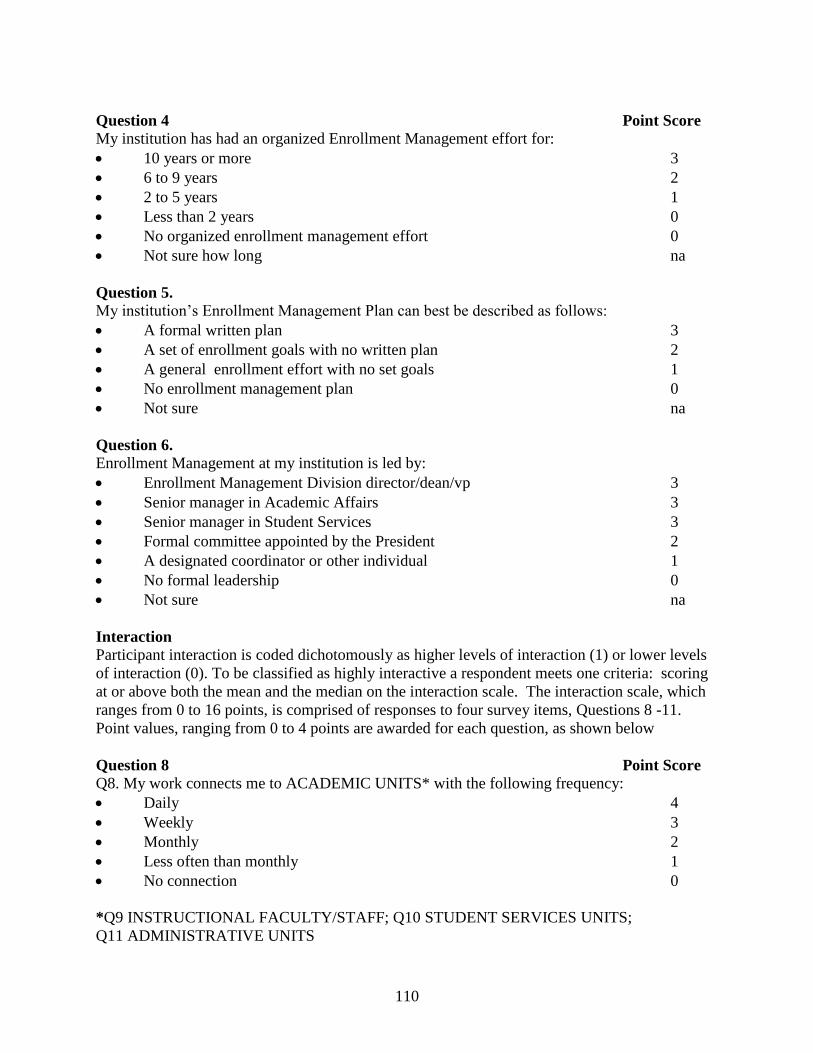
110
Question 4 Point Score
My institution has had an organized Enrollment Management effort for:
10 years or more 3
6 to 9 years 2
2 to 5 years 1
Less than 2 years 0
No organized enrollment management effort 0
Not sure how long na
Question 5.
My institution’s Enrollment Management Plan can best be described as follows:
A formal written plan 3
A set of enrollment goals with no written plan 2
A general enrollment effort with no set goals 1
No enrollment management plan 0
Not sure na
Question 6.
Enrollment Management at my institution is led by:
Enrollment Management Division director/dean/vp 3
Senior manager in Academic Affairs 3
Senior manager in Student Services 3
Formal committee appointed by the President 2
A designated coordinator or other individual 1
No formal leadership 0
Not sure na
Interaction
Participant interaction is coded dichotomously as higher levels of interaction (1) or lower levels
of interaction (0). To be classified as highly interactive a respondent meets one criteria: scoring
at or above both the mean and the median on the interaction scale. The interaction scale, which
ranges from 0 to 16 points, is comprised of responses to four survey items, Questions 8 -11.
Point values, ranging from 0 to 4 points are awarded for each question, as shown below
Question 8 Point Score
Q8. My work connects me to ACADEMIC UNITS* with the following frequency:
Daily 4
Weekly 3
Monthly 2
Less often than monthly 1
No connection 0
*Q9 INSTRUCTIONAL FACULTY/STAFF; Q10 STUDENT SERVICES UNITS;
Q11 ADMINISTRATIVE UNITS