Embed Size (px)
Citation preview

0
Enq: Zinzi Mphahlele
Tel: 015 290 2195
Monthly Budget Statement
28 February 2014
In-year report (February 2014) – Monthly Budget Statement
1
DIRECTORATE: BUDGET AND TREASURY OFFICE ITEM: 15 FILE REF: 4/1 FINANCIAL REPORT FOR THE PERIOD ENDED 28 FEBRUARY 2014. Report of the Chief Financial Officer
1. PURPOSE The purpose of this report is to comply with section 71 and 52(d) of the MFMA and the requirements as promulgated in the Government Gazette No 32141 of 17 April 2009 (Municipal Budgeting Monitoring and Reporting Requirements). 2. STRATEGIC OBJECTIVE
“To comply with MFMA priorities as well as MFMA implementation plan”
3. BACKGROUND
The Financial Report provides a high level overview of the organisation’s financial viability and sustainability. The report meets the requirements of the Municipal Finance Management Act (MFMA 56/2003 – S66 and S71) and the Municipal Budgets and Reporting Regulations (MBRR - No 32141 gazetted 17 April 2009).
Section 71 (1) states that the accounting officer of the municipality must by no later that 10 working days after the end of each month submit to the mayor of the municipality and the relevant treasury a statement in the prescribed format on the implementation of the municipality’s approved budget.” For the reporting period ending 28 February 2014 the ten working day reporting limit expires on 14 March 2014. The Budget and Treasury Office has met the timelines for this reporting period.
RECOMMEND
That the report be noted.
In-year report (February 2014) – Monthly Budget Statement
2
Contents PART 1 – IN-YEAR REPORT ............................................................................................................ 3
1.1 EXECUTIVE SUMMARY .................................................................................................... 3
1.1.1 Revenue Performance ........................................................................................................... 3
1.1.2 Expenditure performance ...................................................................................................... 3
1.1.3 Capital Performance .............................................................................................................. 3
1.1.4 Transfer of Funds ................................................................................................................... 5
1.1.5 External Loans and Instalments ........................................................................................... 6
1.1.6 Debtors..................................................................................................................................... 6
1.1.7 Creditors .................................................................................................................................. 6
1.1.8 Investments ............................................................................................................................. 6
1.1.9 Councillor and Staff Benefits ................................................................................................ 7
In-year budget statement tables ........................................................................................................ 9
2.1Table C1: Monthly budget statement summary ......................................................................... 9
2.2 Table C2: Monthly Budget Statement - Financial Performance (standard classification)
.......................................................................................................................................................... 10
2.3 Table C3: Monthly Budget Statement - Financial Performance (revenue and expenditure
by municipal vote) .............................................................................................................................. 11
2.4 Table C4 - Monthly Budget Statement - Financial Performance (revenue and
expenditure) ........................................................................................................................................ 12
2.5Table C5 Monthly Budget Statement - Capital Expenditure (municipal vote, standard
classification and funding) ................................................................................................................. 13
2.6 Table C6: Monthly Budget Statement - Financial Position................................................... 14
2.7 Table C7 Monthly Budget Statement - Cash Flow ................................................................. 15
PART 2- SUPPORTING DOCUMENTATION ............................................................................... 16
Section 1 – Debtors’ analysis ........................................................................................................... 16
Section 2 – Creditors’ Age analysis ................................................................................................. 16
Section 3 – Investment portfolio analysis ....................................................................................... 17
Section 4 - Capital programme performance ............................................................................. 18
Section 5 - Municipal Manager Quality certification .................................................................. 18
Annexure A Capital Programme 2013/2014 .................................................................................... 0
In-year report (February 2014) – Monthly Budget Statement
3
PART 1 – IN-YEAR REPORT
1.1 EXECUTIVE SUMMARY
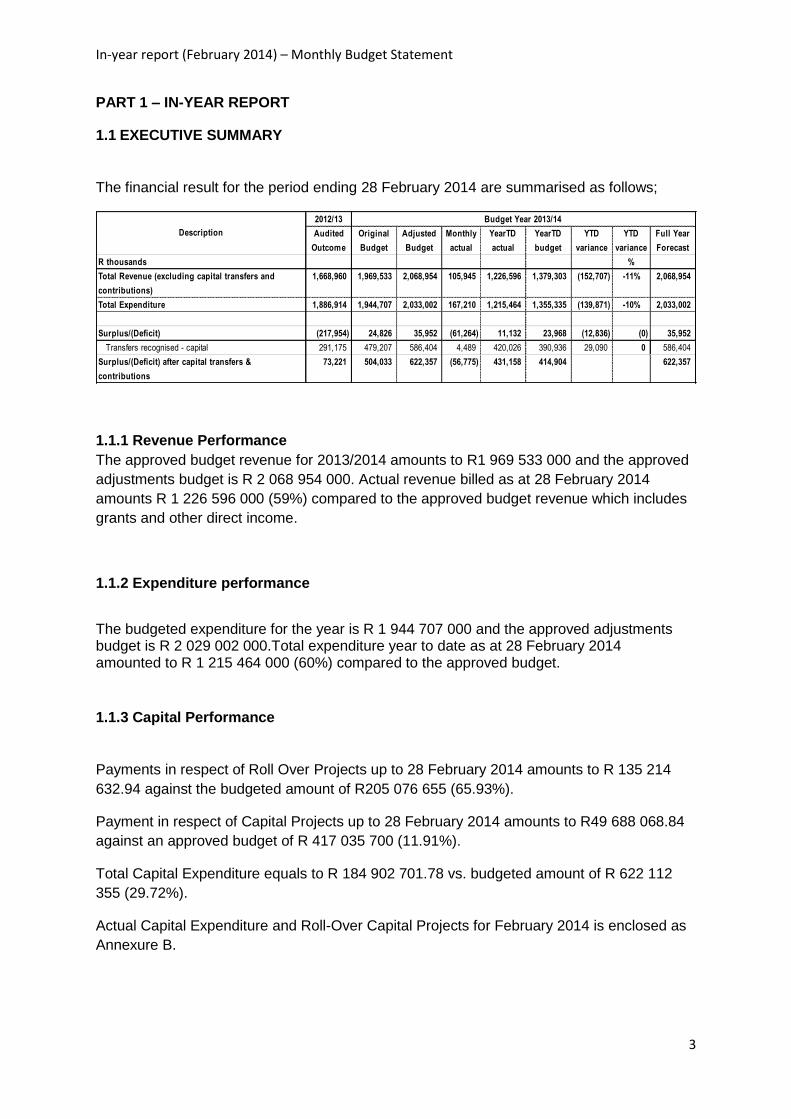
The financial result for the period ending 28 February 2014 are summarised as follows;
1.1.1 Revenue Performance
The approved budget revenue for 2013/2014 amounts to R1 969 533 000 and the approved
adjustments budget is R 2 068 954 000. Actual revenue billed as at 28 February 2014
amounts R 1 226 596 000 (59%) compared to the approved budget revenue which includes
grants and other direct income.
1.1.2 Expenditure performance
The budgeted expenditure for the year is R 1 944 707 000 and the approved adjustments budget is R 2 029 002 000.Total expenditure year to date as at 28 February 2014 amounted to R 1 215 464 000 (60%) compared to the approved budget.
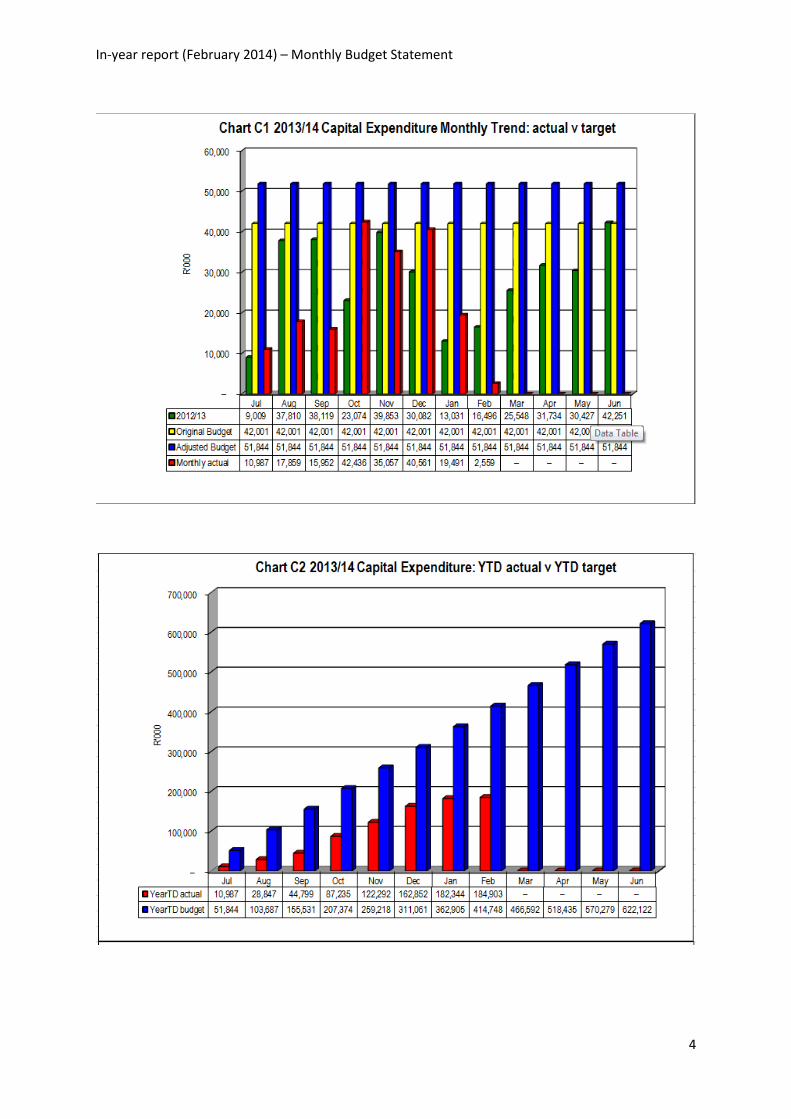
1.1.3 Capital Performance
Payments in respect of Roll Over Projects up to 28 February 2014 amounts to R 135 214
632.94 against the budgeted amount of R205 076 655 (65.93%).
Payment in respect of Capital Projects up to 28 February 2014 amounts to R49 688 068.84
against an approved budget of R 417 035 700 (11.91%).
Total Capital Expenditure equals to R 184 902 701.78 vs. budgeted amount of R 622 112
355 (29.72%).
Actual Capital Expenditure and Roll-Over Capital Projects for February 2014 is enclosed as
Annexure B.
2012/13
Audited
Outcome
Original
Budget
Adjusted
Budget
Monthly
actual
YearTD
actual
YearTD
budget
YTD
variance
YTD
variance
Full Year
Forecast
R thousands %
Total Revenue (excluding capital transfers and
contributions)
1,668,960 1,969,533 2,068,954 105,945 1,226,596 1,379,303 (152,707) -11% 2,068,954
Total Expenditure 1,886,914 1,944,707 2,033,002 167,210 1,215,464 1,355,335 (139,871) -10% 2,033,002
Surplus/(Deficit) (217,954) 24,826 35,952 (61,264) 11,132 23,968 (12,836) (0) 35,952
Transfers recognised - capital 291,175 479,207 586,404 4,489 420,026 390,936 29,090 0 586,404
Surplus/(Deficit) after capital transfers &
contributions
73,221 504,033 622,357 (56,775) 431,158 414,904 622,357
Description
Budget Year 2013/14
In-year report (February 2014) – Monthly Budget Statement
4
In-year report (February 2014) – Monthly Budget Statement
5
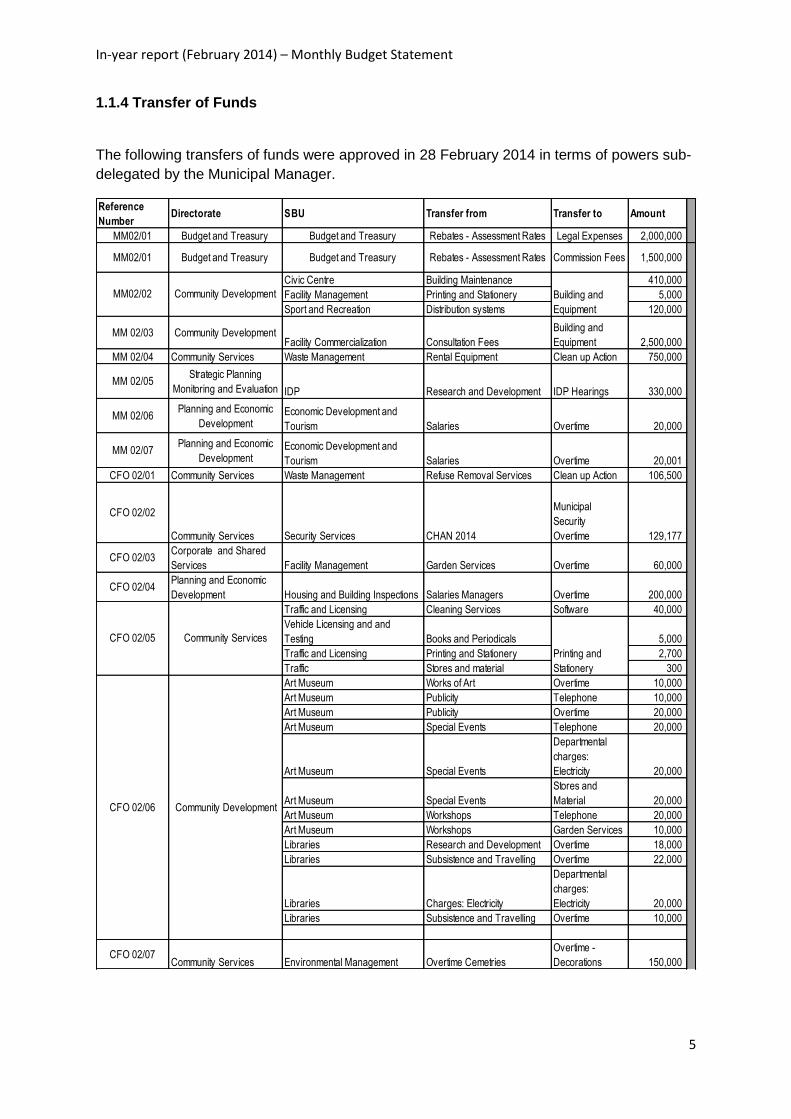
1.1.4 Transfer of Funds
The following transfers of funds were approved in 28 February 2014 in terms of powers sub-
delegated by the Municipal Manager.
Reference
NumberDirectorate SBU Transfer from Transfer to Amount
MM02/01 Budget and Treasury Budget and Treasury Rebates - Assessment Rates Legal Expenses 2,000,000
MM02/01 Budget and Treasury Budget and Treasury Rebates - Assessment Rates Commission Fees 1,500,000
Civic Centre Building Maintenance 410,000
Facility Management Printing and Stationery 5,000
Sport and Recreation Distribution systems 120,000
MM 02/03 Community DevelopmentFacility Commercialization Consultation Fees
Building and
Equipment 2,500,000
MM 02/04 Community Services Waste Management Rental Equipment Clean up Action 750,000
MM 02/05Strategic Planning
Monitoring and Evaluation IDP Research and Development IDP Hearings 330,000
MM 02/06Planning and Economic
DevelopmentEconomic Development and
Tourism Salaries Overtime 20,000
MM 02/07Planning and Economic
DevelopmentEconomic Development and
Tourism Salaries Overtime 20,001
CFO 02/01 Community Services Waste Management Refuse Removal Services Clean up Action 106,500
CFO 02/02
Community Services Security Services CHAN 2014
Municipal
Security
Overtime 129,177
CFO 02/03Corporate and Shared
Services Facility Management Garden Services Overtime 60,000
CFO 02/04Planning and Economic
Development Housing and Building Inspections Salaries Managers Overtime 200,000
Traffic and Licensing Cleaning Services Software 40,000
Vehicle Licensing and and
Testing Books and Periodicals 5,000
Traffic and Licensing Printing and Stationery 2,700
Traffic Stores and material 300
Art Museum Works of Art Overtime 10,000
Art Museum Publicity Telephone 10,000
Art Museum Publicity Overtime 20,000
Art Museum Special Events Telephone 20,000
Art Museum Special Events
Departmental
charges:
Electricity 20,000
Art Museum Special Events
Stores and
Material 20,000
Art Museum Workshops Telephone 20,000
Art Museum Workshops Garden Services 10,000
Libraries Research and Development Overtime 18,000
Libraries Subsistence and Travelling Overtime 22,000
Libraries Charges: Electricity
Departmental
charges:
Electricity 20,000
Libraries Subsistence and Travelling Overtime 10,000
CFO 02/07Community Services Environmental Management Overtime Cemetries
Overtime -
Decorations 150,000
MM02/02 Community Development Building and
Equipment
CFO 02/05 Community Services
Printing and
Stationery
CFO 02/06 Community Development
In-year report (February 2014) – Monthly Budget Statement
6
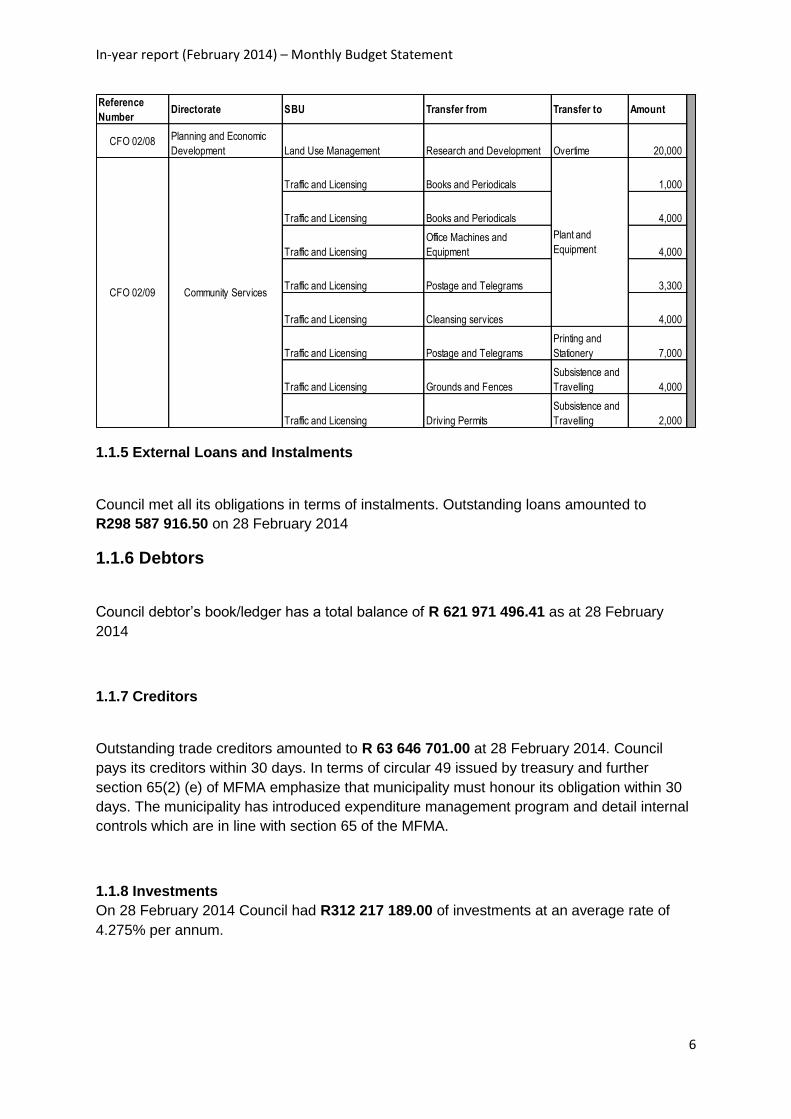
1.1.5 External Loans and Instalments
Council met all its obligations in terms of instalments. Outstanding loans amounted to
R298 587 916.50 on 28 February 2014
1.1.6 Debtors
Council debtor’s book/ledger has a total balance of R 621 971 496.41 as at 28 February
2014
1.1.7 Creditors
Outstanding trade creditors amounted to R 63 646 701.00 at 28 February 2014. Council
pays its creditors within 30 days. In terms of circular 49 issued by treasury and further
section 65(2) (e) of MFMA emphasize that municipality must honour its obligation within 30
days. The municipality has introduced expenditure management program and detail internal
controls which are in line with section 65 of the MFMA.
1.1.8 Investments
On 28 February 2014 Council had R312 217 189.00 of investments at an average rate of
4.275% per annum.
Reference
NumberDirectorate SBU Transfer from Transfer to Amount
CFO 02/08 Planning and Economic
Development Land Use Management Research and Development Overtime 20,000
Traffic and Licensing Books and Periodicals 1,000
Traffic and Licensing Books and Periodicals 4,000
Traffic and Licensing
Office Machines and
Equipment 4,000
Traffic and Licensing Postage and Telegrams 3,300
Traffic and Licensing Cleansing services 4,000
Traffic and Licensing Postage and Telegrams
Printing and
Stationery 7,000
Traffic and Licensing Grounds and Fences
Subsistence and
Travelling 4,000
Traffic and Licensing Driving Permits
Subsistence and
Travelling 2,000
CFO 02/09
Plant and
Equipment
Community Services
In-year report (February 2014) – Monthly Budget Statement
7
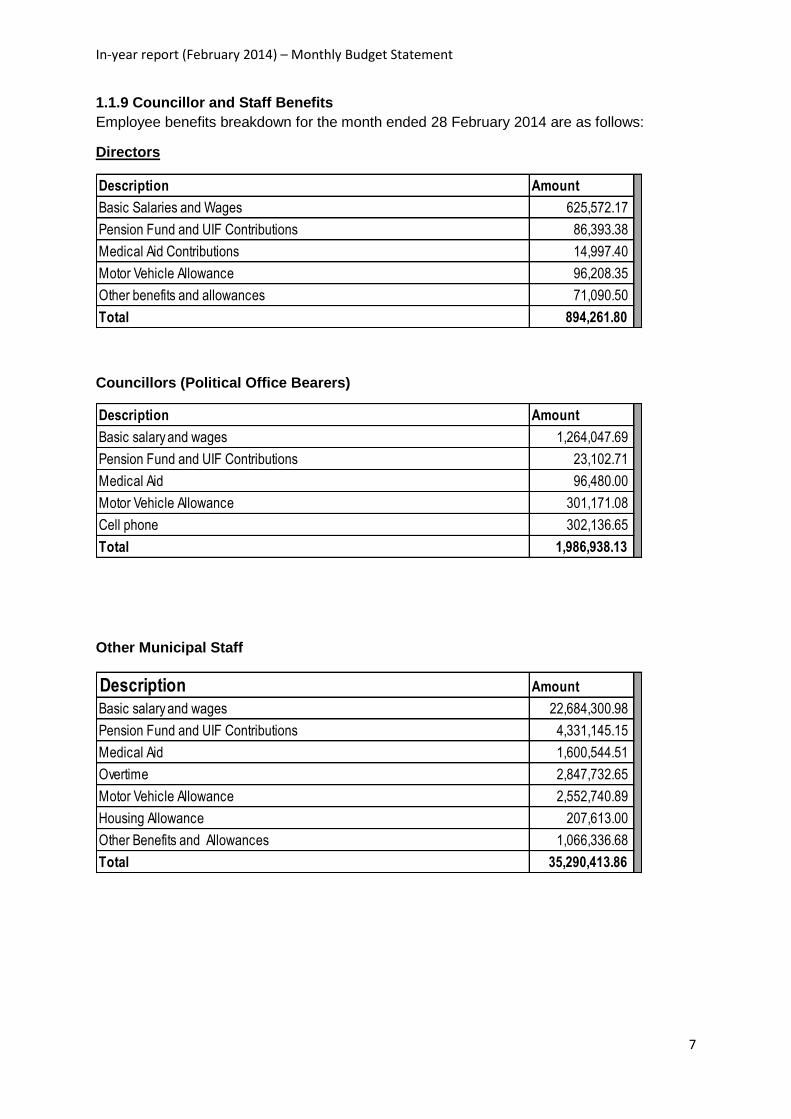
1.1.9 Councillor and Staff Benefits
Employee benefits breakdown for the month ended 28 February 2014 are as follows:
Directors
Councillors (Political Office Bearers)
Other Municipal Staff
Description Amount
Basic Salaries and Wages 625,572.17
Pension Fund and UIF Contributions 86,393.38
Medical Aid Contributions 14,997.40
Motor Vehicle Allowance 96,208.35
Other benefits and allowances 71,090.50
Total 894,261.80
Description Amount
Basic salary and wages 1,264,047.69
Pension Fund and UIF Contributions 23,102.71
Medical Aid 96,480.00
Motor Vehicle Allowance 301,171.08
Cell phone 302,136.65
Total 1,986,938.13
Description Amount
Basic salary and wages 22,684,300.98
Pension Fund and UIF Contributions 4,331,145.15
Medical Aid 1,600,544.51
Overtime 2,847,732.65
Motor Vehicle Allowance 2,552,740.89
Housing Allowance 207,613.00
Other Benefits and Allowances 1,066,336.68
Total 35,290,413.86
In-year report (February 2014) – Monthly Budget Statement
8
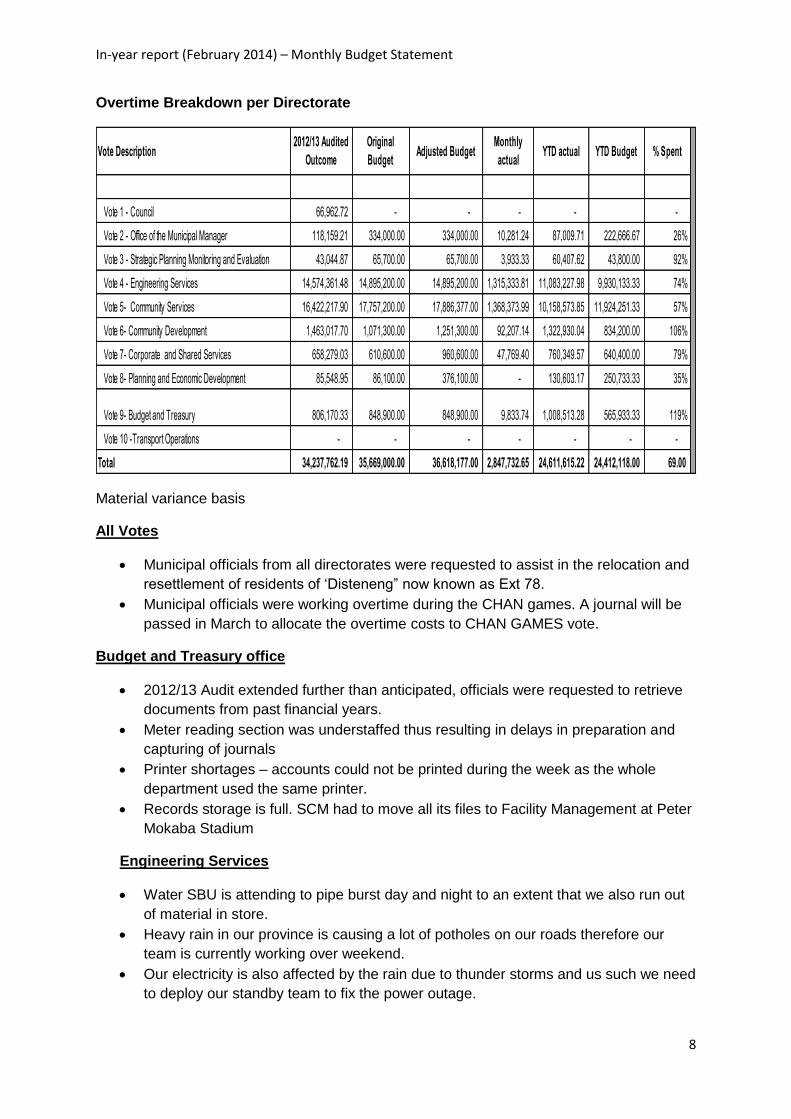
Overtime Breakdown per Directorate
Material variance basis
All Votes
Municipal officials from all directorates were requested to assist in the relocation and
resettlement of residents of ‘Disteneng” now known as Ext 78.
Municipal officials were working overtime during the CHAN games. A journal will be
passed in March to allocate the overtime costs to CHAN GAMES vote.
Budget and Treasury office
2012/13 Audit extended further than anticipated, officials were requested to retrieve
documents from past financial years.
Meter reading section was understaffed thus resulting in delays in preparation and
capturing of journals
Printer shortages – accounts could not be printed during the week as the whole
department used the same printer.
Records storage is full. SCM had to move all its files to Facility Management at Peter
Mokaba Stadium
Engineering Services
Water SBU is attending to pipe burst day and night to an extent that we also run out
of material in store.
Heavy rain in our province is causing a lot of potholes on our roads therefore our
team is currently working over weekend.
Our electricity is also affected by the rain due to thunder storms and us such we need
to deploy our standby team to fix the power outage.
Vote 1 - Council 66,962.72 - - - - -
Vote 2 - Office of the Municipal Manager 118,159.21 334,000.00 334,000.00 10,281.24 87,009.71 222,666.67 26%
Vote 3 - Strategic Planning Monitoring and Evaluation 43,044.87 65,700.00 65,700.00 3,933.33 60,407.62 43,800.00 92%
Vote 4 - Engineering Services 14,574,361.48 14,895,200.00 14,895,200.00 1,315,333.81 11,083,227.98 9,930,133.33 74%
Vote 5- Community Services 16,422,217.90 17,757,200.00 17,886,377.00 1,368,373.99 10,158,573.85 11,924,251.33 57%
Vote 6- Community Development 1,463,017.70 1,071,300.00 1,251,300.00 92,207.14 1,322,930.04 834,200.00 106%
Vote 7- Corporate and Shared Services 658,279.03 610,600.00 960,600.00 47,769.40 760,349.57 640,400.00 79%
Vote 8- Planning and Economic Development 85,548.95 86,100.00 376,100.00 - 130,603.17 250,733.33 35%
Vote 9- Budget and Treasury 806,170.33 848,900.00 848,900.00 9,833.74 1,008,513.28 565,933.33 119%
Vote 10 -Transport Operations - - - - - - -
Total 34,237,762.19 35,669,000.00 36,618,177.00 2,847,732.65 24,611,615.22 24,412,118.00 69.00
YTD Budget % SpentVote Description2012/13 Audited
Outcome
Original
BudgetAdjusted Budget
Monthly
actualYTD actual
In-year report (February 2014) – Monthly Budget Statement
9
In-year budget statement tables
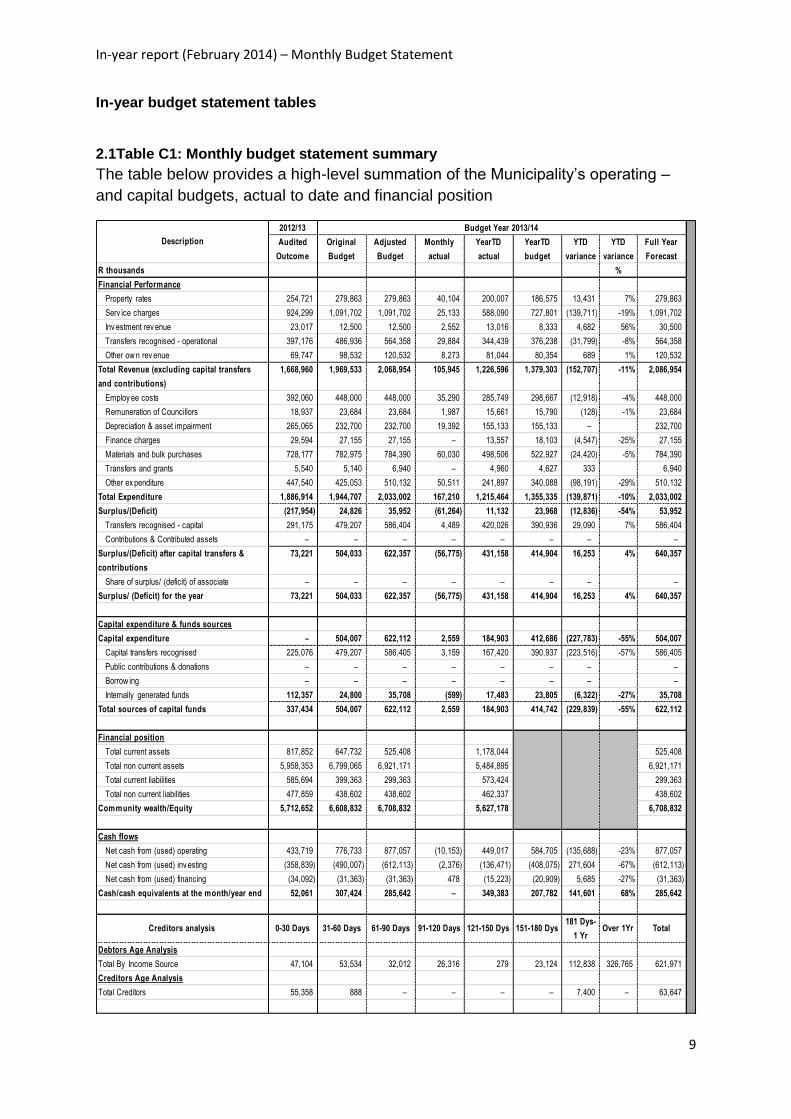
2.1Table C1: Monthly budget statement summary
The table below provides a high-level summation of the Municipality’s operating –
and capital budgets, actual to date and financial position
2012/13
Audited
Outcome
Original
Budget
Adjusted
Budget
Monthly
actual
YearTD
actual
YearTD
budget
YTD
variance
YTD
variance
Full Year
Forecast
R thousands %
Financial Performance
Property rates 254,721 279,863 279,863 40,104 200,007 186,575 13,431 7% 279,863
Serv ice charges 924,299 1,091,702 1,091,702 25,133 588,090 727,801 (139,711) -19% 1,091,702
Inv estment rev enue 23,017 12,500 12,500 2,552 13,016 8,333 4,682 56% 30,500
Transfers recognised - operational 397,176 486,936 564,358 29,884 344,439 376,238 (31,799) -8% 564,358
Other ow n rev enue 69,747 98,532 120,532 8,273 81,044 80,354 689 1% 120,532
Total Revenue (excluding capital transfers
and contributions)
1,668,960 1,969,533 2,068,954 105,945 1,226,596 1,379,303 (152,707) -11% 2,086,954
Employ ee costs 392,060 448,000 448,000 35,290 285,749 298,667 (12,918) -4% 448,000
Remuneration of Councillors 18,937 23,684 23,684 1,987 15,661 15,790 (128) -1% 23,684
Depreciation & asset impairment 265,065 232,700 232,700 19,392 155,133 155,133 – 232,700
Finance charges 29,594 27,155 27,155 – 13,557 18,103 (4,547) -25% 27,155
Materials and bulk purchases 728,177 782,975 784,390 60,030 498,506 522,927 (24,420) -5% 784,390
Transfers and grants 5,540 5,140 6,940 – 4,960 4,627 333 6,940
Other ex penditure 447,540 425,053 510,132 50,511 241,897 340,088 (98,191) -29% 510,132
Total Expenditure 1,886,914 1,944,707 2,033,002 167,210 1,215,464 1,355,335 (139,871) -10% 2,033,002
Surplus/(Deficit) (217,954) 24,826 35,952 (61,264) 11,132 23,968 (12,836) -54% 53,952
Transfers recognised - capital 291,175 479,207 586,404 4,489 420,026 390,936 29,090 7% 586,404
Contributions & Contributed assets – – – – – – – –
Surplus/(Deficit) after capital transfers &
contributions
73,221 504,033 622,357 (56,775) 431,158 414,904 16,253 4% 640,357
Share of surplus/ (deficit) of associate – – – – – – – –
Surplus/ (Deficit) for the year 73,221 504,033 622,357 (56,775) 431,158 414,904 16,253 4% 640,357
Capital expenditure & funds sources
Capital expenditure – 504,007 622,112 2,559 184,903 412,686 (227,783) -55% 504,007
Capital transfers recognised 225,076 479,207 586,405 3,159 167,420 390,937 (223,516) -57% 586,405
Public contributions & donations – – – – – – – –
Borrow ing – – – – – – – –
Internally generated funds 112,357 24,800 35,708 (599) 17,483 23,805 (6,322) -27% 35,708
Total sources of capital funds 337,434 504,007 622,112 2,559 184,903 414,742 (229,839) -55% 622,112
Financial position
Total current assets 817,852 647,732 525,408 1,178,044 525,408
Total non current assets 5,958,353 6,799,065 6,921,171 5,484,895 6,921,171
Total current liabilities 585,694 399,363 299,363 573,424 299,363
Total non current liabilities 477,859 438,602 438,602 462,337 438,602
Community wealth/Equity 5,712,652 6,608,832 6,708,832 5,627,178 6,708,832
Cash flows
Net cash from (used) operating 433,719 776,733 877,057 (10,153) 449,017 584,705 (135,688) -23% 877,057
Net cash from (used) inv esting (358,839) (490,007) (612,113) (2,376) (136,471) (408,075) 271,604 -67% (612,113)
Net cash from (used) financing (34,092) (31,363) (31,363) 478 (15,223) (20,909) 5,685 -27% (31,363)
Cash/cash equivalents at the month/year end 52,061 307,424 285,642 – 349,383 207,782 141,601 68% 285,642
Creditors analysis 0-30 Days 31-60 Days 61-90 Days 91-120 Days 121-150 Dys 151-180 Dys181 Dys-
1 YrOver 1Yr Total
Debtors Age Analysis
Total By Income Source 47,104 53,534 32,012 26,316 279 23,124 112,838 326,765 621,971
Creditors Age Analysis
Total Creditors 55,358 888 – – – – 7,400 – 63,647
Description
Budget Year 2013/14
In-year report (February 2014) – Monthly Budget Statement
10
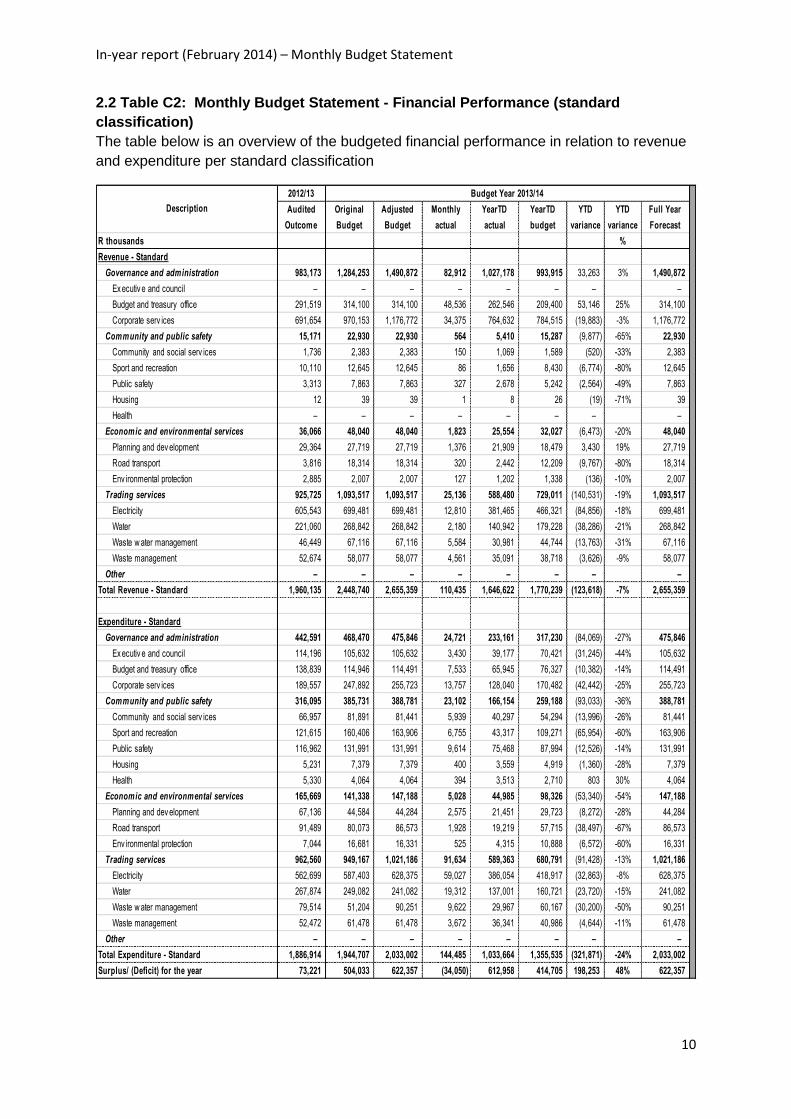
2.2 Table C2: Monthly Budget Statement - Financial Performance (standard
classification)
The table below is an overview of the budgeted financial performance in relation to revenue
and expenditure per standard classification
2012/13 Budget Year 2013/14
Audited
Outcome
Original
Budget
Adjusted
Budget
Monthly
actual
YearTD
actual
YearTD
budget
YTD
variance
YTD
variance
Full Year
Forecast
R thousands %
Revenue - Standard
Governance and administration 983,173 1,284,253 1,490,872 82,912 1,027,178 993,915 33,263 3% 1,490,872
Ex ecutiv e and council – – – – – – – –
Budget and treasury office 291,519 314,100 314,100 48,536 262,546 209,400 53,146 25% 314,100
Corporate serv ices 691,654 970,153 1,176,772 34,375 764,632 784,515 (19,883) -3% 1,176,772
Community and public safety 15,171 22,930 22,930 564 5,410 15,287 (9,877) -65% 22,930
Community and social serv ices 1,736 2,383 2,383 150 1,069 1,589 (520) -33% 2,383
Sport and recreation 10,110 12,645 12,645 86 1,656 8,430 (6,774) -80% 12,645
Public safety 3,313 7,863 7,863 327 2,678 5,242 (2,564) -49% 7,863
Housing 12 39 39 1 8 26 (19) -71% 39
Health – – – – – – – –
Economic and environmental services 36,066 48,040 48,040 1,823 25,554 32,027 (6,473) -20% 48,040
Planning and dev elopment 29,364 27,719 27,719 1,376 21,909 18,479 3,430 19% 27,719
Road transport 3,816 18,314 18,314 320 2,442 12,209 (9,767) -80% 18,314
Env ironmental protection 2,885 2,007 2,007 127 1,202 1,338 (136) -10% 2,007
Trading services 925,725 1,093,517 1,093,517 25,136 588,480 729,011 (140,531) -19% 1,093,517
Electricity 605,543 699,481 699,481 12,810 381,465 466,321 (84,856) -18% 699,481
Water 221,060 268,842 268,842 2,180 140,942 179,228 (38,286) -21% 268,842
Waste w ater management 46,449 67,116 67,116 5,584 30,981 44,744 (13,763) -31% 67,116
Waste management 52,674 58,077 58,077 4,561 35,091 38,718 (3,626) -9% 58,077
Other – – – – – – – –
Total Revenue - Standard 1,960,135 2,448,740 2,655,359 110,435 1,646,622 1,770,239 (123,618) -7% 2,655,359
Expenditure - Standard
Governance and administration 442,591 468,470 475,846 24,721 233,161 317,230 (84,069) -27% 475,846
Ex ecutiv e and council 114,196 105,632 105,632 3,430 39,177 70,421 (31,245) -44% 105,632
Budget and treasury office 138,839 114,946 114,491 7,533 65,945 76,327 (10,382) -14% 114,491
Corporate serv ices 189,557 247,892 255,723 13,757 128,040 170,482 (42,442) -25% 255,723
Community and public safety 316,095 385,731 388,781 23,102 166,154 259,188 (93,033) -36% 388,781
Community and social serv ices 66,957 81,891 81,441 5,939 40,297 54,294 (13,996) -26% 81,441
Sport and recreation 121,615 160,406 163,906 6,755 43,317 109,271 (65,954) -60% 163,906
Public safety 116,962 131,991 131,991 9,614 75,468 87,994 (12,526) -14% 131,991
Housing 5,231 7,379 7,379 400 3,559 4,919 (1,360) -28% 7,379
Health 5,330 4,064 4,064 394 3,513 2,710 803 30% 4,064
Economic and environmental services 165,669 141,338 147,188 5,028 44,985 98,326 (53,340) -54% 147,188
Planning and dev elopment 67,136 44,584 44,284 2,575 21,451 29,723 (8,272) -28% 44,284
Road transport 91,489 80,073 86,573 1,928 19,219 57,715 (38,497) -67% 86,573
Env ironmental protection 7,044 16,681 16,331 525 4,315 10,888 (6,572) -60% 16,331
Trading services 962,560 949,167 1,021,186 91,634 589,363 680,791 (91,428) -13% 1,021,186
Electricity 562,699 587,403 628,375 59,027 386,054 418,917 (32,863) -8% 628,375
Water 267,874 249,082 241,082 19,312 137,001 160,721 (23,720) -15% 241,082
Waste w ater management 79,514 51,204 90,251 9,622 29,967 60,167 (30,200) -50% 90,251
Waste management 52,472 61,478 61,478 3,672 36,341 40,986 (4,644) -11% 61,478
Other – – – – – – – –
Total Expenditure - Standard 1,886,914 1,944,707 2,033,002 144,485 1,033,664 1,355,535 (321,871) -24% 2,033,002
Surplus/ (Deficit) for the year 73,221 504,033 622,357 (34,050) 612,958 414,705 198,253 48% 622,357
Description
In-year report (February 2014) – Monthly Budget Statement
11
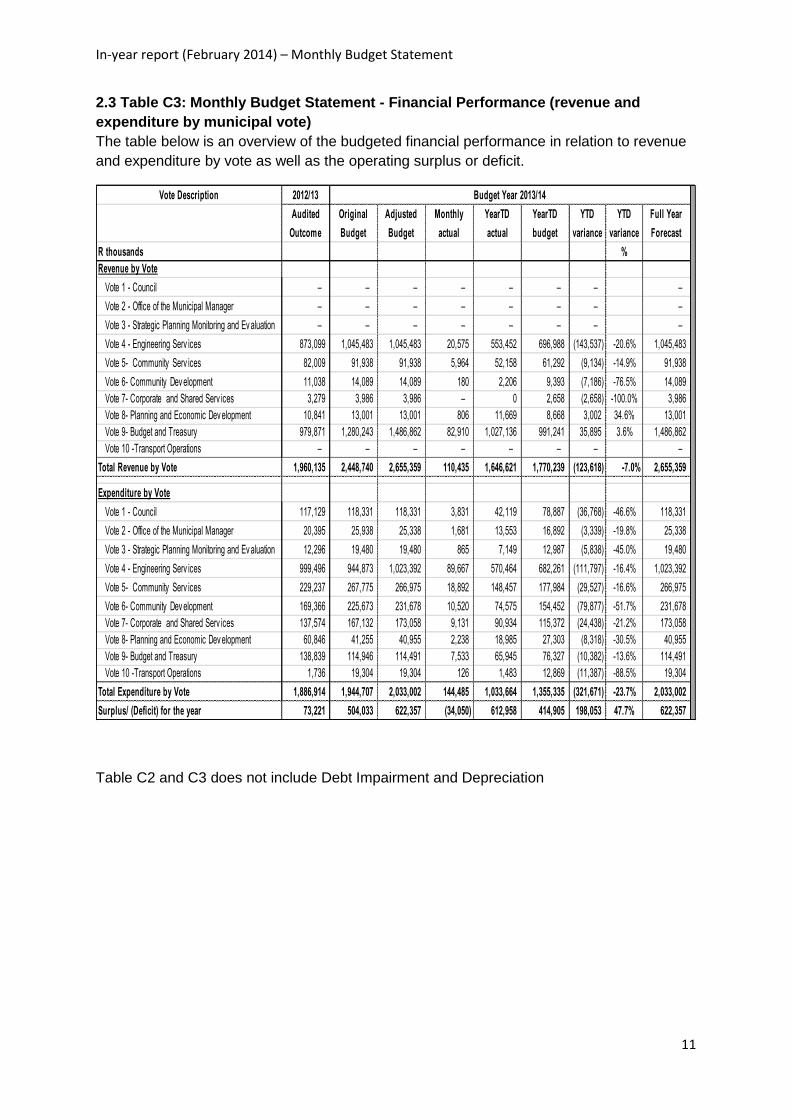
2.3 Table C3: Monthly Budget Statement - Financial Performance (revenue and
expenditure by municipal vote)
The table below is an overview of the budgeted financial performance in relation to revenue
and expenditure by vote as well as the operating surplus or deficit.
Table C2 and C3 does not include Debt Impairment and Depreciation
Vote Description 2012/13
Audited
Outcome
Original
Budget
Adjusted
Budget
Monthly
actual
YearTD
actual
YearTD
budget
YTD
variance
YTD
variance
Full Year
Forecast
R thousands %
Revenue by Vote
Vote 1 - Council – – – – – – – –
Vote 2 - Office of the Municipal Manager – – – – – – – –
Vote 3 - Strategic Planning Monitoring and Ev aluation – – – – – – – –
Vote 4 - Engineering Serv ices 873,099 1,045,483 1,045,483 20,575 553,452 696,988 (143,537) -20.6% 1,045,483
Vote 5- Community Serv ices 82,009 91,938 91,938 5,964 52,158 61,292 (9,134) -14.9% 91,938
Vote 6- Community Dev elopment 11,038 14,089 14,089 180 2,206 9,393 (7,186) -76.5% 14,089
Vote 7- Corporate and Shared Serv ices 3,279 3,986 3,986 – 0 2,658 (2,658) -100.0% 3,986
Vote 8- Planning and Economic Dev elopment 10,841 13,001 13,001 806 11,669 8,668 3,002 34.6% 13,001
Vote 9- Budget and Treasury 979,871 1,280,243 1,486,862 82,910 1,027,136 991,241 35,895 3.6% 1,486,862
Vote 10 -Transport Operations – – – – – – – –
Total Revenue by Vote 1,960,135 2,448,740 2,655,359 110,435 1,646,621 1,770,239 (123,618) -7.0% 2,655,359
Expenditure by Vote
Vote 1 - Council 117,129 118,331 118,331 3,831 42,119 78,887 (36,768) -46.6% 118,331
Vote 2 - Office of the Municipal Manager 20,395 25,938 25,338 1,681 13,553 16,892 (3,339) -19.8% 25,338
Vote 3 - Strategic Planning Monitoring and Ev aluation 12,296 19,480 19,480 865 7,149 12,987 (5,838) -45.0% 19,480
Vote 4 - Engineering Serv ices 999,496 944,873 1,023,392 89,667 570,464 682,261 (111,797) -16.4% 1,023,392
Vote 5- Community Serv ices 229,237 267,775 266,975 18,892 148,457 177,984 (29,527) -16.6% 266,975
Vote 6- Community Dev elopment 169,366 225,673 231,678 10,520 74,575 154,452 (79,877) -51.7% 231,678
Vote 7- Corporate and Shared Serv ices 137,574 167,132 173,058 9,131 90,934 115,372 (24,438) -21.2% 173,058
Vote 8- Planning and Economic Dev elopment 60,846 41,255 40,955 2,238 18,985 27,303 (8,318) -30.5% 40,955
Vote 9- Budget and Treasury 138,839 114,946 114,491 7,533 65,945 76,327 (10,382) -13.6% 114,491
Vote 10 -Transport Operations 1,736 19,304 19,304 126 1,483 12,869 (11,387) -88.5% 19,304
Total Expenditure by Vote 1,886,914 1,944,707 2,033,002 144,485 1,033,664 1,355,335 (321,671) -23.7% 2,033,002
Surplus/ (Deficit) for the year 73,221 504,033 622,357 (34,050) 612,958 414,905 198,053 47.7% 622,357
Budget Year 2013/14
In-year report (February 2014) – Monthly Budget Statement
12
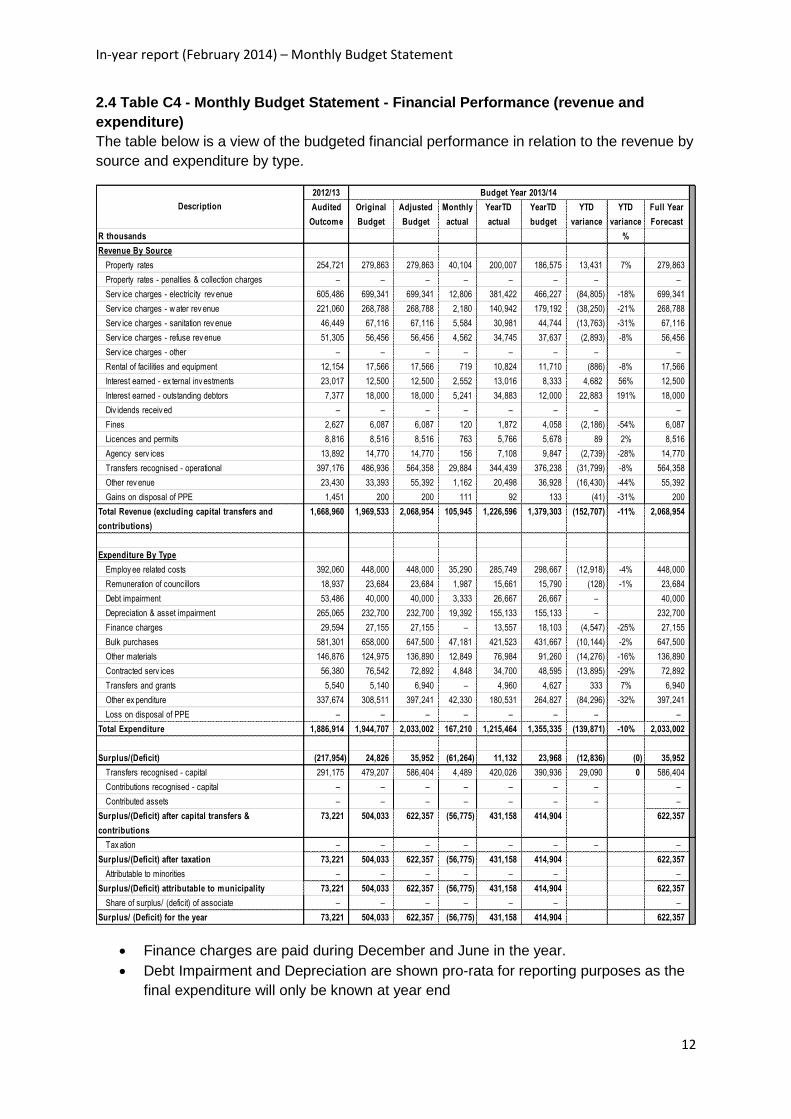
2.4 Table C4 - Monthly Budget Statement - Financial Performance (revenue and
expenditure)
The table below is a view of the budgeted financial performance in relation to the revenue by
source and expenditure by type.
Finance charges are paid during December and June in the year.
Debt Impairment and Depreciation are shown pro-rata for reporting purposes as the
final expenditure will only be known at year end
2012/13
Audited
Outcome
Original
Budget
Adjusted
Budget
Monthly
actual
YearTD
actual
YearTD
budget
YTD
variance
YTD
variance
Full Year
Forecast
R thousands %
Revenue By Source
Property rates 254,721 279,863 279,863 40,104 200,007 186,575 13,431 7% 279,863
Property rates - penalties & collection charges – – – – – – – –
Serv ice charges - electricity rev enue 605,486 699,341 699,341 12,806 381,422 466,227 (84,805) -18% 699,341
Serv ice charges - w ater rev enue 221,060 268,788 268,788 2,180 140,942 179,192 (38,250) -21% 268,788
Serv ice charges - sanitation rev enue 46,449 67,116 67,116 5,584 30,981 44,744 (13,763) -31% 67,116
Serv ice charges - refuse rev enue 51,305 56,456 56,456 4,562 34,745 37,637 (2,893) -8% 56,456
Serv ice charges - other – – – – – – – –
Rental of facilities and equipment 12,154 17,566 17,566 719 10,824 11,710 (886) -8% 17,566
Interest earned - ex ternal inv estments 23,017 12,500 12,500 2,552 13,016 8,333 4,682 56% 12,500
Interest earned - outstanding debtors 7,377 18,000 18,000 5,241 34,883 12,000 22,883 191% 18,000
Div idends receiv ed – – – – – – – –
Fines 2,627 6,087 6,087 120 1,872 4,058 (2,186) -54% 6,087
Licences and permits 8,816 8,516 8,516 763 5,766 5,678 89 2% 8,516
Agency serv ices 13,892 14,770 14,770 156 7,108 9,847 (2,739) -28% 14,770
Transfers recognised - operational 397,176 486,936 564,358 29,884 344,439 376,238 (31,799) -8% 564,358
Other rev enue 23,430 33,393 55,392 1,162 20,498 36,928 (16,430) -44% 55,392
Gains on disposal of PPE 1,451 200 200 111 92 133 (41) -31% 200
Total Revenue (excluding capital transfers and
contributions)
1,668,960 1,969,533 2,068,954 105,945 1,226,596 1,379,303 (152,707) -11% 2,068,954
Expenditure By Type
Employ ee related costs 392,060 448,000 448,000 35,290 285,749 298,667 (12,918) -4% 448,000
Remuneration of councillors 18,937 23,684 23,684 1,987 15,661 15,790 (128) -1% 23,684
Debt impairment 53,486 40,000 40,000 3,333 26,667 26,667 – 40,000
Depreciation & asset impairment 265,065 232,700 232,700 19,392 155,133 155,133 – 232,700
Finance charges 29,594 27,155 27,155 – 13,557 18,103 (4,547) -25% 27,155
Bulk purchases 581,301 658,000 647,500 47,181 421,523 431,667 (10,144) -2% 647,500
Other materials 146,876 124,975 136,890 12,849 76,984 91,260 (14,276) -16% 136,890
Contracted serv ices 56,380 76,542 72,892 4,848 34,700 48,595 (13,895) -29% 72,892
Transfers and grants 5,540 5,140 6,940 – 4,960 4,627 333 7% 6,940
Other ex penditure 337,674 308,511 397,241 42,330 180,531 264,827 (84,296) -32% 397,241
Loss on disposal of PPE – – – – – – – –
Total Expenditure 1,886,914 1,944,707 2,033,002 167,210 1,215,464 1,355,335 (139,871) -10% 2,033,002
Surplus/(Deficit) (217,954) 24,826 35,952 (61,264) 11,132 23,968 (12,836) (0) 35,952
Transfers recognised - capital 291,175 479,207 586,404 4,489 420,026 390,936 29,090 0 586,404
Contributions recognised - capital – – – – – – – –
Contributed assets – – – – – – – –
Surplus/(Deficit) after capital transfers &
contributions
73,221 504,033 622,357 (56,775) 431,158 414,904 622,357
Tax ation – – – – – – – –
Surplus/(Deficit) after taxation 73,221 504,033 622,357 (56,775) 431,158 414,904 622,357
Attributable to minorities – – – – – – –
Surplus/(Deficit) attributable to municipality 73,221 504,033 622,357 (56,775) 431,158 414,904 622,357
Share of surplus/ (deficit) of associate – – – – – – –
Surplus/ (Deficit) for the year 73,221 504,033 622,357 (56,775) 431,158 414,904 622,357
Description
Budget Year 2013/14
In-year report (February 2014) – Monthly Budget Statement
13
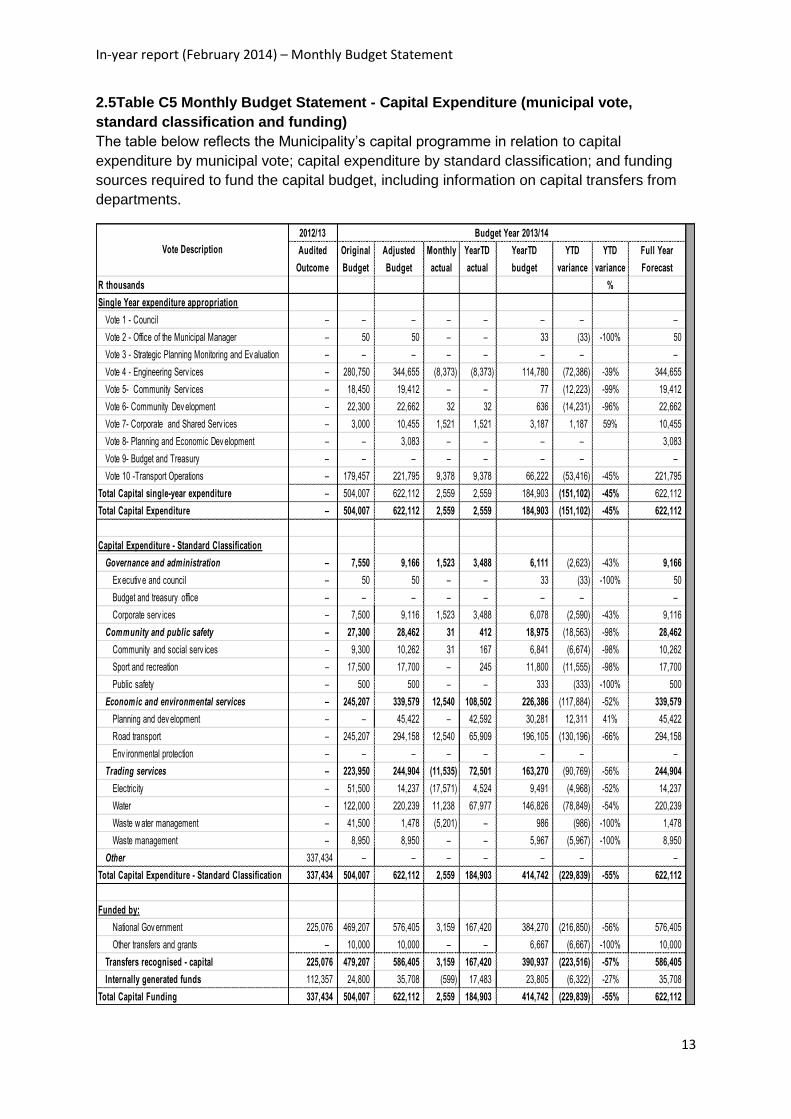
2.5Table C5 Monthly Budget Statement - Capital Expenditure (municipal vote,
standard classification and funding)
The table below reflects the Municipality’s capital programme in relation to capital
expenditure by municipal vote; capital expenditure by standard classification; and funding
sources required to fund the capital budget, including information on capital transfers from
departments.
2012/13 Budget Year 2013/14
Audited
Outcome
Original
Budget
Adjusted
Budget
Monthly
actual
YearTD
actual
YearTD
budget
YTD
variance
YTD
variance
Full Year
Forecast
R thousands %
Single Year expenditure appropriation
Vote 1 - Council – – – – – – – –
Vote 2 - Office of the Municipal Manager – 50 50 – – 33 (33) -100% 50
Vote 3 - Strategic Planning Monitoring and Ev aluation – – – – – – – –
Vote 4 - Engineering Serv ices – 280,750 344,655 (8,373) (8,373) 114,780 (72,386) -39% 344,655
Vote 5- Community Serv ices – 18,450 19,412 – – 77 (12,223) -99% 19,412
Vote 6- Community Dev elopment – 22,300 22,662 32 32 636 (14,231) -96% 22,662
Vote 7- Corporate and Shared Serv ices – 3,000 10,455 1,521 1,521 3,187 1,187 59% 10,455
Vote 8- Planning and Economic Dev elopment – – 3,083 – – – – 3,083
Vote 9- Budget and Treasury – – – – – – – –
Vote 10 -Transport Operations – 179,457 221,795 9,378 9,378 66,222 (53,416) -45% 221,795
Total Capital single-year expenditure – 504,007 622,112 2,559 2,559 184,903 (151,102) -45% 622,112
Total Capital Expenditure – 504,007 622,112 2,559 2,559 184,903 (151,102) -45% 622,112
Capital Expenditure - Standard Classification
Governance and administration – 7,550 9,166 1,523 3,488 6,111 (2,623) -43% 9,166
Ex ecutiv e and council – 50 50 – – 33 (33) -100% 50
Budget and treasury office – – – – – – – –
Corporate serv ices – 7,500 9,116 1,523 3,488 6,078 (2,590) -43% 9,116
Community and public safety – 27,300 28,462 31 412 18,975 (18,563) -98% 28,462
Community and social serv ices – 9,300 10,262 31 167 6,841 (6,674) -98% 10,262
Sport and recreation – 17,500 17,700 – 245 11,800 (11,555) -98% 17,700
Public safety – 500 500 – – 333 (333) -100% 500
Economic and environmental services – 245,207 339,579 12,540 108,502 226,386 (117,884) -52% 339,579
Planning and dev elopment – – 45,422 – 42,592 30,281 12,311 41% 45,422
Road transport – 245,207 294,158 12,540 65,909 196,105 (130,196) -66% 294,158
Env ironmental protection – – – – – – – –
Trading services – 223,950 244,904 (11,535) 72,501 163,270 (90,769) -56% 244,904
Electricity – 51,500 14,237 (17,571) 4,524 9,491 (4,968) -52% 14,237
Water – 122,000 220,239 11,238 67,977 146,826 (78,849) -54% 220,239
Waste w ater management – 41,500 1,478 (5,201) – 986 (986) -100% 1,478
Waste management – 8,950 8,950 – – 5,967 (5,967) -100% 8,950
Other 337,434 – – – – – – –
Total Capital Expenditure - Standard Classification 337,434 504,007 622,112 2,559 184,903 414,742 (229,839) -55% 622,112
Funded by:
National Gov ernment 225,076 469,207 576,405 3,159 167,420 384,270 (216,850) -56% 576,405
Other transfers and grants – 10,000 10,000 – – 6,667 (6,667) -100% 10,000
Transfers recognised - capital 225,076 479,207 586,405 3,159 167,420 390,937 (223,516) -57% 586,405
Internally generated funds 112,357 24,800 35,708 (599) 17,483 23,805 (6,322) -27% 35,708
Total Capital Funding 337,434 504,007 622,112 2,559 184,903 414,742 (229,839) -55% 622,112
Vote Description
In-year report (February 2014) – Monthly Budget Statement
14
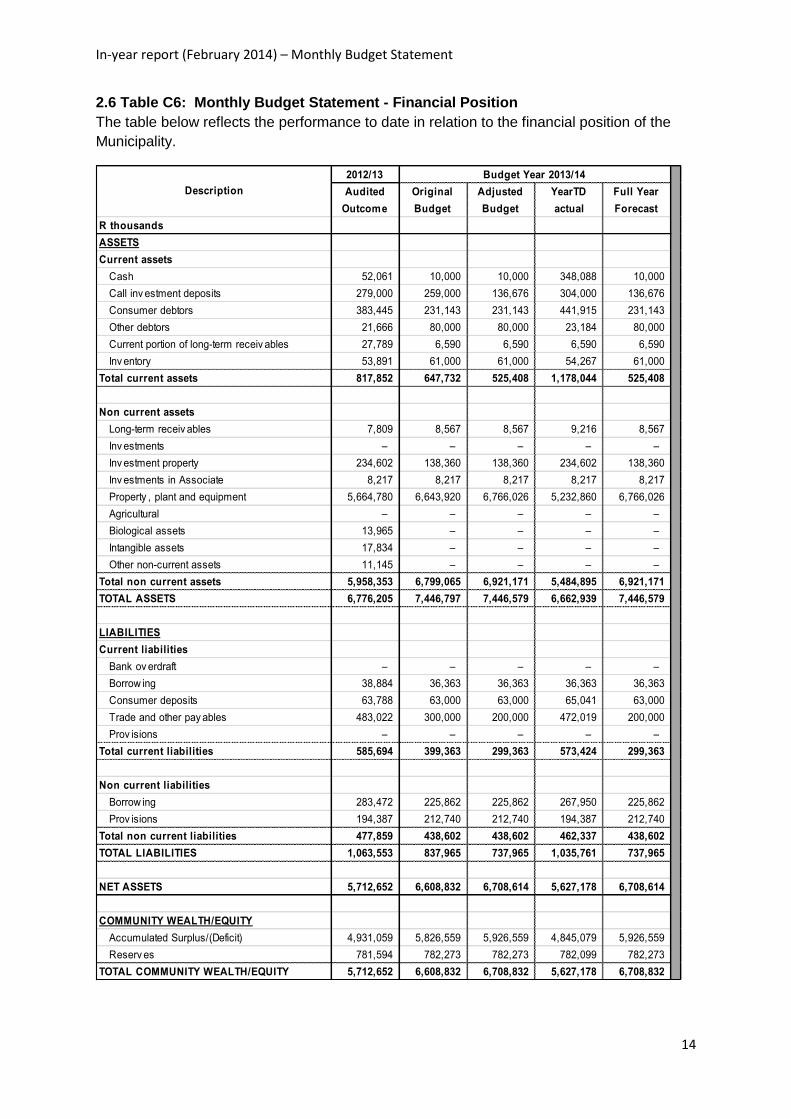
2.6 Table C6: Monthly Budget Statement - Financial Position
The table below reflects the performance to date in relation to the financial position of the
Municipality.
2012/13 Budget Year 2013/14
Audited
Outcome
Original
Budget
Adjusted
Budget
YearTD
actual
Full Year
Forecast
R thousands
ASSETS
Current assets
Cash 52,061 10,000 10,000 348,088 10,000
Call inv estment deposits 279,000 259,000 136,676 304,000 136,676
Consumer debtors 383,445 231,143 231,143 441,915 231,143
Other debtors 21,666 80,000 80,000 23,184 80,000
Current portion of long-term receiv ables 27,789 6,590 6,590 6,590 6,590
Inv entory 53,891 61,000 61,000 54,267 61,000
Total current assets 817,852 647,732 525,408 1,178,044 525,408
Non current assets
Long-term receiv ables 7,809 8,567 8,567 9,216 8,567
Inv estments – – – – –
Inv estment property 234,602 138,360 138,360 234,602 138,360
Inv estments in Associate 8,217 8,217 8,217 8,217 8,217
Property , plant and equipment 5,664,780 6,643,920 6,766,026 5,232,860 6,766,026
Agricultural – – – – –
Biological assets 13,965 – – – –
Intangible assets 17,834 – – – –
Other non-current assets 11,145 – – – –
Total non current assets 5,958,353 6,799,065 6,921,171 5,484,895 6,921,171
TOTAL ASSETS 6,776,205 7,446,797 7,446,579 6,662,939 7,446,579
LIABILITIES
Current liabilities
Bank ov erdraft – – – – –
Borrow ing 38,884 36,363 36,363 36,363 36,363
Consumer deposits 63,788 63,000 63,000 65,041 63,000
Trade and other pay ables 483,022 300,000 200,000 472,019 200,000
Prov isions – – – – –
Total current liabilities 585,694 399,363 299,363 573,424 299,363
Non current liabilities
Borrow ing 283,472 225,862 225,862 267,950 225,862
Prov isions 194,387 212,740 212,740 194,387 212,740
Total non current liabilities 477,859 438,602 438,602 462,337 438,602
TOTAL LIABILITIES 1,063,553 837,965 737,965 1,035,761 737,965
NET ASSETS 5,712,652 6,608,832 6,708,614 5,627,178 6,708,614
COMMUNITY WEALTH/EQUITY
Accumulated Surplus/(Deficit) 4,931,059 5,826,559 5,926,559 4,845,079 5,926,559
Reserv es 781,594 782,273 782,273 782,099 782,273
TOTAL COMMUNITY WEALTH/EQUITY 5,712,652 6,608,832 6,708,832 5,627,178 6,708,832
Description
In-year report (February 2014) – Monthly Budget Statement
15
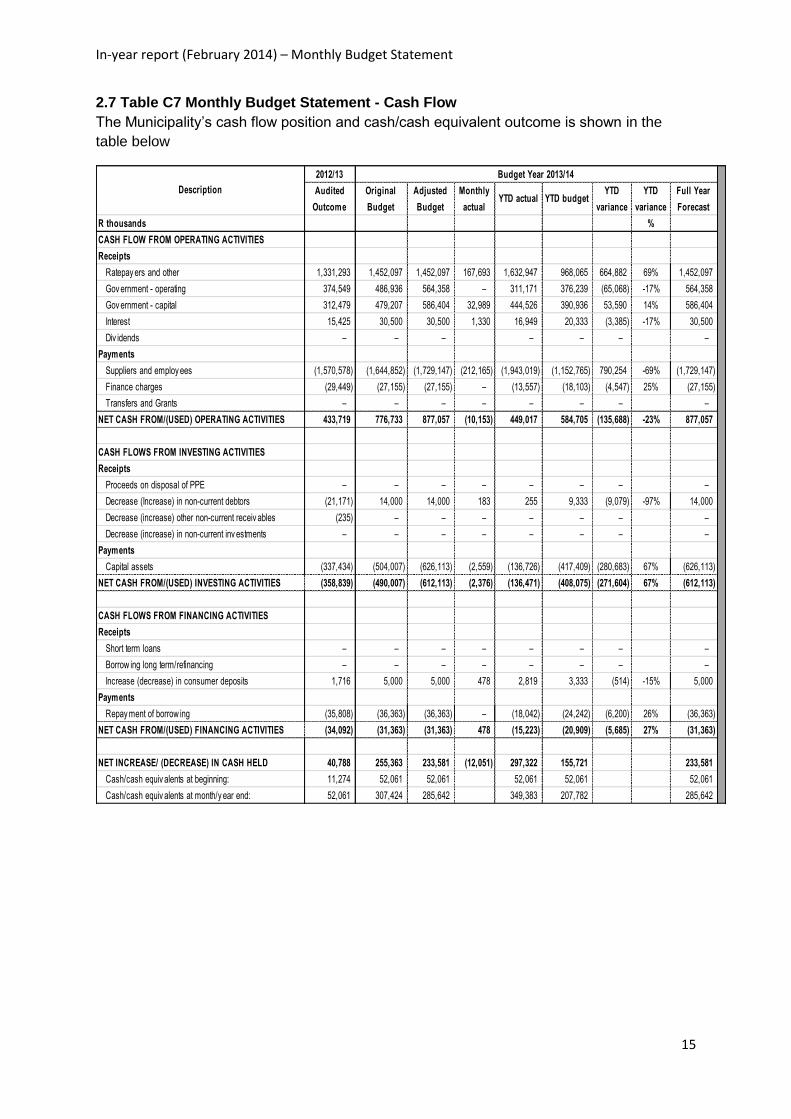
2.7 Table C7 Monthly Budget Statement - Cash Flow
The Municipality’s cash flow position and cash/cash equivalent outcome is shown in the
table below
2012/13 Budget Year 2013/14
Audited
Outcome
Original
Budget
Adjusted
Budget
Monthly
actualYTD actual YTD budget
YTD
variance
YTD
variance
Full Year
Forecast
R thousands %
CASH FLOW FROM OPERATING ACTIVITIES
Receipts
Ratepay ers and other 1,331,293 1,452,097 1,452,097 167,693 1,632,947 968,065 664,882 69% 1,452,097
Gov ernment - operating 374,549 486,936 564,358 – 311,171 376,239 (65,068) -17% 564,358
Gov ernment - capital 312,479 479,207 586,404 32,989 444,526 390,936 53,590 14% 586,404
Interest 15,425 30,500 30,500 1,330 16,949 20,333 (3,385) -17% 30,500
Div idends – – – – – – –
Payments
Suppliers and employ ees (1,570,578) (1,644,852) (1,729,147) (212,165) (1,943,019) (1,152,765) 790,254 -69% (1,729,147)
Finance charges (29,449) (27,155) (27,155) – (13,557) (18,103) (4,547) 25% (27,155)
Transfers and Grants – – – – – – – –
NET CASH FROM/(USED) OPERATING ACTIVITIES 433,719 776,733 877,057 (10,153) 449,017 584,705 (135,688) -23% 877,057
CASH FLOWS FROM INVESTING ACTIVITIES
Receipts
Proceeds on disposal of PPE – – – – – – – –
Decrease (Increase) in non-current debtors (21,171) 14,000 14,000 183 255 9,333 (9,079) -97% 14,000
Decrease (increase) other non-current receiv ables (235) – – – – – – –
Decrease (increase) in non-current inv estments – – – – – – – –
Payments
Capital assets (337,434) (504,007) (626,113) (2,559) (136,726) (417,409) (280,683) 67% (626,113)
NET CASH FROM/(USED) INVESTING ACTIVITIES (358,839) (490,007) (612,113) (2,376) (136,471) (408,075) (271,604) 67% (612,113)
CASH FLOWS FROM FINANCING ACTIVITIES
Receipts
Short term loans – – – – – – – –
Borrow ing long term/refinancing – – – – – – – –
Increase (decrease) in consumer deposits 1,716 5,000 5,000 478 2,819 3,333 (514) -15% 5,000
Payments
Repay ment of borrow ing (35,808) (36,363) (36,363) – (18,042) (24,242) (6,200) 26% (36,363)
NET CASH FROM/(USED) FINANCING ACTIVITIES (34,092) (31,363) (31,363) 478 (15,223) (20,909) (5,685) 27% (31,363)
NET INCREASE/ (DECREASE) IN CASH HELD 40,788 255,363 233,581 (12,051) 297,322 155,721 233,581
Cash/cash equiv alents at beginning: 11,274 52,061 52,061 52,061 52,061 52,061
Cash/cash equiv alents at month/y ear end: 52,061 307,424 285,642 349,383 207,782 285,642
Description
In-year report (February 2014) – Monthly Budget Statement
16
PART 2- SUPPORTING DOCUMENTATION
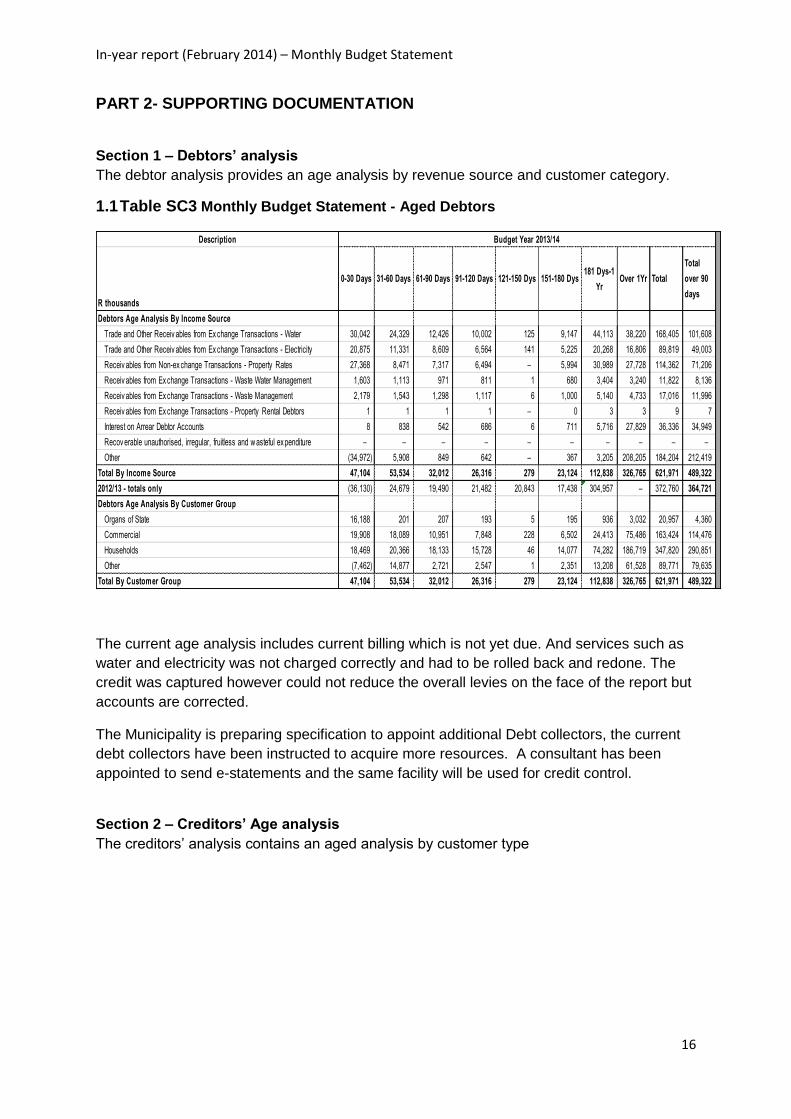
Section 1 – Debtors’ analysis
The debtor analysis provides an age analysis by revenue source and customer category.
1.1 Table SC3 Monthly Budget Statement - Aged Debtors
The current age analysis includes current billing which is not yet due. And services such as
water and electricity was not charged correctly and had to be rolled back and redone. The
credit was captured however could not reduce the overall levies on the face of the report but
accounts are corrected.
The Municipality is preparing specification to appoint additional Debt collectors, the current
debt collectors have been instructed to acquire more resources. A consultant has been
appointed to send e-statements and the same facility will be used for credit control.
Section 2 – Creditors’ Age analysis
The creditors’ analysis contains an aged analysis by customer type
Description
R thousands
0-30 Days 31-60 Days 61-90 Days 91-120 Days 121-150 Dys 151-180 Dys181 Dys-1
YrOver 1Yr Total
Total
over 90
days
Debtors Age Analysis By Income Source
Trade and Other Receiv ables from Ex change Transactions - Water 30,042 24,329 12,426 10,002 125 9,147 44,113 38,220 168,405 101,608
Trade and Other Receiv ables from Ex change Transactions - Electricity 20,875 11,331 8,609 6,564 141 5,225 20,268 16,806 89,819 49,003
Receiv ables from Non-ex change Transactions - Property Rates 27,368 8,471 7,317 6,494 – 5,994 30,989 27,728 114,362 71,206
Receiv ables from Ex change Transactions - Waste Water Management 1,603 1,113 971 811 1 680 3,404 3,240 11,822 8,136
Receiv ables from Ex change Transactions - Waste Management 2,179 1,543 1,298 1,117 6 1,000 5,140 4,733 17,016 11,996
Receiv ables from Ex change Transactions - Property Rental Debtors 1 1 1 1 – 0 3 3 9 7
Interest on Arrear Debtor Accounts 8 838 542 686 6 711 5,716 27,829 36,336 34,949
Recov erable unauthorised, irregular, fruitless and w asteful ex penditure – – – – – – – – – –
Other (34,972) 5,908 849 642 – 367 3,205 208,205 184,204 212,419
Total By Income Source 47,104 53,534 32,012 26,316 279 23,124 112,838 326,765 621,971 489,322
2012/13 - totals only (36,130) 24,679 19,490 21,482 20,843 17,438 304,957 – 372,760 364,721
Debtors Age Analysis By Customer Group
Organs of State 16,188 201 207 193 5 195 936 3,032 20,957 4,360
Commercial 19,908 18,089 10,951 7,848 228 6,502 24,413 75,486 163,424 114,476
Households 18,469 20,366 18,133 15,728 46 14,077 74,282 186,719 347,820 290,851
Other (7,462) 14,877 2,721 2,547 1 2,351 13,208 61,528 89,771 79,635
Total By Customer Group 47,104 53,534 32,012 26,316 279 23,124 112,838 326,765 621,971 489,322
Budget Year 2013/14
In-year report (February 2014) – Monthly Budget Statement
17
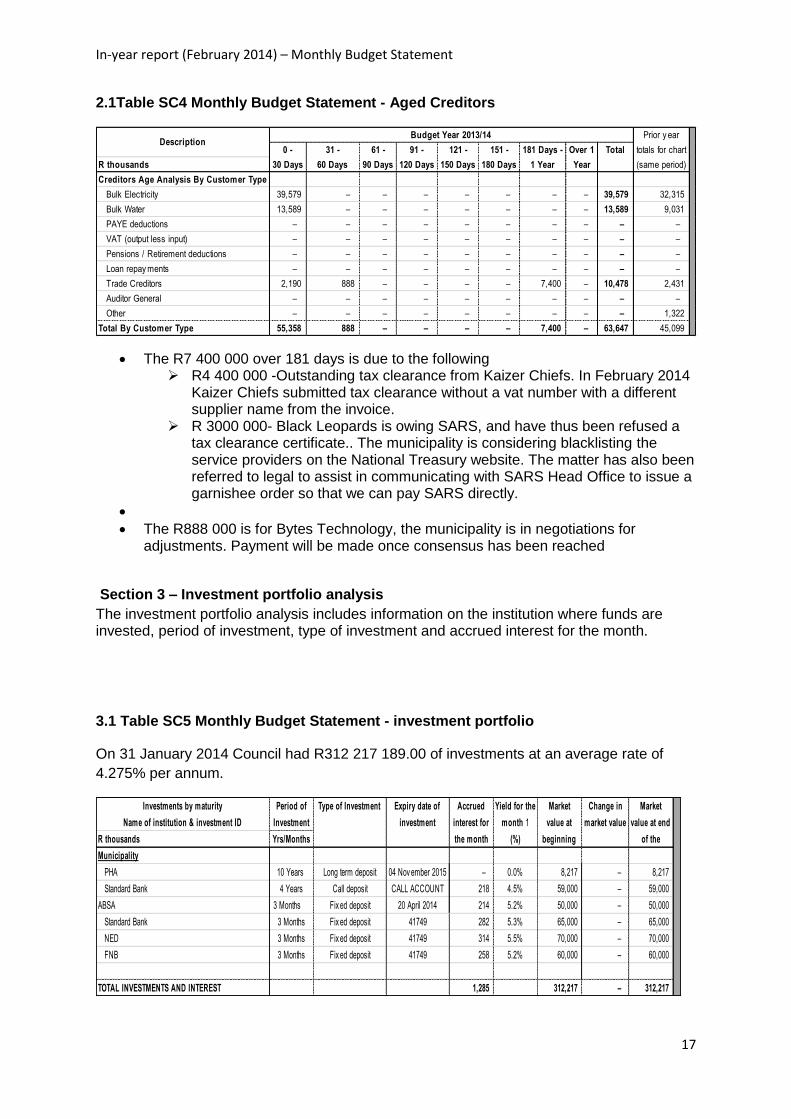
2.1Table SC4 Monthly Budget Statement - Aged Creditors
The R7 400 000 over 181 days is due to the following R4 400 000 -Outstanding tax clearance from Kaizer Chiefs. In February 2014
Kaizer Chiefs submitted tax clearance without a vat number with a different supplier name from the invoice.
R 3000 000- Black Leopards is owing SARS, and have thus been refused a tax clearance certificate.. The municipality is considering blacklisting the service providers on the National Treasury website. The matter has also been referred to legal to assist in communicating with SARS Head Office to issue a garnishee order so that we can pay SARS directly.
The R888 000 is for Bytes Technology, the municipality is in negotiations for adjustments. Payment will be made once consensus has been reached
Section 3 – Investment portfolio analysis
The investment portfolio analysis includes information on the institution where funds are invested, period of investment, type of investment and accrued interest for the month.
3.1 Table SC5 Monthly Budget Statement - investment portfolio
On 31 January 2014 Council had R312 217 189.00 of investments at an average rate of
4.275% per annum.
Budget Year 2013/14
R thousands
Creditors Age Analysis By Customer Type
Bulk Electricity 39,579 – – – – – – – 39,579 32,315
Bulk Water 13,589 – – – – – – – 13,589 9,031
PAYE deductions – – – – – – – – – –
VAT (output less input) – – – – – – – – – –
Pensions / Retirement deductions – – – – – – – – – –
Loan repay ments – – – – – – – – – –
Trade Creditors 2,190 888 – – – – 7,400 – 10,478 2,431
Auditor General – – – – – – – – – –
Other – – – – – – – – – 1,322
Total By Customer Type 55,358 888 – – – – 7,400 – 63,647 45,099
181 Days -
1 Year
Over 1
Year
TotalDescription
Prior y ear
totals for chart
(same period)
0 -
30 Days
31 -
60 Days
61 -
90 Days
91 -
120 Days
121 -
150 Days
151 -
180 Days
Investments by maturity
Name of institution & investment ID
Period of
Investment
R thousands Yrs/Months
Municipality
PHA 10 Years Long term deposit 04 Nov ember 2015 – 0.0% 8,217 – 8,217
Standard Bank 4 Years Call deposit CALL ACCOUNT 218 4.5% 59,000 – 59,000
ABSA 3 Months Fix ed deposit 20 April 2014 214 5.2% 50,000 – 50,000
Standard Bank 3 Months Fix ed deposit 41749 282 5.3% 65,000 – 65,000
NED 3 Months Fix ed deposit 41749 314 5.5% 70,000 – 70,000
FNB 3 Months Fix ed deposit 41749 258 5.2% 60,000 – 60,000
TOTAL INVESTMENTS AND INTEREST 1,285 312,217 – 312,217
Type of Investment Expiry date of
investment
Accrued
interest for
the month
Yield for the
month 1
(%)
Market
value at
beginning
Change in
market value
Market
value at end
of the
In-year report (February 2014) – Monthly Budget Statement
18
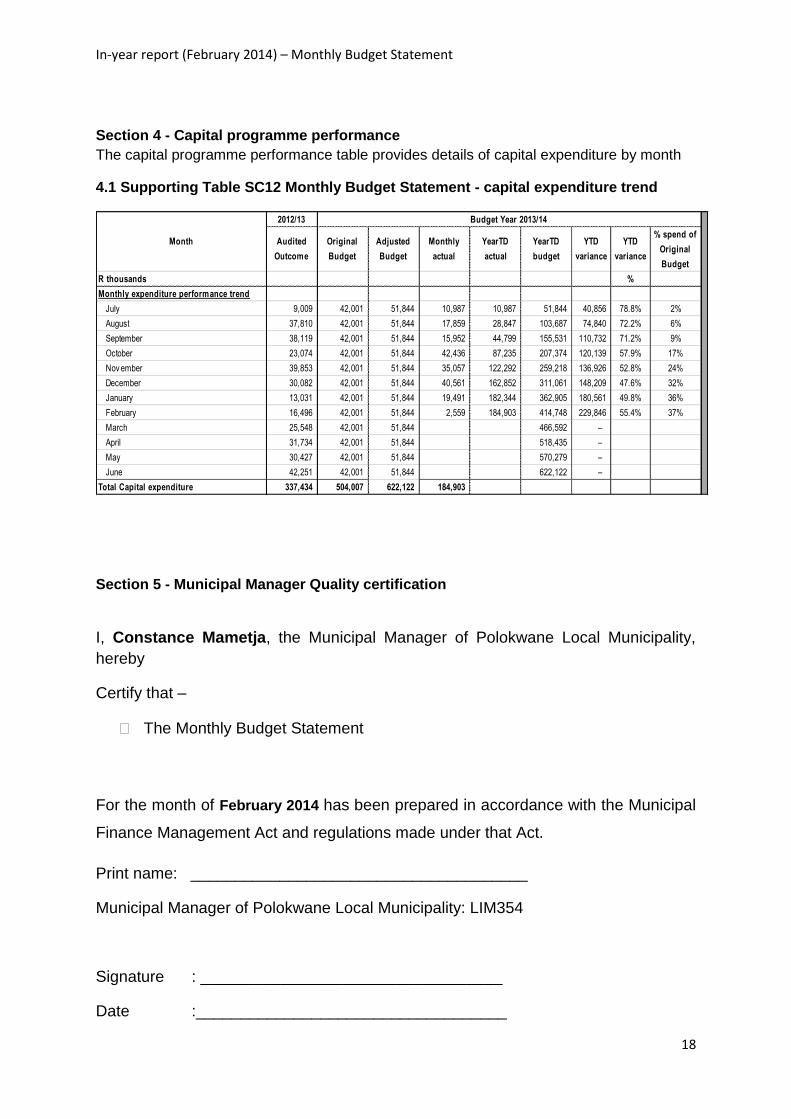
Section 4 - Capital programme performance
The capital programme performance table provides details of capital expenditure by month
4.1 Supporting Table SC12 Monthly Budget Statement - capital expenditure trend
Section 5 - Municipal Manager Quality certification
I, Constance Mametja, the Municipal Manager of Polokwane Local Municipality,
hereby
Certify that –
The Monthly Budget Statement
For the month of February 2014 has been prepared in accordance with the Municipal
Finance Management Act and regulations made under that Act.
Print name: ______________________________________
Municipal Manager of Polokwane Local Municipality: LIM354
Signature : __________________________________
Date :___________________________________
2012/13
Audited
Outcome
Original
Budget
Adjusted
Budget
Monthly
actual
YearTD
actual
YearTD
budget
YTD
variance
YTD
variance
% spend of
Original
Budget
R thousands %
Monthly expenditure performance trend
July 9,009 42,001 51,844 10,987 10,987 51,844 40,856 78.8% 2%
August 37,810 42,001 51,844 17,859 28,847 103,687 74,840 72.2% 6%
September 38,119 42,001 51,844 15,952 44,799 155,531 110,732 71.2% 9%
October 23,074 42,001 51,844 42,436 87,235 207,374 120,139 57.9% 17%
Nov ember 39,853 42,001 51,844 35,057 122,292 259,218 136,926 52.8% 24%
December 30,082 42,001 51,844 40,561 162,852 311,061 148,209 47.6% 32%
January 13,031 42,001 51,844 19,491 182,344 362,905 180,561 49.8% 36%
February 16,496 42,001 51,844 2,559 184,903 414,748 229,846 55.4% 37%
March 25,548 42,001 51,844 466,592 –
April 31,734 42,001 51,844 518,435 –
May 30,427 42,001 51,844 570,279 –
June 42,251 42,001 51,844 622,122 –
Total Capital expenditure 337,434 504,007 622,122 184,903
Month
Budget Year 2013/14
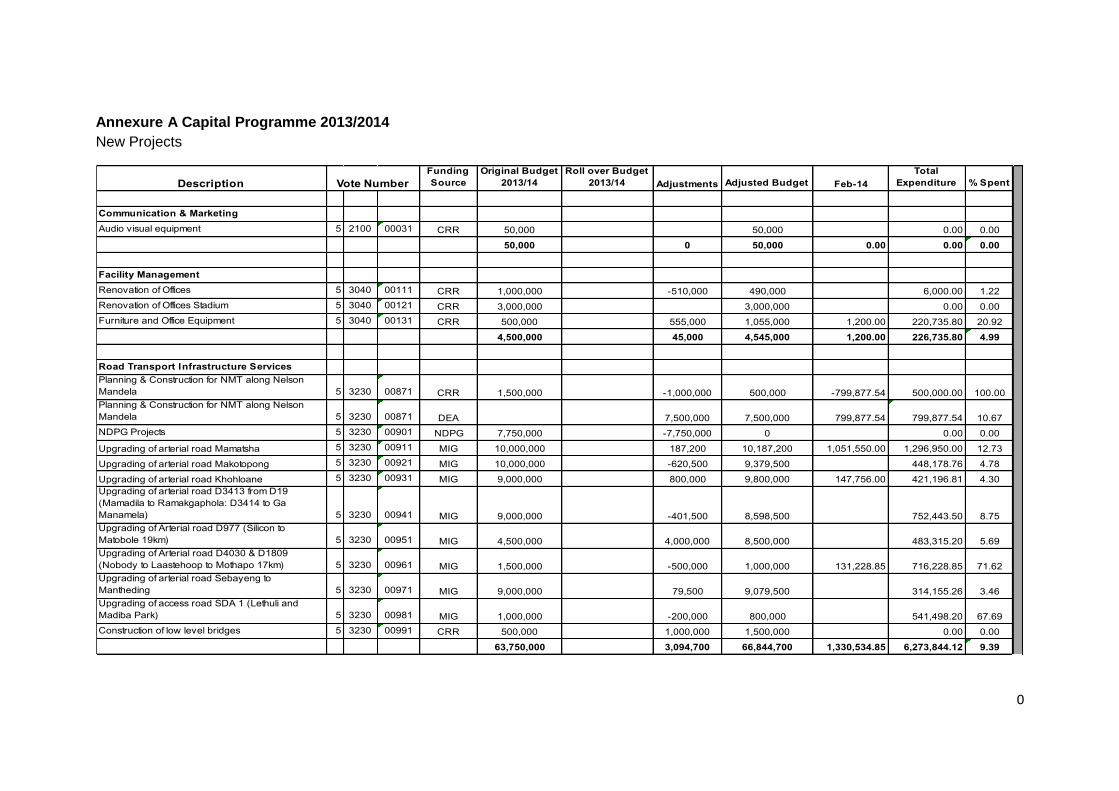
0
Annexure A Capital Programme 2013/2014
New Projects
Description
Funding
Source
Original Budget
2013/14
Roll over Budget
2013/14 Adjustments Adjusted Budget Feb-14
Total
Expenditure % Spent
Communication & Marketing
Audio visual equipment 5 2100 00031 CRR 50,000 50,000 0.00 0.00
50,000 0 50,000 0.00 0.00 0.00
Facility Management
Renovation of Offices 5 3040 00111 CRR 1,000,000 -510,000 490,000 6,000.00 1.22
Renovation of Offices Stadium 5 3040 00121 CRR 3,000,000 3,000,000 0.00 0.00
Furniture and Office Equipment 5 3040 00131 CRR 500,000 555,000 1,055,000 1,200.00 220,735.80 20.92
4,500,000 45,000 4,545,000 1,200.00 226,735.80 4.99
Road Transport Infrastructure Services
Planning & Construction for NMT along Nelson
Mandela 5 3230 00871 CRR 1,500,000 -1,000,000 500,000 -799,877.54 500,000.00 100.00
Planning & Construction for NMT along Nelson
Mandela 5 3230 00871 DEA 7,500,000 7,500,000 799,877.54 799,877.54 10.67
NDPG Projects 5 3230 00901 NDPG 7,750,000 -7,750,000 0 0.00 0.00
Upgrading of arterial road Mamatsha 5 3230 00911 MIG 10,000,000 187,200 10,187,200 1,051,550.00 1,296,950.00 12.73
Upgrading of arterial road Makotopong 5 3230 00921 MIG 10,000,000 -620,500 9,379,500 448,178.76 4.78
Upgrading of arterial road Khohloane 5 3230 00931 MIG 9,000,000 800,000 9,800,000 147,756.00 421,196.81 4.30
Upgrading of arterial road D3413 from D19
(Mamadila to Ramakgaphola: D3414 to Ga
Manamela) 5 3230 00941 MIG 9,000,000 -401,500 8,598,500 752,443.50 8.75
Upgrading of Arterial road D977 (Silicon to
Matobole 19km) 5 3230 00951 MIG 4,500,000 4,000,000 8,500,000 483,315.20 5.69
Upgrading of Arterial road D4030 & D1809
(Nobody to Laastehoop to Mothapo 17km) 5 3230 00961 MIG 1,500,000 -500,000 1,000,000 131,228.85 716,228.85 71.62
Upgrading of arterial road Sebayeng to
Mantheding 5 3230 00971 MIG 9,000,000 79,500 9,079,500 314,155.26 3.46
Upgrading of access road SDA 1 (Lethuli and
Madiba Park) 5 3230 00981 MIG 1,000,000 -200,000 800,000 541,498.20 67.69
Construction of low level bridges 5 3230 00991 CRR 500,000 1,000,000 1,500,000 0.00 0.00
63,750,000 3,094,700 66,844,700 1,330,534.85 6,273,844.12 9.39
Vote Number
In-year report (February 2014) – Monthly Budget Statement
1
Description
Funding
Source
Original Budget
2013/14
Roll over Budget
2013/14 Adjustments Adjusted Budget Feb-14
Total
Expenditure % Spent
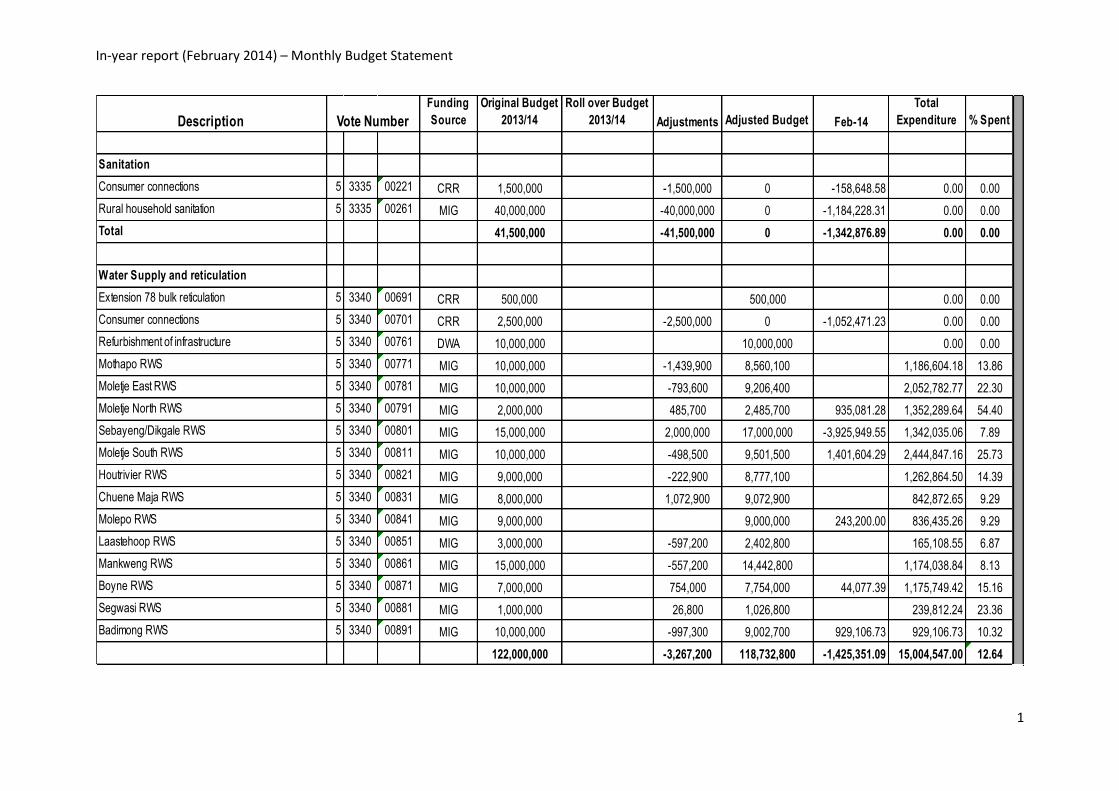
Sanitation
Consumer connections 5 3335 00221 CRR 1,500,000 -1,500,000 0 -158,648.58 0.00 0.00
Rural household sanitation 5 3335 00261 MIG 40,000,000 -40,000,000 0 -1,184,228.31 0.00 0.00
Total 41,500,000 -41,500,000 0 -1,342,876.89 0.00 0.00
Water Supply and reticulation
Extension 78 bulk reticulation 5 3340 00691 CRR 500,000 500,000 0.00 0.00
Consumer connections 5 3340 00701 CRR 2,500,000 -2,500,000 0 -1,052,471.23 0.00 0.00
Refurbishment of infrastructure 5 3340 00761 DWA 10,000,000 10,000,000 0.00 0.00
Mothapo RWS 5 3340 00771 MIG 10,000,000 -1,439,900 8,560,100 1,186,604.18 13.86
Moletje East RWS 5 3340 00781 MIG 10,000,000 -793,600 9,206,400 2,052,782.77 22.30
Moletje North RWS 5 3340 00791 MIG 2,000,000 485,700 2,485,700 935,081.28 1,352,289.64 54.40
Sebayeng/Dikgale RWS 5 3340 00801 MIG 15,000,000 2,000,000 17,000,000 -3,925,949.55 1,342,035.06 7.89
Moletje South RWS 5 3340 00811 MIG 10,000,000 -498,500 9,501,500 1,401,604.29 2,444,847.16 25.73
Houtrivier RWS 5 3340 00821 MIG 9,000,000 -222,900 8,777,100 1,262,864.50 14.39
Chuene Maja RWS 5 3340 00831 MIG 8,000,000 1,072,900 9,072,900 842,872.65 9.29
Molepo RWS 5 3340 00841 MIG 9,000,000 9,000,000 243,200.00 836,435.26 9.29
Laastehoop RWS 5 3340 00851 MIG 3,000,000 -597,200 2,402,800 165,108.55 6.87
Mankweng RWS 5 3340 00861 MIG 15,000,000 -557,200 14,442,800 1,174,038.84 8.13
Boyne RWS 5 3340 00871 MIG 7,000,000 754,000 7,754,000 44,077.39 1,175,749.42 15.16
Segwasi RWS 5 3340 00881 MIG 1,000,000 26,800 1,026,800 239,812.24 23.36
Badimong RWS 5 3340 00891 MIG 10,000,000 -997,300 9,002,700 929,106.73 929,106.73 10.32
122,000,000 -3,267,200 118,732,800 -1,425,351.09 15,004,547.00 12.64
Vote Number
In-year report (February 2014) – Monthly Budget Statement
2
Description
Funding
Source
Original Budget
2013/14
Roll over Budget
2013/14 Adjustments Adjusted Budget Feb-14
Total
Expenditure % Spent
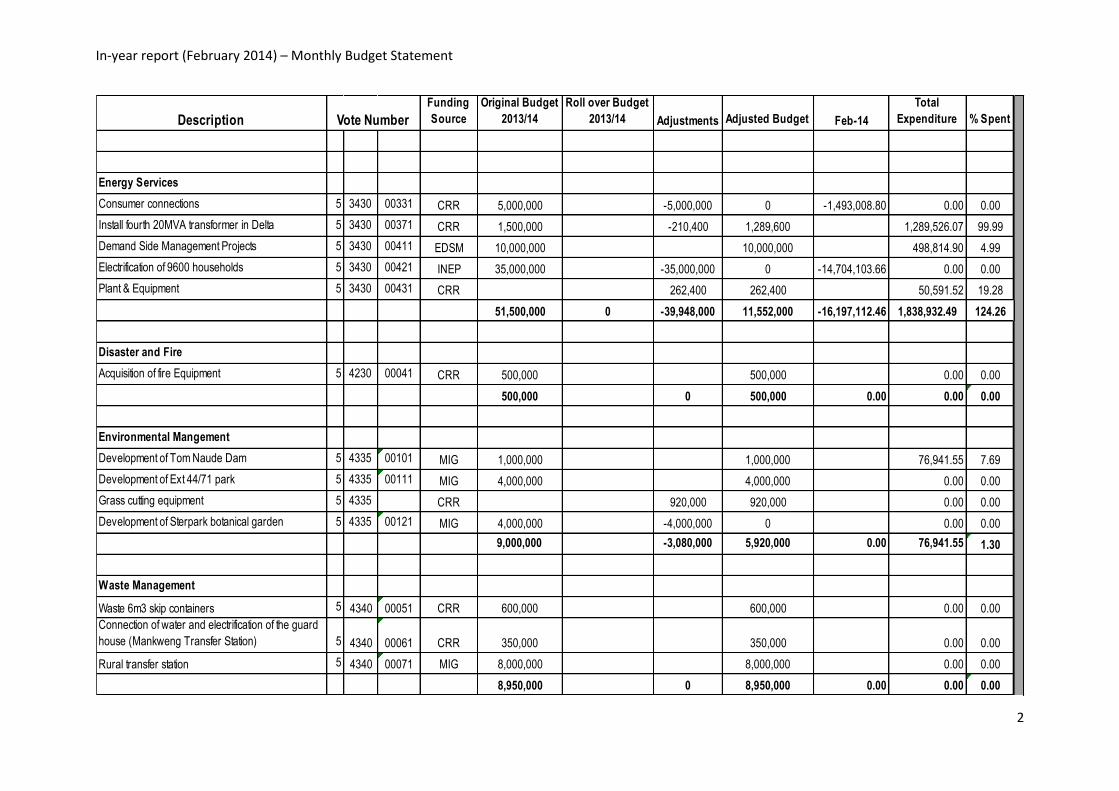
Energy Services
Consumer connections 5 3430 00331 CRR 5,000,000 -5,000,000 0 -1,493,008.80 0.00 0.00
Install fourth 20MVA transformer in Delta 5 3430 00371 CRR 1,500,000 -210,400 1,289,600 1,289,526.07 99.99
Demand Side Management Projects 5 3430 00411 EDSM 10,000,000 10,000,000 498,814.90 4.99
Electrification of 9600 households 5 3430 00421 INEP 35,000,000 -35,000,000 0 -14,704,103.66 0.00 0.00
Plant & Equipment 5 3430 00431 CRR 262,400 262,400 50,591.52 19.28
51,500,000 0 -39,948,000 11,552,000 -16,197,112.46 1,838,932.49 124.26
Disaster and Fire
Acquisition of fire Equipment 5 4230 00041 CRR 500,000 500,000 0.00 0.00
500,000 0 500,000 0.00 0.00 0.00
Environmental Mangement
Development of Tom Naude Dam 5 4335 00101 MIG 1,000,000 1,000,000 76,941.55 7.69
Development of Ext 44/71 park 5 4335 00111 MIG 4,000,000 4,000,000 0.00 0.00
Grass cutting equipment 5 4335 CRR 920,000 920,000 0.00 0.00
Development of Sterpark botanical garden 5 4335 00121 MIG 4,000,000 -4,000,000 0 0.00 0.00
9,000,000 -3,080,000 5,920,000 0.00 76,941.55 1.30
Waste Management
Waste 6m3 skip containers 5 4340 00051 CRR 600,000 600,000 0.00 0.00
Connection of water and electrification of the guard
house (Mankweng Transfer Station) 5 4340 00061 CRR 350,000 350,000 0.00 0.00
Rural transfer station 5 4340 00071 MIG 8,000,000 8,000,000 0.00 0.00
8,950,000 0 8,950,000 0.00 0.00 0.00
Vote Number
In-year report (February 2014) – Monthly Budget Statement
3
Description
Funding
Source
Original Budget
2013/14
Roll over Budget
2013/14 Adjustments Adjusted Budget Feb-14
Total
Expenditure % Spent
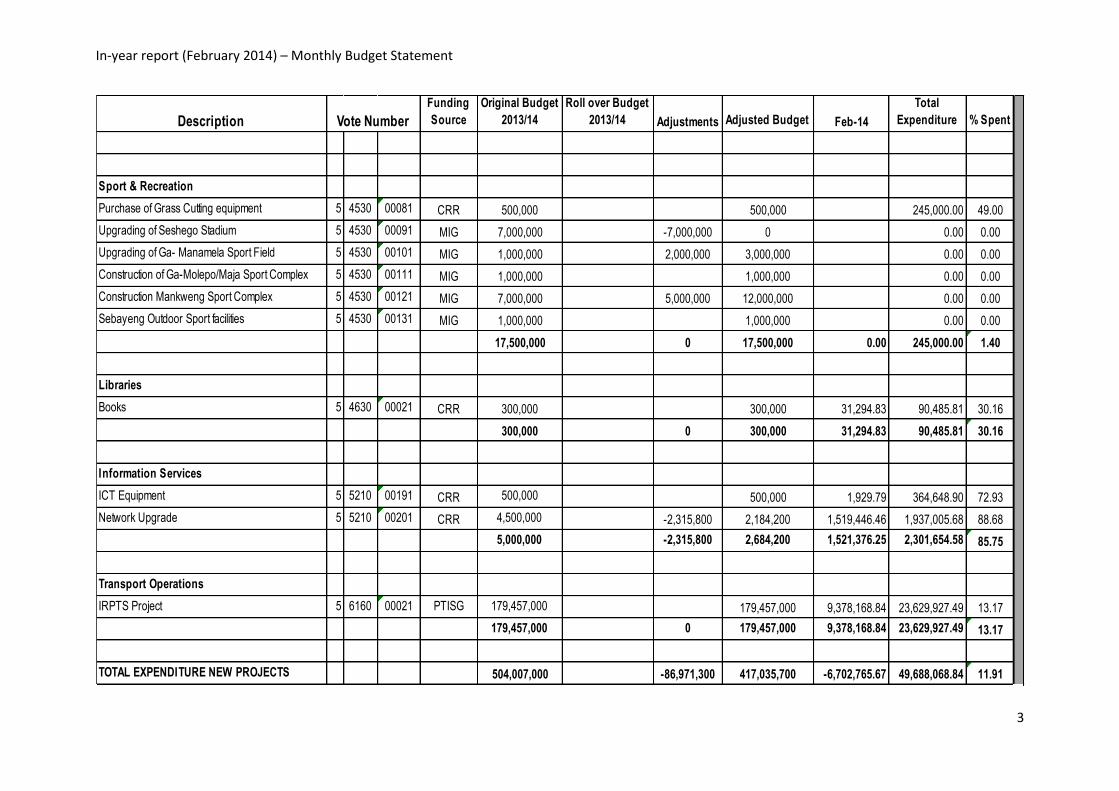
Sport & Recreation
Purchase of Grass Cutting equipment 5 4530 00081 CRR 500,000 500,000 245,000.00 49.00
Upgrading of Seshego Stadium 5 4530 00091 MIG 7,000,000 -7,000,000 0 0.00 0.00
Upgrading of Ga- Manamela Sport Field 5 4530 00101 MIG 1,000,000 2,000,000 3,000,000 0.00 0.00
Construction of Ga-Molepo/Maja Sport Complex 5 4530 00111 MIG 1,000,000 1,000,000 0.00 0.00
Construction Mankweng Sport Complex 5 4530 00121 MIG 7,000,000 5,000,000 12,000,000 0.00 0.00
Sebayeng Outdoor Sport facilities 5 4530 00131 MIG 1,000,000 1,000,000 0.00 0.00
17,500,000 0 17,500,000 0.00 245,000.00 1.40
Libraries
Books 5 4630 00021 CRR 300,000 300,000 31,294.83 90,485.81 30.16
300,000 0 300,000 31,294.83 90,485.81 30.16
Information Services
ICT Equipment 5 5210 00191 CRR 500,000 500,000 1,929.79 364,648.90 72.93
Network Upgrade 5 5210 00201 CRR 4,500,000 -2,315,800 2,184,200 1,519,446.46 1,937,005.68 88.68
5,000,000 -2,315,800 2,684,200 1,521,376.25 2,301,654.58 85.75
Transport Operations
IRPTS Project 5 6160 00021 PTISG 179,457,000 179,457,000 9,378,168.84 23,629,927.49 13.17
179,457,000 0 179,457,000 9,378,168.84 23,629,927.49 13.17
TOTAL EXPENDITURE NEW PROJECTS 504,007,000 -86,971,300 417,035,700 -6,702,765.67 49,688,068.84 11.91
Vote Number
In-year report (February 2014) – Monthly Budget Statement
4
Roll Over Projects 2013/14
Description
Funding
Source
Original Budget
2013/14
Roll over Budget
2013/14 Adjustments Adjusted Budget Feb-14
Total
Expenditure % Spent
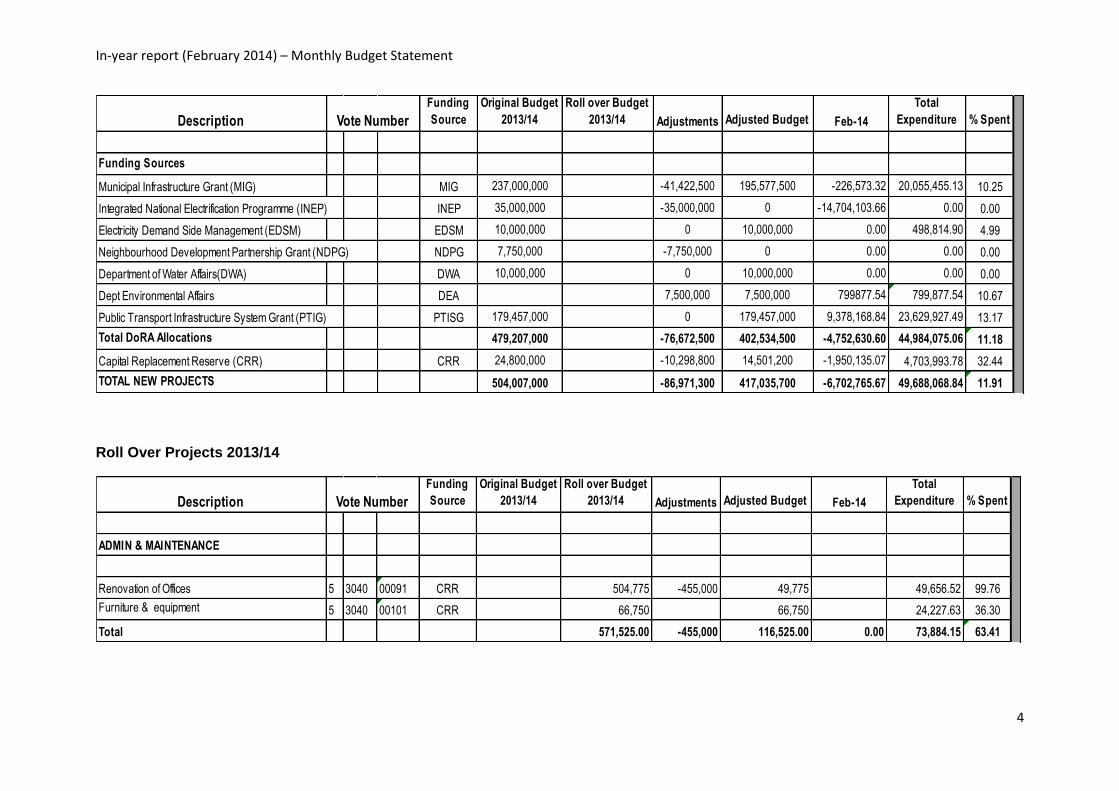
Funding Sources
Municipal Infrastructure Grant (MIG) MIG 237,000,000 -41,422,500 195,577,500 -226,573.32 20,055,455.13 10.25
Integrated National Electrification Programme (INEP) INEP 35,000,000 -35,000,000 0 -14,704,103.66 0.00 0.00
Electricity Demand Side Management (EDSM) EDSM 10,000,000 0 10,000,000 0.00 498,814.90 4.99
Neighbourhood Development Partnership Grant (NDPG) NDPG 7,750,000 -7,750,000 0 0.00 0.00 0.00
Department of Water Affairs(DWA) DWA 10,000,000 0 10,000,000 0.00 0.00 0.00
Dept Environmental Affairs DEA 7,500,000 7,500,000 799877.54 799,877.54 10.67
Public Transport Infrastructure System Grant (PTIG) PTISG 179,457,000 0 179,457,000 9,378,168.84 23,629,927.49 13.17
Total DoRA Allocations 479,207,000 -76,672,500 402,534,500 -4,752,630.60 44,984,075.06 11.18
Capital Replacement Reserve (CRR) CRR 24,800,000 -10,298,800 14,501,200 -1,950,135.07 4,703,993.78 32.44
TOTAL NEW PROJECTS 504,007,000 -86,971,300 417,035,700 -6,702,765.67 49,688,068.84 11.91
Vote Number
Description
Funding
Source
Original Budget
2013/14
Roll over Budget
2013/14 Adjustments Adjusted Budget Feb-14
Total
Expenditure % Spent
ADMIN & MAINTENANCE
Renovation of Offices 5 3040 00091 CRR 504,775 -455,000 49,775 49,656.52 99.76
Furniture & equipment 5 3040 00101 CRR 66,750 66,750 24,227.63 36.30
Total 571,525.00 -455,000 116,525.00 0.00 73,884.15 63.41
Vote Number
In-year report (February 2014) – Monthly Budget Statement
5
Description
Funding
Source
Original Budget
2013/14
Roll over Budget
2013/14 Adjustments Adjusted Budget Feb-14
Total
Expenditure % Spent
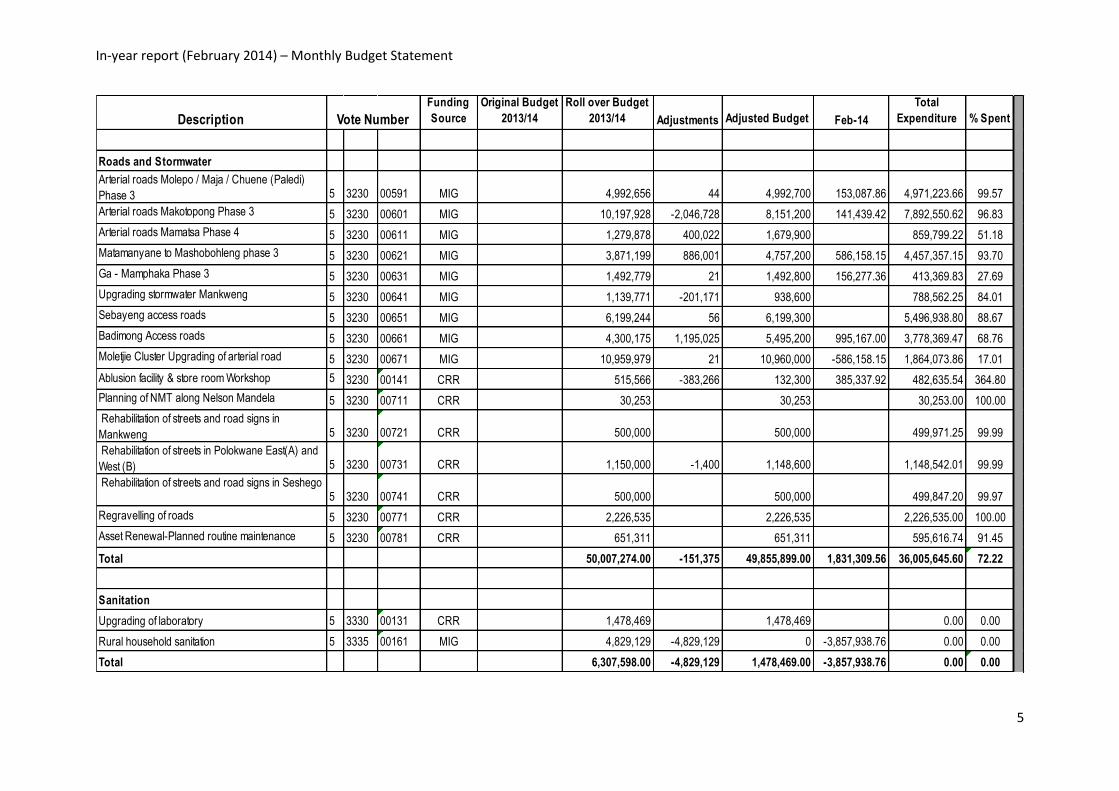
Roads and Stormwater
Arterial roads Molepo / Maja / Chuene (Paledi)
Phase 3 5 3230 00591 MIG 4,992,656 44 4,992,700 153,087.86 4,971,223.66 99.57
Arterial roads Makotopong Phase 3 5 3230 00601 MIG 10,197,928 -2,046,728 8,151,200 141,439.42 7,892,550.62 96.83
Arterial roads Mamatsa Phase 4 5 3230 00611 MIG 1,279,878 400,022 1,679,900 859,799.22 51.18
Matamanyane to Mashobohleng phase 3 5 3230 00621 MIG 3,871,199 886,001 4,757,200 586,158.15 4,457,357.15 93.70
Ga - Mamphaka Phase 3 5 3230 00631 MIG 1,492,779 21 1,492,800 156,277.36 413,369.83 27.69
Upgrading stormwater Mankweng 5 3230 00641 MIG 1,139,771 -201,171 938,600 788,562.25 84.01
Sebayeng access roads 5 3230 00651 MIG 6,199,244 56 6,199,300 5,496,938.80 88.67
Badimong Access roads 5 3230 00661 MIG 4,300,175 1,195,025 5,495,200 995,167.00 3,778,369.47 68.76
Moletjie Cluster Upgrading of arterial road 5 3230 00671 MIG 10,959,979 21 10,960,000 -586,158.15 1,864,073.86 17.01
Ablusion facility & store room Workshop 5 3230 00141 CRR 515,566 -383,266 132,300 385,337.92 482,635.54 364.80
Planning of NMT along Nelson Mandela 5 3230 00711 CRR 30,253 30,253 30,253.00 100.00
Rehabilitation of streets and road signs in
Mankweng 5 3230 00721 CRR 500,000 500,000 499,971.25 99.99
Rehabilitation of streets in Polokwane East(A) and
West (B) 5 3230 00731 CRR 1,150,000 -1,400 1,148,600 1,148,542.01 99.99
Rehabilitation of streets and road signs in Seshego 5 3230 00741 CRR 500,000 500,000 499,847.20 99.97
Regravelling of roads 5 3230 00771 CRR 2,226,535 2,226,535 2,226,535.00 100.00
Asset Renewal-Planned routine maintenance 5 3230 00781 CRR 651,311 651,311 595,616.74 91.45
Total 50,007,274.00 -151,375 49,855,899.00 1,831,309.56 36,005,645.60 72.22
Sanitation
Upgrading of laboratory 5 3330 00131 CRR 1,478,469 1,478,469 0.00 0.00
Rural household sanitation 5 3335 00161 MIG 4,829,129 -4,829,129 0 -3,857,938.76 0.00 0.00
Total 6,307,598.00 -4,829,129 1,478,469.00 -3,857,938.76 0.00 0.00
Vote Number
In-year report (February 2014) – Monthly Budget Statement
6
Description
Funding
Source
Original Budget
2013/14
Roll over Budget
2013/14 Adjustments Adjusted Budget Feb-14
Total
Expenditure % Spent
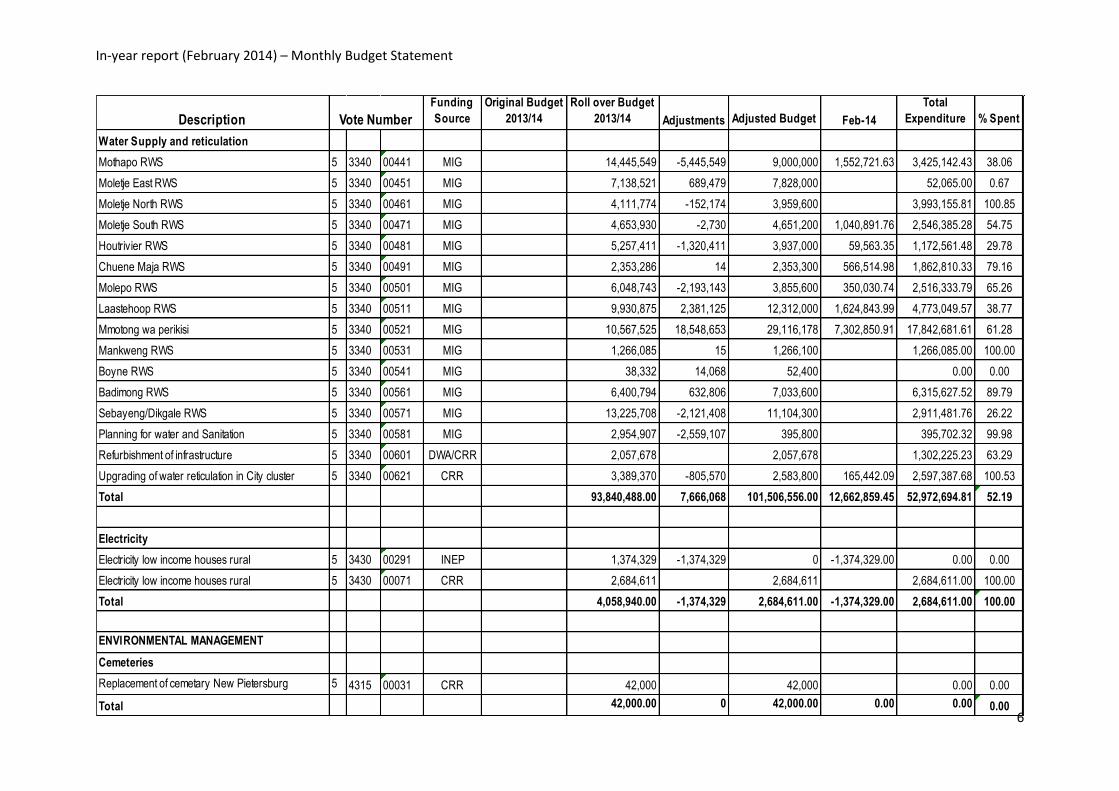
Water Supply and reticulation
Mothapo RWS 5 3340 00441 MIG 14,445,549 -5,445,549 9,000,000 1,552,721.63 3,425,142.43 38.06
Moletje East RWS 5 3340 00451 MIG 7,138,521 689,479 7,828,000 52,065.00 0.67
Moletje North RWS 5 3340 00461 MIG 4,111,774 -152,174 3,959,600 3,993,155.81 100.85
Moletje South RWS 5 3340 00471 MIG 4,653,930 -2,730 4,651,200 1,040,891.76 2,546,385.28 54.75
Houtrivier RWS 5 3340 00481 MIG 5,257,411 -1,320,411 3,937,000 59,563.35 1,172,561.48 29.78
Chuene Maja RWS 5 3340 00491 MIG 2,353,286 14 2,353,300 566,514.98 1,862,810.33 79.16
Molepo RWS 5 3340 00501 MIG 6,048,743 -2,193,143 3,855,600 350,030.74 2,516,333.79 65.26
Laastehoop RWS 5 3340 00511 MIG 9,930,875 2,381,125 12,312,000 1,624,843.99 4,773,049.57 38.77
Mmotong wa perikisi 5 3340 00521 MIG 10,567,525 18,548,653 29,116,178 7,302,850.91 17,842,681.61 61.28
Mankweng RWS 5 3340 00531 MIG 1,266,085 15 1,266,100 1,266,085.00 100.00
Boyne RWS 5 3340 00541 MIG 38,332 14,068 52,400 0.00 0.00
Badimong RWS 5 3340 00561 MIG 6,400,794 632,806 7,033,600 6,315,627.52 89.79
Sebayeng/Dikgale RWS 5 3340 00571 MIG 13,225,708 -2,121,408 11,104,300 2,911,481.76 26.22
Planning for water and Sanitation 5 3340 00581 MIG 2,954,907 -2,559,107 395,800 395,702.32 99.98
Refurbishment of infrastructure 5 3340 00601 DWA/CRR 2,057,678 2,057,678 1,302,225.23 63.29
Upgrading of water reticulation in City cluster 5 3340 00621 CRR 3,389,370 -805,570 2,583,800 165,442.09 2,597,387.68 100.53
Total 93,840,488.00 7,666,068 101,506,556.00 12,662,859.45 52,972,694.81 52.19
Electricity
Electricity low income houses rural 5 3430 00291 INEP 1,374,329 -1,374,329 0 -1,374,329.00 0.00 0.00
Electricity low income houses rural 5 3430 00071 CRR 2,684,611 2,684,611 2,684,611.00 100.00
Total 4,058,940.00 -1,374,329 2,684,611.00 -1,374,329.00 2,684,611.00 100.00
ENVIRONMENTAL MANAGEMENT
Cemeteries
Replacement of cemetary New Pietersburg 5 4315 00031 CRR 42,000 42,000 0.00 0.00
Total 42,000.00 0 42,000.00 0.00 0.00 0.00
Vote Number
In-year report (February 2014) – Monthly Budget Statement
7
Description
Funding
Source
Original Budget
2013/14
Roll over Budget
2013/14 Adjustments Adjusted Budget Feb-14
Total
Expenditure % Spent
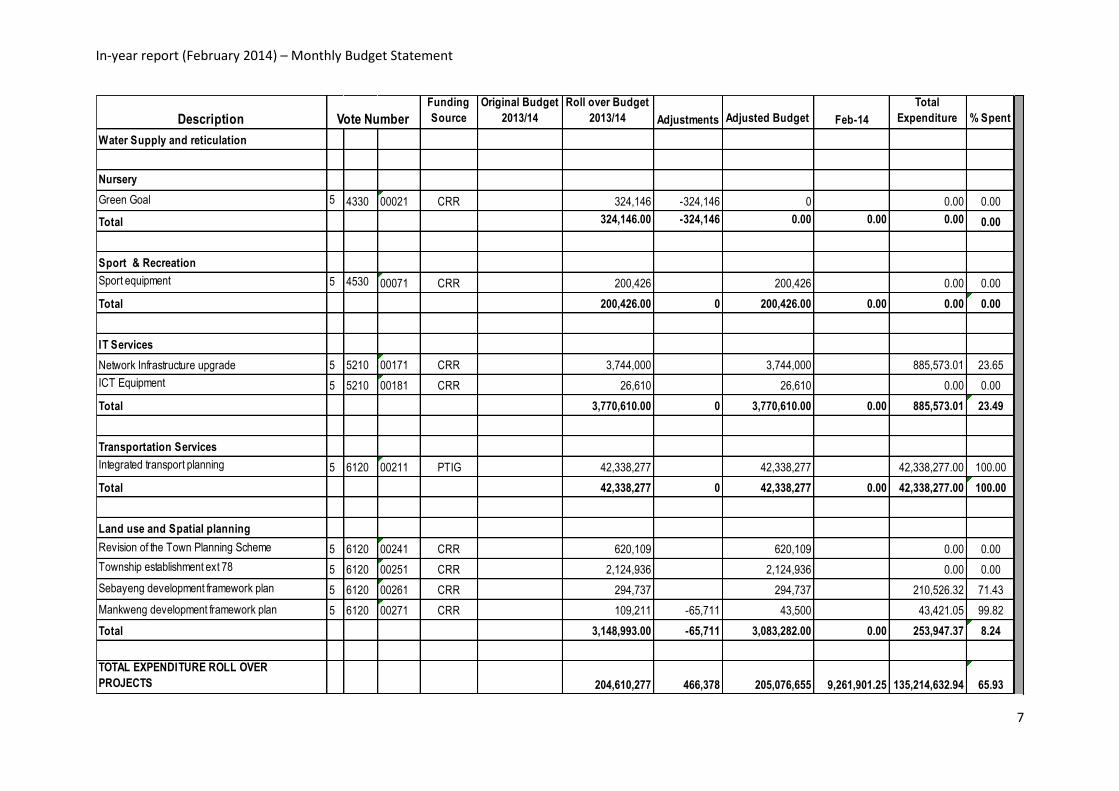
Water Supply and reticulation
Nursery
Green Goal 5 4330 00021 CRR 324,146 -324,146 0 0.00 0.00
Total 324,146.00 -324,146 0.00 0.00 0.00 0.00
Sport & Recreation
Sport equipment 5 4530 00071 CRR 200,426 200,426 0.00 0.00
Total 200,426.00 0 200,426.00 0.00 0.00 0.00
IT Services
Network Infrastructure upgrade 5 5210 00171 CRR 3,744,000 3,744,000 885,573.01 23.65
ICT Equipment 5 5210 00181 CRR 26,610 26,610 0.00 0.00
Total 3,770,610.00 0 3,770,610.00 0.00 885,573.01 23.49
Transportation Services
Integrated transport planning 5 6120 00211 PTIG 42,338,277 42,338,277 42,338,277.00 100.00
Total 42,338,277 0 42,338,277 0.00 42,338,277.00 100.00
Land use and Spatial planning
Revision of the Town Planning Scheme 5 6120 00241 CRR 620,109 620,109 0.00 0.00
Township establishment ext 78 5 6120 00251 CRR 2,124,936 2,124,936 0.00 0.00
Sebayeng development framework plan 5 6120 00261 CRR 294,737 294,737 210,526.32 71.43
Mankweng development framework plan 5 6120 00271 CRR 109,211 -65,711 43,500 43,421.05 99.82
Total 3,148,993.00 -65,711 3,083,282.00 0.00 253,947.37 8.24
TOTAL EXPENDITURE ROLL OVER
PROJECTS 204,610,277 466,378 205,076,655 9,261,901.25 135,214,632.94 65.93
Vote Number
In-year report (February 2014) – Monthly Budget Statement
8
Description
Funding
Source
Original Budget
2013/14
Roll over Budget
2013/14 Adjustments Adjusted Budget Feb-14
Total
Expenditure % Spent
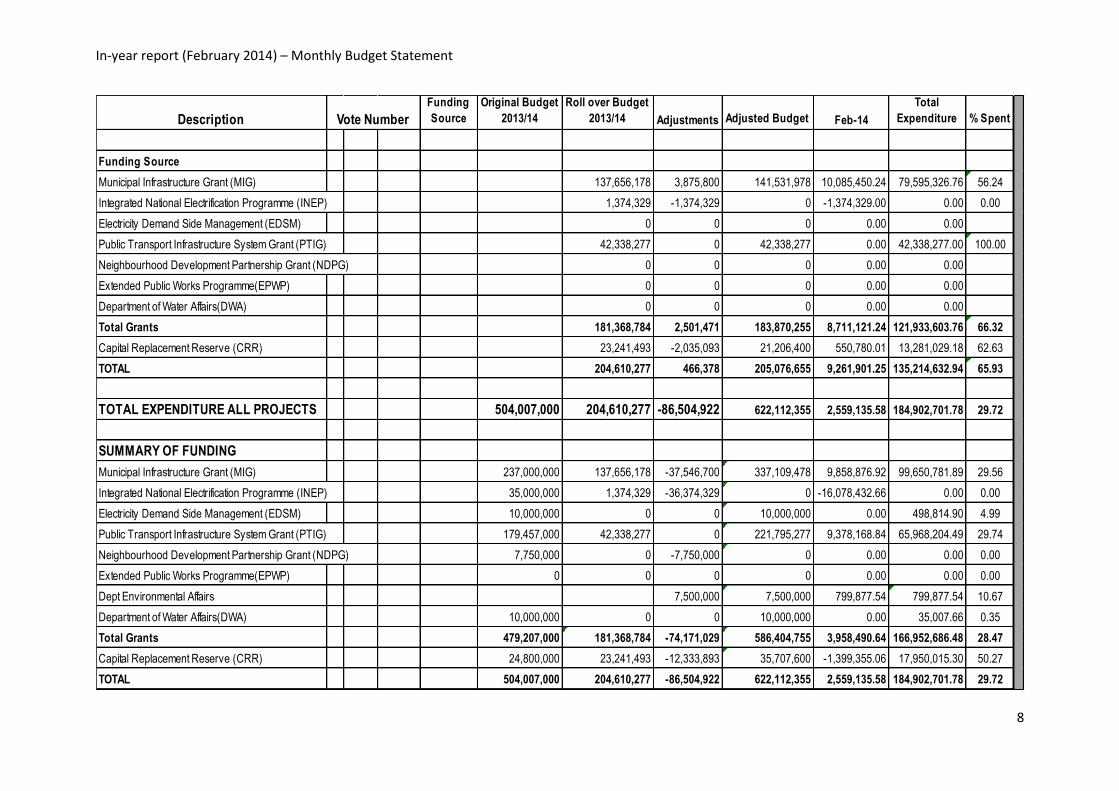
Funding Source
Municipal Infrastructure Grant (MIG) 137,656,178 3,875,800 141,531,978 10,085,450.24 79,595,326.76 56.24
Integrated National Electrification Programme (INEP) 1,374,329 -1,374,329 0 -1,374,329.00 0.00 0.00
Electricity Demand Side Management (EDSM) 0 0 0 0.00 0.00
Public Transport Infrastructure System Grant (PTIG) 42,338,277 0 42,338,277 0.00 42,338,277.00 100.00
Neighbourhood Development Partnership Grant (NDPG) 0 0 0 0.00 0.00
Extended Public Works Programme(EPWP) 0 0 0 0.00 0.00
Department of Water Affairs(DWA) 0 0 0 0.00 0.00
Total Grants 181,368,784 2,501,471 183,870,255 8,711,121.24 121,933,603.76 66.32
Capital Replacement Reserve (CRR) 23,241,493 -2,035,093 21,206,400 550,780.01 13,281,029.18 62.63
TOTAL 204,610,277 466,378 205,076,655 9,261,901.25 135,214,632.94 65.93
TOTAL EXPENDITURE ALL PROJECTS 504,007,000 204,610,277 -86,504,922 622,112,355 2,559,135.58 184,902,701.78 29.72
SUMMARY OF FUNDING
Municipal Infrastructure Grant (MIG) 237,000,000 137,656,178 -37,546,700 337,109,478 9,858,876.92 99,650,781.89 29.56
Integrated National Electrification Programme (INEP) 35,000,000 1,374,329 -36,374,329 0 -16,078,432.66 0.00 0.00
Electricity Demand Side Management (EDSM) 10,000,000 0 0 10,000,000 0.00 498,814.90 4.99
Public Transport Infrastructure System Grant (PTIG) 179,457,000 42,338,277 0 221,795,277 9,378,168.84 65,968,204.49 29.74
Neighbourhood Development Partnership Grant (NDPG) 7,750,000 0 -7,750,000 0 0.00 0.00 0.00
Extended Public Works Programme(EPWP) 0 0 0 0 0.00 0.00 0.00
Dept Environmental Affairs 7,500,000 7,500,000 799,877.54 799,877.54 10.67
Department of Water Affairs(DWA) 10,000,000 0 0 10,000,000 0.00 35,007.66 0.35
Total Grants 479,207,000 181,368,784 -74,171,029 586,404,755 3,958,490.64 166,952,686.48 28.47
Capital Replacement Reserve (CRR) 24,800,000 23,241,493 -12,333,893 35,707,600 -1,399,355.06 17,950,015.30 50.27
TOTAL 504,007,000 204,610,277 -86,504,922 622,112,355 2,559,135.58 184,902,701.78 29.72
Vote Number