Embed Size (px)
Citation preview
A dissertation submitted to the University of Huddersfield in partialfulfillment of the requirements for the degree of Bachelor of Science in
Web Technologies
Enhancing Local Area Network Monitoring
Author: Errietta Kostala - u1250207Supervisor: Matthew Mantle
April 29, 2016
Errietta Kostala Enhancing Local Area Network Monitoring
Abstract
Most businesses nowadays rely on computer systemsworking properly and being available- whether the business is a big online clothing store or a small office with an employee fileserver, the correct functioning of and quick identification of problems with IT systems iscrucial. Network Management Systems allow businesses to monitor their networks’ avail-ability and performance; they are, however, expensive to set up and maintain, to a pointwhere they are out of reach of a small business.
This report highlights the process of developing ShadowNMS::LAN, a Local Area NetworkManagement System that aims at providing an easy and cheap network management so-lutions for small businesses, based on Raspberry Pi hardware and Perl software.
The resulting findings demonstrate how amore lightweight andmore basic NetworkMan-agement System can fill the market gap for Network Management in small businesses, byproviding the most essential monitoring features while significantly cutting installationand maintenance costs.
2
Enhancing Local Area Network Monitoring Errietta Kostala
Acknowledgements
I would like to thank my supervisor, Matthew Mantle, for his support during the devel-opment of this product.
In addition to this, I would like to thank Mark Keating and Matt S. Trout, managing andtechnical directors of Shadowcat Systems, for their guidance during the project and fortheir help evaluating it.
Last but not least, I would like to thank Darren Shaw, Senior Network System Special-ist at the University of Huddersfield, for giving his time to tell me about the University’snetwork management systems and give me his opinion on the product.
3

Errietta Kostala Enhancing Local Area Network Monitoring
4
Enhancing Local Area Network Monitoring Errietta Kostala
Introduction
Network Management Systems offer the ability to monitor different readings (such asservice/network availability, disk input/output, CPU/RAM usage) frommultiple machinesin a computer network and issue alerts for certain events, for example when a servicebecomes unavailable, or resource usage exceeds an amount (Burke, 2010).
Corporations of a certain size and above, which have in-house system administrators,can usually afford to set up and maintain a Network Management System (NMS), such asNagios or OpenNMS. Although these NMSs are free software, installing and maintainingthem is costly due to the complexity involved. Smaller businesses may not have in-housesystem administrators, or if they do they may not be able to afford maintaining one of themainstream NMSs.
ShadowNMS is a cloud-based NMS which aims to provide a solution for this problem byproviding a centralised monitoring environment with a user-friendly interface to Open-NMS. It works by getting a list of IP addresses from the user, and discovering services inthe given addresses. It thenmonitors the services using OpenNMS and sends notificationswhen a service is down.
ShadowNMS works for Internet-connected services, but it is not an ideal solution fore.g. an office. This is because it only monitors services that are publically visible on theInternet, so a file or email server in a company’s office network cannot be monitored. Forthis reason, Shadowcat Systems requested the creation of ShadowNMS::LAN, a smaller,’local’ ShadowNMS that runs on cheap hardware, monitoring devices and sending monitordata to the ShadowNMS back-end.
ShadowNMS::LAN was designed with the principles of modularity, separation of con-cerns, and good testing and documentation from the beginning. Because of this, the endresult was a software suite that is easy to modify, and easy for a new developer to learnand start working on.
Another advantage of ShadowNMS::LAN is that it does not require the user to do anymanual configuration or installation apart from plugging the hardware into the network.This cuts the work and costs associated with installation and maintenance.
5

Errietta Kostala Enhancing Local Area Network Monitoring
.
6
Enhancing Local Area Network Monitoring Errietta Kostala
Contents
1 Research 91.1 Network Management . . . . . . . . . . . . . . . . . . . . . . . . . . . . . . . . . . 91.2 SNMP . . . . . . . . . . . . . . . . . . . . . . . . . . . . . . . . . . . . . . . . . . . . 91.3 Network Management Systems (NMS) . . . . . . . . . . . . . . . . . . . . . . . . . 10
1.3.1 OpenNMS . . . . . . . . . . . . . . . . . . . . . . . . . . . . . . . . . . . . . . 101.3.2 OpenNMS and ShadowNMS . . . . . . . . . . . . . . . . . . . . . . . . . . . 10
Users of OpenNMS . . . . . . . . . . . . . . . . . . . . . . . . . . . . . . . . . 131.3.3 Nagios . . . . . . . . . . . . . . . . . . . . . . . . . . . . . . . . . . . . . . . . 13
Nagios users . . . . . . . . . . . . . . . . . . . . . . . . . . . . . . . . . . . . . 131.3.4 MRTG . . . . . . . . . . . . . . . . . . . . . . . . . . . . . . . . . . . . . . . . . 141.3.5 Evaluating NMSs . . . . . . . . . . . . . . . . . . . . . . . . . . . . . . . . . . 16
1.4 Local Area Networks (LANs) . . . . . . . . . . . . . . . . . . . . . . . . . . . . . . . 171.5 Hardware . . . . . . . . . . . . . . . . . . . . . . . . . . . . . . . . . . . . . . . . . . 17
1.5.1 Raspberry Pi 2 . . . . . . . . . . . . . . . . . . . . . . . . . . . . . . . . . . . . 181.5.2 BeagleBone/BeagleBoard . . . . . . . . . . . . . . . . . . . . . . . . . . . . . 181.5.3 BananaPi . . . . . . . . . . . . . . . . . . . . . . . . . . . . . . . . . . . . . . . 181.5.4 LinkSprite pcDuino . . . . . . . . . . . . . . . . . . . . . . . . . . . . . . . . . 181.5.5 Intel NUC . . . . . . . . . . . . . . . . . . . . . . . . . . . . . . . . . . . . . . . 18
1.6 Development research . . . . . . . . . . . . . . . . . . . . . . . . . . . . . . . . . . 181.6.1 Perl 5 . . . . . . . . . . . . . . . . . . . . . . . . . . . . . . . . . . . . . . . . . 191.6.2 SQLite . . . . . . . . . . . . . . . . . . . . . . . . . . . . . . . . . . . . . . . . 19
1.7 LAN monitoring . . . . . . . . . . . . . . . . . . . . . . . . . . . . . . . . . . . . . . 201.8 Remote access . . . . . . . . . . . . . . . . . . . . . . . . . . . . . . . . . . . . . . . 20
1.8.1 Reverse SSH tunnel . . . . . . . . . . . . . . . . . . . . . . . . . . . . . . . . 201.8.2 Command/data exchange through HTTPS . . . . . . . . . . . . . . . . . . 211.8.3 Long Polling . . . . . . . . . . . . . . . . . . . . . . . . . . . . . . . . . . . . . 221.8.4 Web Sockets . . . . . . . . . . . . . . . . . . . . . . . . . . . . . . . . . . . . . 22
1.9 Authentication . . . . . . . . . . . . . . . . . . . . . . . . . . . . . . . . . . . . . . . 22
2 Design process 252.1 Planning . . . . . . . . . . . . . . . . . . . . . . . . . . . . . . . . . . . . . . . . . . . 25
2.1.1 Discussions with Matt Trout . . . . . . . . . . . . . . . . . . . . . . . . . . . 252.1.2 Design . . . . . . . . . . . . . . . . . . . . . . . . . . . . . . . . . . . . . . . . 25
3 Production 273.1 MoSCoW Analysis . . . . . . . . . . . . . . . . . . . . . . . . . . . . . . . . . . . . . 273.2 Project Management . . . . . . . . . . . . . . . . . . . . . . . . . . . . . . . . . . . 283.3 Programming - Technical evaluation . . . . . . . . . . . . . . . . . . . . . . . . . . 31
3.3.1 Modular approach . . . . . . . . . . . . . . . . . . . . . . . . . . . . . . . . . 313.3.2 Sustainability . . . . . . . . . . . . . . . . . . . . . . . . . . . . . . . . . . . . 323.3.3 Longevity . . . . . . . . . . . . . . . . . . . . . . . . . . . . . . . . . . . . . . . 32
3.4 Documentation . . . . . . . . . . . . . . . . . . . . . . . . . . . . . . . . . . . . . . . 33
CONTENTS 7
Errietta Kostala Enhancing Local Area Network Monitoring
3.5 Deployment . . . . . . . . . . . . . . . . . . . . . . . . . . . . . . . . . . . . . . . . . 33
4 Testing and User Evaluation Research 354.1 Unit testing . . . . . . . . . . . . . . . . . . . . . . . . . . . . . . . . . . . . . . . . . 354.2 Technical testing . . . . . . . . . . . . . . . . . . . . . . . . . . . . . . . . . . . . . . 354.3 User testing . . . . . . . . . . . . . . . . . . . . . . . . . . . . . . . . . . . . . . . . . 354.4 Results . . . . . . . . . . . . . . . . . . . . . . . . . . . . . . . . . . . . . . . . . . . . 354.5 Changes to product . . . . . . . . . . . . . . . . . . . . . . . . . . . . . . . . . . . . 35
5 Evaluation 375.1 Virtual Network . . . . . . . . . . . . . . . . . . . . . . . . . . . . . . . . . . . . . . 37
5.1.1 Test 1 - Discovery . . . . . . . . . . . . . . . . . . . . . . . . . . . . . . . . . . 385.1.2 Test 2 - Monitoring . . . . . . . . . . . . . . . . . . . . . . . . . . . . . . . . . 385.1.3 Test 3 - Cron jobs . . . . . . . . . . . . . . . . . . . . . . . . . . . . . . . . . . 39
5.2 Unit Testing . . . . . . . . . . . . . . . . . . . . . . . . . . . . . . . . . . . . . . . . . 405.3 Three-way evaluation . . . . . . . . . . . . . . . . . . . . . . . . . . . . . . . . . . . 405.4 Feedback by Matt S. Trout . . . . . . . . . . . . . . . . . . . . . . . . . . . . . . . . 415.5 Discussion with Darren Shaw . . . . . . . . . . . . . . . . . . . . . . . . . . . . . . 41
6 Professional Issues 436.1 Nagios::Plugin VS. Nagios Enterprises . . . . . . . . . . . . . . . . . . . . . . . . . 43
7 Conclusion 45
8 References 47
9 Appendix 519.1 Abbreviations . . . . . . . . . . . . . . . . . . . . . . . . . . . . . . . . . . . . . . . . 519.2 Discussion with Matt S. Trout, 27 April 2016 . . . . . . . . . . . . . . . . . . . . . 519.3 Monitoring test results . . . . . . . . . . . . . . . . . . . . . . . . . . . . . . . . . . 539.4 Cron job output . . . . . . . . . . . . . . . . . . . . . . . . . . . . . . . . . . . . . . 589.5 Unit test results . . . . . . . . . . . . . . . . . . . . . . . . . . . . . . . . . . . . . . 609.6 Production log . . . . . . . . . . . . . . . . . . . . . . . . . . . . . . . . . . . . . . . 63
8 CONTENTS
Enhancing Local Area Network Monitoring Errietta Kostala
1. Research
1.1 Network Management
Network management consists of local and remote configuration and using softwareto manage it (Burke, 2010). A management station running a NMS collects and managesinformation such as resource usage, response times, and service availability (Burke, 2010;Abeck, 2009). Burke (2010) also mentions that the purpose of network management is toensure the availability of resources to the end user.
According to Ding (2010), network management can mean different things to differ-ent people. This can range from ensuring service reliability, to being cost-conscious, toknowing when maintenance needs to take place (Ding, 2010). It is therefore critical thatwe establish what we mean with ’Network Management’ as far as this project’s scope isconcerned.
Specifically, the project’s interest is limited only to the availability and performance (e.g.response time) of monitored services, and does not include any of the other areas networkmanagement can be concernedwith. However, it could be extendable to allow futuremod-ifications.
1.2 SNMP
Simple Network Management Protocol (SNMP) is a protocol for managing devices on anetwork (Mauro & Schmidt, 2013). SNMP is used in many existing hardware devices andsoftware packages (Mauro & Schmidt, 2013). Mikalsen and Borgesen (1997/2002) simplyexplain it as the protocol that ensures there is communication between network devices.
SNMP-implementing software typically wait for requests from the NMS and return therequested information or perform an action. SNMP stations have the advantage of be-ing able to provide their data to a large amount of other software and hardware, due toSNMP’s wide adaptation (Ding, 2010). OpenNMS, Nagios and other NMSs use SNMP formany of their features as well. In fact, according to Mikalsen and Borgesen (1997/2002)SNMP agents report any problems it detects to the NMS.
According to M. Burgess (2007), SNMP is a text-based protocol, making it relatively easyfor programmers to write applications that take advantage of it. In fact, tools exist and canbe written to it on a variety of platforms, including PHP, Tcl, Perl, and C (M. Burgess, 2007).
In order for SNMP to work, software that supports it needs to be running on the system.Said system is then called an SNMP agent. Additionally, another system running compat-ible software (or a system administrator) can use a set of commands to retrieve deviceinformation, or even manipulate the device, e.g. by turning off the network interface re-motely. The system sending these management commands is called the SNMP manager.
SNMP agents are configured to send a notification (trap) to the manager when certainevents happen. These traps are sent by the agent without any request from the manager.The manager can also send a query for information, however, which the agent needs torespond to (Mauro & Schmidt, 2013).
CHAPTER 1. RESEARCH 9
Errietta Kostala Enhancing Local Area Network Monitoring
1.3 Network Management Systems (NMS)
1.3.1 OpenNMS
One of the popular NMSs is OpenNMS. OpenNMS is Java-based, enterprise-grade OpenSource software that offers commercial support to its users. (The OpenNMS Project, n.d.).
Although OpenNMS provides some remote polling capability, it is not designed to mon-itor a LAN and send back results - it is instead a way to monitor internet-facing websitesfrom different geographical locations (The OpenNMS Project, 2014). So, while it is usefulfor diagnosing region-specific issues that could prevent users from accessing a service, itcannot be used for LAN monitoring.
Another problem is the resource usage of OpenNMS. It is a rather intensive piece ofjava-based software, even for high-end systems. If one wants to monitor a LAN usingcheap hardware, running OpenNMS will be difficult.
1.3.2 OpenNMS and ShadowNMS
ShadowNMS was built as a more user-frieldy wrapper around OpenNMS, reducing ad-vanced features that are normally difficult to configure to a few button clicks. For example,to scan an IP address with OpenNMS, you would have to run a command, such as:
perl /path/to/OPENNMS/bin/send−event . pl \−−inter face 1 9 2 . 1 6 8 . 1 . 1 \uei . opennms . org/interna l/discovery/newSuspect
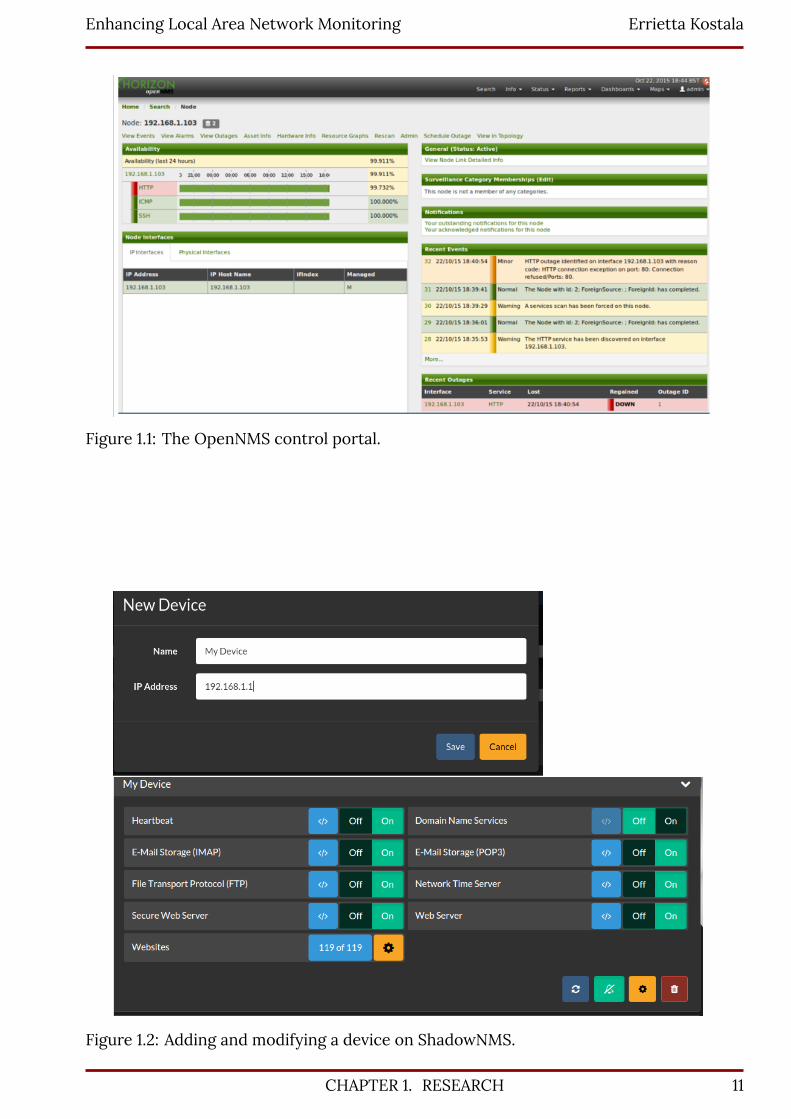
Once scanned, OpenNMS will recognise the device’s available services (shown in figure1.1). However, in order to select which services are being monitored, either a cofigurationfile change or a change through the UI settings is needed to select which services are beingmonitored.
In contrast, ShadowNMS allows a user to simply input an IP address in the website, andautomatically performs the relevant OpenNMS configuration. It also presents availablemonitored services in a simple on/off UI, and again handles the OpenNMS configurationitself (fig. 1.2).
ShadowNMS is also useful for when a business needs network monitoring but are notable to install a local network management solution (Keating, 2015). Since ShadowNMSruns on the Internet, it removes the cost of suitable hardware, software, and staff time (forinstallation and maintenance) which a local installation would bring.
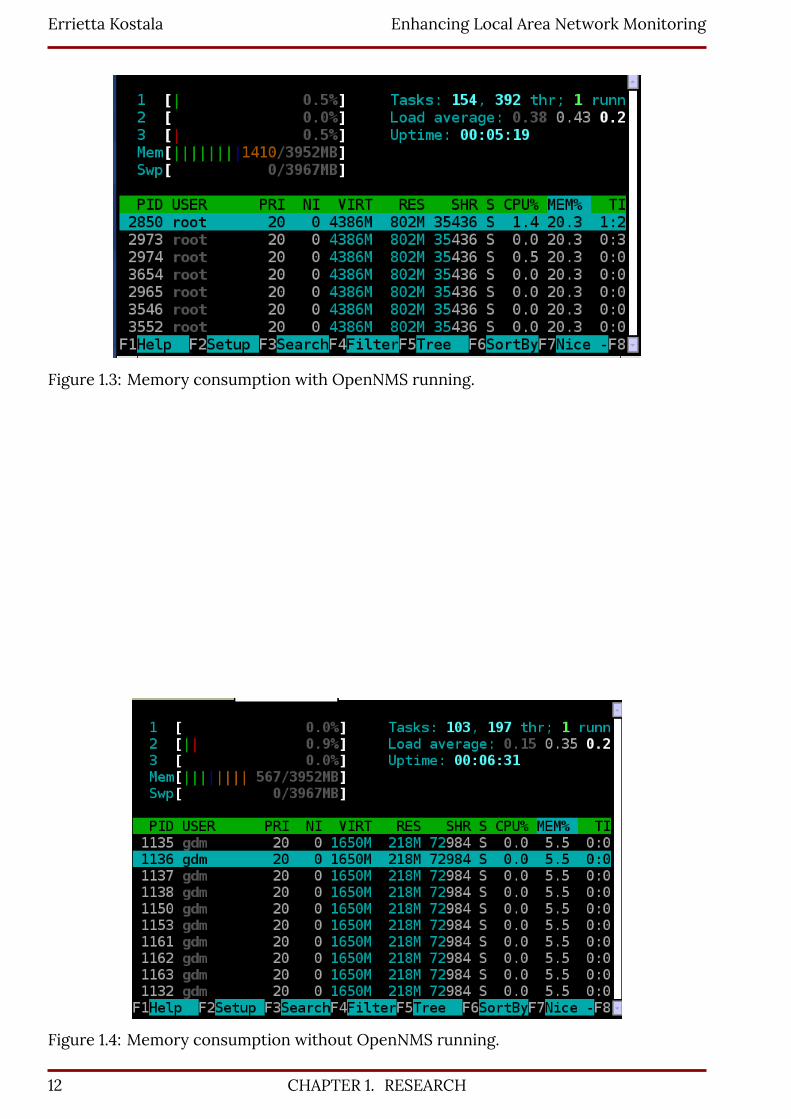
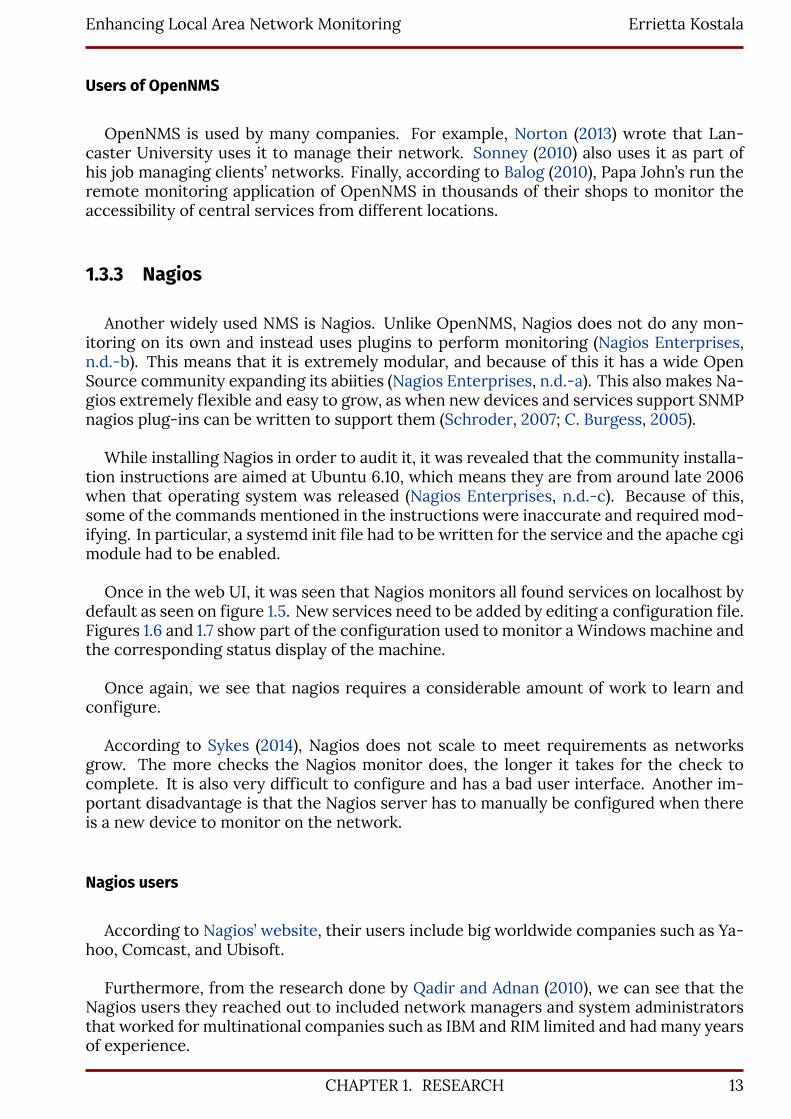
Additionally, looking at the load information with OpenNMS running (figure 1.3) ver-sus not running (figure 1.4), we can see that OpenNMS is responsible for about 840MB ofmemory consumption. This is with minimal configuration only monitoring a single host.
10 CHAPTER 1. RESEARCH
Enhancing Local Area Network Monitoring Errietta Kostala
Figure 1.1: The OpenNMS control portal.
Figure 1.2: Adding and modifying a device on ShadowNMS.
CHAPTER 1. RESEARCH 11
Errietta Kostala Enhancing Local Area Network Monitoring
Figure 1.3: Memory consumption with OpenNMS running.
Figure 1.4: Memory consumption without OpenNMS running.
12 CHAPTER 1. RESEARCH
Enhancing Local Area Network Monitoring Errietta Kostala
Users of OpenNMS
OpenNMS is used by many companies. For example, Norton (2013) wrote that Lan-caster University uses it to manage their network. Sonney (2010) also uses it as part ofhis job managing clients’ networks. Finally, according to Balog (2010), Papa John’s run theremote monitoring application of OpenNMS in thousands of their shops to monitor theaccessibility of central services from different locations.
1.3.3 Nagios
Another widely used NMS is Nagios. Unlike OpenNMS, Nagios does not do any mon-itoring on its own and instead uses plugins to perform monitoring (Nagios Enterprises,n.d.-b). This means that it is extremely modular, and because of this it has a wide OpenSource community expanding its abiities (Nagios Enterprises, n.d.-a). This also makes Na-gios extremely flexible and easy to grow, as when new devices and services support SNMPnagios plug-ins can be written to support them (Schroder, 2007; C. Burgess, 2005).
While installing Nagios in order to audit it, it was revealed that the community installa-tion instructions are aimed at Ubuntu 6.10, which means they are from around late 2006when that operating system was released (Nagios Enterprises, n.d.-c). Because of this,some of the commands mentioned in the instructions were inaccurate and required mod-ifying. In particular, a systemd init file had to be written for the service and the apache cgimodule had to be enabled.
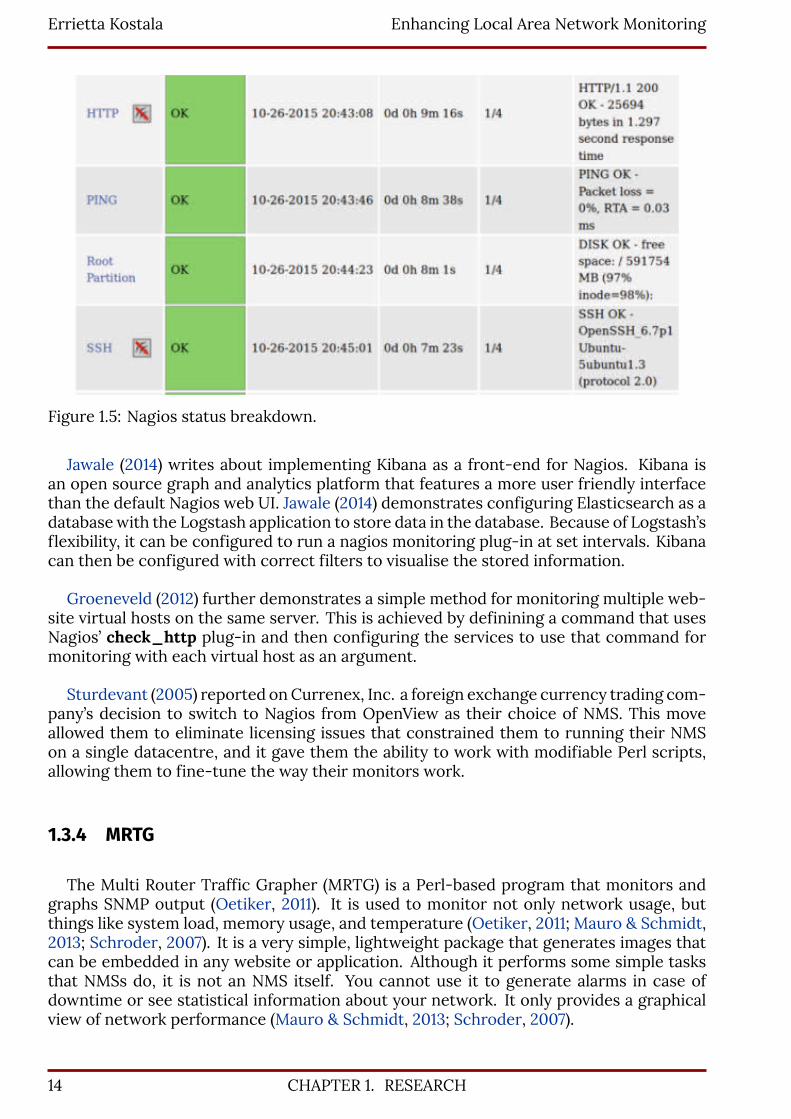
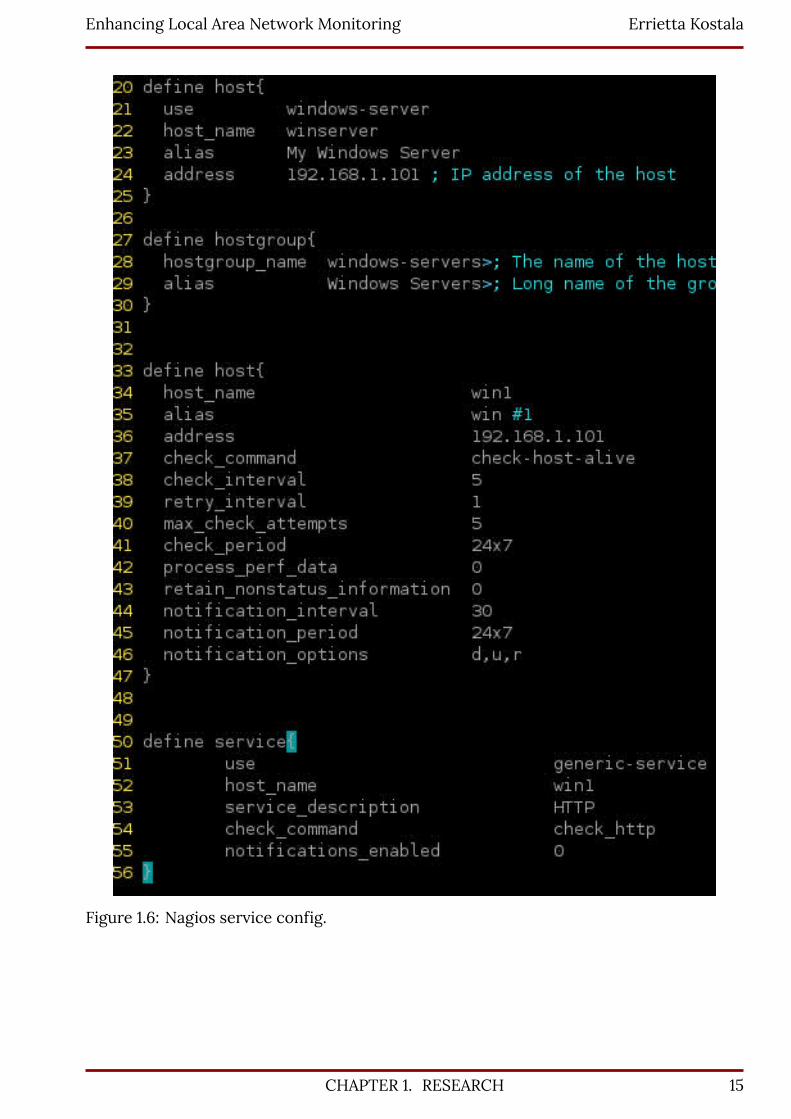
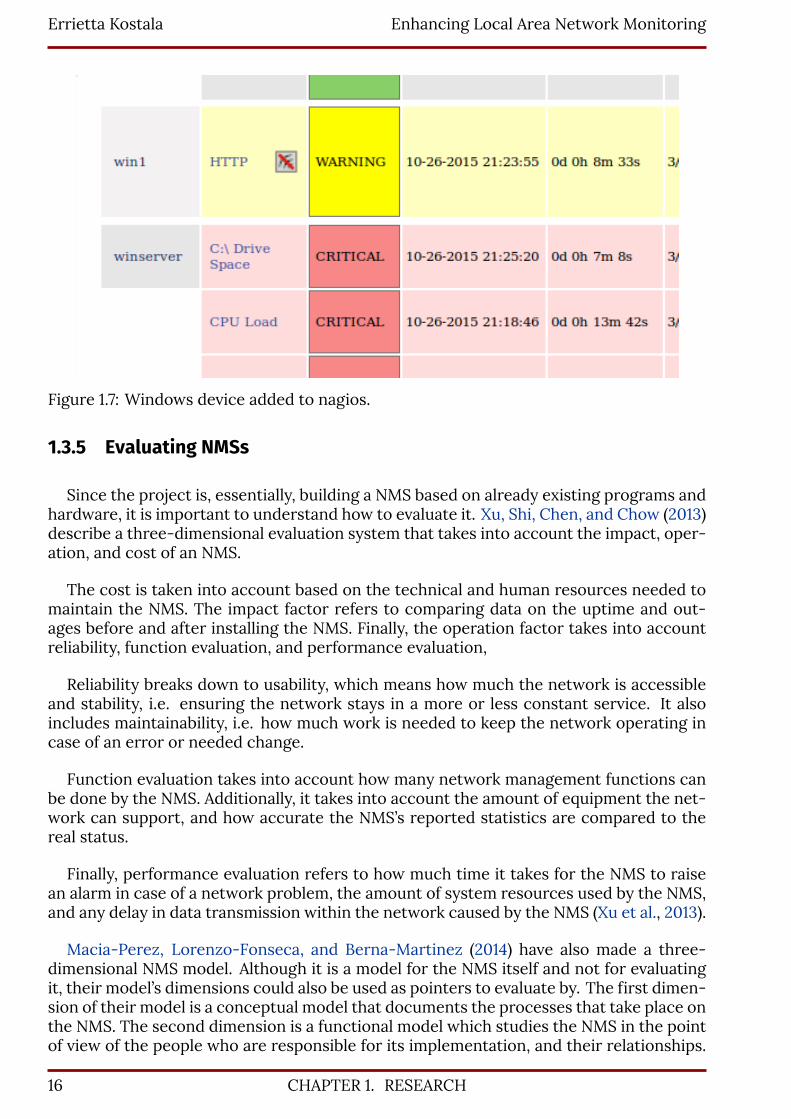
Once in the web UI, it was seen that Nagios monitors all found services on localhost bydefault as seen on figure 1.5. New services need to be added by editing a configuration file.Figures 1.6 and 1.7 show part of the configuration used to monitor a Windows machine andthe corresponding status display of the machine.
Once again, we see that nagios requires a considerable amount of work to learn andconfigure.
According to Sykes (2014), Nagios does not scale to meet requirements as networksgrow. The more checks the Nagios monitor does, the longer it takes for the check tocomplete. It is also very difficult to configure and has a bad user interface. Another im-portant disadvantage is that the Nagios server has to manually be configured when thereis a new device to monitor on the network.
Nagios users
According to Nagios’ website, their users include big worldwide companies such as Ya-hoo, Comcast, and Ubisoft.
Furthermore, from the research done by Qadir and Adnan (2010), we can see that theNagios users they reached out to included network managers and system administratorsthat worked for multinational companies such as IBM and RIM limited and had many yearsof experience.
CHAPTER 1. RESEARCH 13
Errietta Kostala Enhancing Local Area Network Monitoring
Figure 1.5: Nagios status breakdown.
Jawale (2014) writes about implementing Kibana as a front-end for Nagios. Kibana isan open source graph and analytics platform that features a more user friendly interfacethan the default Nagios web UI. Jawale (2014) demonstrates configuring Elasticsearch as adatabase with the Logstash application to store data in the database. Because of Logstash’sflexibility, it can be configured to run a nagios monitoring plug-in at set intervals. Kibanacan then be configured with correct filters to visualise the stored information.
Groeneveld (2012) further demonstrates a simple method for monitoring multiple web-site virtual hosts on the same server. This is achieved by definining a command that usesNagios’ check_http plug-in and then configuring the services to use that command formonitoring with each virtual host as an argument.
Sturdevant (2005) reported onCurrenex, Inc. a foreign exchange currency trading com-pany’s decision to switch to Nagios from OpenView as their choice of NMS. This moveallowed them to eliminate licensing issues that constrained them to running their NMSon a single datacentre, and it gave them the ability to work with modifiable Perl scripts,allowing them to fine-tune the way their monitors work.
1.3.4 MRTG
The Multi Router Traffic Grapher (MRTG) is a Perl-based program that monitors andgraphs SNMP output (Oetiker, 2011). It is used to monitor not only network usage, butthings like system load, memory usage, and temperature (Oetiker, 2011; Mauro & Schmidt,2013; Schroder, 2007). It is a very simple, lightweight package that generates images thatcan be embedded in any website or application. Although it performs some simple tasksthat NMSs do, it is not an NMS itself. You cannot use it to generate alarms in case ofdowntime or see statistical information about your network. It only provides a graphicalview of network performance (Mauro & Schmidt, 2013; Schroder, 2007).
14 CHAPTER 1. RESEARCH
Enhancing Local Area Network Monitoring Errietta Kostala
Figure 1.6: Nagios service config.
CHAPTER 1. RESEARCH 15
Errietta Kostala Enhancing Local Area Network Monitoring
Figure 1.7: Windows device added to nagios.
1.3.5 Evaluating NMSs
Since the project is, essentially, building a NMS based on already existing programs andhardware, it is important to understand how to evaluate it. Xu, Shi, Chen, and Chow (2013)describe a three-dimensional evaluation system that takes into account the impact, oper-ation, and cost of an NMS.
The cost is taken into account based on the technical and human resources needed tomaintain the NMS. The impact factor refers to comparing data on the uptime and out-ages before and after installing the NMS. Finally, the operation factor takes into accountreliability, function evaluation, and performance evaluation,
Reliability breaks down to usability, which means how much the network is accessibleand stability, i.e. ensuring the network stays in a more or less constant service. It alsoincludes maintainability, i.e. how much work is needed to keep the network operating incase of an error or needed change.
Function evaluation takes into account how many network management functions canbe done by the NMS. Additionally, it takes into account the amount of equipment the net-work can support, and how accurate the NMS’s reported statistics are compared to thereal status.
Finally, performance evaluation refers to how much time it takes for the NMS to raisean alarm in case of a network problem, the amount of system resources used by the NMS,and any delay in data transmission within the network caused by the NMS (Xu et al., 2013).
Macia-Perez, Lorenzo-Fonseca, and Berna-Martinez (2014) have also made a three-dimensional NMS model. Although it is a model for the NMS itself and not for evaluatingit, their model’s dimensions could also be used as pointers to evaluate by. The first dimen-sion of their model is a conceptual model that documents the processes that take place onthe NMS. The second dimension is a functional model which studies the NMS in the pointof view of the people who are responsible for its implementation, and their relationships.
16 CHAPTER 1. RESEARCH
Enhancing Local Area Network Monitoring Errietta Kostala
Finally, the architectural model documents the resources needed to implement the NMS(Macia-Perez et al., 2014).
In terms of evaluation, the aforementioned models could be used as following:
• The conceptual model could be evaluated by ensuring all processes work accurately,i.e. all the required devices/services are being monitored, configuration is retrievedfrom the master server, and the status information is sent back.
• The functional model could be evaluated by seeing howmuch manual work has to bedone after the NMS’s instalation to keep it functioning.
• Finally, the architectural model would simply be seen as the amount of resources(software and hardware, money) used.
Qadir and Adnan (2010) performed an evaluation on OpenNMS and Nagios by issuinga questionnaire to IT professionals. The questionnaire focused on how well the acpNMSperformed their functionality requirements. They also performed usability testing by in-stalling the applications in labs and using Network Management and TCP/IP students asthe testers.
In this research, OpenNMS generally performed better than Nagios, in both functional-ity and usability.
1.4 LANs
A LAN is a usually privately owned network that connects devices in a restricted geo-graphic area (Forouzan, 2007). Many companies use a LANwithin their organisation. LANscan be used to share hardware (such as printers), files, and software between many com-puters (Mikalsen & Borgesen, 1997/2002; Forouzan, 2007).
A companymay, for example, run a local file server on their LAN. In this case, employeesin the office should be able to access the file server and retrieve or modify files. However,good security practices are that there is no outside access to the LAN or its services.
1.5 Hardware
The point of this project is to monitor a network that does not allow inbound accessthrough the Internet, and in order to do this we need to send information from inside thenetwork rather than collecting it from outside the network.
In order to install a piece of hardware on a network, it is first required to knowwhat thishardware will be. A full desktop computer is unsuitable; it is too sizeable which makes itdifficult and expensive to transport, and generally costs over £100.
Schroder (2007) demonstrates a solution to this problem; her book shows how to buildrouters, firewalls, and wireless access points using a Linux based on-board computer. AsSchroder (2007) mentions, these machines are not nearly as powerful as regular desktopmachines, but they can still run the required software. What is more, they have been get-ting more and more powerful in time; for example the Raspberry Pi 2 has a 900MHz pro-cessor and 1GB of RAM on a £30 board the size of a credit card (Raspberry Pi Foundation,n.d.-a).
CHAPTER 1. RESEARCH 17
Errietta Kostala Enhancing Local Area Network Monitoring
1.5.1 Raspberry Pi 2
The Raspberry Pi 2 is the latest model, released in February 2015 (Raspberry Pi Founda-tion, n.d.-a). It has considerable computing power with a 900MHz quad-core processorand 1GB of RAM. Software-wise, the official Operating System is Raspbian, but it can sup-port a variety of Linux distributions that work in ARM architectures, as well as Windows10 IoT Core (Raspberry Pi Foundation, n.d.-b). At £30, it is also very affordable (Pi Swag CoLimited, n.d.), allowing a small company to purchase them at a big scale if needed.
1.5.2 BeagleBone/BeagleBoard
The BeagleBone black has a 1GHz Processor and 512MB RAM. The BeagleBoard X15 hasmuch better specs with a 1.5 GHz CPU and 2GB RAM (The BeagleBoard.org Foundation,2015), but unfortunately it has not yet been released (Coley, 2015).
1.5.3 BananaPi
A fork of the Raspberry Pi. It offers similar specifications, but it provides a gigabit eth-ernet adapter built-in (Banana Pi, 2014) unlike the Raspberry Pi (Geerling, 2015).
1.5.4 LinkSprite pcDuino
pcDuino 3B comes with 1GBps Ethernet built-in, a wifi adapter, and a SATA port(LinkSprite, n.d.-a). It can currently be imported from theUnited States for £44 (discountedprice) including shipping, but any import/customs tax must be taken into account as well(LinkSprite, n.d.-b).
1.5.5 Intel NUC
Intel NUC series computers aim to be a complete computer in a single box. They offermuch better specifications with 2 GB of RAM, USB v.3 ports, and gigabit ethernet (IntelCorporation, n.d.). However, the price raises to £292.86 (Amazon, 2015)
1.6 Development research
The applicationwill have to be a native application thatwill run directly on theOperatingSystem, which means the correct technologies must be considered. Furthermore, givenmost of the hardware researched above runs a Linux distribution, Linux support is anotherpoint to consider.
18 CHAPTER 1. RESEARCH
Enhancing Local Area Network Monitoring Errietta Kostala
1.6.1 Perl 5
”Perl is the Swiss Army chainsaw ofscripting languages: powerful andadaptable”
(Sheppard, 2000)
Perl 5 is an extensible programming language that can be used for many different pur-poses. There are thousands of Perl modules available on the Comprehensive Perl ArchiveNetwork (CPAN), including the databasewrapermodule DBiX and theMVCweb frameworkCatalyst, allowing each Perl project to be developed and designed as needed. Modules suchas Perl’s IO::All and LWP::UserAgent make networking and working with files, which thisproject will use, very simple.
Perl originally grew in popularity and use because its creator, Larry Wall, asked for ad-vice and opinions on Usenet, and got contributors involved early on. This is one of the rea-sons for the size of Perl’s community and CPAN contributions (Schwartz, Foy, & Phoenix,2011).
Perl modules can be pure Perl code, or depend on C code. Modules that are pure perlare straightforward to install, while C codemodules might require installing other librariesbefore they can be installed (Wall, Christiansen, & Orwant, 2000).
Perl modules can be installed with a simple command, for example to installLWP::UserAgent:
cpan LWP: : UserAgent
1.6.2 SQLite
This project requires data sources for two purposes: a. storing monitoring configura-tion and b. storing monitoring data until it is sent back to the online server.
Using an SQL database would allow finding and accessing data in a structured commandusing text commands. However, most database systems require server installation andconfiguration, which would complicate the process. Because of this, SQLite would be anideal choice for the project. SQLite does not run on a dedicated program, but insteadSQLite libraries runwithin the code of the program they are used in, and store the databasein that program’s directory. This makes it an extremely portable and lightweight solutionthat is easy to deploy: no additional software is installation or configuration is required.SQLite libraries exist for many languages, including C, Java, Ruby, and Perl (Owens & Allen,2006).
CHAPTER 1. RESEARCH 19
Errietta Kostala Enhancing Local Area Network Monitoring
1.7 LAN monitoring
From the NMSs disussed earlier, it is apparent that although OpenNMS is used for thelive ShadowNMS platform, it would not be ideal for this project. It consumes too manyresources to run on a single-board computer like the Raspberry Pi, it comes with manyfeatures that will not be needed, it is difficult to install on a Raspberry pi, and it is notsuited with any LAN monitoring abilities.
Nagios would be a more suitable system to use. Rather than running a nagios server,however, this project could use the plug-ins (which are just regular applications in thesystem) when and as configured. This application would therefore be a LAN-monitoringNMS that uses Nagios plugins to do the monitoring.
1.8 Remote access
As explained, the projects expects there to be no incoming access to the LAN, and limited(web only) outgoing access. Sending monitoring data to the Internet is still possible in thissetup, but there is also the need to be able to access the hardware system running theapplication for diagnostics.
There needs to be a way to interact with the remote system through a Linux shell orsimilar proccess, being the administrator should be able to send commands which will runon the client system and get the result as a response back.
Usually, Secure Shell (SSH) is used. This is a secure protocol that allows the user to re-motely control a Linux system through the command line the sameway theywould controla system in front of them.
However, since there no in-coming access to the system is assumed for this project, aless direct method would have to be employed.
1.8.1 Reverse SSH tunnel
Since there is no incoming connection, a reverse SSH tunnel will have to be used.
Considering the target machine (T), a server machine that’s always online (A) and can beaccessed by (T) and (S), and the source machine(s) (S), the following are needed to build areverse SSH tunnel:
a) Outgoing SSH (or at least Secure Socket Layer (SSL)) access from (T) to (A).
b) Incoming SSH access to (A) from (T) and (S).
c) A local service running on (T).
20 CHAPTER 1. RESEARCH
Enhancing Local Area Network Monitoring Errietta Kostala
First, a local web server is ran on (T), which is easily donewith an application like Apache.The server will display diagnostics using Perl and a database connection.
Assuming (A) is running an SSH server that’s accessible from (S) and (T), (T) can start anSSH connection with reverse tunnelling. This technique allocates a port locally on (A) thatis used to route connections back to a port on (T).
For example, if this command is ran from (T):
ssh the . publ ic . server −R 8080: loca lhost :80
Now localhost:8080 on the.public.server is tunnelled to port 80 on (T). (S) can then use(A) as a tunnel or proxy to get to (T). For example, from (S):
ssh the . publ ic . server −D localhost :10000
Now, if a web browser running on the source (S) uses localhost:10000 as a socks proxyand navigates to localhost:8080, they will see port 80 on the public server (A), which is inturn forwarded to port 80 on the target (T) (Chamith, 2012; Brinckerhoff, 2011).
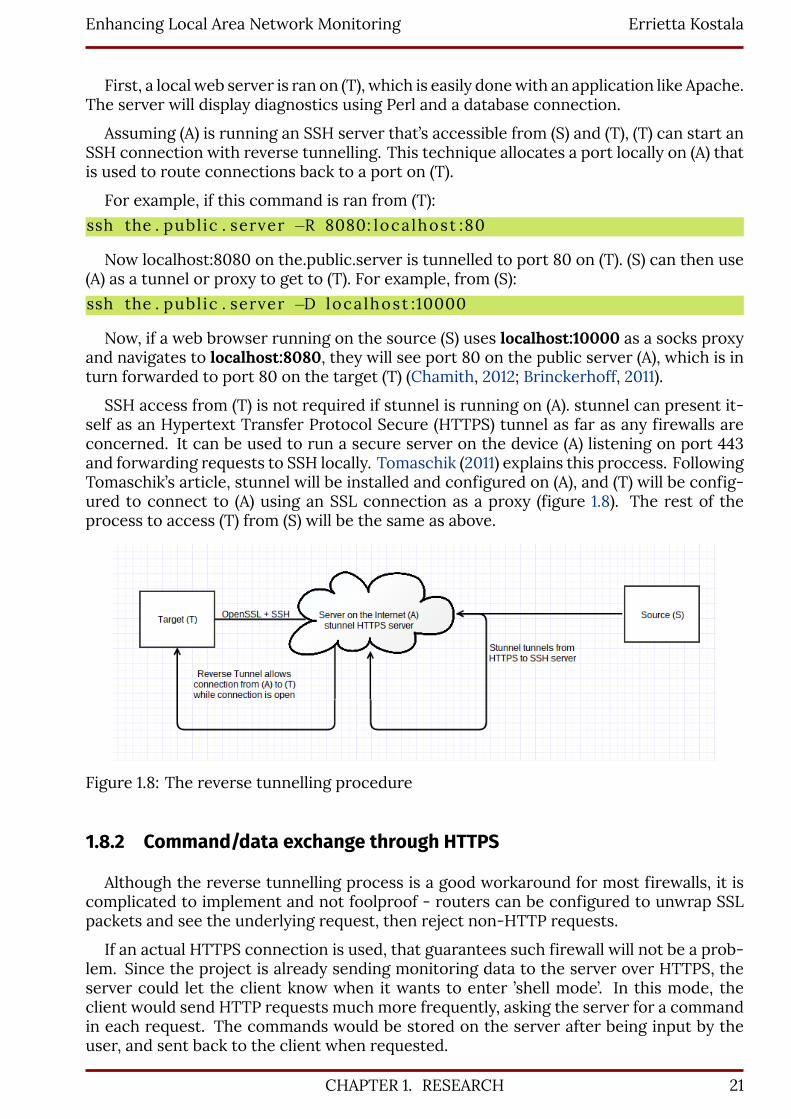
SSH access from (T) is not required if stunnel is running on (A). stunnel can present it-self as an Hypertext Transfer Protocol Secure (HTTPS) tunnel as far as any firewalls areconcerned. It can be used to run a secure server on the device (A) listening on port 443and forwarding requests to SSH locally. Tomaschik (2011) explains this proccess. FollowingTomaschik’s article, stunnel will be installed and configured on (A), and (T) will be config-ured to connect to (A) using an SSL connection as a proxy (figure 1.8). The rest of theprocess to access (T) from (S) will be the same as above.
Figure 1.8: The reverse tunnelling procedure
1.8.2 Command/data exchange through HTTPS
Although the reverse tunnelling process is a good workaround for most firewalls, it iscomplicated to implement and not foolproof - routers can be configured to unwrap SSLpackets and see the underlying request, then reject non-HTTP requests.
If an actual HTTPS connection is used, that guarantees such firewall will not be a prob-lem. Since the project is already sending monitoring data to the server over HTTPS, theserver could let the client know when it wants to enter ’shell mode’. In this mode, theclient would send HTTP requests much more frequently, asking the server for a commandin each request. The commands would be stored on the server after being input by theuser, and sent back to the client when requested.
CHAPTER 1. RESEARCH 21
Errietta Kostala Enhancing Local Area Network Monitoring
1.8.3 Long Polling
Long polling would be using an HTTP request, but this time waiting a specified for theweb server to respond (Pterneas, 2013). With long polling, the application could wait forthe server to request entering command mode with subsequent connections happeningif it does not get a request. Once the request is received, the application will keep usinglong polling and waiting for commands to execute on the operating system. A new pollingsession will start after each received command.
1.8.4 Web Sockets
TheWebSocket protocol allows two-way communication between a client and a server.The WebSocket connection is initiated with a handshake and stays open until the client orserver close it (Pterneas, 2013). With this technology, our application client would be ableto receive maintenance requests and system commands to execute and act upon them inreal time.
The best solution would be to use web sockets for maintenance mode, falling backto long polling, and finally simple HTTP requests, if not supported. However, the HTTPmethod will be developed first, moving up to long polling and finally web sockets as timeallows.
1.9 Authentication
The application can authenticate itself to the server with a password that is stored onthe client’s disk. However, passwords can sometimes be leaked when transferred overthe Internet, or brute forced given enough computing power, so they are not a full-proofmethod of authentication (Remaker, 2015).
Another concern is that for our case it is crucial not only that the client authenticatesitself to the server, but also the reverse happens. Aman-in-the-middle attack could other-wise take place where a malicious machine impersonates the server to collect monitoringdata that the client is sending (The Open Web Application Security Project, 2015).
In these circumstances, SSL is used to authenticate a server. The SSL certificate ischecked for validity against Certificate Authorities to verify that it is correct and has beenissued to the server in question (Cheng, 2012). Typically, the certificate checks consist of:
• Verifying the signature of a trusted issuer/certificate authority, which should bepresent in the SSL certificate and every intermediate certificate in the trust chain.
• Ensuring the certificate has not expired. Certificates are usually valid for a year, afterwhich period they need to be renewed.
• Ensure the hostname the certificate has been issued for matches the hostname ofthe server.For example, certificates for *.google.com are not valid for www.example.com.
22 CHAPTER 1. RESEARCH

Enhancing Local Area Network Monitoring Errietta Kostala
• Check if the certificate has been revoked. If a certificate key has been compromised,the first thing the user of the certificate should do is to request revocation. It is there-fore crucial to perform this step to prevent a forged certificate from being trusted.
(List by Ullrich (2015)).
Apart from using certificates to identify the server, it is also possible to use them forclient authentication and identification. SSL clients can provide the server with their owncertificate; by checking this information against a list of trusted certificates, the server canidentify the client in a more foolproof method than passwords (Cheng, 2012). For example,startssl (https://startssl.com/) use client certificates for log-in instead of user name andpassword. The IO::Socket::SSL Perl module can be used in any Perl application, for bothSSL clients and servers, and it includes functionality to verify certificates.
CHAPTER 1. RESEARCH 23

Errietta Kostala Enhancing Local Area Network Monitoring
24 CHAPTER 1. RESEARCH
Enhancing Local Area Network Monitoring Errietta Kostala
2. Design process
2.1 Planning
2.1.1 Discussions with Matt Trout
During the design process, Matt Trout from Shadowcat Systems gave his insight onwhat is required from the client’s point of view. The minimum requirement was, naturally,monitoring configured services in the local network and sending this data to ShadowNMS’scloud servers. On an Internet Relay Chat (IRC) conversation on the 15th of October 2015,other features were established. In particular, Matt requested for automatic discoveryof devices and services on the network, event buffering so events can be resent after anoutage, SNMP integration, and a way to diagnose the system remotely.
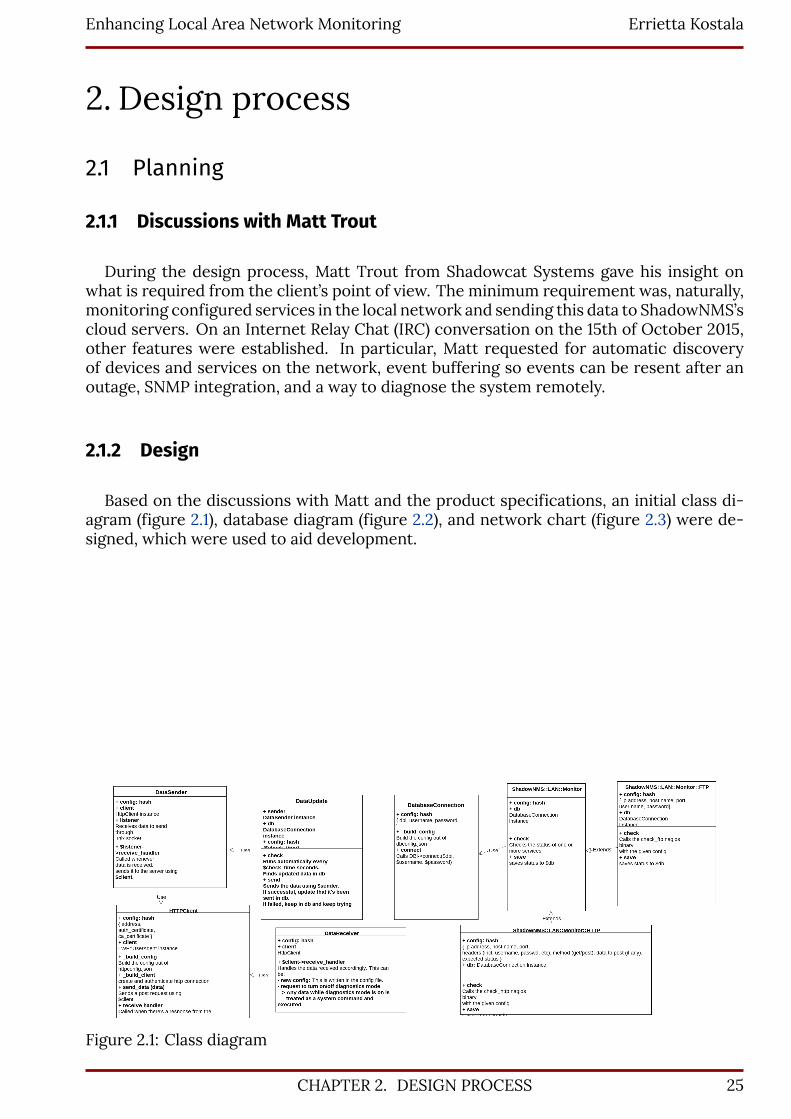
2.1.2 Design
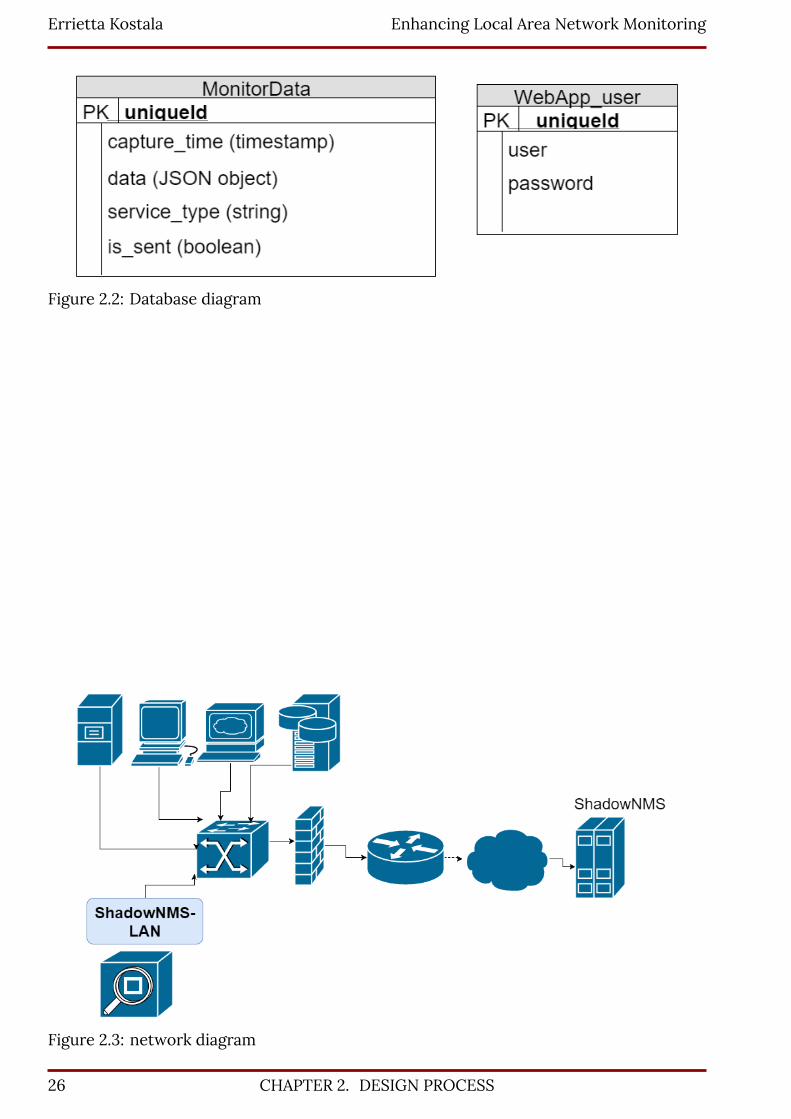
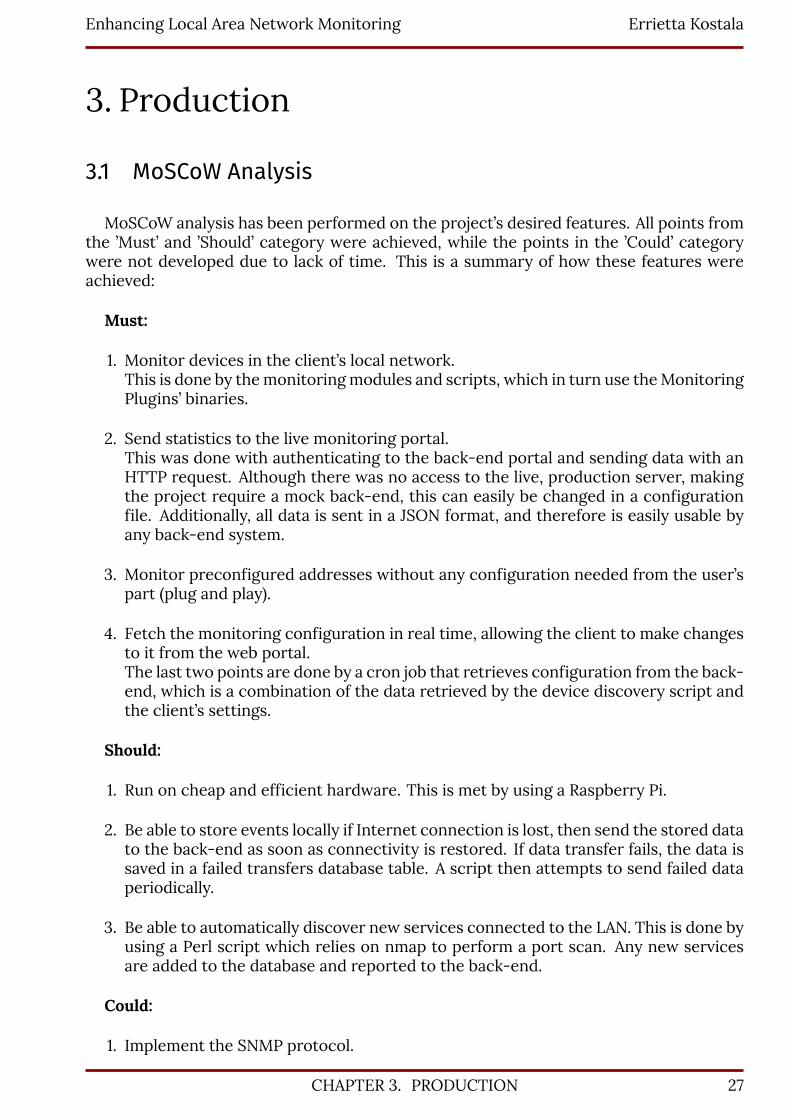
Based on the discussions with Matt and the product specifications, an initial class di-agram (figure 2.1), database diagram (figure 2.2), and network chart (figure 2.3) were de-signed, which were used to aid development.
Figure 2.1: Class diagram
CHAPTER 2. DESIGN PROCESS 25
Errietta Kostala Enhancing Local Area Network Monitoring
Figure 2.2: Database diagram
Figure 2.3: network diagram
26 CHAPTER 2. DESIGN PROCESS
Enhancing Local Area Network Monitoring Errietta Kostala
3. Production
3.1 MoSCoW Analysis
MoSCoW analysis has been performed on the project’s desired features. All points fromthe ’Must’ and ’Should’ category were achieved, while the points in the ’Could’ categorywere not developed due to lack of time. This is a summary of how these features wereachieved:
Must:
1. Monitor devices in the client’s local network.This is done by themonitoringmodules and scripts, which in turn use theMonitoringPlugins’ binaries.
2. Send statistics to the live monitoring portal.This was done with authenticating to the back-end portal and sending data with anHTTP request. Although there was no access to the live, production server, makingthe project require a mock back-end, this can easily be changed in a configurationfile. Additionally, all data is sent in a JSON format, and therefore is easily usable byany back-end system.
3. Monitor preconfigured addresses without any configuration needed from the user’spart (plug and play).
4. Fetch the monitoring configuration in real time, allowing the client to make changesto it from the web portal.The last two points are done by a cron job that retrieves configuration from the back-end, which is a combination of the data retrieved by the device discovery script andthe client’s settings.
Should:
1. Run on cheap and efficient hardware. This is met by using a Raspberry Pi.
2. Be able to store events locally if Internet connection is lost, then send the stored datato the back-end as soon as connectivity is restored. If data transfer fails, the data issaved in a failed transfers database table. A script then attempts to send failed dataperiodically.
3. Be able to automatically discover new services connected to the LAN. This is done byusing a Perl script which relies on nmap to perform a port scan. Any new servicesare added to the database and reported to the back-end.
Could:
1. Implement the SNMP protocol.
CHAPTER 3. PRODUCTION 27
Errietta Kostala Enhancing Local Area Network Monitoring
2. Offer a way for Shadowcat Systems to remotely access and diagnose the installedRaspberry Pi hardware if needed.
Won’t:
1. Inspect packets to further detect network errors. Due to privacy and legal issuesconcerned with deep packet inspection, this is not in the scope of this project.
2. Monitor the network’s cost efficiency.
3. Determine when maintenance is needed on network hardware.
4. Be concerned with configuration management à la Chef or Puppet.
3.2 Project Management
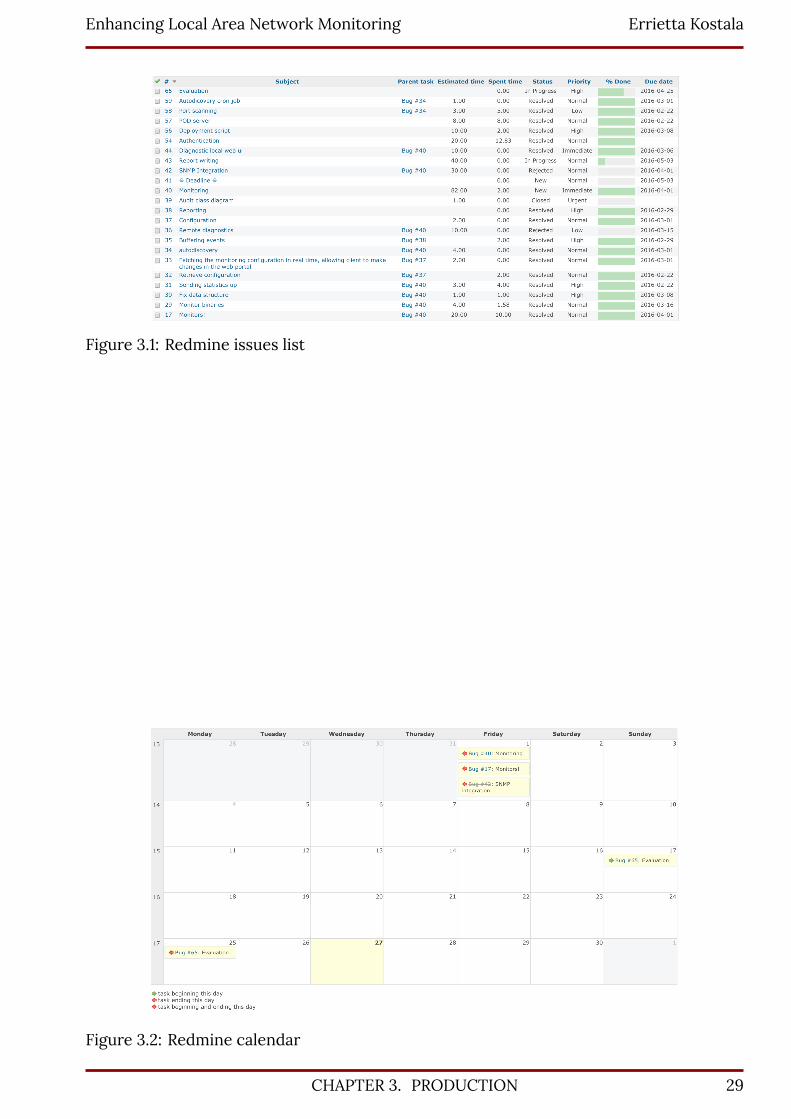
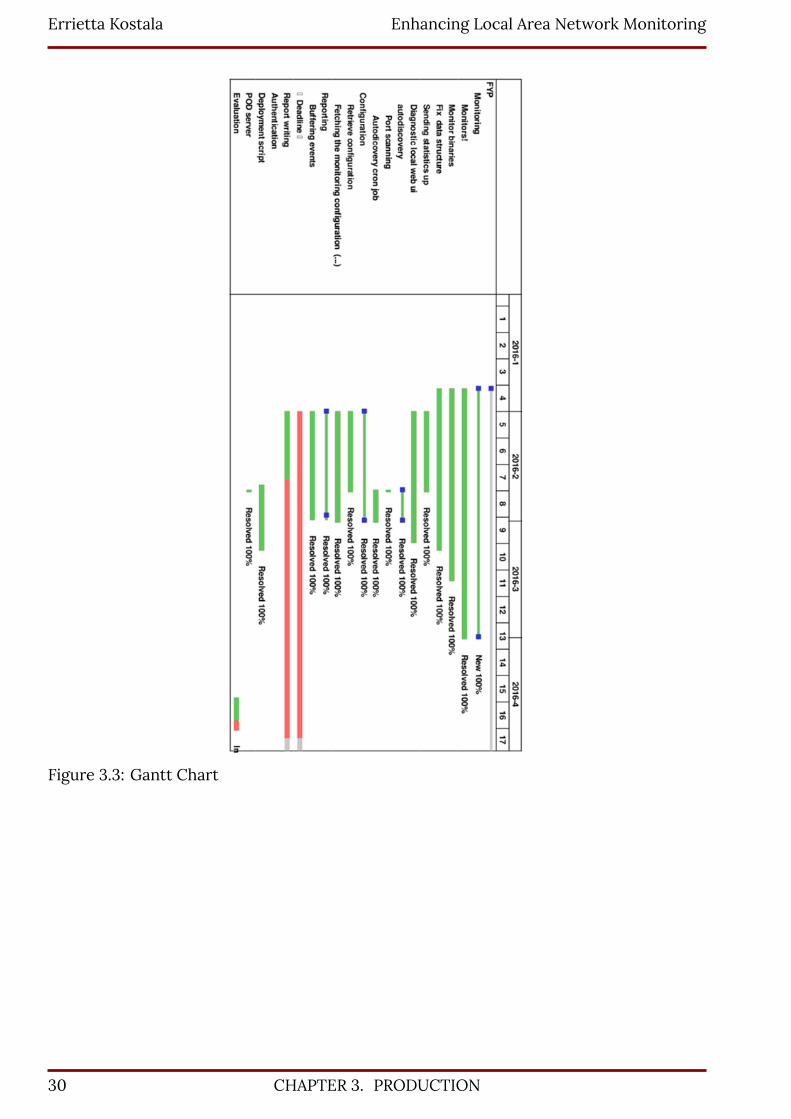
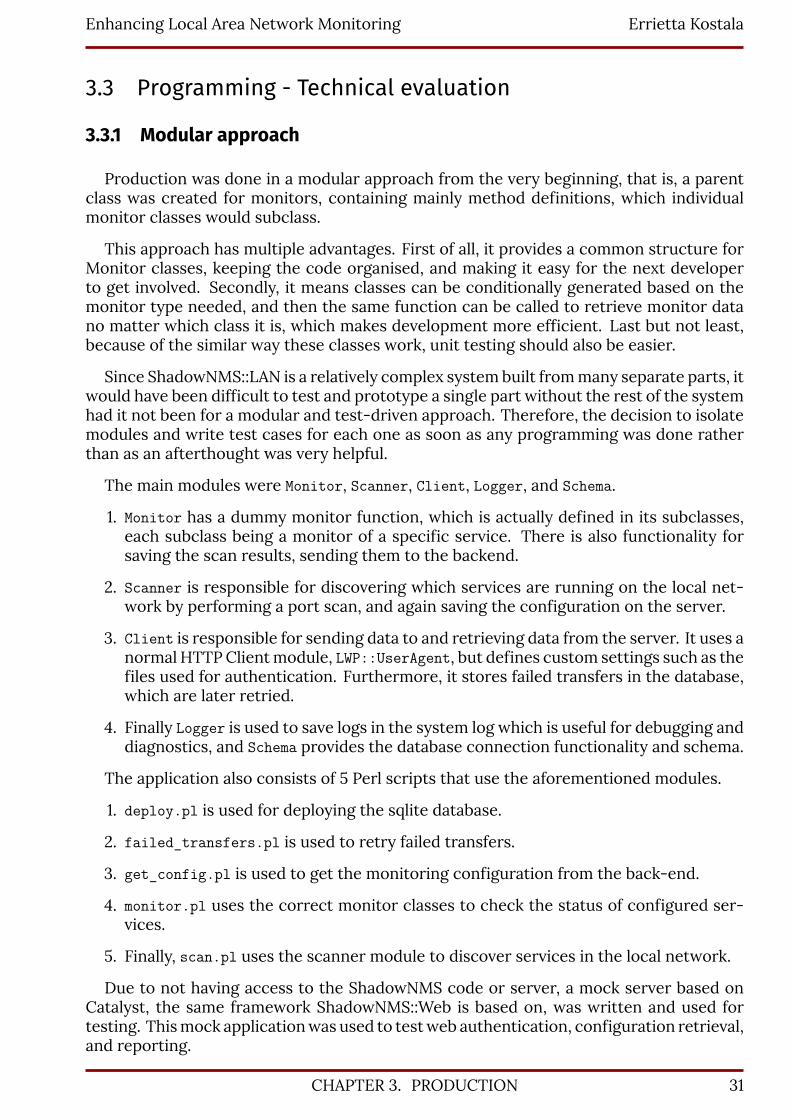
Project management was done using a web platform called Redmine. Issues were cre-ated, which stated the problem, its due date, priority, and expected completion time. Thetasks, their priorities, and their deadlines, were determined by taking into account theMoSCoW analysis in section 3.1.
When deciding which issue to take on next, the priority and completion time were con-sidered; that is, more urgent and less time-consuming issues were prioritised.
If an issue was not done in time due to having underestimated the work needed, run-ning into unexpected software issues, or personal issues, it was moved to the next mostreasonable deadline, while less needed issues were rejected as the deadline was closer.
Redmine also enabled for time tracking, which allowed for knowing if issues took asmuch time as expected, less, or more. That data was used to give more accurate timeestimates to issues created later on.
In the end, the issues that were rejectedwere SNMP integration and remote diagnostics,as theywere not part of theMinimumViable Product (MVP), and therewas not enough timeto implement them.
Overall, the use of project management software helped with keeping track of com-pleted and pending issues, as well as staying organised. However, there were quite a fewoccasions of the issue tracker not being updated right after a feature had been completed.This lead to needing to spend some timewhen starting towork each time to reflect onwhathad already been completed. Perhaps if the tool had been used more diligently, some timewould have been saved, which could be used to work on one of the rejected features.
Another thing that could be done better would be to set up notifications in redmine sothat a reminder would be sent when work was due. This may have further helped keeptrack of pending issues.
28 CHAPTER 3. PRODUCTION
Enhancing Local Area Network Monitoring Errietta Kostala
Figure 3.1: Redmine issues list
Figure 3.2: Redmine calendar
CHAPTER 3. PRODUCTION 29
Errietta Kostala Enhancing Local Area Network Monitoring
Figure 3.3: Gantt Chart
30 CHAPTER 3. PRODUCTION
Enhancing Local Area Network Monitoring Errietta Kostala
3.3 Programming - Technical evaluation
3.3.1 Modular approach
Production was done in a modular approach from the very beginning, that is, a parentclass was created for monitors, containing mainly method definitions, which individualmonitor classes would subclass.
This approach has multiple advantages. First of all, it provides a common structure forMonitor classes, keeping the code organised, and making it easy for the next developerto get involved. Secondly, it means classes can be conditionally generated based on themonitor type needed, and then the same function can be called to retrieve monitor datano matter which class it is, which makes development more efficient. Last but not least,because of the similar way these classes work, unit testing should also be easier.
Since ShadowNMS::LAN is a relatively complex system built frommany separate parts, itwould have been difficult to test and prototype a single part without the rest of the systemhad it not been for a modular and test-driven approach. Therefore, the decision to isolatemodules and write test cases for each one as soon as any programming was done ratherthan as an afterthought was very helpful.
The main modules were Monitor, Scanner, Client, Logger, and Schema.
1. Monitor has a dummy monitor function, which is actually defined in its subclasses,each subclass being a monitor of a specific service. There is also functionality forsaving the scan results, sending them to the backend.
2. Scanner is responsible for discovering which services are running on the local net-work by performing a port scan, and again saving the configuration on the server.
3. Client is responsible for sending data to and retrieving data from the server. It uses anormal HTTPClientmodule, LWP::UserAgent, but defines custom settings such as thefiles used for authentication. Furthermore, it stores failed transfers in the database,which are later retried.
4. Finally Logger is used to save logs in the system log which is useful for debugging anddiagnostics, and Schema provides the database connection functionality and schema.
The application also consists of 5 Perl scripts that use the aforementioned modules.
1. deploy.pl is used for deploying the sqlite database.
2. failed_transfers.pl is used to retry failed transfers.
3. get_config.pl is used to get the monitoring configuration from the back-end.
4. monitor.pl uses the correct monitor classes to check the status of configured ser-vices.
5. Finally, scan.pl uses the scanner module to discover services in the local network.
Due to not having access to the ShadowNMS code or server, a mock server based onCatalyst, the same framework ShadowNMS::Web is based on, was written and used fortesting. Thismock applicationwas used to testweb authentication, configuration retrieval,and reporting.
CHAPTER 3. PRODUCTION 31
Errietta Kostala Enhancing Local Area Network Monitoring
3.3.2 Sustainability
Different people mean different things when they refer to software sustainability. How-ever, the term needs to be defined when undergoing research (Venters et al., 2014). For thepurposes of this document, sustainability refers to, as described by Venters et al. (2014) ”ameasure of a system’s extensibility, interoperability, maintainability, portability, reusabil-ity, scalability, and usability.”
Because of the aforementionedmodular approach, learning andmodifying the softwareshould be extremely easy for a third party to achieve. New monitoring modules can beadded almost entirely independently of the rest of the program as long as they use specificfunction names. Furthermore, monitoring modules can be removed simply by moving orremoving the corresponding file without compromising any other functionality.
Other modules are also easy to edit and replace. For example, the port scanning func-tionality, which currently uses the SubnetFindermodule to determine the network to scan,could be modified to use a pre-determined network provided by the client.
Themodular nature of the application, described above, addresses the the extensibility,interoperability,maintainability, and reusability parts of sustainability.
Portability is not required for this project as it is meant to be ran on a Raspberry Pi.That being said, any Linux environment can run the software as long as the monitoringplug-ins, nmap, and a modern version of Perl are available.
The system is horizontally scalable by adding more monitoring devices and modifyingthe cron jobs so that they are ran at different times for each devices. Since the monitoringdevices cost about £30, this is an attainable method of scaling.
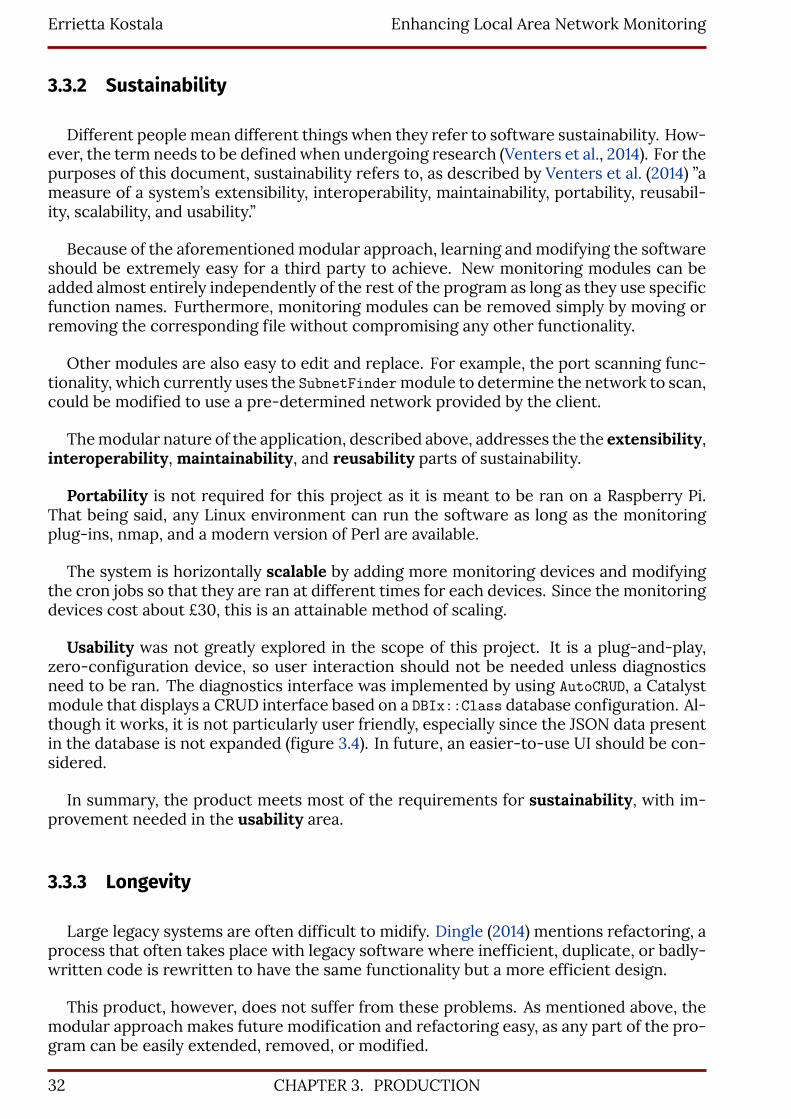
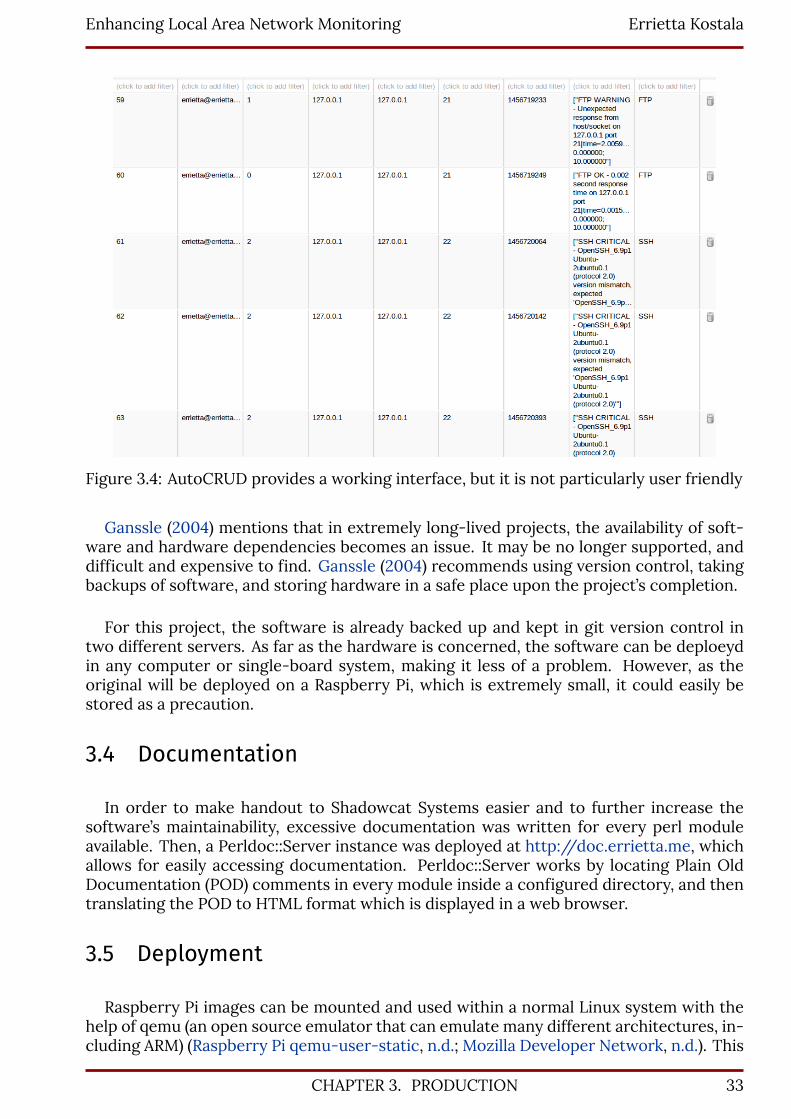
Usability was not greatly explored in the scope of this project. It is a plug-and-play,zero-configuration device, so user interaction should not be needed unless diagnosticsneed to be ran. The diagnostics interface was implemented by using AutoCRUD, a Catalystmodule that displays a CRUD interface based on a DBIx::Class database configuration. Al-though it works, it is not particularly user friendly, especially since the JSON data presentin the database is not expanded (figure 3.4). In future, an easier-to-use UI should be con-sidered.
In summary, the product meets most of the requirements for sustainability, with im-provement needed in the usability area.
3.3.3 Longevity
Large legacy systems are often difficult to midify. Dingle (2014) mentions refactoring, aprocess that often takes place with legacy software where inefficient, duplicate, or badly-written code is rewritten to have the same functionality but a more efficient design.
This product, however, does not suffer from these problems. As mentioned above, themodular approach makes future modification and refactoring easy, as any part of the pro-gram can be easily extended, removed, or modified.
32 CHAPTER 3. PRODUCTION
Enhancing Local Area Network Monitoring Errietta Kostala
Figure 3.4: AutoCRUD provides a working interface, but it is not particularly user friendly
Ganssle (2004) mentions that in extremely long-lived projects, the availability of soft-ware and hardware dependencies becomes an issue. It may be no longer supported, anddifficult and expensive to find. Ganssle (2004) recommends using version control, takingbackups of software, and storing hardware in a safe place upon the project’s completion.
For this project, the software is already backed up and kept in git version control intwo different servers. As far as the hardware is concerned, the software can be deploeydin any computer or single-board system, making it less of a problem. However, as theoriginal will be deployed on a Raspberry Pi, which is extremely small, it could easily bestored as a precaution.
3.4 Documentation
In order to make handout to Shadowcat Systems easier and to further increase thesoftware’s maintainability, excessive documentation was written for every perl moduleavailable. Then, a Perldoc::Server instance was deployed at http://doc.errietta.me, whichallows for easily accessing documentation. Perldoc::Server works by locating Plain OldDocumentation (POD) comments in every module inside a configured directory, and thentranslating the POD to HTML format which is displayed in a web browser.
3.5 Deployment
Raspberry Pi images can be mounted and used within a normal Linux system with thehelp of qemu (an open source emulator that can emulate many different architectures, in-cluding ARM) (Raspberry Pi qemu-user-static, n.d.; Mozilla Developer Network, n.d.). This
CHAPTER 3. PRODUCTION 33

Errietta Kostala Enhancing Local Area Network Monitoring
was done to prepare a custom image that would be used for this project based on the de-fault raspbian image. Perl, ShadowNMS-LAN, its configuration, and its dependencies wereinstalled on the image, and cron was configured to run the monitoring scripts mentionedearlier periodically.
The image could then be written into a (micro)SD card for a raspberry pi to use.
34 CHAPTER 3. PRODUCTION
Enhancing Local Area Network Monitoring Errietta Kostala
4. Testing and User Evaluation Research
4.1 Unit testing
As mentioned above, unit testing is an integral part of both the development and eval-uation of this application. It provides a quick way to test various scenaria without havingto configure monitor data and set up an entire LAN, as well as a verification of the finalproduct functioning correctly.
4.2 Technical testing
This will entail setting up a testing lab of different devices, and configuringShadowNMS::LAN to monitor and report data. Things like purposely taking devices/ser-vices offline can also be done to confirm reporting works.
(Xu et al., 2013)’s methodology would also be considered. Specifically, ShadowNMS::LANcould be set up and evaluated in comparison with another monitoring system, focusing onreliability of results, cost of the NMS in money and resources, effects on the network, andease of use.
4.3 User testing
It is possible that Shadowcat will be able to test the application with a client. However,the network/helpdesk team in University will also be asked to help test the application.
4.4 Results
Unit testing automatically reports results of passed/failed tests, as well as some per-formance reporting (how long each test took to run), while the technical test will be apredefined document of steps to take and expected results compared with actual results.For user testing, the user’s actions setting up the ShadowNMS::LAN hardware and usingthe reporting portal could be recorded, and then analysed to see if they could use all thefeatures. They could potentially be given a list of steps that they should try to achieveusing the software, so that they are not left in the dark.
User testing can also be used to determine whether the product is fit for purpose. Ifa team of network administrators used the product, for example, they would be askedwhether they would use it in addition to or instead of their current network managementsolution, and whether it is fit for purpose to be used in industry.
4.5 Changes to product
Changes would mainly be made after receiving feedback by testers and evaluating theproduct’s fitness for purpose. It may be determined that a feature that was thought im-portant is actually not used, and another feature that was not considered is requested bymany users, in which case development focus would shift towards providing that.
CHAPTER 4. TESTING AND USER EVALUATION RESEARCH 35

Errietta Kostala Enhancing Local Area Network Monitoring
36 CHAPTER 4. TESTING AND USER EVALUATION RESEARCH
Enhancing Local Area Network Monitoring Errietta Kostala
5. Evaluation
5.1 Virtual Network
Since the project requires the ability to monitor network services, a network is requiredto test it. Furthermore, it is important to know the state of the network, as well as be ableto put services online and offline for testing.
In order to achieve these goals without disturbing a production network and riskingworking with a network whose state can change by external factors (e.g. Internet con-nection goes down, a DDOS attack happens, another user disables a service, etc.), it wasdecided to set up a virtual network.
Virtual networks allow easily setting up an arbitrary number of nodes, without purchas-ing actual hardware. It also makes it easier to simulate worst case scenarios such as slowresponse times (Fagen, Cangussu, & Dantu, 2009).
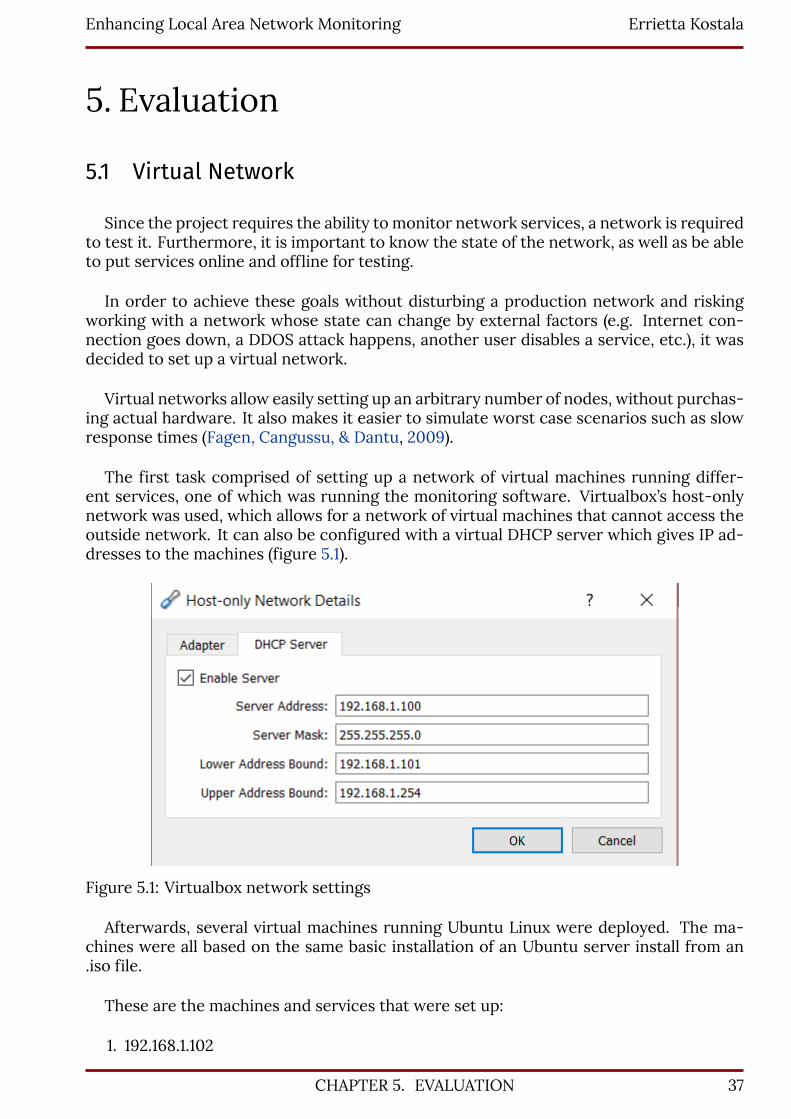
The first task comprised of setting up a network of virtual machines running differ-ent services, one of which was running the monitoring software. Virtualbox’s host-onlynetwork was used, which allows for a network of virtual machines that cannot access theoutside network. It can also be configured with a virtual DHCP server which gives IP ad-dresses to the machines (figure 5.1).
Figure 5.1: Virtualbox network settings
Afterwards, several virtual machines running Ubuntu Linux were deployed. The ma-chines were all based on the same basic installation of an Ubuntu server install from an.iso file.
These are the machines and services that were set up:
1. 192.168.1.102
CHAPTER 5. EVALUATION 37
Errietta Kostala Enhancing Local Area Network Monitoring
• HTTP on port 80
• SSH on port 22
• FTP on port 21
2. 192.168.1.103
• FTP on port 21
• SSH on port 22
3. 192.168.1.104
• IRC on ports 5000, 6666 - 6669 (Default charybdis configuration)
• SSH on port 22
• HTTP on port 8080
4. 192.168.1.101 - ShadowNMS::LAN Monitoring device
5. 192.168.1.107 - Backend
5.1.1 Test 1 - Discovery
The first test was simply ensuring that all the aforementioned services were discovered.This was done by running the scan script on the monitoring device and then checking theback-end’s database. As seen in 5.2, all of the above services were discovered. In additionto that, some other services running on 192.168.1.100 and 192.168.1.107 were discovered, butthey were not used for the purposes of this test.
5.1.2 Test 2 - Monitoring
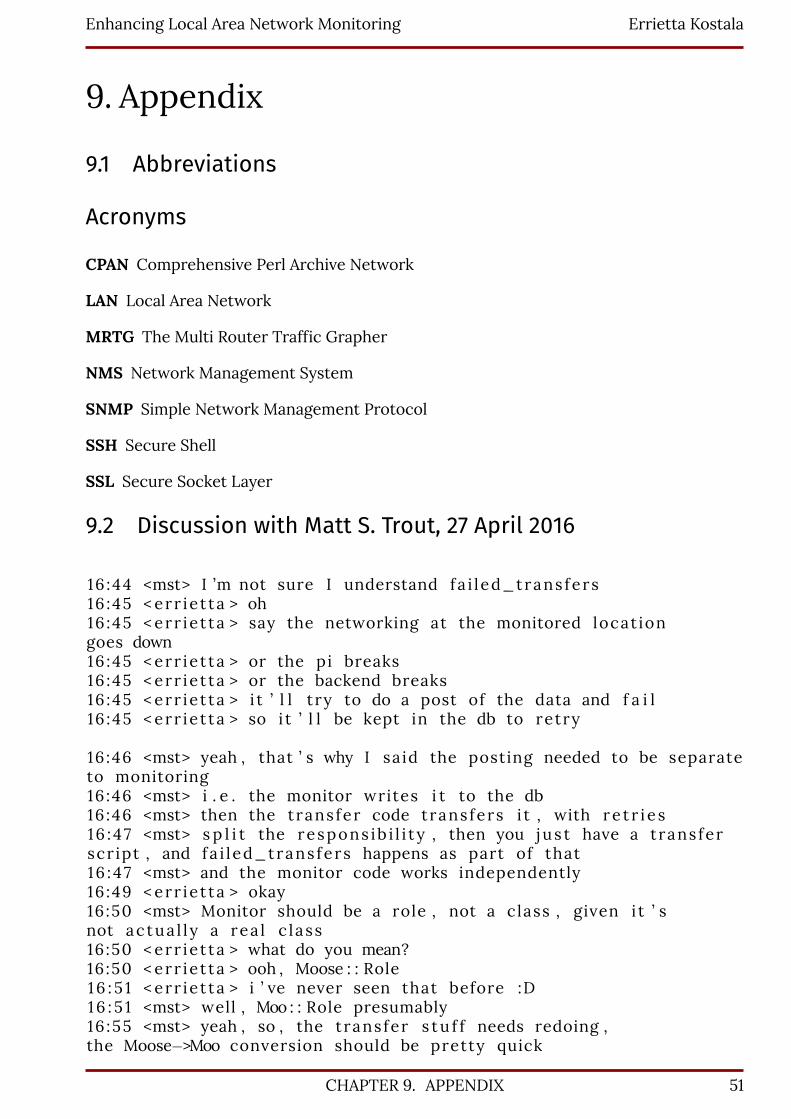
Once that was done, a series of tests based on different services being online and offlinewere carried out:
1. All services up. We should pick up OK responses for them all.
2. HTTP on 192.168.1.102 down, other services up
3. SSH on 192.168.1.102 down, other services up
4. HTTP and sshd on 192.168.1.102, ftp up
5. 192.168.1.102 completely down – all services should be down
6. FTP on 192.168.1.103 down and http on 192.168.1.102 down, all other services up
38 CHAPTER 5. EVALUATION
Enhancing Local Area Network Monitoring Errietta Kostala
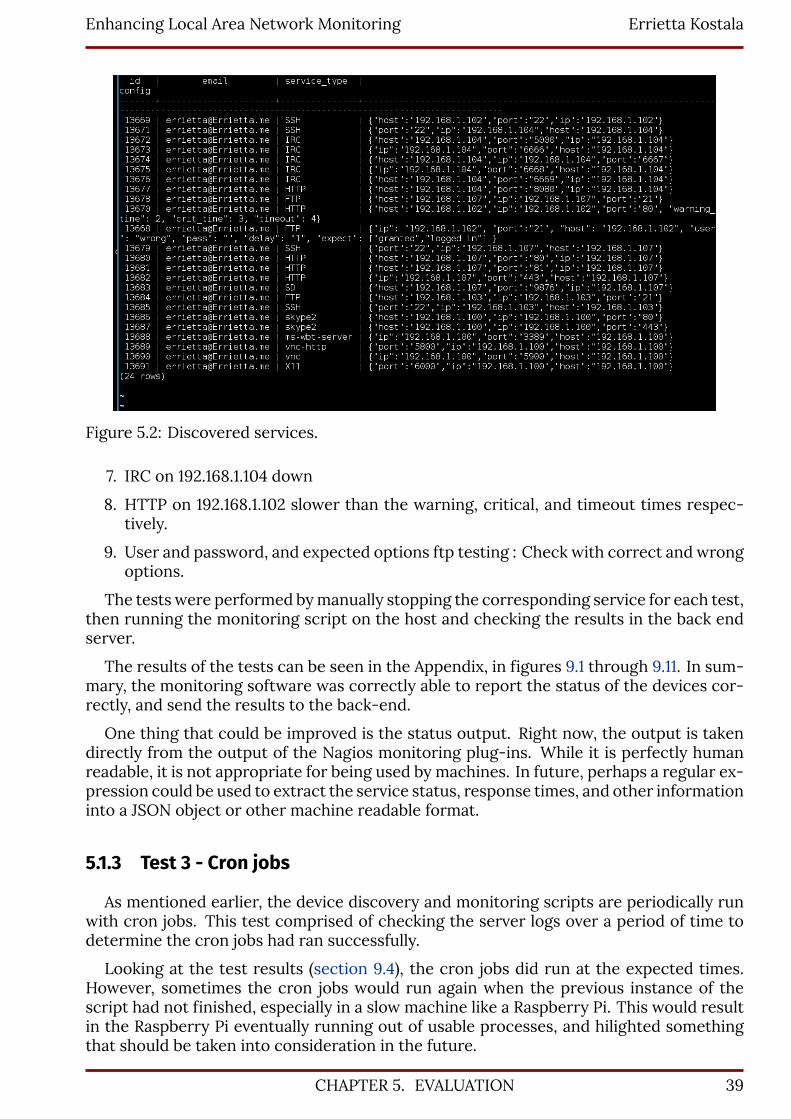
Figure 5.2: Discovered services.
7. IRC on 192.168.1.104 down
8. HTTP on 192.168.1.102 slower than the warning, critical, and timeout times respec-tively.
9. User and password, and expected options ftp testing : Check with correct and wrongoptions.
The tests were performed bymanually stopping the corresponding service for each test,then running the monitoring script on the host and checking the results in the back endserver.
The results of the tests can be seen in the Appendix, in figures 9.1 through 9.11. In sum-mary, the monitoring software was correctly able to report the status of the devices cor-rectly, and send the results to the back-end.
One thing that could be improved is the status output. Right now, the output is takendirectly from the output of the Nagios monitoring plug-ins. While it is perfectly humanreadable, it is not appropriate for being used by machines. In future, perhaps a regular ex-pression could be used to extract the service status, response times, and other informationinto a JSON object or other machine readable format.
5.1.3 Test 3 - Cron jobs
As mentioned earlier, the device discovery and monitoring scripts are periodically runwith cron jobs. This test comprised of checking the server logs over a period of time todetermine the cron jobs had ran successfully.
Looking at the test results (section 9.4), the cron jobs did run at the expected times.However, sometimes the cron jobs would run again when the previous instance of thescript had not finished, especially in a slow machine like a Raspberry Pi. This would resultin the Raspberry Pi eventually running out of usable processes, and hilighted somethingthat should be taken into consideration in the future.
CHAPTER 5. EVALUATION 39
Errietta Kostala Enhancing Local Area Network Monitoring
5.2 Unit Testing
These are the tests that were ran. The complete log of running the tests can be foundin section 9.5
1. Service up/down status and response times are recorded.
2. Configurations of different ports are honored.
3. Content detection (HTTP, FTP)
4. FTP log in
5. Response time detection.
5.3 Three-way evaluation
Evaluation models were mentioned earlier in chapter 1. Specifically, the one mentionedby Macia-Perez et al. (2014) is used due to not requiring as long-term use of the system asother models. The evaluation, explained in chapter 1, yields the following results:
• Conceptual ModelShadowNMS::LAN meets the requirements of being able to detect when services anddevices are added to the network, recording response content, response times, anddowntimes, and re-attempting to send failed data. It therefore is fit for purpose asfar as the MVP is concerned. Shadowcat’s directors, Mark Keating and Matt Trout,have also said that they find the functionality fit for purpose, and that they will useat minimum the service discovery code.
• Functional ModelIn a 72 hour unattended test of the software on a 5-device test network, data wascontinuously recorded, and no manual interventions had to be made. However, thisis not enough evidence to prove the amount of manual work required, as the trafficstrains and size of a real network were not present in the test. As mentioned earlier,however, the system can be horizontally expanded easily and with negligible cost toadapt to bigger networks, which should circumvent problems that arise from loadrelating to network size.
• Architectural ModelThere are three parts to this model:
1. Software - all software used was free and Open Source.
– Debian Linux
– Perl ShadowNMS::LAN depends on 20 relatively small Perl modules. Even ona slow system, it should take under an hour to install the modules
– Virtualbox Used for testing only, Virtualbox assisted in setting up a virtualnetwork.
40 CHAPTER 5. EVALUATION
Enhancing Local Area Network Monitoring Errietta Kostala
2. Hardware
– Raspberry Pi - used for the monitoring device as well as the testing nodes.
– A network switch.
3. Money
– Raspberry Pi - £30 each.
– Network switch - £30 - most businesses should already own a switch orrouter for their network
In summary, the architecture is sustainable, straight-forward to set up, and afford-able by any small business.
5.4 Feedback by Matt S. Trout
Shadowcat Systems technical director Matt S. Trout had the following comments tomake about the code, when he responded on the 27th of April 2016:
• The data transfer needs to happen separately from the monitoring - currently doneas part of the same screen
• Moo should be used for Object Oriented Programming (OOP) code rather Moose, asit is far less resource intensive.
The second item is easily fixed, however the first one would need more of a rewrite orrefactor. Apart from that, however, Mr. Trout is satisfied with the code quality.
The entire conversation is recorded in the appendix, section 9.2.
5.5 Discussion with Darren Shaw
An informal discussion and interview was held with Darren Shaw, a Senior NetworkSystem Specialist at the University of Huddersfield on the 28th of April 2016. Mr. Shawgave a presentation of all the NMSs used in University:
• Solarwinds is used for monitoring application status and traffic. This is the closestfunctionality to what ShadowNMS::LAN provides.
• Meru/Fortinet networkmanagement is used tomonitor theWirelessNetwork status.
• Cacti is used for graphing resource usage on Ethernet connections.
• Nagios is used for CPU, RAM, and disk usage on the data centres.
An interesting observation made was that the University uses several NMSs rather thanusing a single one. According to Mr. Shaw, there’s no single NMS in the market that pro-vides all the required features.
His feedback on ShadowNMS::LANwas that it is not something theUniversitywould use,due to the lack of detailed information and the fact that the University needs to monitorthe actual network flow. However, his opinion is that it could be useful to a small business,depending on how much data they want to monitor.
CHAPTER 5. EVALUATION 41

Errietta Kostala Enhancing Local Area Network Monitoring
42 CHAPTER 5. EVALUATION
Enhancing Local Area Network Monitoring Errietta Kostala
6. Professional Issues
6.1 Nagios::Plugin VS. Nagios Enterprises
Originally, the software used for monitoring was going to be based on Nagios Enter-prises’ Nagios Plugins. However, there were legal disagreements between Nagios Enter-prises and the Nagios Plugins Open Source project, which were related to the use of theNagios trademark in conjuction with mentioning Nagios-enabled software (Trout, 2015).In addition to this, there was some disagreement between a fork of Nagios named Icingaand Nagios Enterprises, as the latter did not believe in the creation of a community-leadfork of their open source code (Friedrich, 2014).
This eventually resulted in every mention of Nagios removed from Open Source forksand related software, causing this project to move from the Nagios Enterprises-lead Na-gios Plugins to the open source https://www.monitoring-plugins.org/(Trout, 2015; Friedrich, 2014).
Since the plug-ins are open source software and there are no trademarks in the nameof Monitoring Plugins, any potential legal or copyright issues are avoided by using theMonitoring Plugins community fork rather than the Nagios Plugins.
CHAPTER 6. PROFESSIONAL ISSUES 43

Errietta Kostala Enhancing Local Area Network Monitoring
44 CHAPTER 6. PROFESSIONAL ISSUES
Enhancing Local Area Network Monitoring Errietta Kostala
7. Conclusion
Though the software design could be improved by splitting the data sending parts of thesoftware on to their ownmodule rather than part of theminitoring and discoverymodules,and the resource use could be reduced, the project was in general a success.
It met the technical requirements of automatically discovering devices in the networkand reporting on the uptime/downtime statistics of said devices, and sending this data toa central server. Additionally, it met the specification of being modular, easy to modify,and well-tested and documented.
Future improvements considered include modularising the data sending code to matchthe design of the rest of the product, making the cron jobs run only if the previous runhas finished to avoid a backlog on running scanning programs, and switching to the MooOOP system to reduce resource usage. The diagnostic UI could also be improved by havinga clearer user interface that displays the statistics in a more user-friendly format and byhaving charts on the statistics.
Another improvement for the further future would be to add more verbose monitoringfeatures, such asmonitoring RAM, CPU, and Network input/output. Adding those featurescould easily be done without interfering with the rest of the software due to the modularnature of the code mentioned above.
The fact that the project was evaluated both with unit testing, manual technical testing,and by interviewing potential users such as Shadowcat Systems and the Networks teamat University meant that data was collected on both the technical accuracy and stabilityof the product and how suitable it is according to users. The satisfactory results in bothmeant that the product was fit for purpose.
CHAPTER 7. CONCLUSION 45

Errietta Kostala Enhancing Local Area Network Monitoring
46 CHAPTER 7. CONCLUSION
Enhancing Local Area Network Monitoring Errietta Kostala
8. References
Abeck, S. (2009). Network management; know it all. Elsevier/Morgan Kaufmann Publish-ers.
Amazon. (2015). Intel NUC5i5RYK Desktop Mini PC (Silver/Black) - (Intel Core i5 i5-5250U1.60 GHz, HD Graphics 6000, DDR3l SDRAM). Retrieved from http://www.amazon.co.uk/dp/B00TXZSRC6/
Balog, T. (2010, Sept 16). Using OpenNMS Remote Monitor for Remote Polling. Retrieved5 Nov 2015, from http://www.adventuresinoss.com/2010/09/16/using-opennms-remote-monitor-for-remote-polling/
Banana Pi. (2014). Banana Pi - A Highend Single-Board Computer: Banana Pi. Retrievedfrom http://www.bananapi.org/p/product.html
Brinckerhoff, B. (2011). Reverse SSH tunneling: easier than port forwarding! Retrieved 7November 2015, from http://bbrinck.com/post/2318562750/reverse-ssh-tunneling-easier-than-port
Burgess, C. (2005). The nagios book. Retrieved 5 Nov 2015, from http://www.nagiosbook.org/PRE-RELEASE_The_Nagios_Book-05012006.pdf
Burgess, M. (2007). Principles of network and system administration. Chichester: Wiley.Burke, R. J. (2010). Network management concepts and practice: A hands-on approach.
US: Pearson Education, inc.Chamith, B. (2012, Mar 21). SSH Tunneling Explained. Retrieved 7 November 2015, from
https://chamibuddhika.wordpress.com/2012/03/21/ssh-tunnelling-explained/Cheng, E. (2012, Feb 8). An Introduction to Mutual SSL Authentication. Retrieved 13
Nov 2015, from http://www.codeproject.com/Articles/326574/An-Introduction-to-Mutual-SSL-Authentication
Coley, G. (2015).Embedded Linux Wiki. Retrieved Oct 31, 2015, from http://www.elinux.org/
Beagleboard:BeagleBoard-X15Ding, J. (2010). Advances in network management. Boca Raton, FL: Auerbach Publications.Dingle, A. (2014). Software Essentials: Design and Construction (Chapman & Hall/CRC
Innovations in Software Engineering and Software Development Series). Chapmanand Hall/CRC.
Fagen, W. A., Cangussu, J. W., & Dantu, R. (2009, Jan). A virtual environment for networktesting. Journal of Network and Computer Applications, 32(1), 184–214. doi: 10.1016/j.jnca.2008.03.008
Forouzan, B. A. (2007). Data communications and networking (4th ed.). New York, NY:McGraw-Hill.
Friedrich, M. (2014, Jan 23). Nagios -More drama for themama. Legen ... D(i)ary!. Retrieved26 April 2016, from http://www.legendiary.at/2014/01/23/nagios-more-drama-for-the-mama/
Ganssle, J. G. (2004, 08). Planning for longevity. Embedded Systems Programming, 17(8), 37-40. Retrieved 23 April 2016, from http://search.proquest.com/docview/218536972?accountid=11526
Geerling, J. (2015). Getting Gigabit Networking on a Raspberry Pi 2 and B+. Re-trieved from http://www.midwesternmac.com/blogs/jeff-geerling/getting-gigabit-networking
Groeneveld, F. (2012, Mar 8). Using Nagios to Monitor Multiple VirtualHosts. Re-trieved 10 Nov 2015, from http://frankgroeneveld.nl/2012/03/08/using-nagios-to-monitor-multiple-virtualhosts/
CHAPTER 8. REFERENCES 47
Errietta Kostala Enhancing Local Area Network Monitoring
Intel Corporation. (n.d.). Mini PC Intel®NUC Kit NUC5PGYH. Retrieved from http://www.intel.com/content/www/us/en/nuc/nuc-kit-nuc5pgyh.html
Jawale, C. (2014, Nov 18). Monitoring your servers with Nagios using NRPE and ELK stack.Retrieved 10 Nov 2015, from http://clogeny.com/2014/11/18/monitoring-servers-elk-stack-nrpe/
Keating, M. (2015, Jan 6). Monitor Everything. Retrieved 5 Nov 2015, from http://shadow.cat/blog/mark-keating/2015/02-shadownms-announce/
LinkSprite. (n.d.-a). Linksprite. Retrieved from http://www.linksprite.com/?page_id=782
LinkSprite. (n.d.-b). pcduino3b: A20 single board computer supports arduino program-ming. Retrieved from http://store.linksprite.com/pcduino3b-a20-single-board-computer-supports-arduino-programming/
Macia-Perez, F., Lorenzo-Fonseca, I., & Berna-Martinez, J. V. (2014, Apr). A formalframework for modelling complex network management systems. Journal of Networkand Computer Applications, 40, 255-269. Retrieved from http://dx.doi.org/10.1016/j.jnca.2013.09.017 doi: 10.1016/j.jnca.2013.09.017
Mauro, D. R., & Schmidt, K. J. (2013). Essential SNMP. Sebastopol, CA: O’Reilly.Mikalsen, A. B., & Borgesen, P. (2002). Local area network management, design and secu-
rity. Chichester: Wiley. (Reprinted from Drift av lokalnettverk; design og sikkerhet,1997, Tapir Akademisk Forlag)
Mozilla Developer Network. (n.d.). Virtual ARM Linux environment. MDN. Retrieved22 April 2016, from https://developer.mozilla.org/en-US/docs/Mozilla/Developer_guide/Virtual_ARM_Linux_environment
Nagios Enterprises. (n.d.-a). Nagios core. Retrieved from https://www.nagios.org/Nagios Enterprises. (n.d.-b). Nagios plugins. Retrieved from https://www.nagios.org/
projects/nagios-plugins/Nagios Enterprises. (n.d.-c). Ubuntu quickstart. Retrieved from https://assets.nagios
.com/downloads/nagioscore/docs/nagioscore/4/en/quickstart-ubuntu.htmlNorton, I. (2013, Oct 19). Documentation is hard, but what happens when you add the need
to make docs version specific? Retrieved 5 Nov 2015, from http://shadow.cat/blog/ian-norton/2013/October/documentation/
Oetiker, T. (2011). MRTG - Tobi Oetiker’s MRTG - The Multi Router Traffic Grapher. Re-trieved Oct 31, 2015, from http://oss.oetiker.ch/mrtg/
Owens, M., & Allen, G. (2006). The definitive guide to sqlite (second ed.). Berkeley, CA:Apress. Retrieved 6 Nov 2015, from http://dx.doi.org/10.1007/978-1-4302-0172-4doi: 10.1007/978-1-4302-0172-4
Pi Swag Co Limited. (n.d.). Raspberry Pi 2 Model B - Raspberry Pi Swag. Retrievedfromhttp://swag.raspberrypi.org/collections/frontpage/products/raspberry-pi-2-model-b
Pterneas, V. (2013). Getting Started with HTML5 WebSocket Programming. Birmingham,UK: Packt Publishing. Retrieved 9 Nov 2015, from http://site.ebrary.com/lib/uoh/detail.action?docID=10754108
Qadir, M., & Adnan, M. (2010). Comparative Analysis of two Open Source Network Mon-itoring Systems: Nagios & OpenNMS (Master Thesis, School of Computing, BlekingeInstitute of Technology, Karlskrona, Sweden). Retrieved 4 November, 2015, fromhttp://www.diva-portal.org/smash/get/diva2:830767/FULLTEXT01.pdf
Raspberry Pi Foundation. (n.d.-a). Raspberry Pi 2 Model B. Retrieved from https://www.raspberrypi.org/products/raspberry-pi-2-model-b/
Raspberry Pi Foundation. (n.d.-b). Raspberry Pi Downloads - Software for the RaspberryPi. Retrieved from https://www.raspberrypi.org/downloads/
48 CHAPTER 8. REFERENCES
Enhancing Local Area Network Monitoring Errietta Kostala
Raspberry Pi qemu-user-static. (n.d.).Debian Wiki. Retrieved 22 April 2016, from https://wiki.debian.org/RaspberryPi/qemu-user-static
Remaker, P. (2015, Oct 31). How do brute force attacks get around the is-sue of maximum password attempt limits? Retrieved 12 Nov 2015, fromhttps://www.quora.com/How-do-brute-force-attacks-get-around-the-issue-of-maximum-password-attempt-limits/answer/Phillip-Remaker
Schroder, C. (2007). Linux networking cookbook. Beijing; Farnham: O’Reilly.Schwartz, R. L., Foy, B. D., & Phoenix, T. (2011). Learning Perl (3rd ed.). Beijing;Farnham;:
O’Reilly Media.Sonney, K. (2010, Sept 15). OpenNMS Remote Polling – How I’m doing it. Retrieved
5 Nov 2015, from http://www.sonney.com/blog/2010/09/15/opennms-remote-polling-how-im-doing-it/
Sturdevant, C. (2005, August 8). Firm Trades on Open Source; Currenex is banking onNagios for systems, network management. eWeek, 22(31), P2.
Sykes, A. (2014, Feb 13). Stop using Nagios (so it can die peacefully). Retrieved 5Nov 2015, from http://www.slideshare.net/superdupersheep/stop-using-nagios-so-it-can-die-peacefully
The BeagleBoard.org Foundation. (2015). BeagleBoard.org - x15. Retrieved from http://beagleboard.org/x15
The Open Web Application Security Project. (2015, Aug 31). Man-in-the-middle attack.Retrieved 13 Nov 2015, from https://www.owasp.org/index.php/Man-in-the-middle_attack
The OpenNMS Project. (n.d.). The OpenNMS Project. Retrieved from http://www.opennms.org/
The OpenNMS Project. (2014). Remote Polling - OpenNMS. Retrieved from http://www.opennms.org/wiki/Remote_Polling
Tomaschik, D. (2011, Feb 19). SSH across a Layer 7 Filter. Retrieved 9 Nov 2015, fromhttps://systemoverlord.com/blog/2011/02/19/ssh-across-a-layer-7-filter/
Trout, M. S. (2015, Dec 14). Nagios::Plugin - Removed from CPAN by request of NagiosEnterprises, succeeded by Monitoring::Plugin. meta::cpan. Retrieved 26 April 2016,from https://metacpan.org/pod/Nagios::Plugin
Ullrich, S. (2015, Sept 20). IO::Socket::SSL. Retrieved 13 Nov 2015, from https://metacpan.org/pod/IO::Socket::SSL
Venters, C. C., Lau, L., Griffiths, M. K., Holmes, V., Ward, R. R., Jay, C., … Xu, J. (2014, Jul). Theblind men and the elephant: Towards an empirical evaluation framework for softwaresustainability. Journal of Open Research Software, 2(1). Retrieved 23 April 2016, fromhttp://dx.doi.org/10.5334/jors.ao doi: 10.5334/jors.ao
Wall, L., Christiansen, T., & Orwant, J. (2000). Programming Perl (3rd ed.). Sebastopol, CA:O’Reilly Media.
Xu, F., Shi, J., Chen, X., &Chow, K. (2013). A three-dimensional evaluationmodel for networkmanagement system. Procedia Computer Science, 17, 888-892. doi: 10.1016/j.procs.2013.05.113
CHAPTER 8. REFERENCES 49

Errietta Kostala Enhancing Local Area Network Monitoring
50 CHAPTER 8. REFERENCES
Enhancing Local Area Network Monitoring Errietta Kostala
9. Appendix
9.1 Abbreviations
Acronyms
CPAN Comprehensive Perl Archive Network
LAN Local Area Network
MRTG The Multi Router Traffic Grapher
NMS Network Management System
SNMP Simple Network Management Protocol
SSH Secure Shell
SSL Secure Socket Layer
9.2 Discussion with Matt S. Trout, 27 April 2016
16 :44 <mst> I ’m not sure I understand fa i led_transfers16 :45 <err ie t ta > oh16 :45 <err ie t ta > say the networking at the monitored locat iongoes down16 :45 <err ie t ta > or the pi breaks16 :45 <err ie t ta > or the backend breaks16 :45 <err ie t ta > i t ’ l l try to do a post of the data and f a i l16 :45 <err ie t ta > so i t ’ l l be kept in the db to retry
16 :46 <mst> yeah , that ’ s why I said the posting needed to be separateto monitoring16 :46 <mst> i . e . the monitor writes i t to the db16:46 <mst> then the transfer code transfers i t , with re t r i e s16 :47 <mst> s p l i t the respons ib i l i ty , then you jus t have a transferscr ipt , and fa i led_transfers happens as part of that16 :47 <mst> and the monitor code works independently16 :49 <err ie t ta > okay16:50 <mst> Monitor should be a role , not a class , given i t ’ snot actua l l y a rea l c lass16:50 <err ie t ta > what do you mean?16:50 <err ie t ta > ooh , Moose : : Role1 6 : 5 1 <err ie t ta > i ’ ve never seen that before :D16 : 5 1 <mst> well , Moo : : Role presumably16 :55 <mst> yeah , so , the transfer s tu f f needs redoing ,the Moose−>Moo conversion should be pretty quick
CHAPTER 9. APPENDIX 51
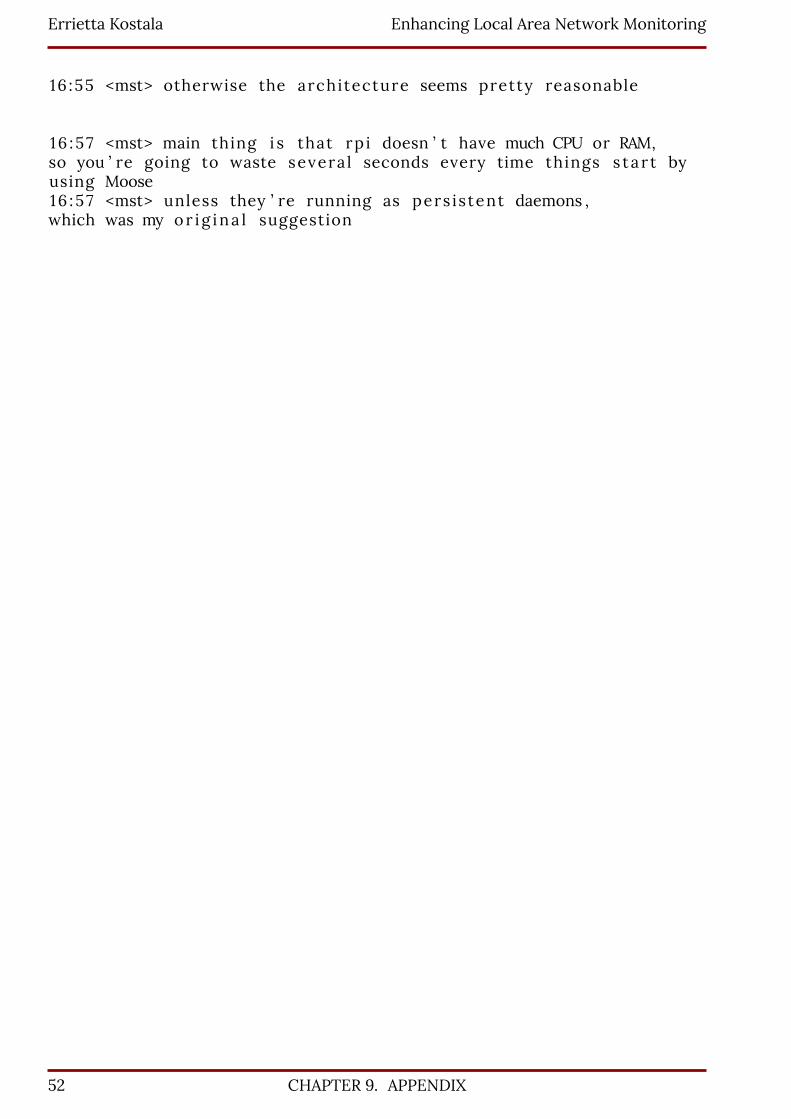
Errietta Kostala Enhancing Local Area Network Monitoring
16 :55 <mst> otherwise the architecture seems pretty reasonable
16 :57 <mst> main thing i s that rp i doesn ’ t have much CPU or RAM,so you ’ re going to waste severa l seconds every time things s tar t byusing Moose16 :57 <mst> unless they ’ re running as pers istent daemons ,which was my or ig ina l suggestion
52 CHAPTER 9. APPENDIX
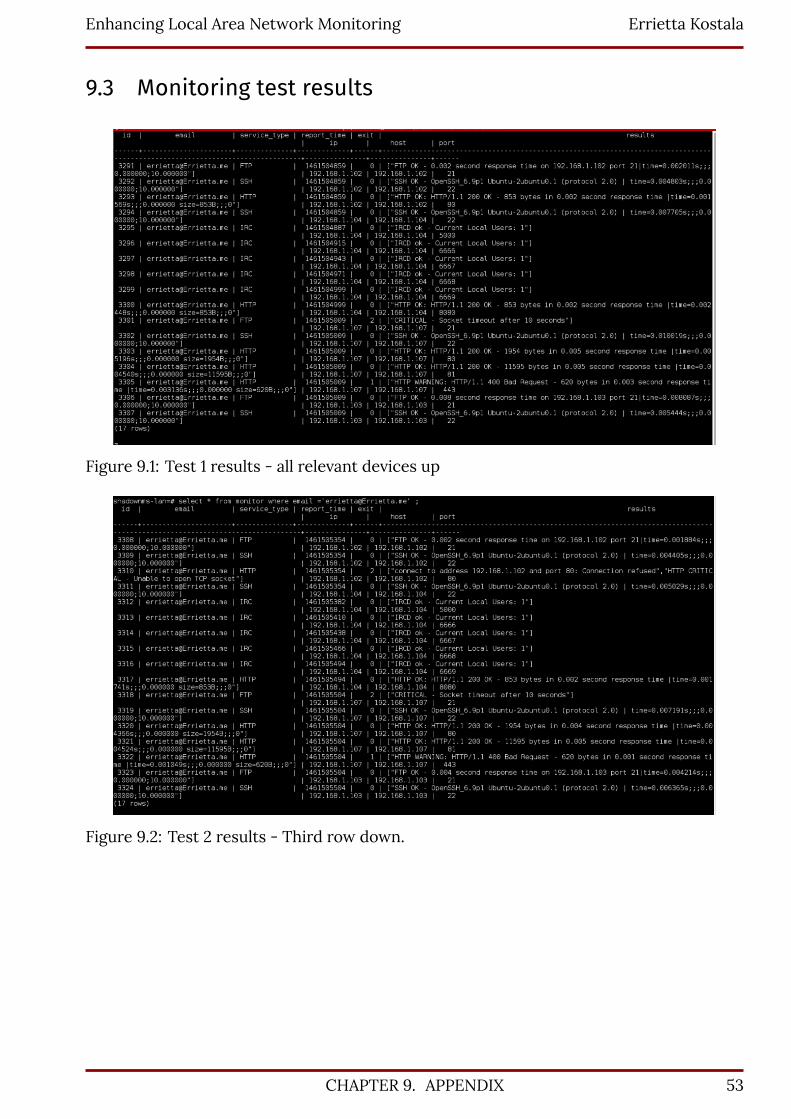
Enhancing Local Area Network Monitoring Errietta Kostala
9.3 Monitoring test results
Figure 9.1: Test 1 results - all relevant devices up
Figure 9.2: Test 2 results - Third row down.
CHAPTER 9. APPENDIX 53
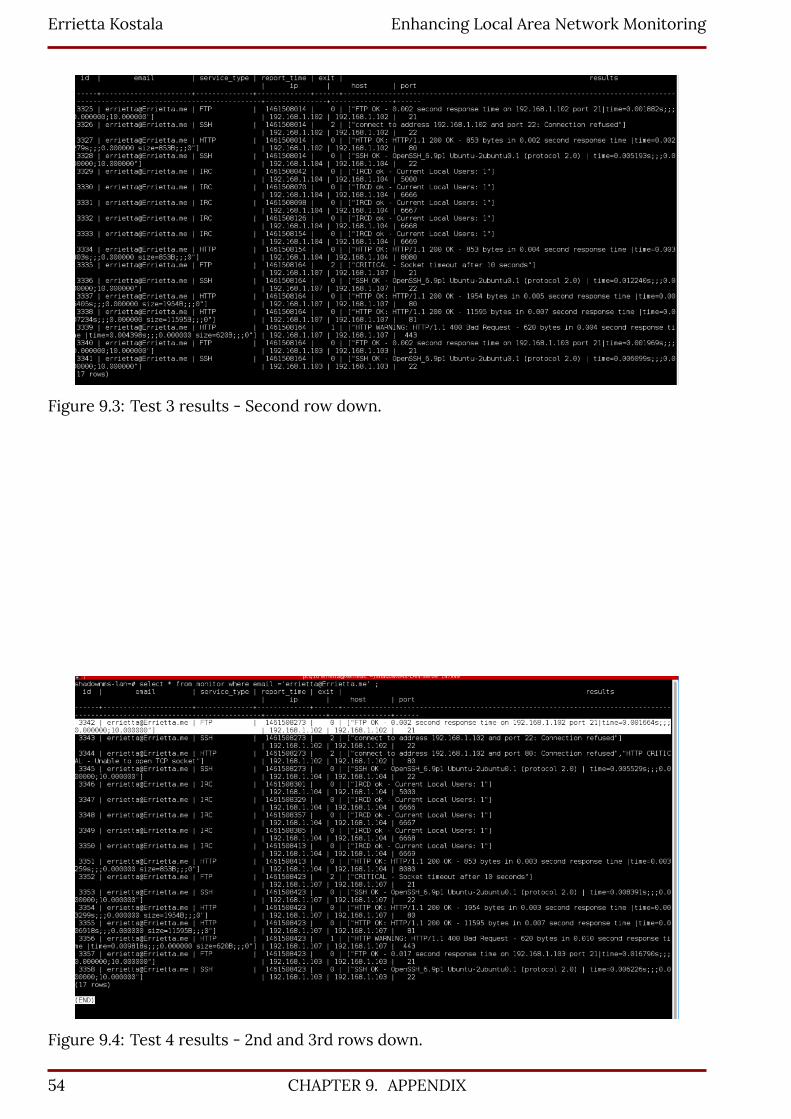
Errietta Kostala Enhancing Local Area Network Monitoring
Figure 9.3: Test 3 results - Second row down.
Figure 9.4: Test 4 results - 2nd and 3rd rows down.
54 CHAPTER 9. APPENDIX
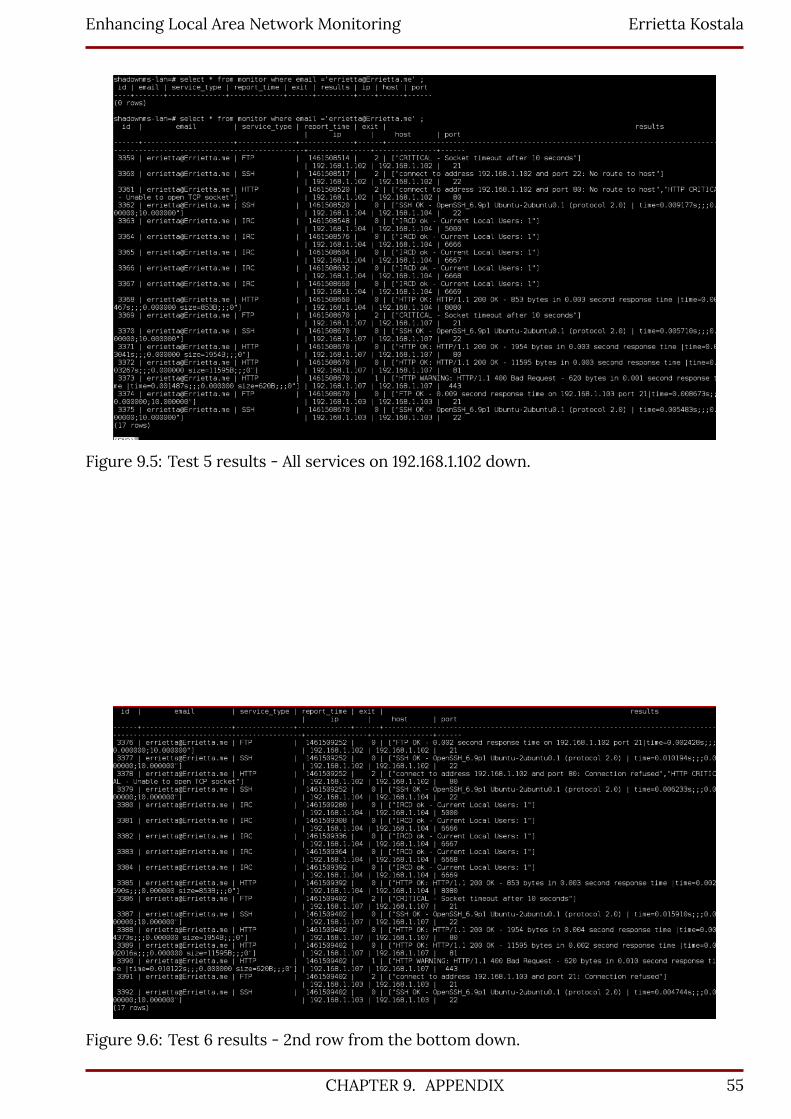
Enhancing Local Area Network Monitoring Errietta Kostala
Figure 9.5: Test 5 results - All services on 192.168.1.102 down.
Figure 9.6: Test 6 results - 2nd row from the bottom down.
CHAPTER 9. APPENDIX 55
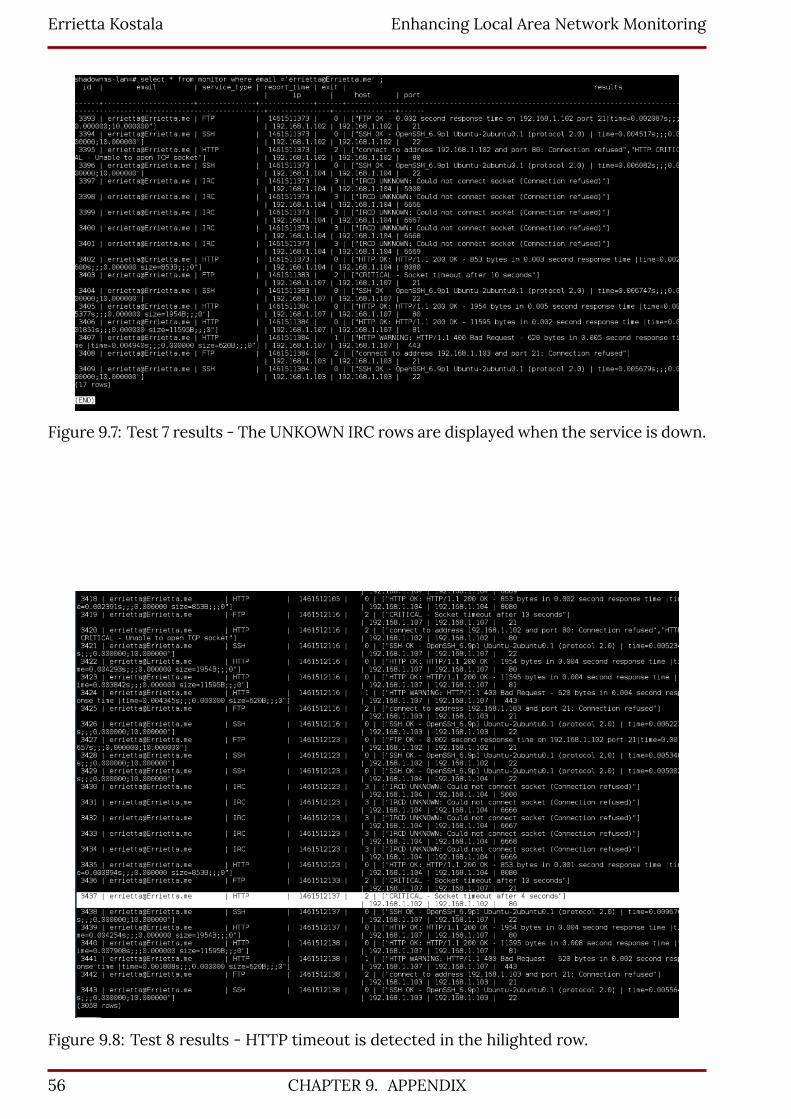
Errietta Kostala Enhancing Local Area Network Monitoring
Figure 9.7: Test 7 results - The UNKOWN IRC rows are displayed when the service is down.
Figure 9.8: Test 8 results - HTTP timeout is detected in the hilighted row.
56 CHAPTER 9. APPENDIX
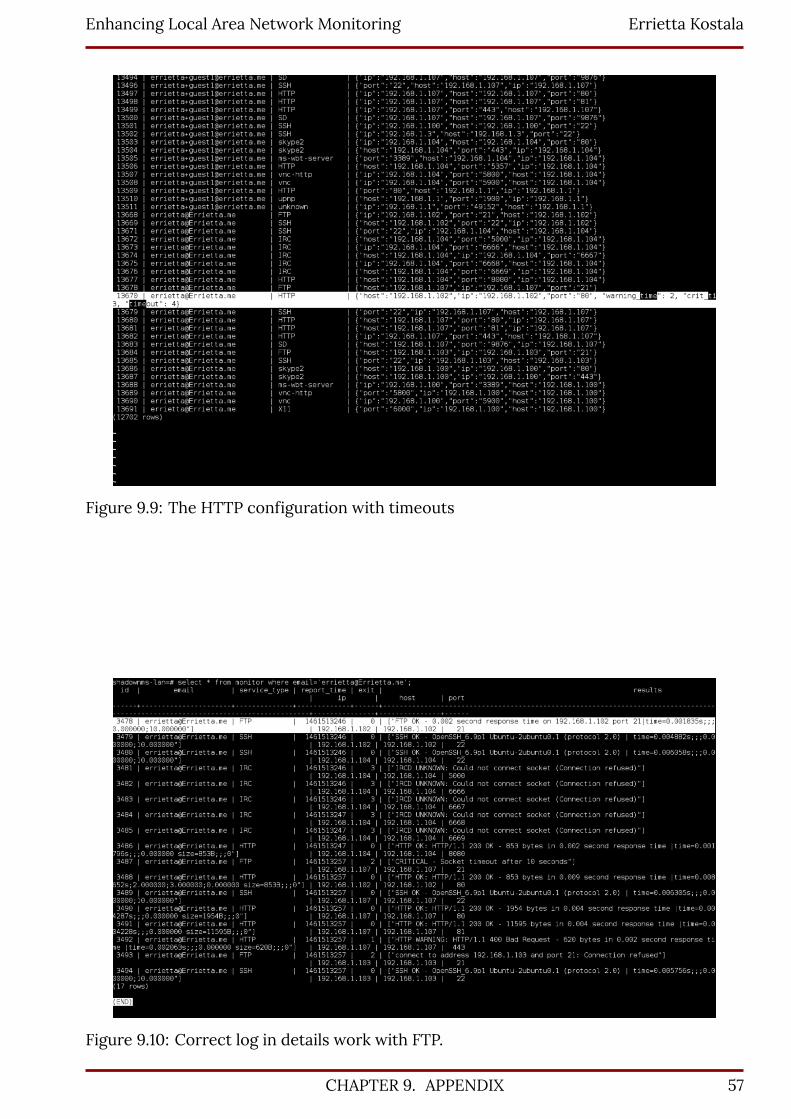
Enhancing Local Area Network Monitoring Errietta Kostala
Figure 9.9: The HTTP configuration with timeouts
Figure 9.10: Correct log in details work with FTP.
CHAPTER 9. APPENDIX 57
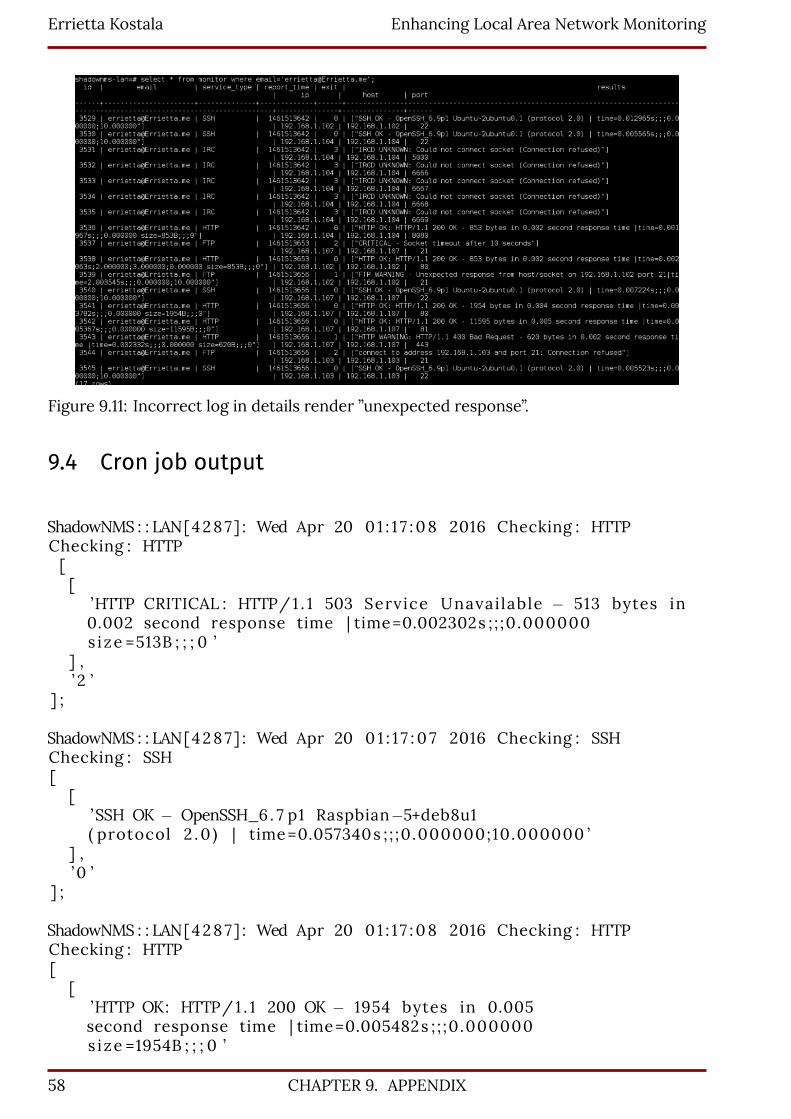
Errietta Kostala Enhancing Local Area Network Monitoring
Figure 9.11: Incorrect log in details render ”unexpected response”.
9.4 Cron job output
ShadowNMS : : LAN[4287 ] : Wed Apr 20 0 1 : 1 7 : 08 2016 Checking : HTTPChecking : HTTP[[
’HTTP CRITICAL : HTTP/1 . 1 503 Service Unavai lable − 513 bytes in0.002 second response time | time=0.002302s ; ; ;0.000000size =513B ; ; ; 0 ’
] ,’ 2 ’
] ;
ShadowNMS : : LAN[4287 ] : Wed Apr 20 0 1 : 1 7 : 0 7 2016 Checking : SSHChecking : SSH[
[’SSH OK − OpenSSH_6. 7 p1 Raspbian−5+deb8u1( protocol 2 .0 ) | time=0.057340s ; ; ;0.000000;10.000000 ’
] ,’ 0 ’
] ;
ShadowNMS : : LAN[4287 ] : Wed Apr 20 0 1 : 1 7 : 08 2016 Checking : HTTPChecking : HTTP[
[’HTTP OK: HTTP/1 . 1 200 OK − 1954 bytes in 0.005second response time | time=0.005482s ; ; ;0.000000size =1954B ; ; ; 0 ’
58 CHAPTER 9. APPENDIX
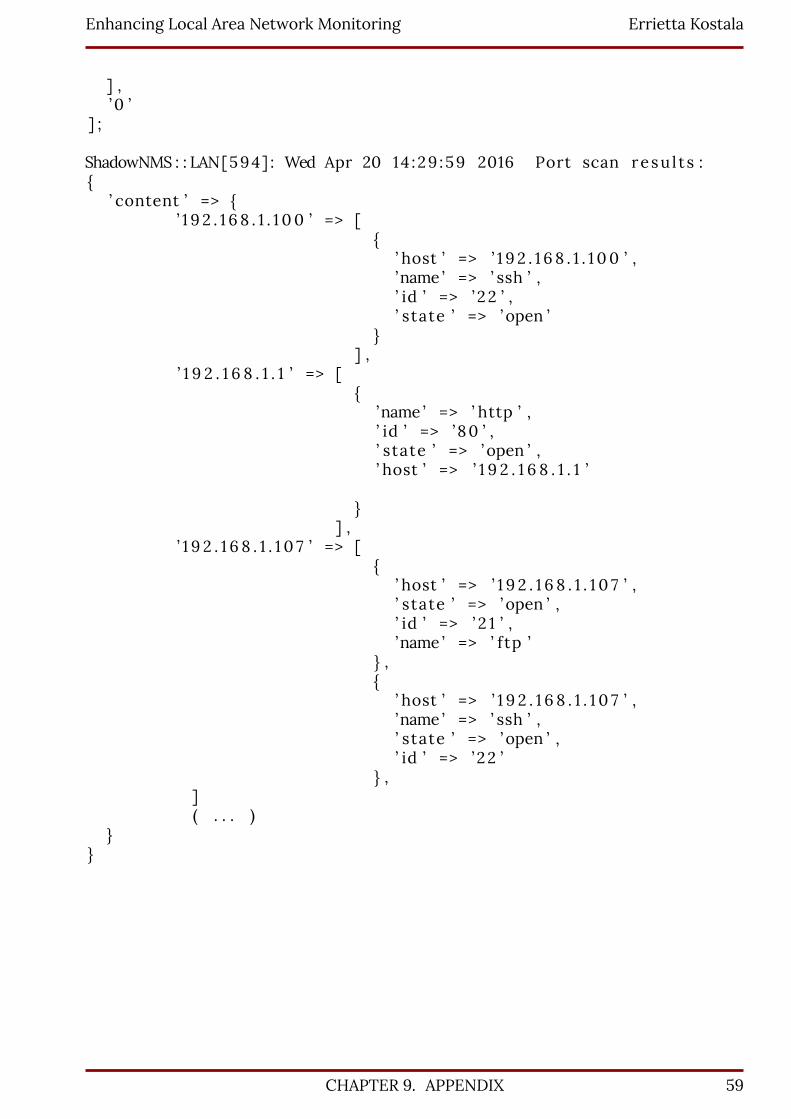
Enhancing Local Area Network Monitoring Errietta Kostala
] ,’ 0 ’
] ;
ShadowNMS : : LAN[594 ] : Wed Apr 20 14 :29 :59 2016 Port scan resu l t s :{
’ content ’ => {’ 1 9 2 . 1 6 8 . 1 . 1 00 ’ => [
{’ host ’ => ’ 1 9 2 . 1 6 8 . 1 . 1 0 0 ’ ,’name ’ => ’ ssh ’ ,’ id ’ => ’ 2 2 ’ ,’ state ’ => ’ open ’
}] ,
’ 1 9 2 . 1 6 8 . 1 . 1 ’ => [{
’name ’ => ’ http ’ ,’ id ’ => ’ 80 ’ ,’ state ’ => ’ open ’ ,’ host ’ => ’ 1 9 2 . 1 6 8 . 1 . 1 ’
}] ,
’ 1 9 2 . 1 6 8 . 1 . 1 0 7 ’ => [{
’ host ’ => ’ 1 9 2 . 1 6 8 . 1 . 1 0 7 ’ ,’ state ’ => ’ open ’ ,’ id ’ => ’ 2 1 ’ ,’name ’ => ’ ftp ’
} ,{
’ host ’ => ’ 1 9 2 . 1 6 8 . 1 . 1 0 7 ’ ,’name ’ => ’ ssh ’ ,’ state ’ => ’ open ’ ,’ id ’ => ’ 22 ’
} ,]( . . . )
}}
CHAPTER 9. APPENDIX 59
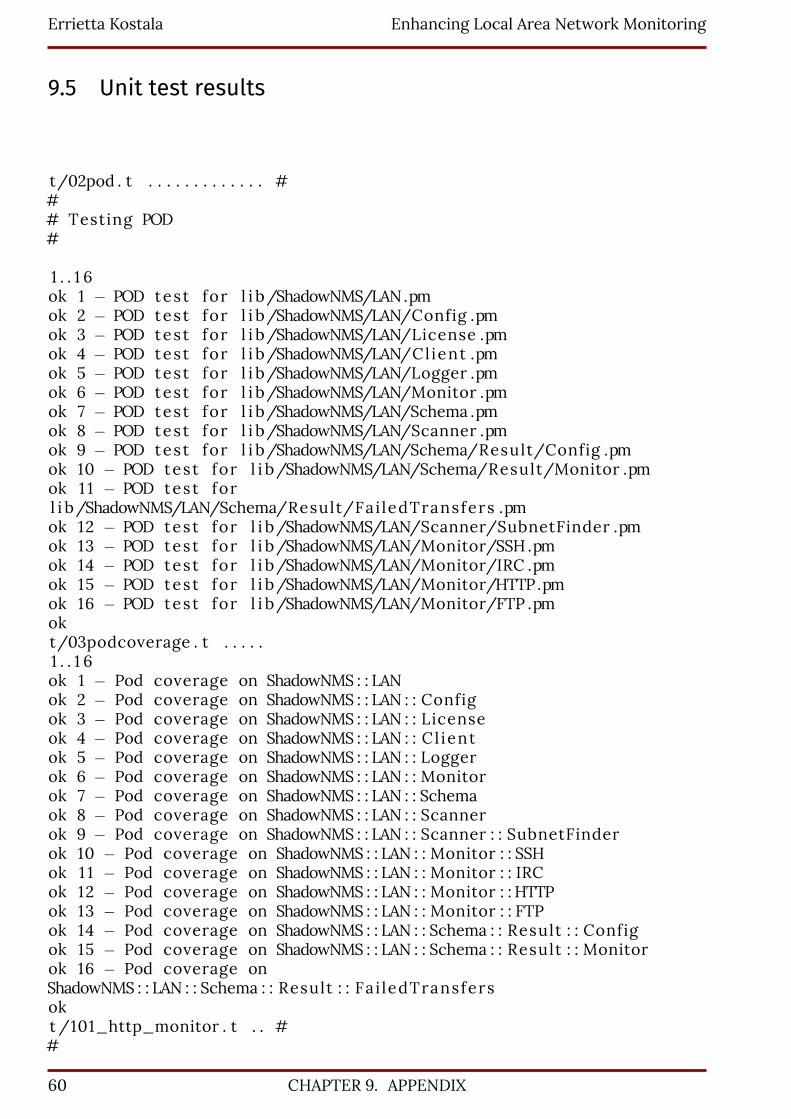
Errietta Kostala Enhancing Local Area Network Monitoring
9.5 Unit test results
t/02pod . t . . . . . . . . . . . . . ### Testing POD#
1 . . 1 6ok 1 − POD test for l i b/ShadowNMS/LAN.pmok 2 − POD test for l i b/ShadowNMS/LAN/Config .pmok 3 − POD test for l i b/ShadowNMS/LAN/License .pmok 4 − POD test for l i b/ShadowNMS/LAN/Cl ient .pmok 5 − POD test for l i b/ShadowNMS/LAN/Logger .pmok 6 − POD test for l i b/ShadowNMS/LAN/Monitor .pmok 7 − POD test for l i b/ShadowNMS/LAN/Schema .pmok 8 − POD test for l i b/ShadowNMS/LAN/Scanner .pmok 9 − POD test for l i b/ShadowNMS/LAN/Schema/Result/Config .pmok 10 − POD test for l i b/ShadowNMS/LAN/Schema/Result/Monitor .pmok 1 1 − POD test forl i b/ShadowNMS/LAN/Schema/Result/Fai ledTransfers .pmok 12 − POD test for l i b/ShadowNMS/LAN/Scanner/SubnetFinder .pmok 13 − POD test for l i b/ShadowNMS/LAN/Monitor/SSH .pmok 14 − POD test for l i b/ShadowNMS/LAN/Monitor/IRC .pmok 15 − POD test for l i b/ShadowNMS/LAN/Monitor/HTTP.pmok 16 − POD test for l i b/ShadowNMS/LAN/Monitor/FTP .pmokt/03podcoverage . t . . . . .1 . . 1 6ok 1 − Pod coverage on ShadowNMS : : LANok 2 − Pod coverage on ShadowNMS : : LAN : : Configok 3 − Pod coverage on ShadowNMS : : LAN : : Licenseok 4 − Pod coverage on ShadowNMS : : LAN : : Cl ientok 5 − Pod coverage on ShadowNMS : : LAN : : Loggerok 6 − Pod coverage on ShadowNMS : : LAN : : Monitorok 7 − Pod coverage on ShadowNMS : : LAN : : Schemaok 8 − Pod coverage on ShadowNMS : : LAN : : Scannerok 9 − Pod coverage on ShadowNMS : : LAN : : Scanner : : SubnetFinderok 10 − Pod coverage on ShadowNMS : : LAN : : Monitor : : SSHok 1 1 − Pod coverage on ShadowNMS : : LAN : : Monitor : : IRCok 12 − Pod coverage on ShadowNMS : : LAN : : Monitor : : HTTPok 13 − Pod coverage on ShadowNMS : : LAN : : Monitor : : FTPok 14 − Pod coverage on ShadowNMS : : LAN : : Schema : : Result : : Configok 15 − Pod coverage on ShadowNMS : : LAN : : Schema : : Result : : Monitorok 16 − Pod coverage onShadowNMS : : LAN : : Schema : : Result : : Fa i ledTransfersokt /101_http_monitor . t . . ##
60 CHAPTER 9. APPENDIX
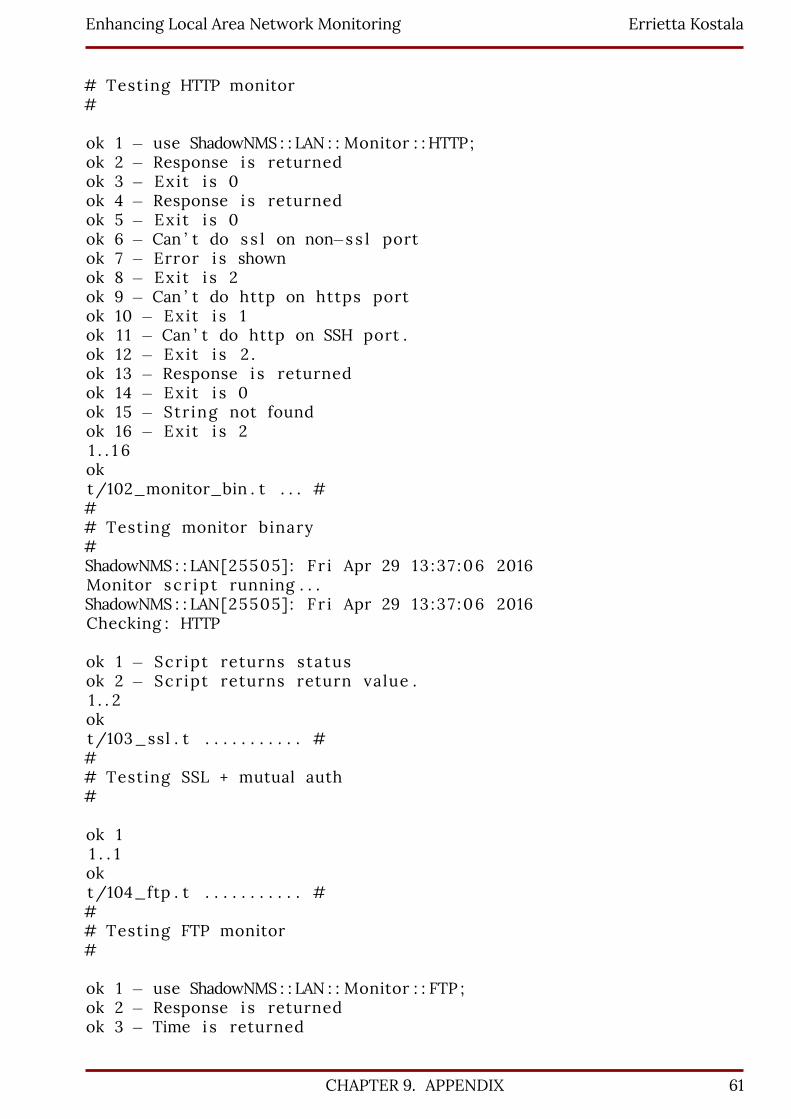
Enhancing Local Area Network Monitoring Errietta Kostala
# Testing HTTP monitor#
ok 1 − use ShadowNMS : : LAN : : Monitor : : HTTP;ok 2 − Response i s returnedok 3 − Exit i s 0ok 4 − Response i s returnedok 5 − Exit i s 0ok 6 − Can ’ t do s s l on non−s s l portok 7 − Error i s shownok 8 − Exit i s 2ok 9 − Can ’ t do http on https portok 10 − Exit i s 1ok 1 1 − Can ’ t do http on SSH port .ok 12 − Exit i s 2 .ok 13 − Response i s returnedok 14 − Exit i s 0ok 15 − String not foundok 16 − Exit i s 21 . . 1 6okt/102_monitor_bin . t . . . ### Testing monitor binary#ShadowNMS : : LAN[25505] : F r i Apr 29 13 :37 :06 2016Monitor scr ipt running . . .ShadowNMS : : LAN[25505] : F r i Apr 29 13 :37 :06 2016Checking : HTTP
ok 1 − Script returns statusok 2 − Script returns return value .1 . . 2okt/103_ssl . t . . . . . . . . . . . ### Testing SSL + mutual auth#
ok 11 . . 1okt/104_ftp . t . . . . . . . . . . . ### Testing FTP monitor#
ok 1 − use ShadowNMS : : LAN : : Monitor : : FTP ;ok 2 − Response i s returnedok 3 − Time i s returned
CHAPTER 9. APPENDIX 61
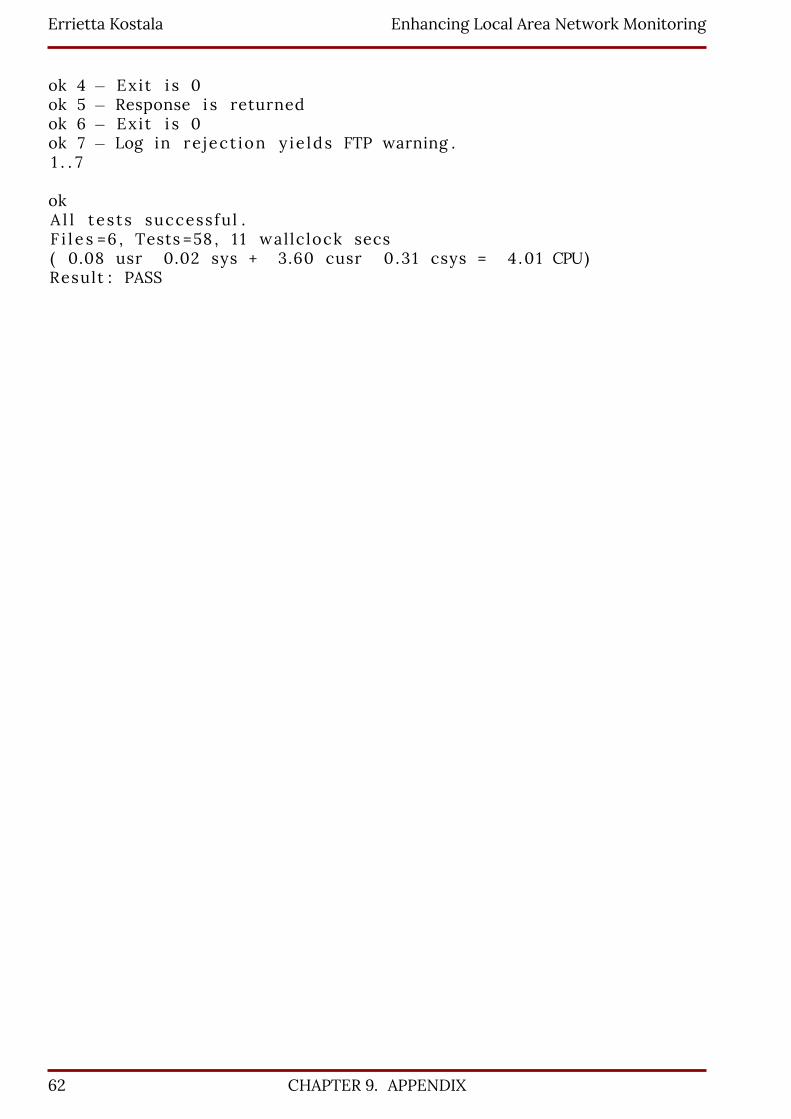
Errietta Kostala Enhancing Local Area Network Monitoring
ok 4 − Exit i s 0ok 5 − Response i s returnedok 6 − Exit i s 0ok 7 − Log in re ject ion y ie lds FTP warning .1 . . 7
okA l l tes ts successful .F i l e s =6 , Tests =58 , 1 1 wal lc lock secs( 0.08 usr 0.02 sys + 3.60 cusr 0 .31 csys = 4 .01 CPU)Result : PASS
62 CHAPTER 9. APPENDIX
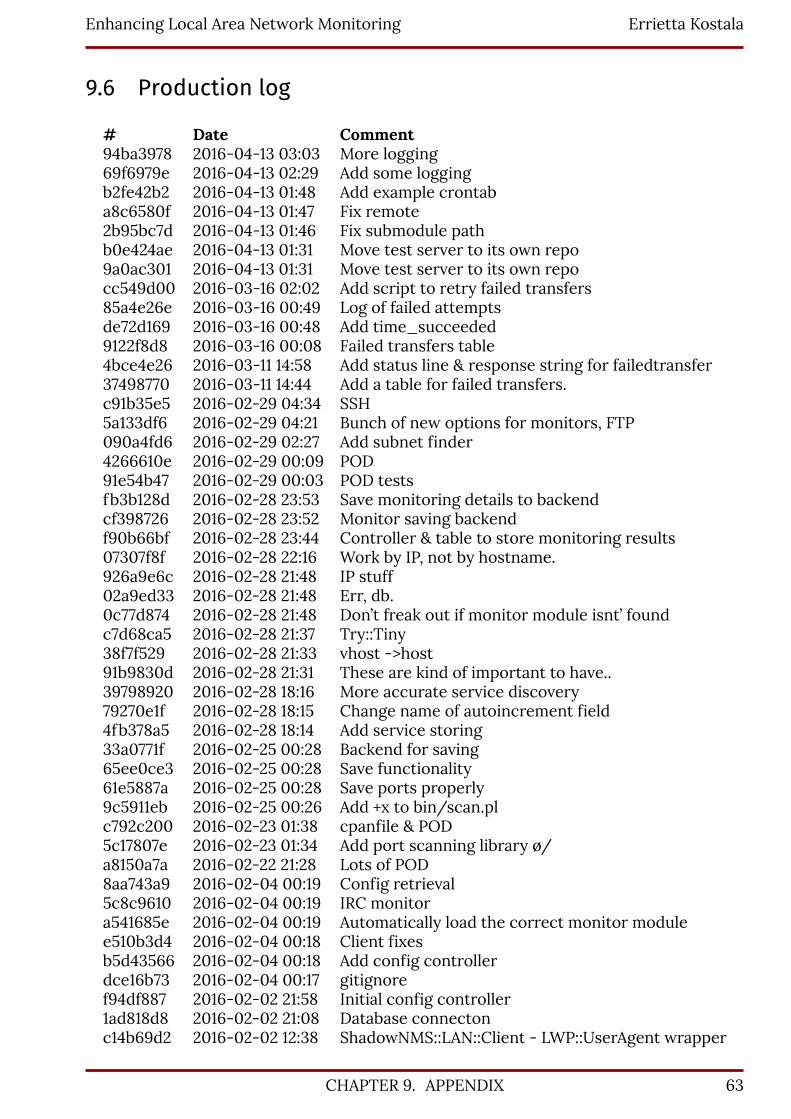
Enhancing Local Area Network Monitoring Errietta Kostala
9.6 Production log
# Date Comment94ba3978 2016-04-13 03:03 More logging69f6979e 2016-04-13 02:29 Add some loggingb2fe42b2 2016-04-13 01:48 Add example crontaba8c6580f 2016-04-13 01:47 Fix remote2b95bc7d 2016-04-13 01:46 Fix submodule pathb0e424ae 2016-04-13 01:31 Move test server to its own repo9a0ac301 2016-04-13 01:31 Move test server to its own repocc549d00 2016-03-16 02:02 Add script to retry failed transfers85a4e26e 2016-03-16 00:49 Log of failed attemptsde72d169 2016-03-16 00:48 Add time_succeeded9122f8d8 2016-03-16 00:08 Failed transfers table4bce4e26 2016-03-11 14:58 Add status line & response string for failedtransfer37498770 2016-03-11 14:44 Add a table for failed transfers.c91b35e5 2016-02-29 04:34 SSH5a133df6 2016-02-29 04:21 Bunch of new options for monitors, FTP090a4fd6 2016-02-29 02:27 Add subnet finder4266610e 2016-02-29 00:09 POD91e54b47 2016-02-29 00:03 POD testsfb3b128d 2016-02-28 23:53 Save monitoring details to backendcf398726 2016-02-28 23:52 Monitor saving backendf90b66bf 2016-02-28 23:44 Controller & table to store monitoring results07307f8f 2016-02-28 22:16 Work by IP, not by hostname.926a9e6c 2016-02-28 21:48 IP stuff02a9ed33 2016-02-28 21:48 Err, db.0c77d874 2016-02-28 21:48 Don’t freak out if monitor module isnt’ foundc7d68ca5 2016-02-28 21:37 Try::Tiny38f7f529 2016-02-28 21:33 vhost ->host91b9830d 2016-02-28 21:31 These are kind of important to have..39798920 2016-02-28 18:16 More accurate service discovery79270e1f 2016-02-28 18:15 Change name of autoincrement field4fb378a5 2016-02-28 18:14 Add service storing33a0771f 2016-02-25 00:28 Backend for saving65ee0ce3 2016-02-25 00:28 Save functionality61e5887a 2016-02-25 00:28 Save ports properly9c5911eb 2016-02-25 00:26 Add +x to bin/scan.plc792c200 2016-02-23 01:38 cpanfile & POD5c17807e 2016-02-23 01:34 Add port scanning library ø/a8150a7a 2016-02-22 21:28 Lots of POD8aa743a9 2016-02-04 00:19 Config retrieval5c8c9610 2016-02-04 00:19 IRC monitora541685e 2016-02-04 00:19 Automatically load the correct monitor modulee510b3d4 2016-02-04 00:18 Client fixesb5d43566 2016-02-04 00:18 Add config controllerdce16b73 2016-02-04 00:17 gitignoref94df887 2016-02-02 21:58 Initial config controller1ad818d8 2016-02-02 21:08 Database connectonc14b69d2 2016-02-02 12:38 ShadowNMS::LAN::Client - LWP::UserAgent wrapper
CHAPTER 9. APPENDIX 63
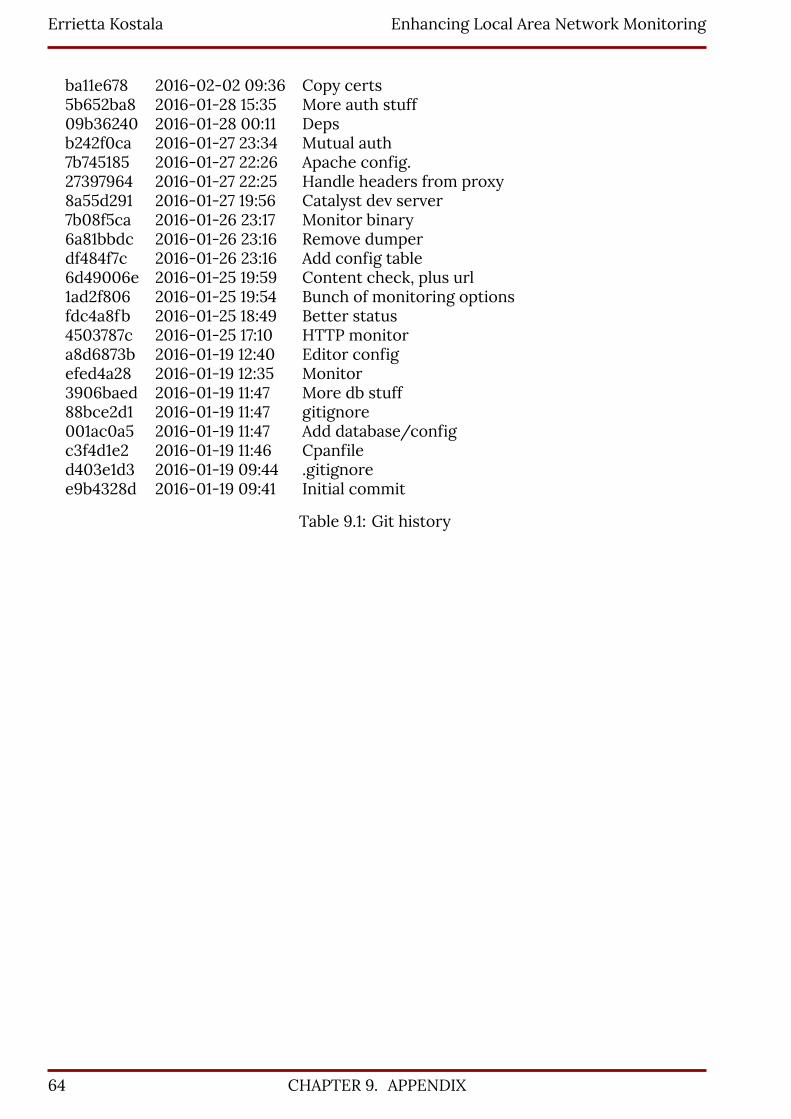
Errietta Kostala Enhancing Local Area Network Monitoring
ba11e678 2016-02-02 09:36 Copy certs5b652ba8 2016-01-28 15:35 More auth stuff09b36240 2016-01-28 00:11 Depsb242f0ca 2016-01-27 23:34 Mutual auth7b745185 2016-01-27 22:26 Apache config.27397964 2016-01-27 22:25 Handle headers from proxy8a55d291 2016-01-27 19:56 Catalyst dev server7b08f5ca 2016-01-26 23:17 Monitor binary6a81bbdc 2016-01-26 23:16 Remove dumperdf484f7c 2016-01-26 23:16 Add config table6d49006e 2016-01-25 19:59 Content check, plus url1ad2f806 2016-01-25 19:54 Bunch of monitoring optionsfdc4a8fb 2016-01-25 18:49 Better status4503787c 2016-01-25 17:10 HTTP monitora8d6873b 2016-01-19 12:40 Editor configefed4a28 2016-01-19 12:35 Monitor3906baed 2016-01-19 11:47 More db stuff88bce2d1 2016-01-19 11:47 gitignore001ac0a5 2016-01-19 11:47 Add database/configc3f4d1e2 2016-01-19 11:46 Cpanfiled403e1d3 2016-01-19 09:44 .gitignoree9b4328d 2016-01-19 09:41 Initial commit
Table 9.1: Git history
64 CHAPTER 9. APPENDIX