Embed Size (px)
Citation preview
SM Analytical and Bioanalytical Techniques
Gr upSM
How to cite this article Cece-Esencan EN, Fontaine F, Plasencia G, Teppner M, Brink A, Pähler A, et al. Enhancing Throughput of Glutathione Adduct Formation Studies and Structural Identification Using a Software-Assisted Workflow
Based on High-Resolution Mass Spectrometry (HRMS) Data. SM Anal Bioanal Technique. 2016; 1(1): 1002.
OPEN ACCESS
ISSN: 2573-3729
IntroductionReactive Metabolites (RM) have been related to the risk of Idiosyncratic Drug Toxicity
(IDT). The mechanism is believed to involve covalent binding of RM to cellular proteins causing IDT [1,2]. The potential for RM formation is routinely tested in lead optimization phase of drug discovery to identify compounds with excessive RM risk [3]. One way to experimentally address this question is to perform in vitro metabolism studies in the presence of the tripeptide glutathione (γ-glutamylcysteinylglycine, GSH) as a nucleophile in the media in order to trap any thiol-reactive electrophilic metabolite. Other types of RM could be detected using other trapping agents. Due to the advantage of the specific fragmentation of the GSH molecule, such screening assays have been implemented by most pharmaceutical companies as part of the screening cascade during compound optimization in the drug discovery process [4].
Numerous methods based on mass spectrometry are published to detect GSH conjugates in vitro, but the automation of these methods as well as the identification of the drug moiety and the site of attachment of the tripeptide currently is key to efficiently support the drug discovery efforts. Precursor Ion Scanning (PreIS) is a standard method that has been used up to today [5], because of the enhanced sensitivity and selectivity of detection the molecular ions. It does not provide fragmentation data and only be used for known mechanisms. However, High-Resolution Mass Spectrometry (HRMS) is a powerful technique currently available to identify and elucidate the structure of GSH adducts with mass accuracy in complex biological matrices [6]. At this point,
Research Article
Enhancing Throughput of Glutathione Adduct Formation Studies and Structural Identification Using a Software-Assisted Workflow Based on High-Resolution Mass Spectrometry (HRMS) DataEsra Nurten Cece-Esencan1, Fabien Fontaine2, Guillem Plasencia2,3, Marieke Teppner3, Andreas Brink3, Axel Pähler3 and Ismael Zamora4*1Municipal Institute for Medical Research (IMIM), University Pompeu Fabra, Barcelona, Spain2Molecular Discovery, London, UK3Roche Pharma Research and Early Development, Pharmaceutical Sciences, Roche Innovation Center Basel, F. Hoffmann-La Roche Ltd, Grenzacherstrasse 124, 4070 Basel, Switzerland4Lead Molecular Design, S.L. San Cugat del Vallès, Spain
Article Information
Received date: Jul 07, 2016 Accepted date: Oct 03, 2016 Published date: Oct 07, 2016
*Corresponding author
Ismael Zamora, Lead Molecular Design, S.L., Calle Vallès, 96-102 Local 27 08173, Sant Cugat del Vallès, Barcelona, Spain, Tel: +34 935907828; Email: [email protected]
Distributed under Creative Commons CC-BY 4.0
Keywords Reactive metabolites; Metabolite identification; Mass spectrometry; Automated software-assisted workflow
Abbreviations RM: Reactive Metabolites; GSH: Tripeptide Glutathione (γ-glutamylcysteinylglycine); HLM: Human Liver Microsomes; IDT: Idiosyncratic Drug Toxicity; FI: Fragmental Ions; NL: Constant Neutral Losses; UPLC: Ultrahigh-Performance Liquid Chromatography; HRMS: High-Resolution Mass Spectrometry; ESI: Electrospray Ionization
Abstract
The bioactivation of drugs to Reactive Metabolites (RM) has been related to drug-induced liver injury and hypersensitivity reactions in patients. Therefore, many pharmaceutical companies are investigating the potential to form reactive metabolites in vitro as an integral part of the optimization of drug candidates. A computer-assisted workflow to efficiently analyze larger numbers of compounds for the formation of glutathione trappable RM is presented here. A set of 95 compounds with known bioactivation potential was selected for this study. Incubations with human liver microsomes were prepared with GSH. The acquisition of MS/MS spectra was triggered by ion intensity. MS with singly and doubly charged ions were used for peak detection and MS/MS spectra were used for structural elucidation. A confidence classification system for the GSH peak detection (high, medium, low) was developed based on the detection of characteristic fragment ions or neutral losses and applied to remove potential false positive results. A comparative analysis of the HRMS results with literature data was carried out. The most frequently observed Neutral Loss (NL) found in singly charged GSH adducts (drug-glutathione conjugates) were, the Neutral Loss (NL, 129 Da) and Fragment Ion (FI, m/z 308) and in the doubly charged ones the Fragment Ion (FI, m/z 130). These NL and FI were used to identify GSH-related drug metabolites. MS/MS spectra were inspected to aid structural elucidations: 17% of drug substrates and 29 % of GSH adduct metabolites were identified with only doubly charged ions, stressing the importance of considering this charge state in the identification workflow. A total of 41 compounds that form GSH adducts were retrieved from literature (HRMS, identified 28 compounds (68%) in high confidence, and the same result was obtained using precursor ion scan). By the confidence analysis of GSH peaks, the quality of the each GSH adduct was determined.
Citation: Cece-Esencan EN, Fontaine F, Plasencia G, Teppner M, Brink A, Pähler A, et al. Enhancing Throughput of Glutathione Adduct Formation Studies and Structural Identification Using a Software-Assisted Workflow Based on High-Resolution Mass Spectrometry (HRMS) Data. SM Anal Bioanal Technique. 2016; 1(1): 1002. Page 2/12
Gr upSM Copyright Zamora I
the loss of constant Neutral Fragments (NL) and the characteristic GSH related Fragment Ions (FI) has been useful to interpret the conjugations of GSH adducts.
During mass spectrometric analysis, glutathione may undergo cleavage and leads to characteristic neutral loss of glycine (75.0320 Da) and pyroglutamic acid (129.0426 Da). In addition, other characteristic NL fragments were also reported, for example, 232.0696, 249.0691, 273.0961, 275.1117Da NL that are attributed to the cleavage of the cysteinyl C-S bond of the GSH moiety. The GSH molecule itself might be lost as neutral moiety (307.0838 Da) and/or can form a specific fragment ion [GSH +H]+ (m/z 308.0911). The molecular ions appear by the cleavage of the C-S bond between the drug and GSH. Finally, the fragment ions with m/z e.g. 179.0485, 177.0328 and 162.0219 Da, which were derived from the glutathione moiety, were reported [7,8].
This work describes a novel approach for the detection and structure elucidation of reactive compounds trapped with GSH. Mass-Meta Site [9] and Web Metabase [10,11] software were used to process the HRMS raw data in a highly automated workflow. In addition to the singly charged ions, which were recently reported [8], the detection of doubly charged GSH adducts was introduced. MS/MS spectra were inspected for fragments originating from singly and doubly charged GSH adducts with the new workflow. Herein, the structural proposals of both ions (singly and doubly charged) were consolidated for the interpretation of the MS/MS spectra. In addition to the automatic peak finding algorithms [8], the new workflow includes a new list of GSH related FI obtained from the doubly charged adduct. This improvement represents an incremental advance in the ability to detect doubly charged GSH trapped reactive drug metabolites in an automated way. Moreover, a new system to process HRMS data automatically by marking and filtering of a specifically desired group of adducts is presented in this workflow. In order to avoid false positive results, a classification of confidence groups (high, medium and low levels) was developed by the GSH peak criteria by analyzing the quality and reliability of a labeled GSH adduct.
Materials and MethodsData set
Ninety-five (95) commercially available compounds were used in this analysis. Aminopyrine [4,12], Amodiaquine [13], Benzbromarone, Ethinylestradiol, Ezetimibe, Tolcapone [8], Acetaminophen, Acetyl-salicylic acid, Amitriptyline, Amlodipine, Aripiprazole, Atorvastatin, Bromfenac, Buspirone, Captopril, Carvedilol, Clopidogrel, Citalopram, Diazepam, Diclofenac, Donezepil, Enalapril, Felbamate, Fluoxetine, Furosemide, Gabapentin, Lisinopril, Lorazepam, Memantine, Nifedipine, Olanzapine [4], Quetiapine, Phenytoin, Procainamide, Ranitidine, Sertraline, Simvastatin, Sitagliptin, Sulfamethoxazole, Valsartan, Venlafaxine, Verapamil, Warfarin and Zolpidem [3], Carbamazepine [14], Cilazapril [15], Clozapine [16], Flutamide [17], Imiloxan [18], Moclobemide [19], Nefazodone, Haloperidol, Indomethacin [20], Nevirapine [4,21,22], Probucol [23], Rimonabant [24], Caffeine and Ritonavir [21], Ticlopidine [25], Tienilic-acid [26], Pioglitazone, Rosiglitazone and Troglitazone [27], Dilthiazem, Diphenhydramin, Erythromycin, Imipramine, Tacrine, Valproic-acid, Zafirlukast [28], Alprazolam [29], Baclofen [30], Desipramine [4,31], Hexobarbital [32], Risperidone [33],
Gemfibrozil [34], Propranolol and Tamoxifen [2], Sumatriptan [35], Amantadine, Atropine, Chlorpromazine, Dextromethorphan, Fenofibrate, Levofloxacin, Lidocaine, Olmesartan, Pentobarbital, Pindolol, Pravastatin, Prazosin, Tocopherol acetate, Paroxetine [36] and Zomepirac [4].
Chemicals and reagents
All chemicals and reagents were used at the highest quality available and were obtained from standard commercial suppliers. The pharmaceutical test compounds were obtained from Sigma-Aldrich (Buchs, Switzerland), Toronto Research Chemicals (Toronto, Canada), Ark Pharm (Libertyville, USA) or from the Roche compound depository. The GSH trapping experiments were performed in Human Liver Microsomes (HLM) incubations including GSH and the drug under investigation. Pooled mixed gender Human Liver Microsomes (HLM) were purchased from BD Biosciences (Woburn, MA. USA). Glutamine was obtained from Life Technologies Invitrogen (Lucerne, Switzerland) and acetonitrile LC-MS grade from Fischer Scientific (Wohlen, Switzerland). The water of chromatography grade and Magnesium Dichloride (MgCl2) was obtained from Merck (Darmstadt, Germany). β-nicotinamide adenine dinucleotide phosphate reduced tetrasodium salt (NADPH), formic acid p.a. was purchased from Sigma-Aldrich (St. Louis, MO, USA).
Incubations with HLM and trapping conditions
All compounds were incubated using a 96-deep-well plate (Eppendorf) at 20 µM (addition of 1 µl of 10 mM DMSO stock solution) in 450 µl of 0.1 M sodium phosphate buffer at pH 7.4 containing Human Liver Microsomes (HLM). Microsomal protein concentration was 1 mg/ml. Pipetting was performed using a TECAN pipetting robot. The buffer was prepared at room temperature by combining 2.62 g NaH2PO4*1H2O and 14.43 g Na2HPO4.2H2O dissolved in H2O (Millipore, >18 MΩ) to a weight of 1000 g (pH 7.4). After 5 minutes of pre-incubation at 37°C, the reaction was started by adding 50 µl of buffer containing GSH (100 mM) and NADPH (20 mM). Fresh stock solutions of GSH and NADPH were prepared straight before each experiment. The final concentrations were 5 mM for GSH and 1 mM for NADPH. After 60 minutes of incubation at 37°C (shaking at 800 rpm), the reaction was quenched with 500 µl of cold acetonitrile and centrifuged at 5000 x g at 4°C for 11 minutes.
Bio-analytical methods
Two different methodologies were used for the analysis of the samples. Firstly, as a standard method in order to validate our results internally, LC-MS/MS analyses were performed on a triple quadrupole-linear ion trap mass spectrometer (Q-TRAP 4000, AB Sciex, Warrington, UK) interfaced with a Shimadzu high performance liquid chromatography system. Sample clean-up and chromatography of analytes were performed on-line by a column-switching set-up of two HPLC columns. From each sample 50 µl were injected (Shimadzu Sil HTC) and loaded with water containing 0.1% formic acid onto a trapping column (Waters Oasis HLB 2.1 x 10 mm, 25 µm) with a flow rate of 0.3 ml/min. After 1.5 minute the trapped analytes were then flushed (included a change in flow direction on the trapping column) onto an analytical column (Waters Atlantis T3 2.1 x 100 mm, 3 µm) with a total flow of 0.2 ml/min starting with
Citation: Cece-Esencan EN, Fontaine F, Plasencia G, Teppner M, Brink A, Pähler A, et al. Enhancing Throughput of Glutathione Adduct Formation Studies and Structural Identification Using a Software-Assisted Workflow Based on High-Resolution Mass Spectrometry (HRMS) Data. SM Anal Bioanal Technique. 2016; 1(1): 1002. Page 3/12
Gr upSM Copyright Zamora I
95/5% water containing 0.1% formic acid/acetonitrile. The fraction of acetonitrile was increased to 20% acetonitrile between 2 and 2.5 minutes, to 70% at 10 minutes and to 98% at 11 minutes. After 12 minutes the analytical column was equilibrated to start conditions (5% acetonitrile). The trapping column was washed with acetonitrile for 1 minute at a flow rate of 1.5 ml/min and equilibrated for 1.25 minutes with water containing 0.1% formic acid at a flow rate of 1.5 ml/minutes. The total running time was 14 minutes per sample.
Mass Spectrometer was operated with Q-TRAP 4000 equipped with an electrospray ionization source (Turbo V), both from AB Sciex. Based on a published method of Dieckhaus [1] a precursor ion of (m/z 272) survey scan (PreIS) method was used to detect GSH-conjugates in negative ion mode. Briefly, as survey scan ions (400 to 900 amu within 2 seconds) are scanned for precursors of m/z 272 amu, the ion spray voltage was -4200 V, the source temperature 500°C, nitrogen was used as curtain and collision gas. If the parent molecule exceeds a molecular mass of 500 the scan range was changed to 500 amu to 1000 amu within 2 seconds. For signals in the survey scan exceeding 7500 cts (that was approximately 5-times the background signal), enhanced resolution scan and an enhanced product ion scan was triggered. This allows for isotope determination and confirmation of a positive GSH adduct by the presence of diagnostic fragment ions. Further instrument settings were as follows: Curtain gas: 30 psi, CAD gas: 10 psi Gas 1: 30 psi, Gas 2: 50 psi, declustering potential: -70 V, entrance potential: -10 V, collision energy: -24 V and cell exit potential -15 V.
Secondly, the incubations were analyzed by HRMS method to obtain the main data for the described new workflow data analysis. Chromatographic separation of adducts was performed on an ACQUITY Ultra Performance Liquid Chromatography (UPLC) System (Waters, Milford, MA, USA) using an ACQUITY UPLC HSS C18 column (2.1 x 50 mm, 1.8 µm) at 50°C. The mobile phase consisted of 0.1% formic acid in water/acetonitrile (eluent A; 95/5, v/v) and 0.1% formic acid in acetonitrile (eluent B) at a flow rate of 0.5 ml/min. The initial condition was 0% B, which was maintained for 1 min. Eluent B was then increased to 70% over 3.5 min and further to 99.9% over 0.1 min where it was maintained for 1.4 min. Subsequently, eluent A was adjusted to 100% over 0.1 min and re-equilibration was performed until the end of the run at 8.5 min.
MS/MS analyses were run on a Triple TOF 5600+ System (AB Sciex, Warrington, UK) mass spectrometer operated in Positive Electrospray Ionization (ESI) mode. MS/MS experiments in HRMS were performed using with the following source parameters (parameter types are source and gas): CUR*=25 psi (Curtain Gas), GS1=45 psi (Ion Source Gas 1), GS2=60 psi (Ion Source Gas 2), ISVF=5500 V (Ion Spray Voltage Floating), and TEM=500°C (Temperature). The settings for the TOF MS were; CE=10 eV (Collision Energy), DP=80 eV (De-clustering Potential), Mass Range 100-1200 m/z and Accumulation Time 50 ms. The IDA (Information Dependent Acquisition) criteria were as follows: Intensity was greater than 500 cps, Spectra was 10, target ions were excluded after 3 occurrences for 2 seconds, Mass Tolerance was 25 ppm, excluded after 3 occurrences, excluded isotope was 2 Da. The settings for the MS/MS were CE=40 eV, CES=20 eV (Collision Energy Spread), DP=80 eV, Mass Range m/z 50-1200, Accumulation Time: 30 ms and Cycle Time: 340 ms.
Processing data
Data acquisition for Precursor Ion Survey Scan (PreIS) method was performed using Analyst 1.4.2, data analysis, i.e. sample control (solvent) comparisons were performed with Metabolite ID 1.3 (AB Sciex).
The HRMS data were processed using Mass-MetaSite “MetaSite 5.0.3 Mass 3.1.3” and “WebMetabase release-2.0.2” (Molecular Discovery Ltd., Middlesex, UK). Mass-MetaSite is the software to process HRMS data and interpret fragment ions rationally for metabolite identification [9-11,37]. Mass-MetaSite was used in the chromatographic peaks detection of the potential drug-related GSH adducts and in the structural elucidation for each GSH-adducts. Herein, Troglitazone, Diclofenac, and Nefazodone were included as experimental positive control compounds in the batch of Mass-MetaSite. All data (chromatograms, MS and MS/MS spectra, definitive/MarkusGSH-adduct structures) was stored in a searchable database mining tool named “WebMetabase”, which can be used for SAR analysis (structure–activity relationships), identification of chemical motifs and comparison of GSH related metabolic pathways for large compound sets.
Mass-MetaSite settings
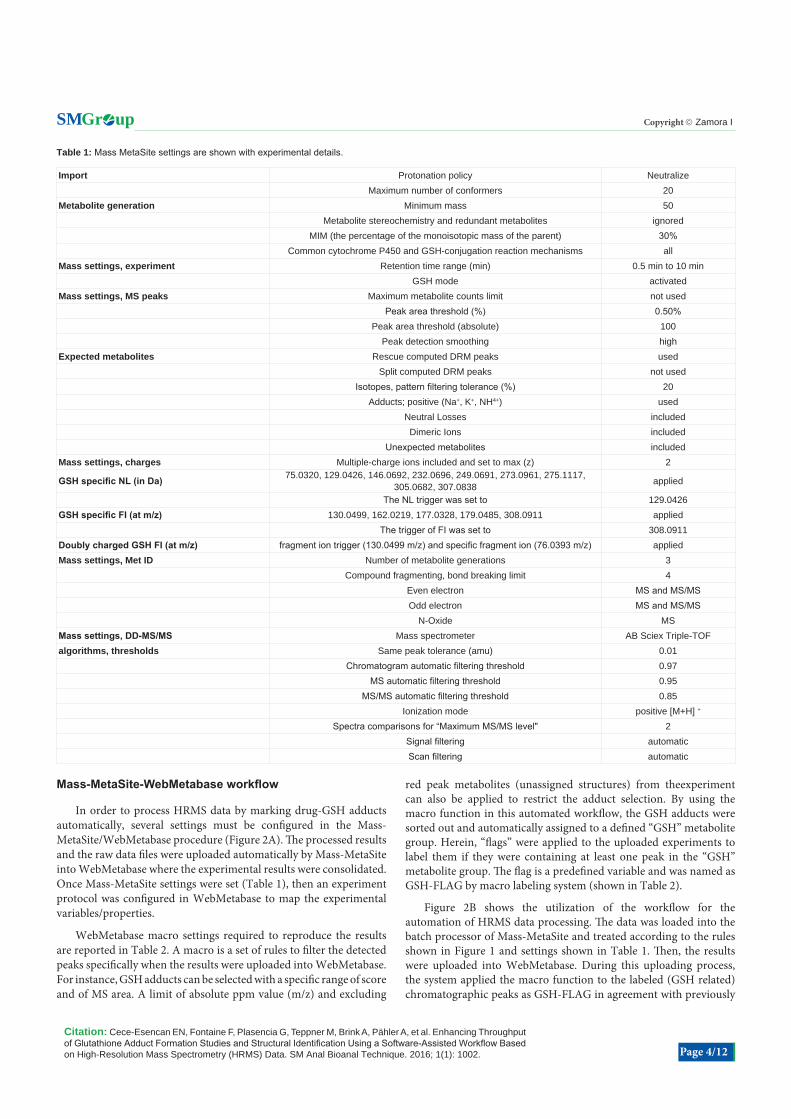
The Mass-MetaSite settings required for reproducing the results are reported in Table 1. The settings are the profile used by the MetaSite-Batch-Processor to run the analysis. Mass-MetaSite procedure to label GSH adducts peaks is based on 3 algorithms: GSH related FI, related constant NL and the related reactions (GSH-conjugation and common CYP mechanisms). Mass-MetaSite automatically adds asterisks (*) and exclamations marks (!) to the adduct names of NL and FI, respectively.
The methodology solely based on singly charged ions for the NL and FI detection was reported previously [8]. In this study, the workflow is updated by searching FI and NL of GSH molecule in MS/MS spectra coming from the both singly and doubly charged GSH adducts. These singly and doubly charged ions were used during the structure elucidation process by generating MS/MS spectra that consolidated both charged ions.
Figure 1, shows how the software automatically reviews the MS/MS spectra for NL and FI of the GSH molecule. Herein, NL of 129.0426 and FI of m/z 308.0911 for singly charged adducts and m/z 130.0499 for doubly charged adducts were set up as trigger ions by the user. These values were selected after a preliminary statistical analysis. According to the approach, if the initially defined NL or FI m/z were detected, the system would trigger the analysis for other NL (75.0320, 146.0692, 275.1117, 273.0961, 307.0838, 305.0682, 232.0696 and 249.0691) and FI (162.0219, 177.0328, 179.0485, and 308.0911). GSH adducts that show (1) NL in the MS/MS spectra were labeled by adding an asterisk sign (*) and (2) FI in the MS/MS spectra by adding exclamations mark sign (!) in the name of the compound. If none of these trigger ions were identified above a predefined threshold, the mass chromatogram was inspected for expected masses (m/z) of GSH conjugations in doubly and singly charged ions based on common and compound-specific biotransformation reactions. If there is not any mass (m/z) related with GSH conjugation, then the system does not look for any other possibility and skips the compound in the analysis to mark it as (non) GSH related compound.
Citation: Cece-Esencan EN, Fontaine F, Plasencia G, Teppner M, Brink A, Pähler A, et al. Enhancing Throughput of Glutathione Adduct Formation Studies and Structural Identification Using a Software-Assisted Workflow Based on High-Resolution Mass Spectrometry (HRMS) Data. SM Anal Bioanal Technique. 2016; 1(1): 1002. Page 4/12
Gr upSM Copyright Zamora I
Mass-MetaSite-WebMetabase workflow
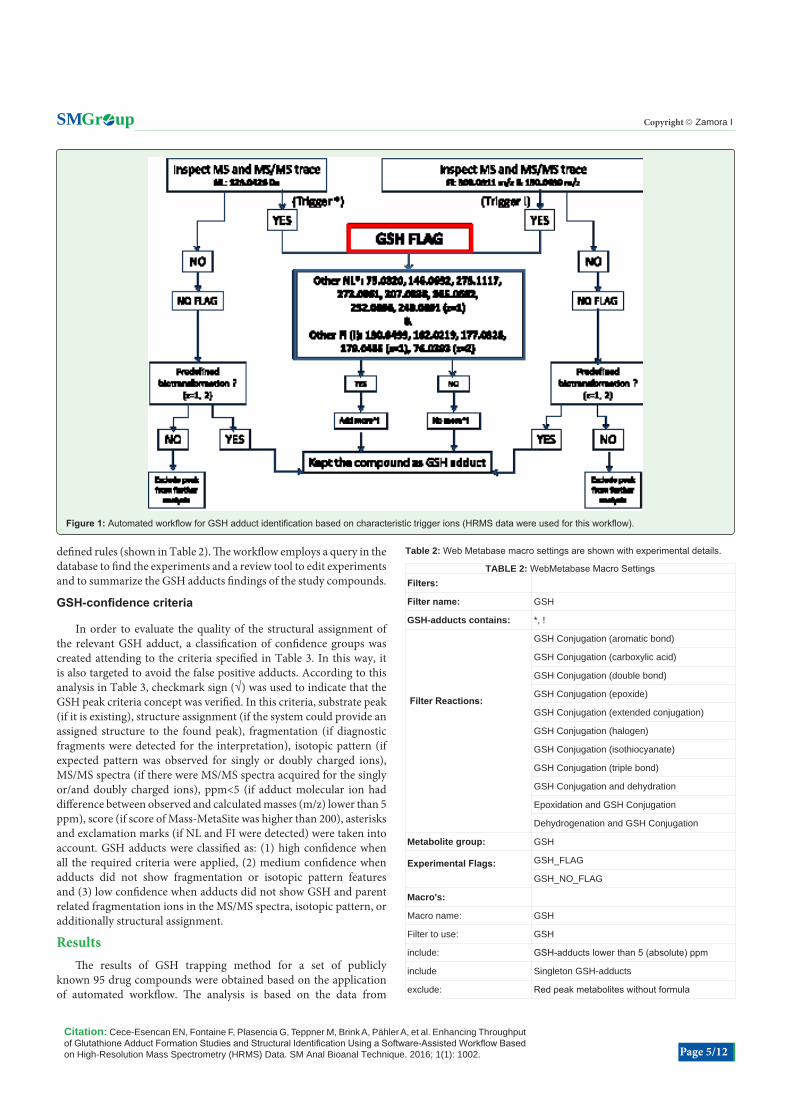
In order to process HRMS data by marking drug-GSH adducts automatically, several settings must be configured in the Mass-MetaSite/WebMetabase procedure (Figure 2A). The processed results and the raw data files were uploaded automatically by Mass-MetaSite into WebMetabase where the experimental results were consolidated. Once Mass-MetaSite settings were set (Table 1), then an experiment protocol was configured in WebMetabase to map the experimental variables/properties.
WebMetabase macro settings required to reproduce the results are reported in Table 2. A macro is a set of rules to filter the detected peaks specifically when the results were uploaded into WebMetabase. For instance, GSH adducts can be selected with a specific range of score and of MS area. A limit of absolute ppm value (m/z) and excluding
red peak metabolites (unassigned structures) from theexperiment can also be applied to restrict the adduct selection. By using the macro function in this automated workflow, the GSH adducts were sorted out and automatically assigned to a defined “GSH” metabolite group. Herein, “flags” were applied to the uploaded experiments to label them if they were containing at least one peak in the “GSH” metabolite group. The flag is a predefined variable and was named as GSH-FLAG by macro labeling system (shown in Table 2).
Figure 2B shows the utilization of the workflow for the automation of HRMS data processing. The data was loaded into the batch processor of Mass-MetaSite and treated according to the rules shown in Figure 1 and settings shown in Table 1. Then, the results were uploaded into WebMetabase. During this uploading process, the system applied the macro function to the labeled (GSH related) chromatographic peaks as GSH-FLAG in agreement with previously
Table 1: Mass MetaSite settings are shown with experimental details.
Import Protonation policy Neutralize Maximum number of conformers 20Metabolite generation Minimum mass 50 Metabolite stereochemistry and redundant metabolites ignored MIM (the percentage of the monoisotopic mass of the parent) 30% Common cytochrome P450 and GSH-conjugation reaction mechanisms allMass settings, experiment Retention time range (min) 0.5 min to 10 min GSH mode activatedMass settings, MS peaks Maximum metabolite counts limit not used Peak area threshold (%) 0.50% Peak area threshold (absolute) 100 Peak detection smoothing highExpected metabolites Rescue computed DRM peaks used Split computed DRM peaks not used Isotopes, pattern filtering tolerance (%) 20 Adducts; positive (Na+, K+, NH4+) used Neutral Losses included Dimeric Ions included Unexpected metabolites includedMass settings, charges Multiple-charge ions included and set to max (z) 2
GSH specific NL (in Da) 75.0320, 129.0426, 146.0692, 232.0696, 249.0691, 273.0961, 275.1117, 305.0682, 307.0838 applied
The NL trigger was set to 129.0426GSH specific FI (at m/z) 130.0499, 162.0219, 177.0328, 179.0485, 308.0911 applied The trigger of FI was set to 308.0911Doubly charged GSH FI (at m/z) fragment ion trigger (130.0499 m/z) and specific fragment ion (76.0393 m/z) appliedMass settings, Met ID Number of metabolite generations 3 Compound fragmenting, bond breaking limit 4 Even electron MS and MS/MS Odd electron MS and MS/MS N-Oxide MSMass settings, DD-MS/MS Mass spectrometer AB Sciex Triple-TOFalgorithms, thresholds Same peak tolerance (amu) 0.01 Chromatogram automatic filtering threshold 0.97 MS automatic filtering threshold 0.95 MS/MS automatic filtering threshold 0.85 Ionization mode positive [M+H] +
Spectra comparisons for “Maximum MS/MS level" 2 Signal filtering automatic Scan filtering automatic
Citation: Cece-Esencan EN, Fontaine F, Plasencia G, Teppner M, Brink A, Pähler A, et al. Enhancing Throughput of Glutathione Adduct Formation Studies and Structural Identification Using a Software-Assisted Workflow Based on High-Resolution Mass Spectrometry (HRMS) Data. SM Anal Bioanal Technique. 2016; 1(1): 1002. Page 5/12
Gr upSM Copyright Zamora I
defined rules (shown in Table 2). The workflow employs a query in the database to find the experiments and a review tool to edit experiments and to summarize the GSH adducts findings of the study compounds.
GSH-confidence criteria
In order to evaluate the quality of the structural assignment of the relevant GSH adduct, a classification of confidence groups was created attending to the criteria specified in Table 3. In this way, it is also targeted to avoid the false positive adducts. According to this analysis in Table 3, checkmark sign (√) was used to indicate that the GSH peak criteria concept was verified. In this criteria, substrate peak (if it is existing), structure assignment (if the system could provide an assigned structure to the found peak), fragmentation (if diagnostic fragments were detected for the interpretation), isotopic pattern (if expected pattern was observed for singly or doubly charged ions), MS/MS spectra (if there were MS/MS spectra acquired for the singly or/and doubly charged ions), ppm<5 (if adduct molecular ion had difference between observed and calculated masses (m/z) lower than 5 ppm), score (if score of Mass-MetaSite was higher than 200), asterisks and exclamation marks (if NL and FI were detected) were taken into account. GSH adducts were classified as: (1) high confidence when all the required criteria were applied, (2) medium confidence when adducts did not show fragmentation or isotopic pattern features and (3) low confidence when adducts did not show GSH and parent related fragmentation ions in the MS/MS spectra, isotopic pattern, or additionally structural assignment.
ResultsThe results of GSH trapping method for a set of publicly
known 95 drug compounds were obtained based on the application of automated workflow. The analysis is based on the data from
Figure 1: Automated workflow for GSH adduct identification based on characteristic trigger ions (HRMS data were used for this workflow).
Table 2: Web Metabase macro settings are shown with experimental details.
TABLE 2: WebMetabase Macro SettingsFilters:
Filter name: GSH
GSH-adducts contains: *, !
Filter Reactions:
GSH Conjugation (aromatic bond)
GSH Conjugation (carboxylic acid)
GSH Conjugation (double bond)
GSH Conjugation (epoxide)
GSH Conjugation (extended conjugation)
GSH Conjugation (halogen)
GSH Conjugation (isothiocyanate)
GSH Conjugation (triple bond)
GSH Conjugation and dehydration
Epoxidation and GSH Conjugation
Dehydrogenation and GSH Conjugation
Metabolite group: GSH
Experimental Flags:
GSH_FLAG
GSH_NO_FLAG
Macro's:
Macro name: GSH
Filter to use: GSH
include: GSH-adducts lower than 5 (absolute) ppm
include Singleton GSH-adducts
exclude: Red peak metabolites without formula
Citation: Cece-Esencan EN, Fontaine F, Plasencia G, Teppner M, Brink A, Pähler A, et al. Enhancing Throughput of Glutathione Adduct Formation Studies and Structural Identification Using a Software-Assisted Workflow Based on High-Resolution Mass Spectrometry (HRMS) Data. SM Anal Bioanal Technique. 2016; 1(1): 1002. Page 6/12
Gr upSM Copyright Zamora I
Precursor Ion Scanning (PreIS) of m/z 272 in negative mode, HRMS and literature review. In this article, we used the HRMS data for the purpose of presenting the described new workflow. Thus, an automated structural elucidation was accomplished for each GSH adduct based on the MS/MS fragmentation (out of HRMS data) and the MassMetaSite algorithm. The GSH adducts were fragmented under positive ion conditions. The list of generic NL and FI often observed for GSH adducts was reported previously [8]. In this article, GSH adduct identification based on doubly charged molecular ions is introduced. In addition to the singly charged the GSH adduct analytes, the new method can also use doubly charged adducts for peak detection and to trigger MS/MS (Table 4).
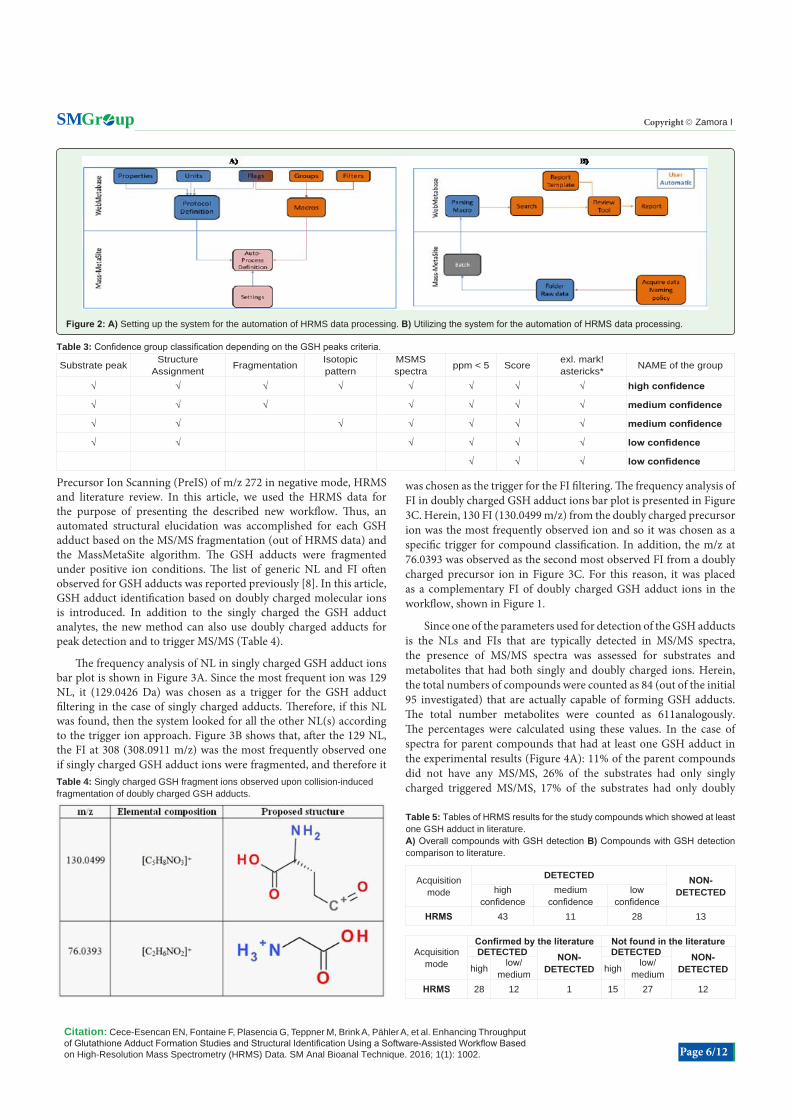
The frequency analysis of NL in singly charged GSH adduct ions bar plot is shown in Figure 3A. Since the most frequent ion was 129 NL, it (129.0426 Da) was chosen as a trigger for the GSH adduct filtering in the case of singly charged adducts. Therefore, if this NL was found, then the system looked for all the other NL(s) according to the trigger ion approach. Figure 3B shows that, after the 129 NL, the FI at 308 (308.0911 m/z) was the most frequently observed one if singly charged GSH adduct ions were fragmented, and therefore it
was chosen as the trigger for the FI filtering. The frequency analysis of FI in doubly charged GSH adduct ions bar plot is presented in Figure 3C. Herein, 130 FI (130.0499 m/z) from the doubly charged precursor ion was the most frequently observed ion and so it was chosen as a specific trigger for compound classification. In addition, the m/z at 76.0393 was observed as the second most observed FI from a doubly charged precursor ion in Figure 3C. For this reason, it was placed as a complementary FI of doubly charged GSH adduct ions in the workflow, shown in Figure 1.
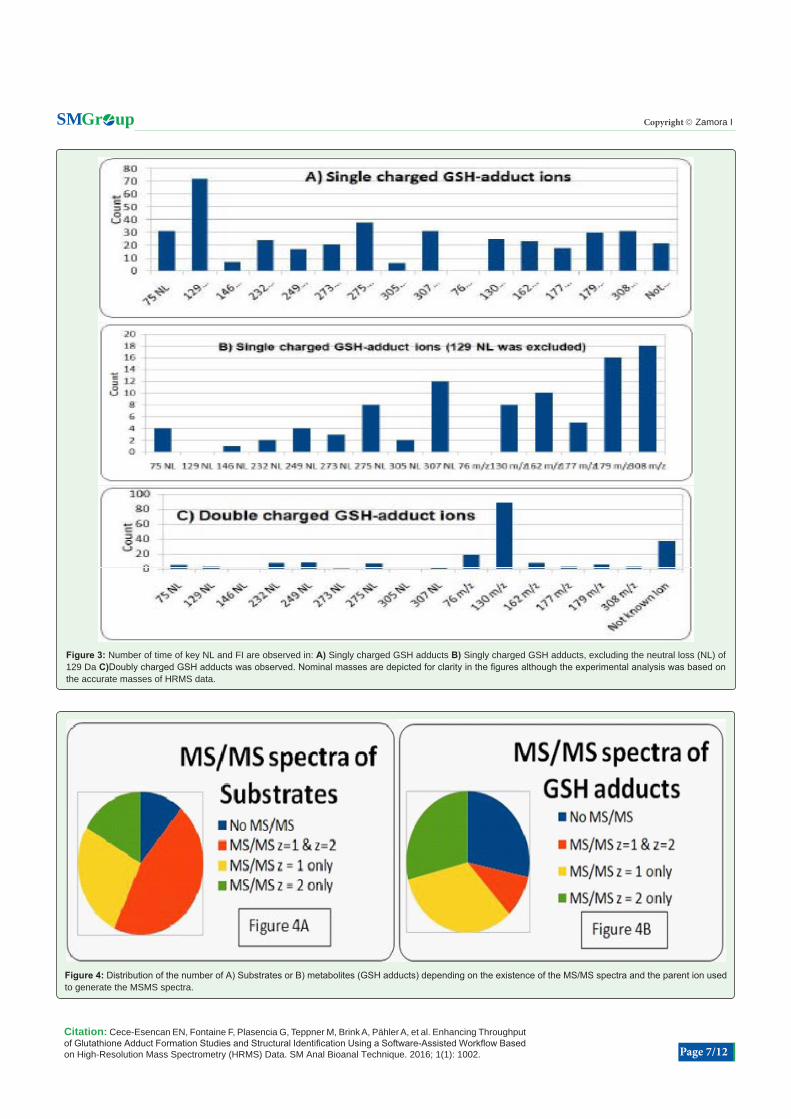
Since one of the parameters used for detection of the GSH adducts is the NLs and FIs that are typically detected in MS/MS spectra, the presence of MS/MS spectra was assessed for substrates and metabolites that had both singly and doubly charged ions. Herein, the total numbers of compounds were counted as 84 (out of the initial 95 investigated) that are actually capable of forming GSH adducts. The total number metabolites were counted as 611analogously. The percentages were calculated using these values. In the case of spectra for parent compounds that had at least one GSH adduct in the experimental results (Figure 4A): 11% of the parent compounds did not have any MS/MS, 26% of the substrates had only singly charged triggered MS/MS, 17% of the substrates had only doubly
Table 3: Confidence group classification depending on the GSH peaks criteria.
Substrate peak Structure Assignment Fragmentation Isotopic
patternMSMS spectra ppm < 5 Score exl. mark!
astericks* NAME of the group
√ √ √ √ √ √ √ √ high confidence
√ √ √ √ √ √ √ medium confidence
√ √ √ √ √ √ √ medium confidence
√ √ √ √ √ √ low confidence
√ √ √ low confidence
Figure 2: A) Setting up the system for the automation of HRMS data processing. B) Utilizing the system for the automation of HRMS data processing.
Table 4: Singly charged GSH fragment ions observed upon collision-induced fragmentation of doubly charged GSH adducts.
Table 5: Tables of HRMS results for the study compounds which showed at least one GSH adduct in literature.A) Overall compounds with GSH detection B) Compounds with GSH detection comparison to literature.
Acquisition mode
DETECTED NON-DETECTEDhigh
confidencemedium
confidencelow
confidenceHRMS 43 11 28 13
Acquisition mode
Confirmed by the literature Not found in the literatureDETECTED NON-
DETECTED
DETECTED NON-DETECTEDhigh low/
medium high low/medium
HRMS 28 12 1 15 27 12
Citation: Cece-Esencan EN, Fontaine F, Plasencia G, Teppner M, Brink A, Pähler A, et al. Enhancing Throughput of Glutathione Adduct Formation Studies and Structural Identification Using a Software-Assisted Workflow Based on High-Resolution Mass Spectrometry (HRMS) Data. SM Anal Bioanal Technique. 2016; 1(1): 1002. Page 7/12
Gr upSM Copyright Zamora I
Figure 3: Number of time of key NL and FI are observed in: A) Singly charged GSH adducts B) Singly charged GSH adducts, excluding the neutral loss (NL) of 129 Da C)Doubly charged GSH adducts was observed. Nominal masses are depicted for clarity in the figures although the experimental analysis was based on the accurate masses of HRMS data.
Figure 4: Distribution of the number of A) Substrates or B) metabolites (GSH adducts) depending on the existence of the MS/MS spectra and the parent ion used to generate the MSMS spectra.
Citation: Cece-Esencan EN, Fontaine F, Plasencia G, Teppner M, Brink A, Pähler A, et al. Enhancing Throughput of Glutathione Adduct Formation Studies and Structural Identification Using a Software-Assisted Workflow Based on High-Resolution Mass Spectrometry (HRMS) Data. SM Anal Bioanal Technique. 2016; 1(1): 1002. Page 8/12
Gr upSM Copyright Zamora I
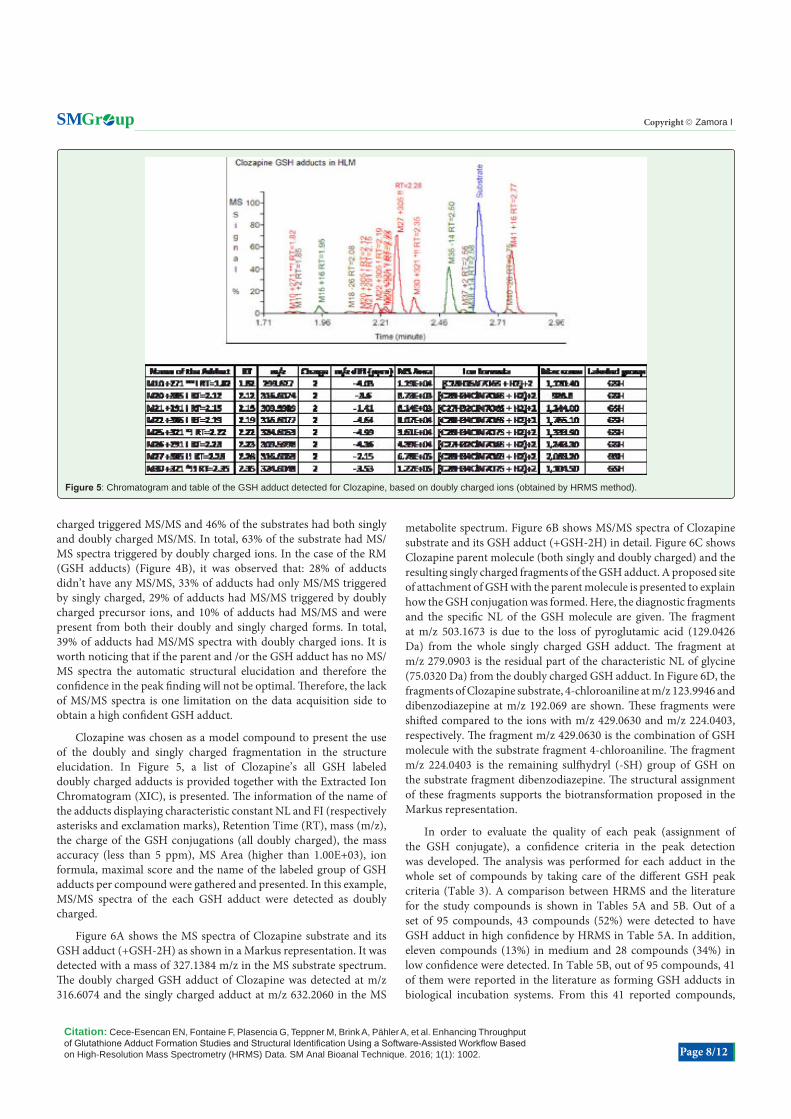
Figure 5: Chromatogram and table of the GSH adduct detected for Clozapine, based on doubly charged ions (obtained by HRMS method).
charged triggered MS/MS and 46% of the substrates had both singly and doubly charged MS/MS. In total, 63% of the substrate had MS/MS spectra triggered by doubly charged ions. In the case of the RM (GSH adducts) (Figure 4B), it was observed that: 28% of adducts didn’t have any MS/MS, 33% of adducts had only MS/MS triggered by singly charged, 29% of adducts had MS/MS triggered by doubly charged precursor ions, and 10% of adducts had MS/MS and were present from both their doubly and singly charged forms. In total, 39% of adducts had MS/MS spectra with doubly charged ions. It is worth noticing that if the parent and /or the GSH adduct has no MS/MS spectra the automatic structural elucidation and therefore the confidence in the peak finding will not be optimal. Therefore, the lack of MS/MS spectra is one limitation on the data acquisition side to obtain a high confident GSH adduct.
Clozapine was chosen as a model compound to present the use of the doubly and singly charged fragmentation in the structure elucidation. In Figure 5, a list of Clozapine’s all GSH labeled doubly charged adducts is provided together with the Extracted Ion Chromatogram (XIC), is presented. The information of the name of the adducts displaying characteristic constant NL and FI (respectively asterisks and exclamation marks), Retention Time (RT), mass (m/z), the charge of the GSH conjugations (all doubly charged), the mass accuracy (less than 5 ppm), MS Area (higher than 1.00E+03), ion formula, maximal score and the name of the labeled group of GSH adducts per compound were gathered and presented. In this example, MS/MS spectra of the each GSH adduct were detected as doubly charged.
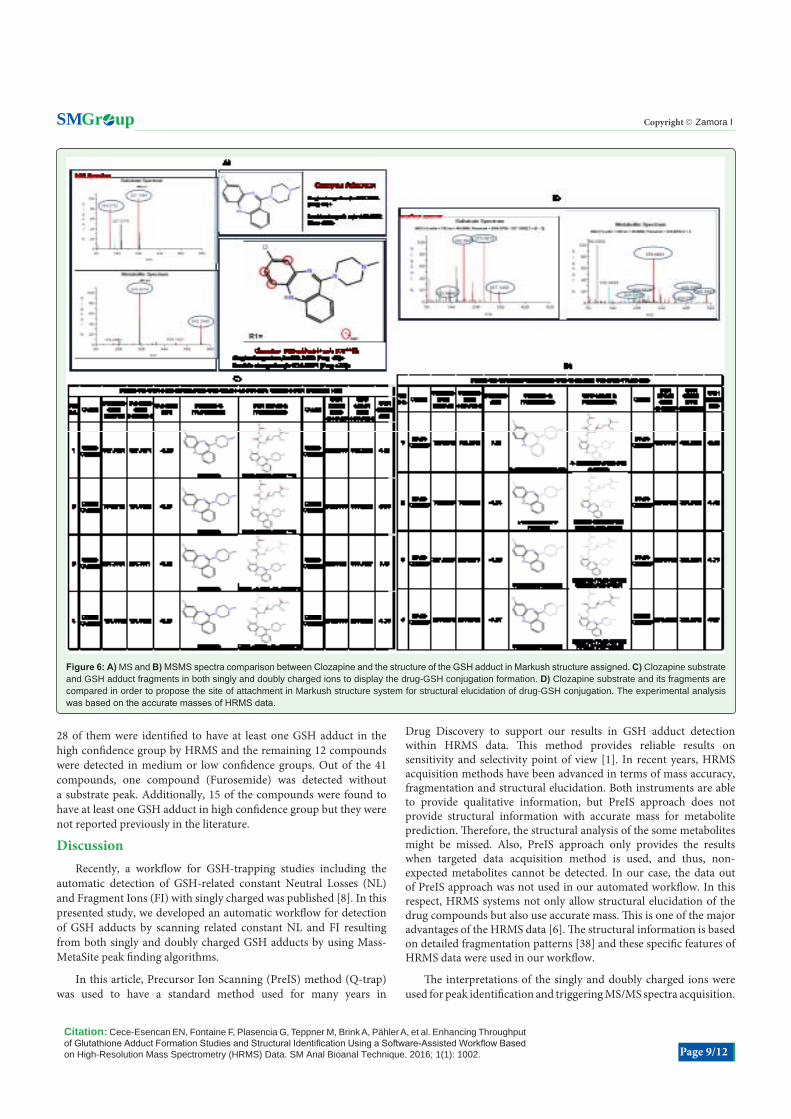
Figure 6A shows the MS spectra of Clozapine substrate and its GSH adduct (+GSH-2H) as shown in a Markus representation. It was detected with a mass of 327.1384 m/z in the MS substrate spectrum. The doubly charged GSH adduct of Clozapine was detected at m/z 316.6074 and the singly charged adduct at m/z 632.2060 in the MS
metabolite spectrum. Figure 6B shows MS/MS spectra of Clozapine substrate and its GSH adduct (+GSH-2H) in detail. Figure 6C shows Clozapine parent molecule (both singly and doubly charged) and the resulting singly charged fragments of the GSH adduct. A proposed site of attachment of GSH with the parent molecule is presented to explain how the GSH conjugation was formed. Here, the diagnostic fragments and the specific NL of the GSH molecule are given. The fragment at m/z 503.1673 is due to the loss of pyroglutamic acid (129.0426 Da) from the whole singly charged GSH adduct. The fragment at m/z 279.0903 is the residual part of the characteristic NL of glycine (75.0320 Da) from the doubly charged GSH adduct. In Figure 6D, the fragments of Clozapine substrate, 4-chloroaniline at m/z 123.9946 and dibenzodiazepine at m/z 192.069 are shown. These fragments were shifted compared to the ions with m/z 429.0630 and m/z 224.0403, respectively. The fragment m/z 429.0630 is the combination of GSH molecule with the substrate fragment 4-chloroaniline. The fragment m/z 224.0403 is the remaining sulfhydryl (-SH) group of GSH on the substrate fragment dibenzodiazepine. The structural assignment of these fragments supports the biotransformation proposed in the Markus representation.
In order to evaluate the quality of each peak (assignment of the GSH conjugate), a confidence criteria in the peak detection was developed. The analysis was performed for each adduct in the whole set of compounds by taking care of the different GSH peak criteria (Table 3). A comparison between HRMS and the literature for the study compounds is shown in Tables 5A and 5B. Out of a set of 95 compounds, 43 compounds (52%) were detected to have GSH adduct in high confidence by HRMS in Table 5A. In addition, eleven compounds (13%) in medium and 28 compounds (34%) in low confidence were detected. In Table 5B, out of 95 compounds, 41 of them were reported in the literature as forming GSH adducts in biological incubation systems. From this 41 reported compounds,
Citation: Cece-Esencan EN, Fontaine F, Plasencia G, Teppner M, Brink A, Pähler A, et al. Enhancing Throughput of Glutathione Adduct Formation Studies and Structural Identification Using a Software-Assisted Workflow Based on High-Resolution Mass Spectrometry (HRMS) Data. SM Anal Bioanal Technique. 2016; 1(1): 1002. Page 9/12
Gr upSM Copyright Zamora I
Figure 6: A) MS and B) MSMS spectra comparison between Clozapine and the structure of the GSH adduct in Markush structure assigned. C) Clozapine substrate and GSH adduct fragments in both singly and doubly charged ions to display the drug-GSH conjugation formation. D) Clozapine substrate and its fragments are compared in order to propose the site of attachment in Markush structure system for structural elucidation of drug-GSH conjugation. The experimental analysis was based on the accurate masses of HRMS data.
28 of them were identified to have at least one GSH adduct in the high confidence group by HRMS and the remaining 12 compounds were detected in medium or low confidence groups. Out of the 41 compounds, one compound (Furosemide) was detected without a substrate peak. Additionally, 15 of the compounds were found to have at least one GSH adduct in high confidence group but they were not reported previously in the literature.
DiscussionRecently, a workflow for GSH-trapping studies including the
automatic detection of GSH-related constant Neutral Losses (NL) and Fragment Ions (FI) with singly charged was published [8]. In this presented study, we developed an automatic workflow for detection of GSH adducts by scanning related constant NL and FI resulting from both singly and doubly charged GSH adducts by using Mass-MetaSite peak finding algorithms.
In this article, Precursor Ion Scanning (PreIS) method (Q-trap) was used to have a standard method used for many years in
Drug Discovery to support our results in GSH adduct detection within HRMS data. This method provides reliable results on sensitivity and selectivity point of view [1]. In recent years, HRMS acquisition methods have been advanced in terms of mass accuracy, fragmentation and structural elucidation. Both instruments are able to provide qualitative information, but PreIS approach does not provide structural information with accurate mass for metabolite prediction. Therefore, the structural analysis of the some metabolites might be missed. Also, PreIS approach only provides the results when targeted data acquisition method is used, and thus, non-expected metabolites cannot be detected. In our case, the data out of PreIS approach was not used in our automated workflow. In this respect, HRMS systems not only allow structural elucidation of the drug compounds but also use accurate mass. This is one of the major advantages of the HRMS data [6]. The structural information is based on detailed fragmentation patterns [38] and these specific features of HRMS data were used in our workflow.
The interpretations of the singly and doubly charged ions were used for peak identification and triggering MS/MS spectra acquisition.
Citation: Cece-Esencan EN, Fontaine F, Plasencia G, Teppner M, Brink A, Pähler A, et al. Enhancing Throughput of Glutathione Adduct Formation Studies and Structural Identification Using a Software-Assisted Workflow Based on High-Resolution Mass Spectrometry (HRMS) Data. SM Anal Bioanal Technique. 2016; 1(1): 1002. Page 10/12
Gr upSM Copyright Zamora I
Due to a large number of GSH adducts that form a doubly charged species upon electrospray ionization, their inclusion in the structure elucidation process was necessary. In Figure 4A and 4B, 29 % of GSH adducts and 17 % of substrates were identified from only doubly charged ions. Furthermore, in Figure 5, the data interpretation was relying on doubly charged adducts. MS/MS spectra of the GSH adducts were detected in doubly charged (z=2) and in both singly and doubly charged (z=1, 2). Therefore, the doubly charged forms should not be overlooked.
For structural elucidation of the GSH adduct, the diagnostic fragments were interpreted in Figures 6 A, B, C and D to propose the possible site of the GSH conjugation in Markus structure. As well, the specific NL of 129 and 75 were shown for both singly and doubly charged adducts, respectively. By this way, the usefulness and benefits of the new workflow for the automated doubly charged GSH adduct detection and structural elucidation was demonstrated.
In order to analyze the quality of the peaks for each structural assignment and to avoid false positive conjugations, a quality scale system was implemented. Each detected GSH adduct was assigned to a confidence group, classified in high, medium or low confidence sub-groups by considering the GSH peak criteria (Table 3). This contribution increased the evaluation speed of the detection of drug metabolites and this quality check reduced the time for getting the final analysis approximately %32. According to the results, more than half of the analyzed compounds were observed to produce GSH adducts in the high confidence group (Table 5A). However, 15 compounds were determined to have at least one GSH adduct in high confidence, yet we could not find any publishable support for these findings (Table 5B). There could be many reasons for a compound detected in this study to produce a high confident GSH adducts it was not reported before, including that these compounds were not tested in literature and therefore they were not reported.
In addition, in Table 5B, considering that the objective of the study was to improve the GSH-adducts identification, we compared the total number of compounds (particularly the ones that are known to form GSH-adducts in literature) with detected GSH adducts in cases where only singly charged ions or where the doubly-charged ions were included. According to our results, out of 28 compounds (the total number of high confidence compounds that are known to form GSH-adducts in literature), 22 compounds (79 %) were detected to form GSH adducts, where the doubly-charged ions were included. This is an important result to highlight that the inclusion of doubly charged ions significantly increases the number of detected GSH adducts.
The comparison between HRMS and literature is presented for the study compounds (in Table 5B). Out of the 12 compounds in the medium or low-quality category, one of them did not show diagnostic fragments to support the structure elucidation and one compound did not present the expected isotopic pattern in the peak. Therefore, these two compounds’ adducts were grouped in the medium confidence group. The remaining 10 compounds adducts did not show MS/MS spectra and didn’t have a structural assignment or diagnostic fragmentation to confirm the detected GSH adducts, and therefore they were counted in low confidence group. In this low confidence GSH adduct, one can find the well-known maker compound for GSH adduct formation Diclofenac. Diclofenac has
a GSH adduct as detected in MS, but not any MS/MS spectra were triggered. Even though the fragmentation was available in MS spectra, in which the NL of pyroglutamate (129 Da) on the GSH adduct could be seen, due to the missing MS/MS spectra Diclofenac was classified in low confidence group. This is one disadvantage of targeted data-depended MS/MS acquisition triggered by ion intensity because lower intensity ions have a lower probability of triggering the MS/MS spectra acquisition.
A statistical analysis of the peak MS area of GSH adducts for each confidence group showed that the median of the total MS area for the compounds in high confidence group was around ten times higher than the MS area for the medium and low confidence ones. This effect was observed in these 10 low confidence compounds. One suggestion to use Data Dependent methods is to perform a pre-acquisition analysis in Mass-MetaSite that generates a preferred list of ions (m/z that comes from the application of metabolite mechanisms on the parent compound to obtain expected metabolite structures) that may trigger the MSMS even if they are low in intensity or use a non-targeted approach where all ions are available for the interpretation.
The current analytical methodologies using automated software and manual strategies employed by biotransformation scientists to identify metabolites of small molecule compounds were discussed recently by Kind, Prakash, Zhu and Kirchmair [39-42]. The metabolite identification method used in this workflow has been successful in metabolite identification processes using MassMetaSite [43]. This new workflow allows successful identification of GSH conjugates with big data sets in a short time period. A huge amount of HRMS experimental data (around > 5 GB) is analyzed in an automated, effective way. After acquiring the data from HRMS, initial data calculation by the Mass-MetaSite took around 8 hours for all 96 compounds analyzed. Then, uploading the all experimental results to WebMetabase took an overnight. Data analysis per compound was around 10 minutes with the aid of macro function (metabolite groups and filtering options). At the end of the process, data reporting took around 5 minutes. Manually processing the GSH trapping experimental data would have taken much longer, completing all the analyzing process in a few days was also an improvement.
ConclusionsThis new approach based on automated processing of HRMS data
systems (taking advantage of scanning characteristic GSH-derived NL and FI formed from both singly and doubly charged GSH adducts) improves the detection of drug-glutathione (GSH) conjugates. A conventional workflow based on the detection of singly charged peaks alone would have missed 29% of GSH adducts and 17 % of substrates that underwent bioactivation to RM but were only detected as GSH adduct by the inclusion of doubly charged ions. It is also a powerful tool to process large datasets of analytical data to identify drug-related GSH adducts. It may serve as a valuable tool in terms of laboratory automation to accelerate the detection of RM in early drug discovery and development phases. In order to detect GSH adducts with a low area with a data dependent approach, it is recommended to have a pre-defined list of ions obtained from a virtual synthesis of all potential metabolite structures that may trigger the MSMS acquisition. Pre-defined list of all potential metabolite structures to detect GSH adducts within low MS area strategy has been proven to be successful in detecting metabolites from in vivo analysis using MassMetaSite
Citation: Cece-Esencan EN, Fontaine F, Plasencia G, Teppner M, Brink A, Pähler A, et al. Enhancing Throughput of Glutathione Adduct Formation Studies and Structural Identification Using a Software-Assisted Workflow Based on High-Resolution Mass Spectrometry (HRMS) Data. SM Anal Bioanal Technique. 2016; 1(1): 1002. Page 11/12
Gr upSM Copyright Zamora I
[43]. The acquired structural information and biotransformation data enables the Drug Metabolism and Pharmacokinetics (DMPK) expert to translate the HRMS data from information into usable knowledge for the GSH conjugates in a highly automated and quick way.
Supporting InformationGSH reports of each study compounds and GSH adduct existence
list per compounds are available free of charge via the Internet at http://pubs.acs.org
Funding InformationThis work was supported by Drug Metabolism &
Pharmacokinetics, Pharma Research and Early Development, pRED; F. Hoffmann-La Roche Ltd., Basel, Switzerland and Lead Molecular Design, S.L. San Cugat del Valles, Spain.
AcknowledgementsThe authors would like to thank Dr. Manuel Pastor and Dr.
Blanca Serra for their constructive discussions and critical reading of the manuscript.
References
1. Dieckhaus CM, Fernández-Metzler CL, King R, Krolikowski PH, Baillie TA. Negative ion tandem mass spectrometry for the detection of glutathione conjugates. Chem Res Toxicol. 2005; 18: 630-638.
2. Nakayama S, Atsumi R, Takakusa H, Kobayashi Y, Kurihara A, Nagai Y, et al. A Zone Classification System for Risk Assessment of Idiosyncratic Drug Toxicity Using Daily Dose and Covalent Binding. Drug Metab Dispos. 2009; 37: 1970-1977.
3. Stepan AF, Walker DP, Bauman J, Price DA, Baillie TA, Kalgutkar AS, et al. Structural alert/reactive metabolite concept as applied in medicinal chemistry to mitigate the risk of idiosyncratic drug toxicity: a perspective based on the critical examination of trends in the top 200 drugs marketed in the United States. Chem Res Toxicol. 2011; 24: 1345-1410.
4. Schadt S, Simon S, Kustermann S, Boess F, McGinnis C, Brink A, et al. Minimizing DILI risk in drug discovery - a screening tool for drug candidates. Toxicol In Vitro. 2015; 30: 429-437.
5. De Hoffmann E. Tandem mass spectrometry: A primer. J Mass Spectrom. 1996; 31: 129-137.
6. Guo B, Chen B, Liu A, Zhu W, Yao S. Liquid Chromatography-Mass Spectrometric Multiple Reaction Monitoring-based Strategies for Expanding Targeted Profiling towards Quantitative Metabolomics. Curr. Drug Metab. 2012; 13: 1226-1243.
7. Xie C, Zhong D, Chen X. A fragmentation-based method for the differentiation of glutathione conjugates by high-resolution mass spectrometry with electrospray ionization. Anal Chim Acta. 2013; 788: 89-98.
8. Brink A, Fontaine F, Marschmann M, Steinhuber B, Cece EN, Zamora I, et al. Post-acquisition analysis of untargeted accurate mass quadrupole time-of-flight MSE data for multiple collision-induced neutral losses and fragment ions of glutathione conjugates. Rapid Commun Mass Spectrom. 2014; 28: 2695-2703.
9. Bonn B, Leandersson C, Fontaine F, Zamora I. Enhanced metabolite identification with MS(E) and a semi- automated software for structural elucidation. Rapid Commun Mass Spectrom. 2010; 24: 3127-3138.
10. Zamora I, Fontaine F, Serra B, Plasencia G. High-throughput, computer assisted, specific MetID. A revolution for drug discovery. Drug Discov Today Technol. 2013; 10: e199-205.
11. Pähler A, Brink A. Software aided approaches to structure-based metabolite identification in drug discovery and development. Drug Discov Today Technol. 2013; 10: e207-217.
12. Eling TE, Mason RP, Sivarajah K. The formation of aminopyrine cation radical by the peroxidase activity of prostaglandin H synthase and subsequent reactions of the radical. J Biol Chem. 1985. 260: 1601-1607.
13. Zhu X, Kalyanaraman N, Subramanian R. Enhanced screening of glutathione-trapped reactive metabolites by in-source collision-induced dissociation and extraction of product ion using UHPLC-high resolution mass spectrometry. Anal Chem. 2011; 83: 9516-9523.
14. Bu HZ, Zhao P, Dalvie DK, Pool WF. Identification of primary and sequential bioactivation pathways of carbamazepine in human liver microsomes using liquid chromatography/tandem mass spectrometry. Rapid Commun Mass Spectrom. 2007; 21: 3317-3322.
15. Prieto JA, Jiménez RM, Alonso RM. Quantitative determination of the angiotensin-converting enzyme inhibitor cilazapril and its active metabolite cilazaprilat in pharmaceuticals and urine by high-performance liquid chromatography with amperometric detection. J Chromatogr B Biomed Sci Appl. 1998; 714: 285-292.
16. MacDonald C, Smith C, Michopoulos F, Weaver R, Wilson ID. Identification and quantification of glutathione adducts of clozapine using ultra-high-performance liquid chromatography with orthogonal acceleration time-of-flight mass spectrometry and inductively coupled plasma mass spectrometry. Rapid Commun Mass Spectrom. 2011; 25: 1787-1793.
17. Kang P, Dalvie D, Smith E, Zhou S, Deese A, Nieman JA. Bioactivation of flutamide metabolites by human liver microsomes. Drug Metab Dispos. 2008; 36: 1425-1437.
18. Fitch WL, Chen Y, Liu L, Paehler A, Young M. Application of Modern Drug Metabolism Structure Determination Tools and Assays to the In Vitro Metabolism of Imiloxan. Drug Metab Lett. 2010; 4: 77-87.
19. Isbister GK, Hackett LP, Dawson AH, Whyte IM, Smith AJ. Moclobemide poisoning: Toxicokinetics and occurrence of serotonin toxicity. Br J Clin Pharmacol. 2003; 56: 441-450.
20. Kalgutkar AS, Vaz AD, Lame ME, Henne KR, Soglia J, Zhao SX, et al. Bioactivation of the nontricyclic antidepressant nefazodone to a reactive quinone-imine species in human liver microsomes and recombinant cytochrome P450 3A4. Drug Metab Dispos. 2005; 33: 243-253.
21. Nakayama S, Takakusa H, Watanabe A, Miyaji Y, Suzuki W, Sugiyama D, et al. Combination of GSH trapping and time-dependent inhibition assays as a predictive method of drugs generating highly reactive metabolites. Drug Metab Dispos. 2011; 39: 1247-1254.
22. Wen B, Chen Y, Fitch WL. Metabolic activation of nevirapine in human liver microsomes: Dehydrogenation and inactivation of cytochrome P450 3A4. Drug Metab Dispos. 2009; 37: 1557-1562.
23. Iqbal M, Okada S. Induction of NAD(P)H:quinone Reductase by Probucol: A Possible Mechanism for Protection against Chemical Carcinogenesis and Toxicity. Pharmacol Toxicol. 2003; 93: 259-263.
24. Bergström MA, Isin EM, Castagnoli N Jr, Milne CE. Bioactivation Pathways of the Cannabinoid Receptor 1 Antagonist Rimonabant. Drug Metab Dispos. 2011; 39: 1823-1832.
25. Wen B, Fitch WL. Screening and characterization of reactive metabolites using glutathione ethyl ester in combination with Q-trap mass spectrometry. J Mass Spectrom. 2009; 44: 90-100.
26. Nishiya T, Kato M, Suzuki T, Maru C, Kataoka H, Hattori C, et al. Involvement of cytochrome P450-mediated metabolism in tienilic acid hepatotoxicity in rats. Toxicol Lett. 2008; 183: 81-89.
27. Alvarez-Sánchez R, Montavon F, Hartung T, Pähler A. Thiazolidinedione bioactivation: A comparison of the bioactivation potentials of troglitazone, rosiglitazone, and pioglitazone using stable isotope-labeled analogues and liquid chromatography tandem mass spectrometry. Chem Res Toxicol. 2006; 19: 1106-1116.
28. Kassahun K, Skordos K, McIntosh I, Slaughter D, Doss GA, Baillie TA, et al. Zafirlukast metabolism by cytochrome P450 3A4 produces an electrophilic alpha,beta-unsaturated iminium species that results in the selective
Citation: Cece-Esencan EN, Fontaine F, Plasencia G, Teppner M, Brink A, Pähler A, et al. Enhancing Throughput of Glutathione Adduct Formation Studies and Structural Identification Using a Software-Assisted Workflow Based on High-Resolution Mass Spectrometry (HRMS) Data. SM Anal Bioanal Technique. 2016; 1(1): 1002. Page 12/12
Gr upSM Copyright Zamora I
mechanism-based inactivation of the enzyme. Chem Res Toxicol. 2005; 18: 1427-1437.
29. Saha B, Mukherjee A, Samanta S, Saha P, Ghosh AK, Santra CR, et al. Caffeine augments Alprazolam induced cytotoxicity in human cell lines. Toxicol In Vitro. 2009; 23: 1100-1109.
30. Navarro VJ, Senior JR. Drug-related hepatotoxicity. N Engl J Med. 2006; 7: 731-739.
31. Hosomi H, Fukami T, Iwamura A, Nakajima M, Yokoi T. Development of a highly sensitive cytotoxicity assay system for CYP3A4-mediated metabolic activation. Drug Metab Dispos. 2011; 39: 1388-1395.
32. Takenoshita R, Toki S. New aspects of hexobarbital metabolism: stereoselective metabolism, new metabolic pathway via GSH conjugation, and 3-hydroxyhexobarbital dehydrogenases. Yakugaku Zasshi. 2004; 124: 857-871.
33. Mannens G, Huang ML, Meuldermans W, Hendrickx J, Woestenborghs R, Heykants J. Absorption, metabolism, and excretion of risperidone in humans. Drug Metab Dispos. 1993; 21: 1134-1141.
34. Baer BR, DeLisle RK, Allen A. Benzylic oxidation of gemfibrozil-1-O-beta-glucuronide by P450 2C8 leads to heme alkylation and irreversible inhibition. Chem Res Toxicol. 2009; 22: 1298-1309.
35. Kulkarni GS, Reddy DN. Design, Development and Evaluation of Sumatriptan Succinate Transdermal Patches. Int J Pharm Sci Res. 2012; 3: 1656-1662.
36. Stachulski AV, Baillie TA, Park BK, Obach RS, Dalvie DK, Williams DP, et al. The generation, detection, and effects of reactive drug metabolites. Med Res Rev. 2013; 33: 985-1080.
37. Zelesky V, Schneider R, Janiszewski J, Zamora I, Ferguson J, Troutman M. Software automation tools for increased throughput metabolic soft-spot identification in early drug discovery. Bioanalysis, 2013; 5: 1165-1179.
38. Perchalski RJ, Yost RA, Wilder BJ. Structural elucidation of drug metabolites by triple-quadrupole mass spectrometry. Anal Chem. 1982; 54: 1466-1471.
39. Kind T, Fiehn O. Advances in structure elucidation of small molecules using mass spectrometry. Bioanal Rev. 2010: 2: 23-60.
40. Prakash C, Shaffer CL, Nedderman A. Analytical strategies for identifying drug metabolites. Mass Spectrom Rev. 2007; 26: 340-369.
41. Zhu M, Zhang H, Humphreys WG. Drug metabolite profiling and identification by high-resolution mass spectrometry. J Biol Chem. 2011; 286: 25419-25425.
42. Kirchmair J, Göller AH, Lang D, Kunze J, Testa B, Wilson ID, et al. Predicting drug metabolism: experiment and/or computation? Nat Rev Drug Discov. 2015; 14: 387-404.
43. Li AC, Chovan JP, Yu E, Zamora I. Update on hydrocodone metabolites in rats and dogs aided with a semi-automatic software for metabolite identification Mass-MetaSite. Xenobiotica. 2013; 43: 390-398.
![Review Article Role of Glutathione in Cancer Progression ...downloads.hindawi.com/journals/omcl/2013/972913.pdf · GCL and glutathione S-transferases [ ]. 2. GSH Biosynthesis Glutathione](https://img.pdfslide.us/doc/110x75/5edbd12aad6a402d666637cd/review-article-role-of-glutathione-in-cancer-progression-gcl-and-glutathione.jpg)