Embed Size (px)
Citation preview
For comments, suggestions or further inquiries please contact:
Philippine Institute for Development StudiesSurian sa mga Pag-aaral Pangkaunlaran ng Pilipinas
The PIDS Discussion Paper Seriesconstitutes studies that are preliminary andsubject to further revisions. They are be-ing circulated in a limited number of cop-ies only for purposes of soliciting com-ments and suggestions for further refine-ments. The studies under the Series areunedited and unreviewed.
The views and opinions expressedare those of the author(s) and do not neces-sarily reflect those of the Institute.
Not for quotation without permissionfrom the author(s) and the Institute.
The Research Information Staff, Philippine Institute for Development Studies5th Floor, NEDA sa Makati Building, 106 Amorsolo Street, Legaspi Village, Makati City, PhilippinesTel Nos: (63-2) 8942584 and 8935705; Fax No: (63-2) 8939589; E-mail: [email protected]
Or visit our website at http://www.pids.gov.ph
January 2014
DISCUSSION PAPER SERIES NO. 2014-07
Enhancing Supply Chain Connectivity andCompetitiveness of ASEAN Agricultural
Products: Identifying Chokepoints
and Opportunities for ImprovementsRoehlano M. Briones and Danilo C. Israel
1
Enhancing Supply Chain Connectivity and Competitiveness of ASEAN Agricultural Products: Identifying Chokepoints and Opportunities for Improvement
PHILIPPINES COUNTRY STUDY
Roehlano M. Briones and Danilo C. Israel1
Abstract
This study examines “choke points” in the supply chain of two selected commodity groups that are of interest to the ASEAN region; within the HS15 group the study focuses on crude coconut oil (CNO); for HS03 the study covers fish and crustacean, mollusks, and other aquatic invertebrates (HS 03). For CNO, no major chokepoints have been identified from millsite to export stages; cost and delay factors can be found at the farm to mill stage, namely low farm productivity, poor postharvest practices (leading to low quality of copra), and inefficiencies in marketing to the mill. Meanwhile for fisheries, several chokepoints have been identified, namely: i) Domestic road conditions (quality, vehicle capacity, quantity); ii) Inter-island shipping (high cost, inadequate service); iii) Conditions in some ports (inadequate; a weak link in the cold chain); iv) Compliance with SPS regulations; and v) Certified laboratories (inadequate number). The study recommends specific types of road investments, competition policy in domestic shipping (both CNO and fisheries), industry restructing in the case of coconut, and SPS measures in the case of fisheries.
Keywords: agriculture supply chain, infrastructure, logistics, choke points, connectivity
1 The authors are Senior Research Fellows at the Philippine Institute for Development Studies. Research assistance was provided by Ma. Diyina Gem Arbo and Ivory Myka Galang, both Research Analyst II of PIDS. This study is part of a multi-country project of the Economic Research Institute for ASEAN and East Asia (ERIA) entitled: “Enhancing Supply Chain Connectivity and Competitiveness of ASEAN Agriculture Products: Identifying Chokepoints and Opportunities for Improvement”. The paper will also appear as ERIA Discussion Paper. The usual disclaimer applies.
2
1. INTRODUCTION
1.1. Aims and scope
The AEC Blueprint identifies agriculture as a priority area for integration, with action points relating to good agricultural practices, harmonized standards, and monitoring of tariff reduction under the AFTA CEPT. Beyond tariff reduction, non-tariff measures, logistics, infrastructure, and trade facilitation, have also been identified as critical aspects of ASEAN integration, according to the Midterm Review of the AEC Blueprint.
This national assessment is part of a multi-country project that examines “chokepoints” in the supply chain of agricultural products within AMSs and the whole ASEAN region. The main objective of the exercise is to help improve the movement of goods from farm to firms and consumers domestically and regionally, thereby moving towards a single production base in agricultural products in the ASEAN region.
The national level analysis focuses on the production network of two selected commodity groups that are of interest to the region, namely: 1) Animal/vegetable fats and oils, etc (HS 15); and 2) Fish and crustacean, mollusks, and other aquatic invertebrates (HS 03). Both commodity groups are important in intra-ASEAN agricultural trade.
1.2. Method and organization of the study
The study focuses on policy and institutional constraints which lead to chokepoints in the agricultural supply chains. Following ABAC Research Team (2011), a chokepoint refers to impediments in the supply chain which when removed allow supply chain participants to realize cost or time savings, or both. Identifying and evaluating these chokepoints relies on interviews of key informants and secondary information from related studies.
Interviews are structured according to questionnaires provided by the multi-country project. The survey covers key informants from associations, transport and logistics service providers, and other private stakeholders involved in the supply chain to determine the relative importance of the various major choke points in the supply chain of the two selected commodity. Also to be surveyed and/or interviewed are concerned government officials in order to capture the policy, regulatory, and institutional issues affecting the supply chain. The interview sessions will also be an opportunity for informants to give their suggestions in enhancing the supply chain connectivity domestically and internationally.
The remainder of this report is organized as follows: Section 2 describes the two selected commodity groups. Section 3 presents the assessment of chokepoints, mainly from the primary data collected; Section 4 extends this assessment to an analysis of policy, regulatory, and institutional issues related to the supply chains of the two groups. Section 5 concludes and states recommendations.
3
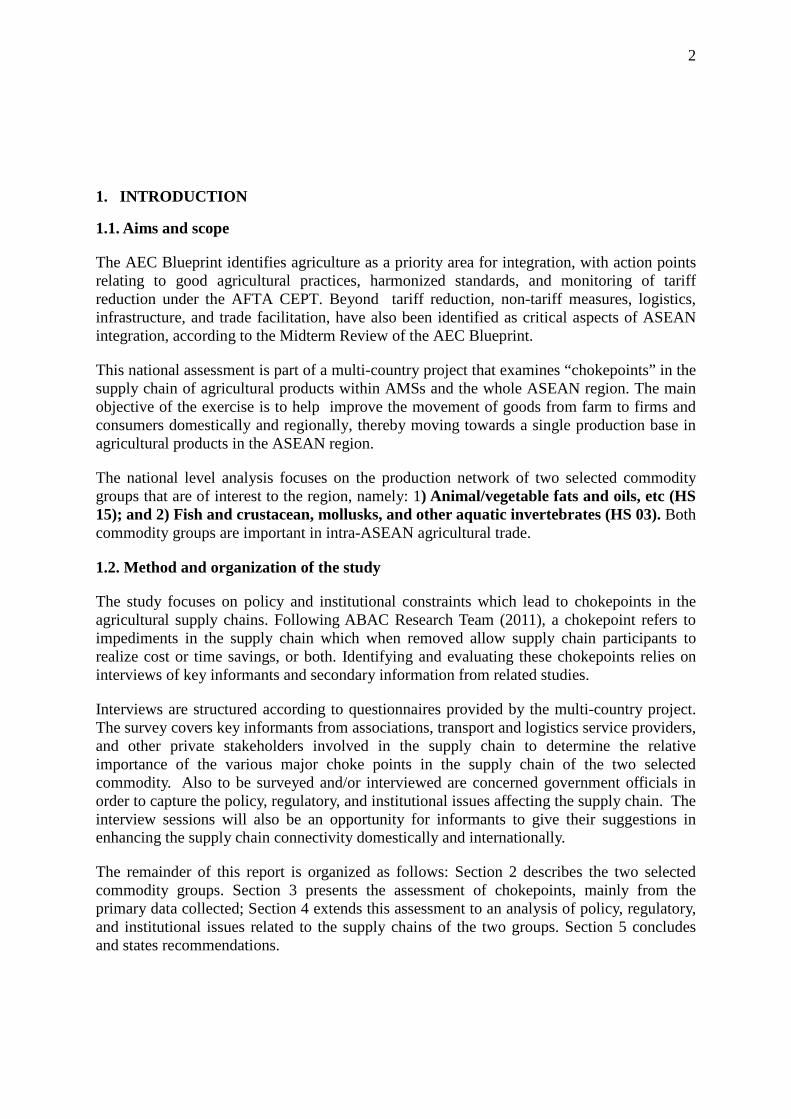
Figure 1: Value of world exports by origin, $ millions, 2001 – 2012
S d
341 280 399 417 483 402 508665
408
979 962
64495 122
99221
346
197
467
565
268
357531
640
0
200
400
600
800
1,000
1,200
1,400
1,600
1,800
2,000
2001 2002 2003 2004 2005 2006 2007 2008 2009 2010 2011 2012
Philippines Indonesia Other countries
2. DESCRIPTION OF THE SELECTED COMMODITY GROUPS
2.1. The fats and oils sector in the Philippines
2.1.1. Product description and importance
The Philippines has a sizable animal/vegetable fats and oils industry for export. This covers a wide variety of products, including palm oil, animal fats, etc. Over the past decade, close to 100% of the country's exports in this sector consists of coconut oil (CNO). The Philippines is the world's largest exporter of CNO, though in recent years Indonesia has rapidly closed the gap in exports (Figure 1). In this study the assessment of choke points and supply chain for the animal and vegetable fats and oils industry is limited to CNO.
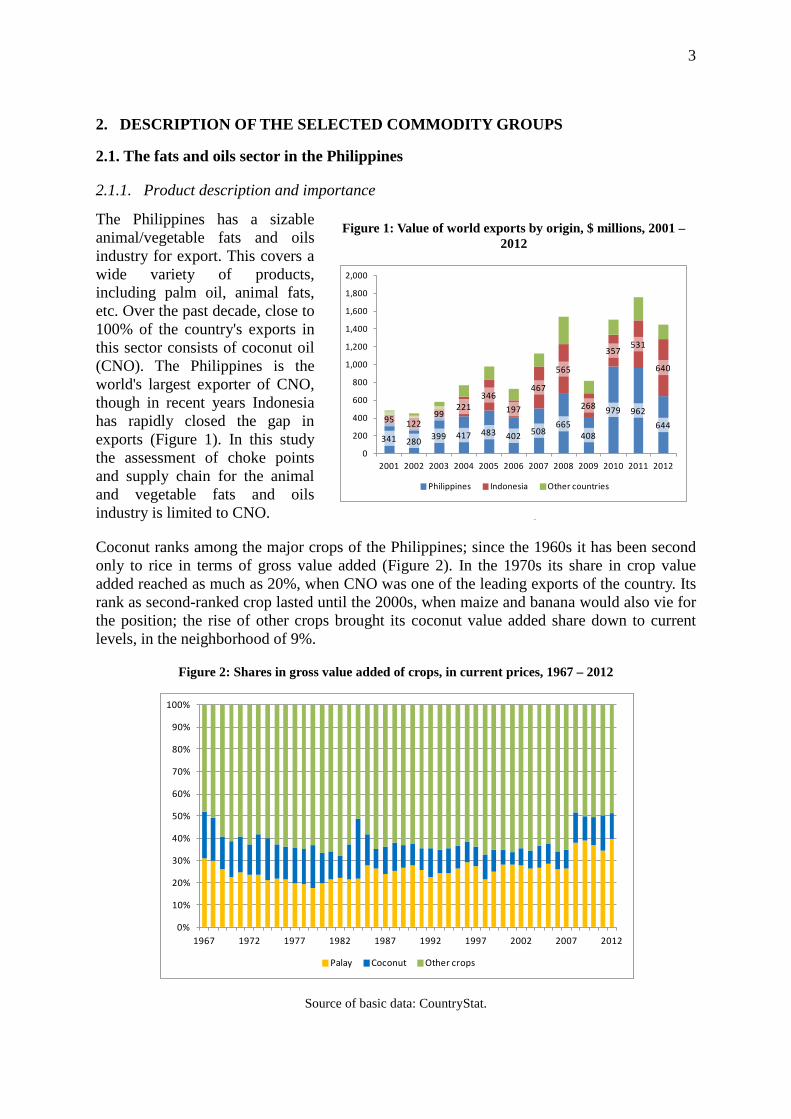
Coconut ranks among the major crops of the Philippines; since the 1960s it has been second only to rice in terms of gross value added (Figure 2). In the 1970s its share in crop value added reached as much as 20%, when CNO was one of the leading exports of the country. Its rank as second-ranked crop lasted until the 2000s, when maize and banana would also vie for the position; the rise of other crops brought its coconut value added share down to current levels, in the neighborhood of 9%.
Figure 2: Shares in gross value added of crops, in current prices, 1967 – 2012
Source of basic data: CountryStat.
0%
10%
20%
30%
40%
50%
60%
70%
80%
90%
100%
1967 1972 1977 1982 1987 1992 1997 2002 2007 2012
Palay Coconut Other crops
4
Production has been growing slowly over time (Table 1). The majority of output produced is in the southern island group of Mindanao. This is followed by the northern island group of Luzon, where production is concentrated in Southern Tagalog (the region surrounding Metro Manila, the National Capital Region).
Table 1: Coconut production by island group and selected regions, in '000 t
1991 2001 2011 Growth rate (%) 1991 - 2011
PHILIPPINES 11,292.5 13,146.1 15,244.6 1.3 LUZON 2,711.8 3,126.3 3,617.3 1.7 Southern Tagalog 1,416.9 1,258.3 1,390.9 0.6 Bicol 804.9 1,122.5 1,201.7 2.5 VISAYAS 1,469 2,279 2,668 2.5 Eastern 931 1,515 1,770 3.0 MINDANAO 7,111 7,741 8,959 1.1 Western 955 1,268 1,558 2.9 Northern 889 1,374 1,746 4.0 Davao 2,855 2,653 2,627 -0.3 ARMM 918 1,103 1,269 1.2
Note: breakdown selects only regions with output greater than 1 million tons. Source: BAS.
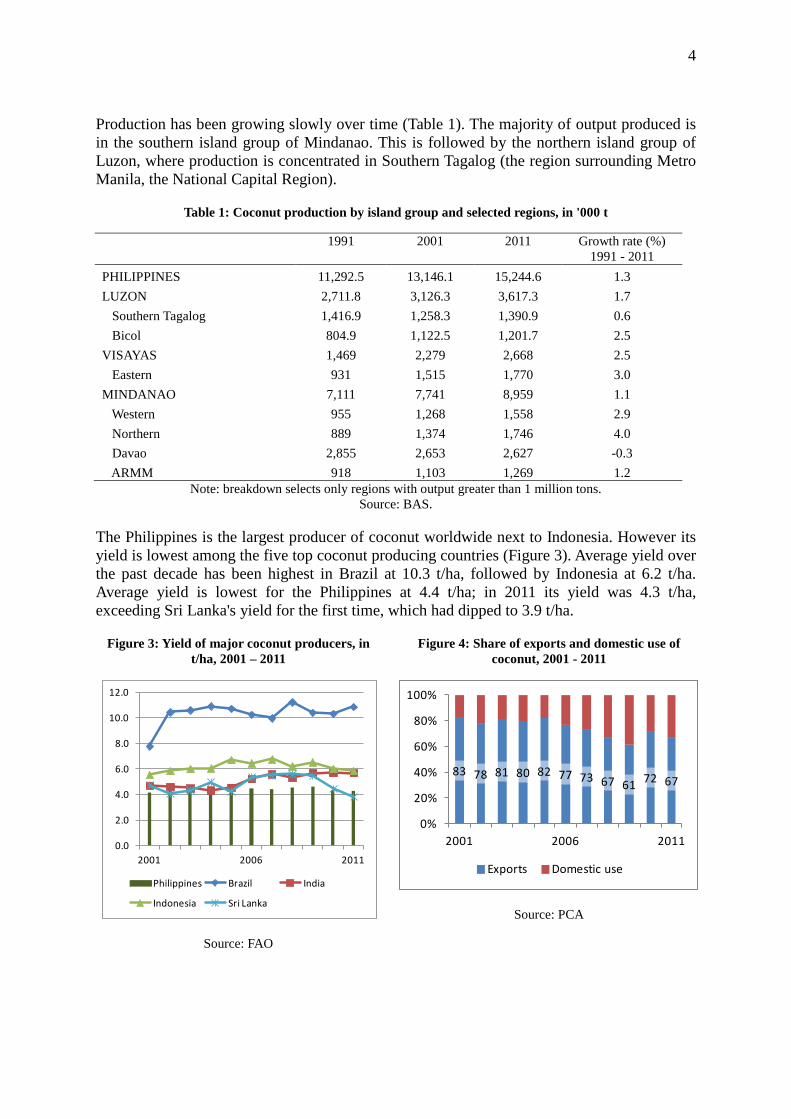
The Philippines is the largest producer of coconut worldwide next to Indonesia. However its yield is lowest among the five top coconut producing countries (Figure 3). Average yield over the past decade has been highest in Brazil at 10.3 t/ha, followed by Indonesia at 6.2 t/ha. Average yield is lowest for the Philippines at 4.4 t/ha; in 2011 its yield was 4.3 t/ha, exceeding Sri Lanka's yield for the first time, which had dipped to 3.9 t/ha.
Figure 3: Yield of major coconut producers, in t/ha, 2001 – 2011
Source: FAO
Figure 4: Share of exports and domestic use of coconut, 2001 - 2011
Source: PCA
0.0
2.0
4.0
6.0
8.0
10.0
12.0
2001 2006 2011
Philippines Brazil India
Indonesia Sri Lanka
83 78 81 80 82 77 73 67 61 72 67
0%
20%
40%
60%
80%
100%
2001 2006 2011
Exports Domestic use
5
Imports of coconut or crude coconut oil into the country are negligible. Supply and utilization is accounted for by production, exports, and domestic consumption (Figure 4). The bulk of domestic production is exported, though the proportion has fallen over the past decade, from as much as 83% in 2011, down to 67% in 2011.
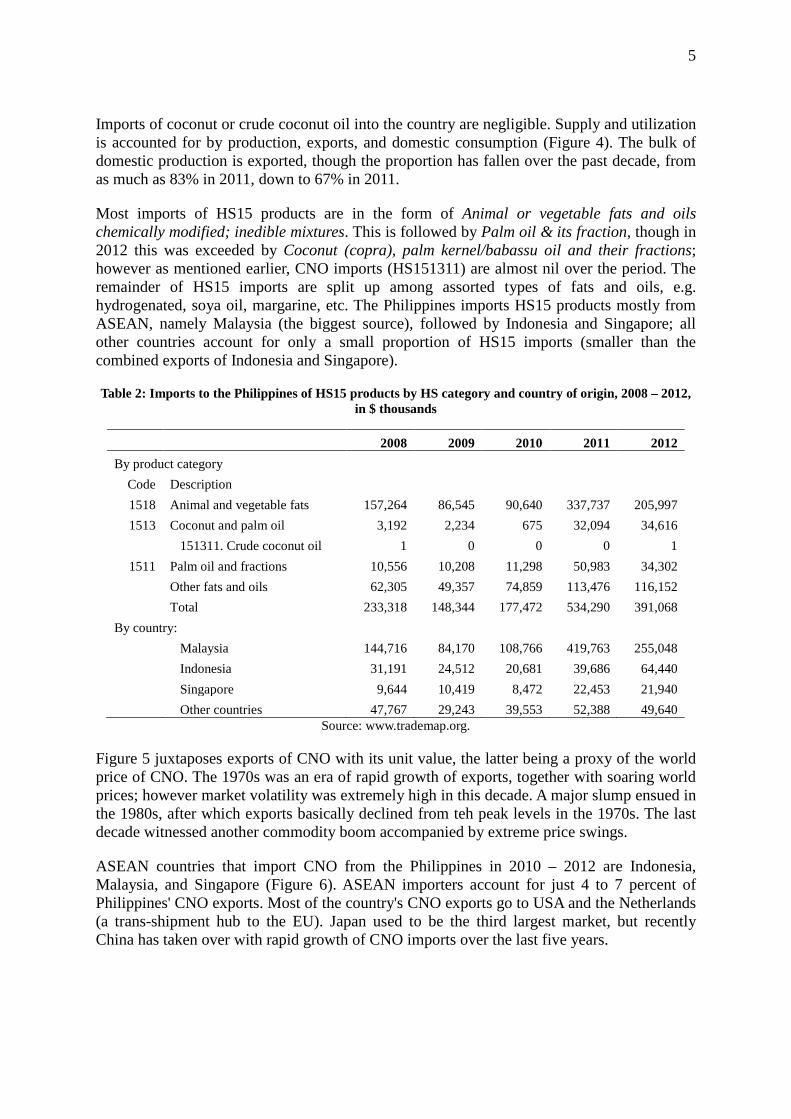
Most imports of HS15 products are in the form of Animal or vegetable fats and oils chemically modified; inedible mixtures. This is followed by Palm oil & its fraction, though in 2012 this was exceeded by Coconut (copra), palm kernel/babassu oil and their fractions; however as mentioned earlier, CNO imports (HS151311) are almost nil over the period. The remainder of HS15 imports are split up among assorted types of fats and oils, e.g. hydrogenated, soya oil, margarine, etc. The Philippines imports HS15 products mostly from ASEAN, namely Malaysia (the biggest source), followed by Indonesia and Singapore; all other countries account for only a small proportion of HS15 imports (smaller than the combined exports of Indonesia and Singapore).
Table 2: Imports to the Philippines of HS15 products by HS category and country of origin, 2008 – 2012, in $ thousands
2008 2009 2010 2011 2012
By product category Code Description 1518 Animal and vegetable fats 157,264 86,545 90,640 337,737 205,997
1513 Coconut and palm oil 3,192 2,234 675 32,094 34,616
151311. Crude coconut oil 1 0 0 0 1
1511 Palm oil and fractions 10,556 10,208 11,298 50,983 34,302
Other fats and oils 62,305 49,357 74,859 113,476 116,152
Total 233,318 148,344 177,472 534,290 391,068
By country:
Malaysia 144,716 84,170 108,766 419,763 255,048
Indonesia 31,191 24,512 20,681 39,686 64,440
Singapore 9,644 10,419 8,472 22,453 21,940
Other countries 47,767 29,243 39,553 52,388 49,640
Source: www.trademap.org.
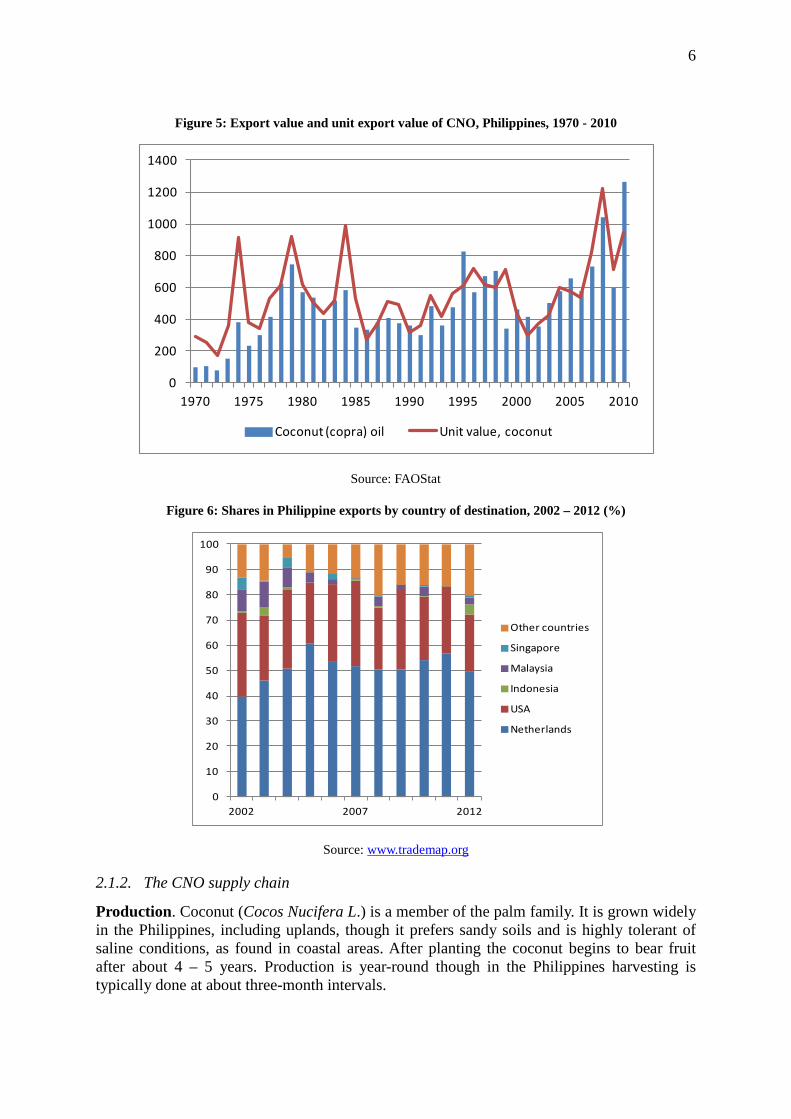
Figure 5 juxtaposes exports of CNO with its unit value, the latter being a proxy of the world price of CNO. The 1970s was an era of rapid growth of exports, together with soaring world prices; however market volatility was extremely high in this decade. A major slump ensued in the 1980s, after which exports basically declined from teh peak levels in the 1970s. The last decade witnessed another commodity boom accompanied by extreme price swings.
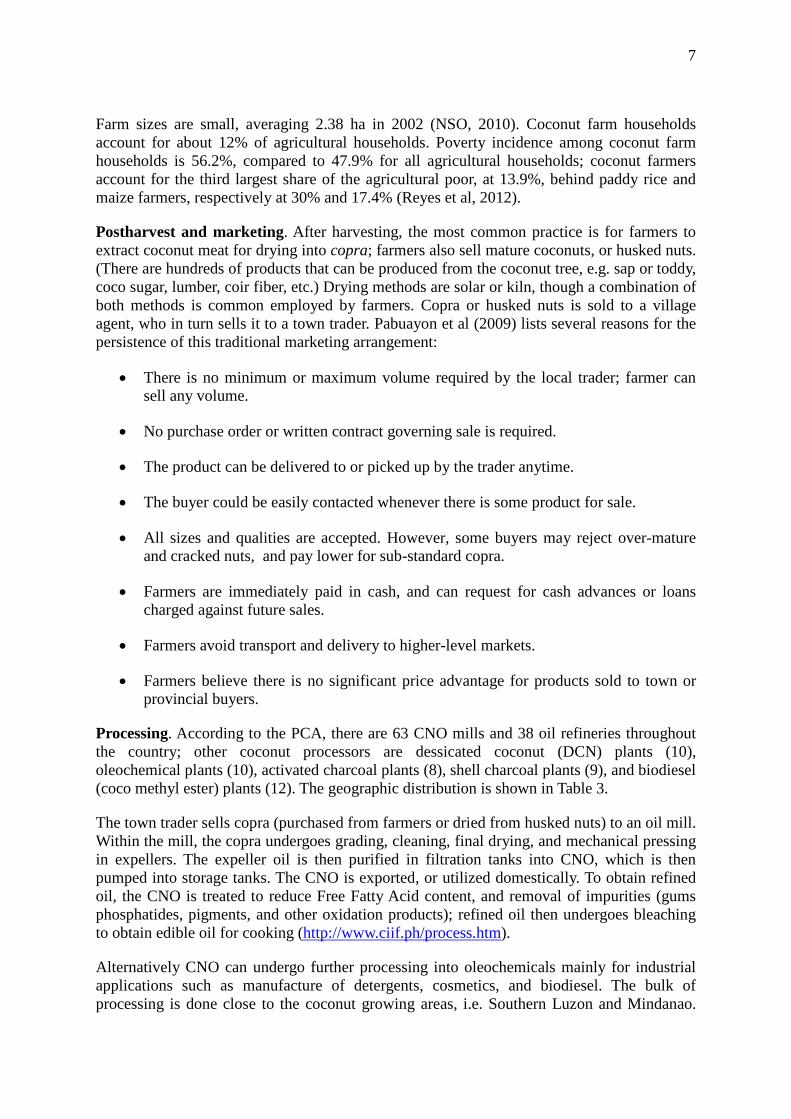
ASEAN countries that import CNO from the Philippines in 2010 – 2012 are Indonesia, Malaysia, and Singapore (Figure 6). ASEAN importers account for just 4 to 7 percent of Philippines' CNO exports. Most of the country's CNO exports go to USA and the Netherlands (a trans-shipment hub to the EU). Japan used to be the third largest market, but recently China has taken over with rapid growth of CNO imports over the last five years.
6
Figure 5: Export value and unit export value of CNO, Philippines, 1970 - 2010
Source: FAOStat
Figure 6: Shares in Philippine exports by country of destination, 2002 – 2012 (%)
Source: www.trademap.org
2.1.2. The CNO supply chain
Production. Coconut (Cocos Nucifera L.) is a member of the palm family. It is grown widely in the Philippines, including uplands, though it prefers sandy soils and is highly tolerant of saline conditions, as found in coastal areas. After planting the coconut begins to bear fruit after about 4 – 5 years. Production is year-round though in the Philippines harvesting is typically done at about three-month intervals.
0
200
400
600
800
1000
1200
1400
1970 1975 1980 1985 1990 1995 2000 2005 2010
Coconut (copra) oil Unit value, coconut
0
10
20
30
40
50
60
70
80
90
100
2002 2007 2012
Other countries
Singapore
Malaysia
Indonesia
USA
Netherlands
7
Farm sizes are small, averaging 2.38 ha in 2002 (NSO, 2010). Coconut farm households account for about 12% of agricultural households. Poverty incidence among coconut farm households is 56.2%, compared to 47.9% for all agricultural households; coconut farmers account for the third largest share of the agricultural poor, at 13.9%, behind paddy rice and maize farmers, respectively at 30% and 17.4% (Reyes et al, 2012).
Postharvest and marketing. After harvesting, the most common practice is for farmers to extract coconut meat for drying into copra; farmers also sell mature coconuts, or husked nuts. (There are hundreds of products that can be produced from the coconut tree, e.g. sap or toddy, coco sugar, lumber, coir fiber, etc.) Drying methods are solar or kiln, though a combination of both methods is common employed by farmers. Copra or husked nuts is sold to a village agent, who in turn sells it to a town trader. Pabuayon et al (2009) lists several reasons for the persistence of this traditional marketing arrangement:
• There is no minimum or maximum volume required by the local trader; farmer can sell any volume.
• No purchase order or written contract governing sale is required.
• The product can be delivered to or picked up by the trader anytime.
• The buyer could be easily contacted whenever there is some product for sale.
• All sizes and qualities are accepted. However, some buyers may reject over-mature and cracked nuts, and pay lower for sub-standard copra.
• Farmers are immediately paid in cash, and can request for cash advances or loans charged against future sales.
• Farmers avoid transport and delivery to higher-level markets.
• Farmers believe there is no significant price advantage for products sold to town or provincial buyers.
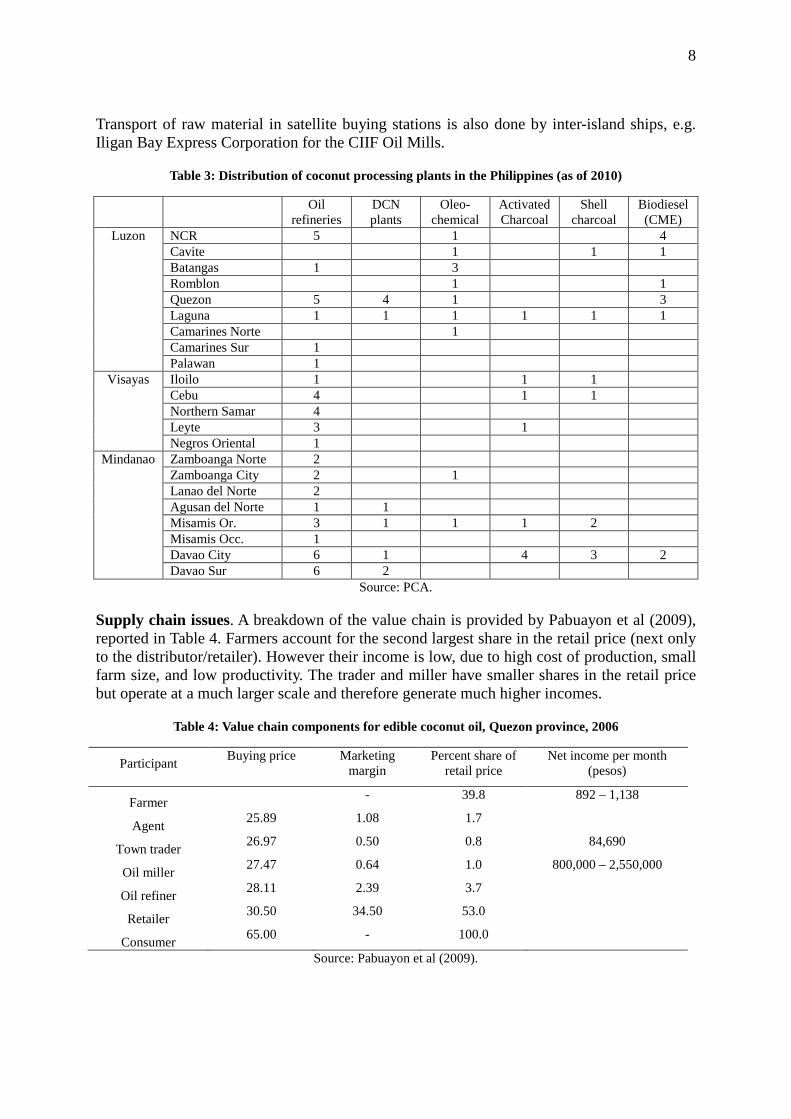
Processing. According to the PCA, there are 63 CNO mills and 38 oil refineries throughout the country; other coconut processors are dessicated coconut (DCN) plants (10), oleochemical plants (10), activated charcoal plants (8), shell charcoal plants (9), and biodiesel (coco methyl ester) plants (12). The geographic distribution is shown in Table 3.
The town trader sells copra (purchased from farmers or dried from husked nuts) to an oil mill. Within the mill, the copra undergoes grading, cleaning, final drying, and mechanical pressing in expellers. The expeller oil is then purified in filtration tanks into CNO, which is then pumped into storage tanks. The CNO is exported, or utilized domestically. To obtain refined oil, the CNO is treated to reduce Free Fatty Acid content, and removal of impurities (gums phosphatides, pigments, and other oxidation products); refined oil then undergoes bleaching to obtain edible oil for cooking (http://www.ciif.ph/process.htm).
Alternatively CNO can undergo further processing into oleochemicals mainly for industrial applications such as manufacture of detergents, cosmetics, and biodiesel. The bulk of processing is done close to the coconut growing areas, i.e. Southern Luzon and Mindanao.
8
Transport of raw material in satellite buying stations is also done by inter-island ships, e.g. Iligan Bay Express Corporation for the CIIF Oil Mills.
Table 3: Distribution of coconut processing plants in the Philippines (as of 2010)
Oil refineries
DCN plants
Oleo-chemical
Activated Charcoal
Shell charcoal
Biodiesel (CME)
Luzon NCR 5 1 4 Cavite 1 1 1 Batangas 1 3 Romblon 1 1 Quezon 5 4 1 3 Laguna 1 1 1 1 1 1 Camarines Norte 1 Camarines Sur 1 Palawan 1
Visayas Iloilo 1 1 1 Cebu 4 1 1 Northern Samar 4 Leyte 3 1 Negros Oriental 1
Mindanao Zamboanga Norte 2 Zamboanga City 2 1 Lanao del Norte 2 Agusan del Norte 1 1 Misamis Or. 3 1 1 1 2 Misamis Occ. 1 Davao City 6 1 4 3 2 Davao Sur 6 2
Source: PCA.
Supply chain issues. A breakdown of the value chain is provided by Pabuayon et al (2009), reported in Table 4. Farmers account for the second largest share in the retail price (next only to the distributor/retailer). However their income is low, due to high cost of production, small farm size, and low productivity. The trader and miller have smaller shares in the retail price but operate at a much larger scale and therefore generate much higher incomes.
Table 4: Value chain components for edible coconut oil, Quezon province, 2006
Participant Buying price Marketing margin
Percent share of retail price
Net income per month (pesos)
Farmer - 39.8 892 – 1,138
Agent 25.89 1.08 1.7
Town trader 26.97 0.50 0.8 84,690
Oil miller 27.47 0.64 1.0 800,000 – 2,550,000
Oil refiner 28.11 2.39 3.7
Retailer 30.50 34.50 53.0
Consumer 65.00 - 100.0
Source: Pabuayon et al (2009).
9
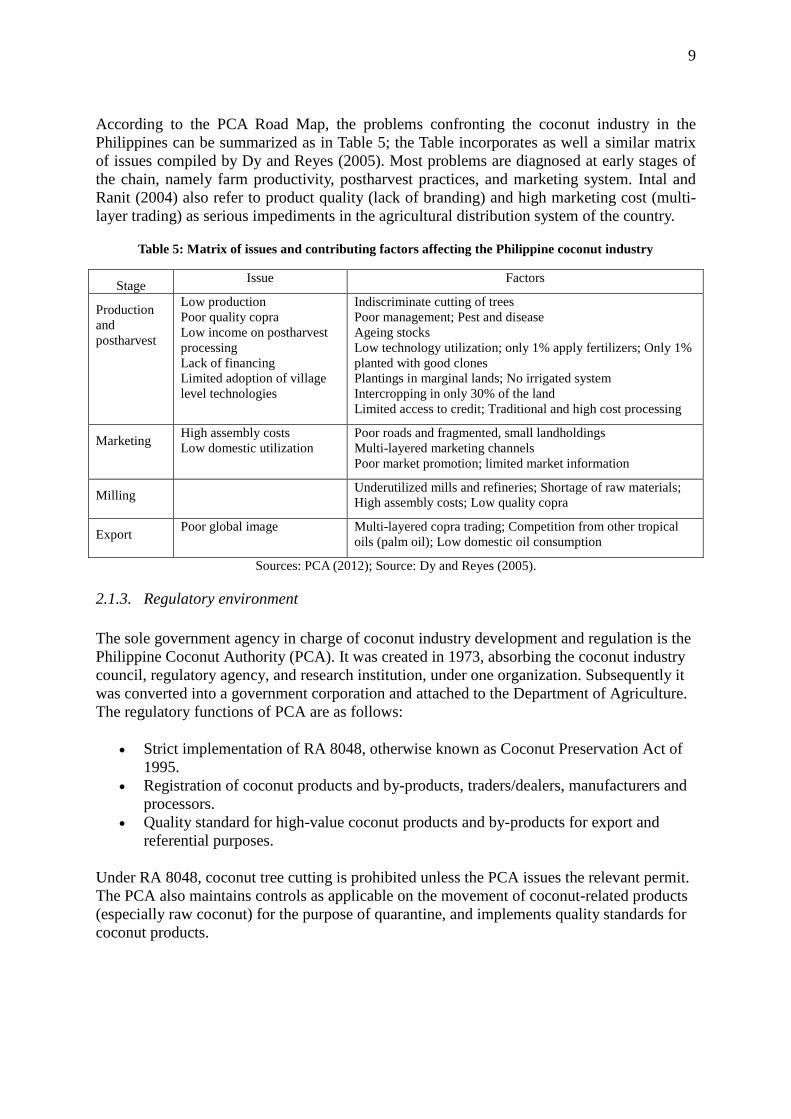
According to the PCA Road Map, the problems confronting the coconut industry in the Philippines can be summarized as in Table 5; the Table incorporates as well a similar matrix of issues compiled by Dy and Reyes (2005). Most problems are diagnosed at early stages of the chain, namely farm productivity, postharvest practices, and marketing system. Intal and Ranit (2004) also refer to product quality (lack of branding) and high marketing cost (multi-layer trading) as serious impediments in the agricultural distribution system of the country.
Table 5: Matrix of issues and contributing factors affecting the Philippine coconut industry
Stage Issue Factors
Production and postharvest
Low production Poor quality copra Low income on postharvest processing Lack of financing Limited adoption of village level technologies
Indiscriminate cutting of trees Poor management; Pest and disease Ageing stocks Low technology utilization; only 1% apply fertilizers; Only 1% planted with good clones Plantings in marginal lands; No irrigated system Intercropping in only 30% of the land Limited access to credit; Traditional and high cost processing
Marketing High assembly costs Low domestic utilization
Poor roads and fragmented, small landholdings Multi-layered marketing channels Poor market promotion; limited market information
Milling Underutilized mills and refineries; Shortage of raw materials; High assembly costs; Low quality copra
Export Poor global image
Multi-layered copra trading; Competition from other tropical oils (palm oil); Low domestic oil consumption
Sources: PCA (2012); Source: Dy and Reyes (2005).
2.1.3. Regulatory environment
The sole government agency in charge of coconut industry development and regulation is the Philippine Coconut Authority (PCA). It was created in 1973, absorbing the coconut industry council, regulatory agency, and research institution, under one organization. Subsequently it was converted into a government corporation and attached to the Department of Agriculture. The regulatory functions of PCA are as follows:
• Strict implementation of RA 8048, otherwise known as Coconut Preservation Act of 1995.
• Registration of coconut products and by-products, traders/dealers, manufacturers and processors.
• Quality standard for high-value coconut products and by-products for export and referential purposes.
Under RA 8048, coconut tree cutting is prohibited unless the PCA issues the relevant permit. The PCA also maintains controls as applicable on the movement of coconut-related products (especially raw coconut) for the purpose of quarantine, and implements quality standards for coconut products.
10
Exportation of coconut products, including CNO, requires an export commodity clearance. Whereas PCA laboratory testing used to be mandatory, under Executive Order 1015 (and ensuing administrative regulations) the PCA accepts testing done in private laboratories.2
2.2. Fisheries sector in the Philippines
2.2.1. Product description and importance
The Philippines is an archipelago composed of about 7,100 islands. Its vast aquatic resources include a coastline of 36,289 kilometers which is the fourth longest in the world; marine waters with a total territorial area of 2.2 million square kilometers inclusive of the Exclusive Economic Zone (EEZ); and inland waters of about 750,000 hectares including swamplands, fishponds, lakes, rivers and reservoirs.
The principal fish stocks exploited in the Philippines are small pelagics (surface and mid-water dwelling fish); tuna and other large pelagics; demersal species (bottom dwelling fish); and invertebrates. Small pelagic are usually caught in coastal areas by municipal fishermen and domestically consumed by the low income groups. Large pelagics are fished in municipal and commercial waters and are both domestically consumed and exported. Demersal species are generally caught in municipal waters and, in the case of prawn and shrimp, are cultured. Prawn and shrimp are high value species and consumed mainly by the high income groups and exported to other countries.
With the abundant aquatic resources and fish stocks of the Philippines, its fisheries sector has contributed significantly to fisheries output both nationally and globally. In 2008, for instance, the country posted a total fish output of 4.4 million metric tons which which is 8th largest in the world (FAO n.d.). Domestically, in 2011, the fisheries contribution to the Gross Domestic Product (GDP) was 1.9 percent at current prices and 2.2 percent at constant prices (BFAR 2012). The fisheries contribution to agriculture, fishery and forestry was 14.7 percent (at current prices).
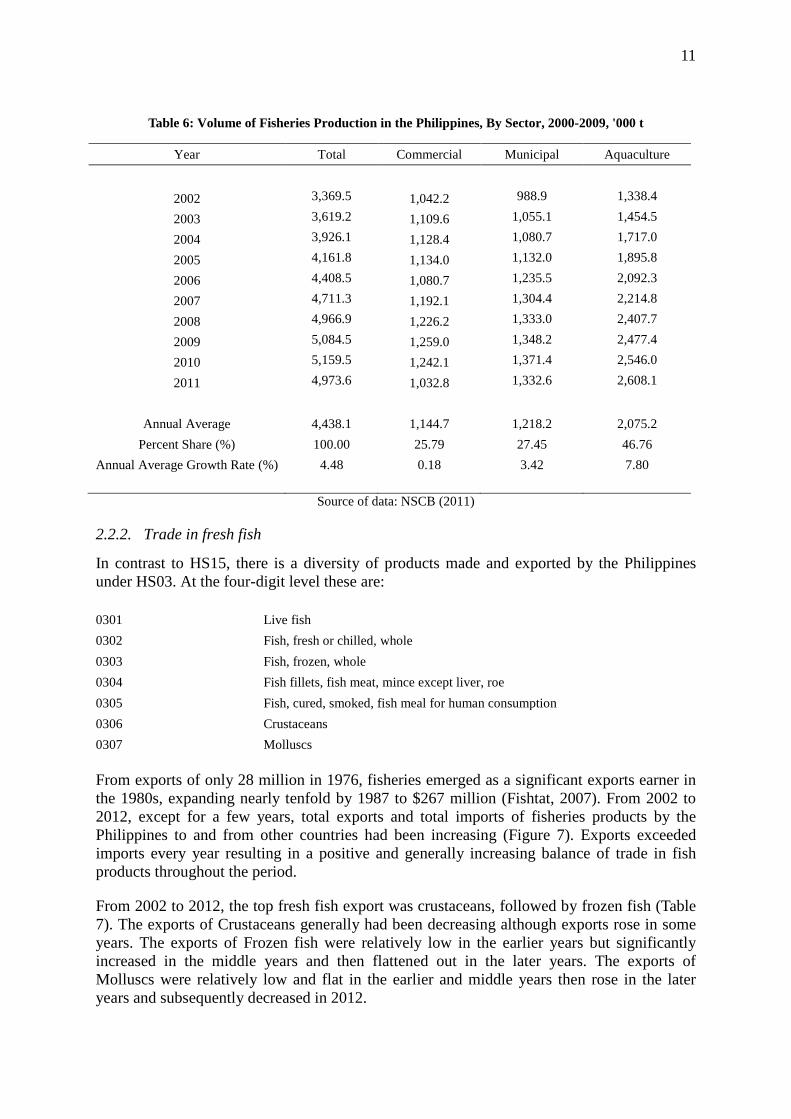
In volume of production and by subsector, aquaculture dominated the fisheries sector of the Philippines. From 2002 to 2011, aquaculture had a share of 46.76 percent on average annually followed far behind by municipal fisheries with 27.45 percent and commercial fisheries with 2.79% (Table 6). Volume of production for the entire fisheries sector had been growing at an average annual rate of 4.48 percent. Aquaculture had been the fastest growing subsector increasing at 7.80 percent on average annually followed by municipal fisheries and commercial fisheries at 3.42 percent and 0.18 percent on average annually, respectively.
About 60 to 70 percent of Filipinos live in the coastal areas and many of them are employed in the fisheries sector. Most of the employment in fisheries was in municipal fisheries which accounted for almost 85 percent of the total while aquaculture and commercial fisheries added 14 percent and 1 percent, respectively (BFAR Various Years). While direct employment in the sector was only about 4 percent to total employment in all industries, approximately 12 percent of the national population derived their livelihood from fisheries-related activities (Trinidad et al. 1993). 2 EO 1015 repeals export and commodity clearances, with a few exceptions, and unless other reinstated by an interagency committee to protect importing countries or safeguard the national interest.
11
Table 6: Volume of Fisheries Production in the Philippines, By Sector, 2000-2009, '000 t
Year Total Commercial Municipal Aquaculture
2002 3,369.5 1,042.2 988.9 1,338.4 2003 3,619.2 1,109.6 1,055.1 1,454.5 2004 3,926.1 1,128.4 1,080.7 1,717.0 2005 4,161.8 1,134.0 1,132.0 1,895.8 2006 4,408.5 1,080.7 1,235.5 2,092.3 2007 4,711.3 1,192.1 1,304.4 2,214.8 2008 4,966.9 1,226.2 1,333.0 2,407.7 2009 5,084.5 1,259.0 1,348.2 2,477.4 2010 5,159.5 1,242.1 1,371.4 2,546.0 2011 4,973.6 1,032.8 1,332.6 2,608.1
Annual Average 4,438.1 1,144.7 1,218.2 2,075.2 Percent Share (%) 100.00 25.79 27.45 46.76
Annual Average Growth Rate (%) 4.48 0.18 3.42 7.80
Source of data: NSCB (2011)
2.2.2. Trade in fresh fish
In contrast to HS15, there is a diversity of products made and exported by the Philippines under HS03. At the four-digit level these are:
0301 Live fish 0302 Fish, fresh or chilled, whole 0303 Fish, frozen, whole 0304 Fish fillets, fish meat, mince except liver, roe 0305 Fish, cured, smoked, fish meal for human consumption 0306 Crustaceans 0307 Molluscs
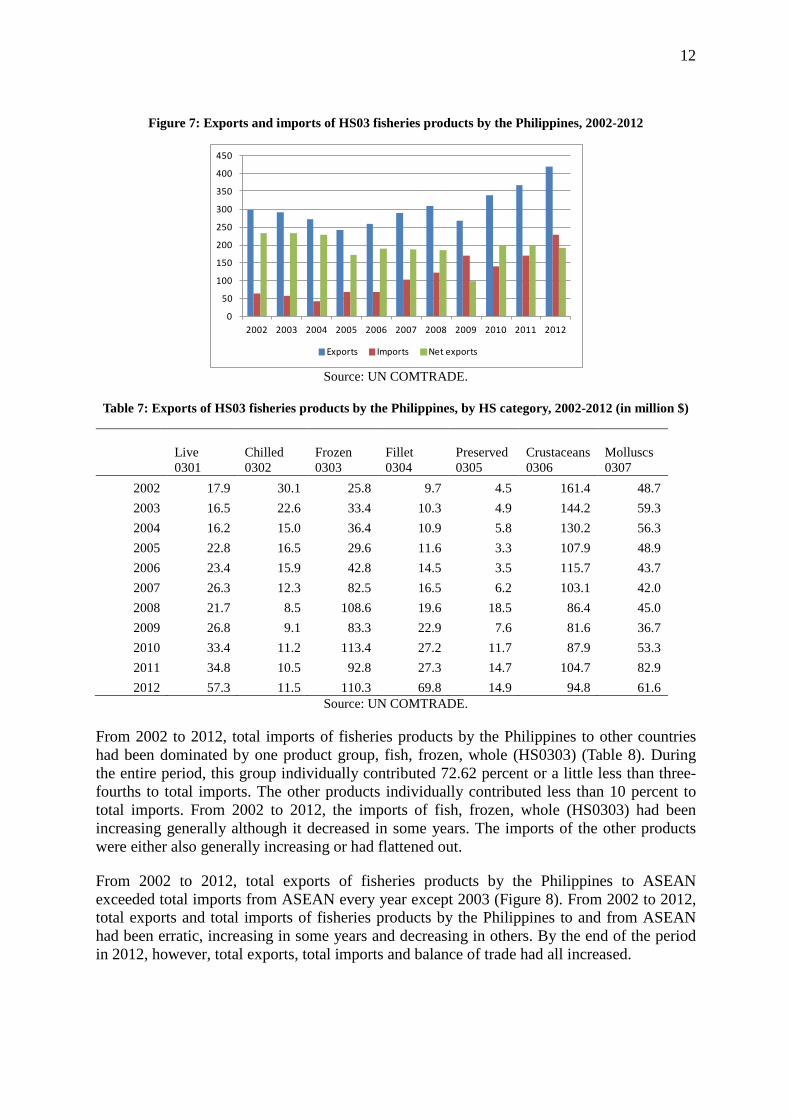
From exports of only 28 million in 1976, fisheries emerged as a significant exports earner in the 1980s, expanding nearly tenfold by 1987 to $267 million (Fishtat, 2007). From 2002 to 2012, except for a few years, total exports and total imports of fisheries products by the Philippines to and from other countries had been increasing (Figure 7). Exports exceeded imports every year resulting in a positive and generally increasing balance of trade in fish products throughout the period.
From 2002 to 2012, the top fresh fish export was crustaceans, followed by frozen fish (Table 7). The exports of Crustaceans generally had been decreasing although exports rose in some years. The exports of Frozen fish were relatively low in the earlier years but significantly increased in the middle years and then flattened out in the later years. The exports of Molluscs were relatively low and flat in the earlier and middle years then rose in the later years and subsequently decreased in 2012.
12
Figure 7: Exports and imports of HS03 fisheries products by the Philippines, 2002-2012
Source: UN COMTRADE.
Table 7: Exports of HS03 fisheries products by the Philippines, by HS category, 2002-2012 (in million $)
Live 0301
Chilled 0302
Frozen 0303
Fillet 0304
Preserved 0305
Crustaceans 0306
Molluscs 0307
2002 17.9 30.1 25.8 9.7 4.5 161.4 48.7 2003 16.5 22.6 33.4 10.3 4.9 144.2 59.3 2004 16.2 15.0 36.4 10.9 5.8 130.2 56.3 2005 22.8 16.5 29.6 11.6 3.3 107.9 48.9 2006 23.4 15.9 42.8 14.5 3.5 115.7 43.7 2007 26.3 12.3 82.5 16.5 6.2 103.1 42.0 2008 21.7 8.5 108.6 19.6 18.5 86.4 45.0 2009 26.8 9.1 83.3 22.9 7.6 81.6 36.7 2010 33.4 11.2 113.4 27.2 11.7 87.9 53.3 2011 34.8 10.5 92.8 27.3 14.7 104.7 82.9 2012 57.3 11.5 110.3 69.8 14.9 94.8 61.6
Source: UN COMTRADE.
From 2002 to 2012, total imports of fisheries products by the Philippines to other countries had been dominated by one product group, fish, frozen, whole (HS0303) (Table 8). During the entire period, this group individually contributed 72.62 percent or a little less than three-fourths to total imports. The other products individually contributed less than 10 percent to total imports. From 2002 to 2012, the imports of fish, frozen, whole (HS0303) had been increasing generally although it decreased in some years. The imports of the other products were either also generally increasing or had flattened out.
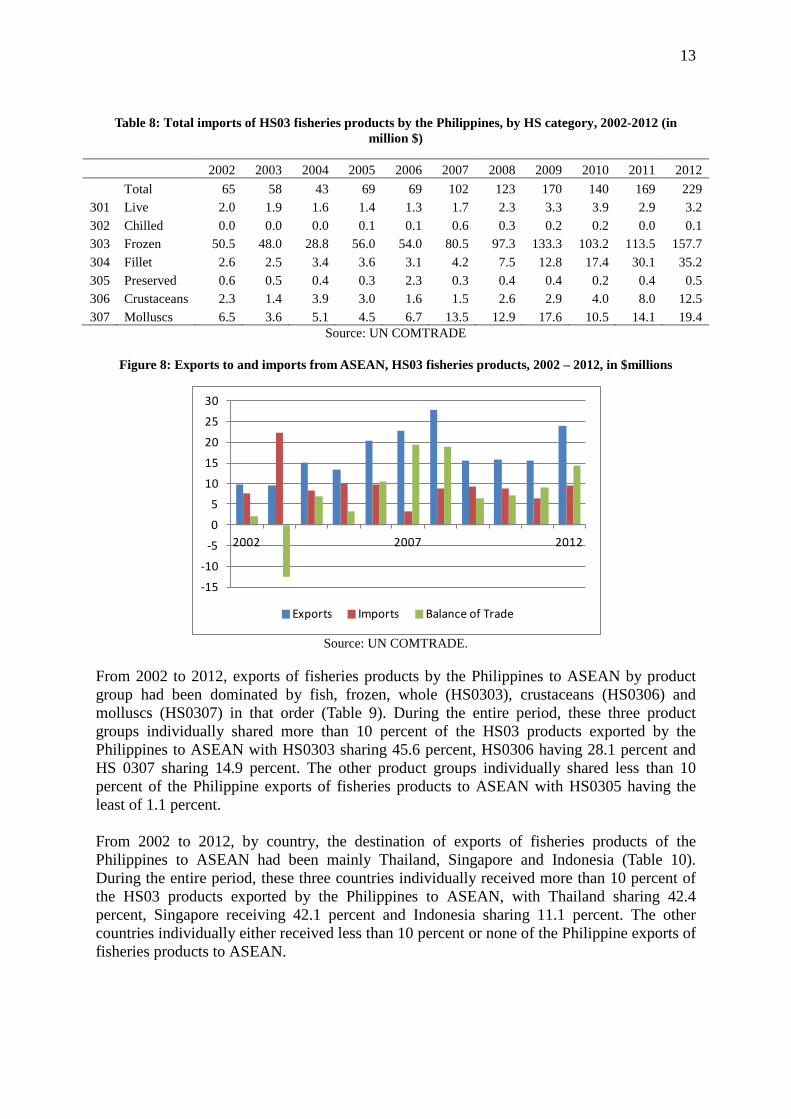
From 2002 to 2012, total exports of fisheries products by the Philippines to ASEAN exceeded total imports from ASEAN every year except 2003 (Figure 8). From 2002 to 2012, total exports and total imports of fisheries products by the Philippines to and from ASEAN had been erratic, increasing in some years and decreasing in others. By the end of the period in 2012, however, total exports, total imports and balance of trade had all increased.
0
50
100
150
200
250
300
350
400
450
2002 2003 2004 2005 2006 2007 2008 2009 2010 2011 2012
Exports Imports Net exports
13
Table 8: Total imports of HS03 fisheries products by the Philippines, by HS category, 2002-2012 (in million $)
2002 2003 2004 2005 2006 2007 2008 2009 2010 2011 2012
Total 65 58 43 69 69 102 123 170 140 169 229
301 Live 2.0 1.9 1.6 1.4 1.3 1.7 2.3 3.3 3.9 2.9 3.2 302 Chilled 0.0 0.0 0.0 0.1 0.1 0.6 0.3 0.2 0.2 0.0 0.1 303 Frozen 50.5 48.0 28.8 56.0 54.0 80.5 97.3 133.3 103.2 113.5 157.7 304 Fillet 2.6 2.5 3.4 3.6 3.1 4.2 7.5 12.8 17.4 30.1 35.2 305 Preserved 0.6 0.5 0.4 0.3 2.3 0.3 0.4 0.4 0.2 0.4 0.5 306 Crustaceans 2.3 1.4 3.9 3.0 1.6 1.5 2.6 2.9 4.0 8.0 12.5 307 Molluscs 6.5 3.6 5.1 4.5 6.7 13.5 12.9 17.6 10.5 14.1 19.4
Source: UN COMTRADE
Figure 8: Exports to and imports from ASEAN, HS03 fisheries products, 2002 – 2012, in $millions
Source: UN COMTRADE.
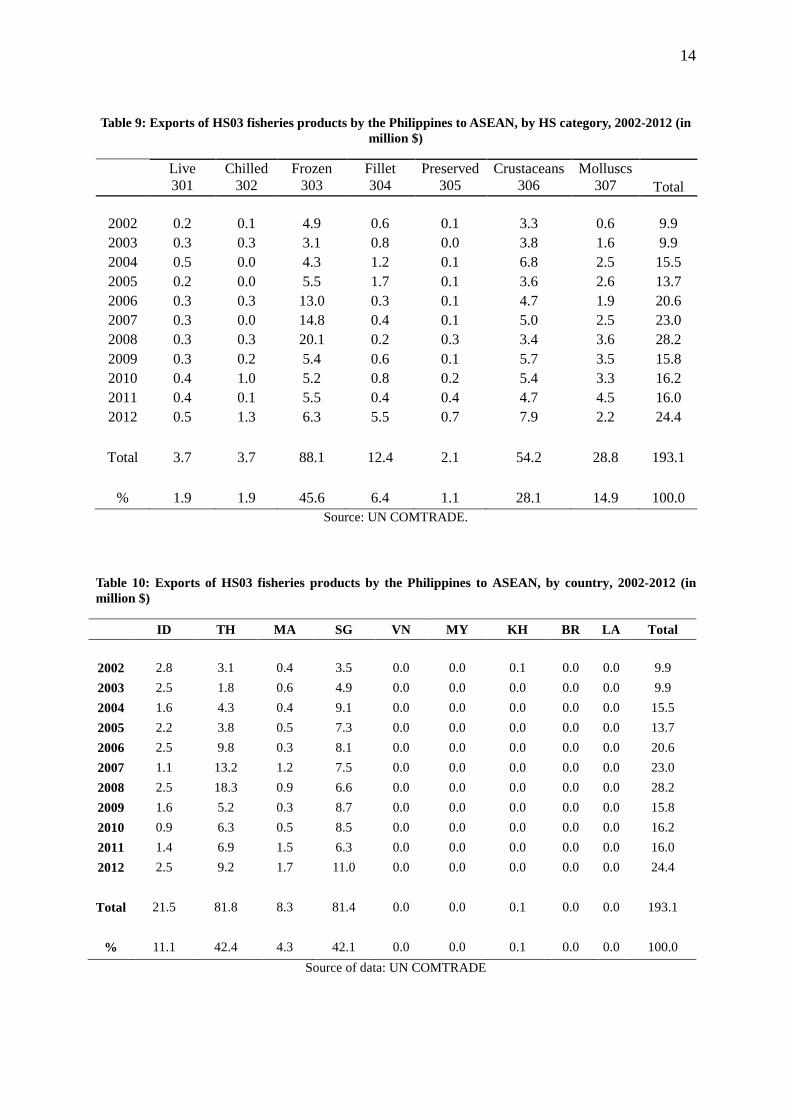
From 2002 to 2012, exports of fisheries products by the Philippines to ASEAN by product group had been dominated by fish, frozen, whole (HS0303), crustaceans (HS0306) and molluscs (HS0307) in that order (Table 9). During the entire period, these three product groups individually shared more than 10 percent of the HS03 products exported by the Philippines to ASEAN with HS0303 sharing 45.6 percent, HS0306 having 28.1 percent and HS 0307 sharing 14.9 percent. The other product groups individually shared less than 10 percent of the Philippine exports of fisheries products to ASEAN with HS0305 having the least of 1.1 percent. From 2002 to 2012, by country, the destination of exports of fisheries products of the Philippines to ASEAN had been mainly Thailand, Singapore and Indonesia (Table 10). During the entire period, these three countries individually received more than 10 percent of the HS03 products exported by the Philippines to ASEAN, with Thailand sharing 42.4 percent, Singapore receiving 42.1 percent and Indonesia sharing 11.1 percent. The other countries individually either received less than 10 percent or none of the Philippine exports of fisheries products to ASEAN.
-15
-10
-5
0
5
10
15
20
25
30
2002 2007 2012
Exports Imports Balance of Trade
14
Table 9: Exports of HS03 fisheries products by the Philippines to ASEAN, by HS category, 2002-2012 (in million $)
Live 301
Chilled 302
Frozen 303
Fillet 304
Preserved 305
Crustaceans 306
Molluscs 307
Total
2002 0.2 0.1 4.9 0.6 0.1 3.3 0.6 9.9 2003 0.3 0.3 3.1 0.8 0.0 3.8 1.6 9.9 2004 0.5 0.0 4.3 1.2 0.1 6.8 2.5 15.5 2005 0.2 0.0 5.5 1.7 0.1 3.6 2.6 13.7 2006 0.3 0.3 13.0 0.3 0.1 4.7 1.9 20.6 2007 0.3 0.0 14.8 0.4 0.1 5.0 2.5 23.0 2008 0.3 0.3 20.1 0.2 0.3 3.4 3.6 28.2 2009 0.3 0.2 5.4 0.6 0.1 5.7 3.5 15.8 2010 0.4 1.0 5.2 0.8 0.2 5.4 3.3 16.2 2011 0.4 0.1 5.5 0.4 0.4 4.7 4.5 16.0 2012 0.5 1.3 6.3 5.5 0.7 7.9 2.2 24.4
Total 3.7 3.7 88.1 12.4 2.1 54.2 28.8 193.1
% 1.9 1.9 45.6 6.4 1.1 28.1 14.9 100.0
Source: UN COMTRADE.
Table 10: Exports of HS03 fisheries products by the Philippines to ASEAN, by country, 2002-2012 (in million $)
ID TH MA SG VN MY KH BR LA Total
2002 2.8 3.1 0.4 3.5 0.0 0.0 0.1 0.0 0.0 9.9 2003 2.5 1.8 0.6 4.9 0.0 0.0 0.0 0.0 0.0 9.9 2004 1.6 4.3 0.4 9.1 0.0 0.0 0.0 0.0 0.0 15.5 2005 2.2 3.8 0.5 7.3 0.0 0.0 0.0 0.0 0.0 13.7 2006 2.5 9.8 0.3 8.1 0.0 0.0 0.0 0.0 0.0 20.6 2007 1.1 13.2 1.2 7.5 0.0 0.0 0.0 0.0 0.0 23.0 2008 2.5 18.3 0.9 6.6 0.0 0.0 0.0 0.0 0.0 28.2 2009 1.6 5.2 0.3 8.7 0.0 0.0 0.0 0.0 0.0 15.8 2010 0.9 6.3 0.5 8.5 0.0 0.0 0.0 0.0 0.0 16.2 2011 1.4 6.9 1.5 6.3 0.0 0.0 0.0 0.0 0.0 16.0 2012 2.5 9.2 1.7 11.0 0.0 0.0 0.0 0.0 0.0 24.4
Total 21.5 81.8 8.3 81.4 0.0 0.0 0.1 0.0 0.0 193.1
% 11.1 42.4 4.3 42.1 0.0 0.0 0.1 0.0 0.0 100.0
Source of data: UN COMTRADE
15
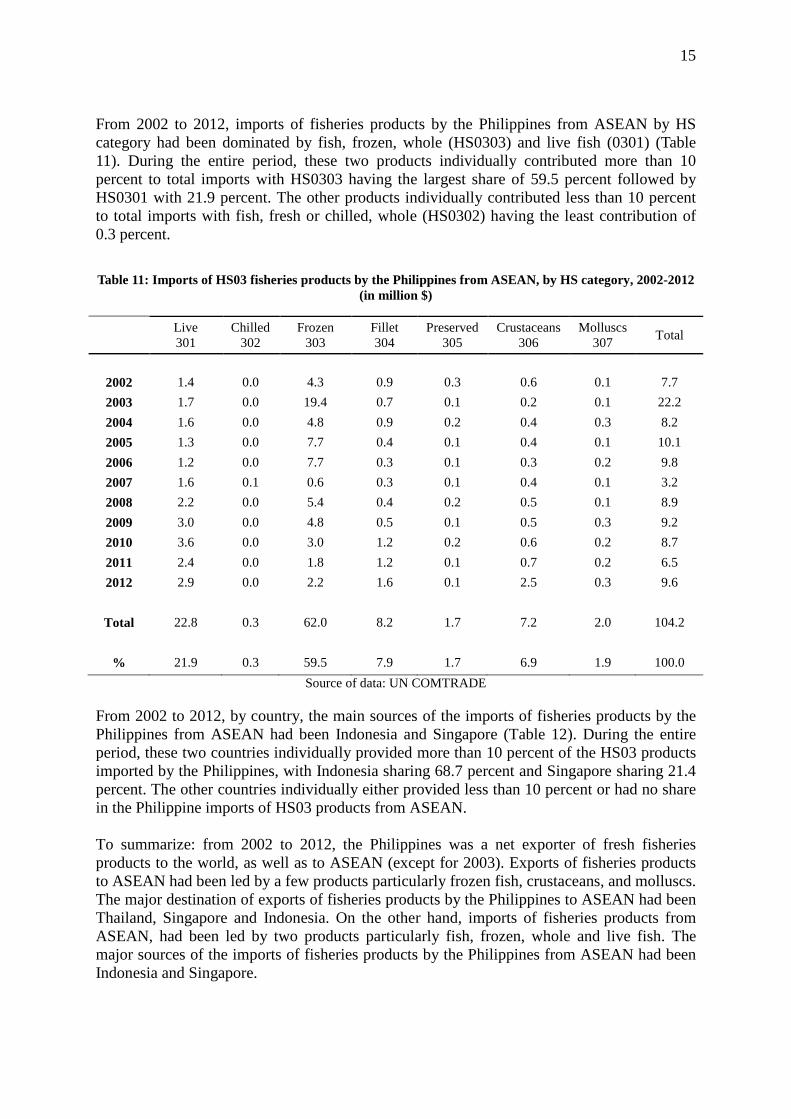
From 2002 to 2012, imports of fisheries products by the Philippines from ASEAN by HS category had been dominated by fish, frozen, whole (HS0303) and live fish (0301) (Table 11). During the entire period, these two products individually contributed more than 10 percent to total imports with HS0303 having the largest share of 59.5 percent followed by HS0301 with 21.9 percent. The other products individually contributed less than 10 percent to total imports with fish, fresh or chilled, whole (HS0302) having the least contribution of 0.3 percent.
Table 11: Imports of HS03 fisheries products by the Philippines from ASEAN, by HS category, 2002-2012 (in million $)
Live 301
Chilled 302
Frozen 303
Fillet 304
Preserved 305
Crustaceans 306
Molluscs 307 Total
2002 1.4 0.0 4.3 0.9 0.3 0.6 0.1 7.7 2003 1.7 0.0 19.4 0.7 0.1 0.2 0.1 22.2 2004 1.6 0.0 4.8 0.9 0.2 0.4 0.3 8.2 2005 1.3 0.0 7.7 0.4 0.1 0.4 0.1 10.1 2006 1.2 0.0 7.7 0.3 0.1 0.3 0.2 9.8 2007 1.6 0.1 0.6 0.3 0.1 0.4 0.1 3.2 2008 2.2 0.0 5.4 0.4 0.2 0.5 0.1 8.9 2009 3.0 0.0 4.8 0.5 0.1 0.5 0.3 9.2 2010 3.6 0.0 3.0 1.2 0.2 0.6 0.2 8.7 2011 2.4 0.0 1.8 1.2 0.1 0.7 0.2 6.5 2012 2.9 0.0 2.2 1.6 0.1 2.5 0.3 9.6
Total 22.8 0.3 62.0 8.2 1.7 7.2 2.0 104.2
% 21.9 0.3 59.5 7.9 1.7 6.9 1.9 100.0
Source of data: UN COMTRADE
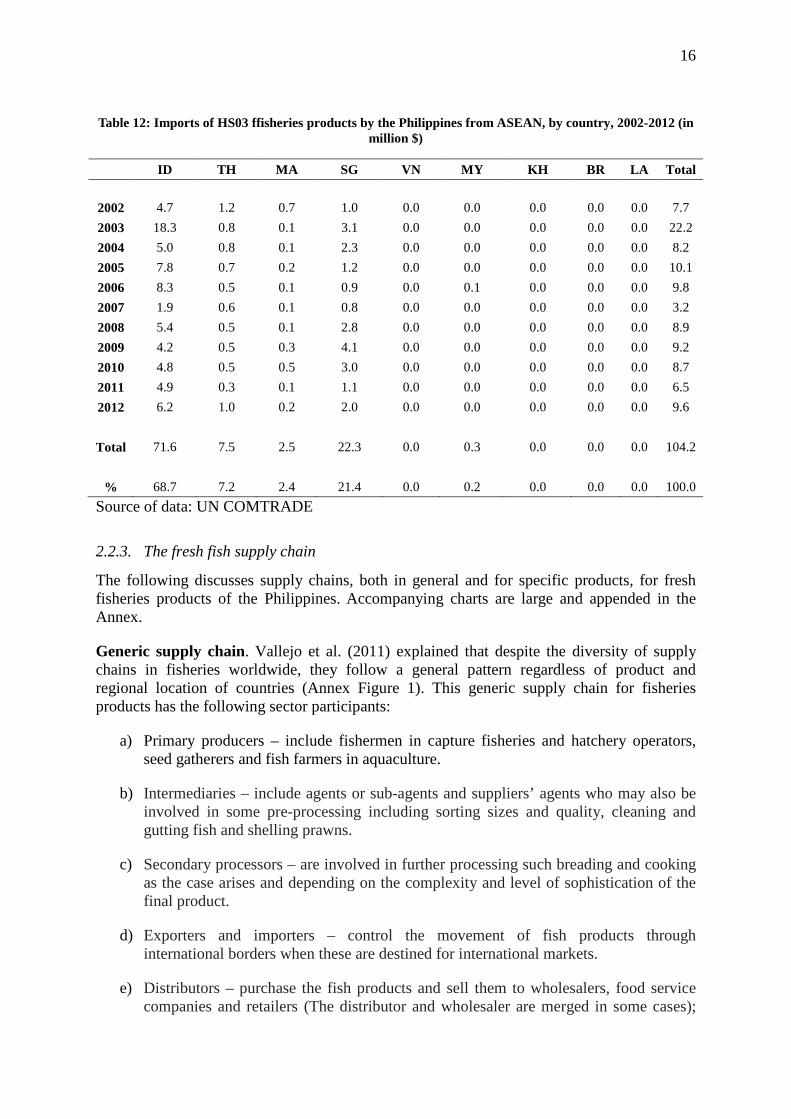
From 2002 to 2012, by country, the main sources of the imports of fisheries products by the Philippines from ASEAN had been Indonesia and Singapore (Table 12). During the entire period, these two countries individually provided more than 10 percent of the HS03 products imported by the Philippines, with Indonesia sharing 68.7 percent and Singapore sharing 21.4 percent. The other countries individually either provided less than 10 percent or had no share in the Philippine imports of HS03 products from ASEAN. To summarize: from 2002 to 2012, the Philippines was a net exporter of fresh fisheries products to the world, as well as to ASEAN (except for 2003). Exports of fisheries products to ASEAN had been led by a few products particularly frozen fish, crustaceans, and molluscs. The major destination of exports of fisheries products by the Philippines to ASEAN had been Thailand, Singapore and Indonesia. On the other hand, imports of fisheries products from ASEAN, had been led by two products particularly fish, frozen, whole and live fish. The major sources of the imports of fisheries products by the Philippines from ASEAN had been Indonesia and Singapore.
16
Table 12: Imports of HS03 ffisheries products by the Philippines from ASEAN, by country, 2002-2012 (in million $)
ID TH MA SG VN MY KH BR LA Total
2002 4.7 1.2 0.7 1.0 0.0 0.0 0.0 0.0 0.0 7.7 2003 18.3 0.8 0.1 3.1 0.0 0.0 0.0 0.0 0.0 22.2 2004 5.0 0.8 0.1 2.3 0.0 0.0 0.0 0.0 0.0 8.2 2005 7.8 0.7 0.2 1.2 0.0 0.0 0.0 0.0 0.0 10.1 2006 8.3 0.5 0.1 0.9 0.0 0.1 0.0 0.0 0.0 9.8 2007 1.9 0.6 0.1 0.8 0.0 0.0 0.0 0.0 0.0 3.2 2008 5.4 0.5 0.1 2.8 0.0 0.0 0.0 0.0 0.0 8.9 2009 4.2 0.5 0.3 4.1 0.0 0.0 0.0 0.0 0.0 9.2 2010 4.8 0.5 0.5 3.0 0.0 0.0 0.0 0.0 0.0 8.7 2011 4.9 0.3 0.1 1.1 0.0 0.0 0.0 0.0 0.0 6.5 2012 6.2 1.0 0.2 2.0 0.0 0.0 0.0 0.0 0.0 9.6
Total 71.6 7.5 2.5 22.3 0.0 0.3 0.0 0.0 0.0 104.2
% 68.7 7.2 2.4 21.4 0.0 0.2 0.0 0.0 0.0 100.0
Source of data: UN COMTRADE
2.2.3. The fresh fish supply chain
The following discusses supply chains, both in general and for specific products, for fresh fisheries products of the Philippines. Accompanying charts are large and appended in the Annex.
Generic supply chain. Vallejo et al. (2011) explained that despite the diversity of supply chains in fisheries worldwide, they follow a general pattern regardless of product and regional location of countries (Annex Figure 1). This generic supply chain for fisheries products has the following sector participants:
a) Primary producers – include fishermen in capture fisheries and hatchery operators, seed gatherers and fish farmers in aquaculture.
b) Intermediaries – include agents or sub-agents and suppliers’ agents who may also be involved in some pre-processing including sorting sizes and quality, cleaning and gutting fish and shelling prawns.
c) Secondary processors – are involved in further processing such breading and cooking as the case arises and depending on the complexity and level of sophistication of the final product.
d) Exporters and importers – control the movement of fish products through international borders when these are destined for international markets.
e) Distributors – purchase the fish products and sell them to wholesalers, food service companies and retailers (The distributor and wholesaler are merged in some cases);

17
and
f) Retailers – purchase the final products from wholesalers before selling them to consumers (Some large retailers may bypass retailers and buy directly from exporters. Some wholesalers may also have a retail operation.
Under the aforementioned participants, there are also sub-participants that operate in the supply chain. For instance, different kinds of intermediaries exit right after the production of the fish itself, when the product is to be internationally traded, and before the fisheries product finally reaches its final consumer.
Product specific supply chains. Milkfish is one of the traditionally cultured fish species in the Philippines and the province of Pangasinan is among the most important milkfish producers. Therefore, the marketing channel for milkfish in Pangasinan is a good of an example of an aquaculture suppy chain in the Philippines (Annex Figure 2). About 70 percent of total produce of milkfish in the province of Pangasinan was channelled through the brokers/consignacions (BAS 2007). Of the 70 percent, about 42 percent was disposed to buyers outside the province while the rest was sold within the province. A portion of the milkfish produced was sold to fish processors some of whom cater to the international market.
The milkfish products exported coming from Pangasinan as well as those coming from the Philippines generally were in fresh/chilled and various processed product forms including fillet, frozen, dried, smoked and whole or in pieces. The country destinations of the exported milkfish included some Asian countries particularly Hong Kong as well as other countries.
Shrimp is another important cultured and traded marine species in the Philippines. The main shrimp species cultured in the country are Black Tiger prawn and Pacific White shrimp both of which have high export potential (Duijn et al. 2012). The main export market for Philippine shrimp is Japan but small amounts also reach the US and EU. The exported shrimp are almost entirely in frozen forms while a very small portion is shrimp paste.
The shrimp value chain in the Philippines is provided in Annex Figure 3. The four main categories of operators in the shrimp industry are the a) input suppliers (hatcheries, feed suppliers, medicines and chemical suppliers and equipment suppliers), b) farmers (traditional and semi-intensive), c) Luzon fish market and middlemen, and d) processors/exporters. Of the shrimp produced, 30 percent is consumed domestically, mainly Pacific White shrimp, while 70 percent is exported, mainly Black Tiger.
Tuna is produced by capture fishery, composed of different tuna species of which Skipjack and Yellowfin tuna are the most important (Duijn et al. 2012). The three main tuna fishing grounds in the country are the South China Sea, the Philippine Sea and the Celebes Sea. Most of the Yellowfin and Skipjack are caught in the Celebes Sea and subsequently landed in the Socsargen region in Central Mindanao.
The simplified tuna value chain the Philippines is presented in Annex Figure 4. The chain has four main categories of operators: a) fishermen, b) fish landing sites, c) middlemen, and d) processors/exporters. In processing, specifically, tuna is processed into specific products such as fresh and frozen whole tuna, head on and head off, cubes, sashimi, pellets, sako, minded meat loins, steaks and canned tuna. In 2010, there were 36 companies processing
18
tuna in the country of which 28 produced fresh and frozen tuna products, while six specialized in canned tuna. Processors of fresh and frozen tuna are concentrated around Manila and in the south part of the Philippines while all canned tuna companies are based in the south particularly in the General Santos City area and Zamboanga. The product flow of frozen and processed tuna products from processors to the countries of destination including export volumes are provided in Annex Figure 5.
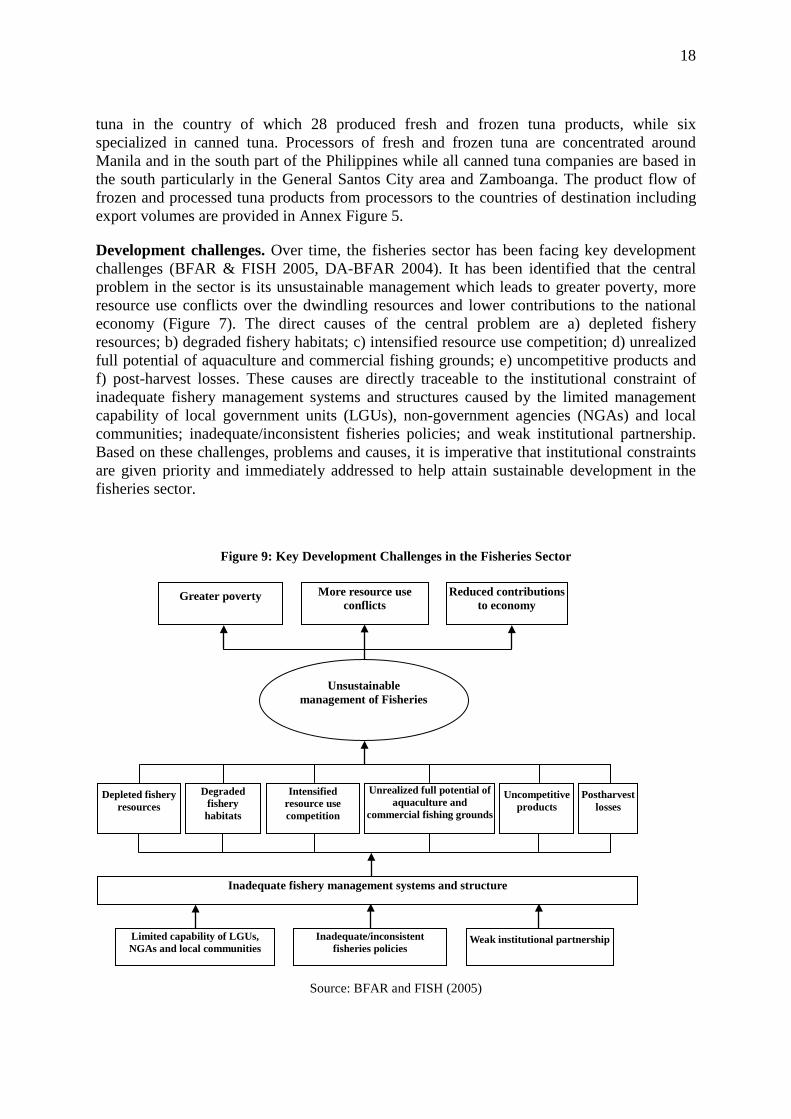
Development challenges. Over time, the fisheries sector has been facing key development challenges (BFAR & FISH 2005, DA-BFAR 2004). It has been identified that the central problem in the sector is its unsustainable management which leads to greater poverty, more resource use conflicts over the dwindling resources and lower contributions to the national economy (Figure 7). The direct causes of the central problem are a) depleted fishery resources; b) degraded fishery habitats; c) intensified resource use competition; d) unrealized full potential of aquaculture and commercial fishing grounds; e) uncompetitive products and f) post-harvest losses. These causes are directly traceable to the institutional constraint of inadequate fishery management systems and structures caused by the limited management capability of local government units (LGUs), non-government agencies (NGAs) and local communities; inadequate/inconsistent fisheries policies; and weak institutional partnership. Based on these challenges, problems and causes, it is imperative that institutional constraints are given priority and immediately addressed to help attain sustainable development in the fisheries sector.
Figure 9: Key Development Challenges in the Fisheries Sector
Source: BFAR and FISH (2005)
Greater poverty More resource use conflicts
Reduced contributions to economy
Unsustainable management of Fisheries
Depleted fishery resources
Degraded fishery habitats
Intensified resource use competition
Unrealized full potential of aquaculture and
commercial fishing grounds
Uncompetitive products
Postharvest losses
Inadequate fishery management systems and structure
Limited capability of LGUs, NGAs and local communities
Inadequate/inconsistent fisheries policies
Weak institutional partnership
19
2.2.4. Regulatory environment
The primary legal instruments for the management of the fisheries sector are the Philippine Fisheries Code or FC (Republic Act No. 8550); Agriculture and Fisheries Modernization Act or AFMA (R.A. 8435); Local Government Code or LGC (R.A. 7160); Implementing Rules and Regulations (IRRs) for the FC, AFMA and LGC; and Fisheries Administrative Ordinances (FAOs). The FC was passed in 1998, AFMA in 1997, and the LGC in 1991. The FC and AFMA consolidated, repealed and modified all past related laws, decrees, executive orders, and IRRs. An important feature of the LGC is the devolution of some national management functions to the LGUs including in fisheries. Among others, it provided municipalities the authority and responsibility for the management of their coastal areas within 15 kilometers from their coastlines.
Other important legal instruments that influence fisheries management in the Philippines are the following (e.g. Flewwelling and Hosch 2004): a) 2004 Clean Water Act (RA 9275) which aims to protect the country’s water bodies from pollution; b) 2001 Wildlife Conservation Act (RA 9147) which governs the conservation and protection of wildlife species and critical habitats; and c) 1997 Indigenous Peoples’ Rights Act (RA 7942) which recognizes the concept of ancestral waters. Additional legislations relevant to the fisheries sector are the Public Land Act, Coast Guard Law, Marine Pollution Decree, Philippine Mining Act, Philippine Environment Code, and Forestry Reform Code. The international Treaties relevant to the fisheries sector are the Convention on Biological Diversity, Agenda 21, Convention on Wetlands of International Importance (RAMSAR), United Nations Convention on the Law of the Sea (UNCLOS), Convention on International Trade in Endangered Species of Wild Flora and Fauna (CITES), FAO Code of Conduct for Fisheries, Cartagena Protocol on Bio-safety, and The Bonn Convention.
The Philippines has other international commitments that affect the fisheries sector, particularly related to fish trade. As part of overall liberalization policy, the reduction of tariffs in fisheries started in 1993 as part of the Philippine commitment to the Asean Free Trade Association (AFTA). An annual schedule of tariff reduction was set until the target tariff of 0-5 percent was reached which was later submitted by the country to the World Trade Organization (WTO), thereby binding it to the commitment.
The FC, on the other hand, had contrary trade restrictions that allow the importation only of fish for processing and canning although the DA can issue a certificate of necessity to import that will allow importation for local consumption. Philippine fisheries trade is also covered by other agreements of the WTO, namely: 1) general rules of the General Agreement on Tariffs and Trade (GATT), 2) Agreement on Sanitary and Phytosanitary (SPS) Measures, 3) Agreement on Import Licensing Procedures, 4) Agreement on Technical Barriers to Trade, 5) Agreement on Safeguards, and 6) Agreement on Subsidies and Countervailing Measures (Vera and Vera 2001).
Fisheries governance in the Philippines is done jointly by the Bureau of Fisheries and Aquatic Resources (BFAR) and the LGUs as mandated by the LGC. In addition to these institutions, the FC (Article II) provided for the establishment of Fisheries and Aquatic Resources Management Councils (FARMCs) at the national, provincial and municipal levels to involve relevant stakeholders in the development and management of the fisheries sector. Overall, BFAR manages all fisheries resources except in municipal waters which are managed by the LGUs. In addition to BFAR and the LGUs, there are other national government agencies and
20
institutions which are in one way of another involved in the management of the fisheries (Table 11). In addition to these institutions, the Southeast Asian Fisheries Development Center-Aquaculture Department (SEAFDEC AQD) which is an Association of Southeast Asian Nations (ASEAN) treaty organization based in the Philippines and mainly funded by the Philippine government is conducting research and development activities in aquaculture for the Philippines and the ASEAN region.
The FC (Section 65) mandated BFAR to prepare and implement a Comprehensive National Fisheries Industry Development Plan (CNFIDP). In 2005, the draft plan was completed (BFAR and FISH 2005). The stated long-term goal of CNFIDP (Section 3.4.2) is to sustain the industry’s socio-economic benefits without jeopardizing the fishery resources and associated habitats in the most administratively efficient and cost effective manner. The nine associated strategic objectives of the plan are to: a) rationalize utilization of fishery resources; b) protect fishery habitats; c) reduce resource use competition; d) maximize full potential of aquaculture and commercial fishing; e) promote competitiveness of fishery products; f) minimize post-harvest losses; g) enhance capability of NGOs, NGAs and local communities; h) promote appropriate fisheries policies; and i) strengthen institutional partnership. Overall, the CNFIDP outlines the strategic directions to be undertaken by the country for a twenty-year period from 2006 to 2025 and lays out the key project interventions that can be implemented for 2006 to 2010.
While the draft CNFIDP was completed, it was not actually implemented by the BFAR. Key informants maintained that the plan was basically industry-driven and so the private sector must take the lead in implementing it. Other than this ownership and implementation issue, reasons put forward for the non-implementation of the plan are limited budgets and other related constraints of BFAR and the national government.
For the agriculture sector as a whole, the AFMA, (Section 13 Chapter II) mandated that the DA, in consultation with the farmers and fisher folk, the private sector, NGOs, people's organizations and the appropriate government agencies and offices, to formulate and implement a medium and long-term comprehensive AFMP. In 2001, the AFMP 2001-2004 was completed (DA 2001). This plan was intended to serve as blueprint for agriculture and fisheries development and provide the strategic interventions for the covered period. As in the case of the CNFIDP, key informants mentioned that the AFMP was not formally implemented by the DA due to budget and other related constraints.
The third national plan of significance to the fisheries sector is the Medium-Term Philippine Development Plan (MTPDP) which in recent years has provided the programs of government of every new national administration. The latest, Philippine Development Plan 2011-2016 (NEDA 2011) has Chapter 4 on competitive and sustainable agriculture and fisheries sector which deals on agriculture and fisheries concerns. There is little in this chapter as well as in the overall plan, however, which deals specifically on the fisheries sector as it is subsumed in the general category of agriculture and fisheries.
3. SUPPLY CHAIN CHOKEPOINTS
3.1. Overview
In this section, the sources of data and information on chokepoints in the fisheries supply chain are the existing relevant literature and interviews based on a prepared questionnaire that
21
were conducted with selected government and private sector key informants in the fisheries sector from February to March 2013.
For both HS03 and HS15, there was greater difficulty in scheduling interviews with private sector representatives. In the case of HS15, despite going through the United Coconut Association of the Philippines (UCAP), only exporter and one LSP was interviewed; international shipping service with office in the Philippines could not be located; nor was there time to locate HS15 importer (of which the relevant product would be palm oil). Two interviews were made for Customs, and one for Ministry of Agriculture. In the case of HS03, three exporters were interviewed, one of which was also an importer; separate interviews were conducted (one each) for road service provider and LSP. Interviews were also done for Customs and Ministry of Agriculture (one each).
3.2. Chokepoint analysis for CNO
3.2.1. Overview of transaction flow
Exports. The responses for HS15 are available from one exporter, which is also representative of industry practice. Typically traders send copra to the factory which is then processed into CNO and stored in factory facilities. This part of the supply chain can extend over great distances, and may require inter-island shipping. From the factory, the company complies with orders on f.o.b.-plant, f.o.b., or c.i.f.-warehouse basis. For the first the exporter awaits pick-up by the buyer from the factory. The buyer arranges freight forwarding (from trucking to international shipping) with an LSP. For the second the exporter arranges for trucking to port, while the buyer arranges the shipping vessel, which is typically a specialized vegetable oil tanker.
Paperwork for exporting begins with an application for export and commodity clearance with the PCA. Tests can be done with PCA or with private laboratories. Upon payment of fees and other steps, the exporter can obtain the permit, which is needed for Customs clearance.
Imports. Imports of vegetable oil are regulated by the Food and Drug Administration (FDA) of the Department of Health. The importer must be licensed and the product to be imported should be registered with the FDA. Vegetable oils are a "Category I" product, meaning FDA inspection and testing is discretionary; what is required is importer's affidavit of compliance with FDA regulation, and compliance with labeling standards of Codex and FDA.
3.2.2. Quality of infrastructure and ICT
Quality of infrastructure is evaluated by the exporter and LSP. Both opted to assign identical rank to all aspects (adequacy, cost, and quality). The ranking for the exporter in descending order of importance is: Domestic trucking, international LSP, and international port conditions. The counterpart ranking for the LSP is: Domestic trucking (same as exporter), Domestic port handling, and Warehousing and storage.
Meanwhile, the opinion of the exporter regarding improvement (or deterioration) of these services (relative to three years ago) is also elicited. The exporter states that there were no changes in any of the services listed in Table 7, except for cost of Domestic trucking and international LSP, both of which had worsened (i.e. become more expensive).
22
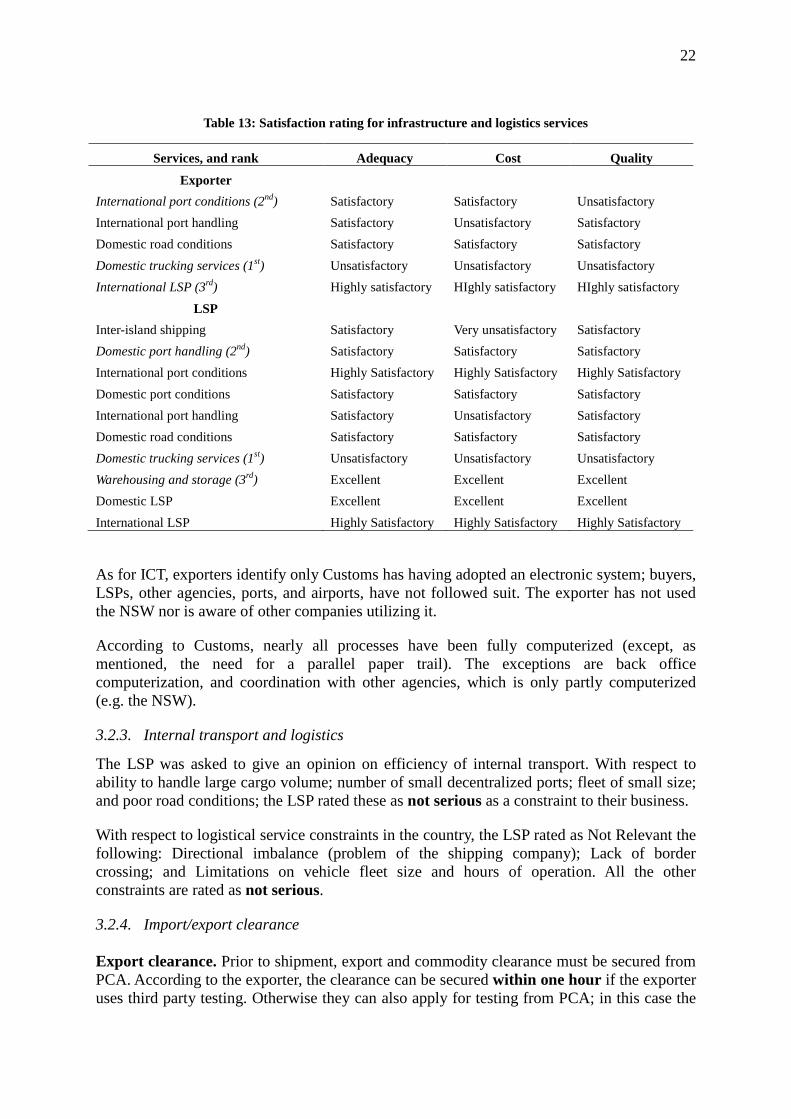
Table 13: Satisfaction rating for infrastructure and logistics services
Services, and rank Adequacy Cost Quality
Exporter International port conditions (2nd) Satisfactory Satisfactory Unsatisfactory International port handling Satisfactory Unsatisfactory Satisfactory Domestic road conditions Satisfactory Satisfactory Satisfactory Domestic trucking services (1st) Unsatisfactory Unsatisfactory Unsatisfactory International LSP (3rd) Highly satisfactory HIghly satisfactory HIghly satisfactory
LSP Inter-island shipping Satisfactory Very unsatisfactory Satisfactory Domestic port handling (2nd) Satisfactory Satisfactory Satisfactory International port conditions Highly Satisfactory Highly Satisfactory Highly Satisfactory Domestic port conditions Satisfactory Satisfactory Satisfactory International port handling Satisfactory Unsatisfactory Satisfactory Domestic road conditions Satisfactory Satisfactory Satisfactory Domestic trucking services (1st) Unsatisfactory Unsatisfactory Unsatisfactory Warehousing and storage (3rd) Excellent Excellent Excellent Domestic LSP Excellent Excellent Excellent International LSP Highly Satisfactory Highly Satisfactory Highly Satisfactory
As for ICT, exporters identify only Customs has having adopted an electronic system; buyers, LSPs, other agencies, ports, and airports, have not followed suit. The exporter has not used the NSW nor is aware of other companies utilizing it.
According to Customs, nearly all processes have been fully computerized (except, as mentioned, the need for a parallel paper trail). The exceptions are back office computerization, and coordination with other agencies, which is only partly computerized (e.g. the NSW).
3.2.3. Internal transport and logistics
The LSP was asked to give an opinion on efficiency of internal transport. With respect to ability to handle large cargo volume; number of small decentralized ports; fleet of small size; and poor road conditions; the LSP rated these as not serious as a constraint to their business.
With respect to logistical service constraints in the country, the LSP rated as Not Relevant the following: Directional imbalance (problem of the shipping company); Lack of border crossing; and Limitations on vehicle fleet size and hours of operation. All the other constraints are rated as not serious.
3.2.4. Import/export clearance
Export clearance. Prior to shipment, export and commodity clearance must be secured from PCA. According to the exporter, the clearance can be secured within one hour if the exporter uses third party testing. Otherwise they can also apply for testing from PCA; in this case the
23
maximum time for clearance is five days, according to PCA. However this option is rarely practiced, according to exporters.
Once CNO is extracted from copra the coconut oil mill places the oil in storage tanks. The industry practice is that export clearance is initiated at the factory. Cargo clearance can be the responsibility of either the forwarding agent, or the exporter itself. Inclusive of customs formalities, export clearance can be accomplished an average of two to three hours. The minimum is one hour and the maximum is 24; this is also the experience of the industry as a whole. Customs officials were more conservative, estimating an average time of 24 hours to comply with all formalities, with little variation around the average.
All declarations are submitted electronically, including e-signatures, in parallel with a paper system. According to Customs, duplicate hard copies allow cross-checking and validation of electronic submission; and may be useful for as preparation for legal issues or disputes related to any shipment. The necessary documents (physical and electronic copies) are:
• Original invoices
• Certificates of origin
• Packing list
• Bill of lading
• Export permit (PCA Export and Commodity Clearance)
The only clearance requirement outside the e-system is the PCA export and commodity clearance. According to PCA, the target is to integrate the PCA clearance into the NSW within the year. Depending on product and export destination, Certificate of Laboratory Analysis may be required by Customs.
Import clearance. For the import of vegetable oils, the same electronic system applies. No import permit is required; the importer is required to present a copy of import license and certificate of product registration from the FDA. clearing time is very quick (less than one day) for Green and Yellow channel (there is no Blue channel). There are hardly ever any delays such as by disputes on valuation; transfer of cargo to and from inspection area; late presentation of cargo documents; etc. Payments (e.g. import duties) are all done electronically by bank transfer.
3.2.5. Transparency and awareness of regulations
With respect to source of information, the exporter utilized the industry association, the government agency, and the internet. The LSP mainly relied on the government agency. Neither LSP nor the exporter mentioned any serious issues with respect to access to information, quality of information, or its application and implementation. The only issue mentioned by the Exporter is "Excessive fees", namely the PCA fees, rated as mildly serious – mainly because the exporter could not see the benefit derived from paying the PCA fees.
Likewise, the PCA claims it mainly disseminates information through its website, and through the industry association (Philippine Coconut Oil Producers Association). Migration
24
within electronic system is the next item in their agenda and is expected to come online this year.
3.2.6. Non-tariff measures
Non-tariff measures are most applicable to the exporter, pertaining to certification and testing requirements (Questionbaire I.12 to I.16); as well as (in the case of ASEAN destination), Trade barrier items (a to c) of III.
Certification is required for HS15 exports, with respect to the following:
• HACCP (all destination countries)
• Halal certification (selected ASEAN countries)
Testing is usually done in a private laboratory based in Manila (far from the factory or port). Test results are usually available within a few hours, maximum within a day. Delays in sampling, testing, and other procedures were rated as Not serious by the exporter. Likewise under the Trade Barriers section of III, none of the destination countries in ASEAN (Malaysia, Indonesia, Vietnam, and Singapore) imposed signficant barriers to CNO from the Philippines. Overall, there were not outstanding issues causing delay or cost escalation in exporting to aforementioned ASEAN countries.
3.3. Chokepoint analysis for fresh fish
3.3.1. Overview of transaction flow
The export clearance process in the country is summarized as follows: First, the exporter files the Export Declaration (ED) at the Export Division of the BOC. Then the filed declaration is checked for completeness of documents and initialled by the checker and sent to the chief of the division. The Authority to Load (ATL) is thereafter signed and released. The exporter then presents the ED to the Customs Container Control Division (CCCD) which forwards the ED to the Arrastre Office for payment of arrastre charges and the Philippine Ports Authority (PPA) for clearance if shipment is by sea or the appropriate units at the Ninoy Aquino International Airport (NAIA) if the shipment is by air. After this, the actual shipment is done.
For import clearance, first, importers must submit to the BOC the following basic documents: a) international air waybill (for airfreight) or bill of lading (for sea freight); b) commercial invoice or pro-forma invoice (A pro-forma invoice will not be accepted where there is a buyer-seller transaction); and c) packing list. In addition, for fisheries products specifically, the BOC requires an import permit which must be obtained from the BFAR. This document is imposed for various reasons including public health and safety, national security or to satisfy international commitments.
Upon the arrival of an imported article, the importer/broker lodges its Import Entry then proceeds to BOC. The Import Entry is received by the Entry Processing Unit (EPU) of the BOC which then forwards it to Section I-A to process the shipment. Upon receipt of the Import Entry, the Examiner or Customs Operation Officer examines the shipment together with the pertinent government agency representative. If upon examination/inspection of the goods, no discrepancy is found, the imported good is then released. If the goods are animal products, upon arrival at the importer’s storage, it will be further inspected by the National
25
Meat Inspection Service (NMIS) before it will be released to the end user.
For fresh/chilled/frozen fish and fishery/aquatic products in particular the inspection and clearance process is summarized as follows :
a) Inspection/verification of accompanying importation documents must be presented and surrendered to the inspecting Fishery Quarantine Officer;
b) Adequate sample of imported fishery product for laboratory examination shall be collected randomly by technical personnel of the Bureau for sensory/organoleptic examination;
c) All imported fishery products shall be subject to microbiological examination. After laboratory examination, if found unfit for human consumption or does not meet the required standard, the product shall be returned to the country of origin; and
d) ) If the product passes inspection, the Fishery Sanitary and Phytosanitary (SPS) Certificate for the release of the imported fishery product is then issued.
3.3.2. Quality of infrastructure
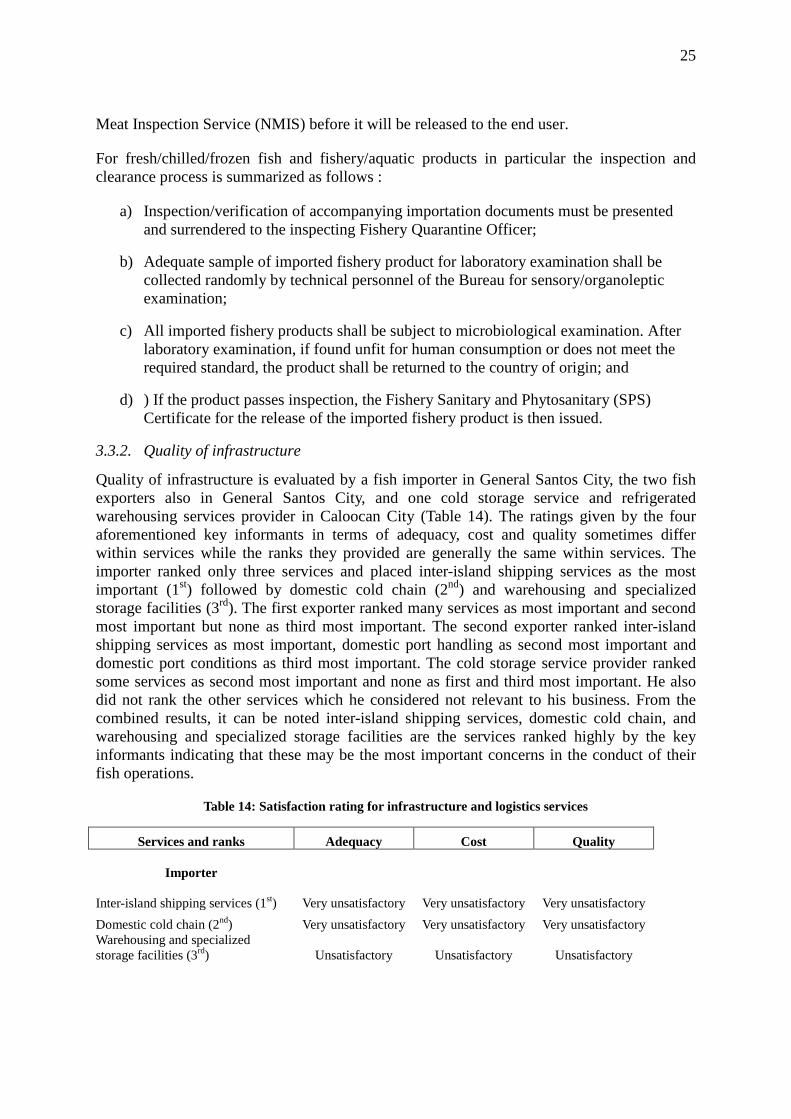
Quality of infrastructure is evaluated by a fish importer in General Santos City, the two fish exporters also in General Santos City, and one cold storage service and refrigerated warehousing services provider in Caloocan City (Table 14). The ratings given by the four aforementioned key informants in terms of adequacy, cost and quality sometimes differ within services while the ranks they provided are generally the same within services. The importer ranked only three services and placed inter-island shipping services as the most important (1st) followed by domestic cold chain (2nd) and warehousing and specialized storage facilities (3rd). The first exporter ranked many services as most important and second most important but none as third most important. The second exporter ranked inter-island shipping services as most important, domestic port handling as second most important and domestic port conditions as third most important. The cold storage service provider ranked some services as second most important and none as first and third most important. He also did not rank the other services which he considered not relevant to his business. From the combined results, it can be noted inter-island shipping services, domestic cold chain, and warehousing and specialized storage facilities are the services ranked highly by the key informants indicating that these may be the most important concerns in the conduct of their fish operations.
Table 14: Satisfaction rating for infrastructure and logistics services
Services and ranks Adequacy Cost Quality
Importer Inter-island shipping services (1st) Very unsatisfactory Very unsatisfactory Very unsatisfactory Domestic cold chain (2nd) Very unsatisfactory Very unsatisfactory Very unsatisfactory Warehousing and specialized storage facilities (3rd)
Unsatisfactory
Unsatisfactory
Unsatisfactory
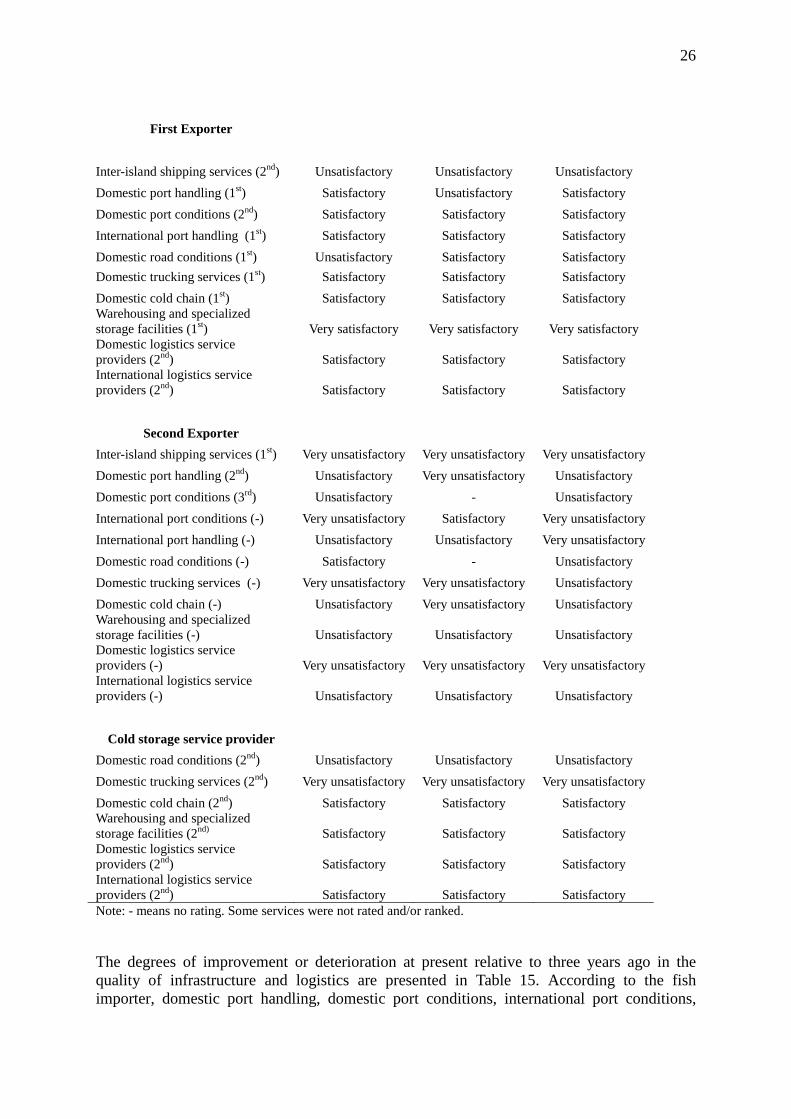
26
First Exporter Inter-island shipping services (2nd) Unsatisfactory Unsatisfactory Unsatisfactory Domestic port handling (1st) Satisfactory Unsatisfactory Satisfactory Domestic port conditions (2nd) Satisfactory Satisfactory Satisfactory International port handling (1st) Satisfactory Satisfactory Satisfactory Domestic road conditions (1st) Unsatisfactory Satisfactory Satisfactory Domestic trucking services (1st) Satisfactory Satisfactory Satisfactory Domestic cold chain (1st) Satisfactory Satisfactory Satisfactory Warehousing and specialized storage facilities (1st) Very satisfactory Very satisfactory Very satisfactory Domestic logistics service providers (2nd) Satisfactory Satisfactory Satisfactory International logistics service providers (2nd) Satisfactory Satisfactory Satisfactory
Second Exporter Inter-island shipping services (1st) Very unsatisfactory Very unsatisfactory Very unsatisfactory Domestic port handling (2nd) Unsatisfactory Very unsatisfactory Unsatisfactory Domestic port conditions (3rd) Unsatisfactory - Unsatisfactory International port conditions (-) Very unsatisfactory Satisfactory Very unsatisfactory International port handling (-) Unsatisfactory Unsatisfactory Very unsatisfactory Domestic road conditions (-) Satisfactory - Unsatisfactory Domestic trucking services (-) Very unsatisfactory Very unsatisfactory Unsatisfactory Domestic cold chain (-) Unsatisfactory Very unsatisfactory Unsatisfactory Warehousing and specialized storage facilities (-) Unsatisfactory Unsatisfactory Unsatisfactory Domestic logistics service providers (-) Very unsatisfactory Very unsatisfactory Very unsatisfactory International logistics service providers (-) Unsatisfactory Unsatisfactory Unsatisfactory
Cold storage service provider
Domestic road conditions (2nd) Unsatisfactory Unsatisfactory Unsatisfactory Domestic trucking services (2nd) Very unsatisfactory Very unsatisfactory Very unsatisfactory Domestic cold chain (2nd) Satisfactory Satisfactory Satisfactory Warehousing and specialized storage facilities (2nd) Satisfactory Satisfactory Satisfactory Domestic logistics service providers (2nd) Satisfactory Satisfactory Satisfactory International logistics service providers (2nd) Satisfactory Satisfactory Satisfactory Note: - means no rating. Some services were not rated and/or ranked.
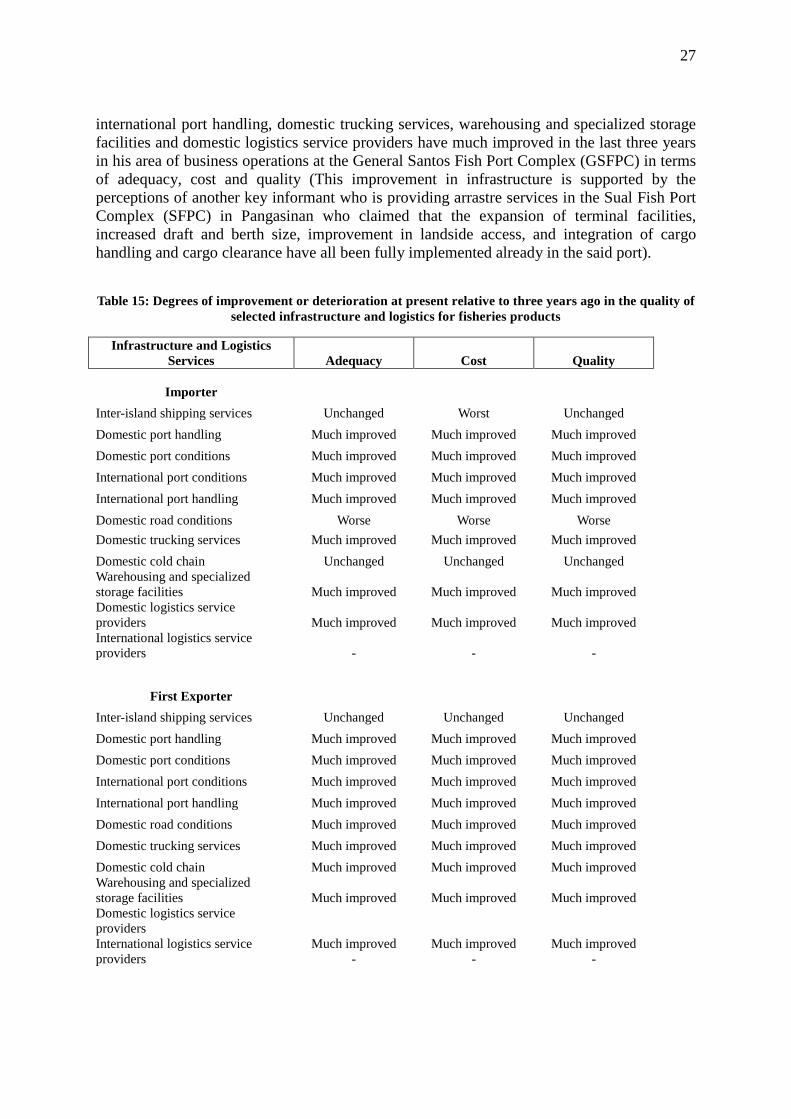
The degrees of improvement or deterioration at present relative to three years ago in the quality of infrastructure and logistics are presented in Table 15. According to the fish importer, domestic port handling, domestic port conditions, international port conditions,
27
international port handling, domestic trucking services, warehousing and specialized storage facilities and domestic logistics service providers have much improved in the last three years in his area of business operations at the General Santos Fish Port Complex (GSFPC) in terms of adequacy, cost and quality (This improvement in infrastructure is supported by the perceptions of another key informant who is providing arrastre services in the Sual Fish Port Complex (SFPC) in Pangasinan who claimed that the expansion of terminal facilities, increased draft and berth size, improvement in landside access, and integration of cargo handling and cargo clearance have all been fully implemented already in the said port).
Table 15: Degrees of improvement or deterioration at present relative to three years ago in the quality of
selected infrastructure and logistics for fisheries products
Infrastructure and Logistics Services Adequacy Cost Quality
Importer
Inter-island shipping services Unchanged Worst Unchanged Domestic port handling Much improved Much improved Much improved Domestic port conditions Much improved Much improved Much improved International port conditions Much improved Much improved Much improved International port handling Much improved Much improved Much improved Domestic road conditions Worse Worse Worse Domestic trucking services Much improved Much improved Much improved Domestic cold chain Unchanged Unchanged Unchanged Warehousing and specialized storage facilities Much improved Much improved Much improved Domestic logistics service providers Much improved Much improved Much improved International logistics service providers - - -
First Exporter
Inter-island shipping services Unchanged Unchanged Unchanged Domestic port handling Much improved Much improved Much improved Domestic port conditions Much improved Much improved Much improved International port conditions Much improved Much improved Much improved International port handling Much improved Much improved Much improved Domestic road conditions Much improved Much improved Much improved Domestic trucking services Much improved Much improved Much improved Domestic cold chain Much improved Much improved Much improved Warehousing and specialized storage facilities Much improved Much improved Much improved Domestic logistics service providers International logistics service providers
Much improved -
Much improved -
Much improved -
28
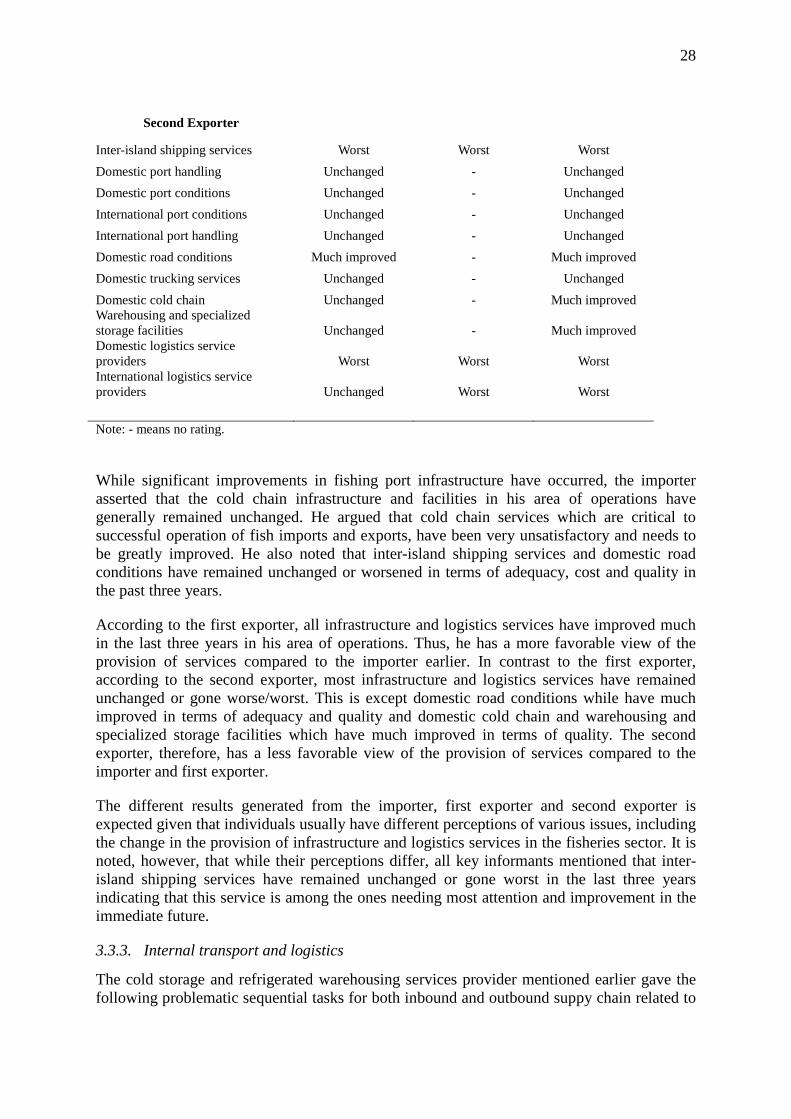
Second Exporter
Inter-island shipping services Worst Worst Worst Domestic port handling Unchanged - Unchanged Domestic port conditions Unchanged - Unchanged International port conditions Unchanged - Unchanged International port handling Unchanged - Unchanged Domestic road conditions Much improved - Much improved Domestic trucking services Unchanged - Unchanged Domestic cold chain Unchanged - Much improved Warehousing and specialized storage facilities Unchanged - Much improved Domestic logistics service providers International logistics service providers
Worst
Unchanged
Worst
Worst
Worst
Worst Note: - means no rating.
While significant improvements in fishing port infrastructure have occurred, the importer asserted that the cold chain infrastructure and facilities in his area of operations have generally remained unchanged. He argued that cold chain services which are critical to successful operation of fish imports and exports, have been very unsatisfactory and needs to be greatly improved. He also noted that inter-island shipping services and domestic road conditions have remained unchanged or worsened in terms of adequacy, cost and quality in the past three years.
According to the first exporter, all infrastructure and logistics services have improved much in the last three years in his area of operations. Thus, he has a more favorable view of the provision of services compared to the importer earlier. In contrast to the first exporter, according to the second exporter, most infrastructure and logistics services have remained unchanged or gone worse/worst. This is except domestic road conditions while have much improved in terms of adequacy and quality and domestic cold chain and warehousing and specialized storage facilities which have much improved in terms of quality. The second exporter, therefore, has a less favorable view of the provision of services compared to the importer and first exporter.
The different results generated from the importer, first exporter and second exporter is expected given that individuals usually have different perceptions of various issues, including the change in the provision of infrastructure and logistics services in the fisheries sector. It is noted, however, that while their perceptions differ, all key informants mentioned that inter-island shipping services have remained unchanged or gone worst in the last three years indicating that this service is among the ones needing most attention and improvement in the immediate future.
3.3.3. Internal transport and logistics
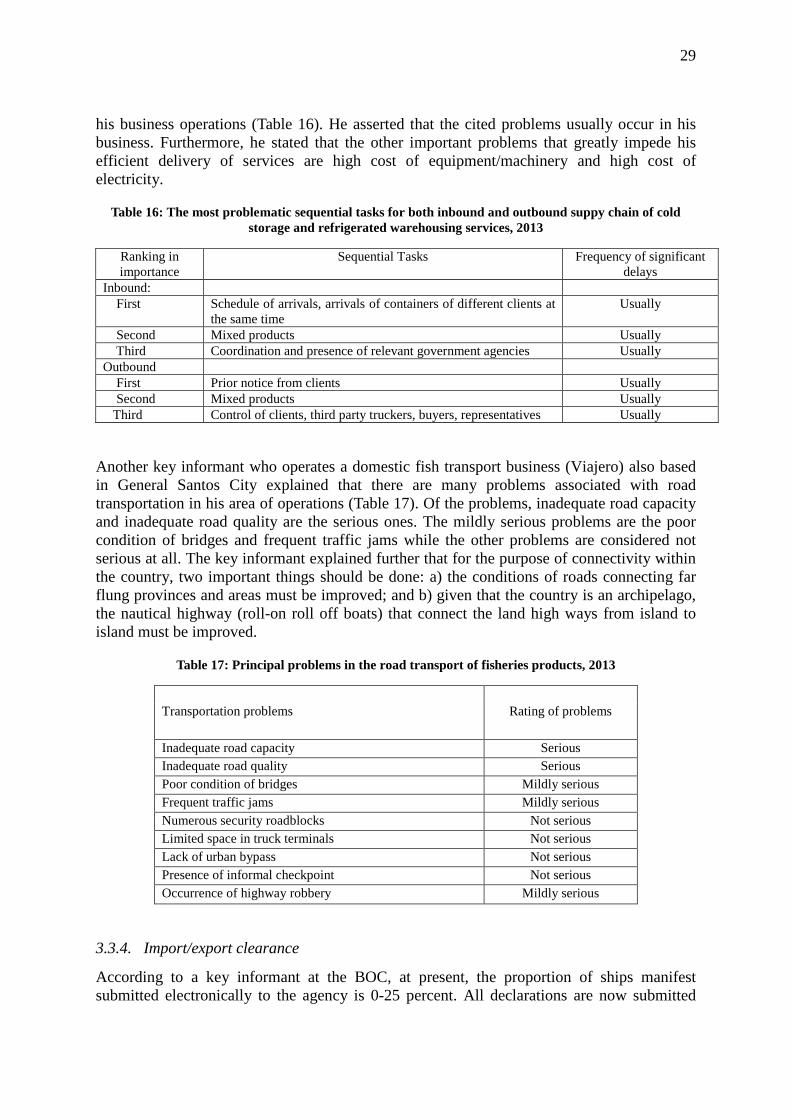
The cold storage and refrigerated warehousing services provider mentioned earlier gave the following problematic sequential tasks for both inbound and outbound suppy chain related to
29
his business operations (Table 16). He asserted that the cited problems usually occur in his business. Furthermore, he stated that the other important problems that greatly impede his efficient delivery of services are high cost of equipment/machinery and high cost of electricity.
Table 16: The most problematic sequential tasks for both inbound and outbound suppy chain of cold storage and refrigerated warehousing services, 2013
Ranking in importance
Sequential Tasks Frequency of significant delays
Inbound: First Schedule of arrivals, arrivals of containers of different clients at
the same time Usually
Second Mixed products Usually Third Coordination and presence of relevant government agencies Usually Outbound First Prior notice from clients Usually Second Mixed products Usually Third Control of clients, third party truckers, buyers, representatives Usually
Another key informant who operates a domestic fish transport business (Viajero) also based in General Santos City explained that there are many problems associated with road transportation in his area of operations (Table 17). Of the problems, inadequate road capacity and inadequate road quality are the serious ones. The mildly serious problems are the poor condition of bridges and frequent traffic jams while the other problems are considered not serious at all. The key informant explained further that for the purpose of connectivity within the country, two important things should be done: a) the conditions of roads connecting far flung provinces and areas must be improved; and b) given that the country is an archipelago, the nautical highway (roll-on roll off boats) that connect the land high ways from island to island must be improved.
Table 17: Principal problems in the road transport of fisheries products, 2013
Transportation problems
Rating of problems
Inadequate road capacity Serious Inadequate road quality Serious Poor condition of bridges Mildly serious Frequent traffic jams Mildly serious Numerous security roadblocks Not serious Limited space in truck terminals Not serious Lack of urban bypass Not serious Presence of informal checkpoint Not serious Occurrence of highway robbery Mildly serious
3.3.4. Import/export clearance
According to a key informant at the BOC, at present, the proportion of ships manifest submitted electronically to the agency is 0-25 percent. All declarations are now submitted
30
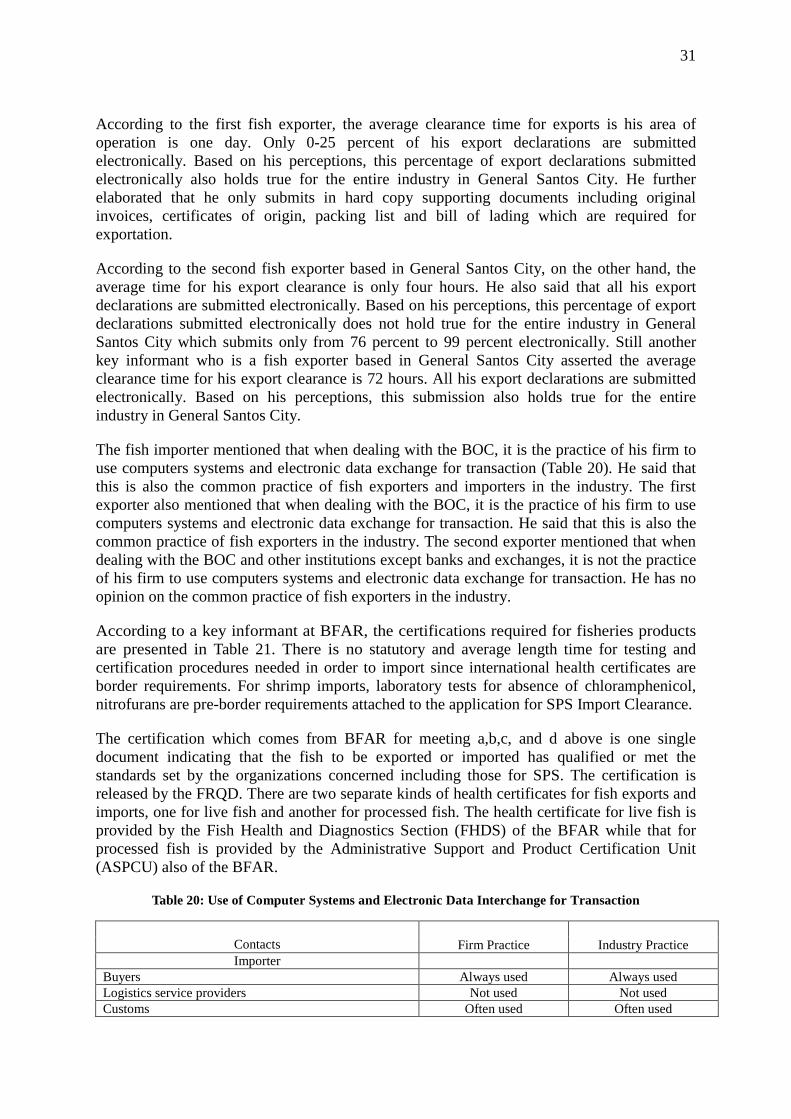
electronically. The proportion of declarations submitted prior to arrival is 0-25 percent. All supporting documents required for the customs clearance of imports are submitted either in hard copy or electronic copy except way-bill or bill of lading which is submitted only in hard copy. The key informant further explained that the responsibility for managing document flow within customs falls on the customs officers and the decision on clearance procedures solely is based on risk management system.
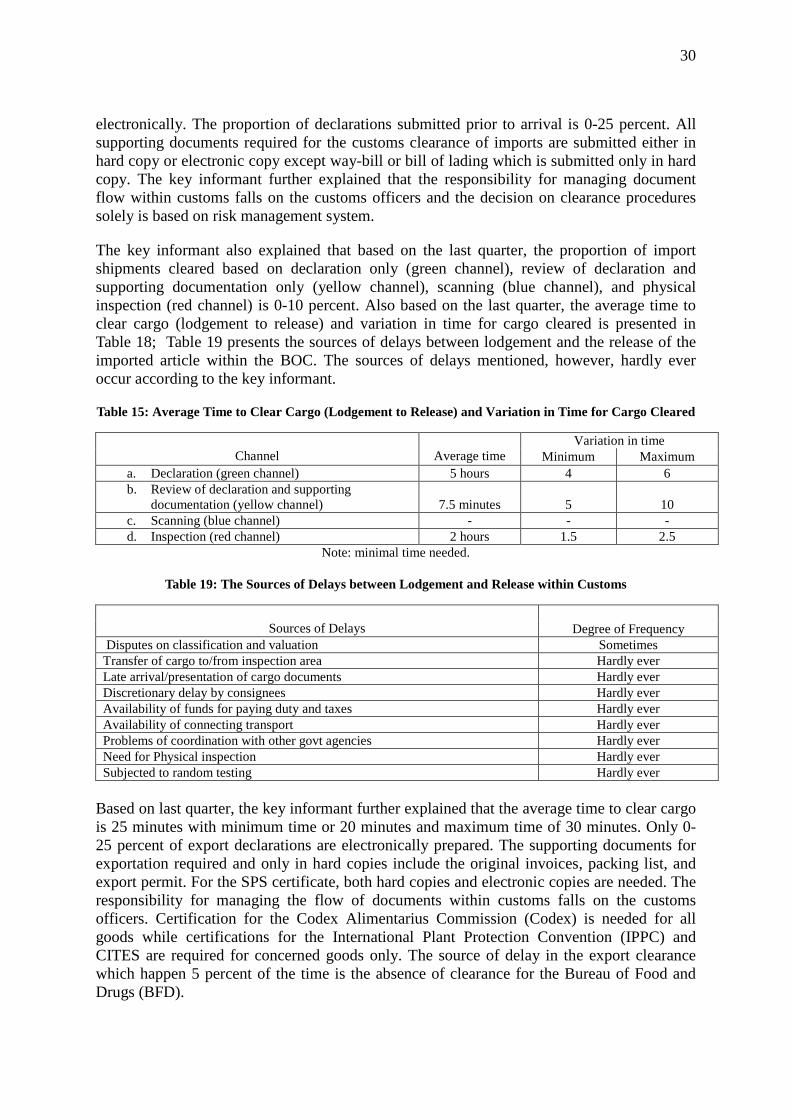
The key informant also explained that based on the last quarter, the proportion of import shipments cleared based on declaration only (green channel), review of declaration and supporting documentation only (yellow channel), scanning (blue channel), and physical inspection (red channel) is 0-10 percent. Also based on the last quarter, the average time to clear cargo (lodgement to release) and variation in time for cargo cleared is presented in Table 18; Table 19 presents the sources of delays between lodgement and the release of the imported article within the BOC. The sources of delays mentioned, however, hardly ever occur according to the key informant.
Table 15: Average Time to Clear Cargo (Lodgement to Release) and Variation in Time for Cargo Cleared
Channel
Average time
Variation in time Minimum Maximum
a. Declaration (green channel) 5 hours 4 6 b. Review of declaration and supporting
documentation (yellow channel)
7.5 minutes
5
10 c. Scanning (blue channel) - - - d. Inspection (red channel) 2 hours 1.5 2.5
Note: minimal time needed.
Table 19: The Sources of Delays between Lodgement and Release within Customs
Sources of Delays
Degree of Frequency
Disputes on classification and valuation Sometimes Transfer of cargo to/from inspection area Hardly ever Late arrival/presentation of cargo documents Hardly ever Discretionary delay by consignees Hardly ever Availability of funds for paying duty and taxes Hardly ever Availability of connecting transport Hardly ever Problems of coordination with other govt agencies Hardly ever Need for Physical inspection Hardly ever Subjected to random testing Hardly ever
Based on last quarter, the key informant further explained that the average time to clear cargo is 25 minutes with minimum time or 20 minutes and maximum time of 30 minutes. Only 0-25 percent of export declarations are electronically prepared. The supporting documents for exportation required and only in hard copies include the original invoices, packing list, and export permit. For the SPS certificate, both hard copies and electronic copies are needed. The responsibility for managing the flow of documents within customs falls on the customs officers. Certification for the Codex Alimentarius Commission (Codex) is needed for all goods while certifications for the International Plant Protection Convention (IPPC) and CITES are required for concerned goods only. The source of delay in the export clearance which happen 5 percent of the time is the absence of clearance for the Bureau of Food and Drugs (BFD).
31
According to the first fish exporter, the average clearance time for exports is his area of operation is one day. Only 0-25 percent of his export declarations are submitted electronically. Based on his perceptions, this percentage of export declarations submitted electronically also holds true for the entire industry in General Santos City. He further elaborated that he only submits in hard copy supporting documents including original invoices, certificates of origin, packing list and bill of lading which are required for exportation.
According to the second fish exporter based in General Santos City, on the other hand, the average time for his export clearance is only four hours. He also said that all his export declarations are submitted electronically. Based on his perceptions, this percentage of export declarations submitted electronically does not hold true for the entire industry in General Santos City which submits only from 76 percent to 99 percent electronically. Still another key informant who is a fish exporter based in General Santos City asserted the average clearance time for his export clearance is 72 hours. All his export declarations are submitted electronically. Based on his perceptions, this submission also holds true for the entire industry in General Santos City.
The fish importer mentioned that when dealing with the BOC, it is the practice of his firm to use computers systems and electronic data exchange for transaction (Table 20). He said that this is also the common practice of fish exporters and importers in the industry. The first exporter also mentioned that when dealing with the BOC, it is the practice of his firm to use computers systems and electronic data exchange for transaction. He said that this is also the common practice of fish exporters in the industry. The second exporter mentioned that when dealing with the BOC and other institutions except banks and exchanges, it is not the practice of his firm to use computers systems and electronic data exchange for transaction. He has no opinion on the common practice of fish exporters in the industry.
According to a key informant at BFAR, the certifications required for fisheries products are presented in Table 21. There is no statutory and average length time for testing and certification procedures needed in order to import since international health certificates are border requirements. For shrimp imports, laboratory tests for absence of chloramphenicol, nitrofurans are pre-border requirements attached to the application for SPS Import Clearance.
The certification which comes from BFAR for meeting a,b,c, and d above is one single document indicating that the fish to be exported or imported has qualified or met the standards set by the organizations concerned including those for SPS. The certification is released by the FRQD. There are two separate kinds of health certificates for fish exports and imports, one for live fish and another for processed fish. The health certificate for live fish is provided by the Fish Health and Diagnostics Section (FHDS) of the BFAR while that for processed fish is provided by the Administrative Support and Product Certification Unit (ASPCU) also of the BFAR.
Table 20: Use of Computer Systems and Electronic Data Interchange for Transaction
Contacts
Firm Practice Industry Practice
Importer Buyers Always used Always used Logistics service providers Not used Not used Customs Often used Often used
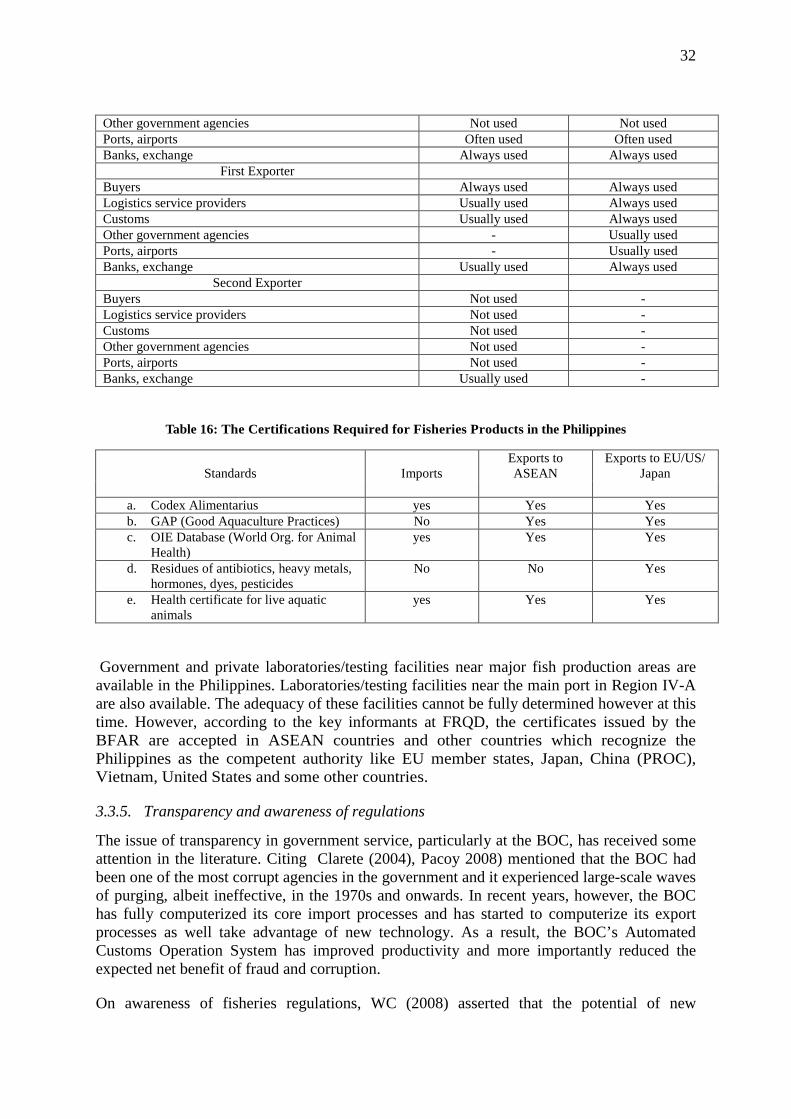
32
Other government agencies Not used Not used Ports, airports Often used Often used Banks, exchange Always used Always used
First Exporter Buyers Always used Always used Logistics service providers Usually used Always used Customs Usually used Always used Other government agencies - Usually used Ports, airports - Usually used Banks, exchange Usually used Always used
Second Exporter Buyers Not used - Logistics service providers Not used - Customs Not used - Other government agencies Not used - Ports, airports Not used - Banks, exchange Usually used -
Table 16: The Certifications Required for Fisheries Products in the Philippines
Standards
Imports
Exports to ASEAN
Exports to EU/US/ Japan
a. Codex Alimentarius yes Yes Yes b. GAP (Good Aquaculture Practices) No Yes Yes c. OIE Database (World Org. for Animal
Health) yes Yes Yes
d. Residues of antibiotics, heavy metals, hormones, dyes, pesticides
No No Yes
e. Health certificate for live aquatic animals
yes Yes Yes
Government and private laboratories/testing facilities near major fish production areas are available in the Philippines. Laboratories/testing facilities near the main port in Region IV-A are also available. The adequacy of these facilities cannot be fully determined however at this time. However, according to the key informants at FRQD, the certificates issued by the BFAR are accepted in ASEAN countries and other countries which recognize the Philippines as the competent authority like EU member states, Japan, China (PROC), Vietnam, United States and some other countries.
3.3.5. Transparency and awareness of regulations
The issue of transparency in government service, particularly at the BOC, has received some attention in the literature. Citing Clarete (2004), Pacoy 2008) mentioned that the BOC had been one of the most corrupt agencies in the government and it experienced large-scale waves of purging, albeit ineffective, in the 1970s and onwards. In recent years, however, the BOC has fully computerized its core import processes and has started to computerize its export processes as well take advantage of new technology. As a result, the BOC’s Automated Customs Operation System has improved productivity and more importantly reduced the expected net benefit of fraud and corruption.
On awareness of fisheries regulations, WC (2008) asserted that the potential of new
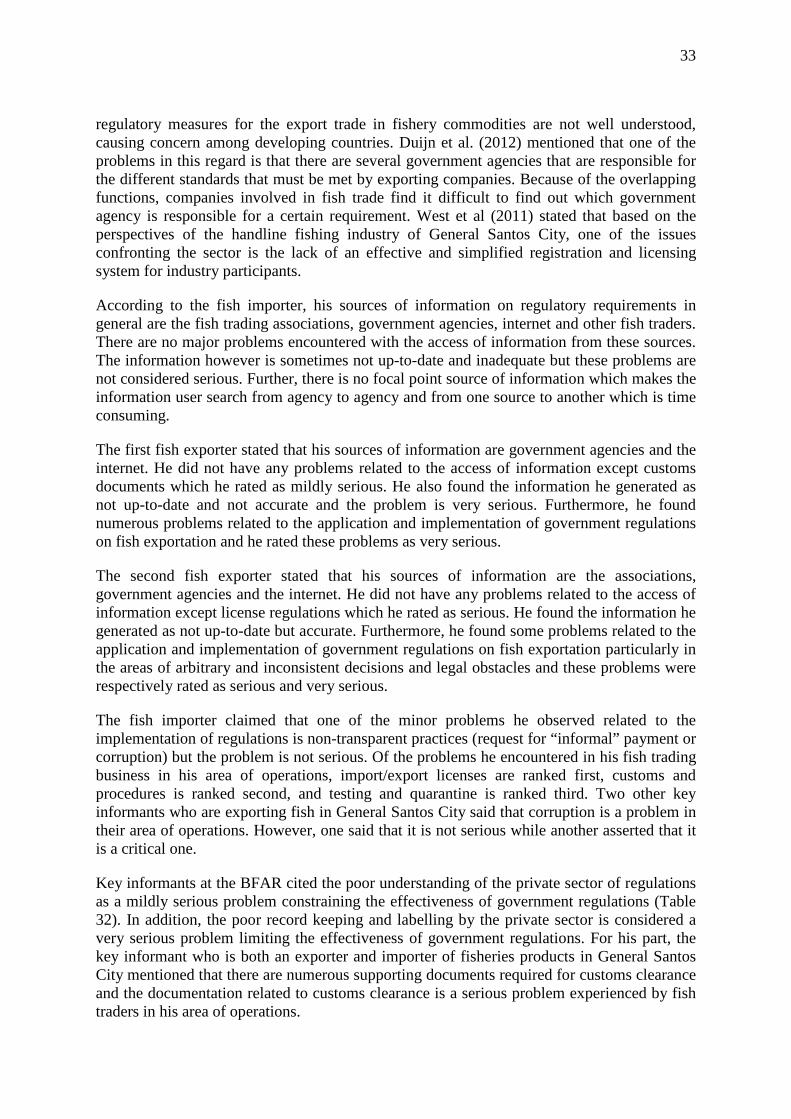
33
regulatory measures for the export trade in fishery commodities are not well understood, causing concern among developing countries. Duijn et al. (2012) mentioned that one of the problems in this regard is that there are several government agencies that are responsible for the different standards that must be met by exporting companies. Because of the overlapping functions, companies involved in fish trade find it difficult to find out which government agency is responsible for a certain requirement. West et al (2011) stated that based on the perspectives of the handline fishing industry of General Santos City, one of the issues confronting the sector is the lack of an effective and simplified registration and licensing system for industry participants.
According to the fish importer, his sources of information on regulatory requirements in general are the fish trading associations, government agencies, internet and other fish traders. There are no major problems encountered with the access of information from these sources. The information however is sometimes not up-to-date and inadequate but these problems are not considered serious. Further, there is no focal point source of information which makes the information user search from agency to agency and from one source to another which is time consuming.
The first fish exporter stated that his sources of information are government agencies and the internet. He did not have any problems related to the access of information except customs documents which he rated as mildly serious. He also found the information he generated as not up-to-date and not accurate and the problem is very serious. Furthermore, he found numerous problems related to the application and implementation of government regulations on fish exportation and he rated these problems as very serious.
The second fish exporter stated that his sources of information are the associations, government agencies and the internet. He did not have any problems related to the access of information except license regulations which he rated as serious. He found the information he generated as not up-to-date but accurate. Furthermore, he found some problems related to the application and implementation of government regulations on fish exportation particularly in the areas of arbitrary and inconsistent decisions and legal obstacles and these problems were respectively rated as serious and very serious.
The fish importer claimed that one of the minor problems he observed related to the implementation of regulations is non-transparent practices (request for “informal” payment or corruption) but the problem is not serious. Of the problems he encountered in his fish trading business in his area of operations, import/export licenses are ranked first, customs and procedures is ranked second, and testing and quarantine is ranked third. Two other key informants who are exporting fish in General Santos City said that corruption is a problem in their area of operations. However, one said that it is not serious while another asserted that it is a critical one.
Key informants at the BFAR cited the poor understanding of the private sector of regulations as a mildly serious problem constraining the effectiveness of government regulations (Table 32). In addition, the poor record keeping and labelling by the private sector is considered a very serious problem limiting the effectiveness of government regulations. For his part, the key informant who is both an exporter and importer of fisheries products in General Santos City mentioned that there are numerous supporting documents required for customs clearance and the documentation related to customs clearance is a serious problem experienced by fish traders in his area of operations.
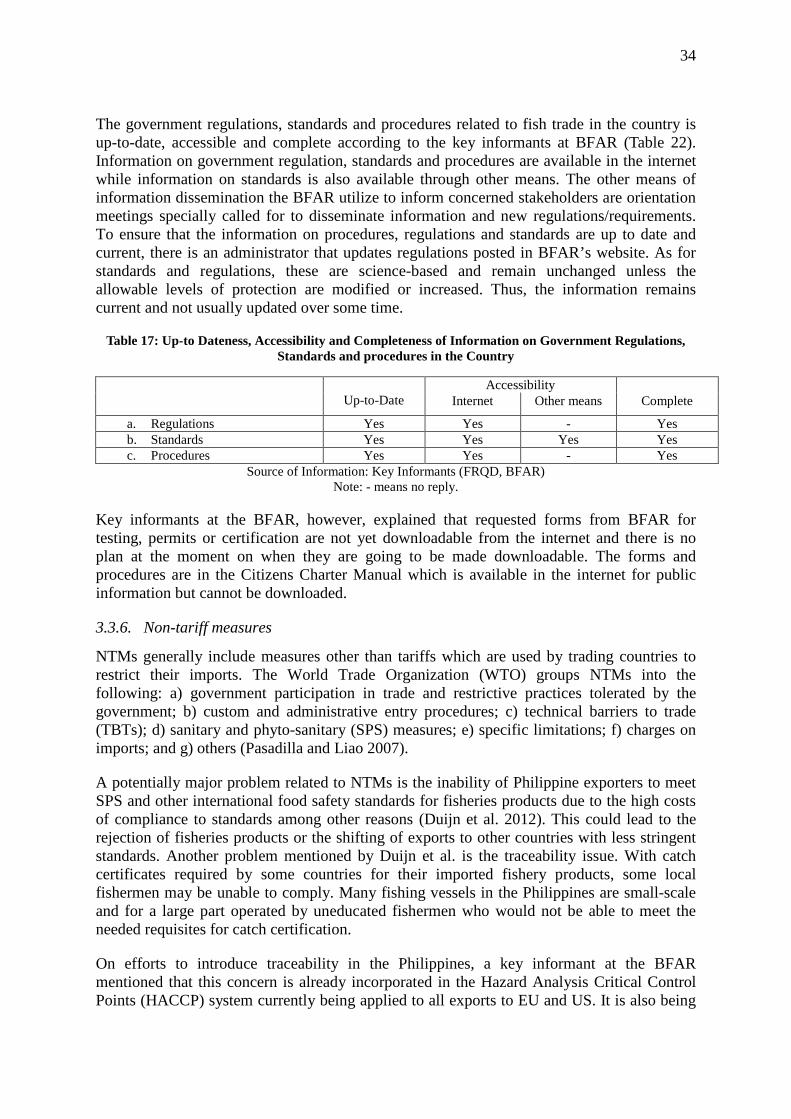
34
The government regulations, standards and procedures related to fish trade in the country is up-to-date, accessible and complete according to the key informants at BFAR (Table 22). Information on government regulation, standards and procedures are available in the internet while information on standards is also available through other means. The other means of information dissemination the BFAR utilize to inform concerned stakeholders are orientation meetings specially called for to disseminate information and new regulations/requirements. To ensure that the information on procedures, regulations and standards are up to date and current, there is an administrator that updates regulations posted in BFAR’s website. As for standards and regulations, these are science-based and remain unchanged unless the allowable levels of protection are modified or increased. Thus, the information remains current and not usually updated over some time.
Table 17: Up-to Dateness, Accessibility and Completeness of Information on Government Regulations, Standards and procedures in the Country
Up-to-Date
Accessibility Internet Other means Complete
a. Regulations Yes Yes - Yes b. Standards Yes Yes Yes Yes c. Procedures Yes Yes - Yes
Source of Information: Key Informants (FRQD, BFAR) Note: - means no reply.
Key informants at the BFAR, however, explained that requested forms from BFAR for testing, permits or certification are not yet downloadable from the internet and there is no plan at the moment on when they are going to be made downloadable. The forms and procedures are in the Citizens Charter Manual which is available in the internet for public information but cannot be downloaded.
3.3.6. Non-tariff measures
NTMs generally include measures other than tariffs which are used by trading countries to restrict their imports. The World Trade Organization (WTO) groups NTMs into the following: a) government participation in trade and restrictive practices tolerated by the government; b) custom and administrative entry procedures; c) technical barriers to trade (TBTs); d) sanitary and phyto-sanitary (SPS) measures; e) specific limitations; f) charges on imports; and g) others (Pasadilla and Liao 2007).
A potentially major problem related to NTMs is the inability of Philippine exporters to meet SPS and other international food safety standards for fisheries products due to the high costs of compliance to standards among other reasons (Duijn et al. 2012). This could lead to the rejection of fisheries products or the shifting of exports to other countries with less stringent standards. Another problem mentioned by Duijn et al. is the traceability issue. With catch certificates required by some countries for their imported fishery products, some local fishermen may be unable to comply. Many fishing vessels in the Philippines are small-scale and for a large part operated by uneducated fishermen who would not be able to meet the needed requisites for catch certification.
On efforts to introduce traceability in the Philippines, a key informant at the BFAR mentioned that this concern is already incorporated in the Hazard Analysis Critical Control Points (HACCP) system currently being applied to all exports to EU and US. It is also being
35
required for the catch certification scheme to implement EC Regulation 1005/2008 which excludes marine products derived from illegal, unregulated and unreported (IUU) fishing from being exported to EU member countries. Furthermore, traceability for farmed products is incorporated in the National Residue Control Programme required for EU exports.
Another potential problem related to NTMs is the inability of Philippine exporters to meet SPS standards not due to costs of compliance but due to the very high standards set by some countries. For instance, EU imposes a requirement of a minimum of 0.02 parts per million (ppm) in lead content in tuna and other fishery products that it imports from ASEAN. This condition is considered as too stringent and for some years now, ASEAN countries have been lobbying for the application of a 0.03 ppm maximum allowable lead content as specified in the Codex Alimentarius, of internationally recognized source of food safety standards. Despite these barriers, Duijn et al. (2012) affirms that there are tuna exporting companies in the Philippines that already meet the standards set by EU, Japan and the US such as HACCP, Good Manufacturing Practices (GMP) and Sanitation Standard Operation Procedure (SSOP). Nevertheless, there are still some companies that are hesitant to expand into the EU market because of its strict requirements.
4. ANALYSIS OF POLICY, REGULATORY AND INSTITUTIONAL ISSUES
4.1. Case of CNO
4.1.1. Infrastructural, regulatory, and investment issues in internal transport
Regulation of internal transport of coconut products is limited to quarantine regulations – aimed at arresting the spread of the Cadang-Cadang disease. Otherwise movement of copra and other coconut products within the country is free.
LSPs are regulated by the Philippine Shippers' Bureau of Department of Trade and Industry. LSPs also need to obtain permit to operate in a Port, is given by the Philippine Ports Authority of the DOTC. Licenses and permits do not require any special training. No limitations or restrictions are imposed on the services except as follows:
• mandatory insurance;
• minimum capitalization (P4 million or just under $100,000);
• regulation on prices charged;
• nationality requirement (100% Filipino-owned).
None of these were serious limitations for the company, or even the industry, as these are typically non-binding (pricing is well below the ceilings provided by PSB; capitalization is well over the minimum needed; insurance would have been purchased). The possible exception is the nationality requirement for the industry. For the company itself this was not an issue because the mother company, which is foreign-owned, created a domestic company under ownership and management of the Filipino spouse of the owner. Respondents were unable to gauge whether this is a serious constraint for the industry as at large.
36
4.1.2. Import and export clearance regulations and certification
The DA imposes export permit requirements to impose product standards on outgoing goods. Meanwhile import of vegetable oils fall under the purvey of the Department of Health and is regulated to ensure food safety of consumers; however there is no quarantine requirement for this product category.
Since 1985, following feedback from industry stakeholders, a major reform was instituted by EO 1016, simplifying procedures for export of coconut oil. In particular, laboratory testing can now be done by private laboratories. These testing facilities, whether public (PCA) or private, are available near the main port, and are generally adequate. Currently, export clearance does not require third-party certification (e.g. GAP, Halal, GMP), rather compliance with PCA product and safety standards.
PCA claims that simplification of import and export regulations has been fully eliminated, as well as that of foreign exchange controls. There is however no plan to drop the PCA fee, which at 12 centavos per kg of copra is deemed sufficiently small as to be almost inconsequential.
Meanwhile Customs functions include collection of border taxes, border control of goods, and trade facilitation. According to Customs, computerization is now fully implemented (though there is no discussion of a completely paperless system). Also fully implemented are:
• use of risk management
• simplification of cargo processing flow
• introduction of preferred status program
• modification of operating hours
• scanning equipment
Enhanced training and recruitment of customs staff is under implementation, while there is apparently no plan for reorganization of customs services. The Bureau cites no major impediments to the introduction of modern procedures, having been the beneficiary of several capacity-development programs towards upgrading of customs services.
4.1.3. Inter-agency / inter-governmental coordination
With respect to inter-agency coordination, the PCA rating is presented in Table 23. The assessment is very sanguine in favor of government. Note however that the rating is "Very strong" but does not include electronic linkages (at present); however the coordination was characterized as beyond "Average". Ministry of Agriculture officials only cited one example of coordination problem, which was quite minor overall: the export of mature coconut, whose prohibition could not readily enforced. The High rating is consistent with the Customs response claiming that that are no coordination problems with ministries related to HS15.
37
Table 18: Rating of quality of coordination within government
Quality of coordination (1 = no coordination; 5 = Super efficient)
Among concerned agencies under Ministry 4
Among agencies between Ministries 4
Between Ministry and Customs 4
4.2.Case of Fisheries
4.2.1. Infrastructural, regulatory, and investment issues in internal transport
In the fisheries sector, Yamashita (2008) mentioned that the tuna industry is trying to overcome difficulties including high transportation costs. The poor state of fisheries infrastructure and cold chain in the Philippines has been noted in the relevant literature. BFAR and FISH (2005), for instance, mentioned that the commercial fisheries subsector has to rely on private ice plants and ice making facilities and while the government provides refrigeration facilities in major fish ports and some municipal ports, most of these facilities are non-operational. Duijn et al. (2012) stated that for the Philippine tuna industry, in particular, the main quality and safety issues are related to improper handling of fish between capture and unloading, bad practice of icing and cooling, and poor sanitation of equipment. West et al. (2011) furthermore argued that in the handline fishing industry of General Santos City, specifically, one of the most pressing issues confronting the tuna subsector is the problem in the handling and refrigeration of fish on handline vessels, especially during long fishing trips.
NFRDI and WCPFC (2012) reported that the Philippine Fisheries Development Authority (PFDA) which manages the major fishing ports in the country recognizes that the increasing competition from other ASEAN countries requires the development of a more efficient port landing and fish certification system that meets international standards. It also mentioned that the major fishing ports of the country are targeted for improvement in the near future. BFAR (n.d.) said that the General Santos Fish Port Complex (GSFPC), in particular, has already undergone expansion and improvement. Major components of said expansion/improvement project includes construction of deep wharves, cold storage and processing area, port handling equipment, power substation, waste water treatment plant, water supply system and other ancillary facilities. BFAR further explained that the other major fish ports in the country are likewise proposed for rehabilitation in the near future. In Metro Manila, in particular, the Navotas Fish Port Complex (NFPC) which is the major fish landing port in the national capital region and nearby areas is scheduled for upgrading of its facilities including its roads, electrical and power system, landing quay and breakwaters (NFRDI and WCPFC (2012).
4.2.2. Import and export clearance regulations and certification
There is limited research on the efficiency of import or export clearance in the Philippines for all products including fisheries products in the Philippines. Alburo (n.d.) mentioned that the release of imported perishable goods at the Manila International Container Port (MICP) in delayed by 33 percent in terms of time between the arrival of goods and lodgement.
38
The permits required by the BFAR for the domestic and international movement of fisheries products are the local transport permit, import permit and export permit (Table 24). The import permit and export permits, in particular, are mandated by Section 61 (d) of RA 8550 and Section 20 of RA 9147 and their implementing Fisheries Administrative Orders 233, 233-1,233-2. To get an import permit from BFAR, the application can be availed from the FRQD. The filled-in form should be submitted together with the commercial invoice from the source of the fish product in the country from which it is imported. In addition, a health certificate from BFAR is also required.
Table 19: The permits required by BFAR for the domestic and international movement of fisheries products
Basis of permit, required documents
a. Local transport permit
Fisheries Administrative Order No. 233 implementing the Wildlife Resources Conservation and Protection Act or Republic Act 9147 for the movement of aquatic wildlife, quarantine clearance from port-based Fisheries Quarantine Officer. Auxiliary invoice per Section 15 of RA 8550 is also required by the local governments.
b. Import permit Section 61 (d) of RA 8550 and Section 20 of RA 9147 and its implementing Fisheries Administrative Orders 233, 233-1,233-2. Health Certificate: BFAR Fish Health and Diagnostics Section, BFAR Administrative Support and Product Certification and Quality Assurance Unit.
c. Export permit Section 61 (d) of RA 8550 and Section 20 of RA 9147 and its implementing Fisheries Administrative Orders 233, 233-1,233-2. Quarantine clearance: Bureau of Quarantine, Department of Health
To get an export permit from BFAR, the application form is also taken from the FRQD. The filled-in form should be submitted together with the commercial invoice from the exporter. A quarantine clearance from the Bureau of Quarantine (BOQ) of the Department of Health (DOH) is also needed. To facilitate the clearance, the BOQ usually takes a sample of the fish to be exported and releases the clearance once the sample is found to be adequate for exportation. A health certificate from BFAR is also needed. Furthermore, a filled-in export declaration form which can b availed from the BOC is required.
Key informants at the agency also mentioned that BFAR implements an e-permits system for imports and while there is no counterpart e-permits system for exports, there is a plan to implement one. There is no definite time frame for the e-permits for exports but the BOC already issued a circular that it would only recognize electronic permits and is phasing out manual permits from regulatory agencies. There is no e-certificates system for exports but there is a plan to implement one as well. No time frame is set however due to BOC Circular on ASEAN economic integration by 2015.
According to the key informant at the BOC, the level of computerization at the agency is shown in Table 25. According to the key informant at the BOC, electronic data interchange in the customs bureau is always used for submission of ship manifest/master air waybill, cargo declaration, and pre-arrival information, and usually used for approvals by other agencies. Submission of declaration and downloading of government forms is always be done in the
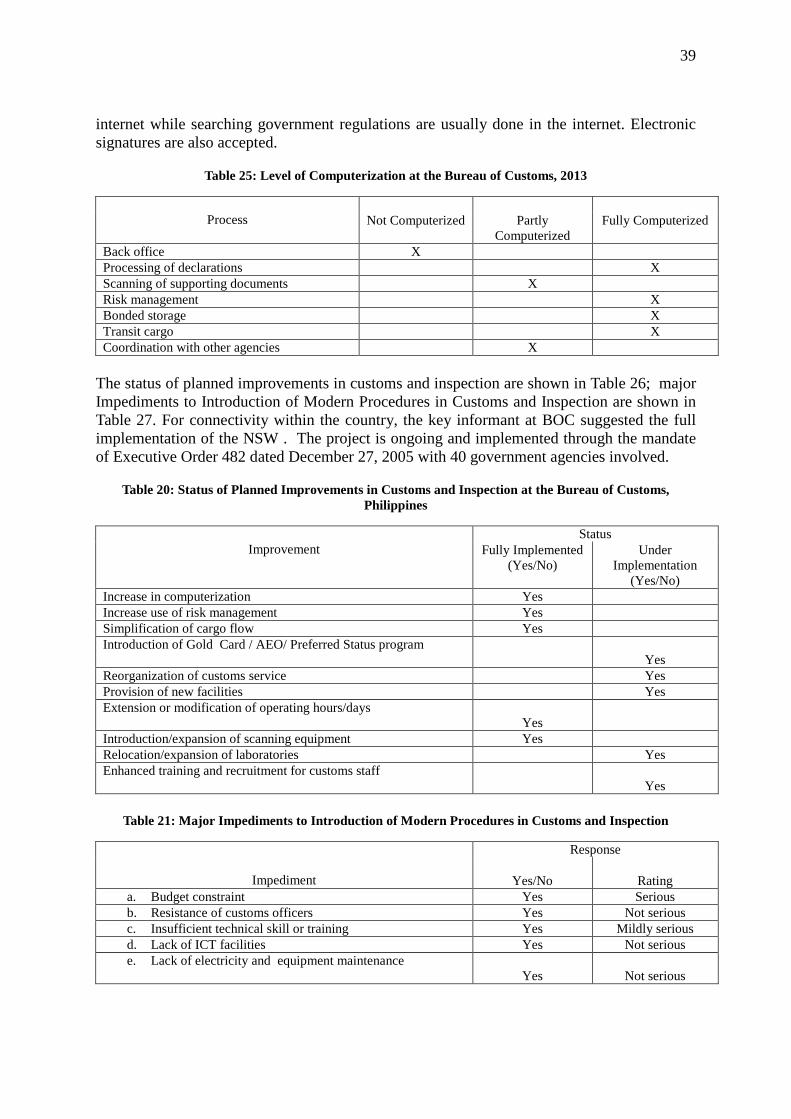
39
internet while searching government regulations are usually done in the internet. Electronic signatures are also accepted.
Table 25: Level of Computerization at the Bureau of Customs, 2013
Process
Not Computerized Partly
Computerized Fully Computerized
Back office X Processing of declarations X Scanning of supporting documents X Risk management X Bonded storage X Transit cargo X Coordination with other agencies X
The status of planned improvements in customs and inspection are shown in Table 26; major Impediments to Introduction of Modern Procedures in Customs and Inspection are shown in Table 27. For connectivity within the country, the key informant at BOC suggested the full implementation of the NSW . The project is ongoing and implemented through the mandate of Executive Order 482 dated December 27, 2005 with 40 government agencies involved.
Table 20: Status of Planned Improvements in Customs and Inspection at the Bureau of Customs, Philippines
Improvement
Status Fully Implemented
(Yes/No) Under
Implementation (Yes/No)
Increase in computerization Yes Increase use of risk management Yes Simplification of cargo flow Yes Introduction of Gold Card / AEO/ Preferred Status program
Yes Reorganization of customs service Yes Provision of new facilities Yes Extension or modification of operating hours/days
Yes
Introduction/expansion of scanning equipment Yes Relocation/expansion of laboratories Yes Enhanced training and recruitment for customs staff
Yes
Table 21: Major Impediments to Introduction of Modern Procedures in Customs and Inspection
Impediment
Response
Yes/No
Rating a. Budget constraint Yes Serious b. Resistance of customs officers Yes Not serious c. Insufficient technical skill or training Yes Mildly serious d. Lack of ICT facilities Yes Not serious e. Lack of electricity and equipment maintenance
Yes
Not serious
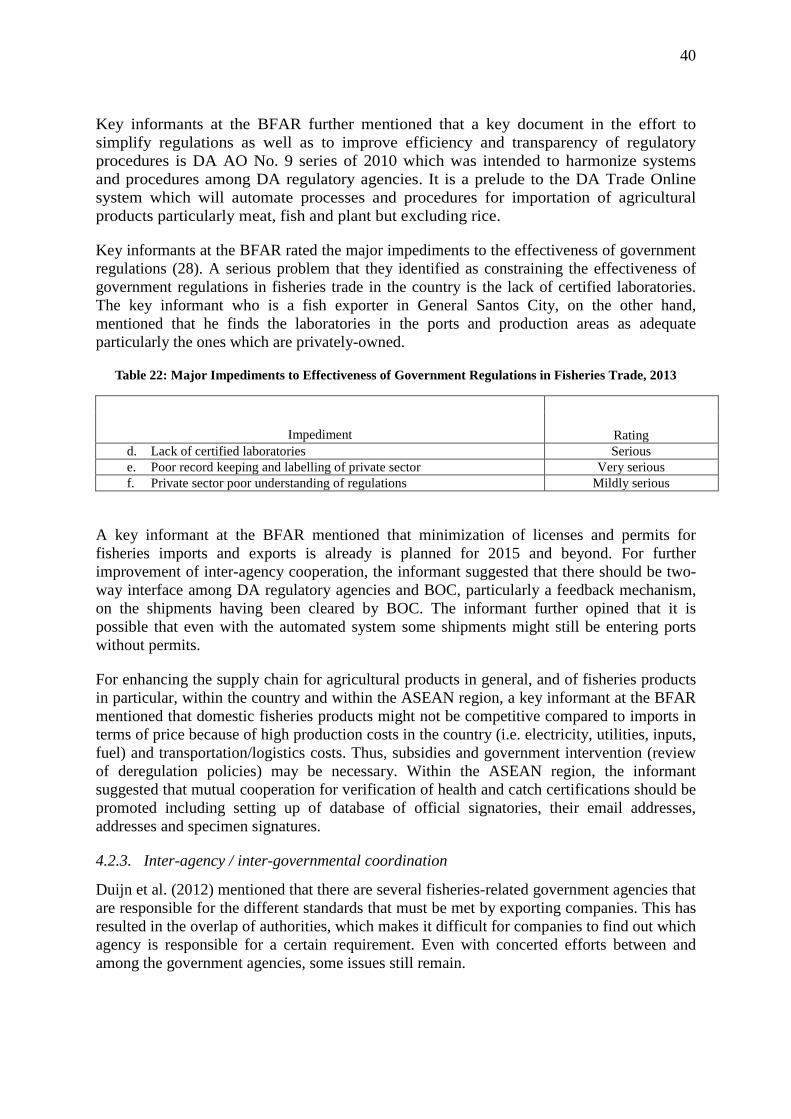
40
Key informants at the BFAR further mentioned that a key document in the effort to simplify regulations as well as to improve efficiency and transparency of regulatory procedures is DA AO No. 9 series of 2010 which was intended to harmonize systems and procedures among DA regulatory agencies. It is a prelude to the DA Trade Online system which will automate processes and procedures for importation of agricultural products particularly meat, fish and plant but excluding rice.
Key informants at the BFAR rated the major impediments to the effectiveness of government regulations (28). A serious problem that they identified as constraining the effectiveness of government regulations in fisheries trade in the country is the lack of certified laboratories. The key informant who is a fish exporter in General Santos City, on the other hand, mentioned that he finds the laboratories in the ports and production areas as adequate particularly the ones which are privately-owned.
Table 22: Major Impediments to Effectiveness of Government Regulations in Fisheries Trade, 2013
Impediment
Rating d. Lack of certified laboratories Serious e. Poor record keeping and labelling of private sector Very serious f. Private sector poor understanding of regulations Mildly serious
A key informant at the BFAR mentioned that minimization of licenses and permits for fisheries imports and exports is already is planned for 2015 and beyond. For further improvement of inter-agency cooperation, the informant suggested that there should be two-way interface among DA regulatory agencies and BOC, particularly a feedback mechanism, on the shipments having been cleared by BOC. The informant further opined that it is possible that even with the automated system some shipments might still be entering ports without permits.
For enhancing the supply chain for agricultural products in general, and of fisheries products in particular, within the country and within the ASEAN region, a key informant at the BFAR mentioned that domestic fisheries products might not be competitive compared to imports in terms of price because of high production costs in the country (i.e. electricity, utilities, inputs, fuel) and transportation/logistics costs. Thus, subsidies and government intervention (review of deregulation policies) may be necessary. Within the ASEAN region, the informant suggested that mutual cooperation for verification of health and catch certifications should be promoted including setting up of database of official signatories, their email addresses, addresses and specimen signatures.
4.2.3. Inter-agency / inter-governmental coordination
Duijn et al. (2012) mentioned that there are several fisheries-related government agencies that are responsible for the different standards that must be met by exporting companies. This has resulted in the overlap of authorities, which makes it difficult for companies to find out which agency is responsible for a certain requirement. Even with concerted efforts between and among the government agencies, some issues still remain.
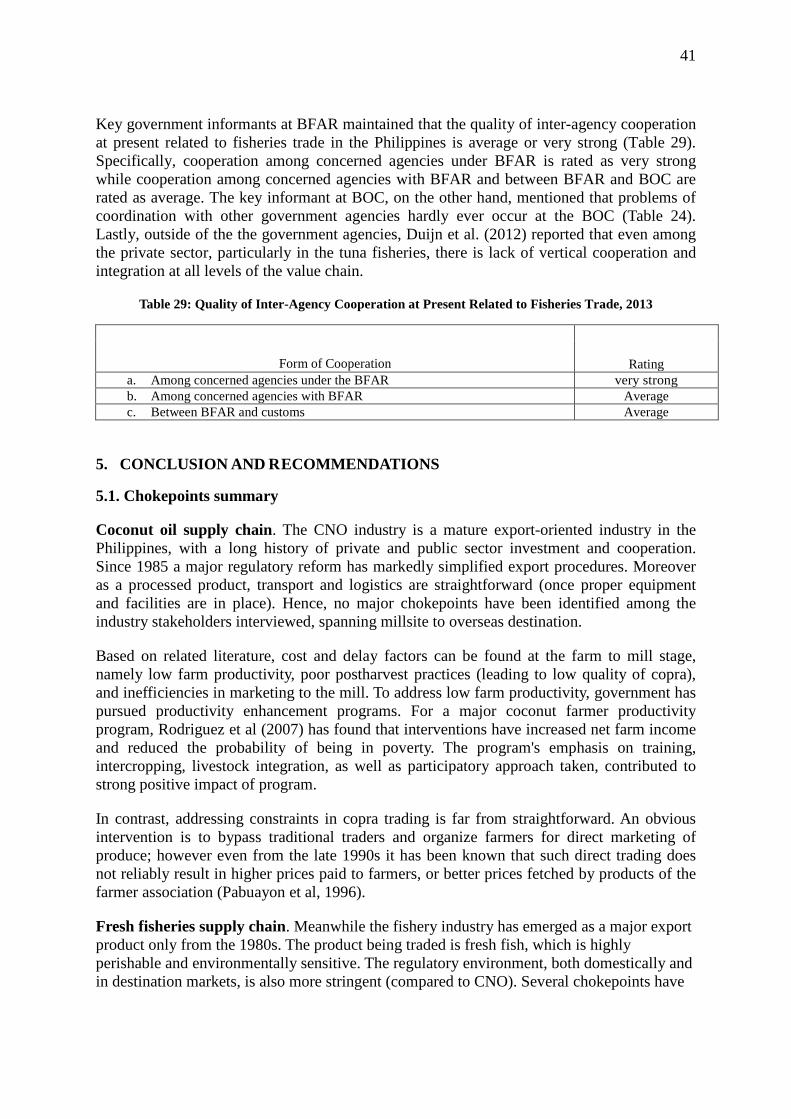
41
Key government informants at BFAR maintained that the quality of inter-agency cooperation at present related to fisheries trade in the Philippines is average or very strong (Table 29). Specifically, cooperation among concerned agencies under BFAR is rated as very strong while cooperation among concerned agencies with BFAR and between BFAR and BOC are rated as average. The key informant at BOC, on the other hand, mentioned that problems of coordination with other government agencies hardly ever occur at the BOC (Table 24). Lastly, outside of the the government agencies, Duijn et al. (2012) reported that even among the private sector, particularly in the tuna fisheries, there is lack of vertical cooperation and integration at all levels of the value chain.
Table 29: Quality of Inter-Agency Cooperation at Present Related to Fisheries Trade, 2013
Form of Cooperation
Rating a. Among concerned agencies under the BFAR very strong b. Among concerned agencies with BFAR Average c. Between BFAR and customs Average
5. CONCLUSION AND RECOMMENDATIONS
5.1. Chokepoints summary
Coconut oil supply chain. The CNO industry is a mature export-oriented industry in the Philippines, with a long history of private and public sector investment and cooperation. Since 1985 a major regulatory reform has markedly simplified export procedures. Moreover as a processed product, transport and logistics are straightforward (once proper equipment and facilities are in place). Hence, no major chokepoints have been identified among the industry stakeholders interviewed, spanning millsite to overseas destination.
Based on related literature, cost and delay factors can be found at the farm to mill stage, namely low farm productivity, poor postharvest practices (leading to low quality of copra), and inefficiencies in marketing to the mill. To address low farm productivity, government has pursued productivity enhancement programs. For a major coconut farmer productivity program, Rodriguez et al (2007) has found that interventions have increased net farm income and reduced the probability of being in poverty. The program's emphasis on training, intercropping, livestock integration, as well as participatory approach taken, contributed to strong positive impact of program.
In contrast, addressing constraints in copra trading is far from straightforward. An obvious intervention is to bypass traditional traders and organize farmers for direct marketing of produce; however even from the late 1990s it has been known that such direct trading does not reliably result in higher prices paid to farmers, or better prices fetched by products of the farmer association (Pabuayon et al, 1996).
Fresh fisheries supply chain. Meanwhile the fishery industry has emerged as a major export product only from the 1980s. The product being traded is fresh fish, which is highly perishable and environmentally sensitive. The regulatory environment, both domestically and in destination markets, is also more stringent (compared to CNO). Several chokepoints have
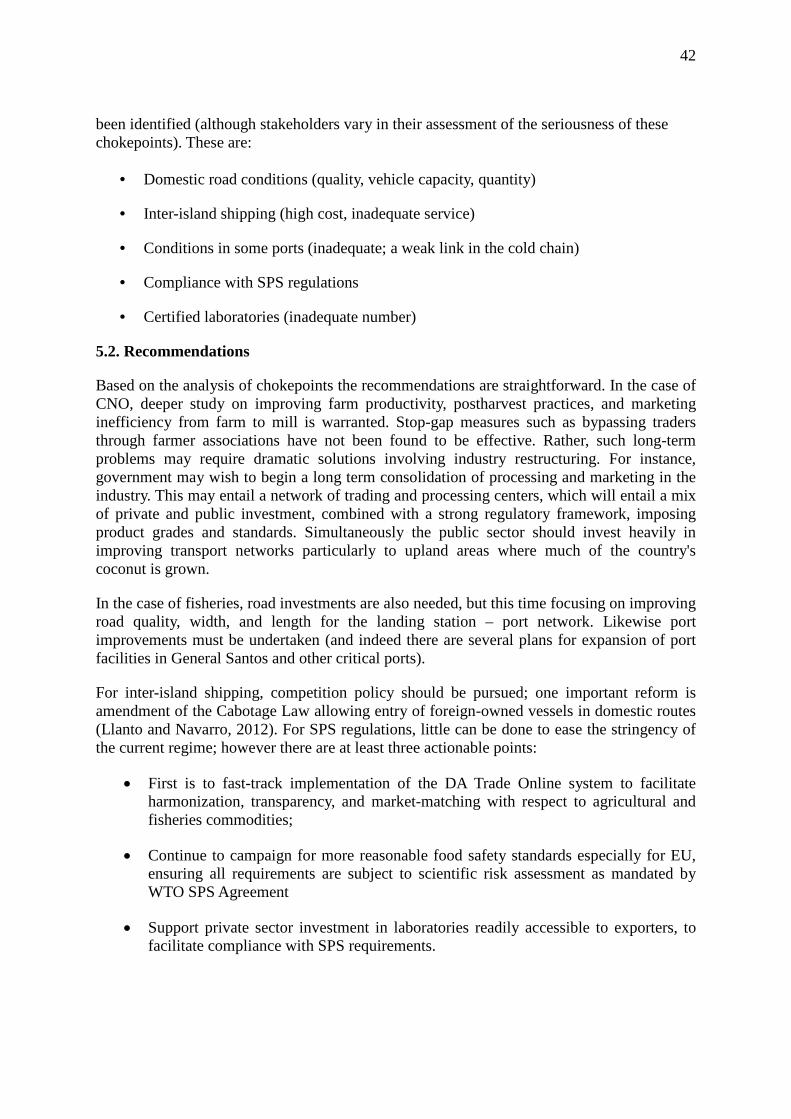
42
been identified (although stakeholders vary in their assessment of the seriousness of these chokepoints). These are:
• Domestic road conditions (quality, vehicle capacity, quantity)
• Inter-island shipping (high cost, inadequate service)
• Conditions in some ports (inadequate; a weak link in the cold chain)
• Compliance with SPS regulations
• Certified laboratories (inadequate number)
5.2. Recommendations
Based on the analysis of chokepoints the recommendations are straightforward. In the case of CNO, deeper study on improving farm productivity, postharvest practices, and marketing inefficiency from farm to mill is warranted. Stop-gap measures such as bypassing traders through farmer associations have not been found to be effective. Rather, such long-term problems may require dramatic solutions involving industry restructuring. For instance, government may wish to begin a long term consolidation of processing and marketing in the industry. This may entail a network of trading and processing centers, which will entail a mix of private and public investment, combined with a strong regulatory framework, imposing product grades and standards. Simultaneously the public sector should invest heavily in improving transport networks particularly to upland areas where much of the country's coconut is grown.
In the case of fisheries, road investments are also needed, but this time focusing on improving road quality, width, and length for the landing station – port network. Likewise port improvements must be undertaken (and indeed there are several plans for expansion of port facilities in General Santos and other critical ports).
For inter-island shipping, competition policy should be pursued; one important reform is amendment of the Cabotage Law allowing entry of foreign-owned vessels in domestic routes (Llanto and Navarro, 2012). For SPS regulations, little can be done to ease the stringency of the current regime; however there are at least three actionable points:
• First is to fast-track implementation of the DA Trade Online system to facilitate harmonization, transparency, and market-matching with respect to agricultural and fisheries commodities;
• Continue to campaign for more reasonable food safety standards especially for EU, ensuring all requirements are subject to scientific risk assessment as mandated by WTO SPS Agreement
• Support private sector investment in laboratories readily accessible to exporters, to facilitate compliance with SPS requirements.
43
REFERENCES Alburo, A. A., The Philippine Automation of Import Procedures for Perishable Goods.
Powerpoint Presentation, Center for the Advancement of Trade Integration and Facilitation, School of Economics, University of the Philippines.
Bureau ofAgricultural Statistics. 2007. Marketing Costs Structure of Milkfish. Department of Agriculture, Philippines. 24 p.
Bureau of Fisheries and Aquatic Resources. 2012. Philippine Fisheries Profile 2011. _______________. No Date. National Tuna Management Plan of the Philippines. 39 p. Bureau of Fisheries and Aquatic Resources and the Fisheries Improved for Sustainable
Harvest Project 2005. Comprehensive National Fishery Industry Development Plan (CNFIDP). Revised Draft, October 2005.
Clarete, R. 2004. Customs Valuation Reform in the Philippines. University of the Philippines-School of Economics.
Department of Agriculture. 2001. The Philippine Agriculture and Fisheries Modernization Plan. December 2001.
Department of Agriculture-Bureau of Fisheries and Aquatic Resources. 2004. In Turbulent Seas: the Status of Philippine Marine Resources. Coastal Resources Management Project of the Department of Environment and Natural Resources, Cebu City, Philippines. 378 p.
Duijn, A. P. V., R. Beukers and W. van der Pijl. 2012. The Philippine Seafood Sector a Value Chain Analysis. Center for the Promotion of Imports from Developing Countries, Ministry of Foreign Affairs of the Netherlands, The Netherlands. 64 p.
Dy, R., and S. Reyes, 2007. The Philippine Coconut Industry: Performance, Issues and Recommendations. Report to the EPRA Project.
Flewwelling, P. and G. Hosch. 2004. Country Review : Philippines. Review of the State of World Marine Capture Fisheries Management : Pacific Ocean. FAO Fisheries Technical Paper No. 488/1.
Food and Agriculture Organization. No Date. Fishery and Aquaculture Country Profile : Philippines.
Intal, P., and L. Ranit, 2004. Literature review of the agricultural distribution services sector: performance, efficiency, and research issues. In: E. Ponce, ed. Special Issues in Agriculture. Philippine Institute for Development Studies and Department of Agriculture – Bureau of Agricultural Research, Makati City.
Lantican, F. A. 2010. Supply Chain Analysis of High-Value Vegetables in the Philippines. Metro Manila Commission Professorial Chair Lecture Delivered in 29 June 2010 at the College of Economics and Management, UP Los Banos, College, Laguna.
Llanto, G. M. 2012. How Critical is Transport and Logistics Infrastructure for Interregional Trade? The Case of High Value Fruits and Vegetables in Mindanao. PIDS Policy Notes No. 2012-22, Philippine Institute for Development Studies, NEDA sa Makati Bldg., Makati, Metro Manila. 8 p.
National Economic and Development Authority. 2011. Philippine Development Plan 2011-2016.
National Fisheries Research and Development Institute and Western and Central Pacific Fisheries Commission. 2012. Philippine Tuna Fisheries Profile. 84 p.
National Statistical Coordination Board. 2011. 2010 Philippine Statistical Yearbook. Pabuayon, I., R. Cabahug, S. Castillo, and M. Mendoza, 2009. Key actors, prices and value
shares in the Philippine coconut market chains: implications for poverty reduction. Journal of ISAAS 15(1): 52 – 62.
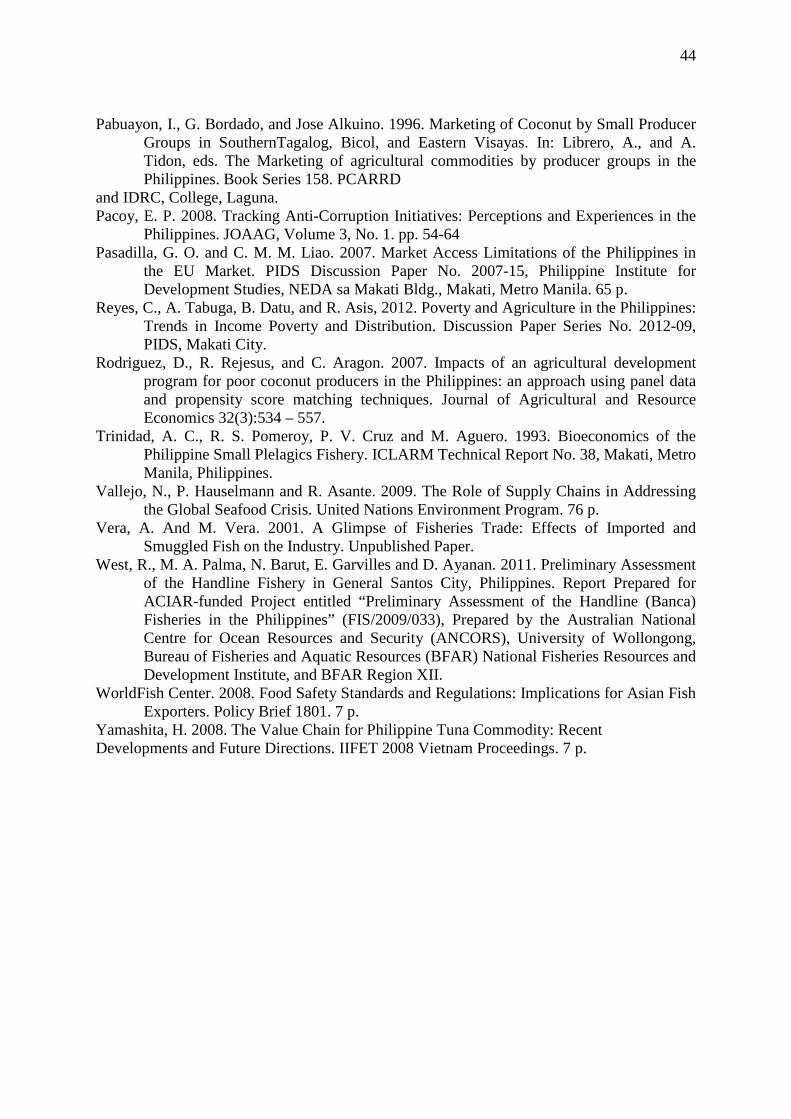
44
Pabuayon, I., G. Bordado, and Jose Alkuino. 1996. Marketing of Coconut by Small Producer Groups in SouthernTagalog, Bicol, and Eastern Visayas. In: Librero, A., and A. Tidon, eds. The Marketing of agricultural commodities by producer groups in the Philippines. Book Series 158. PCARRD
and IDRC, College, Laguna. Pacoy, E. P. 2008. Tracking Anti-Corruption Initiatives: Perceptions and Experiences in the
Philippines. JOAAG, Volume 3, No. 1. pp. 54-64 Pasadilla, G. O. and C. M. M. Liao. 2007. Market Access Limitations of the Philippines in
the EU Market. PIDS Discussion Paper No. 2007-15, Philippine Institute for Development Studies, NEDA sa Makati Bldg., Makati, Metro Manila. 65 p.
Reyes, C., A. Tabuga, B. Datu, and R. Asis, 2012. Poverty and Agriculture in the Philippines: Trends in Income Poverty and Distribution. Discussion Paper Series No. 2012-09, PIDS, Makati City.
Rodriguez, D., R. Rejesus, and C. Aragon. 2007. Impacts of an agricultural development program for poor coconut producers in the Philippines: an approach using panel data and propensity score matching techniques. Journal of Agricultural and Resource Economics 32(3):534 – 557.
Trinidad, A. C., R. S. Pomeroy, P. V. Cruz and M. Aguero. 1993. Bioeconomics of the Philippine Small Plelagics Fishery. ICLARM Technical Report No. 38, Makati, Metro Manila, Philippines.
Vallejo, N., P. Hauselmann and R. Asante. 2009. The Role of Supply Chains in Addressing the Global Seafood Crisis. United Nations Environment Program. 76 p.
Vera, A. And M. Vera. 2001. A Glimpse of Fisheries Trade: Effects of Imported and Smuggled Fish on the Industry. Unpublished Paper.
West, R., M. A. Palma, N. Barut, E. Garvilles and D. Ayanan. 2011. Preliminary Assessment of the Handline Fishery in General Santos City, Philippines. Report Prepared for ACIAR-funded Project entitled “Preliminary Assessment of the Handline (Banca) Fisheries in the Philippines” (FIS/2009/033), Prepared by the Australian National Centre for Ocean Resources and Security (ANCORS), University of Wollongong, Bureau of Fisheries and Aquatic Resources (BFAR) National Fisheries Resources and Development Institute, and BFAR Region XII.
WorldFish Center. 2008. Food Safety Standards and Regulations: Implications for Asian Fish Exporters. Policy Brief 1801. 7 p.
Yamashita, H. 2008. The Value Chain for Philippine Tuna Commodity: Recent Developments and Future Directions. IIFET 2008 Vietnam Proceedings. 7 p.
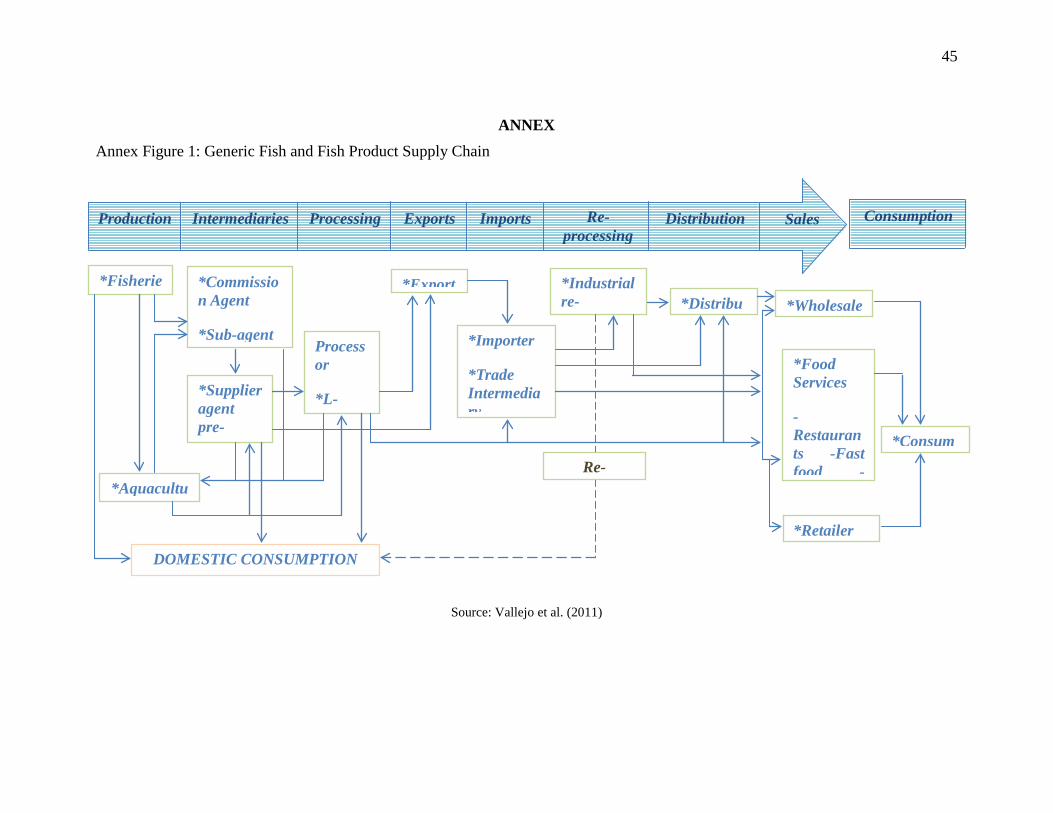
45
ANNEX Annex Figure 1: Generic Fish and Fish Product Supply Chain
Source: Vallejo et al. (2011)
Production Intermediaries Processing Exports Imports Re-processing
Distribution Sales
*Aquacultu
*Commission Agent
*Sub-agent
*Supplier agent pre-
Processor
*L-
*Export
*Importer
*Trade Intermediary
*Industrial re-
Consumption
DOMESTIC CONSUMPTION
*Distribu
*Wholesale
*Food Services
-Restaurants -Fast food -
*Retailer
*Consum
*Fisherie
Re-
Annex Figure 2: Marketing Channels of Milkfish, Pangasinan, Philippines, 2006
Source: Bureau of Agricultural Statistics (2007)
Buyers Outside the
Province
Interregional Assembler- Large Distributor/
Interregional Assembler- Medium Distributor
Consumer
Retailer
Provincial Assembler-
Medium Distributor
Broker/Consignation
Producer
Processor
Institutional Buyers
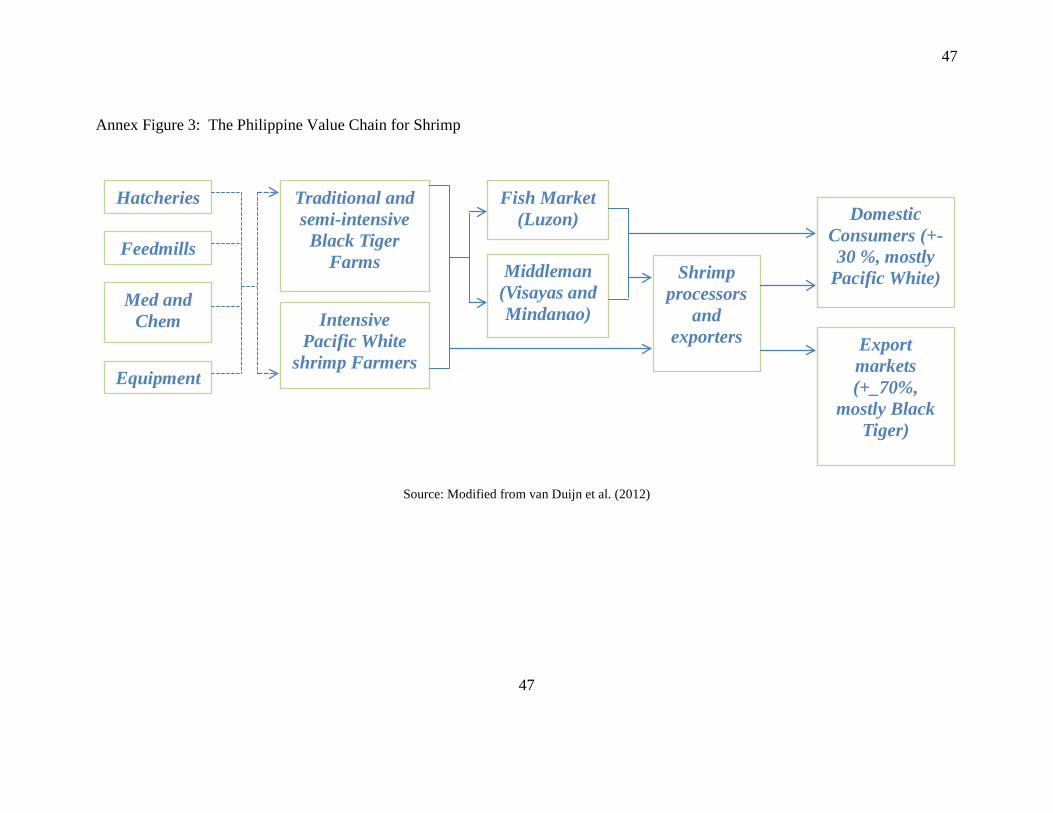
47
47
Annex Figure 3: The Philippine Value Chain for Shrimp
Source: Modified from van Duijn et al. (2012)
Hatcheries
Feedmills
Med and
Chem
Equipment
Traditional and semi-intensive
Black Tiger Farms
Intensive
Pacific White shrimp Farmers
Fish Market (Luzon)
Middleman
(Visayas and Mindanao)
Shrimp processors
and exporters
Domestic Consumers (+-30 %, mostly
Pacific White)
Export markets (+_70%,
mostly Black Tiger)
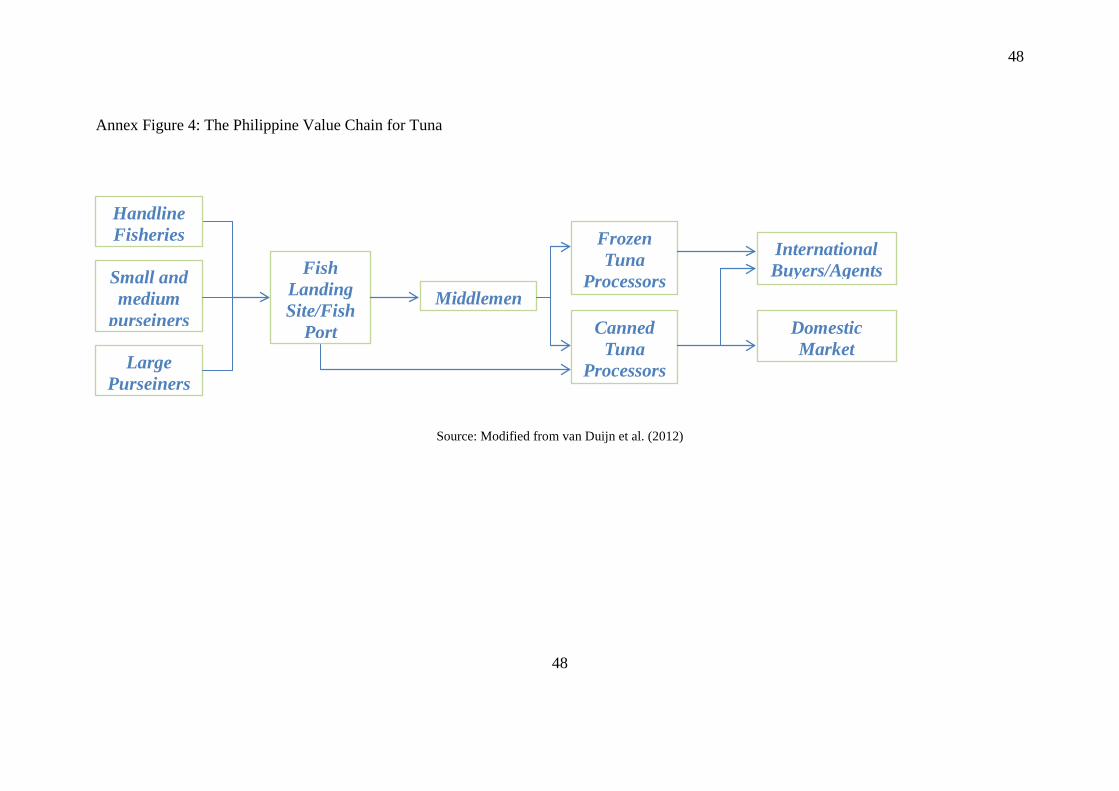
48
48
Annex Figure 4: The Philippine Value Chain for Tuna
Source: Modified from van Duijn et al. (2012)
Handline Fisheries
Small and medium
purseiners
Large Purseiners
Fish Landing Site/Fish
Port
Middlemen
Frozen Tuna
Processors
Canned Tuna
Processors
International Buyers/Agents
Domestic Market
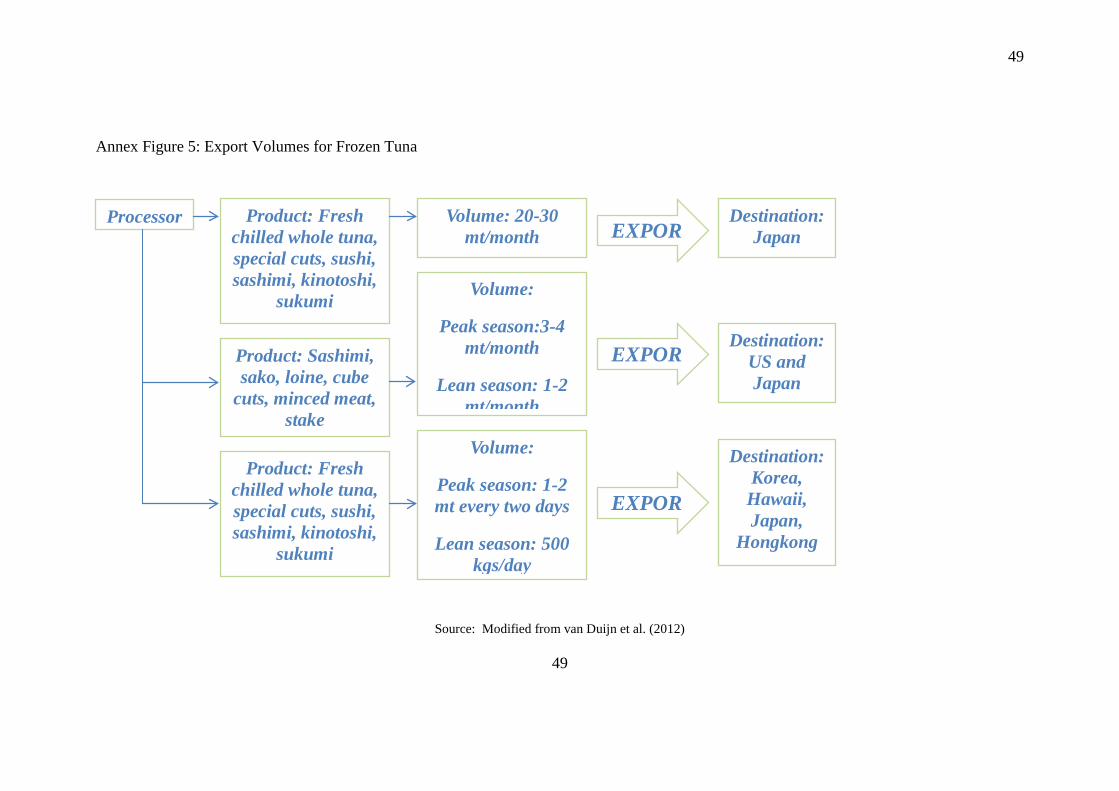
49
49
Annex Figure 5: Export Volumes for Frozen Tuna
Source: Modified from van Duijn et al. (2012)
Processor
Product: Fresh chilled whole tuna, special cuts, sushi, sashimi, kinotoshi,
sukumi
Product: Sashimi, sako, loine, cube
cuts, minced meat, stake
Product: Fresh
chilled whole tuna, special cuts, sushi, sashimi, kinotoshi,
sukumi
Volume: 20-30 mt/month
Volume:
Peak season:3-4 mt/month
Lean season: 1-2 mt/month
Volume:
Peak season: 1-2 mt every two days
Lean season: 500 kgs/day
EXPOR
EXPOR
EXPOR
Destination: Japan
Destination: US and Japan
Destination: Korea, Hawaii, Japan,
Hongkong