Embed Size (px)
Citation preview
Best Clinical and Administrative Practices for Medicaid
toolkit
Enhancing Child Development
Services in Medicaid Managed Care
Center for Health Care Strategies, Inc.
CHCS
About the Center for Health Care StrategiesThe Center for Health Care Strategies promotes high quality health care ser-vices for low-income populations and people with chronic illnesses and disabili-ties. We achieve this objective by providing training, technical assistance, andgrant making to state purchasers of publicly financed health care, health plans,and consumer groups. The Center’s program priorities are: improving quality,reducing racial and ethnic disparities, and increasing community options forpeople with disabilities.
For additional copiesAdditional copies can be downloaded or ordered online at www.chcs.orgor by calling 609.895.8101.
Center for Health Care Strategies, Inc.CHCS
AuthorPurvi Kobawala Smith, MS, MPHCenter for Health Care Strategies
Contributor Edward Schor, MDThe Commonwealth Fund
Contributing EditorLorie MartinCenter for Health Care Strategies
ReviewersMelinda Abrams, MSThe Commonwealth Fund
Patricia Barta, MPHJane Deane Clark, PhDStephen A. Somers, PhDCenter for Health Care Strategies
Margaret L. Oehlmann, MSAssociation for Community Affiliated Plans
DesignNancy BiddleBiddle Design
Copyright ©2005 Center for Health Care Strategies
Enhancing ChildDevelopment Servicesin Medicaid ManagedCareA Best Clinical and Administrative PracticesSM
Toolkit for Medicaid
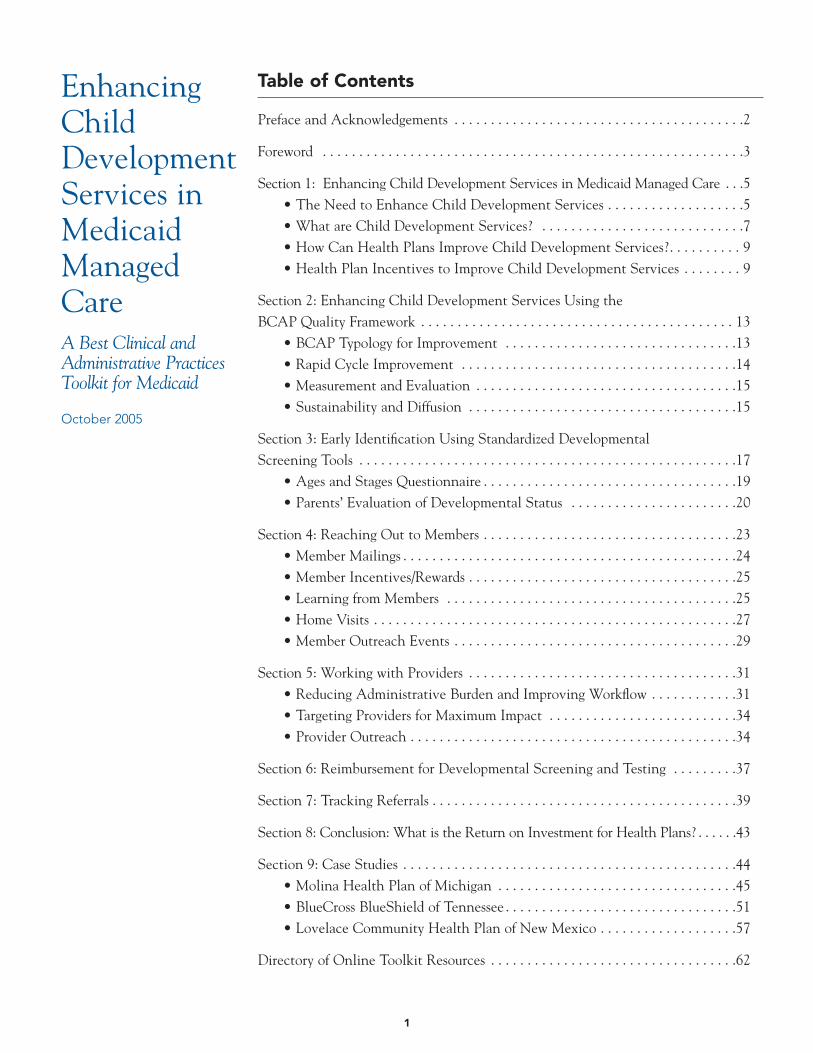
Table of Contents
Preface and Acknowledgements . . . . . . . . . . . . . . . . . . . . . . . . . . . . . . . . . . . . . . . .2
Foreword . . . . . . . . . . . . . . . . . . . . . . . . . . . . . . . . . . . . . . . . . . . . . . . . . . . . . . . . . .3
Section 1: Enhancing Child Development Services in Medicaid Managed Care . . .5• The Need to Enhance Child Development Services . . . . . . . . . . . . . . . . . . .5• What are Child Development Services? . . . . . . . . . . . . . . . . . . . . . . . . . . . .7• How Can Health Plans Improve Child Development Services? . . . . . . . . . . 9• Health Plan Incentives to Improve Child Development Services . . . . . . . . 9
Section 2: Enhancing Child Development Services Using the BCAP Quality Framework . . . . . . . . . . . . . . . . . . . . . . . . . . . . . . . . . . . . . . . . . . . 13
• BCAP Typology for Improvement . . . . . . . . . . . . . . . . . . . . . . . . . . . . . . . .13• Rapid Cycle Improvement . . . . . . . . . . . . . . . . . . . . . . . . . . . . . . . . . . . . . .14• Measurement and Evaluation . . . . . . . . . . . . . . . . . . . . . . . . . . . . . . . . . . . .15• Sustainability and Diffusion . . . . . . . . . . . . . . . . . . . . . . . . . . . . . . . . . . . . .15
Section 3: Early Identification Using Standardized Developmental Screening Tools . . . . . . . . . . . . . . . . . . . . . . . . . . . . . . . . . . . . . . . . . . . . . . . . . . . .17
• Ages and Stages Questionnaire . . . . . . . . . . . . . . . . . . . . . . . . . . . . . . . . . . .19• Parents’ Evaluation of Developmental Status . . . . . . . . . . . . . . . . . . . . . . .20
Section 4: Reaching Out to Members . . . . . . . . . . . . . . . . . . . . . . . . . . . . . . . . . . .23• Member Mailings . . . . . . . . . . . . . . . . . . . . . . . . . . . . . . . . . . . . . . . . . . . . . .24• Member Incentives/Rewards . . . . . . . . . . . . . . . . . . . . . . . . . . . . . . . . . . . . .25• Learning from Members . . . . . . . . . . . . . . . . . . . . . . . . . . . . . . . . . . . . . . . .25• Home Visits . . . . . . . . . . . . . . . . . . . . . . . . . . . . . . . . . . . . . . . . . . . . . . . . . .27• Member Outreach Events . . . . . . . . . . . . . . . . . . . . . . . . . . . . . . . . . . . . . . .29
Section 5: Working with Providers . . . . . . . . . . . . . . . . . . . . . . . . . . . . . . . . . . . . .31• Reducing Administrative Burden and Improving Workflow . . . . . . . . . . . .31• Targeting Providers for Maximum Impact . . . . . . . . . . . . . . . . . . . . . . . . . .34• Provider Outreach . . . . . . . . . . . . . . . . . . . . . . . . . . . . . . . . . . . . . . . . . . . . .34
Section 6: Reimbursement for Developmental Screening and Testing . . . . . . . . .37
Section 7: Tracking Referrals . . . . . . . . . . . . . . . . . . . . . . . . . . . . . . . . . . . . . . . . . .39
Section 8: Conclusion: What is the Return on Investment for Health Plans? . . . . . .43
Section 9: Case Studies . . . . . . . . . . . . . . . . . . . . . . . . . . . . . . . . . . . . . . . . . . . . . .44• Molina Health Plan of Michigan . . . . . . . . . . . . . . . . . . . . . . . . . . . . . . . . .45• BlueCross BlueShield of Tennessee . . . . . . . . . . . . . . . . . . . . . . . . . . . . . . . .51• Lovelace Community Health Plan of New Mexico . . . . . . . . . . . . . . . . . . .57
Directory of Online Toolkit Resources . . . . . . . . . . . . . . . . . . . . . . . . . . . . . . . . . .62
1
EnhancingChildDevelopmentServices inMedicaidManagedCareA Best Clinical andAdministrative PracticesToolkit for Medicaid
October 2005
Preface and Acknowledgements
The Center for Health Care Strategies (CHCS) thanks the many people who sup-ported the production of this toolkit. We recognize Peggy Oehlmann, formerly ofCHCS, for leading the development and early implementation of the BCAPWorkgroup on Enhancing Child Development Services in Medicaid Managed Care. Wethank Beth Smith, MD, of Dartmouth-Hitchcock Concord; Susanne Salem-Schatz,ScD, of HealthCare Quality Initiatives; and Jane Deane Clark, PhD, of CHCS, forhelping plans embrace the importance of measurement. We acknowledge ChristinaTrank of CHCS for her careful review of this toolkit and are grateful to RosaNovatkowski of CHCS, who provided administrative support. We thank MelindaAbrams and Edward Schor, MD, of The Commonwealth Fund and Stephen Somers,PhD, President of CHCS, for their motivation and for continually underscoring theimportance of the work and the opportunities that lie ahead.
We also recognize the highly committed members of the Enhancing ChildDevelopment Services in Medicaid Managed Care workgroup who drove systems-levelimprovements for Medicaid beneficiaries.
2
How this Toolkit is Organized
This toolkit chronicles the experiences of the 11 Medicaid managed care organizations in piloting activitiesto improve early childhood screening and anticipatory guidance, with an emphasis on preventive pediatriccare. The toolkit reviews the BCAP Quality Framework and highlights strategies used to improve the deliveryof child development services, including early identification of developmental disabilities, improving out-reach to members, enhancing provider partnerships, improving reimbursement and referral practices, andrecognizing potential returns on investment. Case studies illustrate how plans applied the BCAP QualityFramework to improve child development services in Medicaid managed care. It is our hope that healthplans, states, and other stakeholders committed to improving the quality of children’s health care can gleanideas from this toolkit on how to systematically enhance the effectiveness of child development services.
3
1 J. Wirt, S. Choy, S. Provasnik, P. Rooney, A. Sen and R. Tobin, “The Condition of Education 2003,” (Washington, DC: US Government Printing Office, 2003).
2 J.P. Shonkoff and D.A. Phillips, eds., “From Neurons to Neighborhoods: The Science of Early Childhood Development,” (Washington, D.C.: National Academy Press, 2000).
3 N. Halfon, M. Regalado, J. Sareen, M. Inkelas, et al., “Assessing Development in the Pediatric Office.” Pediatrics 113, no. 6 (2004):1926-1933 4 American Academy of Pediatrics, “Periodic Survey of Fellows 46,” (Elk Grove Village, IL: American Academy of Pediatrics; 2001).
Every year, tens of thousands of young children enter school unprepared to succeed.Many in this group are low-income children covered by publicly-financed health careprograms like Medicaid and the State Children’s Health Insurance Program. Manyhave had minimal exposure to preventive services and high exposure to detrimentalsocial and emotional environments, due to family circumstances like poverty, low lev-els of education, lack of social support, or due to their own health problems. The earlylife experiences of these children often leave them behind their peers in terms of cog-nitive, social, physical, and emotional development. Research shows that many ofthese children will persistently lag behind their peers throughout their school years.1
Providing these children with good quality early intervention programs and clinicalservices can prevent or ameliorate some of these problems and place “at risk” childrenon a more positive and successful developmental trajectory. It is critical to reach thesechildren as early as possible to change their life course. Neurobiological, behavioral,and social science research has shown the importance of early life experiences onearly brain development and on subsequent development and behavior.2
Unfortunately, in spite of their eligibility for Medicaid and its Early PeriodicScreening, Diagnosis, and Testing (EPSDT) program, many of these at-risk childrenare not identified as having developmental problems prior to school entry, though sys-tematic observation and assessment can identify most problems before age three.
Nearly all children age three and under participate in some level of well-child care,making it an ideal setting for monitoring development. As such, pediatric health carepractitioners are in a unique position to identify children with developmental prob-lems and those at risk for developmental problems, evaluate developmental status,and initiate appropriate interventions and referrals. For children covered by stateMedicaid programs—both in managed care approaches and in the fee-for-service sys-tem—preventive care is required to include developmental screening as a core com-ponent of EPSDT services. Currently, however, the practice of developmental screen-ing and the promotion of optimal development in primary pediatric care practice varytremendously. Many children (i.e., more than 40 percent) do not receive structureddevelopmental assessments from their health care providers.3
There are many—often complex—reasons why child health care professionals fail toscreen and identify young children who could benefit from early intervention services.These barriers are not unique to developmental screening, but affect most compo-nents of preventive pediatric care, including providing anticipatory guidance to par-ents. Children’s and families’ needs are not being met due to time constraints, lowlevels of reimbursement for preventive pediatric care, lack of reimbursement for spe-cific developmental services, lack of training in child development, lack of trainednon-physician staff members, limited access to community services to support familiesand children, and few external incentives for providers to do better.4
F O R E W O R D :G I V I N G C H I L D R E N T H E R I G H T S T A R T
4
Despite these barriers, there is a growing body of experience to show that the fre-quency and quality of developmental screening, as well as other aspects of preven-tive care, can be substantially improved. The Healthy Steps for Young Childrenproject demonstrated that families that receive a structured menu of developmentalservices from primary health care practices were more likely to remain with thepractice. These families were also more likely to receive developmental screens, dis-cuss a variety of developmental issues, receive timely well-child visits and immu-nizations, and be more satisfied with care.5 In North Carolina, Medicaid, in part-nership with physicians and community coordinating councils and funded by TheCommonwealth Fund, developed a structured approach to systematic developmen-tal screening in the pediatric sites of Guildford Child Health.6 Following this ini-tiative, screening rates of young children increased from 15 percent to 66 percentand referrals for early intervention tripled. Managed care organizations (MCOs)that participated in the recent BCAP workgroup of the Center for Health CareStrategies, Enhancing Child Development Services in Medicaid Managed Care, alsofound that they could increase screening rates by educating members and workingwith provider practices to facilitate screening and linkages to appropriate develop-mental services.
Managed care plans, particularly those serving significant numbers of at-risk chil-dren covered under Medicaid, are positioned to work with members and providersto improve early developmental screening. MCOs can take steps to educate andmotivate child health care providers to provide appropriate developmental servicesand refer children suspected of having developmental problems (or those at risk) toappropriate community-based intervention and support services. MCOs can alsotake steps to engage and activate parents and caregivers about the health and devel-opment of their children. Operationally, improving developmental screeningrequires all staff of pediatric practices, and not just physicians, to adopt a screeningprotocol that includes the use of a standardized, parent-completed instrument.Community referrals are facilitated when physicians and office staff are personallyfamiliar with developmental service providers and have established collaborativerelationships with them. Better quality developmental services are more likely tooccur when payers have clear standards for screening, specify a schedule for preven-tive services, and provide adequate reimbursement.
Improving the quality of developmental services may require identifying new oradditional resources, but the amount required is modest. This BCAP Toolkit pro-vides strategies for managed care organizations to systematically improve earlydevelopmental services through partnerships with parents, providers, communityorganizations, and state agencies.
Edward L. Schor, MDVice PresidentThe Commonwealth Fund
5 C.S. Minkovitz, N. Hughart, D. Strobino, D. Scharfstein, et al., “A Practice-Based Intervention to Enhance Quality of Care in the First 3 Years of Life.” Journal of the American Medical Association 290 (2003):3081-3091.
6 H. Pelletier and M. Abrams, “ABCD: Lessons from a Four-State Consortium,” December 2003, www.nashp.org/Files/CW9_ABCD_Lessons_Learned.pdf.
With Medicaid and SCHIP enrollment of children in managed care on the rise,7,8
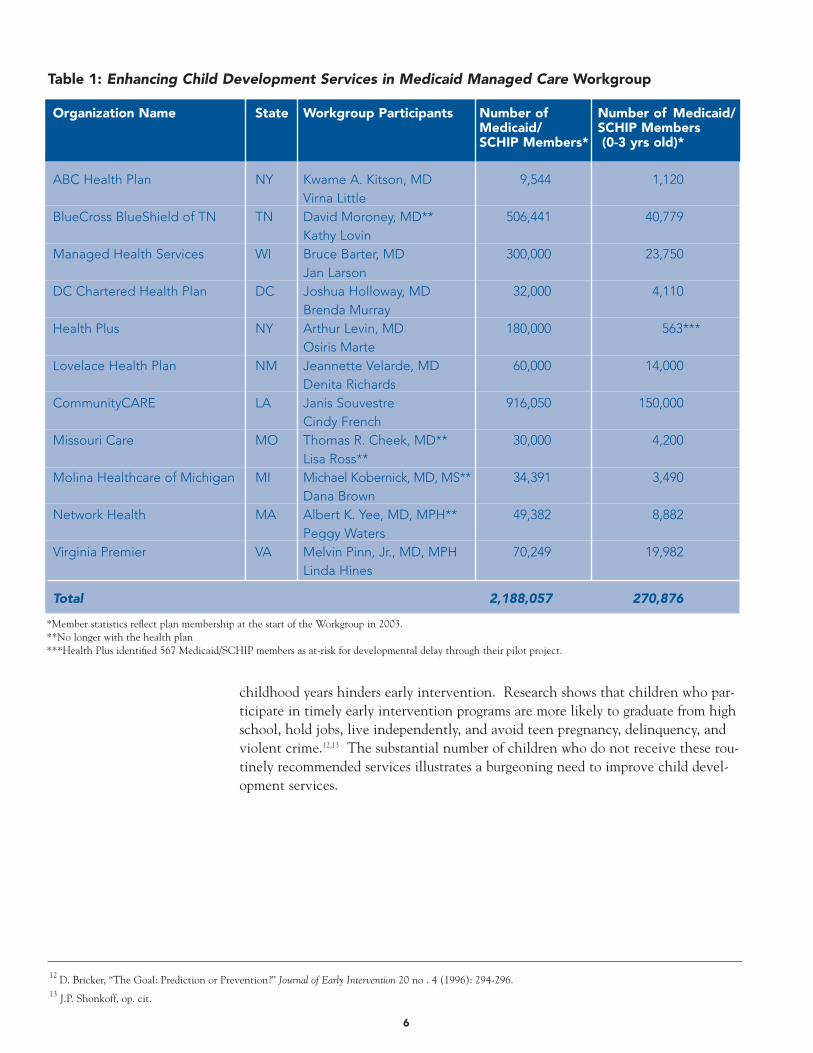
Medicaid managed care organizations face a greater challenge to ensure delivery ofconsistent and high quality child development services. The Commonwealth Fundasked the Center for Health Care Strategies (CHCS) to create a Best Clinical andAdministrative Practices (BCAP) initiative to develop, document, and spread bestpractices among health plans. This toolkit reflects the experiences of the BCAPWorkgroup on Enhancing Child Development Services in Medicaid Managed Care.This workgroup (Table 1) of 10 health plans and one state primary care case man-agement program collaborated to develop, pilot, and refine best practices aroundenhancing child development services.
These 11 workgroup teams devoted time and resources to an area that does notnecessarily offer an immediate return on investment. We value their commitmentto improving care for populations in need and their resourcefulness in identifyinghow to leverage opportunities to enhance child development services within theirorganizations.
The Need to Enhance Child Development Services Assessing young children’s development at specified intervals makes it possible toidentify and treat developmental disabilities at the earliest stage and to help chil-dren lead active and healthy lives.9 However, while approximately 15 to 18 percentof children have disabilities such as speech-language impairments, mental retarda-tion, learning disabilities, and emotional/behavioral disturbances, fewer than 30percent of these children are identified with these problems prior to schoolentrance. Though guidelines endorse routine developmental assessments for youngchildren, parents of many children do not report receiving these assessments.10,11
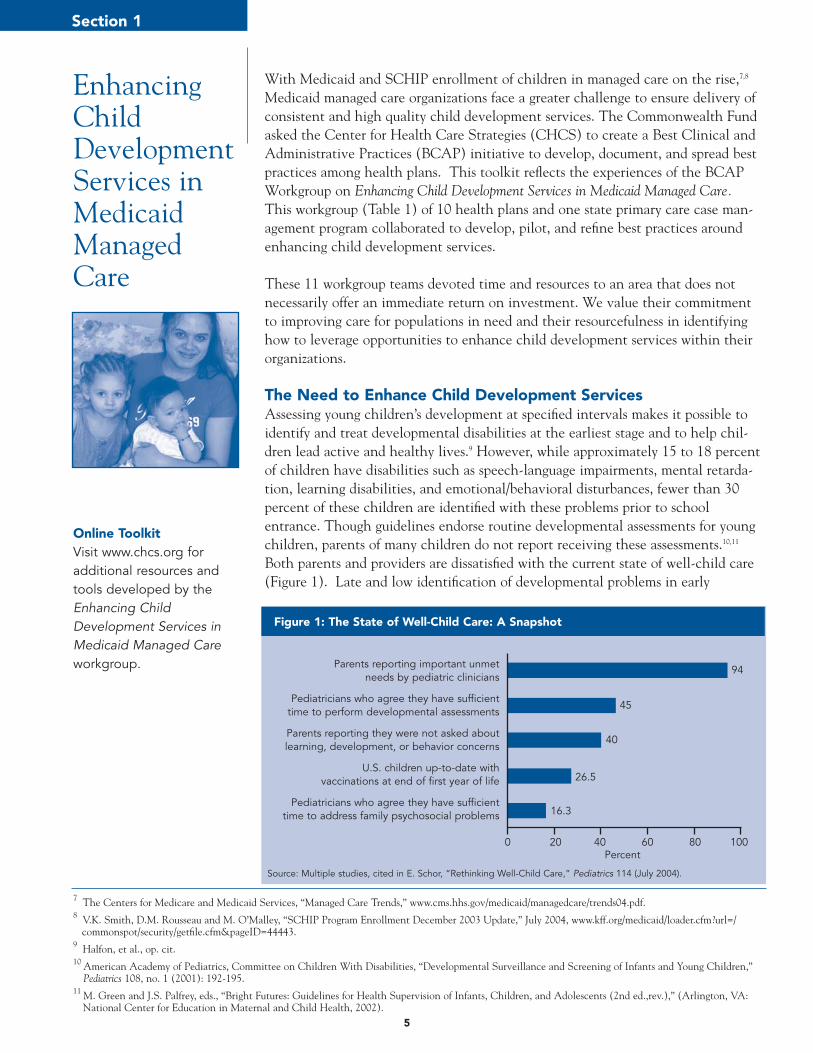
Both parents and providers are dissatisfied with the current state of well-child care(Figure 1). Late and low identification of developmental problems in early
5
EnhancingChildDevelopmentServices inMedicaidManagedCare
Section 1
Online ToolkitVisit www.chcs.org foradditional resources andtools developed by theEnhancing ChildDevelopment Services inMedicaid Managed Careworkgroup.
7 The Centers for Medicare and Medicaid Services, “Managed Care Trends,” www.cms.hhs.gov/medicaid/managedcare/trends04.pdf.8 V.K. Smith, D.M. Rousseau and M. O’Malley, “SCHIP Program Enrollment December 2003 Update,” July 2004, www.kff.org/medicaid/loader.cfm?url=/
commonspot/security/getfile.cfm&pageID=44443.9 Halfon, et al., op. cit.10 American Academy of Pediatrics, Committee on Children With Disabilities, “Developmental Surveillance and Screening of Infants and Young Children,”
Pediatrics 108, no. 1 (2001): 192-195.11 M. Green and J.S. Palfrey, eds., “Bright Futures: Guidelines for Health Supervision of Infants, Children, and Adolescents (2nd ed.,rev.),” (Arlington, VA:
National Center for Education in Maternal and Child Health, 2002).
Figure 1: The State of Well-Child Care: A Snapshot
Parents reporting important unmet needs by pediatric clinicians
Pediatricians who agree they have sufficienttime to perform developmental assessments
Parents reporting they were not asked aboutlearning, development, or behavior concerns
U.S. children up-to-date with vaccinations at end of first year of life
Pediatricians who agree they have sufficienttime to address family psychosocial problems
94
45
40
26.5
16.3
0 20 40 60 80 100Percent
Source: Multiple studies, cited in E. Schor, “Rethinking Well-Child Care,” Pediatrics 114 (July 2004).
childhood years hinders early intervention. Research shows that children who par-ticipate in timely early intervention programs are more likely to graduate from highschool, hold jobs, live independently, and avoid teen pregnancy, delinquency, andviolent crime.12,13 The substantial number of children who do not receive these rou-tinely recommended services illustrates a burgeoning need to improve child devel-opment services.
12 D. Bricker, “The Goal: Prediction or Prevention?” Journal of Early Intervention 20 no . 4 (1996): 294-296.13 J.P. Shonkoff, op. cit.
6
Organization Name State Workgroup Participants Number of Number of Medicaid/Medicaid/ SCHIP MembersSCHIP Members* (0-3 yrs old)*
ABC Health Plan NY Kwame A. Kitson, MD 9,544 1,120Virna Little
BlueCross BlueShield of TN TN David Moroney, MD** 506,441 40,779Kathy Lovin
Managed Health Services WI Bruce Barter, MD 300,000 23,750Jan Larson
DC Chartered Health Plan DC Joshua Holloway, MD 32,000 4,110Brenda Murray
Health Plus NY Arthur Levin, MD 180,000 563***Osiris Marte
Lovelace Health Plan NM Jeannette Velarde, MD 60,000 14,000Denita Richards
CommunityCARE LA Janis Souvestre 916,050 150,000Cindy French
Missouri Care MO Thomas R. Cheek, MD** 30,000 4,200Lisa Ross**
Molina Healthcare of Michigan MI Michael Kobernick, MD, MS** 34,391 3,490Dana Brown
Network Health MA Albert K. Yee, MD, MPH** 49,382 8,882Peggy Waters
Virginia Premier VA Melvin Pinn, Jr., MD, MPH 70,249 19,982Linda Hines
Total 2,188,057 270,876
Table 1: Enhancing Child Development Services in Medicaid Managed Care Workgroup
*Member statistics reflect plan membership at the start of the Workgroup in 2003.**No longer with the health plan***Health Plus identified 567 Medicaid/SCHIP members as at-risk for developmental delay through their pilot project.
7
14 M. Regalado and N. Halfon, “Primary Care Services Promoting Optimal Child Developmental from Birth to Age 3 Years,” Archives of Pediatric and Adolescent Medicine 155 (2001): 1311-1322.
15 K. VanLandeghem, D. Curtis and M. Abrams, “Reasons and Strategies for Strengthening Childhood Development Services in the Healthcare System,” The Commonwealth Fund, October 2002.
16 N. Halfon, M. Inkelas, M. Abrams and G. Stevens, “Quality of Preventive Health Care for Young Children: Strategies for Improvement,” The Commonwealth Fund, May 2005.
17 P.H. Dworkin, “Detection of Behavioral, Developmental, and Psychosocial Problems in Pediatric Primary Care Practice,” Current Opinion in Pediatrics 5 (1993): 531-536.
18 For more information, see the Early Identification Using Standardized Developmental Screening Tools section on page 17.
What are Child Development Services?Child development services are an integral component of well-child care and aredesigned to promote children’s healthy development. Broadly, child developmentservices fall into four categories described below.14,15,16 The BCAP Workgroup onEnhancing Child Development Services in Medicaid Managed Care focused primarily onthe first two categories.
Developmental Screening, Surveillance and AssessmentScreening and surveillance is the collective effort by parents and providers to ensurethat children with potential developmental delays are identified and referred, if nec-essary, to appropriate health care services. Surveillance is a “flexible, continuousprocess, in which knowledgeable professionals perform skilled observations of chil-dren during child health care. The components of developmental surveillanceinclude eliciting and attending to parental concerns, obtaining a relevant develop-mental history, making accurate and informative observations of children, and shar-ing opinions and concerns with other relevant professionals.”17 This ongoing processcan be facilitated by the use of standardized screening tools,18 which can helpproviders and parents assess child development and behavior. The AmericanAssociation of Pediatrics (AAP) Committee on Children with Disabilities, alongwith many leading organizations, recommends the use of standardized screening toolsat well-visits.
Developmentally-Based Health Promotion and EducationHealth promotion and parent education, including anticipatory guidance, informsparents on child development and ways of promoting their child’s learning andgrowth. Developmental topics addressed include areas such as sleeping patterns,encouraging learning, discipline, toilet training, and injury prevention. Age-specificinformation is typically given to parents by providers at well-child visits, but also canbe provided creatively by health plan member education coordinators, through day-care facilities, social services agencies, public service campaigns, etc.
Developmental InterventionsEarly interventions for developmental problems are usually carried out by profession-al educators, but often involve other health professionals such as speech and lan-guage therapists and occupational therapists. Early intervention services for childrenand families commonly occur outside of the traditional health care system, oftenthrough educational or social service contacts.
Care CoordinationCare coordination is required for a comprehensive and child-centered approach to earlychild development services. There are often multiple entities involved in the care of achild in need of developmental intervention and early intervention and other servicesmust be coordinated.
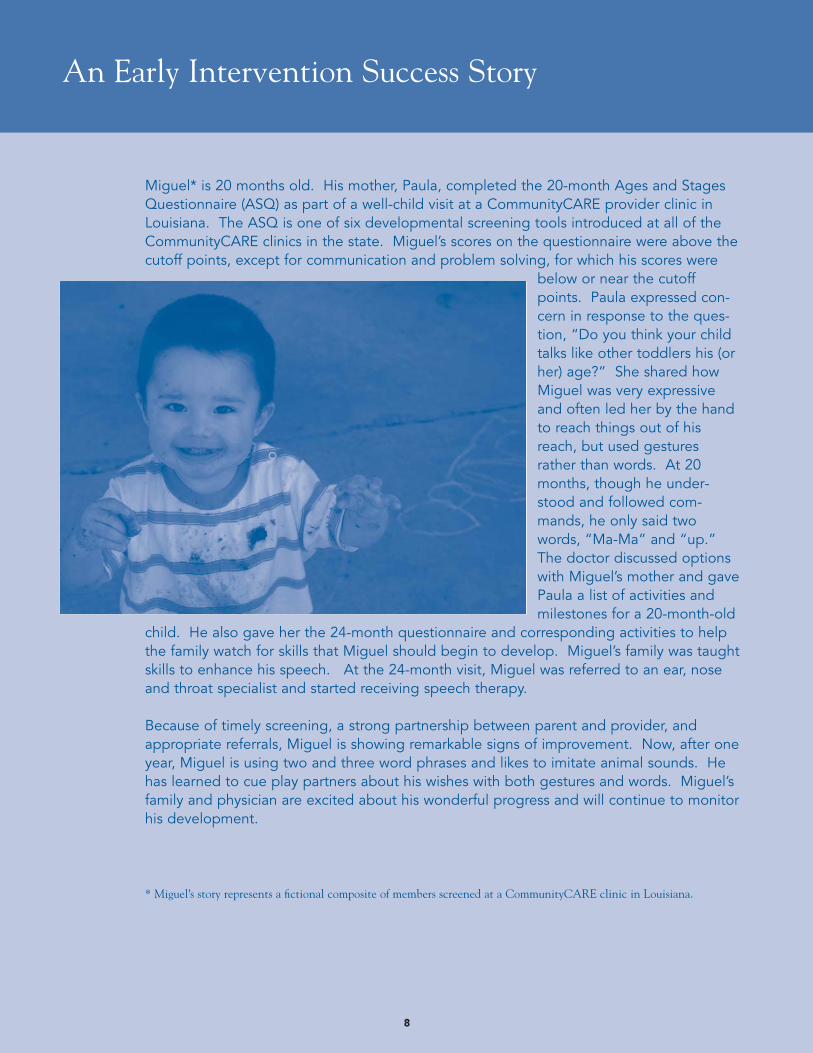
Miguel* is 20 months old. His mother, Paula, completed the 20-month Ages and StagesQuestionnaire (ASQ) as part of a well-child visit at a CommunityCARE provider clinic inLouisiana. The ASQ is one of six developmental screening tools introduced at all of theCommunityCARE clinics in the state. Miguel’s scores on the questionnaire were above thecutoff points, except for communication and problem solving, for which his scores were
below or near the cutoffpoints. Paula expressed con-cern in response to the ques-tion, “Do you think your childtalks like other toddlers his (orher) age?” She shared howMiguel was very expressiveand often led her by the handto reach things out of hisreach, but used gesturesrather than words. At 20months, though he under-stood and followed com-mands, he only said twowords, “Ma-Ma” and “up.”The doctor discussed optionswith Miguel’s mother and gavePaula a list of activities andmilestones for a 20-month-old
child. He also gave her the 24-month questionnaire and corresponding activities to helpthe family watch for skills that Miguel should begin to develop. Miguel’s family was taughtskills to enhance his speech. At the 24-month visit, Miguel was referred to an ear, noseand throat specialist and started receiving speech therapy.
Because of timely screening, a strong partnership between parent and provider, andappropriate referrals, Miguel is showing remarkable signs of improvement. Now, after oneyear, Miguel is using two and three word phrases and likes to imitate animal sounds. Hehas learned to cue play partners about his wishes with both gestures and words. Miguel’sfamily and physician are excited about his wonderful progress and will continue to monitorhis development.
* Miguel’s story represents a fictional composite of members screened at a CommunityCARE clinic in Louisiana.
An Early Intervention Success Story
8
9
How Can Health Plans Improve Child Development Services? Medicaid managed care organizations can play a crucial role in improving the qualityof child development services by building partnerships with providers, families, publicagencies, and policy makers working to improve child health.
Examples of how plans can improve early child development services include:
• Educating providers about the benefits of using standardized screening tools.• Educating parents about developmental milestones and what to expect when their
child is due for a developmental screening.• Standardizing practices across a provider network (e.g., provider profiling to identi-
fy children due for screening, member education at the provider site, provider edu-cation on available screening tools).
• Motivating providers to apply best administrative and clinical practices throughincentives or creative reimbursement.
• Partnering with local agencies to facilitate referral and linkages between medicaland community providers for their members.
• Using data to help providers identify children at risk for developmental delay.
Plans participating in the BCAP Workgroup on Enhancing Child Development Servicesin Medicaid Managed Care tested creative variations of these approaches. Several com-mon factors essential for success emerged:
• Using a structured approach to design quality improvement interventions withclear measures to monitor outcomes and test strategies;
• Improving multi-stakeholder collaboration (purchaser, plan, provider, and mem-ber);
• Providing sufficient time and backing to sustain successful rapid cycle improve-ment; and
• Ensuring committed leadership.
Health Plan Incentives to Improve Child Development ServicesCapitated managed care, because of the inherent incentives in pre-payment for pri-mary and preventive care, offers a unique leverage point to drive effective delivery ofchild development services. Because so many children “churn” in and out ofMedicaid coverage, some of the benefits for identifying chronic problems early mayaccrue to other payors and health plans. Health plans committed to this line of busi-ness, however, realize that children are likely to “churn back” into their membership,so it behooves all payors and plans to invest in preventive services. Furthermore,plans that promote quality improvement in child development services can reapother rewards, including greater member and provider satisfaction, enhanced reputa-tion in their communities, and recognition from their state Medicaid agency.
10
In addition to heeding the growing evidence of the need for early detection of devel-opmental problems, plans joining the BCAP Workgroup on Enhancing ChildDevelopment Services in Medicaid Managed Care reported a variety of reasons for partic-ipating:
1. Raise Performance Ratings: Plans that report to the National Committee forQuality Assurance (NCQA) create performance report cards that are used byMedicaid agencies when making contracting choices and by members when mak-ing enrollment choices. Improving best practices around child development ser-vices improves plan ratings for quality of care and also improves member satisfac-tion.
2. Build Collaboration: Plans saw the workgroup as a vehicle to collaborate withstate agencies and enhance relationships with providers. For example, BlueCrossBlueShield of Tennessee presented the results of the pilot project to the TennCareBureau and the Tennessee Chapter of the American Academy of Pediatrics, whichcontributed to a statewide revision of guidelines on early childhood screening.
3. Reach At-Risk Populations: Focusing on improving child development servicesprovides an opportunity to connect with hard-to-reach populations. LovelaceHealth Plan of New Mexico partnered with the state correctional system to reachchildren of parents in prison; ABC Health Plan of New York partnered with theUrban Institute for Family Health to reach families in low-income neighborhoods;and Network Health of Massachusetts used the Visiting Nurse Association to reachfamilies in their homes.
4. Avoid Disincentives: Some states deploy a disincentive or penalty for poor perfor-mance. DC Chartered Health Plan, for example, sought to improve both the time-liness and the quality of well-child visits at their provider sites to avoid fines forchildren who did not receive timely well-child visits.
And finally, the overriding motive for the plans that joined the BCAP workgroup toenhance child development services was to meet the needs of the children and fami-lies they serve more effectively. The high interest level and outcomes of this work-group indicate that health plans can serve as unique and important leverage points todrive improvement of child development services.
19 More information on the Assuring Better Child Health and Development initiative can be found at www.nashp.org.20 Pelletier, op. cit.21 The Commonwealth Fund, “North Carolina is Assuring Better Health and Development,” September 2005,
http://www.cmwf.org/publications/publications_show.htm?doc_id=294570#north (27 September 2005).
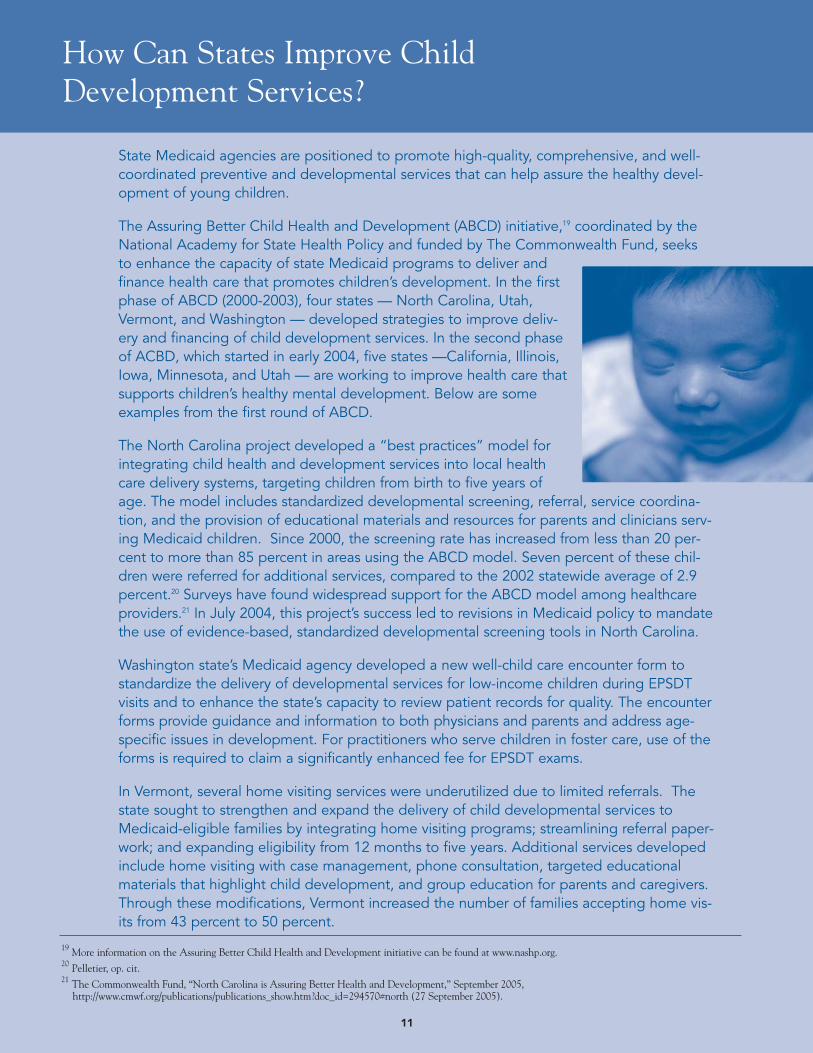
State Medicaid agencies are positioned to promote high-quality, comprehensive, and well-coordinated preventive and developmental services that can help assure the healthy devel-opment of young children.
The Assuring Better Child Health and Development (ABCD) initiative,19 coordinated by theNational Academy for State Health Policy and funded by The Commonwealth Fund, seeksto enhance the capacity of state Medicaid programs to deliver andfinance health care that promotes children’s development. In the firstphase of ABCD (2000-2003), four states — North Carolina, Utah,Vermont, and Washington — developed strategies to improve deliv-ery and financing of child development services. In the second phaseof ACBD, which started in early 2004, five states —California, Illinois,Iowa, Minnesota, and Utah — are working to improve health care thatsupports children’s healthy mental development. Below are someexamples from the first round of ABCD.
The North Carolina project developed a “best practices” model forintegrating child health and development services into local healthcare delivery systems, targeting children from birth to five years ofage. The model includes standardized developmental screening, referral, service coordina-tion, and the provision of educational materials and resources for parents and clinicians serv-ing Medicaid children. Since 2000, the screening rate has increased from less than 20 per-cent to more than 85 percent in areas using the ABCD model. Seven percent of these chil-dren were referred for additional services, compared to the 2002 statewide average of 2.9percent.20 Surveys have found widespread support for the ABCD model among healthcareproviders.21 In July 2004, this project’s success led to revisions in Medicaid policy to mandatethe use of evidence-based, standardized developmental screening tools in North Carolina.
Washington state’s Medicaid agency developed a new well-child care encounter form tostandardize the delivery of developmental services for low-income children during EPSDTvisits and to enhance the state’s capacity to review patient records for quality. The encounterforms provide guidance and information to both physicians and parents and address age-specific issues in development. For practitioners who serve children in foster care, use of theforms is required to claim a significantly enhanced fee for EPSDT exams.
In Vermont, several home visiting services were underutilized due to limited referrals. Thestate sought to strengthen and expand the delivery of child developmental services toMedicaid-eligible families by integrating home visiting programs; streamlining referral paper-work; and expanding eligibility from 12 months to five years. Additional services developedinclude home visiting with case management, phone consultation, targeted educationalmaterials that highlight child development, and group education for parents and caregivers.Through these modifications, Vermont increased the number of families accepting home vis-its from 43 percent to 50 percent.
How Can States Improve Child Development Services?
11

13
EnhancingChildDevelopmentServices Usingthe BCAPQualityFramework
Since 2000, more than 130 Medicaid managed care organizations, including healthplans and PCCMs, representing nearly 14 million Medicaid beneficiaries in 37states, have participated in CHCS’ Best Clinical and Administrative Practices(BCAP) initiatives. These organizations work to improve health care services formillions of Medicaid beneficiaries by developing quality improvement projects usingthe BCAP Quality Framework.
Elements of the BCAP Quality Framework are adapted from learning models devel-oped by the Institute for Healthcare Improvement (IHI) and others focusing onchronic disease such as the Improving Chronic Illness Care (ICIC) program at theMcColl Institute for Healthcare Innovation. The BCAP Quality Frameworkincludes four components:
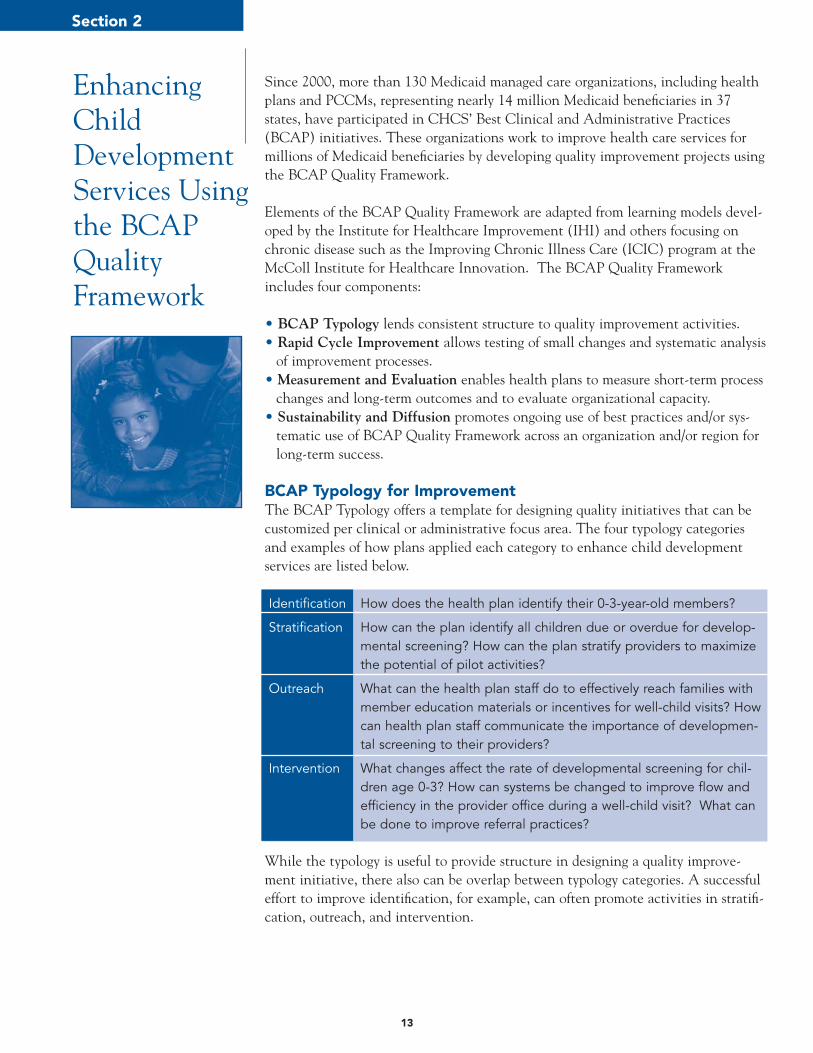
• BCAP Typology lends consistent structure to quality improvement activities.• Rapid Cycle Improvement allows testing of small changes and systematic analysis
of improvement processes.• Measurement and Evaluation enables health plans to measure short-term process
changes and long-term outcomes and to evaluate organizational capacity.• Sustainability and Diffusion promotes ongoing use of best practices and/or sys-
tematic use of BCAP Quality Framework across an organization and/or region forlong-term success.
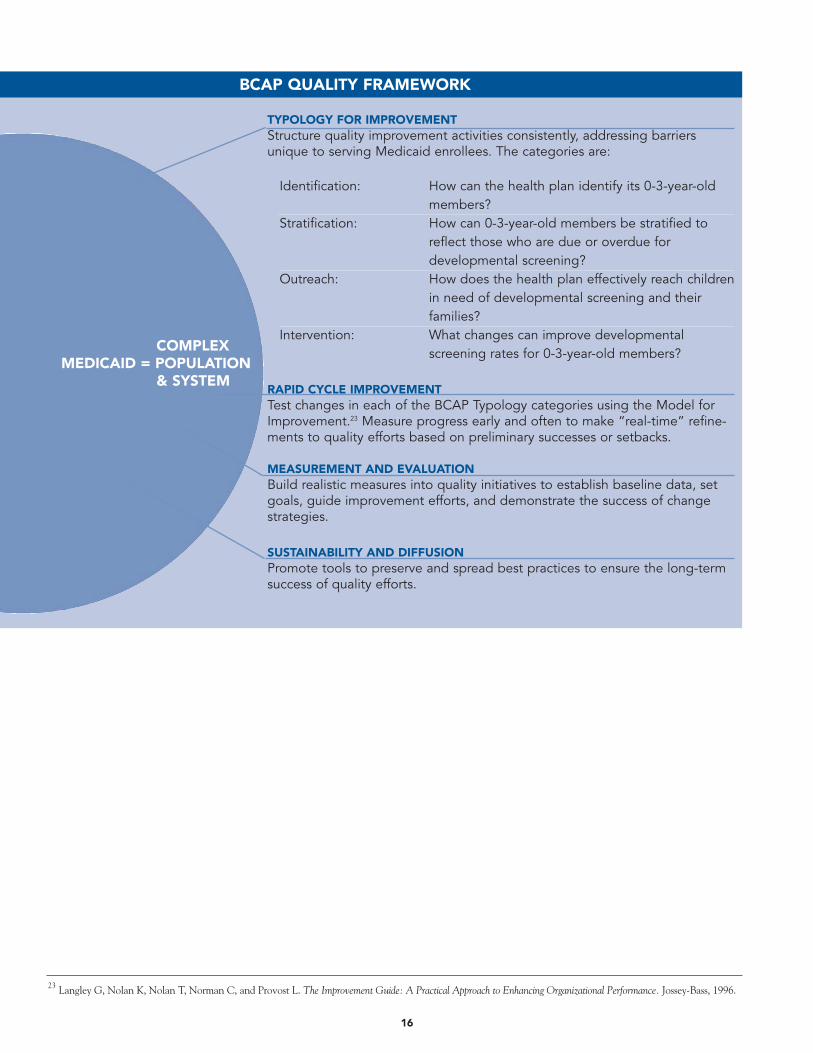
BCAP Typology for Improvement The BCAP Typology offers a template for designing quality initiatives that can becustomized per clinical or administrative focus area. The four typology categoriesand examples of how plans applied each category to enhance child developmentservices are listed below.
Identification How does the health plan identify their 0-3-year-old members?
Stratification How can the plan identify all children due or overdue for develop-mental screening? How can the plan stratify providers to maximize the potential of pilot activities?
Outreach What can the health plan staff do to effectively reach families with member education materials or incentives for well-child visits? How can health plan staff communicate the importance of developmen-tal screening to their providers?
Intervention What changes affect the rate of developmental screening for chil-dren age 0-3? How can systems be changed to improve flow and efficiency in the provider office during a well-child visit? What can be done to improve referral practices?
While the typology is useful to provide structure in designing a quality improve-ment initiative, there also can be overlap between typology categories. A successfuleffort to improve identification, for example, can often promote activities in stratifi-cation, outreach, and intervention.
Section 2
14
Rapid Cycle Improvement Structuring quality improvement goals using the BCAP Typology is followed byPDSA (Plan, Do, Study, Act) cycles, which test changes in systems and processes.PDSA cycles guide teams through a quick-turnaround analysis and improvementprocess. Typically, the health plan develops an overall aim for the project and thendevelops specific aims, measures, and changes for each typology category. Thismethod helps BCAP participants divide large quality improvement projects intomanageable pieces and encourages testing the specific components of the typologyseparately.
For example, DC Chartered Health Plan set an aim to improve screening rates byimplementing the standardized screening at a provider clinic. The following cyclesoutline how DC Chartered Health Plan optimized a provider site interventionthrough cycles of change:
Cycle 1: The health plan hosted several meetings to introduce the developmental screening program and to better understand workflow at the health center pilot site. They determined the need to decrease the administrative burdenon the health center for successful implementation.
Cycle 2: To streamline the screening process, a color-coded file cart, which includedthe screening tool questionnaires sorted by age group, was developed for each exam room. Once completed, the questionnaires were faxed back to the health plan for scoring and follow-up.
Cycle 3: To further assist the clinic staff in quickly picking the correct tool for each child, a “cheat sheet” was developed and included on each patient file indicating the appropriate screener to use.
Cycle 4: Individually faxed screens were difficult to read and unreliable. Bundled completed screens sent through interoffice mail was more reliable and efficient. Once familiar with the screening tool, the clinic staff found the “cheat sheet” to be too redundant and unnecessary and so it was removed from patient files.
This example shows how a health plan can incrementally roll out a qualityimprovement pilot, test changes, and make modifications to improve processes.
15
Measurement and EvaluationDemonstrating the success of any quality improvement initiative requires consistentand frequent data collection. Three categories of measurement are used in theBCAP Quality Framework to evaluate short- and long-term successes:
Pilot measures describe individual improvement team results in each BCAPTypology category and reveal where changes are working and where adjustmentsare necessary. Common measures aggregated across several organizations create normative data.The measures also allow BCAP participants to compare their progress againstbaseline.Capacity measures examine team capabilities, organizational processes, and systems changes.22
Establishing baseline data for each of these measures and collecting data in frequentintervals are critical to demonstrating the success of an initiative.
Sustainability and DiffusionSustainability means ensuring that a successful pilot project is institutionalized sothat it will continue after the improvement team has been disbanded. This meansmoving from a pilot project to a permanent program. For example, Health Pluspiloted a financial incentive to providers to improve developmental screening andobserved a significant improvement in its rates. Because of Health Plus’ pilot suc-cess, the plan institutionalized the incentive and offered reimbursement for devel-opmental screening to all of its providers.
Diffusion is the spread of both the best practice proven by the pilot project and theapplication of the BCAP Quality Framework methodology to other qualityimprovement projects. For example, beyond the developmental screening qualityimprovement work initiated in this workgroup, Molina Healthcare of Michigan isnow applying the BCAP Quality Framework to its lead screening program and itsemergency room utilization program for young children.
22 BCAP workgroups that started prior to 2003, including Enhancing Child Development Services in Medicaid Managed Care, used pilot measures to allow each plan to measure improvement against its own baseline. As of 2003, CHCS added common measures and capacity measures.
16
TYPOLOGY FOR IMPROVEMENTStructure quality improvement activities consistently, addressing barriersunique to serving Medicaid enrollees. The categories are:
Identification: How can the health plan identify its 0-3-year-old members?
Stratification: How can 0-3-year-old members be stratified to reflect those who are due or overdue for developmental screening?
Outreach: How does the health plan effectively reach children in need of developmental screening and their families?
Intervention: What changes can improve developmental screening rates for 0-3-year-old members?
RAPID CYCLE IMPROVEMENTTest changes in each of the BCAP Typology categories using the Model forImprovement.23 Measure progress early and often to make “real-time” refine-ments to quality efforts based on preliminary successes or setbacks.
MEASUREMENT AND EVALUATIONBuild realistic measures into quality initiatives to establish baseline data, setgoals, guide improvement efforts, and demonstrate the success of changestrategies.
SUSTAINABILITY AND DIFFUSIONPromote tools to preserve and spread best practices to ensure the long-termsuccess of quality efforts.
COMPLEX MEDICAID = POPULATION
& SYSTEM
BCAP QUALITY FRAMEWORK
23 Langley G, Nolan K, Nolan T, Norman C, and Provost L. The Improvement Guide: A Practical Approach to Enhancing Organizational Performance. Jossey-Bass, 1996.
17
24 J. Squires, L. Potter and D. Bricker, “The ASQ User’s Guide,” (Baltimore, MD: Paul H. Brooks Publishing Co, 2002). 25 American Academy of Pediatrics, op. cit.26 Ibid.
EarlyIdentificationUsingStandardizedDevelopmentalScreeningTools
Early and accurate identification of infants and young children who have develop-mental delays is critical to timely delivery of early intervention services. One strate-gy to improve appropriate identification of young children is to use standardizeddevelopmental screening tools during well-child care visits. The goal of develop-mental screening is to identify the infants and young children who require moreextensive evaluation. In order to impact large numbers of children, screening proce-dures should be easy to administer, appropriate for diverse populations, and relative-ly inexpensive.24 Screens do not diagnose problems, but can quickly provide direc-tion about whether more testing is needed. Efficient administration and scoring ofscreens frees time for follow-up, resource identification, member education, andtreatment.
The American Academy of Pediatrics Committee on Children with Disabilitiesrecommends various developmental screening tools.25 Many of these tools allowparents to complete self-guided screening tools at home or while they wait forappointments. Clinicians, office staff, or health plan staff need only score and inter-pret the results, saving substantial amounts of professional time.
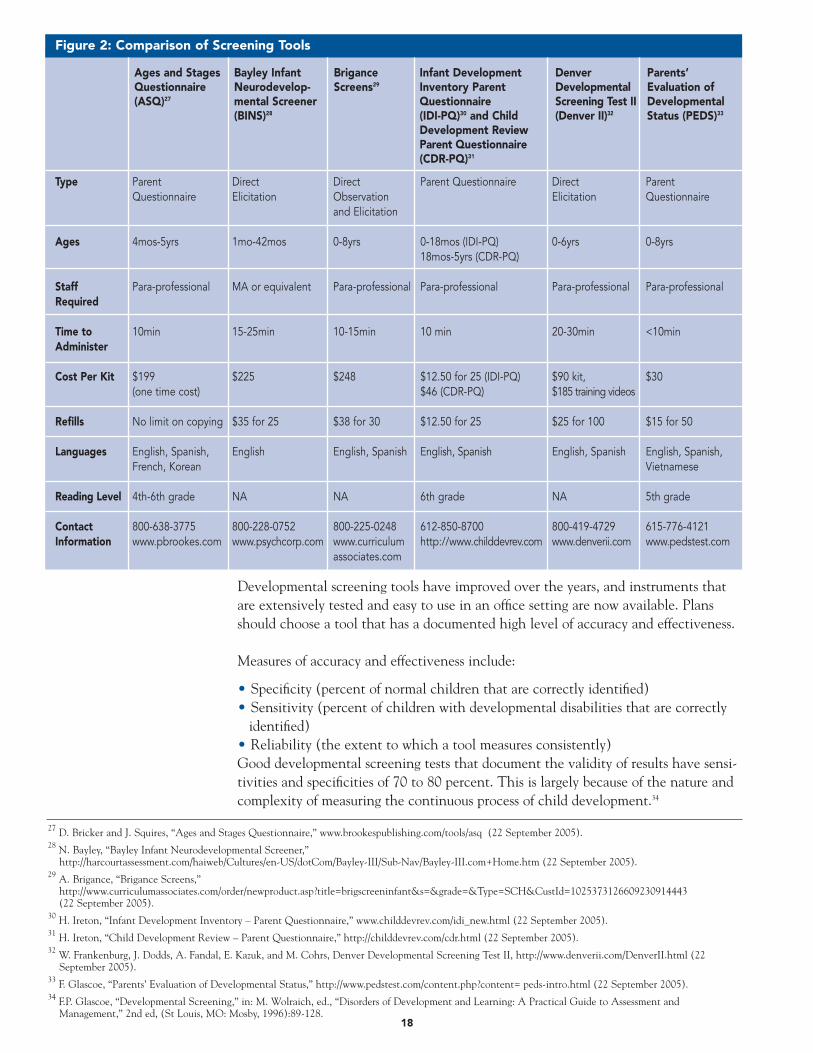
Many Medicaid managed care plans in the BCAP Workgroup on Enhancing ChildDevelopment Services in Medicaid Managed Care worked to incorporate standardizeddevelopmental screening into EPSDT well-child visits. Health plans recognized thatimplementing the use of standardized screening tools could lead to more timelyidentification of developmental delay, early intervention, strengthened parent-provider partnerships, as well as improved clinical and administrative practices.Types of screening tools used include parent questionnaires, direct elicitation (history/interviews), and observation. Figure 2 shows a comparison of commonlyused developmental screening tools.
Section 3
Recommendations on Developmental Surveillance and Screening of Infantsand Young ChildrenThe American Academy of Pediatrics Policy Statement on DevelopmentalSurveillance and Screening of Infants and Young Children provides recommen-dations for screening infants and young children and intervening with families toidentify developmental delays and disabilities.26 This statement is noteworthyfor acknowledging the importance of parents in assessing their children's devel-opment. In particular, the AAP highlights several standardized parent reporttools —the Parents’ Evaluation of Developmental Status (PEDS), Ages andStages Questionnaires (ASQ), and Child Development Inventories (CDI)—andthe emerging scientific data to support use of these tools to facilitate ongoingdevelopmental surveillance.
27 D. Bricker and J. Squires, “Ages and Stages Questionnaire,” www.brookespublishing.com/tools/asq (22 September 2005).28 N. Bayley, “Bayley Infant Neurodevelopmental Screener,”
http://harcourtassessment.com/haiweb/Cultures/en-US/dotCom/Bayley-III/Sub-Nav/Bayley-III.com+Home.htm (22 September 2005).29 A. Brigance, “Brigance Screens,”
http://www.curriculumassociates.com/order/newproduct.asp?title=brigscreeninfant&s=&grade=&Type=SCH&CustId=1025373126609230914443(22 September 2005).
30 H. Ireton, “Infant Development Inventory – Parent Questionnaire,” www.childdevrev.com/idi_new.html (22 September 2005).31 H. Ireton, “Child Development Review – Parent Questionnaire,” http://childdevrev.com/cdr.html (22 September 2005).32 W. Frankenburg, J. Dodds, A. Fandal, E. Kazuk, and M. Cohrs, Denver Developmental Screening Test II, http://www.denverii.com/DenverII.html (22
September 2005).33 F. Glascoe, “Parents’ Evaluation of Developmental Status,” http://www.pedstest.com/content.php?content= peds-intro.html (22 September 2005).34 F.P. Glascoe, “Developmental Screening,” in: M. Wolraich, ed., “Disorders of Development and Learning: A Practical Guide to Assessment and
Management,” 2nd ed, (St Louis, MO: Mosby, 1996):89-128.18
Figure 2: Comparison of Screening Tools
Type Parent Direct Direct Parent Questionnaire Direct ParentQuestionnaire Elicitation Observation Elicitation Questionnaire
and Elicitation
Ages 4mos-5yrs 1mo-42mos 0-8yrs 0-18mos (IDI-PQ) 0-6yrs 0-8yrs18mos-5yrs (CDR-PQ)
Staff Para-professional MA or equivalent Para-professional Para-professional Para-professional Para-professionalRequired
Time to 10min 15-25min 10-15min 10 min 20-30min <10minAdminister
Cost Per Kit $199 $225 $248 $12.50 for 25 (IDI-PQ) $90 kit, $30(one time cost) $46 (CDR-PQ) $185 training videos
Refills No limit on copying $35 for 25 $38 for 30 $12.50 for 25 $25 for 100 $15 for 50
Languages English, Spanish, English English, Spanish English, Spanish English, Spanish English, Spanish,French, Korean Vietnamese
Reading Level 4th-6th grade NA NA 6th grade NA 5th grade
Contact 800-638-3775 800-228-0752 800-225-0248 612-850-8700 800-419-4729 615-776-4121Information www.pbrookes.com www.psychcorp.com www.curriculum http://www.childdevrev.com www.denverii.com www.pedstest.com
associates.com
Ages and StagesQuestionnaire(ASQ)27
Bayley InfantNeurodevelop-mental Screener(BINS)28
BriganceScreens29
Infant DevelopmentInventory ParentQuestionnaire (IDI-PQ)30 and ChildDevelopment ReviewParent Questionnaire(CDR-PQ)31
DenverDevelopmentalScreening Test II(Denver II)32
Parents’Evaluation ofDevelopmentalStatus (PEDS)33
Developmental screening tools have improved over the years, and instruments thatare extensively tested and easy to use in an office setting are now available. Plansshould choose a tool that has a documented high level of accuracy and effectiveness.
Measures of accuracy and effectiveness include:
• Specificity (percent of normal children that are correctly identified)• Sensitivity (percent of children with developmental disabilities that are correctly
identified)• Reliability (the extent to which a tool measures consistently)Good developmental screening tests that document the validity of results have sensi-tivities and specificities of 70 to 80 percent. This is largely because of the nature andcomplexity of measuring the continuous process of child development.34
19
All participants in the BCAP workgroup sought ways to more effectively incorporatedevelopmental screening tools into routine well-child care. Many plans initiatedprovider surveys to learn whether standardized tools were being used during well-child visits. Some plans examined whether their providers were billing for develop-mental screening and assessment and if they were aware of the proper coding orreimbursement for these services. Many of the health plans in the workgroup choseto pilot parent questionnaire screening tools. Both the Ages and StagesQuestionnaire (ASQ) and the Pediatric Evaluation of Developmental Status(PEDS) tools are parent-completed instruments that are validated and have highlevels of sensitivity and specificity.35 Many health plans in the workgroup (Figure 3)selected one or both of these tools for their pilot projects. The advantages and limi-tations of both of these tools are described below.
35 F. P. Glascoe and H. Shapiro, “Introduction to Developmental and Behavioral Screening,” March 2005, www.dbpeds.org/articles/detail.cfm?TextID=5.
Figure 3: Developmental Screening Tools Used by BCAP Health Plans
Organization Name PEDS ASQ Other Screening Method
ABC Health Plan ✓ Parent questionnaires mailed to parents of children athigh risk for developmental delay.
BlueCross BlueShield ✓ Parent questionnaire administered during well-visit.of TN
DC Chartered Health Plan ✓ Parent questionnaire administered during well-visit; plan scored the questionnaire and provided feedbackto provider and members.
Lovelace Health Plan ✓* ✓ Practice site and health fair administration of parent questionnaires by health professionals.
CommunityCARE ✓ ✓ ✓ Practice site could choose from a menu of six accepted tools.
Missouri Care ✓ Parent questionnaire filled out in the waiting room.
Network Health ✓ Parent questionnaire administered at home visit.
Virginia Premier ✓ Parent questionnaire administered during well-visit.
*Lovelace used a modified PEDS questionnaire in a health fair setting.
Ages and Stages Questionnaire (ASQ)Advantages• Parent involvementThe ASQ relies on parents to observe their child and to complete simple question-naires about their child’s abilities. The basic premise is that parents can reliablyassess their child’s development when asked, “Can your baby do _____ now?” ASQhelps health care providers involve parents in a conversation about the child’shealth and development.
• Fast and simple designEach questionnaire includes a title page with instructions, an information sheet foridentification, 30 simply worded activities – six for each of the five developmentalareas (communication, gross motor, fine motor, personal-social, and problem solv-ing), and an information summary sheet for scoring and general comments. The
20
questionnaires are written at a fourth- to sixth-grade literacy level and are availablein multiple languages (English, Spanish, French, and Korean).36 The questionnaireis tailored to address issues specific to the child’s age. Each questionnaire takesapproximately 10 minutes to administer.
• Adaptable implementation The questionnaires can be mailed to the child’s home; completed during a homevisit, in a physician’s office/ waiting room; or completed during telephone interviewswith parents. A health plan may choose to implement a combination of thesestrategies.
• Easy scoringScoring, which takes only one to five minutes, can be done by clerical staff or para-professionals who have been instructed by professional staff. To score a question-naire, the parent’s responses—yes, sometimes, and not yet—are converted topoints–10, 5, 0 respectively–and are totaled for each area.37
• Accurate and effectiveSensitivity ranges from 70 to 90 percent at all ages except the four-month level andspecificity ranges from 76 to 91 percent.38
• Cost-effectiveAfter initial purchase, users can make additional photocopies at no additional cost.
Limitations• Does not address behavioral/emotional issues; however, there is an ASQ: Social-
Emotional screen that can be used as a supplement.• Some programs may need to assess infants or children at intervals not covered by
the ASQ (e.g., one or two months of age).39
Parents' Evaluation of Developmental Status (PEDS)Advantages• Parent involvementUses parent concerns about their child’s developmental and behavioral status andpromotes parent-provider collaboration and family-centered practice by elicitingparents’ concerns.
• Fast and simple designPEDS identifies when to refer, screen further, or refer for additional screeningthrough a questionnaire of 10 carefully constructed questions. It takes less than 10minutes to administer and score. The questionnaire is written at a fourth- to fifth-grade reading level and is available in multiple languages (English, Spanish,Vietnamese). The same 10 questions are used across the age range of PEDS frombirth to age eight.
36 J. Squires, L. Potter, D. Bricker and S. Lamorey, “Parent-Completed Developmental Questionnaires: Effectiveness With Low and Middle Income Parents.” Early Childhood Research Quarterly 13, no. 2 (1998): 345-354.
37 J. Squires et al. “The ASQ User’s Guide.” op. cit.38 Ibid.39 Ibid.
21
• Adaptable implementation The questionnaires can be mailed to the child’s home; completed during a homevisit, in a physician’s office/ waiting room; or completed during telephone inter-views with parents. A health plan may choose to implement a combination ofthese strategies.
• Easy scoring and administrationPEDS can be administered by a range of professionals and paraprofessionals, includ-ing office staff. New users only need to read the brief scoring and administrationguide to score and categorize members as high, moderate, and low risk for develop-mental and behavioral/mental health problems.
• Accurate and effectivePEDS was developed out of four cross-validation studies on a nationally representa-tive sample of families. Sensitivity ranges from 70 to 80 percent at all ages andspecificity ranges from 70 to 80 percent.40
Limitations• Providers at one BCAP Workgroup pilot site reported that the questionnaires
were often incomplete or inappropriately filled out. For example, for the firstquestion (“Please list any concerns about your child’s learning, development, orbehavior”) parents had responded with answers such as “Johnny is acting bad.”This led them to believe that this screener would work better as an interactiveconversation tool, rather than an independently filled-out questionnaire.
• Some providers thought it would be difficult to determine what “normal” childdevelopment was if they did not even understand “normal.”
• The PEDS test requires refills which pose an additional cost.
40 F.P. Glascoe and H. Shapiro, “Introduction to Developmental and Behavioral Screening,” March 2005, www.dbpeds.org/articles/detail.cfm?TextID=5.

Many American parents report that health care providers do not regularly provideinformation regarding their child’s development. In particular, minority or economi-cally disadvantaged parents are two to four times more likely to express dissatisfac-tion with the health care their children receive than white, non-poor, insured families.41 A Commonwealth Fund survey found up to 77 percent of parents with children from birth to 36 months reported that a health professional had not dis-cussed one of six age-appropriate childrearing topics with them; more than onethird had not discussed any of the topics.42 Parents who discussed more topics withtheir health care providerwere more likely to reportthat they received excellentcare.
Health plans can empowerparents to play more signifi-cant roles in assessing theirchild’s development. Usingparents to complete develop-mental questionnaires mayenhance the accuracy of screening assessments because of the intimate informationparents have about their children. Additionally, health plans can support memberneeds by providing materials on childrearing topics, reminders for well-child officevisits, and age-appropriate developmental milestone materials. Educating familiesabout what to expect in their child’s development and helping families to askappropriate questions can also improve communication with providers.44
Health plans in the BCAP Workgroup on Enhancing Child Development Services inMedicaid Managed Care employed various member outreach strategies includingmailing materials, offering member incentives, telephone outreach, conductinghome visits, and creating outreach events. These approaches increased the numberof children who had timely EPSDT visits and the number of children who were for-mally screened for developmental delay.
23
41 E.L. Schor. “Rethinking Well-Child Care.” Pediatrics 114, no. 1 (2004): 210-16.42 Commonwealth Fund Survey of Parents with Young Children, as reported by Schuster et al. (2000).43 M.A. Schuster, N. Duan, M. Regalado and D.J. Klein, “Anticipatory Guidance: What Information Do Parents Receive? What Information Do They Want?”
Archives Pediatric Adolescent Medicine 154 (2000):1191-1198. 44 C.S. Nelson, L.S. Wissow and T.L. Cheng, “Effectiveness of Anticipatory Guidance: Recent Developments.” Current Opinions in Pediatrics 15 (2003):
630–635.
Reaching outto Members
Section 4
“Although anticipatory guidance is consid-ered an important component of well-childcare, the majority of parents reported thatthey had not discussed most standard top-ics with a clinician…. Effort is required toprovide parents with the information theyneed to take good care of their children.”43
24
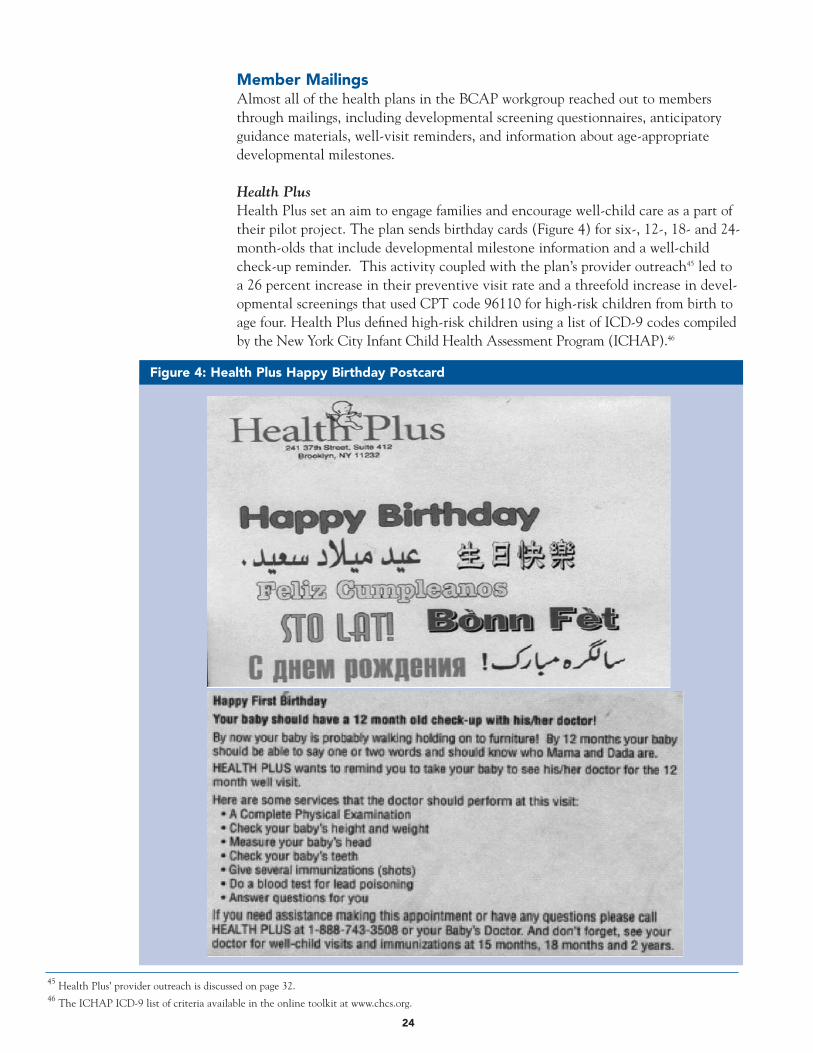
Member MailingsAlmost all of the health plans in the BCAP workgroup reached out to membersthrough mailings, including developmental screening questionnaires, anticipatoryguidance materials, well-visit reminders, and information about age-appropriatedevelopmental milestones.
Health PlusHealth Plus set an aim to engage families and encourage well-child care as a part oftheir pilot project. The plan sends birthday cards (Figure 4) for six-, 12-, 18- and 24-month-olds that include developmental milestone information and a well-childcheck-up reminder. This activity coupled with the plan’s provider outreach45 led toa 26 percent increase in their preventive visit rate and a threefold increase in devel-opmental screenings that used CPT code 96110 for high-risk children from birth toage four. Health Plus defined high-risk children using a list of ICD-9 codes compiledby the New York City Infant Child Health Assessment Program (ICHAP).46
45 Health Plus’ provider outreach is discussed on page 32. 46 The ICHAP ICD-9 list of criteria available in the online toolkit at www.chcs.org.
Figure 4: Health Plus Happy Birthday Postcard
CommunityCARECommunityCARE set a goal to increase awareness about KIDMED47 program ser-vices. A brochure, “Improving Your Health,” is mailed to every new eligible childand once a year during open enrollment. The brochure describes the “KIDMED”program and the importance of regularly-scheduled well-child visits, periodic devel-opmental screening, and immunizations.48
Molina Healthcare of MichiganThrough member outreach, Molina Healthcare sought to educate parents regardingthe components of the EPSDT visit. For its pilot project, the health plan developeda new member education mailing in English and Spanish that explained the compo-nents of a well-child visit as well as health tips, milestones, and available resources.The accompanying letter included a tear-off portion for members to bring to theirwell-child care visit for the practitioner to fill out and return to the health plan.49
The letters were mailed every 60 days or until the child received all recommendedEPSDT visits. Parents who received member outreach mailings from Molina askedmore questions and brought up issues about their child’s development, growth, andbehavior.50
Member Incentives/RewardsA few health plans in the workgroup offered member incentives as a part of memberoutreach efforts. For example, Virginia Premier Health Plan offered a free Sears por-trait to targeted high-risk mothers who brought their children in for timely well-child visits and developmental screening.
To encourage literacy promotion and positive parent-child interactions, MolinaHealthcare of Michigan sent age-appropriate, bilingual board books to each childwho was brought in for an EPSDT visit. Molina confirmed the visit through a check-off list from providers indicating that a developmental assessment was completed.
In both of these cases, the health plans learned that the real incentive for memberswas to have an opportunity to discuss their child’s health and well-being with ahealth care provider who was listening. By piloting the incentive approaches withtargeted populations using rapid cycle improvement techniques, the health plansquickly learned that these member incentives did not correlate with increased well-child visit rates, or with developmental screening rates. Both plans subsequentlystopped their incentive strategies and enhanced focus on providing educationalmaterials to help members better understand age-related milestones and bring con-cerns to their provider’s attention.
Learning from MembersCommunityCARE, Louisiana’s primary care case management program discoveredthat approximately 30 percent of members, age 0-21, missed scheduled appointments,according to self-reported data from two pilot sites. CommunityCARE conducted anurse-administered member survey via telephone to understand and evaluate the reasonsfor missed well-visit appointments, and to improve both well-visit and standardized
25
47 KIDMED is the name of Louisiana’s EPSDT program.48 Community Care’s “Improving Your Health” brochure is available in the online toolkit at www.chcs.org. 49 Molina Healthcare’s member mailing materials are available in the online toolkit at www.chcs.org. 50 Center for Health Care Strategies, “Improving Developmental Screening: One Child at a Time,” September 2004, http://www.chcs.org/info-url3969/info-
url_show.htm?doc_id=241085.
26
51 CommunityCARE’s Provider Training Guide is available in the online toolkit at www.chcs.org.
developmental screening rates. CommunityCARE learned that lack of public trans-portation was a significant barrier to regular well-visits. As a result,CommunityCARE included information about Friends and Family, a program pro-viding non-emergency transportation for Medicaid recipients in a newly developedProvider Training Guide,51 developed as a result of survey responses.
Additionally, CommunityCARE used the phone conversation to give age-appropri-ate anticipatory guidance to parents and caregivers. When parents were contacted,they often had questions regarding the health of their child. The nurses were ableto address their concerns and share age-appropriate information about their child’sdevelopment.
Recognizing unmet needs expressed by members, CommunityCARE added the following questions related to child development services to its annual member sat-isfaction survey:
• In the past 12 months, did your child’s doctor or other health care provider(nurse) talk to you about your child’s learning, development, or behavior?
• In the last 12 months, did you have any concerns about your child’s learningdevelopment or behavior? If so, did your doctor or nurse give you specific infor-mation on how to address these concerns?
• Are you familiar with KIDMED screening services? If so, has your child receiveda KIDMED screening in the past two years?
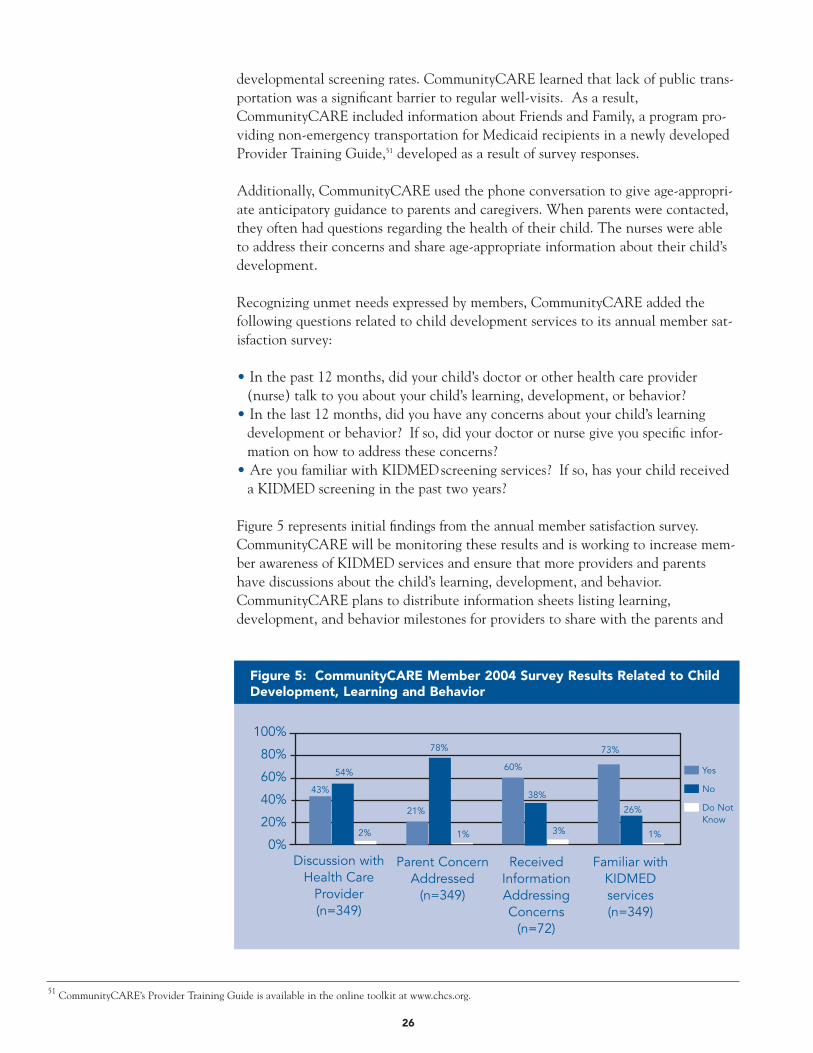
Figure 5 represents initial findings from the annual member satisfaction survey.CommunityCARE will be monitoring these results and is working to increase mem-ber awareness of KIDMED services and ensure that more providers and parentshave discussions about the child’s learning, development, and behavior.CommunityCARE plans to distribute information sheets listing learning, development, and behavior milestones for providers to share with the parents and
Figure 5: CommunityCARE Member 2004 Survey Results Related to ChildDevelopment, Learning and Behavior
Discussion withHealth Care
Provider(n=349)
Parent ConcernAddressed
(n=349)
Yes
No
Do NotKnow
ReceivedInformationAddressingConcerns
(n=72)
Familiar withKIDMED services(n=349)
100%
80%
60%
40%
20%
0%
43%
54%
2%
21%
78%
60%
38%
73%
26%
1% 1%3%
age-specific “Step by Step” developmental information sheets directly to members.52
Conducting the telephone member survey led to the creation of the ProviderTraining Guide and to the addition of questions relevant to child development ser-vices to CommunityCARE’s member satisfaction survey.
Home VisitsIf children and their parents or caregivers are not able to visit a provider’s office, pub-lic health nurses, social workers, and other trained home visitors can deliver childdevelopment services through home visits. For example, a trained home visitor couldadminister a developmental screening, provide parent education and counseling, andidentify local community resources for families. A home visit may be required whenparents are unable or unwilling to keep appointments because of work schedule con-flicts, cultural or linguistic factors, lack of transportation, or other challenges faced by
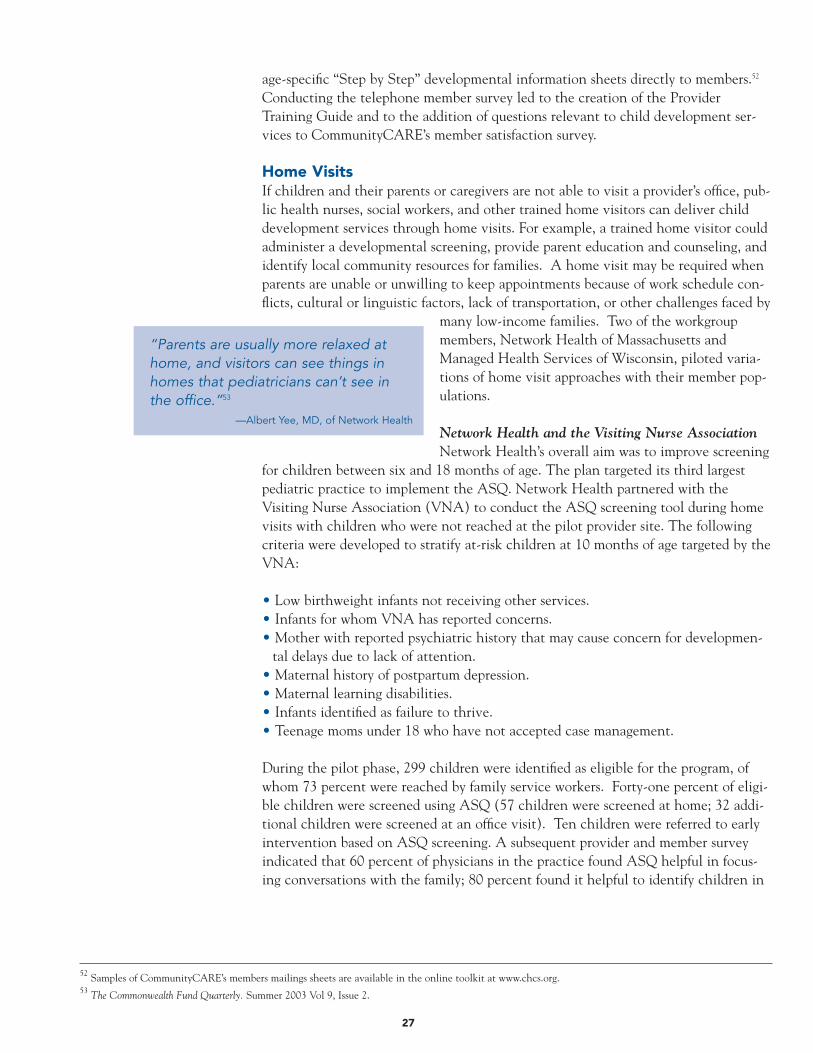
many low-income families. Two of the workgroupmembers, Network Health of Massachusetts andManaged Health Services of Wisconsin, piloted varia-tions of home visit approaches with their member pop-ulations.
Network Health and the Visiting Nurse AssociationNetwork Health’s overall aim was to improve screening
for children between six and 18 months of age. The plan targeted its third largestpediatric practice to implement the ASQ. Network Health partnered with theVisiting Nurse Association (VNA) to conduct the ASQ screening tool during homevisits with children who were not reached at the pilot provider site. The followingcriteria were developed to stratify at-risk children at 10 months of age targeted by theVNA:
• Low birthweight infants not receiving other services.• Infants for whom VNA has reported concerns.• Mother with reported psychiatric history that may cause concern for developmen-
tal delays due to lack of attention.• Maternal history of postpartum depression.• Maternal learning disabilities.• Infants identified as failure to thrive.• Teenage moms under 18 who have not accepted case management.
During the pilot phase, 299 children were identified as eligible for the program, ofwhom 73 percent were reached by family service workers. Forty-one percent of eligi-ble children were screened using ASQ (57 children were screened at home; 32 addi-tional children were screened at an office visit). Ten children were referred to earlyintervention based on ASQ screening. A subsequent provider and member surveyindicated that 60 percent of physicians in the practice found ASQ helpful in focus-ing conversations with the family; 80 percent found it helpful to identify children in
27
52 Samples of CommunityCARE’s members mailings sheets are available in the online toolkit at www.chcs.org.53 The Commonwealth Fund Quarterly. Summer 2003 Vol 9, Issue 2.
“Parents are usually more relaxed athome, and visitors can see things inhomes that pediatricians can’t see inthe office.”53
—Albert Yee, MD, of Network Health
need of services. Ninety-four percent of members felt the ASQ helped them betterunderstand what questions to ask their child’s doctor. Select member responsesinclude:
• “I found it very helpful, because I was ready when I went to the doctor’s office toask the right questions.”
• “I think it is wonderful. It is a great tool. This is my first baby and I feel I gotgreat help. I am very happy with both [the plan], and my pediatrician.”
• “I thought it was a good program. It helped me better understand my child.”
• “I found the pilot program very helpful. I wish I had this when I had my firstchild.”
Network Health’s physician group added developmental benchmarks based on theASQ screener to its well-visit forms that reside permanently in the patient charts.Network Health is exploring the feasibility of providing additional home visits formembers identified as being at-risk during the post-partum home visit.
Managed Health Services Home Visit ProgramManaged Health Services (MHS) designed a home visit program calledHealthCheck to reach children who were overdue for a well-child visit. To set upthe home visit appointment, MHS staff first called the family. If phone contact wasunsuccessful, they sent a postcard requesting that the member call MHS. If a mem-ber reached by phone declined a home visit (which only occurred twice), theninformation on early childhood development was sent by mail and information wasreviewed during a phone call. This phone call was also used to link members with-out a provider with a primary care physician.
Initially, MHS tried to collaborate with an ongoing home visitation program at theCity of Milwaukee Health Department. The health department conducted limitedhome visits to high-risk infants who met specific criteria. MHS developed a referralform that would be sent to the health department whenever an MHS member metthe city’s high-risk criteria. After multiple attempts to launch the program, the Cityof Milwaukee Health Department withdrew due to limited resources and concernsregarding the potential volume of home visits.
Due to this barrier, MHS has taken full responsibility to reach members who wereoverdue for a well-child visit through home visits, telephone contacts, mailing of a“call us” postcard, and mailing of information on early childhood development.From December 2003 to May 2004, MHS contacted 88 percent of MHS newbornswho were overdue for a well-child visit. During this period, 72 percent of the mem-bers reached received HealthCheck home visits as a result of successful outreach.
28
Member Outreach EventsThrough outreach events — community fairs, health fairs, parent training groups —paraprofessionals can conduct developmental screenings for children in their com-munities. Parent-guided questionnaires can be distributed at events and returned viamail or at an upcoming well-visit. An outreach event also can be used to conducton-site screenings and enroll children in a longer-term screening program. Memberoutreach events also offer an opportunity to distribute anticipatory guidance materi-als and engage parents as partners in the healthy development of their children.
Lovelace Community Health PlanLovelace created Well-Child Round-Ups to encourage members to schedule preven-tive care visits as part of its Healthy Trails program to improve well-child care. Well-Child Round-Ups take place one day a month at two clinic pilot sites. Lovelace’sHealthy Trails mascot, Hank, the Healthy Trails Horse, visits the clinic armed withhealth education materials. Hank entertains children, while parents fill out theAges and Stages Questionnaire in preparation for the well-visit. Families are alsogiven Healthy Trails calendars that come with stickers for developmental milestonesand reminders for when well-child visits are due. This new initiative has been verysuccessful with parents and children. Typically, 35 to 45 members have their well-child visits on Well-Child Round-Up days.
CommunityCARE During its annual open enrollment week, the CommunityCARE program hosts aluncheon for members and providers where early intervention success stories areshared. The children featured in the success stories, their families, along with theproviders and their staff, are honored. Through use of personal testimony, this out-reach event has been highly successful in increasing awareness of the benefits ofdevelopmental screening and early intervention for both parents and providers.
29

31
Primary care practitioners play an especially important role in the early identificationand referral of children with developmental delays under three years of age. TheNational Survey of Early Childhood Health shows that 95 percent of young childrenbetween four months of age to their third birthday had a doctor’s visit in the last 12months.54 Physicians who care for infants and toddlers are in a unique position toobserve developmental progress, identify children with developmental problems,counsel parents on developmental issues, and make appropriate referrals for childrenrequiring intervention.
Health plans can work with providers to help reduce administrative burden andimprove workflow; reward quality through incentives; and provide trainings on theimportance of developmental screening and early intervention, new screening tools,community resources, and efficient navigation of the reimbursement process. Thehealth plan participants in the BCAP Workgroup on Enhancing Child DevelopmentServices in Medicaid Managed Care implemented several provider strategies to improvechild development services.
Reducing Administrative Burden and Improving WorkflowHealth plans can reduce administrative burden on provider practices by providingtools for, and potentially administering and scoring, standardized developmentalscreens. Health plans can also improve workflow by providing critical utilizationdata to providers. For example, healthplans can use reminder systems toencourage the use of preventive ser-vices, or provide feedback to physicianson utilization to encourage better pro-cesses of care. Following are examplesof how participants in the BCAPWorkgroup supported their providers.
Missouri CareMissouri Care aimed to implement useof the ASQ screener and increase thepercentage of 18-26-month-old chil-dren receiving developmental screeningto 80 percent at pilot clinics. Clinicstaff identified Missouri Care members presenting for a 24-month EPSDT check-up.Parents were encouraged to complete the ASQ while in the waiting room. Nursesscored the completed ASQs and tracked the referrals made to specialty care for fol-low-up. From June to August 2004, 85 ASQs were handed out to parents presentingwith their children for a 24-month EPSDT visit, 36 ASQs were completed, and fivechildren were referred to specialty care.
Molina Healthcare of MichiganMolina was able to reduce administrative burden at its provider sites by implement-ing a regular system for contacting members through outreach mailings, which significantly increased the number of children visiting the pilot site for well-child
WorkingwithProviders
54 L. M. Olson, M. Inkelas, N. Halfon, M.A. Schuster, K.G. O'Connor and R. Mistry, “Overview of the Content of Health Supervision for Young Children: Reports From Parents and Pediatricians,” Pediatrics 113, no. 6 , Suppl., (2004):1907-1916.
Section 5
“Molina's efforts brought a lotmore children to us for well-childexams, particularly the two- tothree-year-olds. It really took a lotof the work from us in not havingto contact people ourselves.Seeing these kids on a more timelybasis obviously helps us to identifyproblems early and reduce poten-tial aggravations of problems.”
—Gary Detwiler, Physician Assistant at Sparta Health Center in Sparta, Michigan
32
visits. In addition to contacting members, Molina developed educational materialsfor provider offices that explained the components of an EPSDT exam, additionalservices required for Medicaid beneficiaries, proper CPT codes, billing instructions,referral sources for children with developmental delays, and plan contact numbers.Providers were appreciative and extremely supportive of Molina’s efforts to get chil-dren in for well-child visits.55
DC CharteredDC Chartered Health Plan worked with two high-volume provider sites to imple-ment consistent use of ASQ as a screening tool for plan members. DC Charteredstaff trained provider office staff on using ASQ, and worked with the sites to imple-ment additional office system changes. These included color-coding for age-specificforms, providing information about how the forms are scored, and working with theclinic to assure appropriate referral and follow-up for children identified at risk.After the questionnaires were completed, the health plan scored each one and pro-vided follow-up information to providers and parents.
Four months into the pilot, 275 children born between April 1, 2000-April 1, 2001,were seen at two high-volume provider sites for well-child visits. Out of the 275children, 175 ASQs were completed during these visits (64 percent). None of thesechildren were previously screened for developmental delay. Thirteen children out of175 (seven percent) were identified as at risk; five of the 175 (three percent) werereferred for a developmental evaluation. A developmental milestone chart and infor-mation about available resources were mailed to the remaining eight families. DCChartered has continued this program beyond the conclusion of this workgroup.
CommunityCARELouisiana’s EPSDT Program, KIDMED, developed standardized flowsheets56 to helpguide EPSDT visits at each age interval. The flowsheets were introduced atCommunityCARE’s annual provider training. Each flowsheet includes sections ondevelopmental assessment and anticipatory guidance. These forms help providersremember what preventive and child development services should be covered ateach KIDMED visit. Most CommunityCARE providers are using the flowsheets andreport positive feedback. In particular, providers appreciate that the flowsheets arecomprehensive as well as user-friendly. Many providers use the form for all of thepatients in their practice, not just those who are eligible for the KIDMED program.The standardization across the state has been useful for chart monitoring and perfor-mance evaluation.
Health Plus Health Plus set a goal to increase well-visits (including developmental assessments)by 20 percent in members 0-4 years. The plan identified select ICD-9 codes fromclaims data to identify 563 children, age 0-4, at risk for developmental delays.57 Thehealth plan sent letters to providers notifying them of high-risk members and offeredinstructions on office-based screening (Figure 6). By identifying children forproviders, Health Plus was able to reduce provider site administrative burden.Health Plus’ pilot resulted in a 26 percent increase in developmental screening
55 For more information about Molina’s member outreach, see pages 25 and 47.56 CommunityCARE’s documentation flowsheet is available in the online toolkit at www.chcs.org.57 The ICHAP ICD-9 list is available in the online toolkit at www.chcs.org.
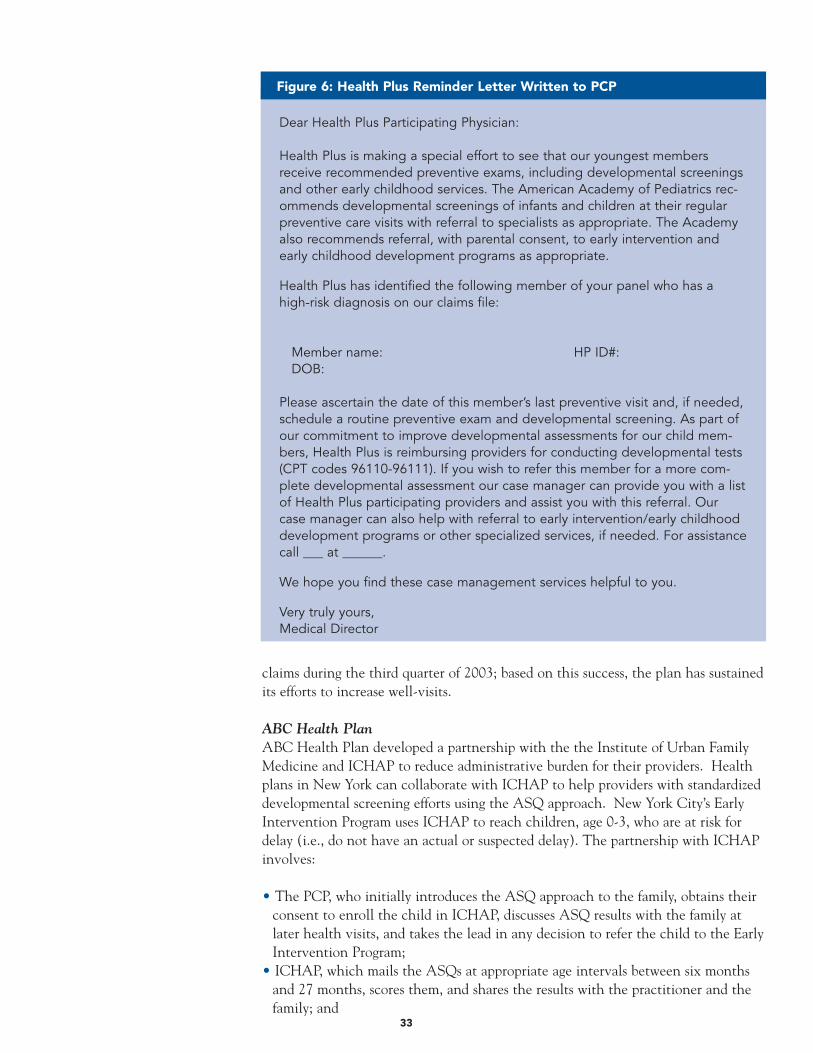
33
claims during the third quarter of 2003; based on this success, the plan has sustainedits efforts to increase well-visits.
ABC Health Plan ABC Health Plan developed a partnership with the the Institute of Urban FamilyMedicine and ICHAP to reduce administrative burden for their providers. Healthplans in New York can collaborate with ICHAP to help providers with standardizeddevelopmental screening efforts using the ASQ approach. New York City’s EarlyIntervention Program uses ICHAP to reach children, age 0-3, who are at risk fordelay (i.e., do not have an actual or suspected delay). The partnership with ICHAPinvolves:
• The PCP, who initially introduces the ASQ approach to the family, obtains theirconsent to enroll the child in ICHAP, discusses ASQ results with the family atlater health visits, and takes the lead in any decision to refer the child to the EarlyIntervention Program;
• ICHAP, which mails the ASQs at appropriate age intervals between six monthsand 27 months, scores them, and shares the results with the practitioner and thefamily; and
Figure 6: Health Plus Reminder Letter Written to PCP
Dear Health Plus Participating Physician:
Health Plus is making a special effort to see that our youngest membersreceive recommended preventive exams, including developmental screeningsand other early childhood services. The American Academy of Pediatrics rec-ommends developmental screenings of infants and children at their regularpreventive care visits with referral to specialists as appropriate. The Academyalso recommends referral, with parental consent, to early intervention andearly childhood development programs as appropriate.
Health Plus has identified the following member of your panel who has ahigh-risk diagnosis on our claims file:
Member name: HP ID#:DOB:
Please ascertain the date of this member’s last preventive visit and, if needed,schedule a routine preventive exam and developmental screening. As part ofour commitment to improve developmental assessments for our child mem-bers, Health Plus is reimbursing providers for conducting developmental tests(CPT codes 96110-96111). If you wish to refer this member for a more com-plete developmental assessment our case manager can provide you with a listof Health Plus participating providers and assist you with this referral. Ourcase manager can also help with referral to early intervention/early childhooddevelopment programs or other specialized services, if needed. For assistancecall ___ at ______.
We hope you find these case management services helpful to you.
Very truly yours,Medical Director
58 The ICHAP ICD-9 list is available in the online toolkit at www.chcs.org.59 See the case study on page 51 for more information.
34
• The family, which completes the ASQs, mails them back to ICHAP, and isinvolved in early intervention referral decisions.
To enroll a child in the ICHAP ASQ program, the child must:
• Be 0-3 years of age;• Live in New York City; and • Have one or more ICHAP risk factors.58
ABC created a registry of high-risk 0-3-year-old members based on claims data indi-cating ICHAP risk factors. With parent permission, members on the registry wereenrolled in the ICHAP ASQ program at the provider site.
ABC and ICHAP found that a large proportion of participating families returned thequestionnaires on a regular basis. ICHAP’s ASQ approach supports ongoing develop-mental screening, is integrated into the child’s primary care medical home, sparesthe pediatrician’s time and resources, is cost efficient, and fully involves the family indevelopmental assessment.
Targeting Providers for Maximum ImpactBlueCross BlueShield of Tennessee maximized resource use by stratifying its “high-leverage” providers for a quality improvement intervention. Through claims data,the plan identified the percentage of providers who were conducting a standardizeddevelopmental screen in their EPSDT preventive visit. Only 8.9 percent of the pre-ventive visits showed a documented developmental screen, suggesting significantopportunity for improvement. BCBST stratified PCPs serving six- to 36-month-oldsby the number of preventive visits, and by the percentage of preventive visits withstandardized developmental screen using the following definitions:
• “High-Volume” = PCPs with 100 or more preventive visits per year.• “High-Opportunity” = PCPs with fewer than 50 percent of preventive visits with
standardized developmental screen.• “High-Leverage” = PCPs stratified as both high-volume and high-opportunity.
Through this innovative stratification approach, BCBST determined that 34 PCPsperformed close to 80 percent of preventive visits and also had a preventive visitdevelopmental screening rate of less than 50 percent. BCBST targeted its outreachefforts on these high-leverage PCPs to maximize the potential of improvement activ-ities, and saw improvement in screening rates at these sites.59
Provider OutreachManaged care organizations can support providers through trainings on the impor-tance of developmental screening and new tools available. Several plans in theBCAP workgroup piloted approaches to increase provider/office staff awareness andoffer training for early childhood development screening.
35
BlueCross BlueShield of TennesseeBCBST provided training on the PEDS Test for 34 provider sites through theirRegional Clinical Network Analyst (registered nurse/outreach worker). The out-reach worker had direct contact with all the targeted provider sites through tele-phonic outreach and at least one visit to each office. Training packets were devel-oped for the outreach worker to use when visiting PCPs and training office staff.60
The training focused on how and when to administer the PEDS test as well as howto navigate the reimbursement process. To reinforce the training, an article wasplaced in the provider newsletter.
Lovelace Community Health PlanLovelace aimed to improve screening and referral rates by training providers aboutstandardized screening and the Family Infant Toddler (FIT)61 referral process.Lovelace oriented providers to the ASQ screener by visiting selected pilot site prac-tices and reviewing the ASQ with providers. Lovelace staff learned that althoughall of their providers had heard of the ASQ, and understood the importance oftimely and quality well-visits, none of the providers had seen the questionnaire andsome thought that it had to be administered at every EPSDT visit. Providersresponded positively to the ASQ training, recognizing that ASQ offers an easy toolthat could be used throughout the office. Lovelace also sought to educate providerson the FIT Program referral process. Many providers were making referrals for ther-apies that were non-covered services and many providers did not know how tomake a referral to the FIT program. Lovelace developed a list of local FIT providersand covered services for each pilot site. Through provider outreach, the health planwas able to educate providers on how to incorporate standardized screening intowell-child care and how to appropriately navigate the referral process.62
CommunityCARECommunityCARE set a goal to increase provider knowledge of standardized devel-opmental screening tools. CommunityCARE staff was trained on Bright FuturesGuidelines (see Bright Futures, page 36) and added the PEDS and ASQ screeners tothe tools available to providers. It was originally envisioned that increasing thenumber of available tools would increase flexibility for providers and thus improvescreening rates. CommunityCARE reports that increasing the number of screeningtools did not yield an increase in referral rates in most cases. They learned thatincreasing the number of accepted tools requires time-intensive training and aware-ness building around the pros and cons of each tool.
CommunityCARE also developed and distributed a Provider Training Guide to helpproviders direct members to appropriate services. The guide includes communityresources, best practices for data collection, and anticipatory guidance materials.Among the community resources included were: “Friends and Family,” a programproviding non-emergency transportation for Medicaid recipients; “Nurse-FamilyPartnership,” nurse home visiting program for first time, low-income mothers andtheir families; and the “Early Steps Program,” Louisiana’s early intervention program.
60 BlueCross BlueShield’s Provider Training Packet are available in the toolkit online resources at www.chcs.org. 61 The Family Infant Toddler Program is New Mexico’s early intervention program.62 See the case study on page 57 for more information on Lovelace’s pilot.
36
To promote Louisiana’s “Early Steps” intervention program, CommunityCARErecruited parent liaisons to share their personal stories at provider offices. Parentliaisons discuss the importance of developmental screening and share personal stories.For example, one of the liaisons shares her experiences of having a daughter withdevelopmental disabilities. When her daughter was born, there was no program likeEarly Steps that could come into the home and work with her daughter. The parentliaison describes how she had to drive two hours, twice a week to take her daughterto therapy with her two-year-old son in tow. Physicians have responded very posi-tively to this personalized outreach that validates the need for quality and timelyscreening and referral.
CommunityCARE’s provider outreach efforts have contributed to more consistentreferrals and provider tracking of referral rates.
Bright Futures
Bright Futures, initiated by the Maternal and Child Health Bureau over a decade ago, is dedicated toensuring that every child deserves to be healthy, and that optimal health involves a trusting relationshipbetween the health professional, the child, the family, and the community. As part of this initiative, BrightFutures: Guidelines for Health Supervision of Infants, Children, and Adolescents (2nd Edition), was devel-oped to provide comprehensive health supervision guidelines, including recommendations on immuniza-tions, routine health screenings, and anticipatory guidance. In the upcoming 3rd Edition, each age stage(infancy, early childhood, middle childhood, and adolescence) is divided into 11 themes. These themescan be found at the beginning of each age stage and are carried throughout each well-child visit. Thethemes are:
• Promoting child development• Promoting family development• Promoting mental health and emotional well-being• Promoting nutritional health• Promoting physical activity• Promoting oral health• Promoting healthy sexuality• Promoting safety and injury prevention• Promoting community relationships and resources• Transitions• Physical examination and screening tests
The new revised guidelines will be available at http://brightfutures.aap.org/web/.
In 2003, the Centers for Medicare and Medicaid Services approved two CPT codesrelated to child development — 96110 for developmental screening and 96111 fordevelopmental testing — thereby forging a path for reimbursement for the servicescovered by these codes.63 Health plans can encourage delivery of standardizeddevelopmental screening by reimbursing providers for codes 96110 and 96111 inaddition to reimbursement for preventive visits. Several BCAP Workgroup partici-pants — Lovelace, Health Plus, Virginia Premier, Managed Health Services, DCChartered, and BCBST — implemented or reinforced provider incentives as a partof their pilot projects.
Lovelace Community Health PlanIn New Mexico, both health risk assessments and developmental questionnaireswere considered part of the EPSDT exam and were not reimbursed separately.Lovelace approached the Medicaid Department of the Health and Human ServicesDepartment (DHHS) and requested permission to reimburse for use of the ASQscreener. Initially, DHHS determined that Lovelace would not receive extra reim-bursement from the state and thought that Lovelace could reimburse for the ASQscreener as an enhancement to its services.
The Lovelace BCAP team presented an economic justification to the MedicalDirector of Lovelace Health Plan. They showed that the average age of referral tothe Family Infant Toddler program was 17 months and that most children were inthe program for two years. They convinced the leadership at Lovelace that encour-aging early screening through the ASQ could possibly improve the early referralrate to FIT and save unnecessary costs on more complex therapies and services at alater age. Lovelace saw the potential to reduce costs to the health plan and decid-ed to pilot a reimbursement of $10 per questionnaire at the pilot sites. This incen-tive led to improved screening and referral rates and, as a result, the reimbursementwas expanded to all Medicaid providers at Lovelace. In addition, Lovelace wentback to DHHS and convinced state policy makers to reimburse an additionalamount ($14) for standardized developmental testing.
Health PlusHealth Plus sought to increase physician awareness of the need for developmentalscreenings as part of well-child visits and added an incentive of $25 for physicianswho submitted claims for developmental screening and testing. The plan promotedthis new incentive through letters to providers serving children at risk for develop-mental delay and also through two articles in a quarterly provider newsletter. Theplan reports that these efforts doubled their developmental screening claims duringtheir pilot phase. There was also a 26 percent increase in preventive visits for chil-dren between the ages of 12 months and four years. Through the pilot project,Health Plus learned that increasing physician awareness and providing monetaryincentives can help ensure that infants receive developmental screening as part ofthe preventive exam. Because of the success of the pilot project, Health Plus per-manently extended the intervention to all providers.
37
ReimbursementforDevelopmentalScreening andTesting
Section 6
63 M. Macias and L. Wegner, “Coding Conundrums - Screening and Developmental Testing Codes,” March 2005, www.dbpeds.org/articles/detail.cfm?TextID=384.

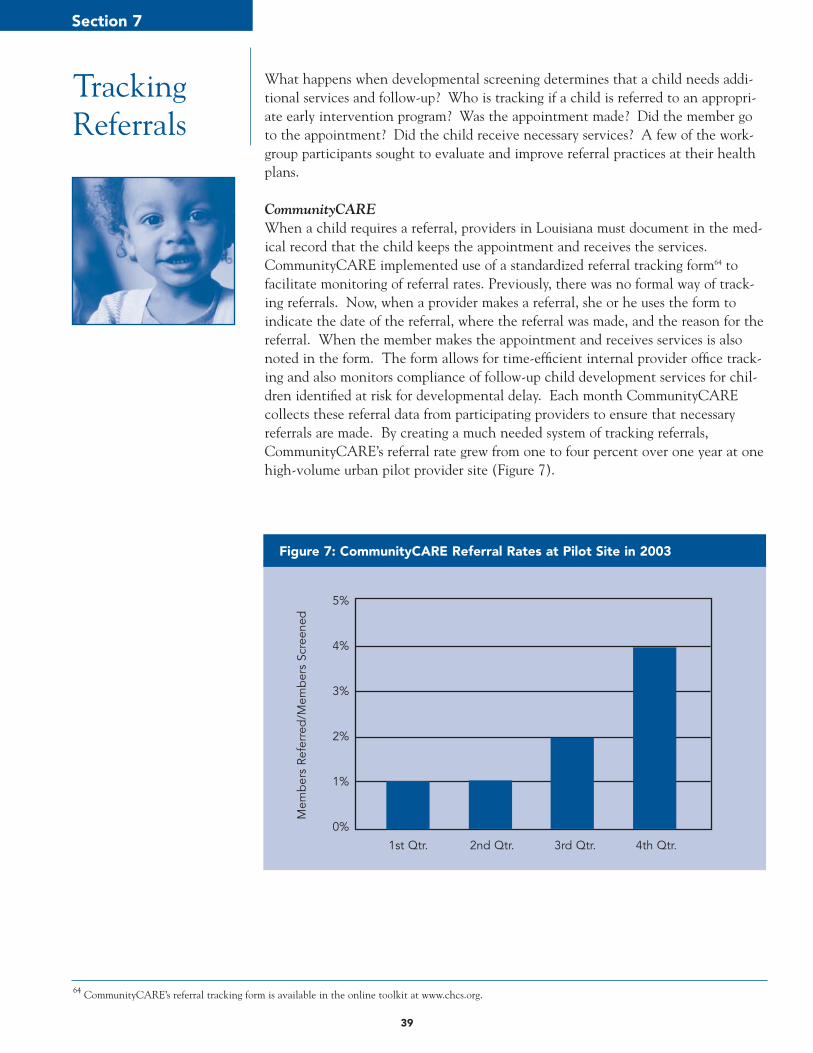
39
What happens when developmental screening determines that a child needs addi-tional services and follow-up? Who is tracking if a child is referred to an appropri-ate early intervention program? Was the appointment made? Did the member goto the appointment? Did the child receive necessary services? A few of the work-group participants sought to evaluate and improve referral practices at their healthplans.
CommunityCAREWhen a child requires a referral, providers in Louisiana must document in the med-ical record that the child keeps the appointment and receives the services.CommunityCARE implemented use of a standardized referral tracking form64 tofacilitate monitoring of referral rates. Previously, there was no formal way of track-ing referrals. Now, when a provider makes a referral, she or he uses the form toindicate the date of the referral, where the referral was made, and the reason for thereferral. When the member makes the appointment and receives services is alsonoted in the form. The form allows for time-efficient internal provider office track-ing and also monitors compliance of follow-up child development services for chil-dren identified at risk for developmental delay. Each month CommunityCAREcollects these referral data from participating providers to ensure that necessaryreferrals are made. By creating a much needed system of tracking referrals,CommunityCARE’s referral rate grew from one to four percent over one year at onehigh-volume urban pilot provider site (Figure 7).
TrackingReferrals
Section 7
64 CommunityCARE’s referral tracking form is available in the online toolkit at www.chcs.org.
Figure 7: CommunityCARE Referral Rates at Pilot Site in 2003
5%
4%
3%
2%
1%
0%
1st Qtr. 2nd Qtr. 3rd Qtr. 4th Qtr.
Mem
ber
s Re
ferr
ed/M
emb
ers
Scre
ened
40
LovelaceLovelace participated in New Mexico’s Senate Joint Memorial Task Force to exam-ine appropriateness and timeliness of referrals to the Family Infant Toddler program,New Mexico’s early intervention program. This 35-member task force includedmedical personnel, Family Infant Toddler program providers, parents of childrenwith developmental delays, advocates, relevant state personnel, and Lovelace’s med-ical director. The task force identified barriers65 to appropriate and early referrals,developed strategies for addressing those barriers, and prioritized strategies. Thetask force identified four major outcomes and a number of strategies to address eachof the outcomes.
Outcome #1: Training and information for medical providers• Train physicians about how to refer children to the FIT program and the benefits
of early intervention at Grand Rounds, during residency training, and in theiroffices.
• Develop medical society “position statements” endorsing early intervention.
Outcome #2: A statewide public awareness campaign• Create a campaign directed to the general public to provide information on early
brain development from birth to age three and the importance of intervention if achild has a developmental delay.
Outcome #3: Developmental screenings and referrals to the FIT program• Promote use of developmental screening tools at medical providers’ offices.• Clarify and streamline the FIT referral process.• Emphasize that a referral to the FIT program is a referral for a “developmental
evaluation” and that the child may or may not need ongoing FIT program services.• Recommend modifications to the Medicaid Early and Periodic Screening and
Diagnostic Testing to emphasize child development.• Explore reimbursement possibilities for physicians to conduct developmental
screening.• Promote existing databases to identify children with conditions that place them
at high risk for developmental delays.• Pilot use of a FIT Developmental Specialist placed in medical offices to conduct
developmental screening.
Outcome #4: Effective communication with providers• Encourage input from medical providers on FIT services.• Follow-up with findings after referrals are received.• Recommend to Governor’s office that a representative of the Pediatric Society be
added to the Interagency Coordinating Council for infants and toddlers.
65 A list of barriers identified by Lovelace is available in the online toolkit at www.chcs.org.
41
CHCS EPSDT Modernization InitiativeIn partnership with the George Washington University Center on Health PolicyResearch, CHCS is working to modernize how Early and Periodic Screening,Diagnosis, and Treatment (EPSDT) services are accessed, financed, delivered andmonitored. Families and providers are faced with many challenges in receivingand delivering the numerous services that fall under EPSDT. Several criticalchanges have occurred since the inception of EPSDT, such as the evolution ofmanaged care, a change in the role of the public health system, increasing stateand federal fiscal pressures, and changes in our understanding of effective childhealth and development services. CHCS’ EPSDT initiative will develop a set ofpolicy and procedural recommendations that address key deficiencies in the cur-rent system and give child-serving agencies and managed care organizations con-crete tools to re-orient EPSDT toward integrated service provision, continuousquality improvement, and measuring key health outcomes. The proposed recom-mendations will be tested in partnership with at least one state, its managed carecontractors, and providers in a model demonstration project.
CHCS’ EPSDT initiative is funded by the Commonwealth Fund, The David andLucille Packard, The Annie E. Casey, and The Robert Wood Johnson Foundations.
More information about CHCS’ EPSDT initiative can be found at www.chcs.org

43
Like many quality improvement efforts undertaken by health plans, it may be diffi-cult to demonstrate a traditional financial return on investment for activitiesdesigned to improve the quality of child developmental services. Nonetheless, theexperience of health plans in the BCAP Workgroup on Enhancing ChildDevelopment Services in Medicaid Managed Care suggests that there is the potentialfor significant improvements worthy of health plan investment:
• All plans recognized the opportunity to improve health and socioeconomic out-comes for children who are screened earlier, identified as having a developmentaldelay, referred, and treated in a timely fashion.
• Several health plans were able to improve their HEDIS measures for well-childvisit rates and member satisfaction. These measures are used by Medicaid stateagencies in determining their contracting choices and by members when makingenrollment choices. In the case of DC Chartered, improving well-visit ratesallows the health plan to avoid penalties given if a plan demonstrates poor perfor-mance.
• Improving quality of child development services can lead to recognition and rep-utational value for health plans as leaders in quality improvement by purchasers,policy makers, and other health plans. Molina Healthcare of Michigan receivedthe Michigan Association of Health Plans Pinnacle Award for their “BabystepsToward Health” program. State policy makers in New Mexico approved addition-al reimbursement for developmental screening and testing as a result of LovelaceHealth Plan’s quality improvement efforts.
• Improving services for Medicaid recipients often leads to improved services for allplan members as a result of practice and plan-wide enhancements. BlueCrossBlueShield of Tennessee providers are now encouraged to use standardized screen-ing tools for their entire patient population. Louisiana’s screening documentationflowsheet has been applied universally for all well-visits.
• Lessons learned can be transferred to other population groups served by thehealth plan. Molina Healthcare of Michigan is using the BCAP QualityFramework for a statewide lead screening program and also is planning to use theBCAP approach for mammography reminders and cervical cancer screeningreminders.
• Programs developed for one purpose or population can positively impact otherpopulations. Molina’s M.O.M. (Moms of Molina) program was created to identifypregnant women to promote the value of timely EPSDT services, but also servedto improve identification of pregnant women for Molina’s prenatal program.
Beyond a clear financial return, there are clearly many cases to be made to invest inenhancing child development services in Medicaid. A healthier population with aresulting higher quality of life will continue to be the ultimate reward for healthplans that invest in children’s health quality as well as for society at large.
Conclusion:What is theReturn onInvestmentfor HealthPlans?
Section 8
44
APPLYING THE BCAP QUALITY FRAMEWORK
The previous sections highlight general areas where health plans can implementinterventions to improve early childhood development assessment and screeningwithin their enrollee populations. The following case studies detail how threeplans used the BCAP Quality Framework to structure quality improvement activi-ties:
• Molina Healthcare of Michigan• BlueCross BlueShield of Tennessee• Lovelace Community Health Plan
Section 9
CaseStudies
45
I Molina Healthcare of Michigan
Molina Healthcare of Michigan developed a pilot program, “Baby Steps TowardsHealth,” to increase Early and Periodic Screening, Diagnosis, and Treatment (EPSDT)visits for children from birth to age three. Molina's BCAP pilot project goal was toincrease the number of EPSDT visits for children from birth to age three to 80 percentby linking the member, practitioner, and health plan as well as increasing parentinvolvement. Through outreach to members, Molina sought to educate parents aboutthe importance of well-child visits and provide age-specific information on what toexpect during each well-child visit. The project also included provider education aboutEPSDT components, proper documentation, coding, and referral sources for childrenwith developmental delays. Provider offices were asked to provide a developmentalassessment during the members’ regularly scheduled EPSDT visits. The pilot project,implemented July through December 2003 in Kent County, Michigan, involved 1,537children from 11 provider offices. Prior to the “Baby Steps Towards Health” pilot,Molina’s EPSDT rate for children from birth to age three was 46 percent (January –July2003). The pilot program increased the EPSDT rate for this age group to 76 percent.
IDENTIFICATION
To improve delivery of EPSDT services and developmental screening, Molina set a goalto identify all children, from birth to age three, as well as all expectant mothers. Molinadeveloped an EPSDT database to facilitate identification and began efforts in KentCounty, which was targeted because of its high volume of practitioners and members(23 percent of Molina’s membership) as well as established community resources.
Aim:1. To identify 100 percent of children in Kent County, from birth to age three, enrolled
in Molina Healthcare of Michigan.2. To identify 100 percent of expectant mothers in Kent County enrolled in Molina
prior to delivery.
Measure:1. Children, age 0-3 years, in Kent County, enrolled in Molina Healthcare
All children, age 0-3 years, enrolled in Molina Healthcare
2. # of expectant mothers identified prior to delivery in Kent County, enrolled in Molina Healthcare# of deliveries in Kent County, enrolled in Molina Healthcare
Change:Molina implemented the following strategies to improve identification of children, frombirth to age three:
• Developed an EPSDT database to generate a monthly list of children in need ofEPSDT services. The database generates an age-specific list of members by countyand displays the age at which the child’s next EPSDT visit is due.
• Created a newborn notification form for Utilization Management nurses. This infor-mation was then forwarded to Molina’s Education Department. Newborns wereadded to the program after the health plan received their identification number fromthe state.
46
I Molina Healthcare of Michigan
• Sent a letter to mothers of newborns in Kent County in their welcome packet askingthem to call Member Services and select a primary care provider as soon as possible.If the mother selected a provider site that was participating in the pilot project, shewas sent the program materials.
To identify expectant mothers, a Maternal Child Nurse was hired in August 2003 toimplement a new program (M.O.M.- Moms of Molina) to identify and provide educa-tional information to pregnant members.
Results: Through these efforts, Molina identified 1,537 children, birth to age three, who wereeligible for the pilot program in Kent County. In addition, Molina increased identifica-tion of expectant mothers from 33 percent at the beginning of the pilot period tomore than 90 percent by August of 2004.
STRATIFICATION
Molina set a goal to identify 100 percent of children, from birth to age three, who hadno EPSDT visits or only one EPSDT visit. The EPSDT database used claims data toautomatically stratify and identify children in need of EPSDT services.
Aim:Stratify 100 percent of children in Kent County identified by claims data as either hav-ing at least one EPSDT visit or having no EPSDT visits.
Measure:# of children in the Kent County pilot with at least one EPSDT visitTotal # of children in Kent County
# of children in the Kent County pilot with no EPSDT visitTotal # of children in Kent County
Change:To stratify children, from birth to age three, Molina developed a database of childrenneeding an EPSDT screen. The database was updated monthly by EducationDepartment staff.
Results: During the initial pilot phase, from July 2003 to November 2003, Molina increased theidentification of children with at least one EPSDT visit from 46 percent to 72 percent.
Stratification July 2003 Nov 2003
# of children with EPSDT visit 527 = 46.3% 624 = 72.3%Total number of children 1,137 862
# of children with no EPSDT visit 610 = 53.6% 238 = 27.6%Total number of children 1,137 862
47
I Molina Healthcare of Michigan
OUTREACH
MEMBER OUTREACHMolina set a goal to provide education regarding developmental milestones and whatto expect during the well-child visit to 90 percent of parents in the pilot program.
Aim:Educate 90 percent of parents in the pilot program about developmental milestones.
Measure:Contact rate = # of successful follow-up calls to parents of children who had no visit
# of parents attempted to reach by phone
Successful mail rate = # mailed - # returnedTotal # mailed
Change:Molina implemented the following outreach strategies to educate families aboutEPSDT services and well-child visits:
• Sent letters to all parents providing education about developmental milestones. • Sent reminder letters, along with age-specific developmental milestone information,
to parents of children who were overdue for well-child visit. Letters were mailedevery 60 days or until the child received all recommended EPSDT visits.
• Made phone calls to parents of children with no well-child visits to schedule a pre-ventive care visit.
• Attempted to correct addresses on all returned pilot project mailings. When letterswere returned, Education Department staff checked the system for a second address,and, if found, materials were re-mailed. This second mailing included a note request-ing the member to call the plan to verify the correct address.
Results: Molina achieved a 33 percent contact rate for these calls. Due to the low success rateof telephone outreach for their population, Molina focused on mailing address confir-mation. Taking the extra step of confirming addresses paid off: Molina achieved a96.7 percent successful mail rate for the pilot program.
PROVIDER OUTREACH Molina set out to improve provider awareness of well-child care and developmentalscreening practices. Molina identified 11 provider offices in Kent County to serve aspilot sites. These practices represented a diverse membership in both urban and ruralservice areas.
Aim:Conduct provider site training sessions on EPSDT components, proper documentation,coding, and referral sources for children with developmental delays at 100 percent ofthe participating provider offices.
Measure:# PCPs who attended provider training sessionsTotal # provider offices in Kent County participating in the project
48
I Molina Healthcare of Michigan
Change:Education Department staff conducted training sessions for provider office staff at all11 identified provider practices. To ensure buy-in from providers, Molina's ProviderService Representative spoke with practitioner office staff about the pilot project priorto the training to allow them to give the plan feedback on the format of the session.Training focused on the importance of detecting developmental delays early, referralsources for children with developmental delays, EPSDT visit components, proper docu-mentation, and coding of EPSDT/Well-Child visits.
Communication was frequent to the provider pilot sites throughout the project.Program progress letters were sent to each provider site at two months and fivemonths into the program. The letter included a report indicating the number of check-off slips received verifying the developmental screening and referrals for follow-up ifapplicable.
INTERVENTION
To increase the number of infants and toddlers receiving appropriate well-child visits,Molina implemented strategies to educate members about the importance of preven-tive care and to help them recognize warning signs of potential problems in their child’sdevelopment. The plan also developed provider materials to facilitate developmentalscreening within EPSDT visits and assist in referrals.
Aim: 1. To ensure that 80 percent of Molina members in Kent County, from birth to age
three, have an appropriate EPSDT visit.
2. To track and improve the number of children who received developmental screens and referrals through claims data.
Measure: 1. # children identified needing EPSDT visit sent reminder letter and program materials
Total # of children due or overdue for an EPSDT visit
# of EPSDT claims (July – Nov 2003)Total # of children due or overdue for an EPSDT visit
2. # of developmental screenings# of EPSDT visits identified from claims/encounter data
# of referrals#of screenings
Change:Molina implemented the following member and provider education strategies toincrease the number of children, from birth to age three, who received EPSDT screen-ings and appropriate developmental screenings:
49
MEMBER EDUCATIONMolina developed an age-specific educational mailing for parents that explained thecomponents of the EPSDT exam, provided health tips and milestones, and offered theincentive of a baby board book for members who scheduled well-child visits. The mail-ing included a tear-off form for members to take to the provider’s office. During thevisit the provider office completed the form, indicating services rendered, develop-mental screening performed, tests performed, and referral(s) made, and sent it toMolina. Upon receipt of the form, Molina sent a board book as a gift to parents fortheir child. Between July through December 2003, 833 books were mailed.
PROVIDER EDUCATIONMolina developed educational materials for provider offices on EPSDT components,coding, and referral sources for children with developmental delays. Providers receivedthe following laminated sheets:
• Overview that explains components of EPSDT exam, additional services required forMedicaid recipients, proper CPT codes, billing instructions, referral sources for chil-dren with developmental delays, program outline, and plan contact numbers.
• List of CPT codes to bill for the EPSDT exam.• EPSDT schedule of services.• Summary of developmental assessment tools, including information on the specificity
and sensitivity of the tool, the age groups covered by the tool, a description of thetool, the cost, length of time to complete, and where to purchase the tool.
Molina worked with the Kent County Health Department to develop a list of area orga-nizations that provide services to children with developmental delays. Each pilot sitewas given information on area referral sources. Molina found that some of the officeswere not aware of or were not familiar with other referral sources that address theneeds of children under the age of three. All offices were provided with contact infor-mation and a summary of the services available for children three and under.
OVERALL PROGRAM RESULTSAt the end of the six-month pilot program, Molina’s EPSDT rate for children from birthto age three increased from 46 percent to 76 percent. Twelve children (5.6 percent)were identified through developmental screening and were referred for follow-up inter-vention. Additionally, the EPSDT exam rate for three-year-olds rose from 46 percent to63 percent.
SUSTAINING AND DIFFUSING THE PROGRAMBased on its success in increasing EPSDT rates, the “Baby Steps Towards Health”Program was incorporated into Molina’s existing statewide EPSDT reminder program.As of February 2004, children from birth to age three (13,000 members) due for anEPSDT visit are mailed a Well-Child Visit Sheet providing age specific informationabout the components of the EPSDT visit, information about any immunizations/testsdue, and developmental milestones. In the mailing, parents are asked to schedule anappointment and bring a list of their questions or concerns to the well-child visit. Visit
I Molina Healthcare of Michigan
sheets are mailed at least 30 days prior to the recommended EPSDT visit for childrenfrom birth to 18 months, and every 60 days to children age 20 to 36 months who aredue/overdue. In March 2004, the program was extended to include four-, five-, andsix-year-olds, bringing the total number of children enrolled to more than 23,000.These age groups were added because Molina's HEDIS scores for well-child visits forchildren, ages four, five, and six, have been below the NCQA 75th percentile.
Although many members appreciated receiving the board books in the initial pilot,Molina found that it was not an effective incentive to encourage parents who wereoverdue in scheduling well-child visits. As a result, Molina will pilot an incentive of a$10 gift certificate to encourage members whose children are overdue for EPSDT visitsand who already have received two reminders to schedule well-child exams.
Molina Healthcare of Michigan also is extending the use of the BCAP QualityFramework to other quality improvement initiatives. The plan will apply BCAP todesign and measure the results of a statewide lead screening program and also isplanning to use the BCAP approach for mammography reminders and cervical cancerscreen reminders.
50
I Molina Healthcare of Michigan
51
II BlueCross BlueShield of Tennessee
BlueCross BlueShield of Tennessee (BCBST) set an overall aim to encourage moreproviders to perform standardized developmental screening in children, age six to 36months, during preventive visits. BCBST used the BCAP Typology to stratify “high-leverage” primary care providers (PCPs) by number of preventive visits and by preven-tive visits with standardized developmental screening. BCBST defined high-leverageas providers identified as both “high-volume” and “high-opportunity.” High-volumeequals PCPs with 100 or more preventive visits per year. High-opportunity equalsPCPs with fewer than 50 percent of preventive visits inclusive of a standardized devel-opmental screening.
During the pilot phase, outreach nurses from BCBST, called Regional Clinical NetworkAnalysts (RCNA), visited 34 high-leverage sites to train providers on how to administer,score and submit reimbursement for the PEDS tool. The screening rate for these high-leverage providers increased from 0 to 43.5 percent during the pilot phase. Becauseof the potential realized after the initial BCBST pilot, the Tennessee Chapter of theAmerican Academy of Pediatrics now trains on EPSDT at provider sites throughout thestate.
IDENTIFICATION
BCBST set a goal to identify all preventive care visits for members, age six to 36months, to determine which members were not receiving standardized developmentalscreening, as well as which providers were providing preventive care.
Aims:1. Identify 100 percent of preventive visits for members age six to 36 months.2. Identify the percentage of preventive visits by PCPs for members age six to 36
months for which standardized developmental screening was performed.3. Identify the PCPs who perform preventive visits for members age six to 36 months.
Measures:1. # of preventive visits for members age six to 36 months = 5,934
2. # of preventive visits for members age six to 36 months with standardized developmental screening = 528# of preventive visits for members age six to 36 months 5,934
Percent of preventive visits with concurrent screen = (528/5,934)*100 = 8.9%
3. # of PCPs performing preventive visits in members age six to 36 months = 114
52
IIChange:BlueCross BlueShield of Tennessee implemented the following strategies to improvetracking of preventive visits and developmental screens performed by PCPs for chil-dren age six-36 months of age:
• Conducted quarterly queries of claims database. Analysis of the claims data includ-ed PCP number, PCP name, PCP specialty description, # of preventive visits withstandardized developmental screen by same PCP, # of preventive visits, date andregion.
• Used CPT codes (99381, 99382, 99391, 99392) to identify preventive visits and CPT96110 to identify standardized developmental screen for children six to 36 months ofage.
• Made analytical comparisons for each provider whose name appeared in the quarter-ly claims queries.
Accomplishment:Through this effort, BCBST was able to identify the percentage of providers who wereand were not conducting a standardized developmental screening in their EPSDT preventive visit. Of the 5,934 preventive visits performed by 114 PCPs, only 528 (8.9percent) documented a standardized developmental screen at the time of the preventive visit, suggesting an opportunity for improvement.
STRATIFICATION
BCBST set a stratification goal to identify “high-leverage” providers, that is thoseproviders with high volume of preventive visits each year and a weak track record ofperforming standardized developmental screening. Through this unique stratificationapproach, the plan identified 34 “high-leverage” providers to target for additionalintervention.
Aim:Stratify 100 percent of PCPs by number of preventive visits and by percentage of pre-ventive visits with standardized developmental screen to determine “high-leverage”PCPs, those physicians stratified as both high-volume and high-opportunity.
Working Definitions:• “High-Volume” = PCPs with 100 or greater preventive visits per year.• “High-Opportunity” = PCPs with fewer than 50 percent of preventive visits with
standardized developmental screen.• “High-Leverage” = PCPs who are stratified as both high-volume and high-opportunity.
Measures:# of “High-Volume” PCPs# of “High-Opportunity” PCPs# of “High-Leverage” PCPs = High-Volume PCPs + High-Opportunity PCPs
BlueCross BlueShield of Tennessee
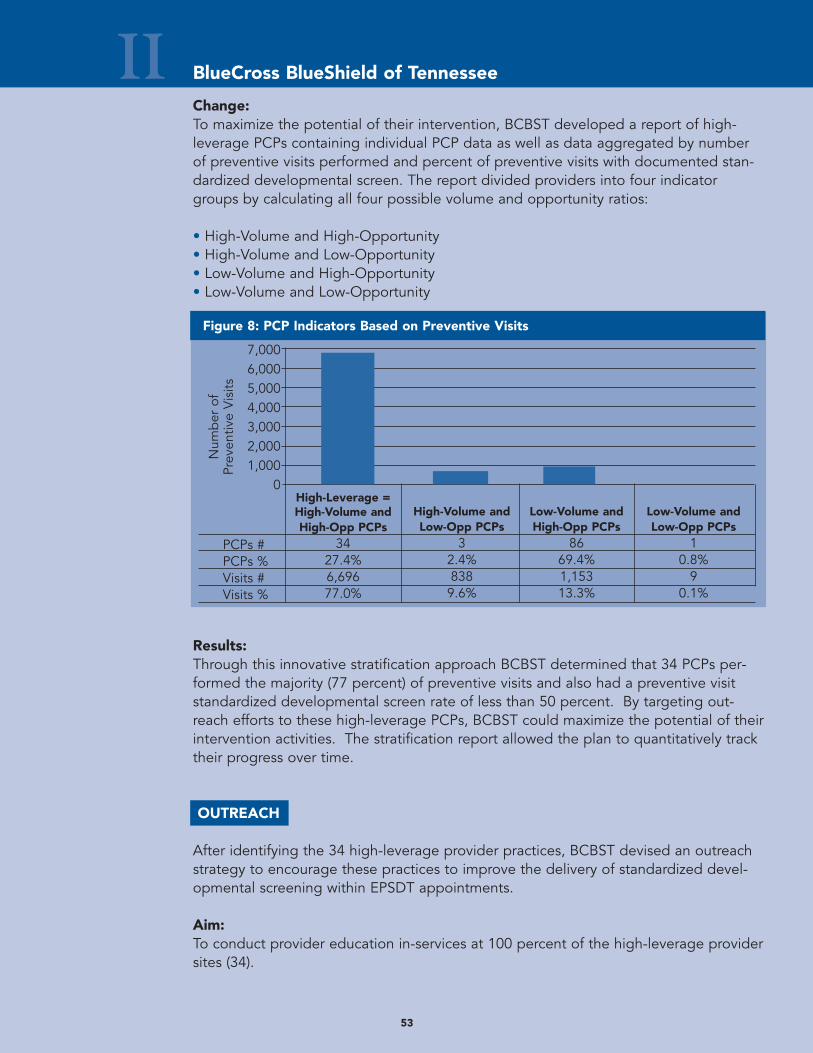
53
II
Figure 8: PCP Indicators Based on Preventive Visits
7,0006,0005,0004,0003,0002,0001,000
0
PCPs #PCPs %Visits #Visits %
Num
ber
of
Prev
entiv
e V
isits
Change:To maximize the potential of their intervention, BCBST developed a report of high-leverage PCPs containing individual PCP data as well as data aggregated by numberof preventive visits performed and percent of preventive visits with documented stan-dardized developmental screen. The report divided providers into four indicatorgroups by calculating all four possible volume and opportunity ratios:
• High-Volume and High-Opportunity• High-Volume and Low-Opportunity• Low-Volume and High-Opportunity• Low-Volume and Low-Opportunity
Results:Through this innovative stratification approach BCBST determined that 34 PCPs per-formed the majority (77 percent) of preventive visits and also had a preventive visitstandardized developmental screen rate of less than 50 percent. By targeting out-reach efforts to these high-leverage PCPs, BCBST could maximize the potential of theirintervention activities. The stratification report allowed the plan to quantitatively tracktheir progress over time.
OUTREACH
After identifying the 34 high-leverage provider practices, BCBST devised an outreachstrategy to encourage these practices to improve the delivery of standardized devel-opmental screening within EPSDT appointments.
Aim:To conduct provider education in-services at 100 percent of the high-leverage providersites (34).
BlueCross BlueShield of Tennessee
High-Volume andLow-Opp PCPs
32.4%8389.6%
Low-Volume andHigh-Opp PCPs
8669.4%1,15313.3%
Low-Volume andLow-Opp PCPs
10.8%
90.1%
High-Leverage =High-Volume andHigh-Opp PCPs
3427.4%6,69677.0%
54
IIMeasure:# of high-leverage providers receiving educational in-service# of high-leverage providers
Change:BCBST made the following changes to facilitate training and outreach to the identifiedhigh-leverage provider sites:
• Distributed stratification report to nurse outreach worker.• Modified PCP contact database to include standardized developmental screening
field.• Developed training packets for the nurse outreach worker to use when visiting PCP
offices. The training covered background on the PEDS screening tool, how andwhen to administer it, and the reimbursement process.
• The nurse outreach worker contacted each PCP office by phone and conducted atleast one in-service at each site.
Results:All (100 percent) of the 34 high-leverage providers and their office staffs received aneducational in-service. Providers and office staff learned how to obtain the PEDS testand additional information was included to assist with referrals for problems identifiedthrough the PEDS test, if necessary. The training packet included contact informationfor the Tennessee Early Intervention System, which offers a directory of programs,resources, and professionals for infants and toddlers with disabilities and their families.
INTERVENTION
BCBST set a goal to ensure that all identified high-leverage providers perform a stan-dardized developmental screening within at least half of their pediatric preventive carevisits for children, age six- to 36-months.
Aim:To ensure that 100 percent of high-leverage PCPs perform a standardized develop-mental screening as part of preventive visit at least 50 percent of the time.
Measure:# of high-leverage PCPs with greater than 50 percent rate for standardized
developmental screening# of high-leverage PCPs
BlueCross BlueShield of Tennessee
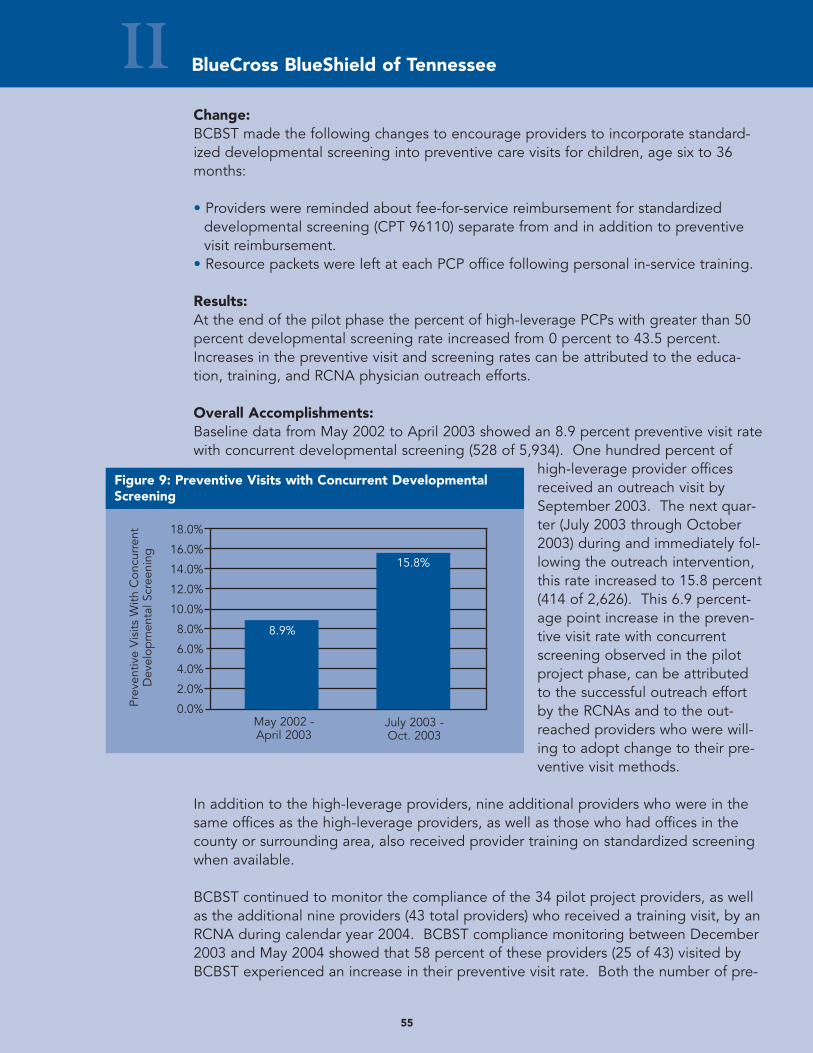
55
Change:BCBST made the following changes to encourage providers to incorporate standard-ized developmental screening into preventive care visits for children, age six to 36months:
• Providers were reminded about fee-for-service reimbursement for standardizeddevelopmental screening (CPT 96110) separate from and in addition to preventivevisit reimbursement.
• Resource packets were left at each PCP office following personal in-service training.
Results:At the end of the pilot phase the percent of high-leverage PCPs with greater than 50percent developmental screening rate increased from 0 percent to 43.5 percent.Increases in the preventive visit and screening rates can be attributed to the educa-tion, training, and RCNA physician outreach efforts.
Overall Accomplishments:Baseline data from May 2002 to April 2003 showed an 8.9 percent preventive visit ratewith concurrent developmental screening (528 of 5,934). One hundred percent of
high-leverage provider officesreceived an outreach visit bySeptember 2003. The next quar-ter (July 2003 through October2003) during and immediately fol-lowing the outreach intervention,this rate increased to 15.8 percent(414 of 2,626). This 6.9 percent-age point increase in the preven-tive visit rate with concurrentscreening observed in the pilotproject phase, can be attributedto the successful outreach effortby the RCNAs and to the out-reached providers who were will-ing to adopt change to their pre-ventive visit methods.
In addition to the high-leverage providers, nine additional providers who were in thesame offices as the high-leverage providers, as well as those who had offices in thecounty or surrounding area, also received provider training on standardized screeningwhen available.
BCBST continued to monitor the compliance of the 34 pilot project providers, as wellas the additional nine providers (43 total providers) who received a training visit, by anRCNA during calendar year 2004. BCBST compliance monitoring between December2003 and May 2004 showed that 58 percent of these providers (25 of 43) visited byBCBST experienced an increase in their preventive visit rate. Both the number of pre-
II BlueCross BlueShield of Tennessee
Figure 9: Preventive Visits with Concurrent DevelopmentalScreening
18.0%
16.0%
14.0%
12.0%
10.0%
8.0%
6.0%
4.0%
2.0%
0.0%Prev
entiv
e V
isits
With
Con
curr
ent
Dev
elop
men
tal S
cree
ning
May 2002 -April 2003
July 2003 -Oct. 2003
8.9%
15.8%
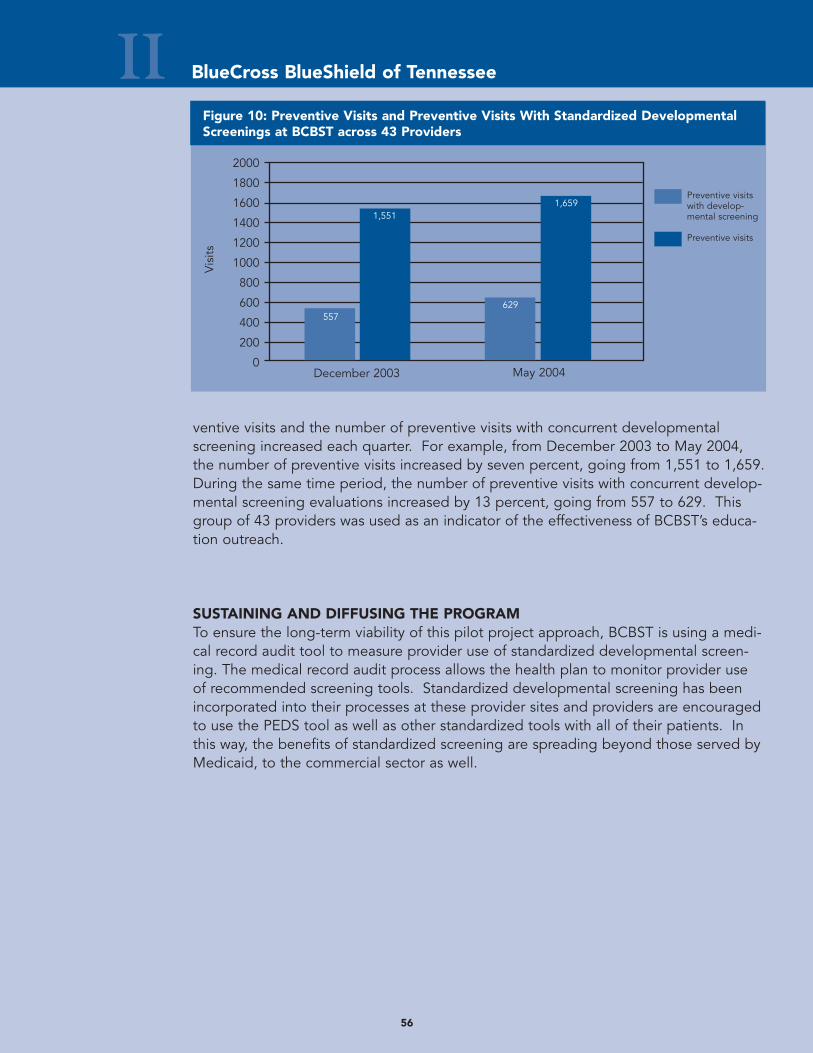
56
ventive visits and the number of preventive visits with concurrent developmentalscreening increased each quarter. For example, from December 2003 to May 2004,the number of preventive visits increased by seven percent, going from 1,551 to 1,659.During the same time period, the number of preventive visits with concurrent develop-mental screening evaluations increased by 13 percent, going from 557 to 629. Thisgroup of 43 providers was used as an indicator of the effectiveness of BCBST’s educa-tion outreach.
SUSTAINING AND DIFFUSING THE PROGRAMTo ensure the long-term viability of this pilot project approach, BCBST is using a medi-cal record audit tool to measure provider use of standardized developmental screen-ing. The medical record audit process allows the health plan to monitor provider useof recommended screening tools. Standardized developmental screening has beenincorporated into their processes at these provider sites and providers are encouragedto use the PEDS tool as well as other standardized tools with all of their patients. Inthis way, the benefits of standardized screening are spreading beyond those served byMedicaid, to the commercial sector as well.
II BlueCross BlueShield of Tennessee
Figure 10: Preventive Visits and Preventive Visits With Standardized DevelopmentalScreenings at BCBST across 43 Providers
2000
1800
1600
1400
1200
1000
800
600
400
200
0December 2003
Vis
its
May 2004
Preventive visitswith develop-mental screening
Preventive visits
557
1,551
629
1,659
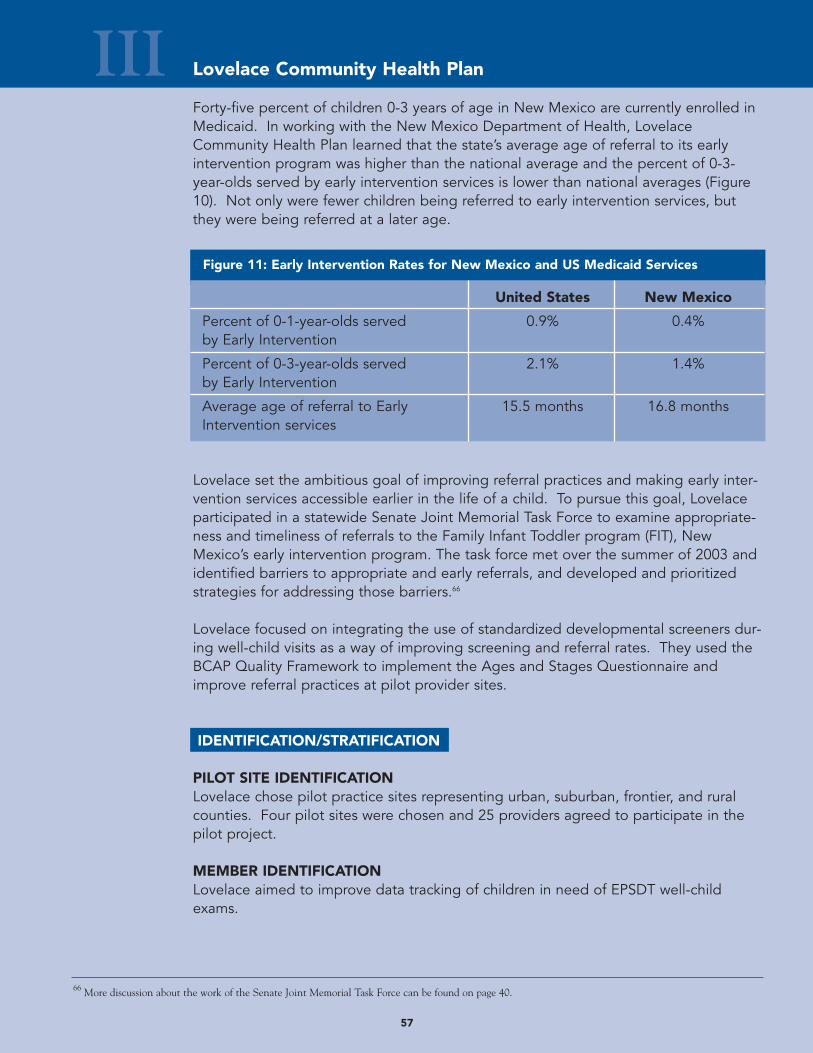
57
III Lovelace Community Health Plan
Forty-five percent of children 0-3 years of age in New Mexico are currently enrolled inMedicaid. In working with the New Mexico Department of Health, LovelaceCommunity Health Plan learned that the state’s average age of referral to its earlyintervention program was higher than the national average and the percent of 0-3-year-olds served by early intervention services is lower than national averages (Figure10). Not only were fewer children being referred to early intervention services, butthey were being referred at a later age.
Lovelace set the ambitious goal of improving referral practices and making early inter-vention services accessible earlier in the life of a child. To pursue this goal, Lovelaceparticipated in a statewide Senate Joint Memorial Task Force to examine appropriate-ness and timeliness of referrals to the Family Infant Toddler program (FIT), NewMexico’s early intervention program. The task force met over the summer of 2003 andidentified barriers to appropriate and early referrals, and developed and prioritizedstrategies for addressing those barriers.66
Lovelace focused on integrating the use of standardized developmental screeners dur-ing well-child visits as a way of improving screening and referral rates. They used theBCAP Quality Framework to implement the Ages and Stages Questionnaire andimprove referral practices at pilot provider sites.
IDENTIFICATION/STRATIFICATION
PILOT SITE IDENTIFICATIONLovelace chose pilot practice sites representing urban, suburban, frontier, and ruralcounties. Four pilot sites were chosen and 25 providers agreed to participate in thepilot project.
MEMBER IDENTIFICATIONLovelace aimed to improve data tracking of children in need of EPSDT well-childexams.
Figure 11: Early Intervention Rates for New Mexico and US Medicaid Services
United States New Mexico
Percent of 0-1-year-olds served 0.9% 0.4%by Early Intervention
Percent of 0-3-year-olds served 2.1% 1.4%by Early Intervention
Average age of referral to Early 15.5 months 16.8 monthsIntervention services
66 More discussion about the work of the Senate Joint Memorial Task Force can be found on page 40.
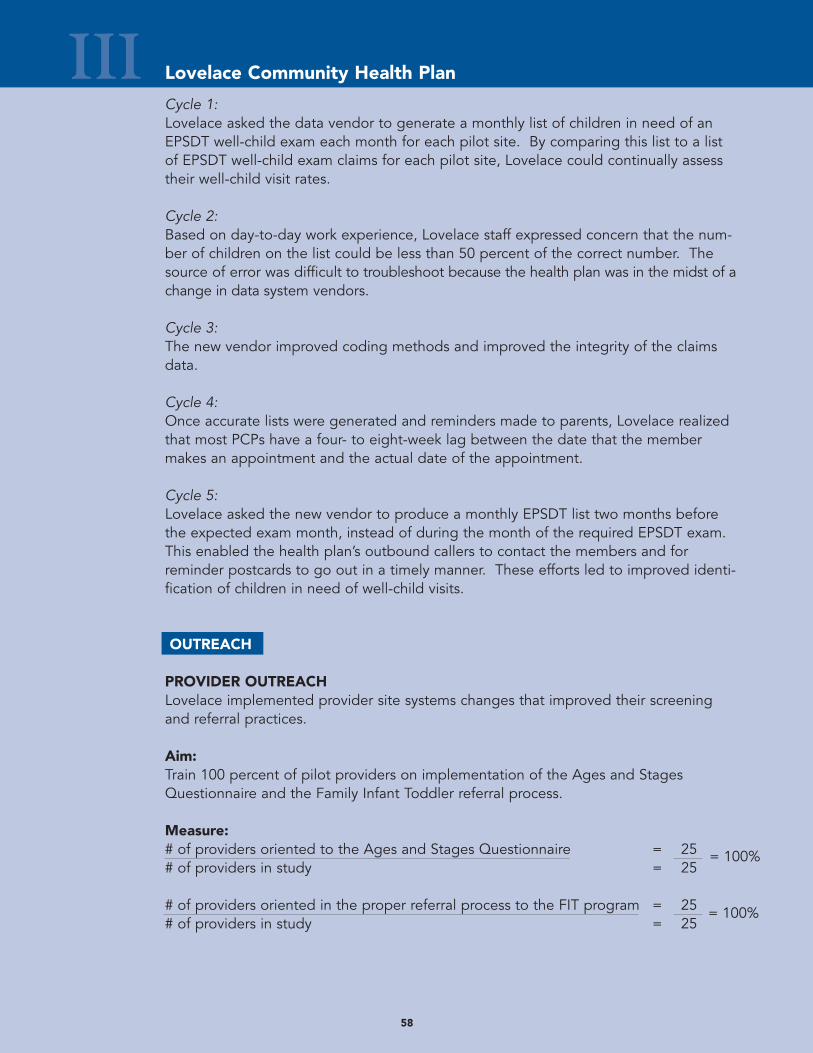
58
III Lovelace Community Health Plan
Cycle 1:Lovelace asked the data vendor to generate a monthly list of children in need of anEPSDT well-child exam each month for each pilot site. By comparing this list to a listof EPSDT well-child exam claims for each pilot site, Lovelace could continually assesstheir well-child visit rates.
Cycle 2:Based on day-to-day work experience, Lovelace staff expressed concern that the num-ber of children on the list could be less than 50 percent of the correct number. Thesource of error was difficult to troubleshoot because the health plan was in the midst of achange in data system vendors.
Cycle 3:The new vendor improved coding methods and improved the integrity of the claimsdata.
Cycle 4:Once accurate lists were generated and reminders made to parents, Lovelace realizedthat most PCPs have a four- to eight-week lag between the date that the membermakes an appointment and the actual date of the appointment.
Cycle 5:Lovelace asked the new vendor to produce a monthly EPSDT list two months beforethe expected exam month, instead of during the month of the required EPSDT exam.This enabled the health plan’s outbound callers to contact the members and forreminder postcards to go out in a timely manner. These efforts led to improved identi-fication of children in need of well-child visits.
OUTREACH
PROVIDER OUTREACH Lovelace implemented provider site systems changes that improved their screeningand referral practices.
Aim:Train 100 percent of pilot providers on implementation of the Ages and StagesQuestionnaire and the Family Infant Toddler referral process.
Measure:# of providers oriented to the Ages and Stages Questionnaire = 25 # of providers in study = 25
# of providers oriented in the proper referral process to the FIT program = 25# of providers in study = 25
= 100%
= 100%
59
III Lovelace Community Health Plan
Change:Lovelace held lunch trainings at each of the four provider sites. All 25 providerswere trained across the sites. Lovelace’s Medical Director discussed New Mexico’slow referral rates and provided information about how to implement the ASQ tooland how Lovelace would help providers navigate the FIT referral process. The follow-ing system changes were implemented to improve screening and referral practices:
• The receptionist hands out the ASQ tool to the caregiver to be filled out in thewaiting room prior to selected (six-, 12-, 18-, and 24-month) well-visits as well aswhenever the caregiver or provider has a concern.
• The provider reviews the questionnaire with the caregiver during the well-visit exam.• Through a “fax-back program” office staff bundle all score sheets indicating rea-
son for follow-up evaluation and fax them to Lovelace weekly.• Health plan Outbound Caller contacts the caregivers of children who are eligible
for a FIT evaluation and helps the caregiver set up an appointment.• The Outbound Caller contacts FIT and provides them with the scoring sheet. • The Outbound Caller follows-up with the caregiver after the appointment to
ensure that the child has been evaluated.• If the family misses an appointment, it is referred to case management for further
intervention.
Results:Lovelace purchased the ASQ screening tool and manual and made copies for eachof their pilot sites. Through hands-on training, providers learned how standardizedscreening could easily be incorporated in well-child care visits. Providers respondedpositively and continue to use the ASQ screener with all of their patients.
The fax-back program proved to be difficult for providers over time and Lovelacehad a low fax response rate. This was due to providers dealing with multiple payorsources and serving several non-Lovelace members. The provider site staff found itinefficient to cull out only Lovelace member ASQs. As a result, Lovelace introducedthe idea to the New Mexico Department of Health and Human Services (DHHS). Byimplementing the fax-back program at a state level, providers would be able tosend all score sheets indicating reason for follow-up to a single place. Lovelacedeveloped a list of local FIT providers and covered services specific to each pilotsite. Providers have found this to be very useful in helping families navigate thereferral process.
MEMBER OUTREACH Lovelace set a goal to reach out to members through develop-ment of member education materials and the development of“Well-Visit Round-Up” days at the four pilot sites. Building onLovelace’s existing Healthy Trails Program, the health plan creat-ed a mascot, Hank the Healthy Trails Horse. On monthly Well-Visit Round-Up days, Hank the Horse visits the waiting rooms atthe four pilot sites, armed with health education materials andparental resources on developmental topics such as toilet train-
ing, nutrition, and language and literacy development.
60
III Lovelace Community Health Plan
60
Aim:Engage Lovelace families as partners in the child’s growth and development.
Measure:Number of participants in Well-Visit Round-Up days.
Change:Lovelace implemented the following outreach strategies to educate families aboutEPSDT services and well-child visits:
• Sent well-visit reminder postcards to all caregivers.• Developed and posted posters with Hank the Horse inviting children and caregivers
to Well-Visit Round-Ups in the waiting rooms of each of the four clinic sites.• Developed and distributed caregiver education materials and a Healthy Trails calen-
dar with stickers to indicate important developmental milestones and reminders forwell-visits.
• Called all caregivers of children eligible for EPSDT to encourage participation in“Well-Visit Round-Up” days.
Results:Families and providers have responded positively to Well-Visit Round-Up Days. AtLovelace’s Consumer Advisory meetings, members have expressed that they find themember education materials useful and that their children enjoy Hank the Horse at thedoctor’s office. They also reported that the ASQ screener is easy to fill out while theyare in the waiting room. Lovelace reports that each clinic typically sees 35-45 childrenon Well-Visit Round-Up days.
INTERVENTION
Lovelace implemented a monetary provider incentive as a means of improving theirscreening and referral rates.
Aim:Improve screening and referral rates through provider reimbursement.
Measure:# of children at six, 12, 18 and 24 months of age# of children with EPSDT exams at six, 12, 18 and 24 months of age
# of children with initial FIT evaluation# of children eligible for initial FIT evaluation
# of children served with FIT 0-1 population# of children 0-1 years
# of children served with FIT 0-3 population# of children 0-3 years
61
Lovelace Community Health PlanIIIChange:
Cycle 1:Lovelace approached the Medicaid Department of the Health and Human ServicesDepartment (DHHS) and requested permission to reimburse for use of the ASQscreener.
Cycle 2:DHHS determined that Lovelace would not receive extra reimbursement from the stateand thought that Lovelace could reimburse for the ASQ screener as an enhancementto their services.
Cycle 3:The Lovelace BCAP team presented a convincing economic justification to upper man-agement at Lovelace and as a result, Lovelace decided to pilot a $10 reimbursementper questionnaire only at the pilot sites.
Cycle 5:This incentive led to improved screening and referral rates and, as a result, the reim-bursement was expanded to all Medicaid providers at Lovelace.
Cycle 6:Lovelace went back to DHHS and convinced state policy makers to reimburse an addi-tional amount ($14) for standardized developmental testing.
Results:Providers have responded positively to the additional reimbursement and claims forstandardized developmental screening continue to increase across all provider sites.Lovelace indicates a modest improvement in screening and referral rates. The referralrate measures have been adopted by the State of New Mexico to evaluate their FamilyInfant Toddler program, which will allow Lovelace to compare its results with the state.
SUSTAINING AND DIFFUSING THE PROGRAMPositive provider and member feedback has encouraged Lovelace to spread lessonslearned to provider offices beyond the four pilot sites. Providers at the pilot sites arenow routinely using the ASQ screener and therefore best practices piloted in Medicaidare impacting children from the commercial sector as well. New Mexico’s Departmentof Health and Human Services has also been very interested in the progress demon-strated at Lovelace and is considering implementation of referral fax-back programpiloted at Lovelace at a statewide level. And lastly, Lovelace has extended the success-es of its pilot programs in a variety of ways. Lovelace has made presentations toprovider groups, the Governor’s Cabinet and the Legislature’s Children’s Cabinet aboutthe need to improve child development services in New Mexico and the importance oftimely screening and referrals. These efforts have led to a statewide policy changeand reimbursement for standardized screening.
Directory of Online Toolkit Resources Many of the plans in the BCAP Workgroup on Enhancing ChildDevelopment Services in Medicaid Managed Care used innovative toolsand resources as a part of their quality improvement pilot projects. Thesecan be found in CHCS’ online Resource Library.
Visit www.chcs.org to access these online resources:
1. BCAP Pilot Summary Form2. BCAP Quality Framework 3. ICHAP ICD-9 Codes to Identify Developmental Delay Risks4. Molina Healthcare member mailing materials:
• 12-month well-child visit• 12-month well-child visit – Spanish• 12-month milestones• EPSDT and LEAD reminder letter
5. CommunityCARE Provider Training Guide6. CommunityCARE Sample Mailing 7. CommunityCARE Documentation Flowsheet8. BlueCross BlueShield Provider Training Packet9. CommunityCARE Referral Tracking Form10. Lovelace List of Barriers to timely screening and referrals identified by
Senate Joint Memorial Task Force
62
Learn More about BCAP Enhancing Child Development Services in MedicaidManaged Care
The Center for Health Care Strategies website offers a wealth of resources for organizations committed to measurably improving health care quality for Medicaidbeneficiaries. Visit www.chcs.org to:
• Learn about the BCAP Quality Framework.• Explore previous BCAP Toolkits on:
- Improving Birth Outcomes- Improving Preventive Care Services for Children- Achieving Better Care for Asthma- Improving Managed Care for Children with Special Needs
• Register for CHCS Network Exchange Calls to learn about best practice strategies.
• Join the BCAP Network Listserv to share information about quality improvementtechniques with professional peers across the country.
• Sign up for CHCS Monthly Topics for e-news updates regarding upcoming opportunities to participate in BCAP workgroups or other educational sessions.

P.O. Box 3469Princeton, NJ 08543-3469(609) 895-8101(609) 895-9648 faxwww.chcs.org
Center for Health Care Strategies, Inc.CHCS