Embed Size (px)
Citation preview
Enhancement of Ethanol Fermentation in Saccharomyces cerevisiaeSake Yeast by Disrupting Mitophagy Function
Shodai Shiroma,a Lahiru Niroshan Jayakody,a,b Kenta Horie,a Koji Okamoto,c Hiroshi Kitagakia,b
Department of Environmental Science, Faculty of Agriculture, Saga University, Saga, Japana; Department of Biochemistry and Applied Biosciences, United GraduateSchool of Agricultural Sciences, Kagoshima University, Kagoshima, Japanb; Graduate School of Frontier Biosciences, Osaka University, Osaka, Japanc
Saccharomyces cerevisiae sake yeast strain Kyokai no. 7 has one of the highest fermentation rates among brewery yeasts usedworldwide; therefore, it is assumed that it is not possible to enhance its fermentation rate. However, in this study, we found thatfermentation by sake yeast can be enhanced by inhibiting mitophagy. We observed mitophagy in wild-type sake yeast during thebrewing of Ginjo sake, but not when the mitophagy gene (ATG32) was disrupted. During sake brewing, the maximum rate ofCO2 production and final ethanol concentration generated by the atg32� laboratory yeast mutant were 7.50% and 2.12% higherthan those of the parent strain, respectively. This mutant exhibited an improved fermentation profile when cultured under limit-ing nutrient concentrations such as those used during Ginjo sake brewing as well as in minimal synthetic medium. The mutantproduced ethanol at a concentration that was 2.76% higher than the parent strain, which has significant implications for indus-trial bioethanol production. The ethanol yield of the atg32� mutant was increased, and its biomass yield was decreased relativeto the parent sake yeast strain, indicating that the atg32� mutant has acquired a high fermentation capability at the cost of de-creasing biomass. Because natural biomass resources often lack sufficient nutrient levels for optimal fermentation, mitophagymay serve as an important target for improving the fermentative capacity of brewery yeasts.
Sake is a traditional Japanese alcoholic beverage produced fromsteamed rice and koji. During the manufacturing process, glu-
cose is produced (saccharification) from the starch present in riceby the actions of enzymes produced by the koji fungus Aspergillusoryzae. Glucose is fermented to ethanol by Saccharomyces cerevi-siae sake yeast strains (1). Sake contains the highest ethanol con-centration of all the brewed alcoholic beverages worldwide. Thishigh ethanol concentration is generated by technologies that in-clude successive addition of enzymes and nutrients derived fromkoji during sake brewing (2, 3), a 3-step pitching process, brewingin winter, and the historical selection of high-ethanol-producingsake yeast strains (1). Sake yeast strains have been selected througha long history of cultivation, ranging from 100 to 400 years. Themost frequently used sake yeast at present is Kyokai no. 7 (K7),which was isolated from sake mash in 1946 (4, 5). This strainproduces a high concentration of ethanol, because it lacks func-tions of proteins encoded by MSN4, PPT1, and RIM15, which arerequired to mount a stress response (6–8). For this reason, re-searchers in this field believe that it is difficult to further augmentthe fermentation rate of this sake yeast.
Although rice is used as a raw material to brew sake, the surfaceof rice contains many constituents such as amino acids that imparta heavy and complex taste to sake. Because Japanese consumerstend to prefer a light and clear taste, rice with a polished surface isused for sake brewing. Sake is categorized into two representativetypes depending on the extent of rice polishing; these types havebeen specified by the official guidelines of the Japanese government(http://www.nta.go.jp/shiraberu/senmonjoho/sake/hyoji/seishu/gaiyo/02.htm). When the weight of the removed surface is less than 30%or more than 40% of the total weight of rice, sake is categorizedas either normal sake or premium Ginjo sake, respectively.Because sake yeast strains are cultured in the presence of lownutrient concentrations during Ginjo sake brewing (30% loweramino acid concentration than normal sake brewing) (9), sake
yeast produces flavors imparted by ethyl caproate and isoamylacetate (10).
Autophagy is a bulk degradative and recycling process involv-ing the transport of cytoplasmic components and organelles to thevacuole (plant and fungal cells) or lysosome (mammalian cells); itis required for homeostasis and is induced under conditions ofnutrient starvation (11). Mitophagy is a selective form of au-tophagy that specifically degrades mitochondria (12, 13) and playscritical roles in the pathogenesis of Parkinson’s disease. Mi-tophagy is mediated by the activity of the serine/threonine proteinkinase PTEN-induced putative kinase 1 (PINK1) and the ubiqui-tin ligase Parkin (PARK2) (14, 15). PINK1 phosphorylates mito-fusin 2 (MFN2), which functions as a Parkin receptor for cullingdamaged mitochondria in response to mitochondrial depolariza-tion (16). Although yeasts undergo autophagy during wine fer-mentation (17–19), selective modes of autophagy, such as mi-tophagy, have not been reported. Moreover, there are nopublished studies on the relationship between mitophagy and thefermentation characteristics of yeast.
Our laboratory focuses on the effects of mitochondrial activi-ties and the metabolic engineering of sake yeast strains that influ-ence their ability to ferment substrates (1, 20–26). Mitochondriadepolarize during anaerobiosis, which corresponds to the condi-tions used for industrial alcoholic fermentation (27–29), and mi-tophagy occurs when mitochondrial electron potential decreases
Received 17 September 2013 Accepted 18 November 2013
Published ahead of print 22 November 2013
Address correspondence to Hiroshi Kitagaki, [email protected].
Supplemental material for this article may be found at http://dx.doi.org/10.1128/AEM.03130-13.
Copyright © 2014, American Society for Microbiology. All Rights Reserved.
doi:10.1128/AEM.03130-13
1002 aem.asm.org Applied and Environmental Microbiology p. 1002–1012 February 2014 Volume 80 Number 3
on June 12, 2018 by guesthttp://aem
.asm.org/
Dow
nloaded from
(30). Moreover, mitophagy is induced in yeast cells when theavailability of nutrients is limited (11). Indeed, sake yeasts arecultured under such conditions during sake brewing, because thenutrient-rich surface of rice substrate is polished and removed.Therefore, we hypothesized that mitophagy plays a role in thefermentation characteristics of sake yeast.
In the present study, we demonstrate that mitophagy occursduring sake brewing and that the fermentative capacity is im-proved by inhibiting mitophagy. This novel approach will be valu-able for improving the fermentative capacity of other breweryyeasts.
MATERIALS AND METHODSYeast strains. The S. cerevisiae strains used in this study are listed in Table1. BY4743 (MATa/� his3��1/his3�1 leu2�0/leu2�0 MET15/met15�0LYS2/lys2�0ura3�0/ura3�0) and the atg8�, atg11�, and atg32� mutants(BY4743 background) were purchased from Life Technologies. The sakeyeast strain K7 was purchased from the Brewing Society of Japan. The K7haploid strain K7H868 was obtained by sporulating the K7 parental dip-loid strain and was selected according to its brewing performance, whichis similar to that of the K7 parental diploid strain (31).
Media. To propagate yeast cells, yeast extract-peptone-dextrose(YPD) medium containing 2% (wt/vol) Bacto peptone, 1% (wt/vol) Bactoyeast extract (Beckton Dickinson), and 2% (wt/vol) glucose was used. Topropagate cells harboring mitochondrion-targeted green fluorescent pro-tein (GFP), minimal synthetic medium containing a 0.67% (wt/vol) yeastnitrogen base without amino acids (Beckton Dickinson), 800 mg liter�1
complete supplement mixture Drop-out–HIS � 40 ADE (Formedium), and2% (wt/vol) glucose was used. For fermentation tests, minimal synthetic me-dium containing a 0.67% (wt/vol) yeast nitrogen base without amino acids(Beckton Dickinson), 790 mg liter�1 complete supplement mixture Drop-out: Complete (Formedium), and 15% (wt/vol) glucose was used.
Construction of yeast mutants. The two copies of ATG32 in the K7strains were disrupted using a PCR-based method. To disrupt the firstcopy of ATG32, a DNA fragment containing kanMX as a selectable markerwith the flanking regions of the ATG32 open reading frame was amplifiedusing the forward primer atg32kanMXfw (5=-AGATCACCGTCTCTCTAGAGC-3=) and the reverse primer atg32kanMXrv (5=-TGCATTCACATTTACAGCGA-3=) and atg32� DNA (BY4743 background) as a template.
The PCR product was used to transform the K7 strains, and cells trans-formed with the disrupted ATG32 gene were selected on plates containing500 �g ml�1 G418. To disrupt the second copy of ATG32, a DNA frag-ment containing NAT1 as a selectable marker with the same flankingregions as the first gene was amplified using the primers atg32nat1fw(5=-TGAAGTCCTAATCACAAAAGCAAAAAAAATCTGCCAGGAACAGTAAACATCACATACGATTTAGGTGACAC-3=) and atg32nat1rv (5=-TAGTAAAAAAGTGAGTAGGAACGTGTATGTTTGTGTATATTGGAAAAAGGAATACGACTCACTATAGGGAG-3=) and pAG25 as a tem-plate. These amplicons were used to transform K7 strains as well. Trans-formants disrupted in the two copies of ATG32 were selected on platescontaining 100 �g ml�1 nourseothricin. These strains were transformedwith the plasmid pRS413GPDmitGFP. To construct the plasmidpRS413GPDmitGFP, a fragment containing the Su9 (1– 69)-GFP frag-ment (GFP fused to a sequence encoding the first 69 amino acid residuesof subunit 9 of the mitochondrial Fo ATPase of Neurospora crassa) (32)flanked by the oligonucleotide sequences 5=-ACTAGT-3=on its 5= end and5=-GAATTC-3= on its 3= end was subcloned and was inserted into theSpeI-EcoRI-cleaved site of pRS413GPD. pRS413GPD is a plasmid(pRS413) with a glyceraldehyde-3-phosphate dehydrogenase (GPD) pro-moter (33). pRS413 is a low-copy-number autonomously replicatingplasmid containing the HIS3 marker (35).
Sake brewing. Sake was brewed according to a published method (22).Briefly, the yeast strains were cultured in YPD medium, centrifuged, andwashed with distilled water. These cells (optical density at 600 nm[OD600], 200 units) were mixed with 60 g dried pregelatinized rice, 23 gdried pregelatinized koji (Tokushima Seiko Co.), 200 ml distilled water,and 45 �l of 90% lactic acid in a 500-ml glass beaker and incubated with-out shaking at 15°C for 14 days. The mash was stirred once 24 h after thestart of incubation. For normal sake brewing, we used rice and koji with30% of their surface removed. For Ginjo sake brewing, we used koji andrice with 50% and 60% of the surface removed, respectively. We moni-tored the progress of the fermentation by determining the loss of mass ofthe culture, which was calculated as the amount of CO2 evolved.
Fermentation test. Yeast cells (3 � 107 cells) were inoculated with 100ml of minimal synthetic medium containing 15% (wt/vol) glucose in a300-ml Erlenmeyer flask equipped with an air lock on top of the flask. Themedium was cultured statically at 30°C for 11 days, and mass was deter-mined every day.
Ethanol concentration. The ethanol concentrations of sake or fer-mented media were analyzed using a contact combustion system with analcohol densitometer (Alcohol Checker YSA-200; Yazaki Meter Co. Ltd.)according to the manufacturer’s instructions, as described previously(31).
CFU. Samples were obtained from the sake mash at different timepoints and diluted by factors of 2,000, 10,000, and 50,000. One hundredmicroliters of the diluted samples was plated on YPD agar and incubatedat 30°C for 2 days. We then counted the colonies formed.
Observation of mitochondria and vacuoles. Sake mash was sampledat different time points, and yeast cells were recovered from a viscouswhite layer formed after centrifugation of the sake mash. Yeast cells wereincubated with the liquid recovered from the sake mash containing 100�M E-64 (Sigma-Aldrich) and 8 �M FM4-64 (Molecular Probes) in a30°C water bath for 30 min, washed with the same liquid to remove freeE-64 and FM4-64, incubated again in the liquid at 30°C for 90 min withmild shaking, washed with phosphate-buffered saline, and observed usinga fluorescence microscope (Keyence BZ8000). To observe the three-di-mensional structures of mitochondria and vacuoles, z-stack images wereacquired.
Western blotting. The stability of mitochondrial GFP was verifiedusing Western blotting and an antibody against GFP. Cells of the atg32�sake yeast and its parent sake yeast strain were recovered from minimalsynthetic medium incubated statically for 4 h or Ginjo sake mash brewedfor 10 days. Cells were recovered from Ginjo sake mash as describedabove. Proteins were extracted using the Y-PER plus solution following
TABLE 1 Yeast strains used in this study
Strain Relevant genotype or description Source
BY4743 MATa/� his3�0/his3�0 leu2�/leu2�0 met15�0/MET15 LYS2/lys2�0; ura3�0/ura3�0
OpenBiosystems
BY4743 atg8� BY4743 atg8�::kanMX OpenBiosystems
BY4743 atg11� BY4743 atg11�::kanMX OpenBiosystems
BY4743 atg32� BY4743 atg32�::kanMX OpenBiosystems
BY4743mitGFP BY4743�pYX142mitGFP 22BY4743 atg32�mitGFP BY4743 atg32��pYX142mitGFP This studyK7H868 Sake yeast MATa 31K7H868 atg32� K7H868 atg32�::kanMX This studyK7RAK Sake yeast RAK1536 MATa/�
his3/his334
K7RAKmitGFP RAK1536�pRS413GPDmitGFP This studyK7RAK atg32� RAK1536
atg32�::kanMX/atg32�::NAT1This study
K7RAK atg32�mitGFP K7RAKatg32��pRS413GPDmitGFP
This study
Enhancing Yeast Fermentation by Disrupting Mitophagy
February 2014 Volume 80 Number 3 aem.asm.org 1003
on June 12, 2018 by guesthttp://aem
.asm.org/
Dow
nloaded from
the manufacturer’s protocol (Thermo Scientific). The extracted proteinsolution was concentrated by extraction using chloroform-methanol-wa-ter (4:1:3), and the precipitated protein was solubilized in sterile water.The protein concentrations of the disrupted cells were determined usingthe Bradford method. Equal amounts of protein samples (20 �g) wereapplied to a 12.5% SDS-polyacrylamide gel and electrophoresed at 40 mAfor 50 min. Proteins were transferred to a polyvinylidene difluoride(PVDF) membrane (100 mA, 2 h). The membrane was blocked with skimmilk (0.3% [wt/vol] in Tris-buffered saline-Tween 20 [TBST]). Incuba-tion with the first antibody was performed overnight using an antibodyagainst GFP (diluted 1:1,000) (mFX73; Wako Chemicals), and immunecomplexes were detected using an alkaline phosphatase-conjugated goat
anti-mouse IgG (diluted 1:30,000) (Sigma-Aldrich). The membrane wasvisualized using the BCIP/NBT (5-bromo-4-chloro-3-indolyl-phosphatewith nitro blue tetrazolium) liquid substrate system (Sigma-Aldrich).
Measurement of dry cell weight. After fermentation, cells were col-lected by centrifugation, washed twice with sterile water, suspended in 1ml sterile water, and added to 250-ml aluminum bottles. The bottles wereweighed before adding the cells. The bottles were heated in an oven at180°C overnight and then weighed. The differences between the weight ofbottles before and after addition of cells have been presented as the dry cellweight. The dry cell weight was expressed as biomass.
Measurement of signal intensity of mitochondria. Cells were photo-graphed under a fluorescence microscope (Keyence BZ8000) at a magni-
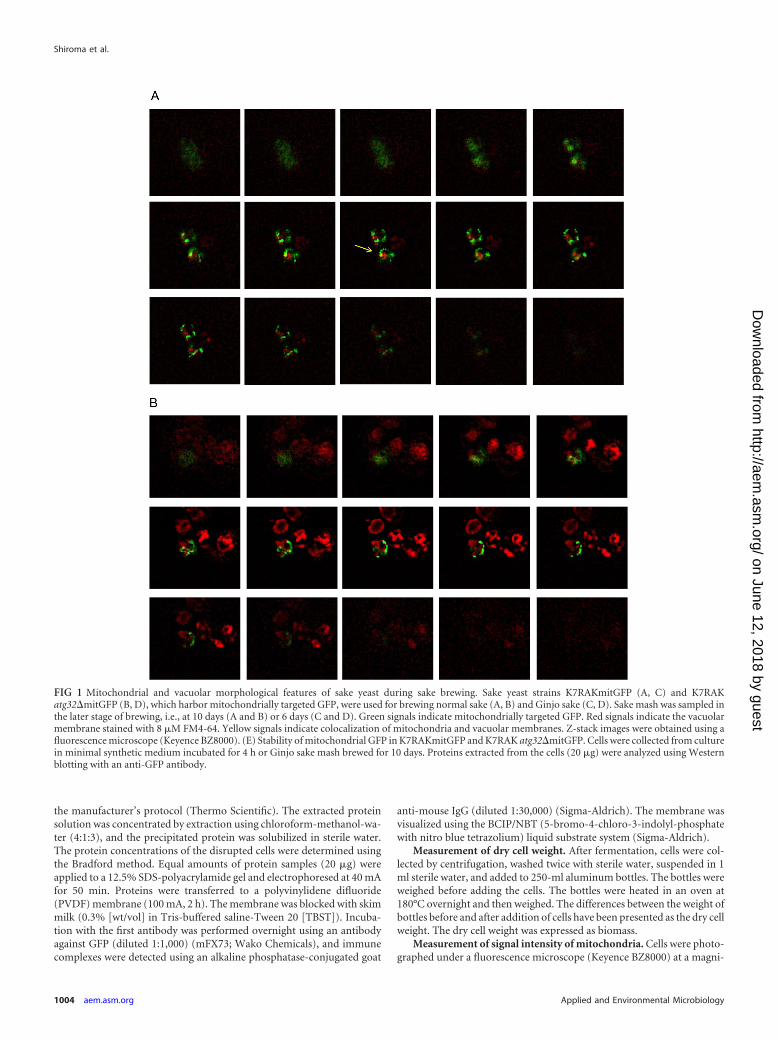
FIG 1 Mitochondrial and vacuolar morphological features of sake yeast during sake brewing. Sake yeast strains K7RAKmitGFP (A, C) and K7RAKatg32�mitGFP (B, D), which harbor mitochondrially targeted GFP, were used for brewing normal sake (A, B) and Ginjo sake (C, D). Sake mash was sampled inthe later stage of brewing, i.e., at 10 days (A and B) or 6 days (C and D). Green signals indicate mitochondrially targeted GFP. Red signals indicate the vacuolarmembrane stained with 8 �M FM4-64. Yellow signals indicate colocalization of mitochondria and vacuolar membranes. Z-stack images were obtained using afluorescence microscope (Keyence BZ8000). (E) Stability of mitochondrial GFP in K7RAKmitGFP and K7RAK atg32�mitGFP. Cells were collected from culturein minimal synthetic medium incubated for 4 h or Ginjo sake mash brewed for 10 days. Proteins extracted from the cells (20 �g) were analyzed using Westernblotting with an anti-GFP antibody.
Shiroma et al.
1004 aem.asm.org Applied and Environmental Microbiology
on June 12, 2018 by guesthttp://aem
.asm.org/
Dow
nloaded from
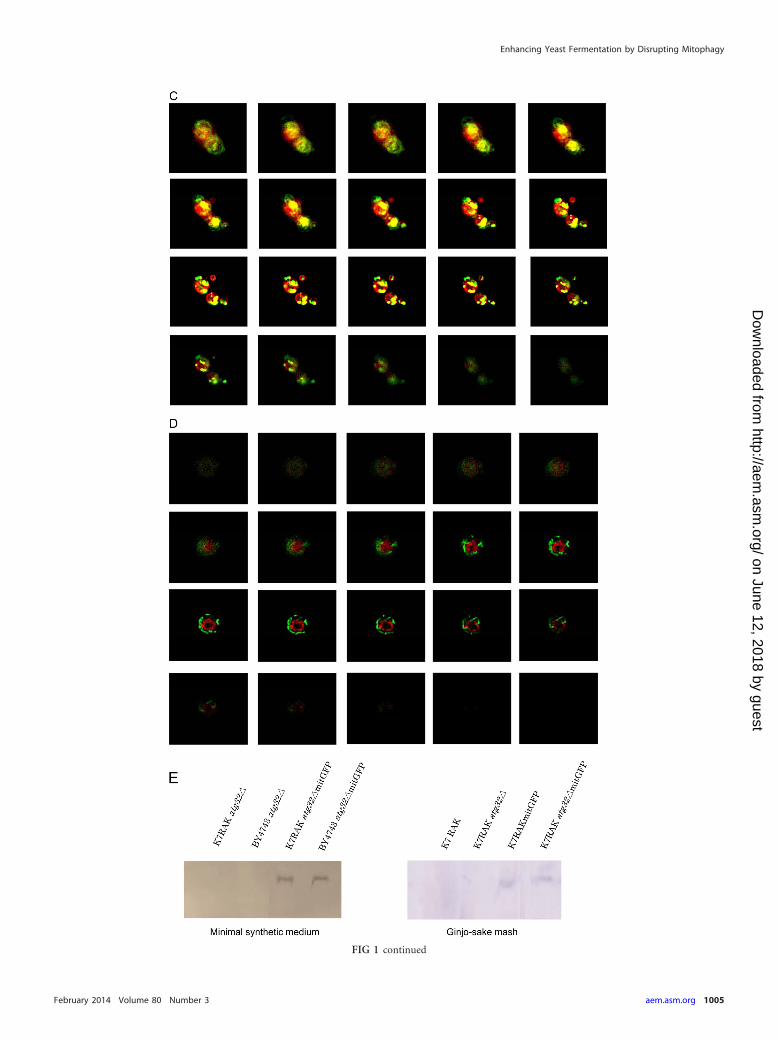
FIG 1 continued
Enhancing Yeast Fermentation by Disrupting Mitophagy
February 2014 Volume 80 Number 3 aem.asm.org 1005
on June 12, 2018 by guesthttp://aem
.asm.org/
Dow
nloaded from
fication of �1,000. Signal intensities of GFP images were determined us-ing Dynamic Cell Count software (Keyence).
Measurement of cell area. Cells were photographed under a micro-scope (Olympus BX53) at a magnification of �1,000. The photos wereprocessed using Image J software (National Institutes of Health). Onehundred cells were outlined, and areas of the outlined cells were measuredusing the software.
Quantitative reverse transcriptase real-time PCR. Yeast cells werecollected from minimal synthetic medium or Ginjo sake mash by centrif-
ugation. Total RNA was extracted from the cells using a hot phenolmethod (36). Total RNA was purified using the RNeasy minikit (Qiagen).Real-time PCR was performed using primers 5=-TGGTGTTCAATGCTTTTCAAG-3= and 5=-CAAGGGTATCACCTTCAAACT-3=, the TaKaRaPrimeScript RT Master mix (Perfect Real Time) (TaKaRa Bio, Inc.), andthe Light Cycler 480 system (Roche Diagnostics).
Statistical analysis. The statistical significance of differences betweenthe averages of two data groups with fewer than 30 samples was judgedusing an unpaired one-tailed Student t test without known deviations.
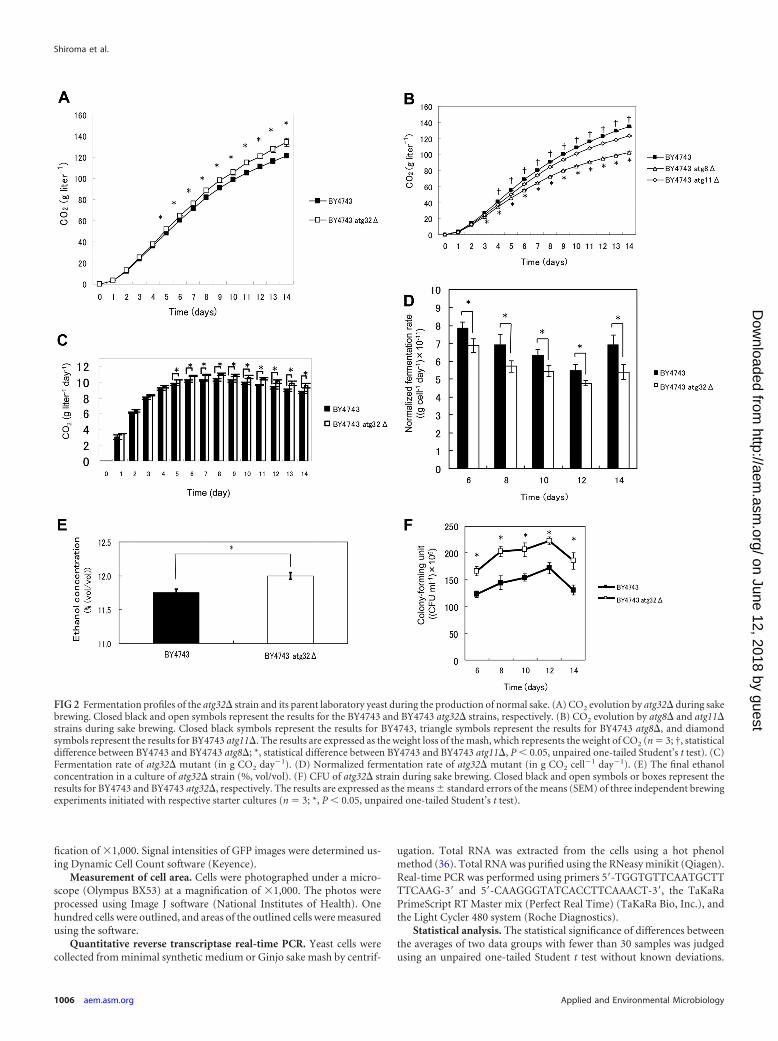
FIG 2 Fermentation profiles of the atg32� strain and its parent laboratory yeast during the production of normal sake. (A) CO2 evolution by atg32� during sakebrewing. Closed black and open symbols represent the results for the BY4743 and BY4743 atg32� strains, respectively. (B) CO2 evolution by atg8� and atg11�strains during sake brewing. Closed black symbols represent the results for BY4743, triangle symbols represent the results for BY4743 atg8�, and diamondsymbols represent the results for BY4743 atg11�. The results are expressed as the weight loss of the mash, which represents the weight of CO2 (n � 3; †, statisticaldifference between BY4743 and BY4743 atg8�; *, statistical difference between BY4743 and BY4743 atg11�, P 0.05, unpaired one-tailed Student’s t test). (C)Fermentation rate of atg32� mutant (in g CO2 day�1). (D) Normalized fermentation rate of atg32� mutant (in g CO2 cell�1 day�1). (E) The final ethanolconcentration in a culture of atg32� strain (%, vol/vol). (F) CFU of atg32� strain during sake brewing. Closed black and open symbols or boxes represent theresults for BY4743 and BY4743 atg32�, respectively. The results are expressed as the means standard errors of the means (SEM) of three independent brewingexperiments initiated with respective starter cultures (n � 3; *, P 0.05, unpaired one-tailed Student’s t test).
Shiroma et al.
1006 aem.asm.org Applied and Environmental Microbiology
on June 12, 2018 by guesthttp://aem
.asm.org/
Dow
nloaded from
The statistical significance of differences between the averages of two datagroups with more than 30 samples was judged using the two-sample z-test(37).
RESULTSMitophagy occurs dependent on Atg32 in sake yeast during sakebrewing. To determine whether mitophagy occurs in yeast cellsduring sake brewing, we generated a sake yeast strain disrupted inATG32 and sake yeast strains that express GFP targeted to themitochondria. ATG32 encodes a mitochondrial outer membraneprotein, which recruits the autophagy adaptor protein Atg11p andthe ubiquitin-like protein Atg8p to the mitochondrial surface toinitiate mitophagy (11). A study reported that a mutant defectivein Atg32 does not cause mitophagy (11). Sake was brewed usingthese strains, and mitochondrial and vacuolar structures were ob-served using a fluorescence microscope. Highly fragmented mito-chondria and large swollen vacuoles were observed during thelater phase of sake brewing, as reported previously (22, 38). Inwild-type sake yeast cells analyzed during the brewing of normal
sake, some portion of the mitochondria (green) fused with thevacuolar membrane (red) to generate yellow signals in z-stackimages (Fig. 1A, yellow arrow). In contrast, in the atg32� sakeyeast, mitochondria (green) were located distant from the vacuo-lar membrane (red), and virtually no yellow signal was detectedthat would indicate fusion of mitochondria with the vacuolarmembrane (Fig. 1B). We hypothesized that mitophagy would bemore evident in cultures with limited nutrient concentration. Mi-tophagy was clearly observed in sake yeast during the brewing ofGinjo sake (a refined sake), likely because the medium containedlow nutrient concentrations. In wild-type sake yeast, a significantportion of mitochondria (green) fused with the vacuolar mem-brane (red) to generate yellow signals (Fig. 1C), but this was notobserved in atg32� sake yeast (Fig. 1D). The atg32� cells exhibitedweaker mitochondrial signals than wild-type sake yeast during thebrewing of Ginjo sake (for the wild type, average signal intensity�75,standard deviation [SD] � 20, n � 172; for the atg32� strain,average signal intensity � 41, SD � 8, n � 201, two-sample z
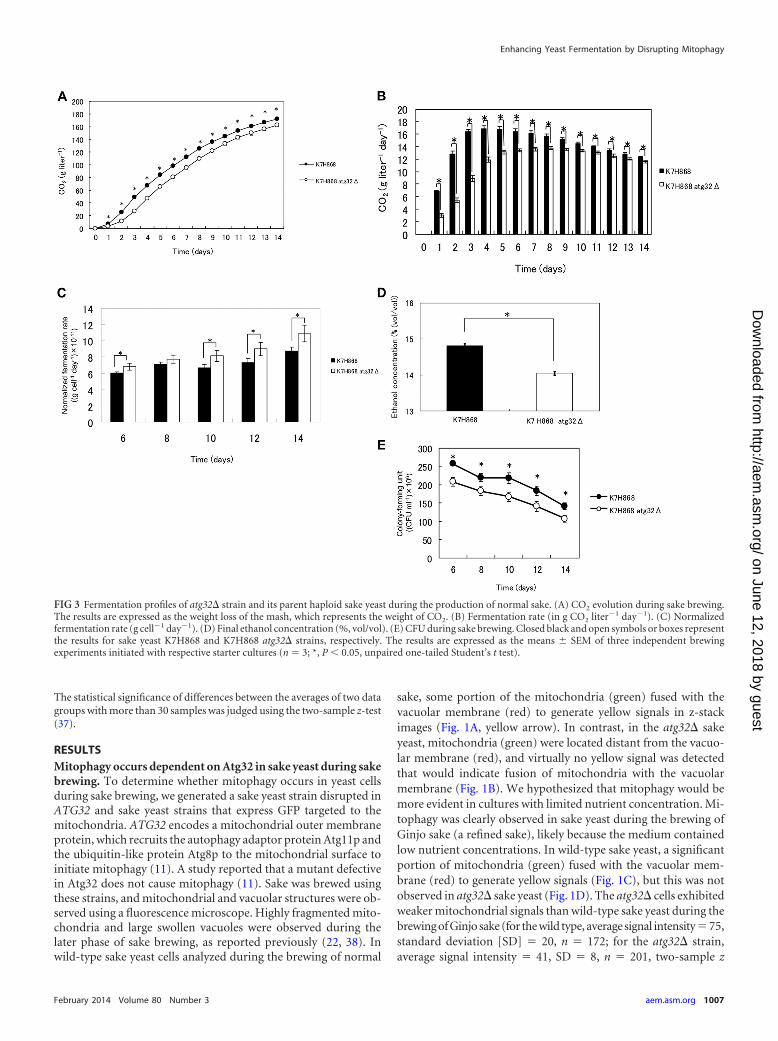
FIG 3 Fermentation profiles of atg32� strain and its parent haploid sake yeast during the production of normal sake. (A) CO2 evolution during sake brewing.The results are expressed as the weight loss of the mash, which represents the weight of CO2. (B) Fermentation rate (in g CO2 liter�1 day�1). (C) Normalizedfermentation rate (g cell�1 day�1). (D) Final ethanol concentration (%, vol/vol). (E) CFU during sake brewing. Closed black and open symbols or boxes representthe results for sake yeast K7H868 and K7H868 atg32� strains, respectively. The results are expressed as the means SEM of three independent brewingexperiments initiated with respective starter cultures (n � 3; *, P 0.05, unpaired one-tailed Student’s t test).
Enhancing Yeast Fermentation by Disrupting Mitophagy
February 2014 Volume 80 Number 3 aem.asm.org 1007
on June 12, 2018 by guesthttp://aem
.asm.org/
Dow
nloaded from
score � 67.9; P 0.001). In contrast, there was no significantdifference between the atg32� strain and its parent strain withrespect to the amount of GFP (Fig. 1E) or in their levels of expres-sion of GFP mRNA (data not shown) when cells were culturedunder the conditions of Ginjo sake brewing. These results indicatethat mitochondrial GFP, although expressed normally in theatg32� strain, cannot translocate to the mitochondria in theatg32� strain because of low mitochondrial electron potential,which is consistent with the report that this mutant accumu-lates dysfunctional mitochondria (39). Together, these resultsindicate that mitophagy occurs dependent on Atg32 and thismitophagy is required to maintain mitochondrial quantity insake yeast during sake brewing.
Enhanced ethanol fermentation by the atg32� laboratorystrain. Because the above results indicated clearly that mitophagyoccurred in sake yeast during sake brewing, we hypothesized thatmitophagy may affect the characteristics of brewed sake. There-fore, sake was first brewed with the atg32� and its parent labora-tory yeast strains. Analysis of the ability of the atg32� laboratorystrain to produce CO2 indicated that it has an improved fermen-tation (P 0.05; Fig. 2A). This result indicated that mitophagyplays a role in ethanol fermentation. We then asked whether in-
hibiting general autophagy would have the same effect. To addressthis question, we brewed sake with mutants defective in genesrequired for general autophagy (atg11� and atg8� laboratoryyeast strains). However, in contrast to what was seen for theatg32� mutant, fermentation by these mutants was significantlyreduced (P 0.05; Fig. 2B), which is consistent with the results ofprevious studies of wine fermentation (40). These results indicatethat disrupting mitophagy, but not general autophagy, enhancesfermentation. To determine the basis for this effect, we assessedthe fermentation profiles of atg32� mutants and found that theCO2 production rate (Fig. 2C), the final ethanol concentration(Fig. 2E), and CFU (Fig. 2F) were significantly higher than those ofthe parental strain (P 0.05). The maximum CO2 productionrate of the parent laboratory strain was 10.3 0.167 g liter�1
day�1, and that of the atg32� mutant was 11.0 0.146 g liter�1
day�1, which represents an increase of 7.50% relative to that of theparent strain (P 0.05). These results indicate that the atg32�mutant has an enhanced ethanol fermentation rate. The normal-ized CO2 production rate of the atg32� strain per cell was signif-icantly lower than that of the parent strain (P 0.05) (Fig. 2D),suggesting that the metabolic competence of the atg32� mutantper cell did not mediate its high fermentation rate.
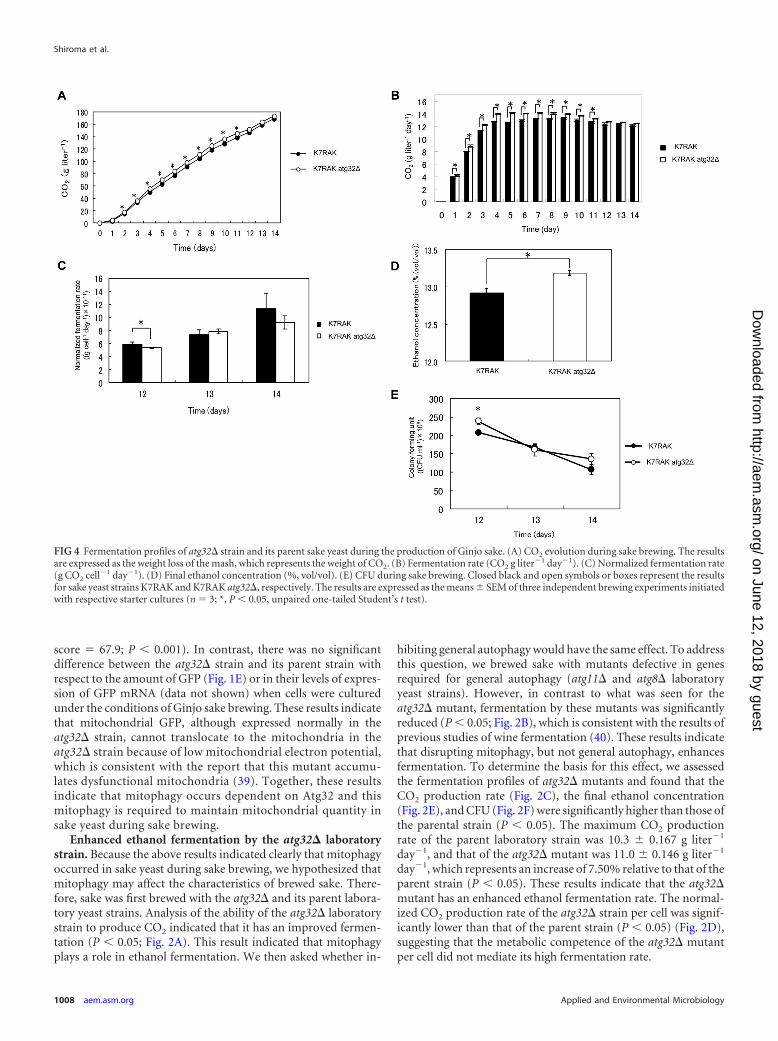
FIG 4 Fermentation profiles of atg32� strain and its parent sake yeast during the production of Ginjo sake. (A) CO2 evolution during sake brewing. The resultsare expressed as the weight loss of the mash, which represents the weight of CO2. (B) Fermentation rate (CO2 g liter�1 day�1). (C) Normalized fermentation rate(g CO2 cell�1 day�1). (D) Final ethanol concentration (%, vol/vol). (E) CFU during sake brewing. Closed black and open symbols or boxes represent the resultsfor sake yeast strains K7RAK and K7RAK atg32�, respectively. The results are expressed as the means SEM of three independent brewing experiments initiatedwith respective starter cultures (n � 3; *, P 0.05, unpaired one-tailed Student’s t test).
Shiroma et al.
1008 aem.asm.org Applied and Environmental Microbiology
on June 12, 2018 by guesthttp://aem
.asm.org/
Dow
nloaded from
Enhanced ethanol fermentation by the atg32� sake yeastmutant when cultured under Ginjo sake (a refined sake) brew-ing conditions and also in minimal synthetic medium. In orderto elucidate if atg32� sake yeast also shows improved fermenta-tion profile, the fermentation profile of atg32� sake yeast duringthe brewing of normal sake was investigated. In contrast to theatg32� laboratory strain, the atg32� sake yeast strain (K7H868, ahaploid strain) showed a significantly (P 0.05) lower ability toproduce CO2 (Fig. 3A), CO2 production rate (Fig. 3B), final eth-anol concentration (Fig. 3D), and CFU (Fig. 3E) than its parentsake yeast strain. The maximum CO2 production rates by the par-ent and atg32� sake yeast strains were 16.8 0.470 g liter�1 day�1
and 13.6 0.293 g liter�1 day�1, respectively, representing a19.1% decrease relative to that of the parent strain (P 0.05).Intriguingly, the normalized CO2 production rate per cell ofatg32� sake yeast was higher than that of its parent strain underthis condition (Fig. 3C), suggesting the metabolic impact of theatg32� mutation. Increase of fermentation and final ethanol con-centration during the brewing of normal sake were not observed
in atg32� diploid sake yeast strains either (see Fig. S1 in the sup-plemental material). These data led us to conclude that laboratoryand sake yeasts may respond differently to nutrient concentra-tions, as described previously (41), because laboratory yeasts havelong been cultured in media very rich in nutrients such as YPD,and sake yeasts have long been cultured in nutrient-poor mediathat contain polished rice. Therefore, sake yeast should exhibit thesame response as laboratory yeast in the presence of low nutrientconcentrations similar to those used for Ginjo sake brewing. Con-sistent with this hypothesis, under the conditions used to produceGinjo sake, the atg32� sake yeast strain showed significantly (P 0.05) increased CO2 production (Fig. 4A), fermentation rate (Fig.4B), final ethanol concentration (Fig. 4D), and CFU (Fig. 4E)compared to the parent strain. The maximum CO2 productionrate of the parent sake strain was 13.2 0.179 g liter�1 day�1, andthat of the atg32� mutant was 14.1 0.126 g liter�1 day�1, rep-resenting an increase of 6.28% relative to that of the parent strain(P 0.05). The atg32� sake yeast strain showed a normalized CO2
production rate that was not significantly different from that of its
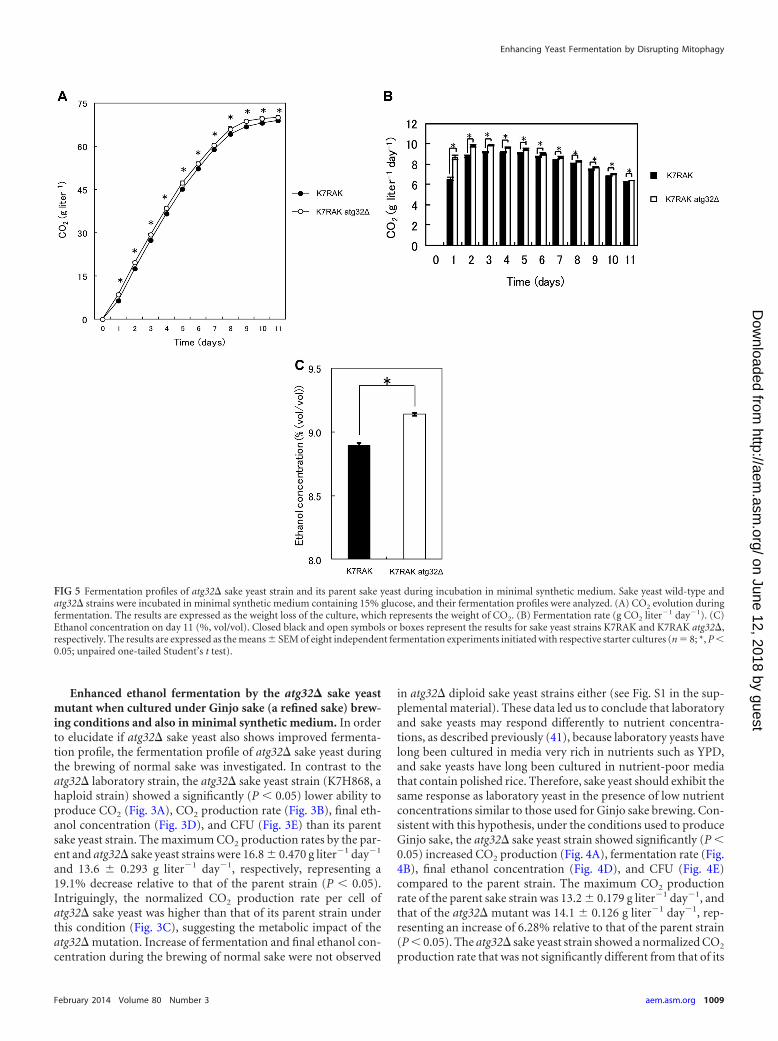
FIG 5 Fermentation profiles of atg32� sake yeast strain and its parent sake yeast during incubation in minimal synthetic medium. Sake yeast wild-type andatg32� strains were incubated in minimal synthetic medium containing 15% glucose, and their fermentation profiles were analyzed. (A) CO2 evolution duringfermentation. The results are expressed as the weight loss of the culture, which represents the weight of CO2. (B) Fermentation rate (g CO2 liter�1 day�1). (C)Ethanol concentration on day 11 (%, vol/vol). Closed black and open symbols or boxes represent the results for sake yeast strains K7RAK and K7RAK atg32�,respectively. The results are expressed as the means SEM of eight independent fermentation experiments initiated with respective starter cultures (n � 8; *, P 0.05; unpaired one-tailed Student’s t test).
Enhancing Yeast Fermentation by Disrupting Mitophagy
February 2014 Volume 80 Number 3 aem.asm.org 1009
on June 12, 2018 by guesthttp://aem
.asm.org/
Dow
nloaded from
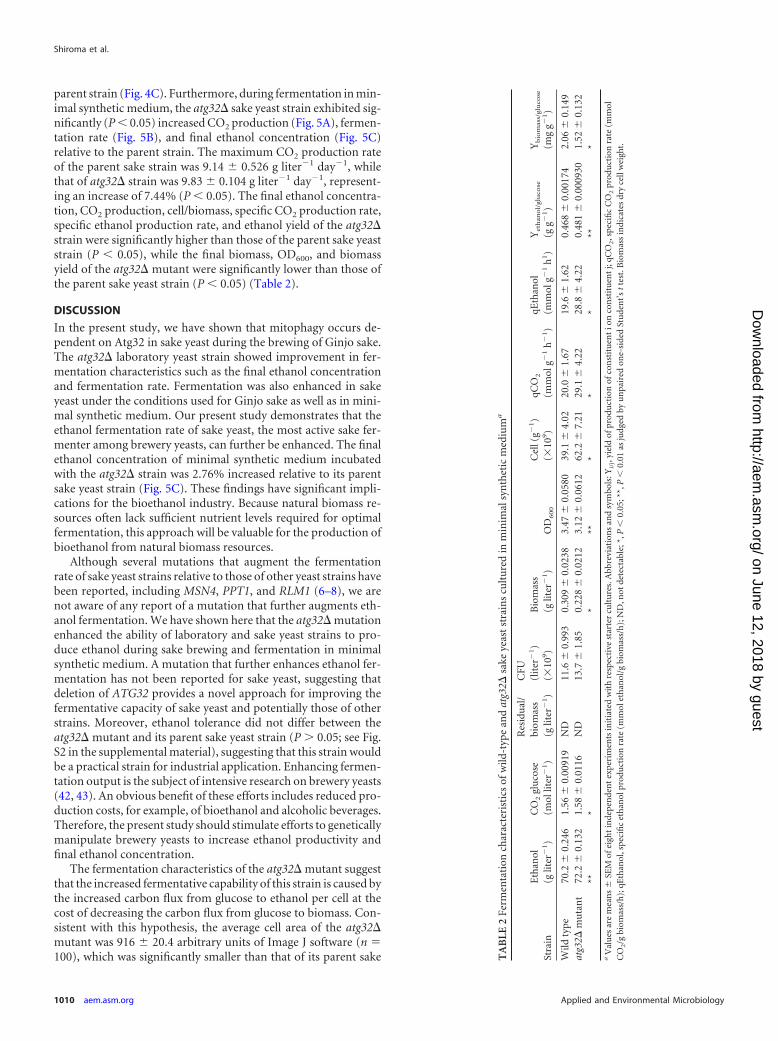
parent strain (Fig. 4C). Furthermore, during fermentation in min-imal synthetic medium, the atg32� sake yeast strain exhibited sig-nificantly (P 0.05) increased CO2 production (Fig. 5A), fermen-tation rate (Fig. 5B), and final ethanol concentration (Fig. 5C)relative to the parent strain. The maximum CO2 production rateof the parent sake strain was 9.14 0.526 g liter�1 day�1, whilethat of atg32� strain was 9.83 0.104 g liter�1 day�1, represent-ing an increase of 7.44% (P 0.05). The final ethanol concentra-tion, CO2 production, cell/biomass, specific CO2 production rate,specific ethanol production rate, and ethanol yield of the atg32�strain were significantly higher than those of the parent sake yeaststrain (P 0.05), while the final biomass, OD600, and biomassyield of the atg32� mutant were significantly lower than those ofthe parent sake yeast strain (P 0.05) (Table 2).
DISCUSSION
In the present study, we have shown that mitophagy occurs de-pendent on Atg32 in sake yeast during the brewing of Ginjo sake.The atg32� laboratory yeast strain showed improvement in fer-mentation characteristics such as the final ethanol concentrationand fermentation rate. Fermentation was also enhanced in sakeyeast under the conditions used for Ginjo sake as well as in mini-mal synthetic medium. Our present study demonstrates that theethanol fermentation rate of sake yeast, the most active sake fer-menter among brewery yeasts, can further be enhanced. The finalethanol concentration of minimal synthetic medium incubatedwith the atg32� strain was 2.76% increased relative to its parentsake yeast strain (Fig. 5C). These findings have significant impli-cations for the bioethanol industry. Because natural biomass re-sources often lack sufficient nutrient levels required for optimalfermentation, this approach will be valuable for the production ofbioethanol from natural biomass resources.
Although several mutations that augment the fermentationrate of sake yeast strains relative to those of other yeast strains havebeen reported, including MSN4, PPT1, and RLM1 (6–8), we arenot aware of any report of a mutation that further augments eth-anol fermentation. We have shown here that the atg32� mutationenhanced the ability of laboratory and sake yeast strains to pro-duce ethanol during sake brewing and fermentation in minimalsynthetic medium. A mutation that further enhances ethanol fer-mentation has not been reported for sake yeast, suggesting thatdeletion of ATG32 provides a novel approach for improving thefermentative capacity of sake yeast and potentially those of otherstrains. Moreover, ethanol tolerance did not differ between theatg32� mutant and its parent sake yeast strain (P � 0.05; see Fig.S2 in the supplemental material), suggesting that this strain wouldbe a practical strain for industrial application. Enhancing fermen-tation output is the subject of intensive research on brewery yeasts(42, 43). An obvious benefit of these efforts includes reduced pro-duction costs, for example, of bioethanol and alcoholic beverages.Therefore, the present study should stimulate efforts to geneticallymanipulate brewery yeasts to increase ethanol productivity andfinal ethanol concentration.
The fermentation characteristics of the atg32� mutant suggestthat the increased fermentative capability of this strain is caused bythe increased carbon flux from glucose to ethanol per cell at thecost of decreasing the carbon flux from glucose to biomass. Con-sistent with this hypothesis, the average cell area of the atg32�mutant was 916 20.4 arbitrary units of Image J software (n �100), which was significantly smaller than that of its parent sake T
AB
LE2
Ferm
enta
tion
char
acte
rist
ics
ofw
ild-t
ype
and
atg3
2�sa
keye
ast
stra
ins
cult
ure
din
min
imal
syn
thet
icm
ediu
ma
Stra
inE
than
ol(g
liter
�1)
CO
2gl
uco
se(m
ollit
er�
1)
Res
idu
al/
biom
ass
(glit
er�
1)
CFU
(lit
er�
1)
(�10
9)
Bio
mas
s(g
liter
�1)
OD
60
0
Cel
l(g�
1)
(�10
9)
qCO
2
(mm
olg�
1h
�1)
qEth
anol
(mm
olg�
1h
1)
Yet
han
ol/
glu
cose
(gg�
1)
Yb
iom
ass/
glu
cose
(mg
g�1)
Wild
type
70.2
0.
246
1.56
0.
0091
9N
D11
.6
0.99
30.
309
0.
0238
3.47
0.
0580
39.1
4.
0220
.0
1.67
19.6
1.
620.
468
0.
0017
42.
06
0.14
9at
g32�
mu
tan
t72
.2
0.13
21.
58
0.01
16N
D13
.7
1.85
0.22
8
0.02
123.
12
0.06
1262
.2
7.21
29.1
4.
2228
.8
4.22
0.48
1
0.00
0930
1.52
0.
132
***
***
**
***
*a
Val
ues
are
mea
ns
SE
Mof
eigh
tin
depe
nde
nt
expe
rim
ents
init
iate
dw
ith
resp
ecti
vest
arte
rcu
ltu
res.
Abb
revi
atio
ns
and
sym
bols
:Yi/
j,yi
eld
ofpr
odu
ctio
nof
con
stit
uen
tio
nco
nst
itu
ent
j;qC
O2,s
peci
fic
CO
2pr
odu
ctio
nra
te(m
mol
CO
2/g
biom
ass/
h);
qEth
anol
,spe
cifi
cet
han
olpr
odu
ctio
nra
te(m
mol
eth
anol
/gbi
omas
s/h
);N
D,n
otde
tect
able
;*,P
0.
05;*
*,P
0.
01as
judg
edby
un
pair
edon
e-si
ded
Stu
den
t’s
ttes
t.B
iom
ass
indi
cate
sdr
yce
llw
eigh
t.
Shiroma et al.
1010 aem.asm.org Applied and Environmental Microbiology
on June 12, 2018 by guesthttp://aem
.asm.org/
Dow
nloaded from
yeast (985 30.8 arbitrary units of Image J software, n � 100; P 0.01 as judged by the two-sample z-test). This finding may beexplained by the difference in cell response of wild-type andatg32� cells exposed to stressful conditions induced by accumu-lation of fermented products and limited nutrient concentration.While wild-type cells use carbon flux to construct cell componentsby degrading mitochondria and recovering amino acids upon ex-posure to limited nutrient concentrations, atg32� cells lack thisresponse, do not invest in carbon flux directed to biomass, andinstead use the carbon flux toward ethanol.
Although autophagy has been observed under various wine-making conditions (17–19, 44), to our knowledge, no study hasdefined the role of mitophagy in alcoholic fermentation. The pres-ent study demonstrates that mitophagy occurs during alcoholicfermentation and its disruption enhances fermentation. Indeed,very recently, it has been shown that mitophagy occurs duringfermentation, independent of respiration (13). Together, thesestudies indicate that mitophagy during alcoholic fermentationwill be a new target in the development of fermentation technol-ogies.
In summary, we have shown here that mitophagy occurs insake yeast and that deleting the mitophagy gene augments thisorganism’s capacity to produce ethanol. Considering that naturalbiomass resources often contain low concentrations of nutrients,this method will provide benefits in the production of bioethanolfrom biomass resources.
ACKNOWLEDGMENTS
This study was supported in part by grant KAKENHI24580117 to H.K.We thank Katsuhiko Kitamoto and Junichi Maruyama of the Univer-
sity of Tokyo for the valuable discussions and Rinji Akada of YamaguchiUniversity for providing yeast strain RAK1536.
REFERENCES1. Kitagaki H, Kitamoto K. 2013. Breeding research on sake yeasts in Japan:
history, recent technological advances, and future perspectives. Annu.Rev. Food Sci. Technol. 4:215–235. http://dx.doi.org/10.1146/annurev-food-030212-182545.
2. Hirata M, Tsuge K, Jayakody LN, Urano Y, Sawada K, Inaba S, NagaoK, Kitagaki H. 2012. Structural determination of glucosylceramides in thedistillation remnants of shochu, the Japanese traditional liquor, and itsproduction by Aspergillus kawachii. J. Agric. Food Chem. 60:11473–11482. http://dx.doi.org/10.1021/jf303117e.
3. Takahashi K, Izumi K, Nakahata E, Hirata M, Sawada K, Tsuge K,Nagao K, Kitagaki H. 2014. Quantitation and structural determination ofglucosylceramides contained in sake lees. J. Oleo Sci. 63:15–23. http://dx.doi.org/10.5650/jos.ess13086.
4. Tsukahara T, Nakamura Y, Sato S, Tanaka Y. 1947. Brewing character-istics of Kyokai no. 6 and no. 7. J. Brew. Soc. Jpn. 42:26 –27. http://dx.doi.org/10.6013/jbrewsocjapan1915.42.10-12_26.
5. Akao T, Yashiro I, Hosoyama A, Kitagaki H, Horikawa H, Watanabe D,Akada R, Ando Y, Harashima S, Inoue T, Inoue Y, Kajiwara S, Kita-moto K, Kitamoto N, Kobayashi O, Kuhara S, Masubuchi T, MizoguchiH, Nakao Y, Nakazato A, Namise M, Oba T, Ogata T, Ohta A, Sato M,Shibasaki S, Takatsume Y, Tanimoto S, Tsuboi H, Nishimura A, YodaK, Ishikawa T, Iwashita K, Fujita N, Shimoi H. 2011. Whole-genomesequencing of sake yeast Saccharomyces cerevisiae Kyokai no. 7. DNA Res.18:423– 434. http://dx.doi.org/10.1093/dnares/dsr029.
6. Watanabe M, Tamura K, Magbanua JP, Takano K, Kitamoto K,Kitagaki H, Akao T, Shimoi H. 2007. Elevated expression of genes underthe control of stress response element (STRE) and Msn2p in an ethanol-tolerance sake yeast Kyokai no. 11. J. Biosci. Bioeng. 104:163–170. http://dx.doi.org/10.1263/jbb.104.163.
7. Watanabe D, Araki Y, Zhou Y, Maeya N, Akao T, Shimoi H. 2012. Aloss-of-function mutation in the PAS kinase Rim15p is related to defectivequiescence entry and high fermentation rates of Saccharomyces cerevisiae
sake yeast strains. Appl. Environ. Microbiol. 78:4008 – 4016. http://dx.doi.org/10.1128/AEM.00165-12.
8. Watanabe D, Wu H, Noguchi C, Zhou Y, Akao T, Shimoi H. 2011.Enhancement of the initial rate of ethanol fermentation due to dysfunction ofyeast stress response components Msn2p and/or Msn4p. Appl. Environ. Mi-crobiol. 77:934–941. http://dx.doi.org/10.1128/AEM.01869-10.
9. Iemura Y, Ohta Y, Hara S. 1995. The effect of type of rice and its polishingratio on solubilization of rice during sake brewing. J. Brew. Soc. Jpn. 90:947–952.
10. Mason AB, Dufour JP. 2000. Alcohol acetyltransferases and the signifi-cance of ester synthesis in yeast. Yeast 16:1287–1298. http://dx.doi.org/10.1002/1097-0061(200010)16:141287::AID-YEA613�3.0.CO;2-I.
11. Okamoto K, Kondo-Okamoto N, Ohsumi Y. 2009. Mitochondria-anchored receptor Atg32 mediates degradation of mitochondria via selec-tive autophagy. Dev. Cell 17:87–97. http://dx.doi.org/10.1016/j.devcel.2009.06.013.
12. Kanki T, Klionsky DJ, Okamoto K. 2011. Mitochondria autophagy inyeast. Antioxid. Redox Signal. 14:1989 –2001. http://dx.doi.org/10.1089/ars.2010.3762.
13. Eiyama A, Kondo-Okamoto N, Okamoto K. 2013. Mitochondrial deg-radation during starvation is selective and temporally distinct from bulkautophagy in yeast. FEBS Lett. 587:1787–1792. http://dx.doi.org/10.1016/j.febslet.2013.04.030.
14. Jin SM, Youle RJ. 2012. PINK1- and Parkin-mediated mitophagy at aglance. J. Cell Sci. 125:795–799. http://dx.doi.org/10.1242/jcs.093849.
15. Chen Y, Dorn GW, II. 2013. PINK1-phosphorylated mitofusin 2 is aParkin receptor for culling damaged mitochondria. Science 340:471– 475.http://dx.doi.org/10.1126/science.1231031.
16. Sarraf SA, Raman M, Guarani-Pereira V, Sowa ME, Huttlin EL, GygiSP, Harper JW. 2013. Landscape of the PARKIN-dependent ubiquity-lome in response to mitochondrial depolarization. Nature 496:372–376.http://dx.doi.org/10.1038/nature12043.
17. Cebollero E, Rejas MT, González R. 2008. Autophagy in wine making.Methods Enzymol. 451:163–175. http://dx.doi.org/10.1016/S0076-6879(08)03212-6.
18. Cebollero E, Gonzalez R. 2006. Induction of autophagy by second-fermentation yeasts during elaboration of sparkling wines. Appl. Environ.Microbiol. 72:4121– 4127. http://dx.doi.org/10.1128/AEM.02920-05.
19. Cebollero E, Carrascosa AV, Gonzalez R. 2005. Evidence for yeast au-tophagy during simulation of sparkling wine aging: a reappraisal of themechanism of yeast autolysis in wine. Biotechnol. Prog. 21:614 – 616. http://dx.doi.org/10.1021/bp049708y.
20. Kitagaki H. 2009. Mitochondrial-morphology-targeted breeding of in-dustrial yeast strains for alcohol fermentation. Biotechnol. Appl.Biochem. 53:145–153. http://dx.doi.org/10.1042/BA20090032.
21. Kitagaki H, Kato T, Isogai A, Mikami S, Shimoi H. 2008. Inhibition ofmitochondrial fragmentation during sake brewing causes high malateproduction in sake yeast. J. Biosci. Bioeng. 105:675– 678. http://dx.doi.org/10.1263/jbb.105.675.
22. Kitagaki H, Shimoi H. 2007. Mitochondrial dynamics of yeast duringsake brewing. J. Biosci. Bioeng. 104:227–230. http://dx.doi.org/10.1263/jbb.104.227.
23. Motomura S, Horie K, Kitagaki H. 2012. Mitochondrial activity of sakebrewery yeast affects malic and succinic acid production during alcoholicfermentation. J. Inst. Brew. 118:22–26. http://dx.doi.org/10.1002/jib.7.
24. Horie K, Oba T, Motomura S, Isogai A, Yoshimura T, Tsuge K,Koganemaru K, Kobayashi G, Kitagaki H. 2010. Breeding of a lowpyruvate-producing sake yeast by isolation of a mutant resistant to ethylalpha-transcyanocinnamate, an inhibitor of mitochondrial pyruvatetransport. Biosci. Biotechnol. Biochem. 74:843– 847. http://dx.doi.org/10.1271/bbb.90373.
25. Kitagaki H, Takagi H. 2013. Mitochondrial metabolism and stress responseof yeast: applications in fermentation technologies. J. Biosci. Bioeng. pii:S1389-1723(13)00352-6. http://dx.doi.org/10.1016/j.jbiosc.2013.09.011.
26. Sasaki M, Oba T, Suenaga H, Sato M, Tsuruta H, Tsuge K, YoshimuraT, Koganemaru K, Kitagaki H. 2011. Breeding of a low pyruvate-producing ginjo sake yeast and its application to the fermentation indus-try. Seibutsu Kogaku Kaishi 89:222–227.
27. Larsen GA, Skjellegrind HK, Vinje ML, Berg-Johnsen J. 2008. Mito-chondria are more resistant to hypoxic depolarization in the newbornthan in the adult brain. Neurochem. Res. 33:1894 –1900. http://dx.doi.org/10.1007/s11064-008-9664-2.
28. Lloyd D, Moran CA, Suller MTE, Dinsdale MG, Hayes AJ. 1996. Flow
Enhancing Yeast Fermentation by Disrupting Mitophagy
February 2014 Volume 80 Number 3 aem.asm.org 1011
on June 12, 2018 by guesthttp://aem
.asm.org/
Dow
nloaded from

cytometric monitoring of rhodamine 123 and a cyanine dye uptake byyeast during cider fermentation. J. Inst. Brew. 102:251–259. http://dx.doi.org/10.1002/j.2050-0416.1996.tb00910.x.
29. Larsen GA, Skjellegrind HK, Berg-Johnsen J, Moe MC, Vinje ML. 2006.Depolarization of mitochondria in isolated CA1 neurons during hypoxia,glucose deprivation and glutamate excitotoxicity. Brain Res. 1077:153–160. http://dx.doi.org/10.1016/j.brainres.2005.10.095.
30. Priault M, Salin B, Schaeffer J, Vallette FM, di Rago JP, Martinou JC.2005. Impairing the bioenergetic status and the biogenesis of mitochon-dria triggers mitophagy in yeast. Cell Death Differ. 12:1613–1621. http://dx.doi.org/10.1038/sj.cdd.4401697.
31. Katou T, Kitagaki H, Akao T, Shimoi H. 2008. Brewing characteristics ofhaploid strains isolated from sake yeast Kyokai no. 7. Yeast 25:799 – 807.http://dx.doi.org/10.1002/yea.1634.
32. Westermann B, Neupert W. 2000. Mitochondria-targeted green fluores-cent proteins: convenient tools for the study of organelle biogenesis inSaccharomyces cerevisiae. Yeast 16:1421–1427. http://dx.doi.org/10.1002/1097-0061(200011)16:151421::AID-YEA624�3.3.CO;2-L.
33. Mumberg D, Müller R, Funk M. 1995. Yeast vectors for the controlledexpression of heterologous proteins in different genetic backgrounds.Gene 156:119 –122. http://dx.doi.org/10.1016/0378-1119(95)00037-7.
34. Hashimoto S, Ogura M, Aritomi K, Hoshida H, Nishizawa Y, Akada R.2005. Isolation of auxotrophic mutants of diploid industrial yeast strainsafter UV mutagenesis. Appl. Environ. Microbiol. 71:312–319. http://dx.doi.org/10.1128/AEM.71.1.312-319.2005.
35. Sikorski RS, Hieter P. 1989. A system of shuttle vectors and yeast hoststrains designed for efficient manipulation of DNA in Saccharomycescerevisiae. Genetics 122:19 –27.
36. Kohrer K, Domdey H. 1991. Preparation of high molecular weight RNA.Methods Enzymol. 194:398 – 405.
37. Chris Cheadle C, Vawter MP, Freed WJ, Becker KG. 2003. Analysis ofmicroarray data using Z score transformation. J. Mol. Diagn. 5:73– 81.http://dx.doi.org/10.1016/S1525-1578(10)60455-2.
38. Izawa S, Ikeda K, Miki T, Wakai Y, Inoue Y. 2010. Vacuolar morphologyof Saccharomyces cerevisiae during the process of wine making and Japa-nese sake brewing. Appl. Microbiol. Biotechnol. 88:277–282. http://dx.doi.org/10.1007/s00253-010-2758-1.
39. Kurihara Y, Kanki T, Aoki Y, Hirota Y, Saigusa T, Uchiumi T, Kang D.2012. Mitophagy plays an essential role in reducing mitochondrial pro-duction of reactive oxygen species and mutation of mitochondrial DNAby maintaining mitochondrial quantity and quality in yeast. J. Biol. Chem.287:3265–3272. http://dx.doi.org/10.1074/jbc.M111.280156.
40. Piggott N, Cook MA, Tyers M, Measday V. 2011. Genome-wide fitnessprofiles reveal a requirement for autophagy during yeast fermentation. G3(Bethesda) 1:353–367. http://dx.doi.org/10.1534/g3.111.000836.
41. Homann OR, Cai H, Becker JM, Lindquist SL. 2005. Harnessing naturaldiversity to probe metabolic pathways. PLoS Genet. 1:e80. http://dx.doi.org/10.1371/journal.pgen.0010080.
42. Marullo P, Mansour C, Dufour M, Albertin W, Sicard D, Bely M,Dubourdieu D. 2009. Genetic improvement of thermo-tolerance in wineSaccharomyces cerevisiae strains by a backcross approach. FEMS Yeast Res.9:1148 –1160. http://dx.doi.org/10.1111/j.1567-1364.2009.00550.x.
43. Sasano Y, Takahashi S, Shima J, Takagi H. 2010. Antioxidant N-acetyltransferase Mpr1/2 of industrial baker’s yeast enhances fermenta-tion ability after air-drying stress in bread dough. Int. J. Food Microbiol.138:181–185. http://dx.doi.org/10.1016/j.ijfoodmicro.2010.01.001.
44. Orozco H, Matallana E, Aranda A. 2012. Oxidative stress tolerance,adenylate cyclase, and autophagy are key players in the chronological lifespan of Saccharomyces cerevisiae during winemaking. Appl. Environ. Mi-crobiol. 78:2748 –2757. http://dx.doi.org/10.1128/AEM.07261-11.
Shiroma et al.
1012 aem.asm.org Applied and Environmental Microbiology
on June 12, 2018 by guesthttp://aem
.asm.org/
Dow
nloaded from