Embed Size (px)
Citation preview
INT RODUCT ION
Legislation and public interest for alternative fuels call for increasing
the use of ethanol/gasoline blends in the transportation industry. While
some regions of the world are driving to limit fossil fuel consumption
in non-transportation related applications or reduce greenhouse gas
emissions, others are focused on reducing their energy dependency on
imported oil1. The United States produced over 3.9 billion gallons of
ethanol in 2005, about a 120% increase from 2001. There are more
than 100 ethanol biorefineries in 19 states across the country and
more than an additional 110 worldwide. In the U.S. alone, the biore-
fineries have the capacity to produce more than 4.7 billion gallons of
ethanol a year.2 The production of ethanol from a renewable resource
such as corn utilizes a fermentation process with enzymes and yeast to
convert starches and sugars to ethanol. To improve the productivity of
the fermentation process, certain stress factors affecting the activity of
the yeast are carefully managed throughout the process. These include
monitoring the relative concentrations of glucose, ethanol, lactic acid,
and acetic acid.3
This information is then used to optimize fermentation conditions. HPLC
analysis can easily provide information about the critical components
and is widely used throughout the U.S. in producer labs. Typical HPLC
run times are 20 to 30 minutes.4
This note describes using a Waters® Breeze™ HPLC system to obtain the
necessary information in 10 minutes. With HPLC run times reduced by
more than 50%, plant operators can determine component concentra-
tions more quickly, resulting in superior fermentation process control.
Consequently, plant managers have the potential to increase ethanol
plant productivity and reduce loss due to fermentation failure.
FA S T H P L C A NA LYSIS FO R F E RM EN TAT IO N E T HA NO L P RO C E S S E S
Jinchuan Yang, Peter J. Lee, and Alice J. Di Gioia
Waters Corporation, Milford, MA U.S.A.
EXPERIMENTAL
Breeze system
1515 HPLC pump5, 717 plus autosampler, external column heating
module, 2414 RI detector, Breeze software.
Column: 7.8 x 150 mm IC-Pak™ Ion Exclusion
(WAT010295)
Pre-column 6.0 x 50 mm SH-1011P (WAT034243)
Column temp: 75 °C
Flow rate: 1.0 ml/min
Mobile phase: 0.5 mM sulfuric acid
Injection volume: 5 µl
RI sensitivity: 32
RI time constant: 0.2 seconds
Sampling rate: 5 pts/second
RI detection temp: 30 °C
Materials
Dextrin (Type I: from corn), maltotriose, maltose (monohydrate Grade
I), glucose monohydrate, L(+)-lactic acid (SigmaUltra, 98%), glycerol,
acetic acid 96.0% sulfuric acid (ACS reagent), and ethyl alcohol were
purchased from Sigma-Aldrich (Milwaukee, WI). The Ethanol Industry
Standard was purchased from Midland Scientific (Omaha, NE). Dextrin
is a mixture of polysaccharides containing a small amount of low
molecular weight polysaccharides6. Chromatography indicated 92.1%
polysaccharide with more than 3 glucose units, 2.7% maltotriose (3
glucose units), 1.7% maltose (2 glucose units), 2.6% glucose, and
0.9% unidentified oligosaccharide7. This data was used in to calculate
the standard concentrations.
RESULTS AND DISCUSSION
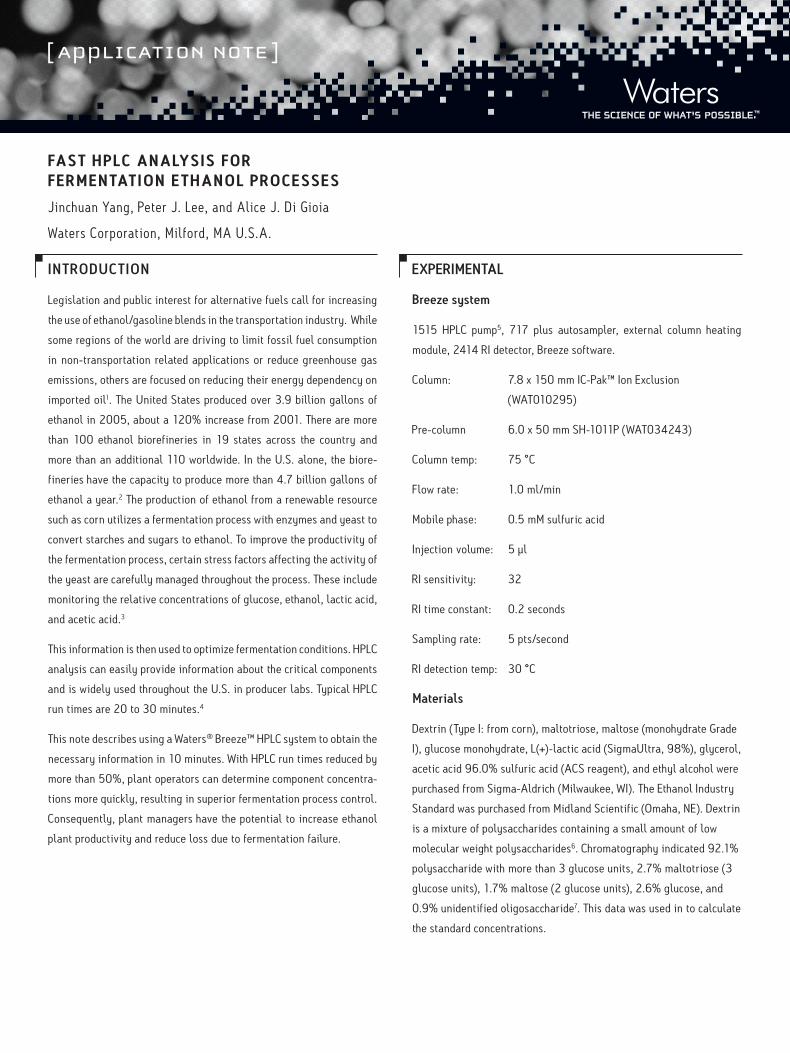
Ethanol fermentation broth contains mostly sugars and alcohols. The
major components of interest are dextrin, maltotriose, maltose, glu-
cose, lactic acid, glycerol, acetic acid, and ethanol. The fast separation
shown in Figure 1 was optimized for these components on a Waters
system by changing a combination of column dimensions, column
temperature, and concentration of the mobile phase and flow rate
(see Experimental). The peaks were identified separately by obtaining
chromatograms of the individual components under the same condi-
tions. The calibration curves were generated automatically in Breeze
software from the chromatograms of a series of standard mixtures at
several concentrations. Table 1 summarizes calibration information.
RI (mV)
0 .0
1 0 0 .0
2 0 0 .0
3 0 0 .0
4 0 0 .0
5 0 0 .0
6 0 0 .0
7 0 0 .0
8 0 0 .0
9 0 0 .0
R eten tion T im e (M in )
0 .0 0 1 .0 0 2 .0 0 3 .0 0 4 .0 0 5 .0 0 6 .0 0 7 .0 0 8 .0 0 9 .0 0 1 0 .0 0
1
2
3 4
5
6
7
8
Figure 1. HPLC separation of 8 major fermenting mash components: 1. dextrin, 2. maltotriose, 3. maltose, 4. glucose, 5. lactic acid, 6. glycerol, 7. acetic acid, and 8. ethanol.
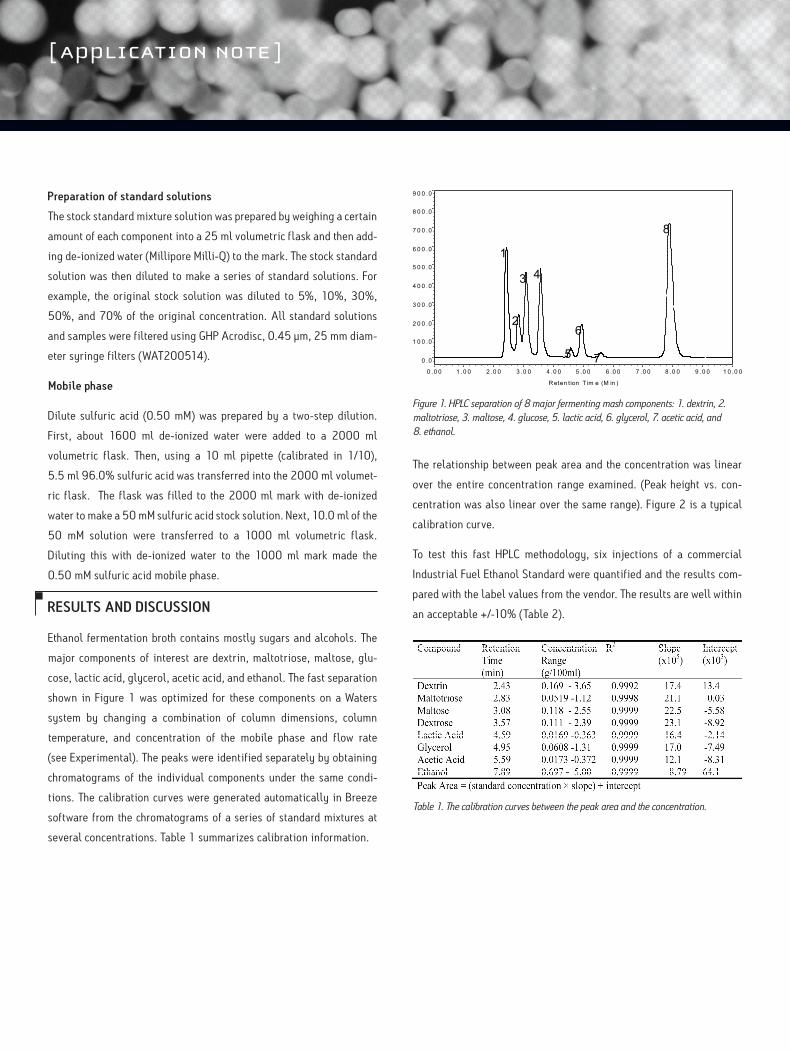
The relationship between peak area and the concentration was linear
over the entire concentration range examined. (Peak height vs. con-
centration was also linear over the same range). Figure 2 is a typical
calibration curve.
To test this fast HPLC methodology, six injections of a commercial
Industrial Fuel Ethanol Standard were quantified and the results com-
pared with the label values from the vendor. The results are well within
an acceptable +/-10% (Table 2).
Table 1. The calibration curves between the peak area and the concentration.
Preparation of standard solutions
The stock standard mixture solution was prepared by weighing a certain
amount of each component into a 25 ml volumetric flask and then add-
ing de-ionized water (Millipore Milli-Q) to the mark. The stock standard
solution was then diluted to make a series of standard solutions. For
example, the original stock solution was diluted to 5%, 10%, 30%,
50%, and 70% of the original concentration. All standard solutions
and samples were filtered using GHP Acrodisc, 0.45 µm, 25 mm diam-
eter syringe filters (WAT200514).
Mobile phase
Dilute sulfuric acid (0.50 mM) was prepared by a two-step dilution.
First, about 1600 ml de-ionized water were added to a 2000 ml
volumetric flask. Then, using a 10 ml pipette (calibrated in 1/10),
5.5 ml 96.0% sulfuric acid was transferred into the 2000 ml volumet-
ric flask. The flask was filled to the 2000 ml mark with de-ionized
water to make a 50 mM sulfuric acid stock solution. Next, 10.0 ml of the
50 mM solution were transferred to a 1000 ml volumetric flask.
Diluting this with de-ionized water to the 1000 ml mark made the
0.50 mM sulfuric acid mobile phase.
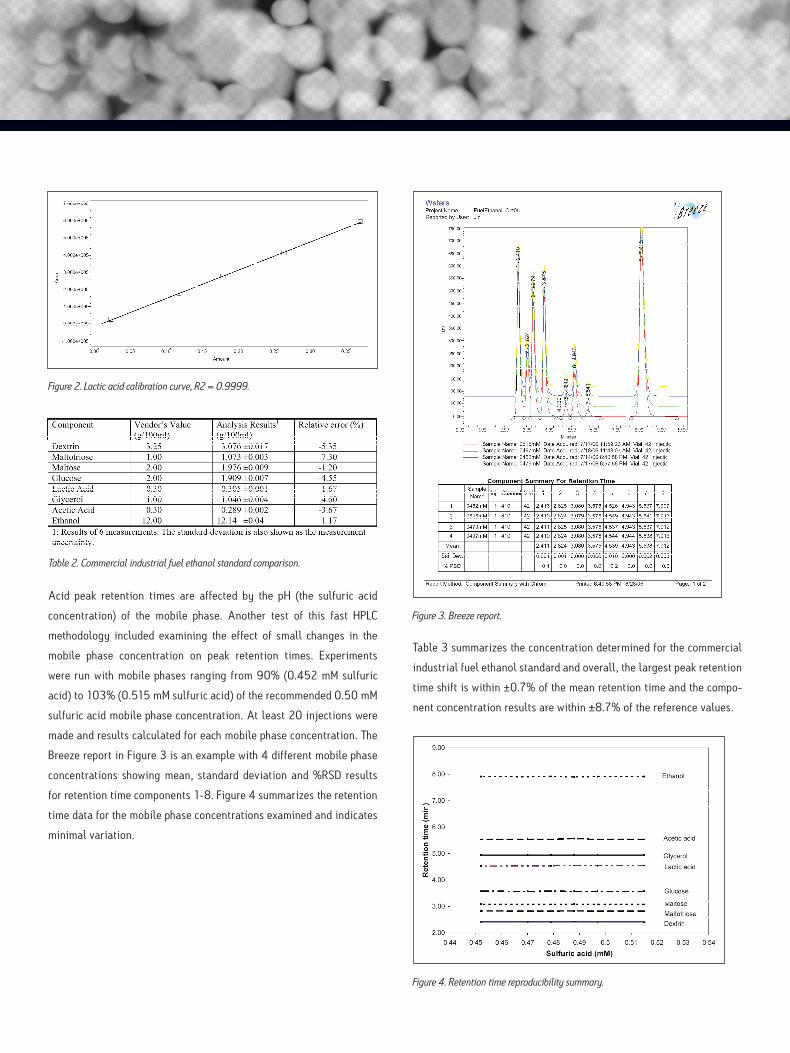
Figure 2. Lactic acid calibration curve, R2 = 0.9999.
Table 2. Commercial industrial fuel ethanol standard comparison.
Acid peak retention times are affected by the pH (the sulfuric acid
concentration) of the mobile phase. Another test of this fast HPLC
methodology included examining the effect of small changes in the
mobile phase concentration on peak retention times. Experiments
were run with mobile phases ranging from 90% (0.452 mM sulfuric
acid) to 103% (0.515 mM sulfuric acid) of the recommended 0.50 mM
sulfuric acid mobile phase concentration. At least 20 injections were
made and results calculated for each mobile phase concentration. The
Breeze report in Figure 3 is an example with 4 different mobile phase
concentrations showing mean, standard deviation and %RSD results
for retention time components 1-8. Figure 4 summarizes the retention
time data for the mobile phase concentrations examined and indicates
minimal variation.
Figure 3. Breeze report.
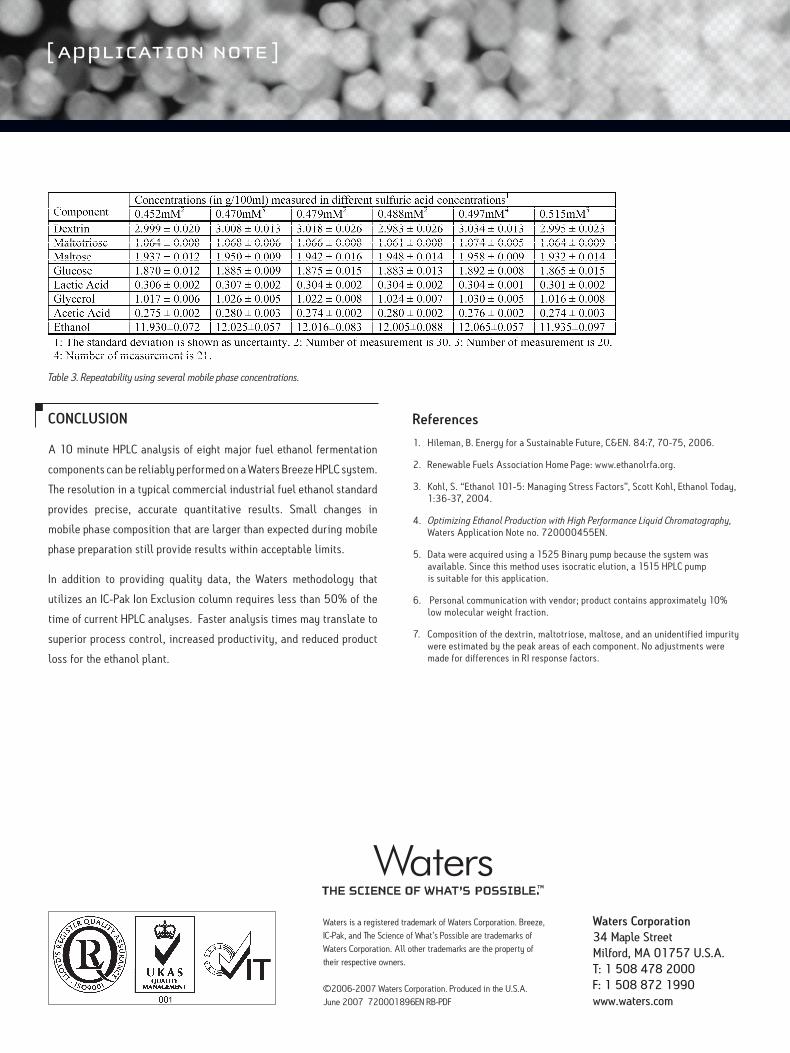
Table 3 summarizes the concentration determined for the commercial
industrial fuel ethanol standard and overall, the largest peak retention
time shift is within ±0.7% of the mean retention time and the compo-
nent concentration results are within ±8.7% of the reference values.
Figure 4. Retention time reproducibility summary.
Waters Corporation 34 Maple Street Milford, MA 01757 U.S.A. T: 1 508 478 2000 F: 1 508 872 1990 www.waters.com
References
1. Hileman, B. Energy for a Sustainable Future, C&EN. 84:7, 70-75, 2006.
2. Renewable Fuels Association Home Page: www.ethanolrfa.org.
3. Kohl, S. “Ethanol 101-5: Managing Stress Factors”, Scott Kohl, Ethanol Today, 1:36-37, 2004.
4. Optimizing Ethanol Production with High Performance Liquid Chromatography, Waters Application Note no. 720000455EN.
5. Data were acquired using a 1525 Binary pump because the system was available. Since this method uses isocratic elution, a 1515 HPLC pump is suitable for this application.
6. Personal communication with vendor; product contains approximately 10% low molecular weight fraction.
7. Composition of the dextrin, maltotriose, maltose, and an unidentified impurity were estimated by the peak areas of each component. No adjustments were made for differences in RI response factors.
Table 3. Repeatability using several mobile phase concentrations.
CONCLUSION
A 10 minute HPLC analysis of eight major fuel ethanol fermentation
components can be reliably performed on a Waters Breeze HPLC system.
The resolution in a typical commercial industrial fuel ethanol standard
provides precise, accurate quantitative results. Small changes in
mobile phase composition that are larger than expected during mobile
phase preparation still provide results within acceptable limits.
In addition to providing quality data, the Waters methodology that
utilizes an IC-Pak Ion Exclusion column requires less than 50% of the
time of current HPLC analyses. Faster analysis times may translate to
superior process control, increased productivity, and reduced product
loss for the ethanol plant.
Waters is a registered trademark of Waters Corporation. Breeze, IC-Pak, and The Science of What’s Possible are trademarks of Waters Corporation. All other trademarks are the property of their respective owners.
©2006-2007 Waters Corporation. Produced in the U.S.A. June 2007 720001896EN RB-PDF