Embed Size (px)
Citation preview
Enhanced wind turbine noise prediction tool SILANT
K. Boorsma J.G. Schepers
Presented at the Fourth International Meeting on Wind Turbine Noise,
12-14 April 2011, Rome, Italy
ECN-M--12-004 FEBRUARY 2012
Enhanced wind turbine noise prediction tool SILANT Page 1 of 16
Fourth International Meeting on Wind Turbine Noise
Rome Italy 12-14 April 2011
Enhanced wind turbine noise prediction tool SILANT
K. Boorsma, J.G. Schepers Energy research Centre of the Netherlands, Westerduinweg 3, 1755 LE, Petten, the Netherlands [email protected], [email protected]
Abstract
Wind turbine noise often is quantified in terms of time averaged overall sound power levels, whilst annoyance due to noise level fluctuations in mid- to high-range frequencies (‘swish’) are not taken into account. Recent experimental research on wind turbine noise has revealed the major causes of the swishing noise to be due to the directivity of the noise sources and convective amplification effects of the moving turbine blades. The findings have been incorporated in the noise prediction tool SILANT which in addition to sound power levels gives sound pressure level predictions for specified observer positions.
The noise sources that are taken into account are trailing edge, inflow and tip noise, using the models of Brooks, Pope and Marcolini (BPM) and Amiet and Lowson. The blade is divided into a number of independent elements for which effective inflow velocity and angle of attack information is a necessary input. A distinction is made between the various profiles along the blade span by including their boundary layer displacement thicknesses at the trailing edge in a profile database.
The propagation model includes directivity, convective amplification, Doppler shift and atmospheric absorption. The effect of the retarded time is taken into account individually for the separate elements along the blade span using the time dependent rotor azimuth position. A simple empirical model is applied to quantify meteorological effects influencing refraction and ground effects.
Prediction results are compared to SIROCCO project measurements from microphones positioned in a circle around a turbine. The high spatial and temporal resolution of the SILANT simulations gives new insights in the variation of wind turbine inflow and trailing edge noise as a function of observer position, rotor azimuth angle and frequency band. The influence of directivity is illustrated for the dominant noise sources.
Enhanced wind turbine noise prediction tool SILANT Page 2 of 16
1. Introduction
Wind turbine noise often is quantified in terms of time averaged overall sound power. The periodic nature of wind turbine operation introduces noise level fluctuations which vary around 1 Hz for modern wind turbines. Although these fluctuations are often perceived as annoying, they are not taken into account in modern guidelines for standardized measurements (1). Recent experimental research on wind turbine noise has revealed the major causes of the swishing noise to be due to the directivity of the noise sources and convective amplification effects of the moving turbine blades (2).
There have been many previous modeling efforts in the field of wind turbine noise, which for modern turbines mostly focus on aerodynamic noise from the blades (3). Mechanical noise is often not considered an important source, as long as tonal components are not present (4). Where rotational harmonics are dictating the low frequency spectrum for downwind rotors, they seem to be insignificant above 20 Hz for upwind placed rotors (5)(6). Both aerodynamic source modeling as well as its propagation have hence been subject of investigation, mostly for upwind placed rotors.
Source modeling ranges from simple empirical one-equation models to computational aeroacoustic (CAA) simulations resolving both the flow field and acoustic perturbations around the wind turbine blades (7). A compromise between accuracy and computational effort can be found in semi-empirical methods that divide the wind turbine blades into segments and treat these as two-dimensional airfoil sections producing incoherent sound sources (8). The most popular model for predicting these sectional sources is the Brooks, Pope and Marcolini (BPM) model (9). It includes a prediction method for turbulent boundary layer trailing edge noise, which is believed to be the dominant source for wind turbine applications (10). However, the TNO model (11) which includes a more physics based approach is currently under investigation by several parties for an enhanced prediction of this source (12).
For a propagation prediction the empirically calculated sources are often lumped together at the hub height and an estimate is made for the integrated directivity of the sources. However, to properly predict the time varying noise, it is necessary to calculate propagation separately for each blade segment, especially in the vicinity of the turbine. For a proper evaluation of wind turbine noise it is argued that it is not sufficient to solely determine the emission level. The ECN program SILANT has been improved to take into account these effects, which are the subject of the current investigation.
The content of the present paper is as follows. Firstly the noise model used in SILANT is described, including both source and propagation modeling. The model and its implementation are then validated by comparing its results to field measurements. The properties of the simulated sound field around the turbine are discussed. Finally the effect of wind shear and the tower on both emission and immission are evaluated.
Enhanced wind turbine noise prediction tool SILANT Page 3 of 16
2. Model
SILANT originated in 1996 from a Dutch consortium consisting of Stork Product Engineering BV, the Netherlands Organisation for Applied Scientific Research (TNO) and the Dutch Aerospace Laboratory (NLR). The model was designed to calculate noise emission of wind turbines, based on the sources that are considered most important: trailing edge noise (including separation-stall noise) and inflow noise. After ECN became the manager of the tool several improvements have been made, partly in cooperation with NLR. The improvements include the addition of models for prediction of tip noise and propagation effects.
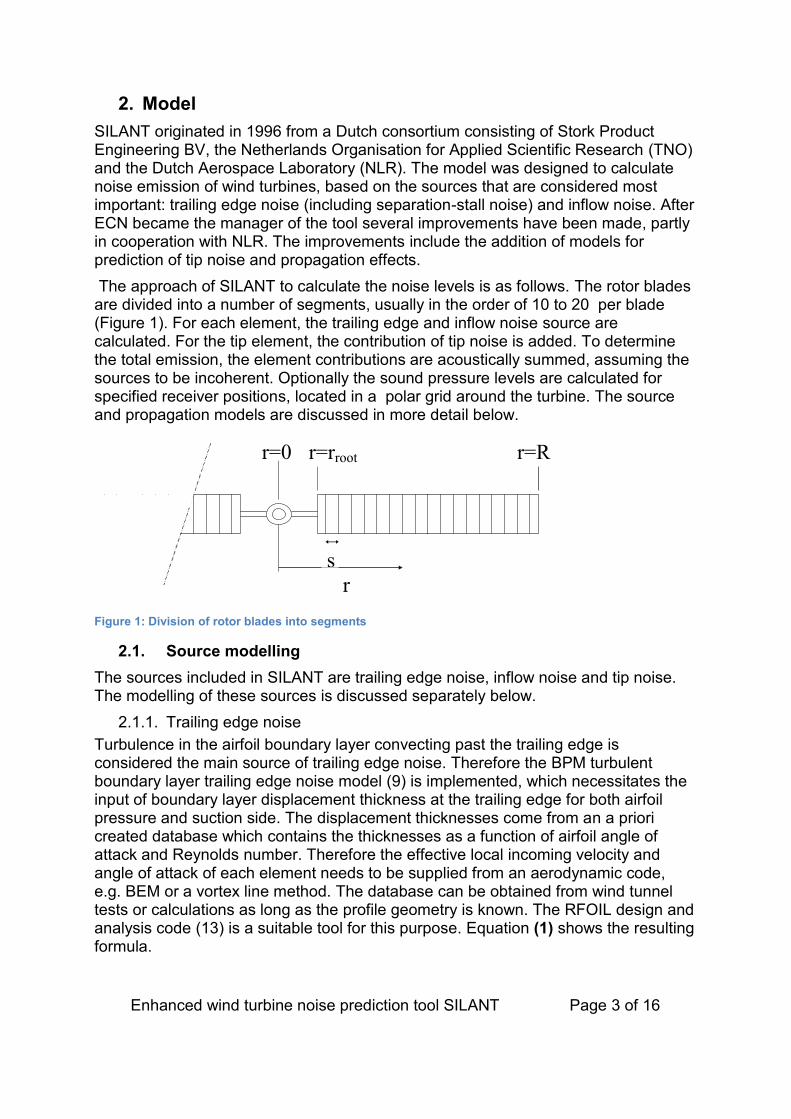
The approach of SILANT to calculate the noise levels is as follows. The rotor blades are divided into a number of segments, usually in the order of 10 to 20 per blade (Figure 1). For each element, the trailing edge and inflow noise source are calculated. For the tip element, the contribution of tip noise is added. To determine the total emission, the element contributions are acoustically summed, assuming the sources to be incoherent. Optionally the sound pressure levels are calculated for specified receiver positions, located in a polar grid around the turbine. The source and propagation models are discussed in more detail below.
r=rroot r=0 r=R
s r
Figure 1: Division of rotor blades into segments
2.1. Source modelling
The sources included in SILANT are trailing edge noise, inflow noise and tip noise. The modelling of these sources is discussed separately below.
2.1.1. Trailing edge noise
Turbulence in the airfoil boundary layer convecting past the trailing edge is considered the main source of trailing edge noise. Therefore the BPM turbulent boundary layer trailing edge noise model (9) is implemented, which necessitates the input of boundary layer displacement thickness at the trailing edge for both airfoil pressure and suction side. The displacement thicknesses come from an a priori created database which contains the thicknesses as a function of airfoil angle of attack and Reynolds number. Therefore the effective local incoming velocity and angle of attack of each element needs to be supplied from an aerodynamic code, e.g. BEM or a vortex line method. The database can be obtained from wind tunnel tests or calculations as long as the profile geometry is known. The RFOIL design and analysis code (13) is a suitable tool for this purpose. Equation (1) shows the resulting formula.
Enhanced wind turbine noise prediction tool SILANT Page 4 of 16
(1)
The spectral shape is determined using the frequency dependent function A. For angles of attack above stall there is a contribution of the separated flow with the airfoil solid surface. The model then switches to separation-stall noise by modifying the frequency dependent function A.
2.1.2. Inflow noise
The interaction of the airfoil with turbulence in the oncoming flow results in inflow noise. The model of Amiet (14) and Lowson (15) is used for prediction of this noise type, using formula (2) below.
(2)
The spectral shape is determined using the frequency dependent function B. The turbulence length scale and variance of turbulent velocity fluctuations are determined using the specified roughness length and element height as defined by ESDU (16).
2.1.3. Tip noise
The formation of the tip vortex creates turbulent flow interacting with the trailing edge of the airfoil tip region. This contribution is only calculated for the tip element using the BPM model (9). The level and spectral content of the tip noise are determined using the spanwise extent of separation l at the trailing edge due to the tip vortex. Equation (3) shows the resulting formula.
Enhanced wind turbine noise prediction tool SILANT Page 5 of 16
(3)
The spectral shape is determined using the frequency dependent function C. The spanwise extent of separation is determined using
. (4)
The above equation (4) is only valid for rounded blade tips.
2.2. Propagation model
The propagation effects are calculated separately for each element-receiver combination and source. Tip noise is treated as trailing edge noise for this purpose. The actual turbine geometry (i.e. location, orientation and velocity of each element) is determined from specified radial location, hub height, pitch-, tilt- and cone angle, azimuth position and rotational speed. Equation (5) shows how the contributions are incorporated to obtain the immission of an element-receiver combination.
(5)
After the propagation effects have been incorporated, A-weighting of the sound pressure levels can be applied. The different contributions of the propagation model are discussed separately below.
2.2.1. Directivity
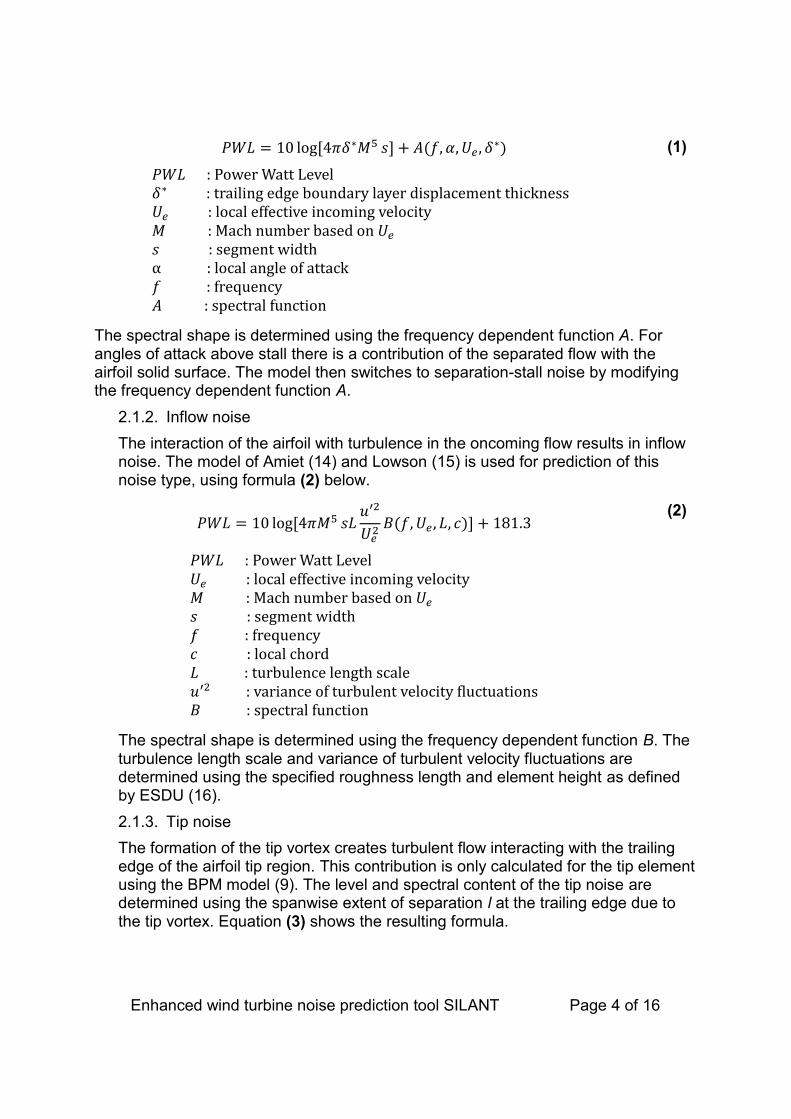
Directivity is source type dependent, and equation (6) and Figure 2 demonstrate the directivity functions used for trailing edge and inflow noise.
Enhanced wind turbine noise prediction tool SILANT Page 6 of 16
Figure 2: Definition of directivity angles from (9)
igure igure
(6)
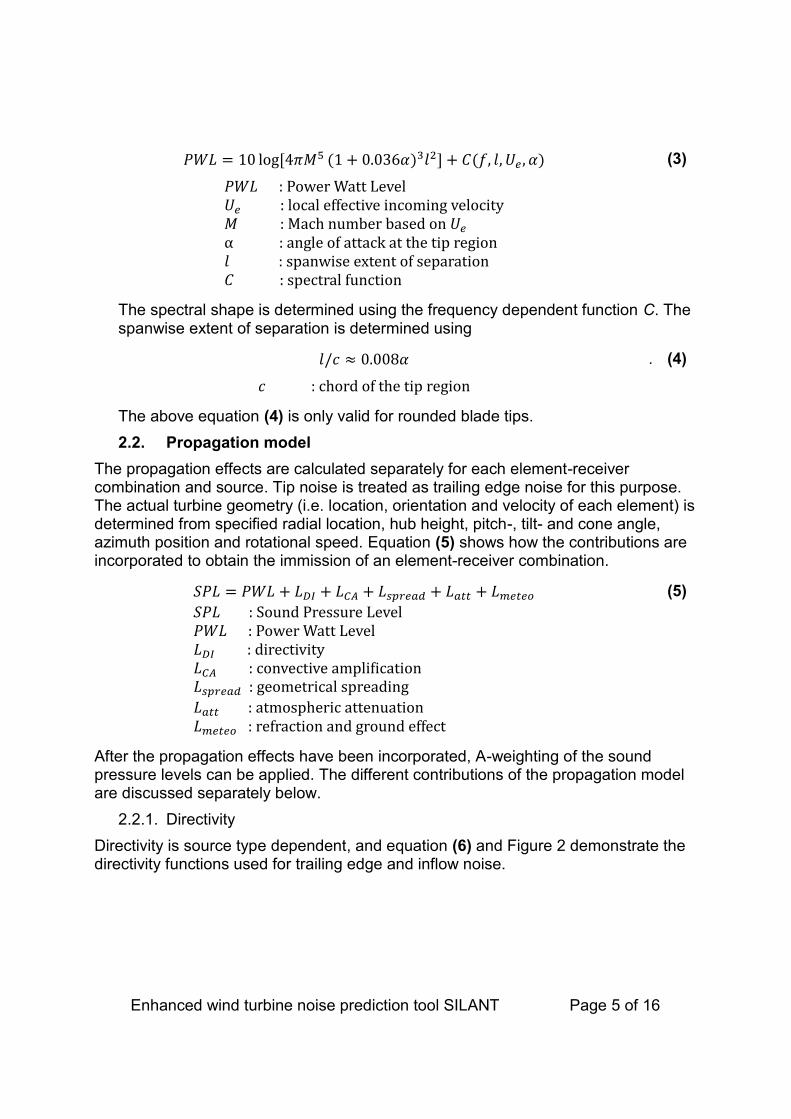
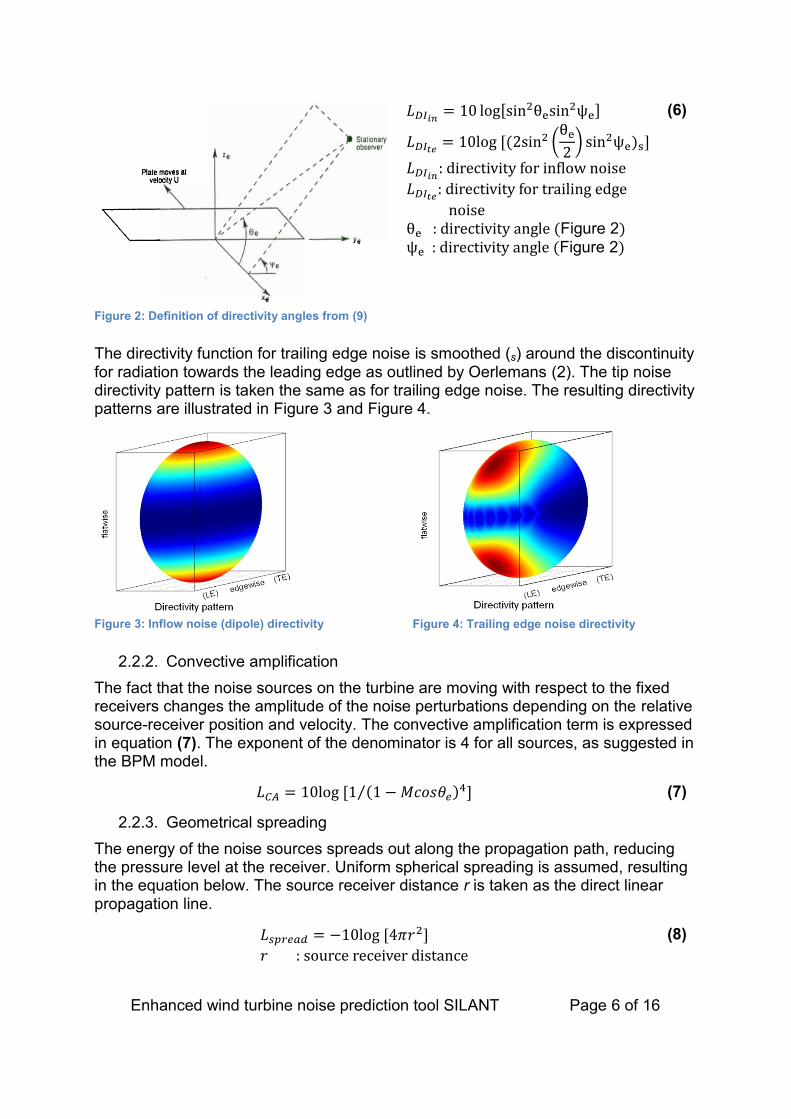
The directivity function for trailing edge noise is smoothed (s) around the discontinuity for radiation towards the leading edge as outlined by Oerlemans (2). The tip noise directivity pattern is taken the same as for trailing edge noise. The resulting directivity patterns are illustrated in Figure 3 and Figure 4.
Figure 3: Inflow noise (dipole) directivity
Figure 4: Trailing edge noise directivity
2.2.2. Convective amplification
The fact that the noise sources on the turbine are moving with respect to the fixed receivers changes the amplitude of the noise perturbations depending on the relative source-receiver position and velocity. The convective amplification term is expressed in equation (7). The exponent of the denominator is 4 for all sources, as suggested in the BPM model.
(7)
2.2.3. Geometrical spreading
The energy of the noise sources spreads out along the propagation path, reducing the pressure level at the receiver. Uniform spherical spreading is assumed, resulting in the equation below. The source receiver distance r is taken as the direct linear propagation line.
(8)
Enhanced wind turbine noise prediction tool SILANT Page 7 of 16
2.2.4. Atmospheric attenuation
Air friction causes the acoustic perturbations to be absorbed by the atmosphere, depending on frequency temperature and humidity.
(9)
The attenuation coefficient is determined from the ICAO standard (17) . The temperature is fixed to 288 K and the relative humidity to 50%.
2.2.5. Refraction and ground effect
Temperature and velocity gradients result in refraction of the sound rays. At sufficient upstream distance this can result in a shadow zone. Angle of incidence with respect to the ground will change due to refraction, which influences the way sound rays are absorbed or reflected by the ground. A relatively simple model (18) is implemented to take into account these frequency dependent effects for a flat terrain with soft (grass type) ground. Temperature gradients are neglected.
(10)
The shadow zone location and angle of incidence are estimated from the meteorological conditions and the source receiver geometry (18).
2.2.6. Doppler effect
A source approaching a receiver will results in a higher observed frequency and vice versa. This Doppler effect is accounted for using the equation below.
(11)
2.2.7. Retarded time effect
To estimate the temporal variation of the noise immision it is necessary to take the travel time of the sound waves into account.
(12)
The effective speed of sound is taken as the speed of sound taking into account wind velocity and direction at a height above the receiver of 80% of the vertical source receiver distance.
Enhanced wind turbine noise prediction tool SILANT Page 8 of 16
3. Validation
The SIROCCO field measurements (19) are used to validate the SILANT software package. Firstly the measurement set-up is discussed, then both calculated emission and immision characteristics are compared to the measured values.
3.1. Description of field measurements
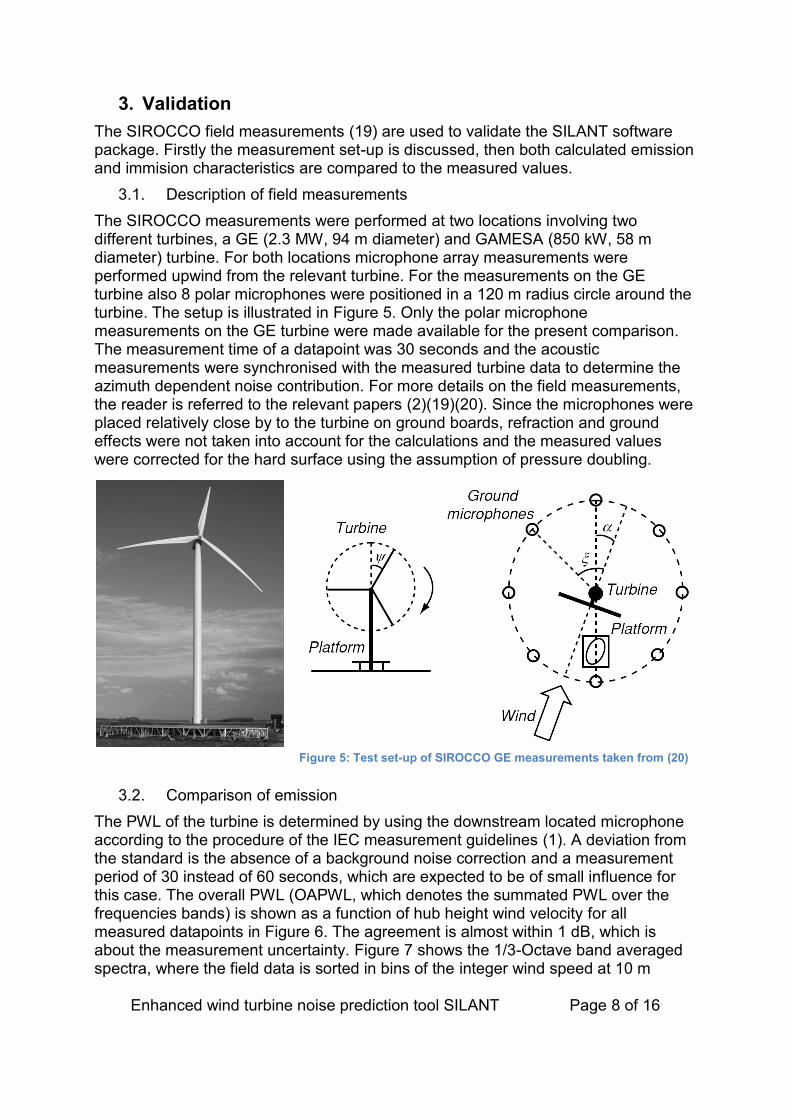
The SIROCCO measurements were performed at two locations involving two different turbines, a GE (2.3 MW, 94 m diameter) and GAMESA (850 kW, 58 m diameter) turbine. For both locations microphone array measurements were performed upwind from the relevant turbine. For the measurements on the GE turbine also 8 polar microphones were positioned in a 120 m radius circle around the turbine. The setup is illustrated in Figure 5. Only the polar microphone measurements on the GE turbine were made available for the present comparison. The measurement time of a datapoint was 30 seconds and the acoustic measurements were synchronised with the measured turbine data to determine the azimuth dependent noise contribution. For more details on the field measurements, the reader is referred to the relevant papers (2)(19)(20). Since the microphones were placed relatively close by to the turbine on ground boards, refraction and ground effects were not taken into account for the calculations and the measured values were corrected for the hard surface using the assumption of pressure doubling.
Figure 5: Test set-up of SIROCCO GE measurements taken from (20)
3.2. Comparison of emission
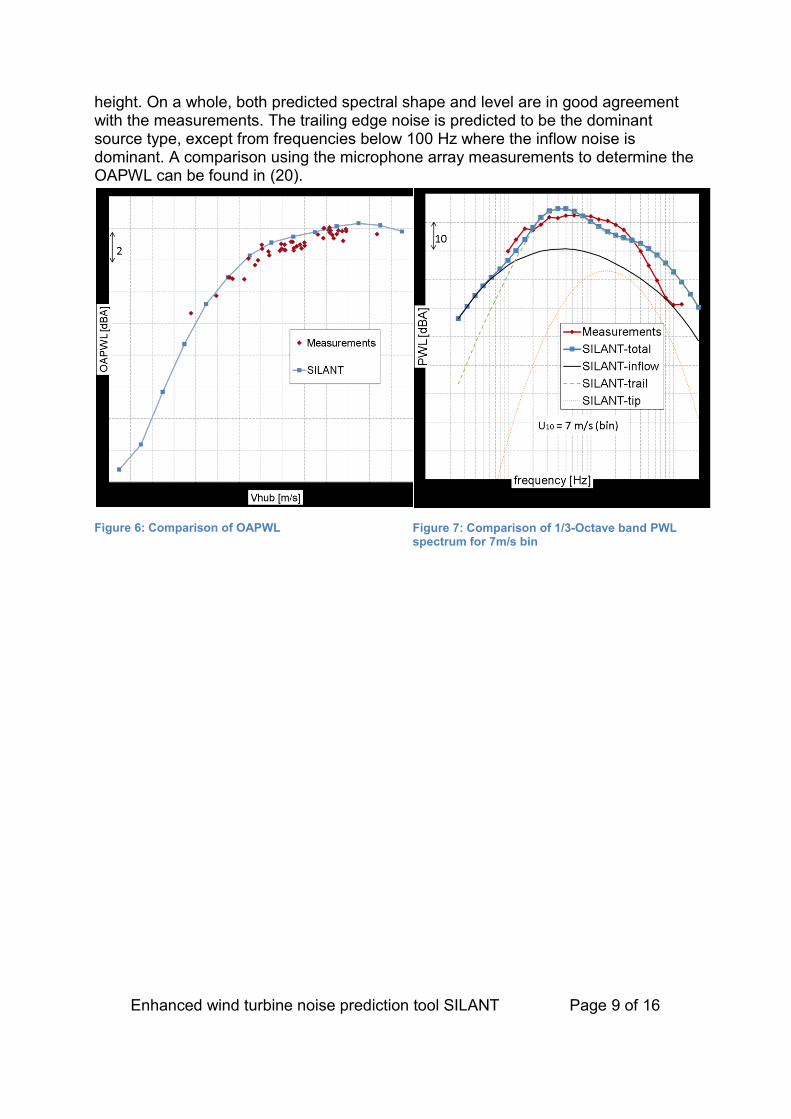
The PWL of the turbine is determined by using the downstream located microphone according to the procedure of the IEC measurement guidelines (1). A deviation from the standard is the absence of a background noise correction and a measurement period of 30 instead of 60 seconds, which are expected to be of small influence for this case. The overall PWL (OAPWL, which denotes the summated PWL over the frequencies bands) is shown as a function of hub height wind velocity for all measured datapoints in Figure 6. The agreement is almost within 1 dB, which is about the measurement uncertainty. Figure 7 shows the 1/3-Octave band averaged spectra, where the field data is sorted in bins of the integer wind speed at 10 m
Enhanced wind turbine noise prediction tool SILANT Page 9 of 16
height. On a whole, both predicted spectral shape and level are in good agreement with the measurements. The trailing edge noise is predicted to be the dominant source type, except from frequencies below 100 Hz where the inflow noise is dominant. A comparison using the microphone array measurements to determine the OAPWL can be found in (20).
Figure 6: Comparison of OAPWL
Figure 7: Comparison of 1/3-Octave band PWL spectrum for 7m/s bin
Enhanced wind turbine noise prediction tool SILANT Page 10 of 16
3.3. Comparison of immission
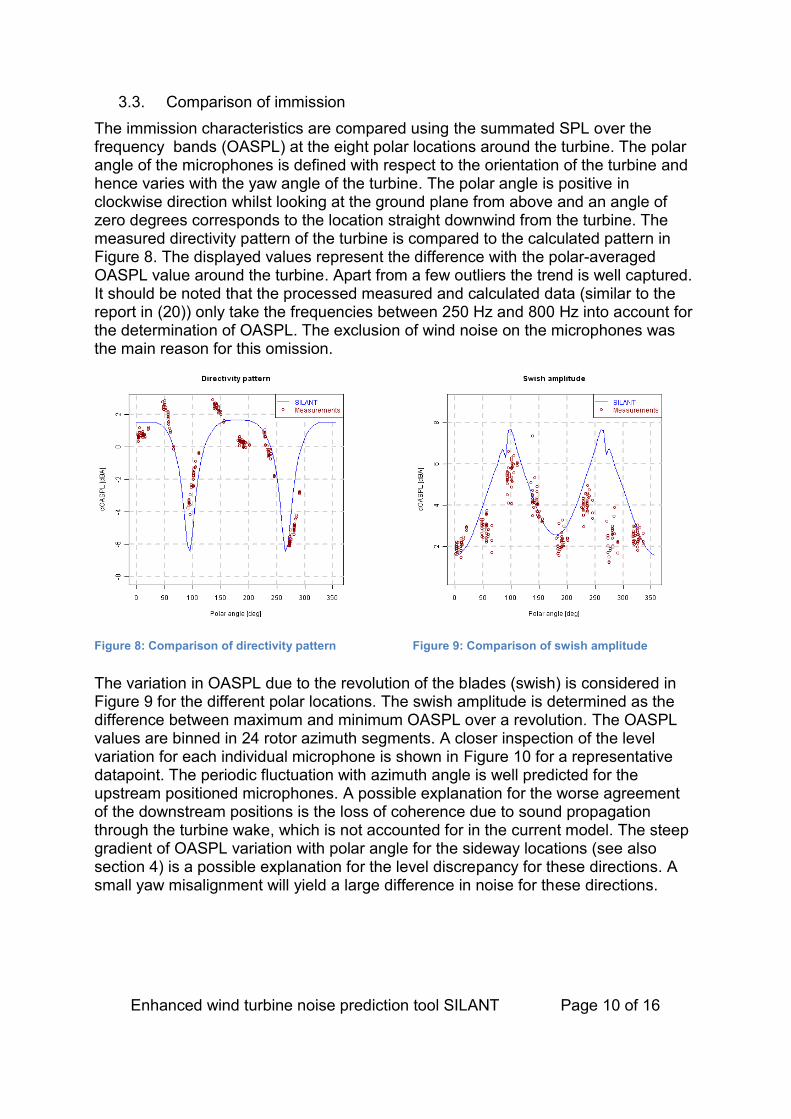
The immission characteristics are compared using the summated SPL over the frequency bands (OASPL) at the eight polar locations around the turbine. The polar angle of the microphones is defined with respect to the orientation of the turbine and hence varies with the yaw angle of the turbine. The polar angle is positive in clockwise direction whilst looking at the ground plane from above and an angle of zero degrees corresponds to the location straight downwind from the turbine. The measured directivity pattern of the turbine is compared to the calculated pattern in Figure 8. The displayed values represent the difference with the polar-averaged OASPL value around the turbine. Apart from a few outliers the trend is well captured. It should be noted that the processed measured and calculated data (similar to the report in (20)) only take the frequencies between 250 Hz and 800 Hz into account for the determination of OASPL. The exclusion of wind noise on the microphones was the main reason for this omission.
Figure 8: Comparison of directivity pattern
Figure 9: Comparison of swish amplitude
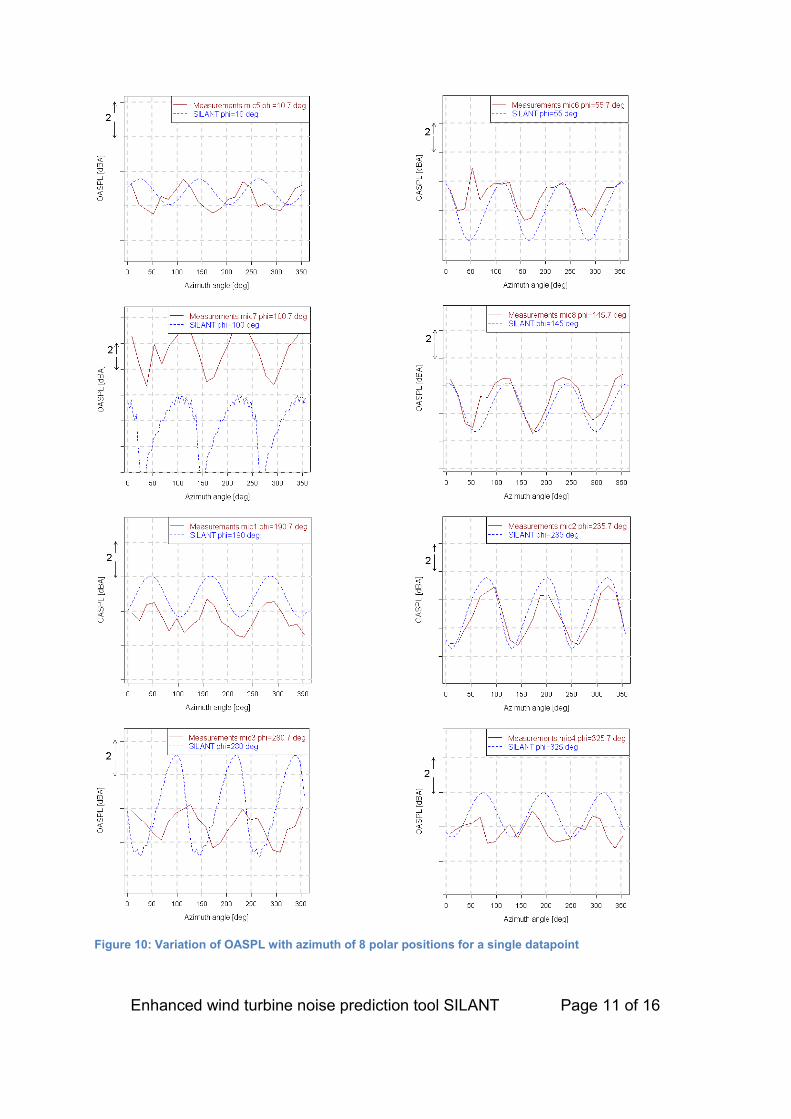
The variation in OASPL due to the revolution of the blades (swish) is considered in Figure 9 for the different polar locations. The swish amplitude is determined as the difference between maximum and minimum OASPL over a revolution. The OASPL values are binned in 24 rotor azimuth segments. A closer inspection of the level variation for each individual microphone is shown in Figure 10 for a representative datapoint. The periodic fluctuation with azimuth angle is well predicted for the upstream positioned microphones. A possible explanation for the worse agreement of the downstream positions is the loss of coherence due to sound propagation through the turbine wake, which is not accounted for in the current model. The steep gradient of OASPL variation with polar angle for the sideway locations (see also section 4) is a possible explanation for the level discrepancy for these directions. A small yaw misalignment will yield a large difference in noise for these directions.
Enhanced wind turbine noise prediction tool SILANT Page 11 of 16
Figure 10: Variation of OASPL with azimuth of 8 polar positions for a single datapoint
Enhanced wind turbine noise prediction tool SILANT Page 12 of 16
4. Source directivity
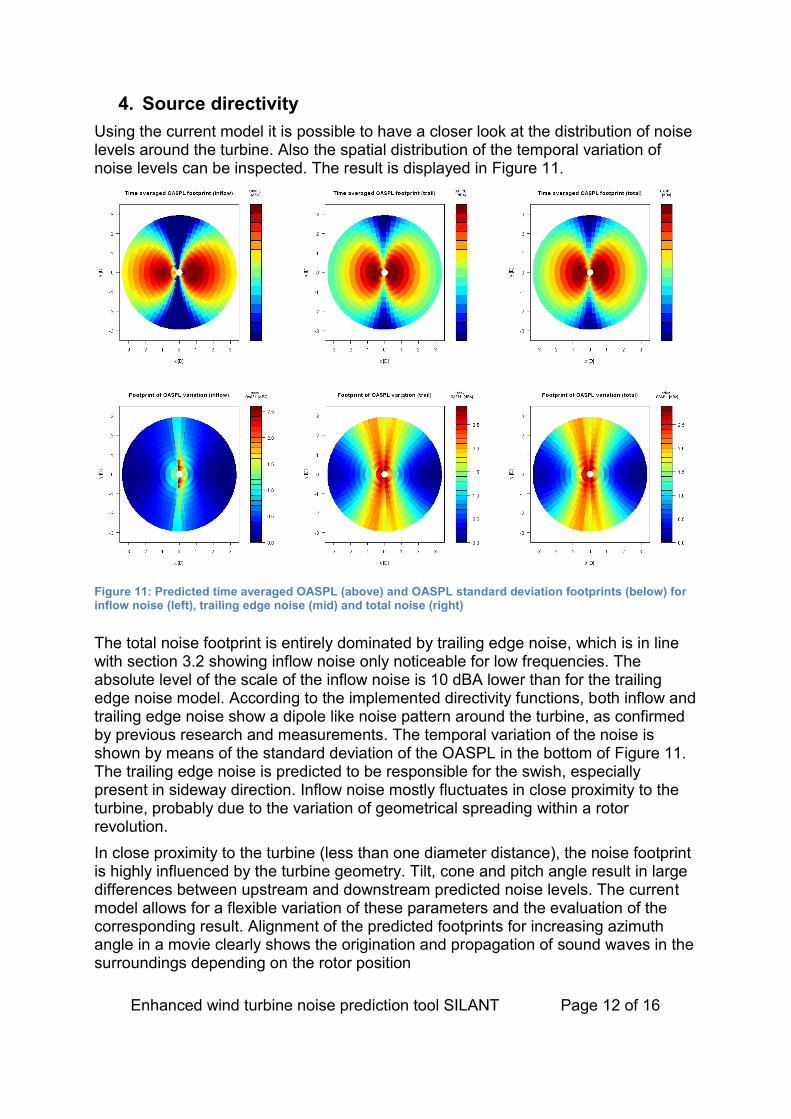
Using the current model it is possible to have a closer look at the distribution of noise levels around the turbine. Also the spatial distribution of the temporal variation of noise levels can be inspected. The result is displayed in Figure 11.
Figure 11: Predicted time averaged OASPL (above) and OASPL standard deviation footprints (below) for inflow noise (left), trailing edge noise (mid) and total noise (right)
The total noise footprint is entirely dominated by trailing edge noise, which is in line with section 3.2 showing inflow noise only noticeable for low frequencies. The absolute level of the scale of the inflow noise is 10 dBA lower than for the trailing edge noise model. According to the implemented directivity functions, both inflow and trailing edge noise show a dipole like noise pattern around the turbine, as confirmed by previous research and measurements. The temporal variation of the noise is shown by means of the standard deviation of the OASPL in the bottom of Figure 11. The trailing edge noise is predicted to be responsible for the swish, especially present in sideway direction. Inflow noise mostly fluctuates in close proximity to the turbine, probably due to the variation of geometrical spreading within a rotor revolution.
In close proximity to the turbine (less than one diameter distance), the noise footprint is highly influenced by the turbine geometry. Tilt, cone and pitch angle result in large differences between upstream and downstream predicted noise levels. The current model allows for a flexible variation of these parameters and the evaluation of the corresponding result. Alignment of the predicted footprints for increasing azimuth angle in a movie clearly shows the origination and propagation of sound waves in the surroundings depending on the rotor position
Enhanced wind turbine noise prediction tool SILANT Page 13 of 16
5. Wind shear and tower effect
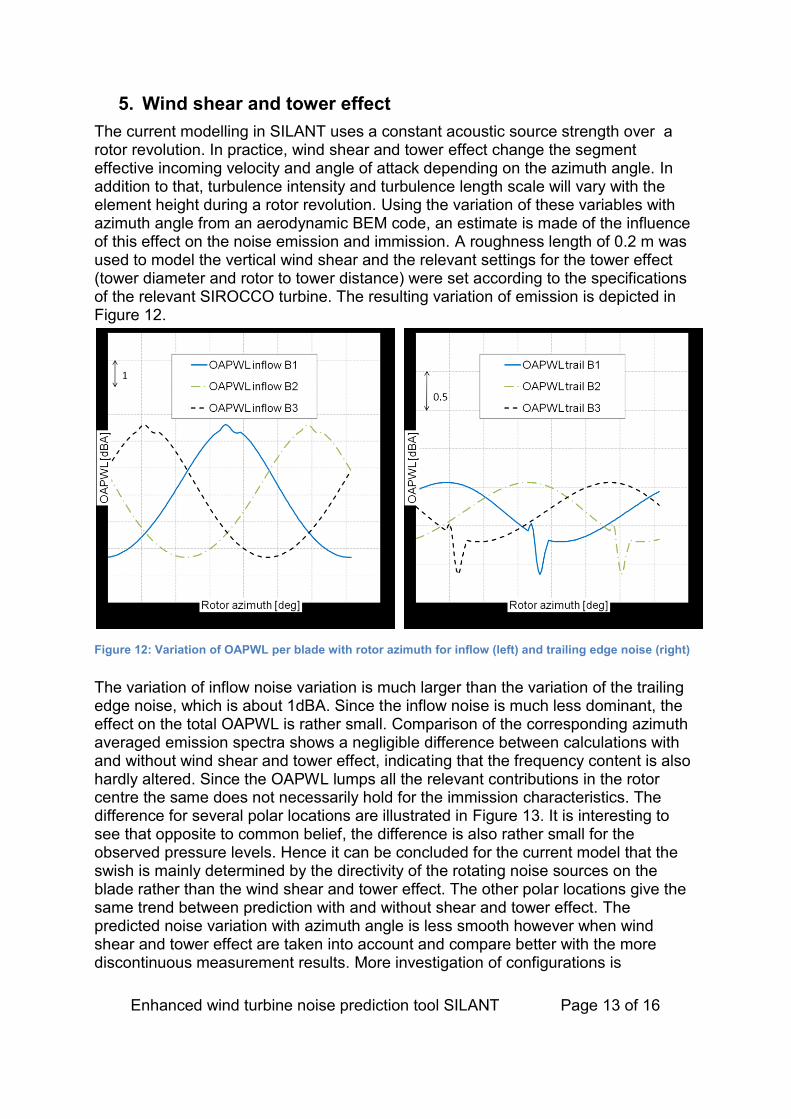
The current modelling in SILANT uses a constant acoustic source strength over a rotor revolution. In practice, wind shear and tower effect change the segment effective incoming velocity and angle of attack depending on the azimuth angle. In addition to that, turbulence intensity and turbulence length scale will vary with the element height during a rotor revolution. Using the variation of these variables with azimuth angle from an aerodynamic BEM code, an estimate is made of the influence of this effect on the noise emission and immission. A roughness length of 0.2 m was used to model the vertical wind shear and the relevant settings for the tower effect (tower diameter and rotor to tower distance) were set according to the specifications of the relevant SIROCCO turbine. The resulting variation of emission is depicted in Figure 12.
Figure 12: Variation of OAPWL per blade with rotor azimuth for inflow (left) and trailing edge noise (right)
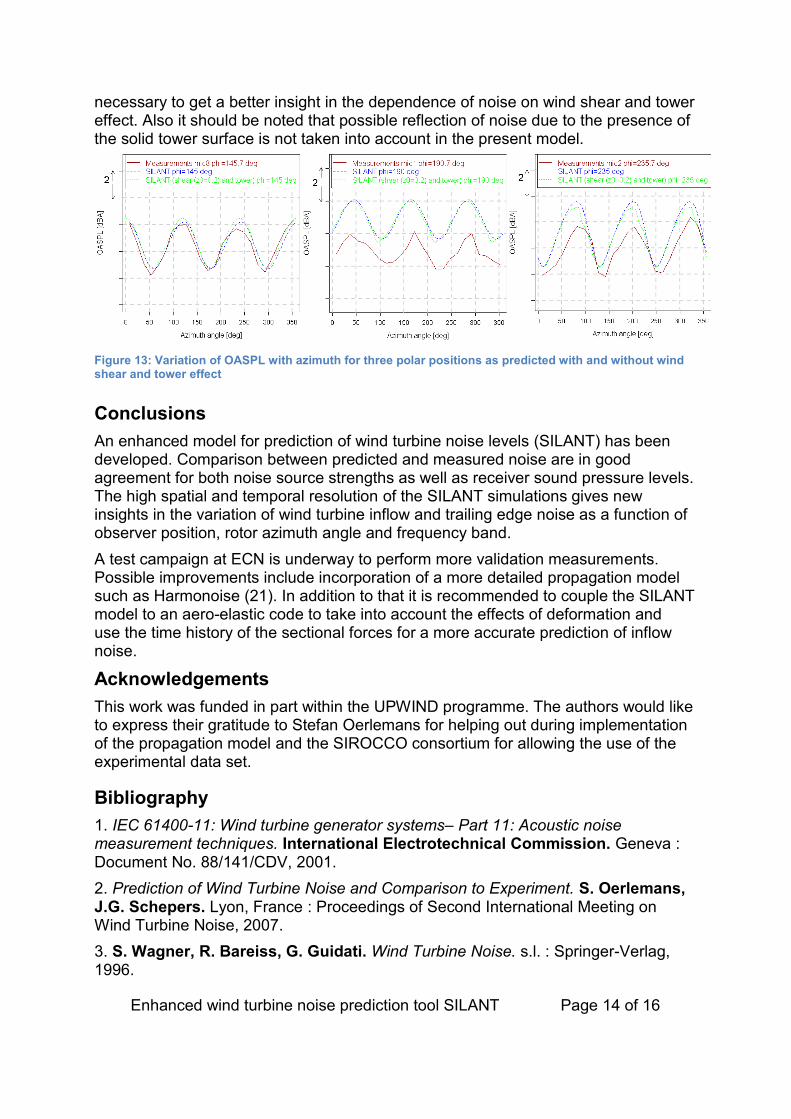
The variation of inflow noise variation is much larger than the variation of the trailing edge noise, which is about 1dBA. Since the inflow noise is much less dominant, the effect on the total OAPWL is rather small. Comparison of the corresponding azimuth averaged emission spectra shows a negligible difference between calculations with and without wind shear and tower effect, indicating that the frequency content is also hardly altered. Since the OAPWL lumps all the relevant contributions in the rotor centre the same does not necessarily hold for the immission characteristics. The difference for several polar locations are illustrated in Figure 13. It is interesting to see that opposite to common belief, the difference is also rather small for the observed pressure levels. Hence it can be concluded for the current model that the swish is mainly determined by the directivity of the rotating noise sources on the blade rather than the wind shear and tower effect. The other polar locations give the same trend between prediction with and without shear and tower effect. The predicted noise variation with azimuth angle is less smooth however when wind shear and tower effect are taken into account and compare better with the more discontinuous measurement results. More investigation of configurations is
Enhanced wind turbine noise prediction tool SILANT Page 14 of 16
necessary to get a better insight in the dependence of noise on wind shear and tower effect. Also it should be noted that possible reflection of noise due to the presence of the solid tower surface is not taken into account in the present model.
Figure 13: Variation of OASPL with azimuth for three polar positions as predicted with and without wind shear and tower effect
Conclusions
An enhanced model for prediction of wind turbine noise levels (SILANT) has been developed. Comparison between predicted and measured noise are in good agreement for both noise source strengths as well as receiver sound pressure levels. The high spatial and temporal resolution of the SILANT simulations gives new insights in the variation of wind turbine inflow and trailing edge noise as a function of observer position, rotor azimuth angle and frequency band.
A test campaign at ECN is underway to perform more validation measurements. Possible improvements include incorporation of a more detailed propagation model such as Harmonoise (21). In addition to that it is recommended to couple the SILANT model to an aero-elastic code to take into account the effects of deformation and use the time history of the sectional forces for a more accurate prediction of inflow noise.
Acknowledgements
This work was funded in part within the UPWIND programme. The authors would like to express their gratitude to Stefan Oerlemans for helping out during implementation of the propagation model and the SIROCCO consortium for allowing the use of the experimental data set.
Bibliography
1. IEC 61400-11: Wind turbine generator systems– Part 11: Acoustic noise measurement techniques. International Electrotechnical Commission. Geneva : Document No. 88/141/CDV, 2001.
2. Prediction of Wind Turbine Noise and Comparison to Experiment. S. Oerlemans, J.G. Schepers. Lyon, France : Proceedings of Second International Meeting on Wind Turbine Noise, 2007.
3. S. Wagner, R. Bareiss, G. Guidati. Wind Turbine Noise. s.l. : Springer-Verlag, 1996.

Enhanced wind turbine noise prediction tool SILANT Page 15 of 16
4. Mechanical Noise from Wind Turbines. J.N. Pinder. s.l. : Wind Engineering, 1992, Vol. 16 Nr. 3.
5. H.H. Hubbard, K.P. Shepherd. Wind Turbine Acoustics. s.l. : NASA-TP-3057, 1990.
6. Madsen, H.A. Low frequency noise from MW wind turbines -- mechanisms of generation and its modeling. Roskilde : Risoe-R-1637(EN), 2008.
7. An Aeroacoustic Analysis of Wind Turbines. P.J. Morris, L.N. Long, K.S. Brentner. Reno, Nevada : 42nd AIAA Aerospace Sciences Meeting and Exhibit, 2004.
8. P. Fuglsang, H.A. Madsen. Implementation and Verification of an Aeroacoustic Noise Prediction Model for Wind Turbines. s.l. : Risoe-R-867(EN), 1996.
9. T.F. Brooks, D.S. Pope, M.A. Marcolini. Airfoil self noise and prediction. s.l. : NASA Reference publication 1218, 1989.
10. Localisation and Quantification of Noise Sources on a Wind Turbine. S. Oerlemans, B.M. Lopez. Berlin : Wind Turbine Noise: Perspectives for Flow Control, 2005.
11. R.Parchen. Progress report DRAW, a prediction scheme for trailing-edge noise based on detailed boundary-layer characteristics. s.l. : TNO Institute of Applied Physics report HAG-RPT-980023, 1998.
12. F. Bertagnolio. Trailing Edge Noise Model Applied to Wind Turbine Airfoils. s.l. : Risoe-R-1633(EN), 2008.
13. B. Montgomerie, A. Brand, J. Bosschers, R. van Rooij. Three-dimensional effects in stall. s.l. : ECN-C-96-079, 1997.
14. Acoustic radiation from and airfoil in a turbulent stream. R.K. Amiet . s.l. : Journal of Sound and Vibration, 1975, Vol. 41(4).
15. M.V. Lowson. Assessment and prediction of wind turbine noise. s.l. : ETSU W/13/00284/REP, 1993.
16. Characteristics of Atmospheric Turbulence near the Ground. ESDU. s.l. : report ESDU 85020 , 1985.
17. International Civil Aviation Organization. International Standards and Reommended Practices, Environmental Protection. 1988. Annex 16, Volume I, Appendix I, section 8, 2nd edition.
18. A. van Beek, B. van den Haspel. Noise contours for wind turbines (in Dutch). s.l. : Centrum voor energiebesparing en schone technologie, 1989. CE.87.1.1.
19. SIROCCO: SIlent ROtors by aCoustiC Optimization. J.G. Schepers, A. Curvers, S. Oerlemans, K. Braun, Th. Lutz, A. Herrig, W. Wuerz. Lyon, France : Wind Turbine Noise-2007, 2007.
20. Prediction of wind turbine noise and validation against experiment. S. Oerlemans, J.G. Schepers. s.l. : International journal of aeroacoustics, 2009, Vol. 8(6).

Enhanced wind turbine noise prediction tool SILANT Page 16 of 16
21. Harmonoise WP 3 Engineering method for road traffic and railway noise after validation and fine-tuning. R. Nota, R. Barelds, D. van Maercke. s.l. : Technical Report HAR32TR-040922-DGMR20 of Harmonoise WP3 working group, 2005.


![Development of Improved Bond Coat for Enhanced Turbine ... · TBC spallation life of monolithic NiAl intermetallics with minor element additions (compositions in atomic %) [7] The](https://img.pdfslide.us/doc/110x75/5c8a365b09d3f2ac578c602d/development-of-improved-bond-coat-for-enhanced-turbine-tbc-spallation-life.jpg)