Embed Size (px)
Citation preview
Clemson University Clemson University
TigerPrints TigerPrints
All Theses Theses
December 2019
Enhanced Oil Recovery Using Silica Nanoparticles: Sandpack Enhanced Oil Recovery Using Silica Nanoparticles: Sandpack
Flooding Experiments in a Low Salinity Environment Flooding Experiments in a Low Salinity Environment
Brightin Blanton Clemson University, [email protected]
Follow this and additional works at: https://tigerprints.clemson.edu/all_theses
Recommended Citation Recommended Citation Blanton, Brightin, "Enhanced Oil Recovery Using Silica Nanoparticles: Sandpack Flooding Experiments in a Low Salinity Environment" (2019). All Theses. 3200. https://tigerprints.clemson.edu/all_theses/3200
This Thesis is brought to you for free and open access by the Theses at TigerPrints. It has been accepted for inclusion in All Theses by an authorized administrator of TigerPrints. For more information, please contact [email protected].
ENHANCED OIL RECOVERY USING SILICA NANOPARTICLES: SANDPACK FLOODING EXPERIMENTS IN A LOW SALINITY ENVIRONMENT
A Thesis
Presented to
the Graduate School of
Clemson University
In Partial Fulfillment
of the Requirements for the Degree
Master of Science
Hydrogeology
by
Brightin Rex Blanton
December 2019
Accepted by:
Dr. Christophe Darnault, Committee Chair
Scott Brame
Dr. Ronald Falta
Dr. James K. Henderson
ii
ABSTRACT
Mobilizing and recovering crude oils from geological strata is crucial for the
management and development of petroleum reservoirs. Unlike conventional oil production
methods, enhanced oil recovery (EOR) processes can increase the recovery of most oil products
from the reservoir above the secondary recovery baseline. Recent studies have demonstrated
that nanoparticles (NPs) have the potential to improve EOR processes. Therefore, understanding
how NPs impact the mechanisms that govern the interaction between the fluids interface, the
fluid-solid interface, and the mobility of oil in porous media is critical to alter the properties of
nanofluids for specific geofluid conditions and increase EOR efficiency. The objectives of this
research are to determine the impacts of NPs on the fluid-fluid interfaces, the fluid-solid
interfaces, the mobility of oil in porous media, and oil recovery. This research seeks to evaluate
the different production processes in petroleum engineering commonly implemented at the
field scale. Sequencing is a process that is heavily implemented by the petroleum industry and
involves the injection of an aqueous phase (brine) prior to the injection of EOR fluid. Non-
sequencing involves the immediate injection of chemical-EOR fluid to displace crude oil and is
more of a theoretical process which allows for a direct comparison of the immediate impact of
chemical-EOR fluid with oil displacement associated with waterflooding and sequenced
chemical-EOR injection. In this study, silicon dioxide nanoparticles (SiO2 NPs) were employed to
improve the efficiency of the chemical-EOR process that utilizes surfactant flooding in an oil wet
sandstone aquifer analogue. Although sandstone aquifers are most frequently water wet, the
imbibing liquid is crude oil in these experiments, resulting in more conservative oil recovery
rates. Quartz silica sand was used to simulate the porous media material. Light (West Texas

iii
Intermediate, or WTI) crude oil was selected as the oil phase, due to its ubiquity as a global
standard for crude oil characteristics and price. De-ionized water and one weight percent (1 wt
%) NaCl brine, with 2 critical micelle concentrations (CMC) of anionic surfactant (sodium dodecyl
sulphate, or SDS) and concentrations of silica nanoparticles including 0, 0.01, and 0.1 wt% were
used to create the nanofluids. Experiments were conducted to measure the contact angle
between the microscope glass slide and SiO2 / SDS - based aqueous nanofluid systems. The
contact angle between the aqueous nanofluid and the microscope glass slide is a factor used to
assess the alteration of the sand wettability, a property critical to the mobilization of crude oil
from porous media. Microscope glass slides were used to simulate quartz silica grain surfaces
for contact angle measurements. Sandpack flooding column experiments were conducted to
test the impacts of the various nanofluids injected into the crude oil saturated sandpack on the
cumulative and fractional recovery rates of WTI crude oil. The effective oil displacement by the
SiO2 / SDS – based aqueous nanofluids tested was monitored over time and expressed as a
function of the number of pore volumes (PVs) of fluid injected into the system during various
processes. Cumulative and fractional oil displacement are plotted as a function of PVs injected
during events designed to simulate common practices in the petroleum industry. Primary Oil
Recovery is simply the process of oil recovery due to natural gravity drainage or pressure head
driving fluid from the subsurface. This process is analogous to the initial oil injection phase,
during which the column is saturated with oil to the extent that WTI crude oil is flowing out the
effluent tube and into the designated pre-experiment effluent sample tube. Secondary oil
recovery, or waterflooding as it is commonly called, involves the re-injection of natural aquifer
fluids such as water or brine to displace an additional amount of crude oil. Finally, tertiary or
Enhanced Oil Recovery (EOR) involves the injection of heat, gas, or chemicals to further improve
iv
the displacement efficiency of crude oil. This research seeks to evaluate the different impacts of
processes commonly implemented at the field scale. The research demonstrated that SiO2 NPs
can be used with surfactants such as SDS in crude oil to change the wettability of petroleum
reservoir systems from oil wet to water wet, allowing for a more efficient displacement of crude
oil and consequently yielding significantly higher oil recovery rates.
Keywords: Aqueous Nanofluids, Brine, Crude Oil Imbibement, Enhanced Oil Recovery,
Surfactant, Waterflooding, Wettability
v
TABLE OF CONTENTS
Page
TITLE PAGE .............................................................................................................................. i
ABSTRACT ............................................................................................................................... ii
TABLE OF CONTENTS .............................................................................................................. v
LIST OF FIGURES AND TABLES ............................................................................................... vii
INTRODUCTION ...................................................................................................................... 1
Literature Review ....................................................................................................... 1
Rationale.................................................................................................................... 5
Objectives .................................................................................................................. 7
MATERIALS AND METHODS .................................................................................................... 9
Methodology ............................................................................................................. 9
Experimental Procedure ........................................................................................... 21
Materials.................................................................................................................. 23
RESULTS ............................................................................................................................... 25
vi
Table of Contents (Continued) Page
DISCUSSION .......................................................................................................................... 39
CONCLUSIONS ...................................................................................................................... 43
APPENDIX ............................................................................................................................. 46
REFERENCES ......................................................................................................................... 49
vii
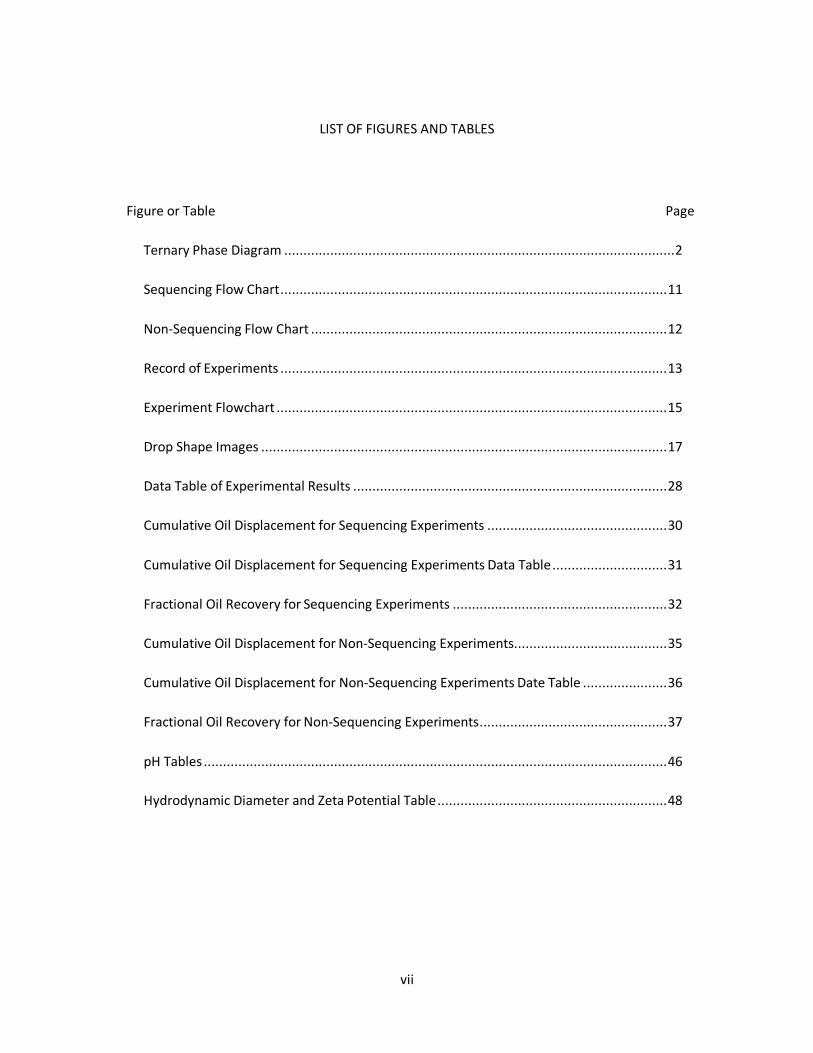
LIST OF FIGURES AND TABLES
Figure or Table Page
Ternary Phase Diagram ...................................................................................................... 2 Sequencing Flow Chart ..................................................................................................... 11 Non-Sequencing Flow Chart ............................................................................................. 12 Record of Experiments ..................................................................................................... 13 Experiment Flowchart ...................................................................................................... 15 Drop Shape Images .......................................................................................................... 17 Data Table of Experimental Results .................................................................................. 28 Cumulative Oil Displacement for Sequencing Experiments ............................................... 30 Cumulative Oil Displacement for Sequencing Experiments Data Table .............................. 31 Fractional Oil Recovery for Sequencing Experiments ........................................................ 32 Cumulative Oil Displacement for Non-Sequencing Experiments ........................................ 35 Cumulative Oil Displacement for Non-Sequencing Experiments Date Table ...................... 36 Fractional Oil Recovery for Non-Sequencing Experiments ................................................. 37 pH Tables ......................................................................................................................... 46 Hydrodynamic Diameter and Zeta Potential Table ............................................................ 48
1
INTRODUCTION
Literature Review
Nanoparticles (NPs) and nanomaterials have been implemented for a variety of scientific
and engineering processes, including foam stability simulations and chemical Enhanced Oil
Recovery (EOR). Particles added to chemical suspensions consist of nanocellulose (Wei, Li, Jin, Li, &
Wang, 2016), aluminum oxide NPs (Joonaki & Ghanaatian, 2014), silicon dioxide NPs (Binks &
Rodrigues, 2007), and others. Due to their low cost and identical chemical composition to sand, a
common reservoir material, silicon dioxide (SiO2) NPs are especially prevalent in industrial and
academic chemical-EOR applications. Surface Active Agents (more commonly known as
surfactants) were implemented for cleaning purposes long before the development of EOR
techniques. Today, surfactants are used commonly in detergents, cleaners, and pharmaceutical
goods. However, these chemicals have also been shown to increase bulk foam stability and oil
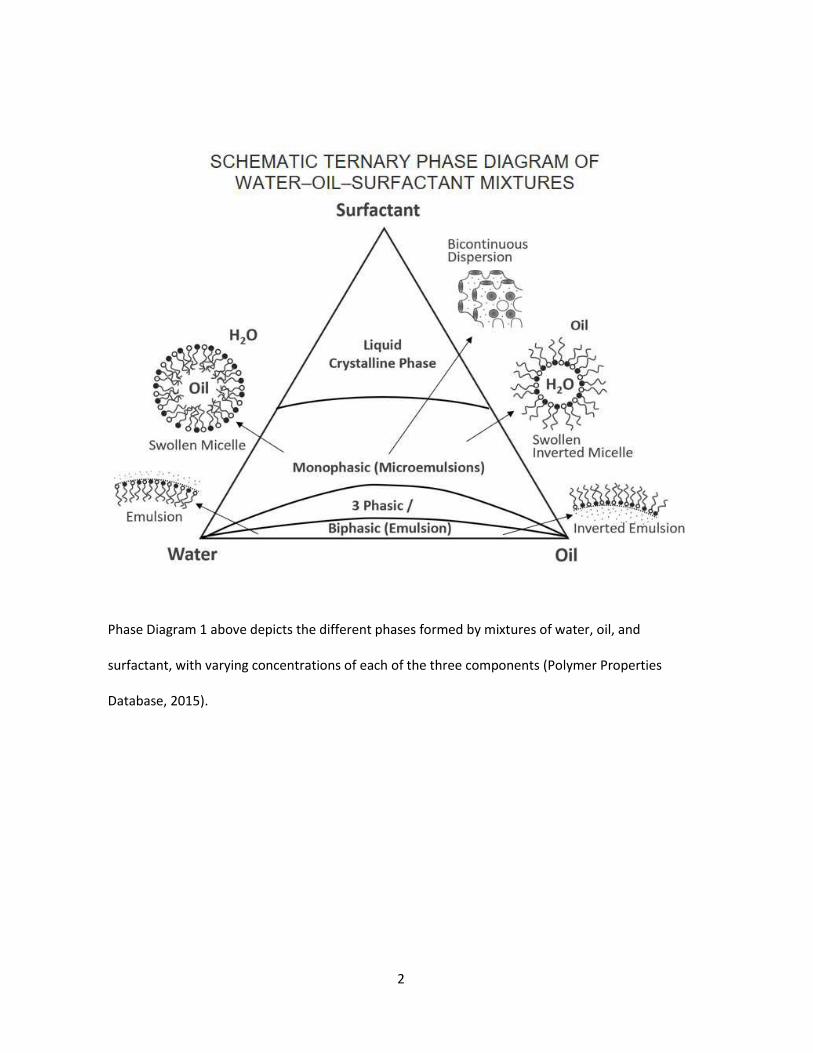
displacement efficiency in a laboratory setting (Osei-Bonsu, Grassia, & Shokri, 2017). As shown in
the Ternary Phase Diagram below, adapted from the Polymer Properties Database, a low
concentration of surfactant in the presence of oil and water will contribute to the formation of a
biphasic emulsion in which oil and water mix together to form a fine dispersion of immiscible
fluids (Phase Diagram 1; Polymer Properties Database, 2015). This emulsification process enables
the chemical-EOR fluid to more effectively flush crude oil from an oilfield, significantly improving
the volumetric sweep efficiency during EOR operations.
2
Phase Diagram 1 above depicts the different phases formed by mixtures of water, oil, and
surfactant, with varying concentrations of each of the three components (Polymer Properties
Database, 2015).
3
Bulk foam stability (foam volume over time) is a physical characteristic that has a
significant impact on oil displacement efficiency during foam flooding for EOR operations. Over
the course of a chemical injection event, foams with greater stability will consistently lead to a
stronger propagating displacement front, thus mobilizing crude oil more effectively than a system
in which preferential flow paths or viscous fingering dominate the flow regime (Wang et al., 2013).
Surfactants are added as solutions in the chemical-EOR fluid due to their ability to increase the
water wettability of porous reservoir material and reduce surface tension between phases (Ravari,
Strand, & Austad, 2011), prevent flocculation and aggregation of NPs (Singh & Mohanty, 2015),
and to produce stable foams in the presence of NPs for the purpose of forming a mobile crude oil
displacement front (Yang et al., 2017).
There is an expansive body of previous work on Enhanced Oil Recovery. A synergistic
relationship between positively charged surfactant and negatively charged nanoparticles at a high
pH has been demonstrated by mixing silica nanosuspensions with surfactant, then measuring the
volume of the foam and time. The governing mechanism of foam stability is the electrostatic
attraction between the surfactant and nanoparticles in the mixture, and it is this attraction that
causes “foam formation and stability due to the adsorption of surfactant molecules onto particle
surfaces” (Binks, Kirkland, & Rodrigues, 2008). A similar experiment was conducted in 2015 by
researchers at the University of Texas, except with a different application. The research sought to
test the effectiveness of various foams for oil recovery in a Berea sandstone core, and ultimately
showed that “surfactant or surfactant−nanoparticle blends can increase the oil recovery over
water flood by about 10% of the original oil in place” (Singh & Mohanty, 2015). A major factor
contributing toward increased crude oil mobility is wettability alteration of the porous media.
4
Through nanoparticle and surfactant dispersion experiments conducted for EOR of various crude
oils in Boise and Berea sandstone, surface wettability of the porous media has been shown to
increase due to lessened surface interactions with the imbibing crude oil. This decrease in crude
oil contact on the porous media facilitates a loss of oleophilicity and an increase in hydrophilicity,
thus effectively mobilizing more oil from the core (Huibers et al., 2017).
Other experiments involving surfactant flooding within a sandpack have been conducted
under various experimental parameters. In 2014, Qian Sun et al. conducted experiments with
different concentrations of SDS surfactant and observed that, with silica nanoparticles, an optimal
concentration of SDS surfactant promotes foam stability while reducing the effects of viscous
fingering. The mechanism responsible for this increased foam stability, reduction in viscous
fingering, and subsequent improvement in “plugging performance” is the tendency of silica
nanoparticles to migrate to the interfacial film and reinforce the foam boundary (Sun et al., 2014).
“Plugging performance,” as it is called in the Sun article, refers to the ability of a chemical to
exhibit “plug flow” during an Enhanced Oil Recovery simulation, particularly in a column
experiment. “Plug flow” is the ideal scenario for crude oil mobilization because in a plug flow
regime the chemical-EOR phase forms a strong interfacial boundary with the imbibed crude oil
and displaces the oil from the column, bottom to top, in a manner similar to a piston moving
through a cylinder. The effects of preferential flow paths and viscous fingering are mitigated
during plug flow, and the residual Original Oil In Place (OOIP) left behind in the porous media is
minimized. An investigation of immiscible foam flooding in the presence of various surfactants and
electrolytes, but without any added nanoparticles, was recently conducted by Hosseini-Nasab and
Zitha. This research indicates that co-injection of gas with the surfactant and cosolvent solution
5
could mobilize an additional 33% of OOIP compared to experiments involving waterflooding alone
(Hosseini-Nasab & Zitha, 2017).
Some common themes uniting much of the literature on chemical-EOR include the
improvement of bulk foam stability (foam volume over time), wettability alteration causing an
increase in hydrophilicity and a decrease in oleophilicity, reinforcement of the displacement front
resulting in lessened effects of preferential flow paths and viscous fingering, and finally a greater
percent of Original Oil In Place (OOIP) mobilized over the secondary (waterflooding) recovery
baseline volume. Optimal concentrations of surfactant and NPs have been shown to exist for the
different chemical-EOR, aqueous dispersion, and waterflooding-preceded-chemical-EOR injection
systems.
Rationale
This research project seeks to combine many of the useful characteristics of prior
research, while also expanding the knowledge base of outcomes associated with the injection of
different nanoparticle and surfactant systems. For example, previous experiments have been
conducted on low-salinity waterflooding (Hussain et al., 2013). Prior work has also been done on
the synergistic impact of silica nanoparticles with a cationic surfactant (Binks, Kirkland, &
Rodrigues, 2008), as well as on the impacts of waterflooding and chemical-EOR in a sandpack
(Dong, Ma, & Liu, 2009). Experiments involving Berea sandstone cores pre-saturated with crude oil
and placed in a jar with a silica nanofluid dispersion have shown the effectiveness of the
dispersion in removing 50% or more of the crude oil from the column over the course of one to
two weeks (Zhang, Nikolov, & Wasan, 2014). This body of previous work is described in partial
6
detail above to illustrate the breadth of recent work on EOR, particularly in the presence of NPs
and or surfactant.
The experiments and analysis completed over the course of this project test a unique
combination of EOR parameters, including oil mobilization from a sandpack, oil mobilization due
to waterflooding with a low salinity (1 wt% NaCl) brine, sequenced and non-sequenced injection
techniques and their impact on oil displacement efficiency, and the effect of various
concentrations of silica NPs on chemical-EOR.
It is the endeavor of this paper and the associated research to accurately construct a
microcosm of an oil wet subsurface petroleum reservoir system and associated exploitation
techniques. According to the literature (United States Department of Energy), common practice
within the petroleum industry is to first extract any oil available through primary oil recovery.
Primary oil recovery is a process that simply involves pumping oil directly out of the subsurface
(without the fluid or chemical/thermal injection processes associated with secondary and tertiary
recovery). Natural gravity drainage due to pressure head is also responsible for primary recovery
processes. Unfortunately, the 10-25% of an oil field’s Original Oil In Place (OOIP) that is extractable
through primary oil recovery is insufficient to keep pace with growing demands. The declining
availability of primary oil reserves is highly responsible for the advent of novel oil recovery
techniques, including waterflooding (secondary oil recovery), and EOR (tertiary oil recovery). New
drilling and extraction processes, such as horizontal drilling and hydraulic fracturing are examples
of technologies developed to maximize the oil displacement from a formation. An additional 10-
20% of crude oil is mobilized during secondary recovery (waterflooding), regardless of the salinity,
pH, and physicochemical properties of the aquifer fluid used for waterflooding (Mid-Con Energy
7
Partners, LP, 2014). By calculating the percentage of oil extracted from a system over the
secondary baseline cumulative recovery volume, the volumetric crude oil displacement can be
evaluated and compared for various chemical-EOR systems.
Secondary recovery involves flushing the experiment column with 320 mL of 1 wt% NaCl
brine in this research project. 1 wt% brine was selected primarily because the scientific
community’s understanding of chemical-EOR would significantly benefit from more research
involving low salinity flooding of an oil-saturated sandpack, prior to injection of nanofluids or a
control solution. Dissolved ions have been shown to alter permeability within a Berea sandstone,
“by the lifting, migration and subsequent plugging of pores by fine particles” (Hussain et al., 2013).
According to previous work, low salinity brine injections have proven productive in terms of
mobilization of trapped crude oil reserves. This is because, “When injecting low salinity (LS) water,
it is believed that destabilization of oil layers adhering to mineral surfaces could be a contributing
mechanism to enhanced oil recovery (EOR)” (Johannessen & Spildo, 2013). Following
waterflooding, an additional 30% or more of OOIP can be mobilized using tertiary recovery, or
EOR. EOR consists of thermal, chemical, or gas injection, and implements a pumping well and an
injection well for mobilizing trapped and often isolated droplets of heavily-imbibed crude oil.
Objectives
The objective of the research is to demonstrate that SiO2 NPs can be used with surfactants
such as SDS, with a variety of processes, to change the wettability of systems from oil wet to water
wet, allowing for a more efficient displacement of oil and consequently yielding significantly
higher recovery of crude oil. By observing the impact of SDS surfactant and various NP
concentrations on oil recovery operations above the secondary baseline recovery volume
8
(simulated by injecting 320 mL of brine into the system), techniques for Enhanced Oil Recovery
can be optimized for different subsurface environments and injection scenarios.
The implementation of two different injection schemes, sequencing and non-sequencing,
allows for an expansion of the knowledge that is accessible from the dataset. The traditional
sequencing technique is largely implemented by the petroleum industry during Enhanced Oil
Recovery and hydraulic fracturing operations. Sequencing is quite prevalent and widespread due
to the lack of cost associated with extracting and reinjecting whatever brine or aquifer fluid is
already present in order to displace an additional volume of oil above the Original Oil In Place
(OOIP). This secondary recovery process is not intended to alter the physical or chemical
properties of the porous media, but rather to mobilize an additional volume of crude oil in a cost-
effective manner. By preceding the SiO2 / SDS – based aqueous nanofluid injection with brine
injection, the researcher hopes to construct a comparative baseline, which should provide a
comparable volume of cumulative oil recovery and a graphical relationship between fractional /
cumulative recovery and volume of brine or EOR fluid injected. The data from the first 320 mL of
injection in each sequenced injection experiment represent the same process of waterflooding, a
common industry practice and an effective way to establish a baseline for oil recovery
(Zargartalebi, Barati, & Kharrat, 2014). The average cumulative volume of oil recovery from the
waterflooding experiments can be compared with the average cumulative volume of oil recovery
from each SiO2 / SDS – based aqueous nanofluid system, and a percent change can be calculated
to determine the percent increase in oil mobilized above baseline associated with each of the
different silica nanofluid systems.
9
MATERIALS AND METHODS
Methodology
To maximize crude oil yield, different processes are implemented involving the type of
chemicals injected for EOR and the sequence in which they are injected. Thus, in the petroleum
industry, “Sequencing” indicates that Enhanced Oil Recovery is preceded by secondary oil
recovery (waterflooding). In experiments designed to simulate sequenced injection, waterflooding
precedes chemical-EOR (Figure 1). In experiments designed to simulate non-sequenced injection,
EOR is commenced immediately following crude oil imbibement (Figure 2). Non-sequenced
injection is hardly ever practiced at the field scale, due to the lack of cost associated with a
preceding waterflooding event. However, this research includes a set of non-sequenced chemical-
EOR experiment replicates to compare against the crude oil recovery from waterflooding and
traditional sequenced injection. In the case of the brine used for waterflooding, as well as the 2
Critical Micelle Concentration (CMC) Sodium Dodecyl Sulphate (SDS) surfactant-in-brine control
solution and the SiO2 / SDS – based aqueous nanofluids, each fluid is injected in the amount of 320
mL. Volume of fluid injected over the course of an experiment is determined by labeling the
sample tubes and timing the removal and replacement of each sample tube from underneath the
effluent outlet. Each tube is labeled to indicate what chemical injection process it is associated
with and numbered to indicate where in the sequence of sample tubes it falls. The sample tubes
are also given a letter/number combination to correspond with which of the four columns was
used to run the experiment and how many experiments had been conducted in that column
previously, and silica concentration, timing, and chemical constituents involved in each injection
event are recorded. 20 mL of effluent (oil/brine, oil/aqueous nanofluid phases) are collected in
10
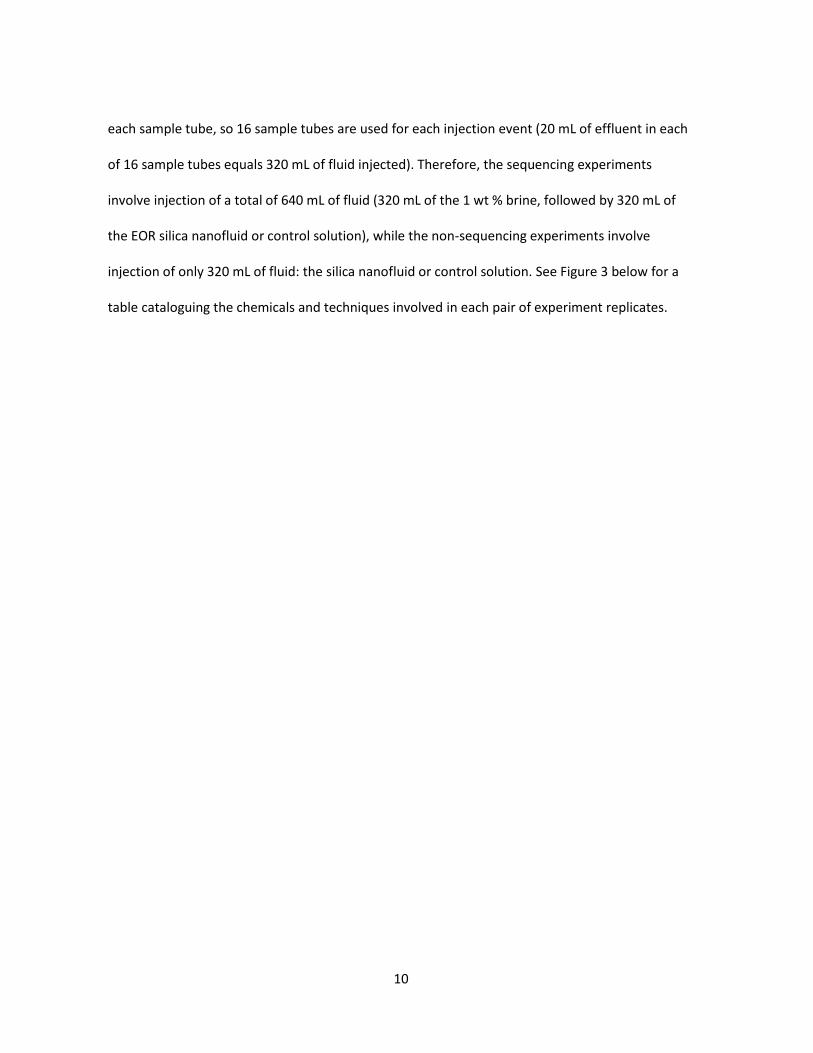
each sample tube, so 16 sample tubes are used for each injection event (20 mL of effluent in each
of 16 sample tubes equals 320 mL of fluid injected). Therefore, the sequencing experiments
involve injection of a total of 640 mL of fluid (320 mL of the 1 wt % brine, followed by 320 mL of
the EOR silica nanofluid or control solution), while the non-sequencing experiments involve
injection of only 320 mL of fluid: the silica nanofluid or control solution. See Figure 3 below for a
table cataloguing the chemicals and techniques involved in each pair of experiment replicates.
11
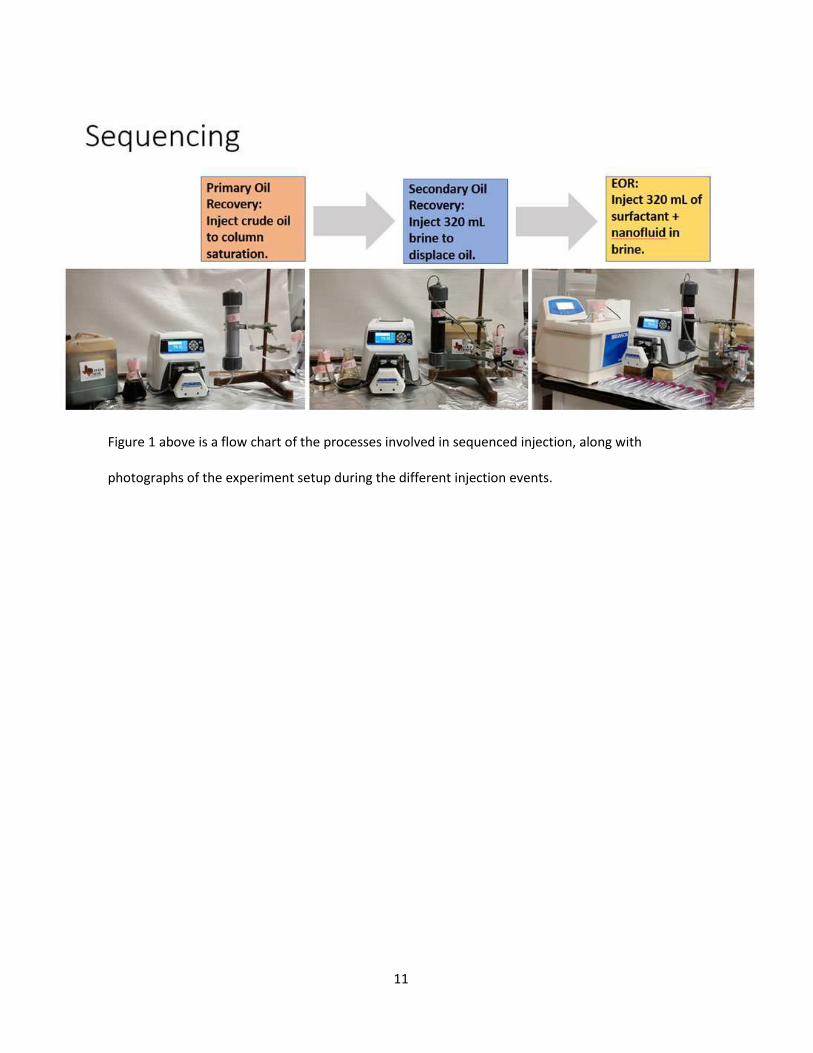
Figure 1 above is a flow chart of the processes involved in sequenced injection, along with
photographs of the experiment setup during the different injection events.
12
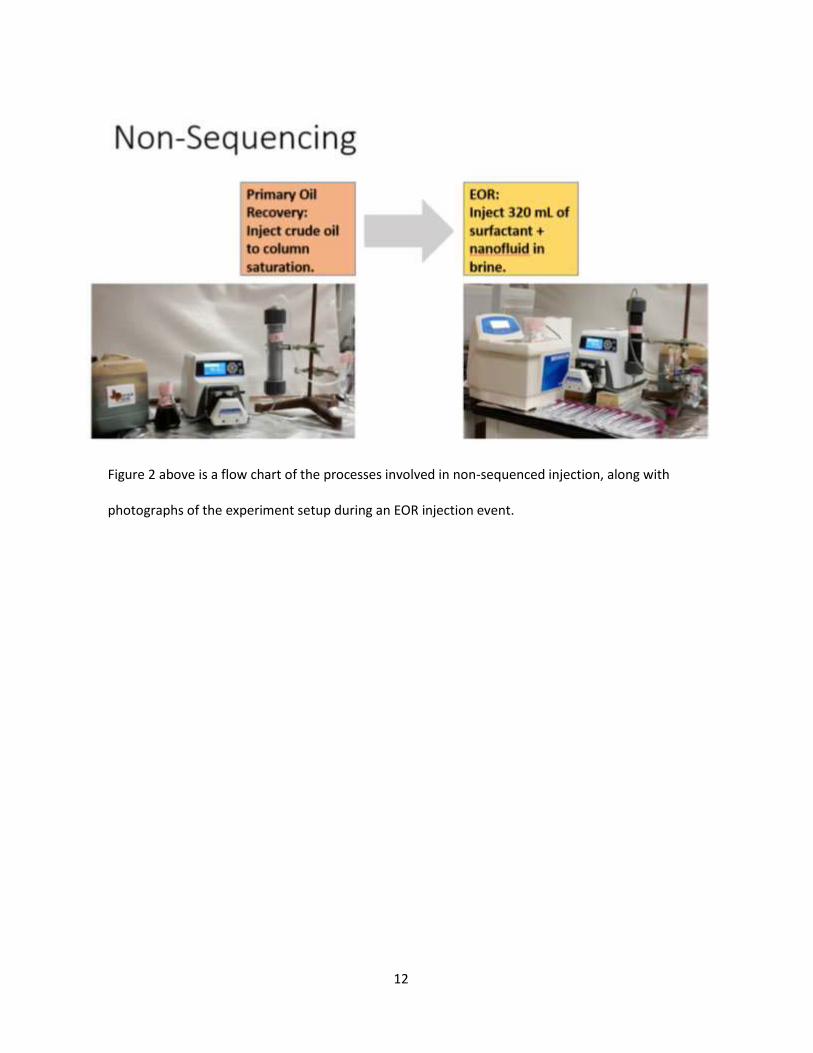
Figure 2 above is a flow chart of the processes involved in non-sequenced injection, along with
photographs of the experiment setup during an EOR injection event.
13
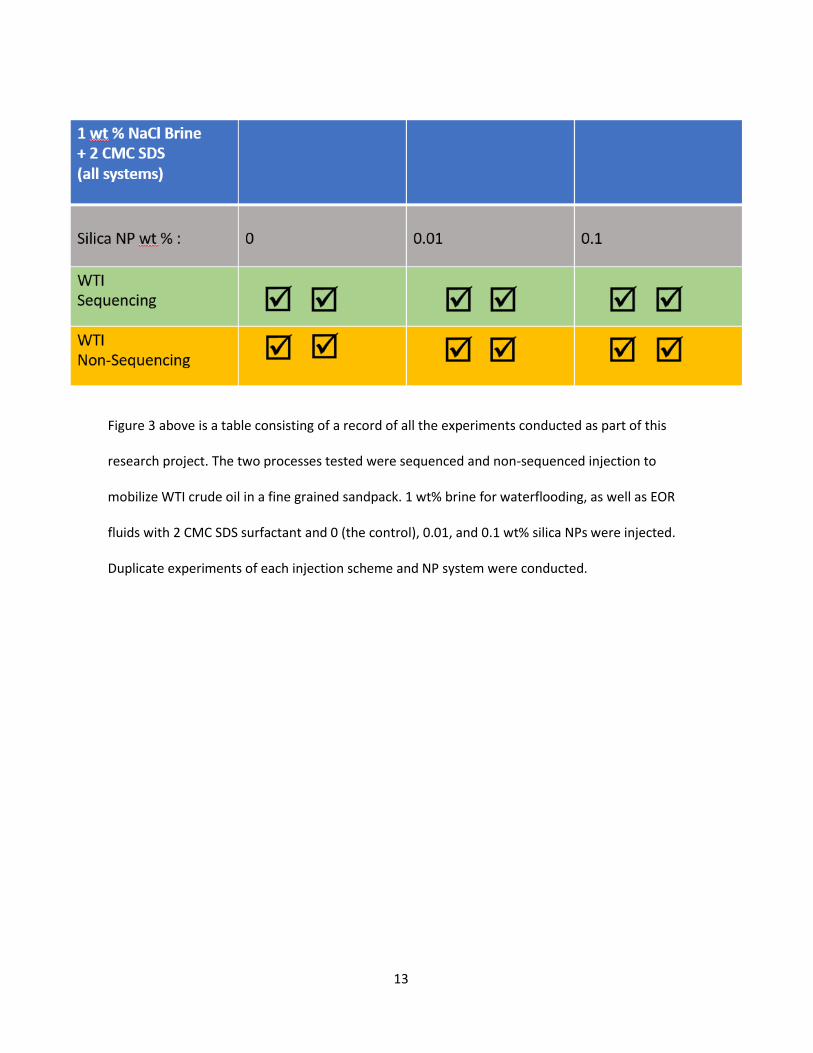
Figure 3 above is a table consisting of a record of all the experiments conducted as part of this
research project. The two processes tested were sequenced and non-sequenced injection to
mobilize WTI crude oil in a fine grained sandpack. 1 wt% brine for waterflooding, as well as EOR
fluids with 2 CMC SDS surfactant and 0 (the control), 0.01, and 0.1 wt% silica NPs were injected.
Duplicate experiments of each injection scheme and NP system were conducted.
14
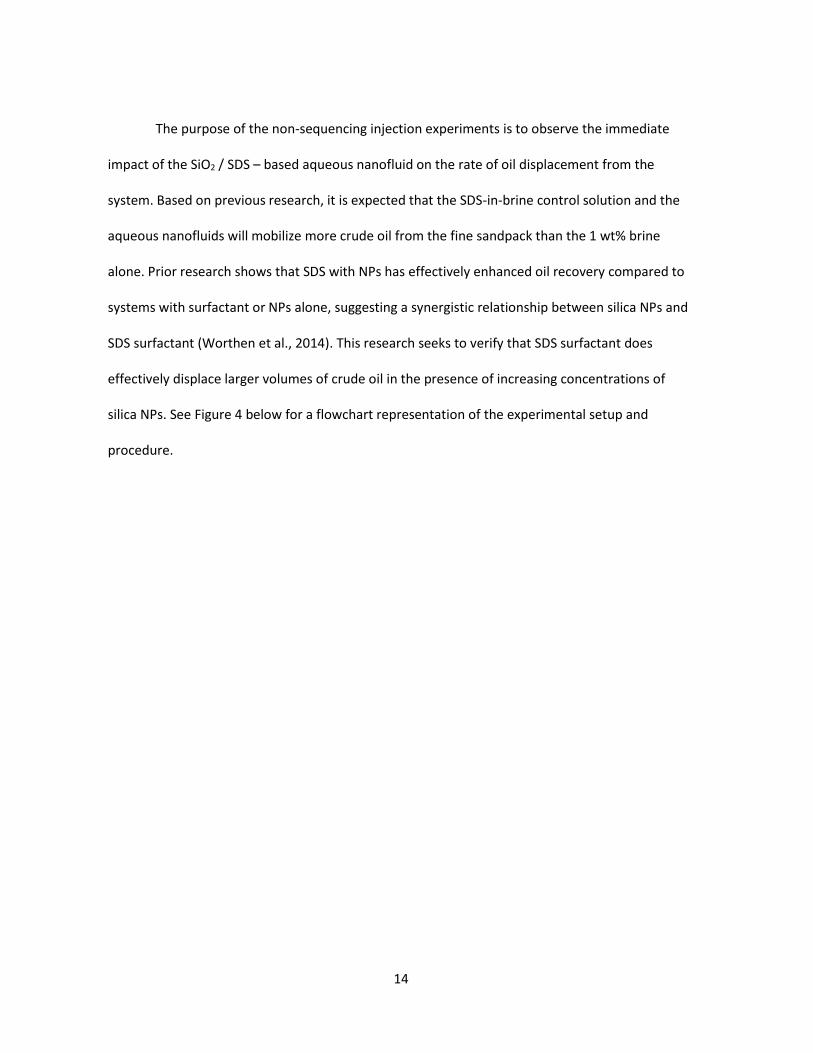
The purpose of the non-sequencing injection experiments is to observe the immediate
impact of the SiO2 / SDS – based aqueous nanofluid on the rate of oil displacement from the
system. Based on previous research, it is expected that the SDS-in-brine control solution and the
aqueous nanofluids will mobilize more crude oil from the fine sandpack than the 1 wt% brine
alone. Prior research shows that SDS with NPs has effectively enhanced oil recovery compared to
systems with surfactant or NPs alone, suggesting a synergistic relationship between silica NPs and
SDS surfactant (Worthen et al., 2014). This research seeks to verify that SDS surfactant does
effectively displace larger volumes of crude oil in the presence of increasing concentrations of
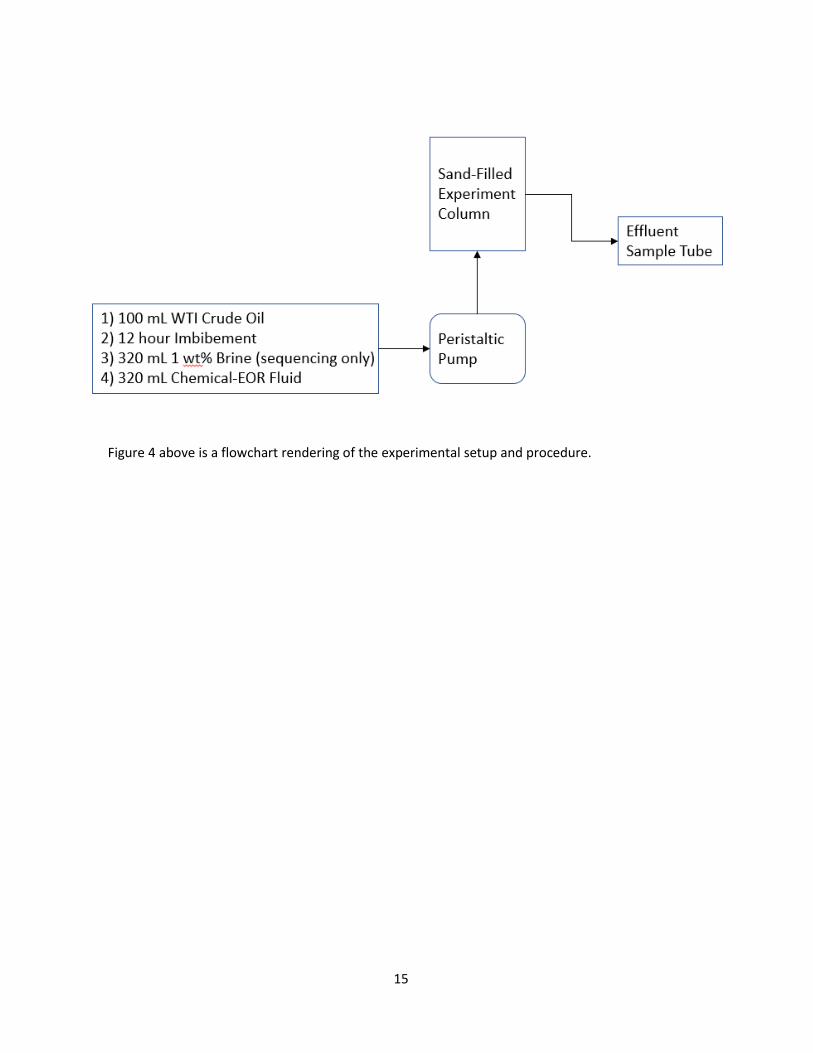
silica NPs. See Figure 4 below for a flowchart representation of the experimental setup and
procedure.
15
Figure 4 above is a flowchart rendering of the experimental setup and procedure.
16
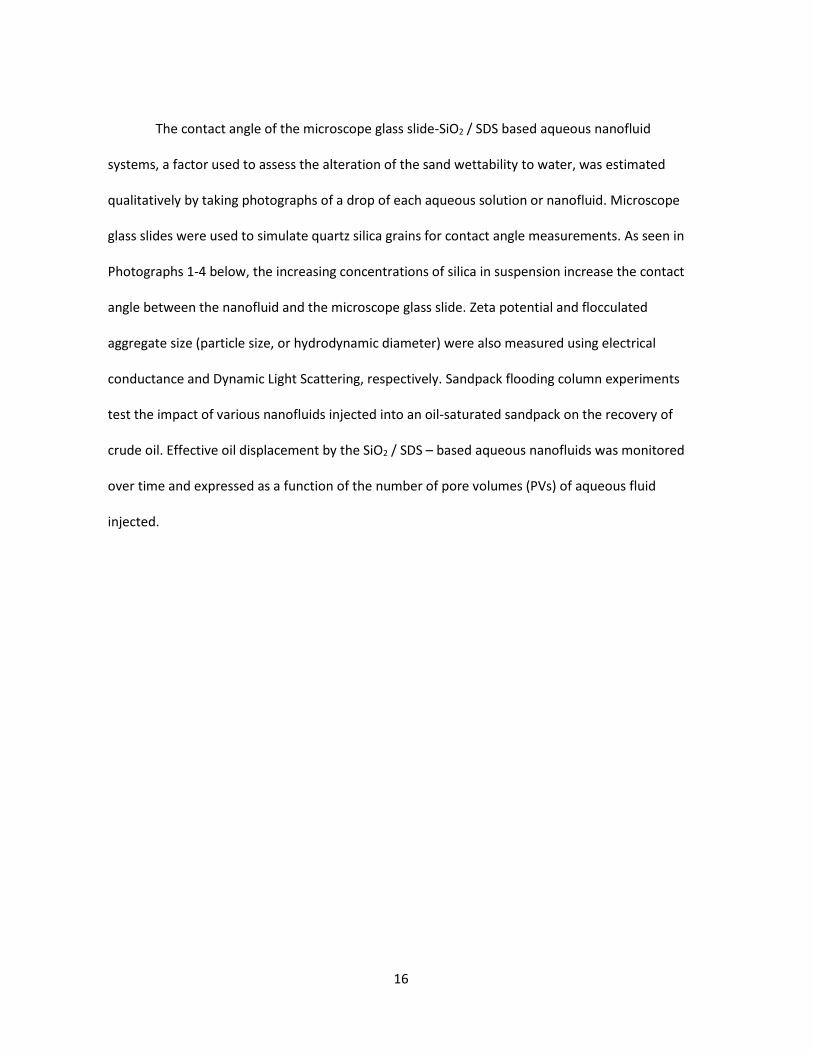
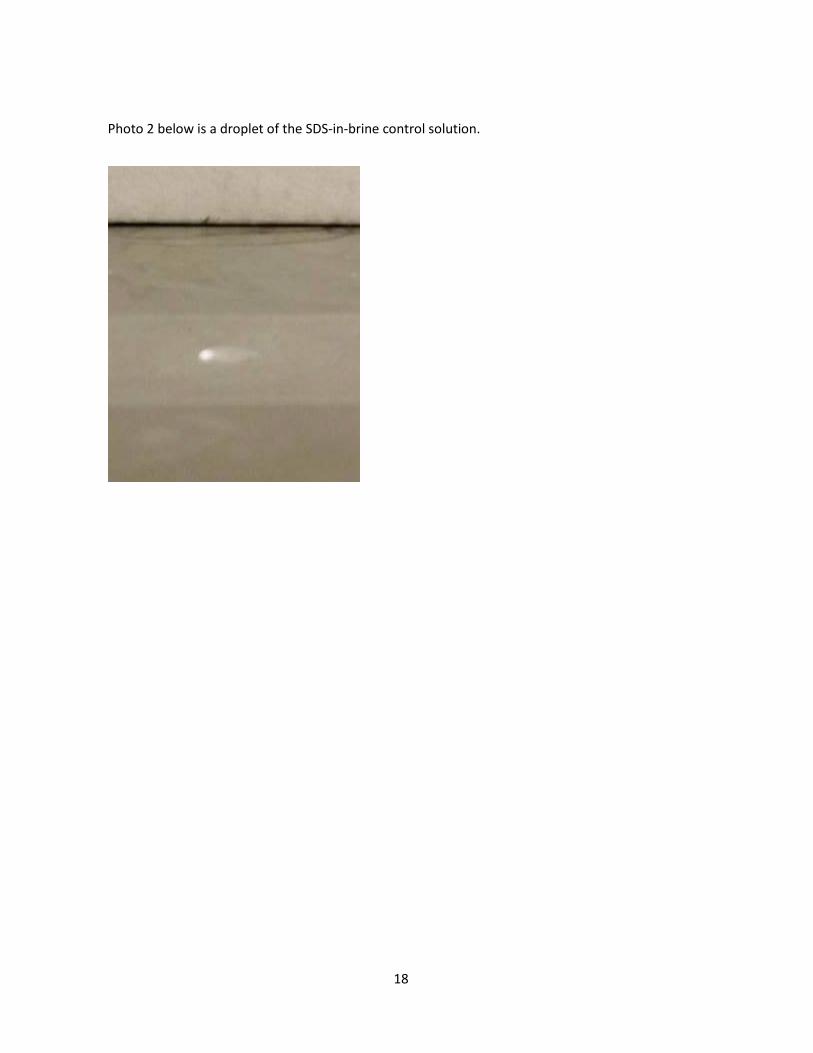
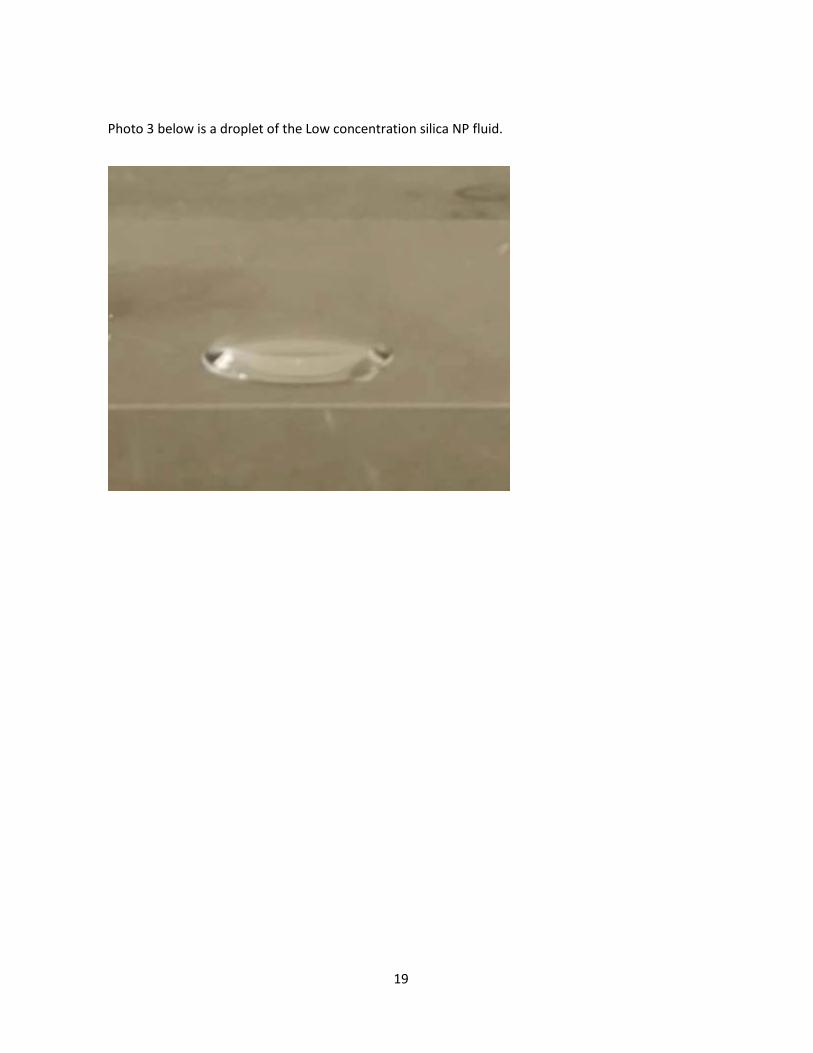
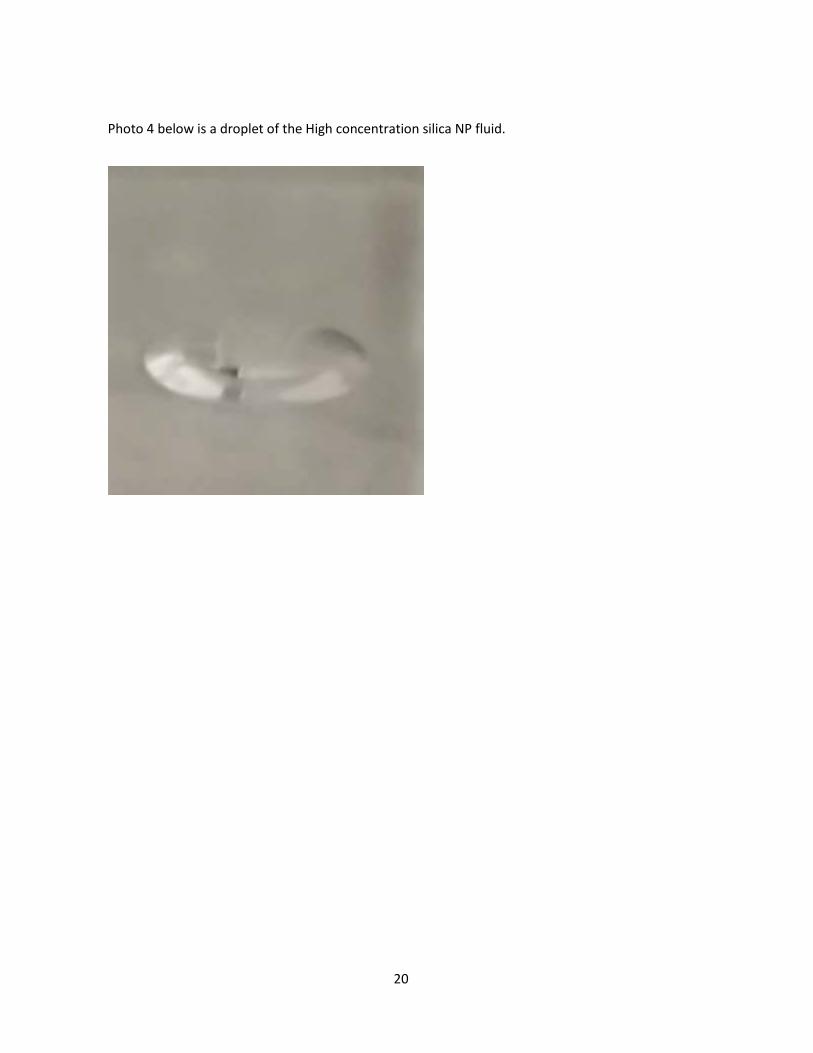
The contact angle of the microscope glass slide-SiO2 / SDS based aqueous nanofluid
systems, a factor used to assess the alteration of the sand wettability to water, was estimated
qualitatively by taking photographs of a drop of each aqueous solution or nanofluid. Microscope
glass slides were used to simulate quartz silica grains for contact angle measurements. As seen in
Photographs 1-4 below, the increasing concentrations of silica in suspension increase the contact
angle between the nanofluid and the microscope glass slide. Zeta potential and flocculated
aggregate size (particle size, or hydrodynamic diameter) were also measured using electrical
conductance and Dynamic Light Scattering, respectively. Sandpack flooding column experiments
test the impact of various nanofluids injected into an oil-saturated sandpack on the recovery of
crude oil. Effective oil displacement by the SiO2 / SDS – based aqueous nanofluids was monitored
over time and expressed as a function of the number of pore volumes (PVs) of aqueous fluid
injected.
17
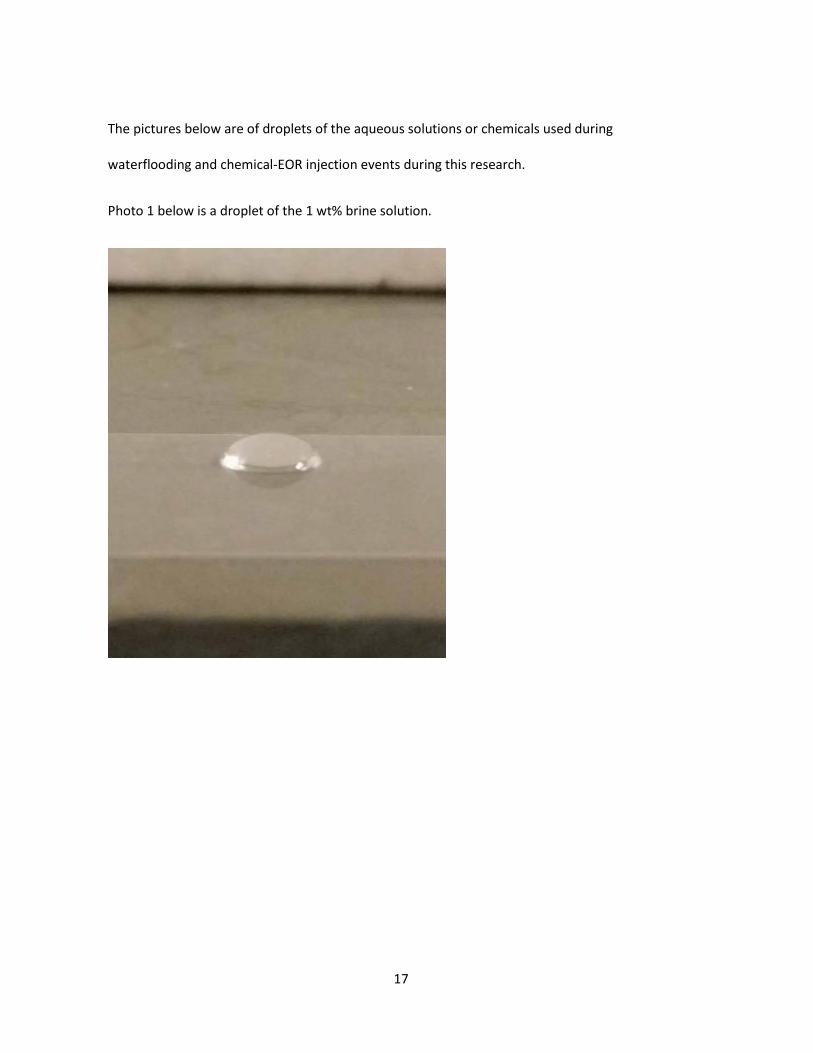
The pictures below are of droplets of the aqueous solutions or chemicals used during
waterflooding and chemical-EOR injection events during this research.
Photo 1 below is a droplet of the 1 wt% brine solution.
18
Photo 2 below is a droplet of the SDS-in-brine control solution.
19
Photo 3 below is a droplet of the Low concentration silica NP fluid.
20
Photo 4 below is a droplet of the High concentration silica NP fluid.
21
Following is a step-by-step description of procedures implemented during the
experimentation and analysis phases:
1) A 25 cm long column (3.7 cm diameter) is filled with 520.5 g of 20/40 US Silica fine grained silica
sand. The column is made of a heavy-duty transparent PVC material, with threads on both ends.
The threads are wrapped with Teflon tape in order to prevent leakage, and a plastic plug is
tightened on each end of the column. A small, threaded hole is drilled in the center of each of the
end-plugs. Using a wrench, plastic hose barbs are gently tightened into the two holes, and these
hose barbs are connected to the influent and effluent silicone Masterflex platinum-cured pump
tubing which connects the crude oil/brine/aqueous nanofluid or control solution beaker to the
peristaltic pump, to the experiment column, and finally to the effluent sample tube.
2) Aqueous suspensions are prepared with the following chemicals: 0, 0.01, or 0.1 wt% NPs, and 2
critical micelle concentrations (CMC) of sodium dodecyl sulphate (SDS) anionic surfactant with 1
wt% NaCl brine. To make 1 L of each solution, 10.101 g of NaCl, 4.758 g of SDS surfactant (2 CMC
for 1 Liter of solvent), and 0, 0.10001, and 1.001 g of silica NPs are added to 1 Liter of de-ionized
water (the three different masses of silica NPs result in 0, 0.01, and 0.1 wt% SiO2). After adding the
solutes, a magnetic chemical mixer is used to dissolve the SDS and NaCl into solution over a 12-
hour period. Next, a point-source sonicator is used to mix the silica NPs into a (relatively)
homogeneous suspension. The point-source sonicator settings are as follows: Time-5 min, Power-
40 W; Amplitude-45 (Huibers et al., 2017). During the experimental phase, all aqueous NP
suspensions are placed in the bath sonicator immediately prior to the 320 mL EOR injection for
both sequencing and non-sequencing experiments.
22
3) Using a peristaltic pump, at least 100 mL of West Texas Intermediate crude oil are injected into
the column. One pore volume (PV) is 297 cm3 (the volume of the enclosed column) times a
porosity of 0.30, or 89.1 mL. According to various computational methods, the PV of the column
sandpack system is 78.75 mL (using the product of flow rate [mL/hr] and time taken to fully
saturate the column [hr]), PV is 83.3 mL (using difference in mass [g] of the column before and
after injection of deionized water), and PV is 87.73 mL (using difference in mass of a beaker before
and after injection of de-ionized water from that beaker into the column sandpack).
4) At least 12 hours are required for the crude oil to fully imbibe on the porous media. During this
time the experiment column should remain stationary and within a controlled environment.
5) 320 mL of 1 wt% NaCl brine are injected into the experiment column to simulate secondary oil
recovery or waterflooding. Since one PV ~80-90 mL, 320 mL is ~3.5-4 PVs. 320 mL of brine and
nanofluids are injected for both secondary oil recovery and chemical-EOR to ensure that three PVs
is exceeded. All the experiment effluent sample tubes should be labeled prior to conducting any
experiments. During experimentation, each effluent sample tube must be removed and replaced
with a new sample tube every time 20 mL of brine or chemical-EOR fluid is injected into the
column. This greatly facilitates accounting for the volume of fluid injected in the column during
analysis.
6) 320 mL of 0, 0.01, or 0.1 wt% silica NP fluid are injected with 2 CMC of SDS surfactant in 1 wt%
brine into column to simulate chemical-EOR.
7) The above process is repeated for each NP/surfactant system, omitting step five (secondary oil
recovery or waterflooding). This will allow for a comparison between two processes: oil recovery-
23
over-baseline simulated by experiments in which EOR is preceded by waterflooding (sequenced
injection), and oil recovery because of immediate EOR (non-sequenced injection).
8) Fractional and cumulative oil recovery rates are plotted up for the various NP/surfactant
systems as a function of the number of pore volumes (PVs) injected. The percent of Original Oil In
Place (OOIP) mobilized over the secondary recovery baseline volume, and the control surfactant-
brine solutions, for both the sequenced and non-sequenced injection processes is calculated by
dividing the difference between cumulative oil recovery for the control/waterflooding injection
event and the chemical-EOR cumulative oil recovery by the control/waterflooding cumulative oil
recovery. This fraction (or percent, if multiplied by 100) indicates the amount of OOIP displaced
over the control system for each experiment replicate, or the average or experiment-specific
secondary recovery baseline volume achieved during experimentation (see Table 1).
9) Important physicochemical properties of the nanofluids and control solution are measured,
including the contact angle of the solution/suspension on a glass microscope slide substrate, zeta
potential, pH, and hydrodynamic diameter (particle size of flocculated aggregates).
10) The data is analyzed to determine which experimental conditions most effectively maximize oil
displacement.
Materials:
• West Texas Intermediate (light) crude oil
• 20/40 US Silica fine grained silica sand (porosity is 0.30)
• 25 cm cylindrical column (diameter is 3.7 cm, volume is 297 cm3) with threaded ends and
plugs

24
• Hose Barbs
• Teflon Tape
• Cole-Parmer peristaltic pump
• Cole-Parmer silicone Masterflex platinum-cured pump tubing
• Silica nanoparticles (NPs)
• Sodium dodecyl sulfate (SDS) surfactant
• De-ionized Water (18.2 ohms)
• Sodium chloride to prepare 1 wt % NaCl brine solution
• Point-source Sonicator
• Bath Sonicator
• Mettler Toledo Benchtop pH Meter
• Brookhaven Instruments Corporation 90 Plus Particle Sizing Software
• Brookhaven Instruments Corporation Phase Analysis Light Scattering Zeta Potential
Analyzer
25
RESULTS
The results of these experiments indicate different optimal chemical-EOR techniques for
sequencing and non-sequencing injection. When considering the most effective methods for
presenting the crude oil displacement results, it becomes apparent that there are many aspects to
each experiment, as well as points of comparison between the various SDS / aqueous nanofluid
systems. Analysis of the results of the non-sequencing experiments is relatively straightforward.
Because this process involves only the injection of chemical-EOR fluid, there is no baseline against
which to compare the non-sequenced injection results. The cumulative volume and fractional
recovery rate are measured over the course of the injection event, and then analyzed after
completion of the experiment. It is worthwhile to note the percent change in cumulative oil
displacement from system to system for the non-sequenced chemical-EOR experiments, so
percent OOIP displaced above the control solutions’ average is calculated in Table 1 for all
systems. For non-sequenced experiments, the average of all cumulative crude oil volumes
displaced during waterflooding in the sequenced experiments (40.33 mL) is used to calculate the
percent OOIP over the average observed secondary baseline for each system. All the same
calculations are performed for the sequenced experiments, except using the volumes of oil
recovered over the control solution and baseline for the respective experiment replicate, instead
of the average baseline oil recovery volume. A final tool for assessment of the performance of
each SDS / aqueous nanofluid system in terms of crude oil displacement and recovery is the
Efficiency Ratio. The Efficiency Ratio is simply the ratio between cumulative oil displacement by a
particular system and the volume of fluid injected during that experiment. The purpose of this
metric is to unilaterally evaluate and compare the effectiveness of each surfactant solution or
26
nanofluid. Because sequencing experiments involve a total injection of 640 mL of fluid, 640 is the
denominator in these ratios. If instead, only the 320 mL involved in chemical-EOR during a
sequencing experiment was used in this calculation, then only the volume of crude oil recovered
after waterflooding could be used as the numerator. All in all, this changes the specific results
insignificantly. Furthermore, the Efficiency Ratio is best interpreted broadly, as a rough indicator
of the rate of valuable oil removed from a system to costly chemicals injected into that system.
Sequencing injection experiments demonstrate a complex relationship between silica NP
concentration and cumulative oil displacement. In terms of volumetric oil recovery, the outcomes
of the sequencing experiments show a wide range of outcomes between the replicates of various
SDS / aqueous nanofluid systems. To most effectively compare the data, the fractional and
cumulative volumetric results of each experiment are graphed as a function of pore volumes of
brine or EOR fluid injected. First, six curves are plotted in the same space, with each curve
corresponding to a different experiment and curves labeled with the specific SDS / aqueous
nanofluid system injected during chemical-EOR (Figure 5).
Next, the results are averaged for each pair of experimental replicates associated with the
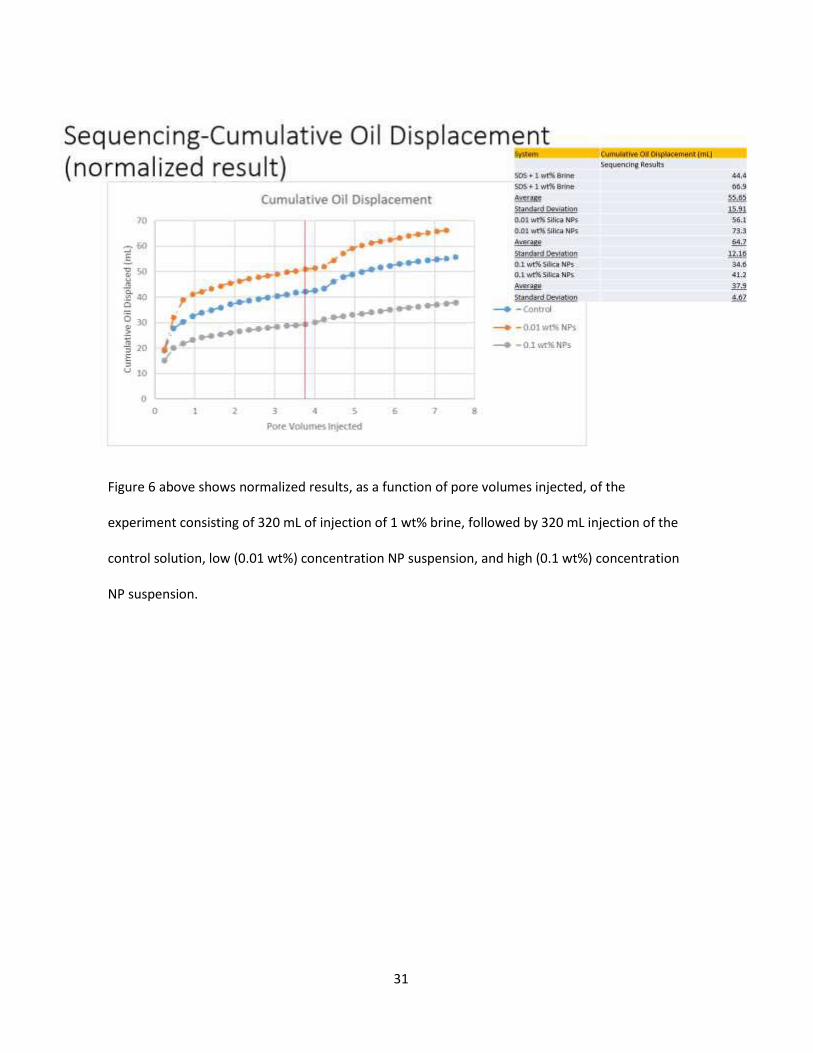
same chemical-EOR system. Figure 6 shows the average of each of the two experimental
replicates’ results for the three silica nanofluid systems as a function of pore volumes of brine and
chemical-EOR fluid injected. This averaged, or “normalized,” result for the replicates of each of the
three nanofluid system experiments shows the same general relationship between silica NP
concentration and oil recovery volume for sequenced injection. The 0.01 wt% silica nanofluid
performed slightly better than the other two systems during chemical-EOR following
waterflooding for sequencing experiments. The low concentration (0.01 wt% NP) suspensions
27
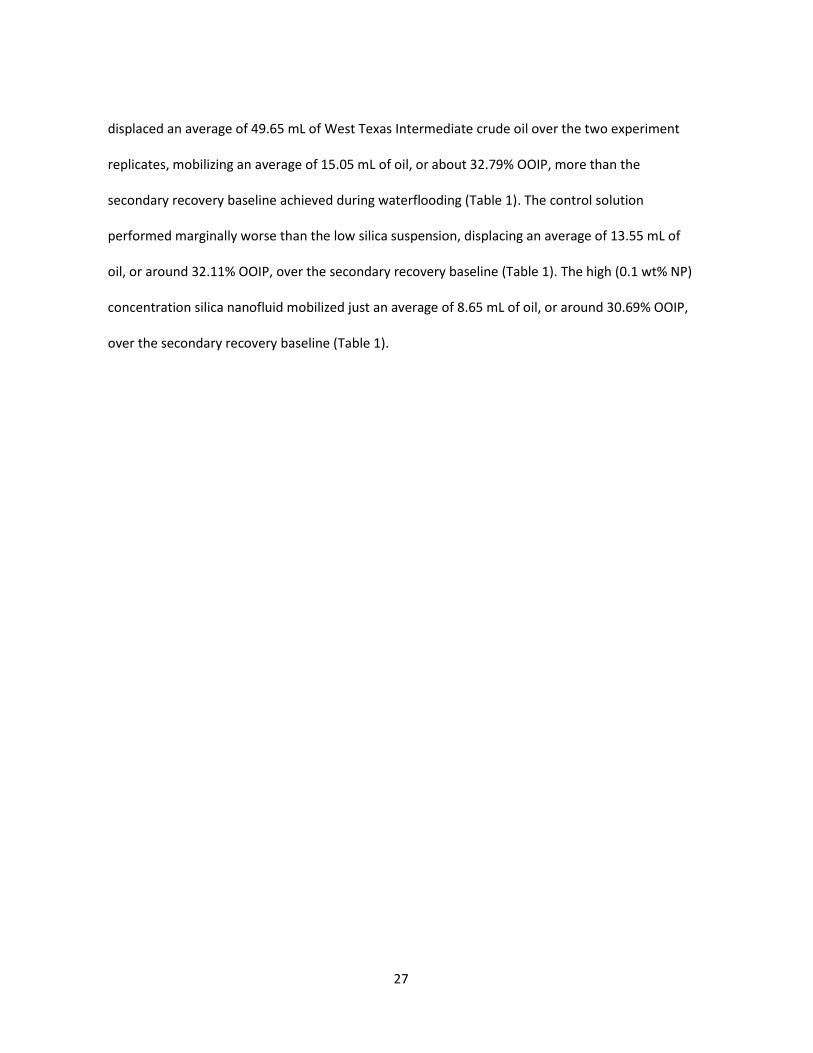
displaced an average of 49.65 mL of West Texas Intermediate crude oil over the two experiment
replicates, mobilizing an average of 15.05 mL of oil, or about 32.79% OOIP, more than the
secondary recovery baseline achieved during waterflooding (Table 1). The control solution
performed marginally worse than the low silica suspension, displacing an average of 13.55 mL of
oil, or around 32.11% OOIP, over the secondary recovery baseline (Table 1). The high (0.1 wt% NP)
concentration silica nanofluid mobilized just an average of 8.65 mL of oil, or around 30.69% OOIP,
over the secondary recovery baseline (Table 1).
28
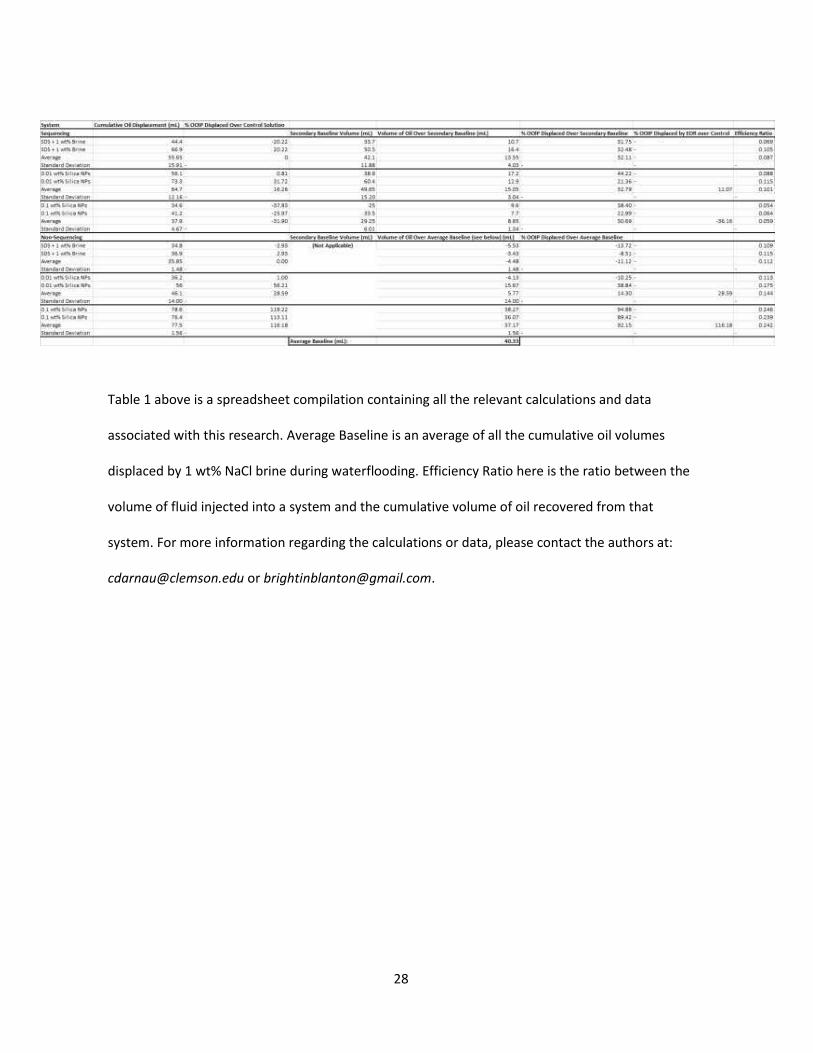
Table 1 above is a spreadsheet compilation containing all the relevant calculations and data
associated with this research. Average Baseline is an average of all the cumulative oil volumes
displaced by 1 wt% NaCl brine during waterflooding. Efficiency Ratio here is the ratio between the
volume of fluid injected into a system and the cumulative volume of oil recovered from that
system. For more information regarding the calculations or data, please contact the authors at:
29
The key insight from these sequenced experiments is that, for all three chemical-EOR
systems, an additional 30% or more of OOIP is mobilized over the respective average secondary
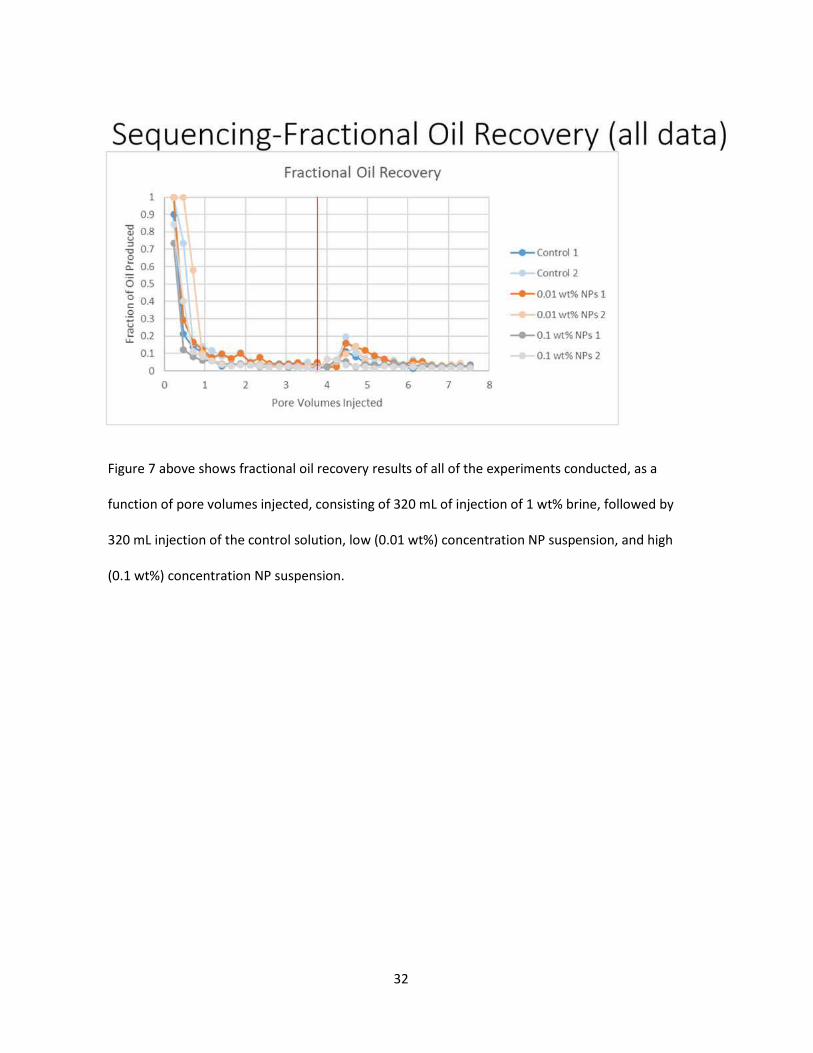
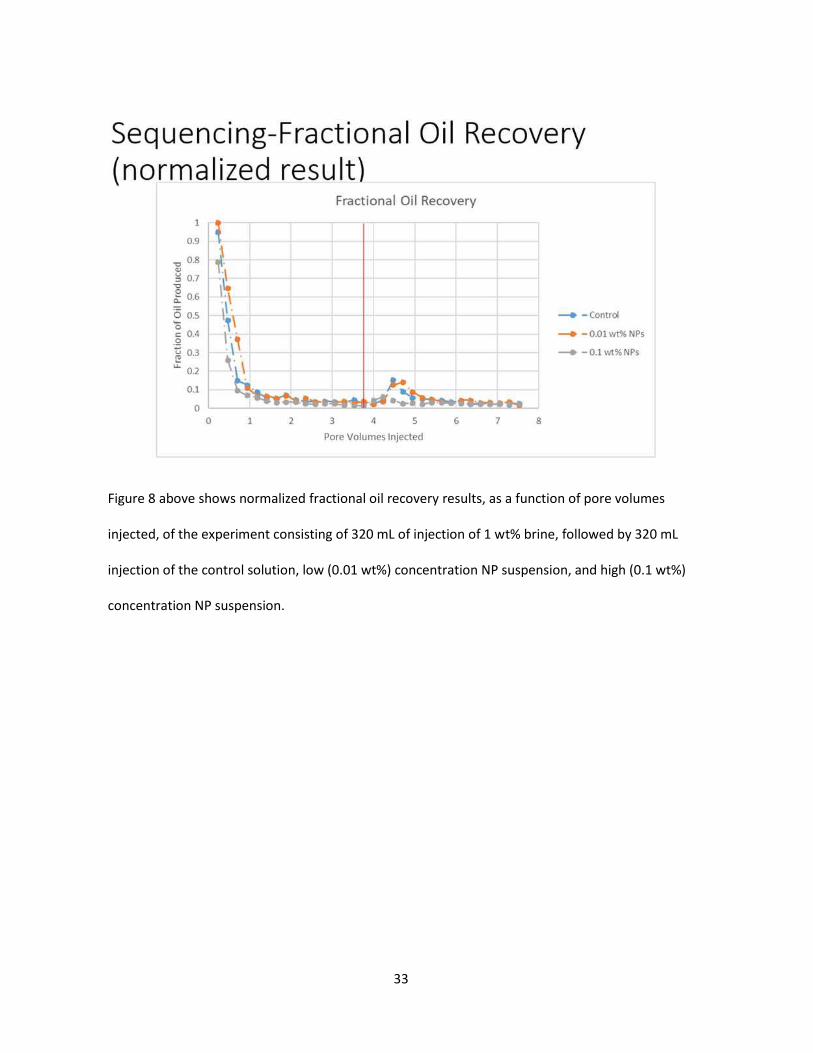
baseline recovery achieved for the pairs of experimental replicates. Notice how the fractional
crude oil recovery rate spikes shortly after transitioning from brine injection to chemical-EOR in
Figures 7 and 8 below. These sequenced injection results indicate that low (magnitude of 0.01
wt% silica) concentration nanofluids perform similarly to the 2 CMC SDS in brine control solution
in terms of cumulative oil displacement. The high (magnitude of 0.1 wt% silica) concentration
nanofluids performed distinctly worse in terms of the average volume of oil recovered over
baseline, but only around 2% worse in terms of the difference in percent of OOIP removed over
average secondary baseline. The surprisingly low effectiveness of 0.1 wt% silica nanofluid to
displace crude oil during chemical-EOR in sequencing experiments distinctly contrasts with the
relationship observed during the non-sequencing experimental results (see below). There are
several possible explanations for this behavior. The most likely explanation for low mobilization of
oil over the secondary baseline by the high concentration silica nanofluid is that the preceding
waterflooding event introduced enough sodium and chloride ions to greatly increase the rate of
flocculation of suspended particles. This flocculation of silica NPs and removal of salt from solution
has been shown to possibly enable a positive reinforcement cycle of flocculation of NP aggregates
and solutes, removal from suspension and solution, and growth of large hydrodynamic diameter
masses of previously well-dispersed material (Worthen et al., 2014).
30
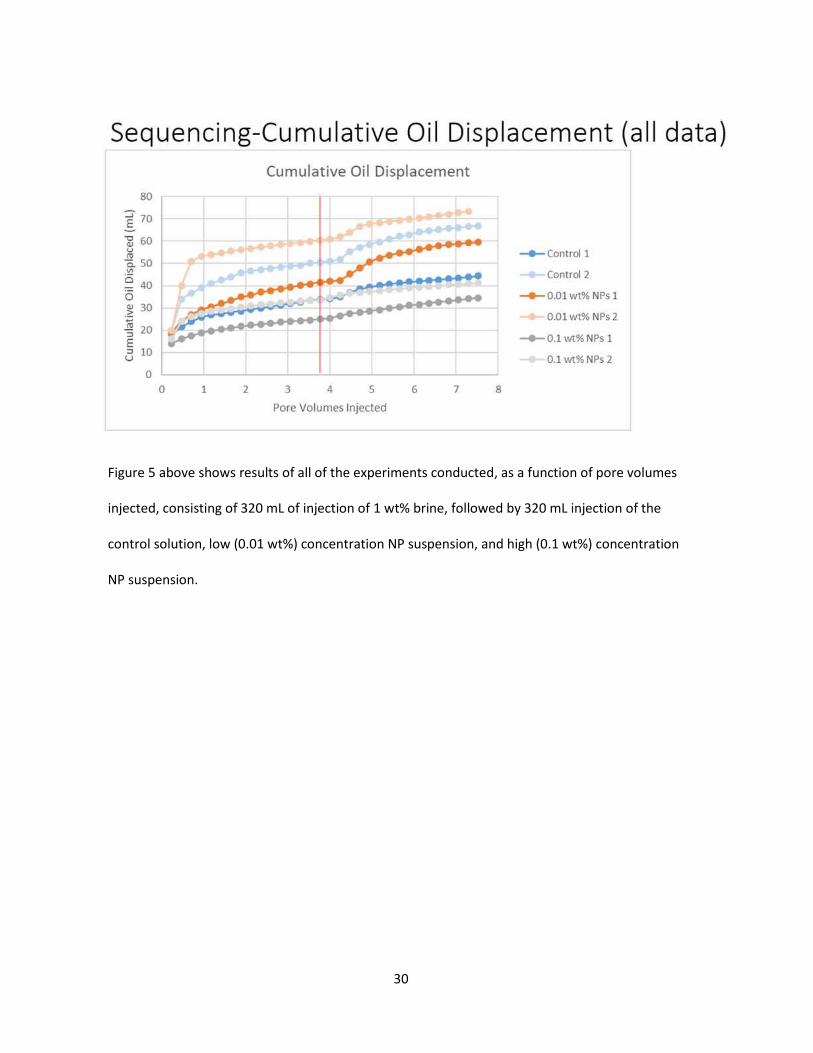
Figure 5 above shows results of all of the experiments conducted, as a function of pore volumes
injected, consisting of 320 mL of injection of 1 wt% brine, followed by 320 mL injection of the
control solution, low (0.01 wt%) concentration NP suspension, and high (0.1 wt%) concentration
NP suspension.
31
Figure 6 above shows normalized results, as a function of pore volumes injected, of the
experiment consisting of 320 mL of injection of 1 wt% brine, followed by 320 mL injection of the
control solution, low (0.01 wt%) concentration NP suspension, and high (0.1 wt%) concentration
NP suspension.
32
Figure 7 above shows fractional oil recovery results of all of the experiments conducted, as a
function of pore volumes injected, consisting of 320 mL of injection of 1 wt% brine, followed by
320 mL injection of the control solution, low (0.01 wt%) concentration NP suspension, and high
(0.1 wt%) concentration NP suspension.
33
Figure 8 above shows normalized fractional oil recovery results, as a function of pore volumes
injected, of the experiment consisting of 320 mL of injection of 1 wt% brine, followed by 320 mL
injection of the control solution, low (0.01 wt%) concentration NP suspension, and high (0.1 wt%)
concentration NP suspension.
34
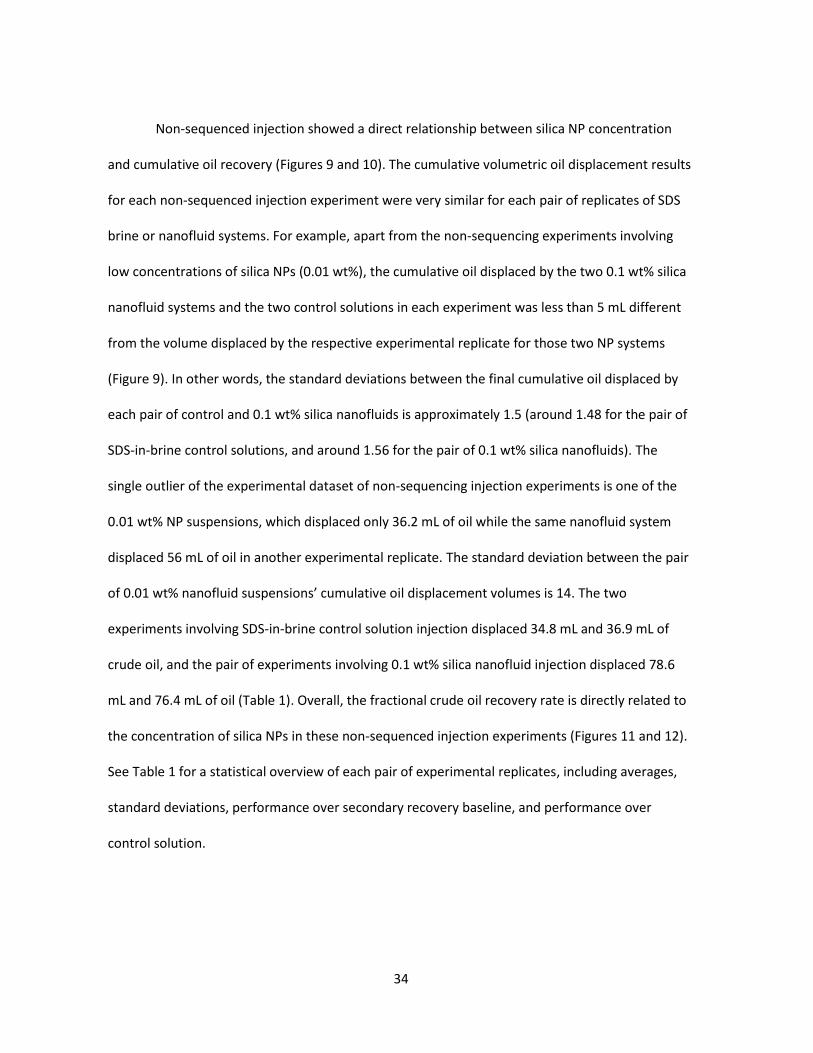
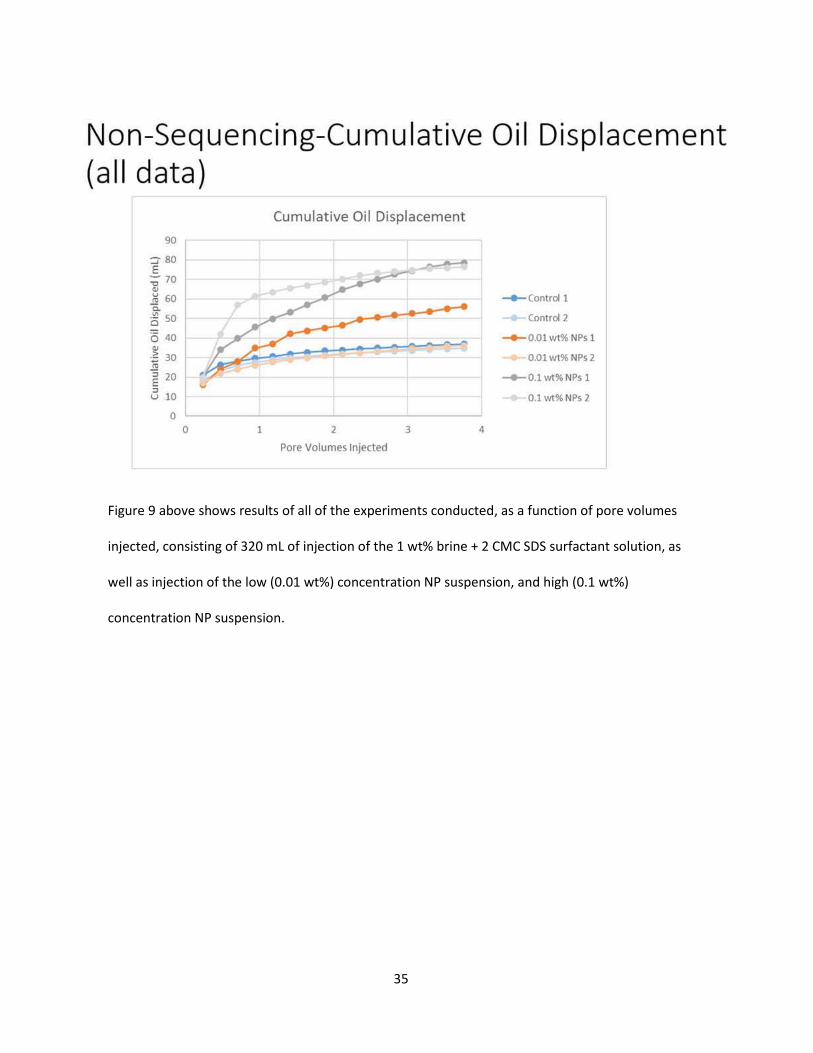
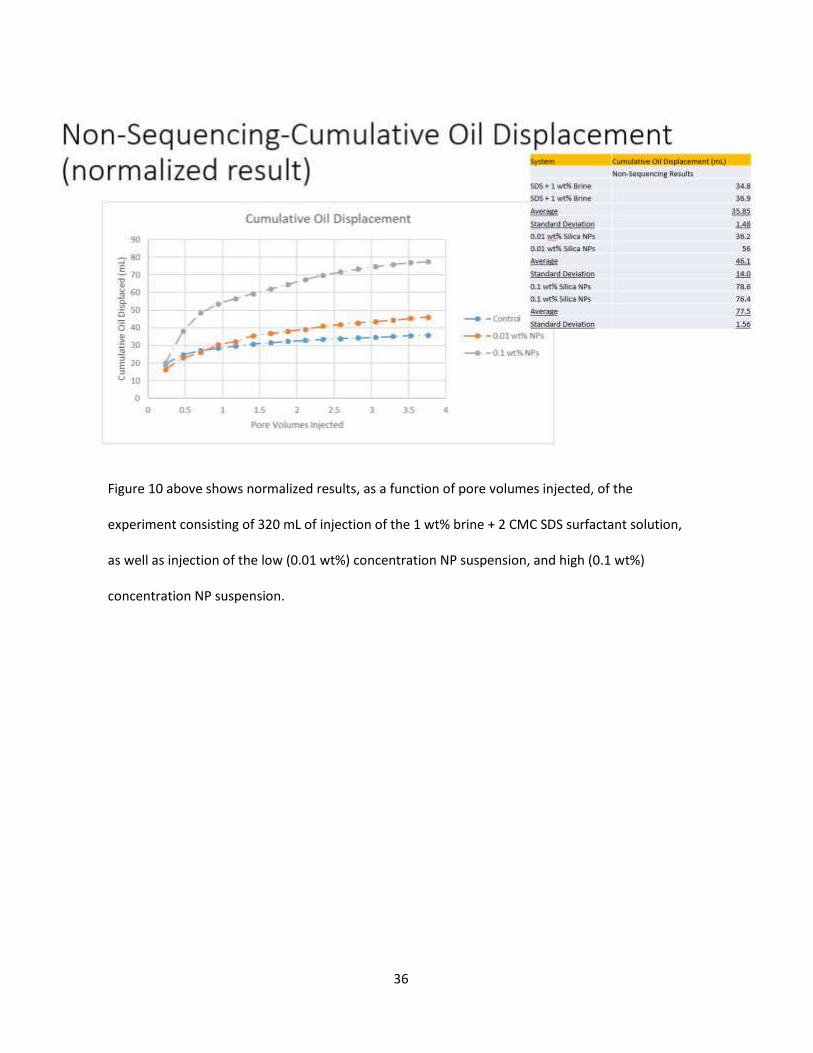
Non-sequenced injection showed a direct relationship between silica NP concentration
and cumulative oil recovery (Figures 9 and 10). The cumulative volumetric oil displacement results
for each non-sequenced injection experiment were very similar for each pair of replicates of SDS
brine or nanofluid systems. For example, apart from the non-sequencing experiments involving
low concentrations of silica NPs (0.01 wt%), the cumulative oil displaced by the two 0.1 wt% silica
nanofluid systems and the two control solutions in each experiment was less than 5 mL different
from the volume displaced by the respective experimental replicate for those two NP systems
(Figure 9). In other words, the standard deviations between the final cumulative oil displaced by
each pair of control and 0.1 wt% silica nanofluids is approximately 1.5 (around 1.48 for the pair of
SDS-in-brine control solutions, and around 1.56 for the pair of 0.1 wt% silica nanofluids). The
single outlier of the experimental dataset of non-sequencing injection experiments is one of the
0.01 wt% NP suspensions, which displaced only 36.2 mL of oil while the same nanofluid system
displaced 56 mL of oil in another experimental replicate. The standard deviation between the pair
of 0.01 wt% nanofluid suspensions’ cumulative oil displacement volumes is 14. The two
experiments involving SDS-in-brine control solution injection displaced 34.8 mL and 36.9 mL of
crude oil, and the pair of experiments involving 0.1 wt% silica nanofluid injection displaced 78.6
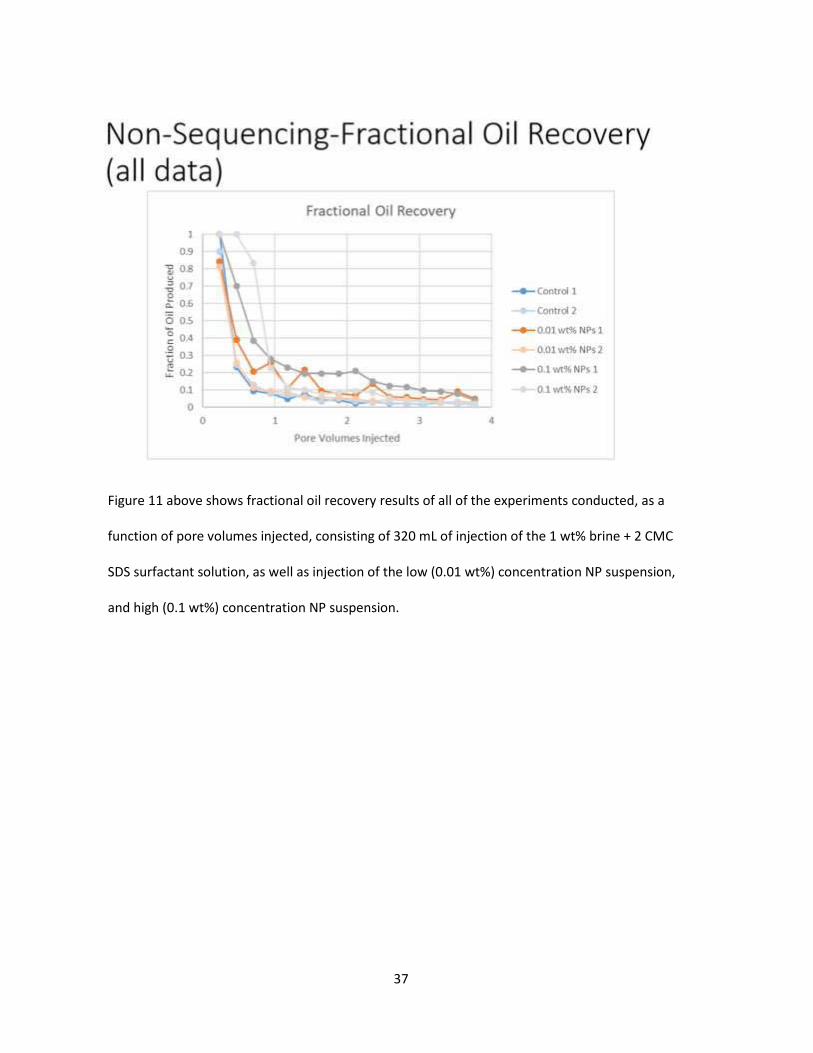
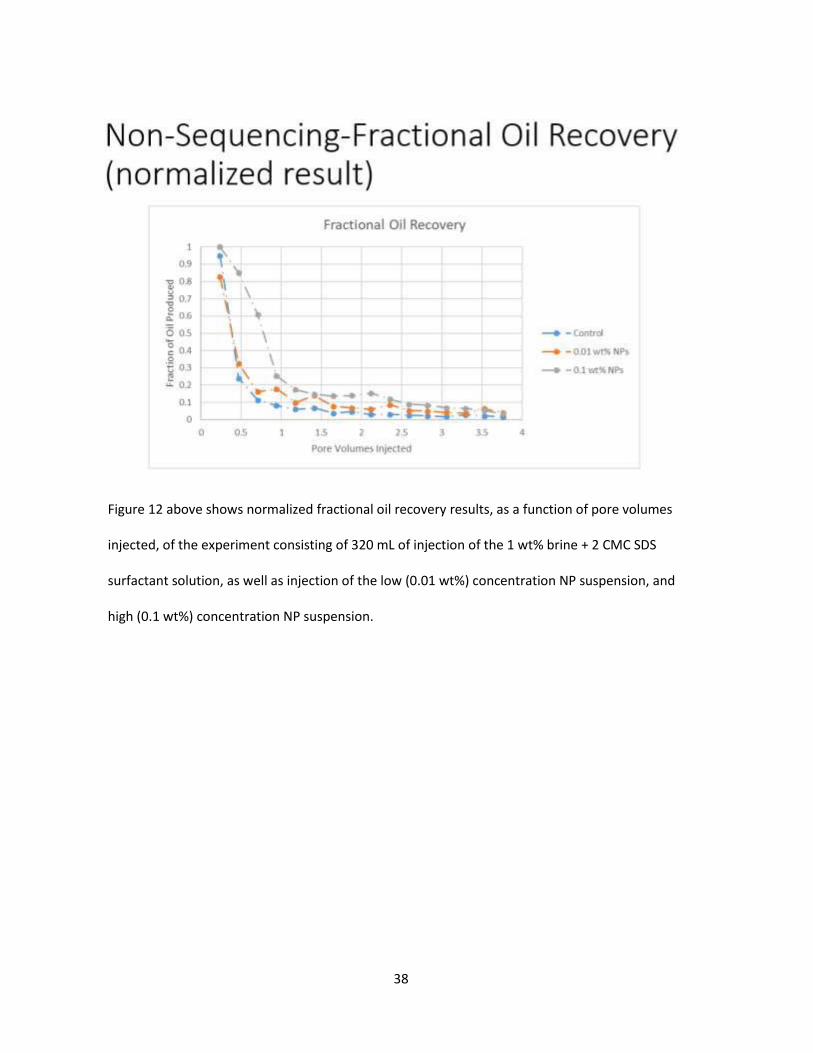
mL and 76.4 mL of oil (Table 1). Overall, the fractional crude oil recovery rate is directly related to
the concentration of silica NPs in these non-sequenced injection experiments (Figures 11 and 12).
See Table 1 for a statistical overview of each pair of experimental replicates, including averages,
standard deviations, performance over secondary recovery baseline, and performance over
control solution.
35
Figure 9 above shows results of all of the experiments conducted, as a function of pore volumes
injected, consisting of 320 mL of injection of the 1 wt% brine + 2 CMC SDS surfactant solution, as
well as injection of the low (0.01 wt%) concentration NP suspension, and high (0.1 wt%)
concentration NP suspension.
36
Figure 10 above shows normalized results, as a function of pore volumes injected, of the
experiment consisting of 320 mL of injection of the 1 wt% brine + 2 CMC SDS surfactant solution,
as well as injection of the low (0.01 wt%) concentration NP suspension, and high (0.1 wt%)
concentration NP suspension.
37
Figure 11 above shows fractional oil recovery results of all of the experiments conducted, as a
function of pore volumes injected, consisting of 320 mL of injection of the 1 wt% brine + 2 CMC
SDS surfactant solution, as well as injection of the low (0.01 wt%) concentration NP suspension,
and high (0.1 wt%) concentration NP suspension.
38
Figure 12 above shows normalized fractional oil recovery results, as a function of pore volumes
injected, of the experiment consisting of 320 mL of injection of the 1 wt% brine + 2 CMC SDS
surfactant solution, as well as injection of the low (0.01 wt%) concentration NP suspension, and
high (0.1 wt%) concentration NP suspension.
39
When comparing experimental results from various oil recovery simulations generated
during similar research projects, or when attempting to use the model presented above to predict
the behavior of a natural system, direct comparisons between cumulative and fractional oil
recovery outputs may be difficult. This is because it is problematic to interpret laboratory scale
results or extrapolate chemical-EOR productivity at the field scale when fractional and cumulative
oil recovery rates are presented as a function of volume of fluid injected. While a relatively small
volume of fluid will displace a relatively large volume of crude oil in the experiment column, at the
field scale the same exact volume of chemical-EOR or waterflooding fluid injected would likely
result in an insignificant amount of crude oil mobilized. To correct for this, and to make the
experimental results more practically relevant and comparable to other research and systems, all
results are plotted as a function of pore volumes injected. The number of PVs injected is
determined simply by dividing the volume of fluid injected (mL) by the PV of the sand-filled
experiment column system (around 85 mL; see Methods section above). To facilitate comparisons
between these results and other experimental data, as well as to ease applications of these results
in the field, all cumulative and fractional oil recovery graphs are plotted as a function of the
number of PVs of chemical-EOR fluid injected.
DISCUSSION
The experimental results described above demonstrate a complex relationship between
silica NP concentration and crude oil mobility enhancement. As described in the Worthen (2014)
paper, the presence of salt in an aqueous silica nanofluid can act as an impediment to crude oil
displacement, mobilization, and recovery. In the Worthen research, emulsions (immiscible
dispersions of oil and water) were generated to observe the impact of silica NPs on the
40
coalescence of oil droplets. Instead of conducting flooding experiments in porous media, the
Worthen et al. project seeks to identify the chemical mechanisms responsible for facilitating the
coalescence of two distinct phases within an insoluble mixture, or emulsion, by observing the
behavior of the liquids within a test tube. Ideally, the emulsion will separate into its component
phases naturally, due to differences in properties such as polarity and density. However, this is
often not the case, especially when dealing with a heavily-imbibed contaminant plume or
petroleum reservoir in porous media. In order to access volumes of oil trapped in the subsurface,
it is useful to enable the coalescence of droplets of the liquid by introducing new chemicals to the
system. Worthen et al. conducted experiments to determine the impact of silica NPs on this
coalescence. Because salt is a common dissolved mineral found in the brackish waters of the deep
subsurface, the Worthen research group looked at the impact of NaCl on the behavior of their
emulsions, comparing the coalescence of phases in emulsions with de-ionized water and synthetic
seawater with a variety of oil/water ratios. The team observes that “salt is shown to produce weak
NP flocculation, which increases the hydrodynamic forces for NP adsorption relative to
electrostatic repulsion and also provides a more effective barrier to droplet coalescence”
(Worthen et al., 2014). Essentially, the dissolved salt ions tip the balance away from electrostatic
repulsion towards hydrodynamic adsorption of suspended solids, a process which decreases the
effectiveness of the NPs and surfactant in flushing the oil droplets from the aqueous phase. NPs
and surfactant perform best when they are well mixed and dissolved (respectively) within the
aqueous phase, and subsequently “sweep” oil droplets out of the aqueous phase and into another
distinct, coalescing oil phase.
41
Although the emulsions generated by the Worthen research team are mixed in test tubes,
rather than in porous media as would be seen in the natural environment, the impact of the salt
as a deterrent to oil coalescence is a valuable takeaway considering how common brine and
brackish water are around contaminant oil plumes and petroleum reservoirs. Another paper,
described in the Rationale section above, argues that low salinity waterflooding, high flow
velocity, pH, and temperature may all contribute to a reduction in water permeability due to an
activation of fine particle migration. The article states, “Numerous methods of fines
immobilization by chemical treatment or nano-particle injections are presently under intensive
development” (Hussain et al., 2013). Although the presence, behavior, or characteristics of these
fine particles were not considered within the initial scope of this research project, the Hussain
article provides an excellent segue to the core flooding experiments described above by positing
that NP injection can immobilize fine particles, allowing them to clog flow paths in the porous
media through which water would otherwise pass, preserving a low relative water permeability,
and increasing oil recovery. The Hussain paper does comment on the ambiguity present across the
experimental results of various papers, noting that some researchers have observed fines
migration in response to low salinity waterflooding while others have not. The exact impact of fine
particles on EOR productivity is undetermined, although the use of saltwater brine for
waterflooding may certainly influence fine particle mobility and thus oil recovery.
Previous research projects have sought to quantify the production results of EOR
experiments in different ways. Most commonly, oil recovery is presented as a function of pore
volumes of waterflooding or chemical-EOR fluid injected. As stated earlier, plotting results as a
function of PVs of fluid injected allows for the results of various experimental configurations to be
42
compared side-by-side. Also, experimental results can be easily scaled up to the field scale when
considering the productivity of an oil field in terms of PVs of fluid injected. For cumulative oil
recovery results, it is difficult to extrapolate from volumetric oil recovery at the experimental scale
to volumetric oil recovery at the field scale because differences in oil properties such as
imbibement, density, viscosity, etc., as well as subsurface properties including porosity,
permeability, and temperature all contribute to the productivity of an oil field. Still, it is
worthwhile to consider the relative cumulative volumetric oil recovery of various chemical-EOR
systems and presenting this data as a function of PVs injected facilitates a comparison between
the results of the experiments conducted during this research project and those of other
experimenters. Fractional oil recovery rates are more apt for comparison between different
chemical-EOR systems and research projects, as fractional oil recovery presents a ratio of the
volume of crude oil recovered to total volume of liquid recovered. At the laboratory scale, 3 PVs of
fluid injected would be around 255 mL (for this research project), and a fractional oil recovery of
0.2 would imply 4 mL of oil and 16 mL of the aqueous phase recovered in a particular 20 mL
effluent sample tube. At the scale of an oil field, 3 PVs of fluid injected could be hundreds of
thousands to millions of liters, while a fractional oil recovery rate of 0.2 could mean 4,000 liters of
crude oil and 16,000 liters of the aqueous phase recovered over the course of an injection event.
Of course, the numbers given for the oil field example above are completely arbitrary, but the fact
remains that the fractional oil recovery rates presented as a function of PVs of injected fluid are
readily scaled up to predict the behavior of natural systems based on laboratory observations.
43
CONCLUSIONS
The results of these experiments indicate that a low concentration of silica NPs does
enhance the oil recovery process with 2 CMC of SDS surfactant in 1 wt% NaCl brine during
sequenced injection experiments. An increased fractional recovery rate and cumulative volume of
oil was produced from a column sandpack because of the 0.01 wt% silica NP fluid injection. For
experiments in which EOR is preceded by waterflooding (sequenced injection), the 0.01 wt% silica
nanofluid chemical-EOR process produced the optimal (greatest crude oil over baseline) result.
When compared to the secondary baseline recovery and the control solution, the 0.01 wt% silica
NP suspension increased the volume of oil displaced the most. However, for experiments in which
non-sequencing injection procedures were implemented, there was a direct relationship between
the wt% concentration of silica NPs in the chemical-EOR nanofluids and cumulative oil
displacement. These non-sequencing results can be compared independently with one another to
provide insight on the immediate impact of various concentrations of silica nanofluids on the
subsurface environment. Based on these non-sequenced results alone, it appears that average
volume of oil displaced is most for the 0.1 wt% silica nanofluid, oil displacement is intermediate
for the 0.01 wt% silica nanofluid, and the 2 CMC SDS in 1 wt% NaCl brine control solution
performed the worst. There are a few possible explanations for why the highest concentration of
SiO2 NPs performed so well in non-sequenced injection experiments but was surpassed by the
0.01 wt% silica nanofluid in terms of productivity in sequenced injection experiments. The
Worthen et al. (2014) article provides a logical explanation for this, describing the mechanisms
through which saline water initiates flocculation and aggregation of particles (Worthen et al.,
2014). The Hussain article (2013) implies greater complexity in the relationship between salt

44
concentration and crude oil mobility, by describing the impacts of physical and chemical
properties on the displacement of fine sediment particles. Fine sediment particles have been
shown to alter the water permeability of the subsurface by clogging flow paths through which
water would otherwise pass. Regardless of the mechanisms responsible for the poor performance
of 0.1 wt% silica nanofluid in sequencing injection, at the scale of an oil field the high
concentration SiO2 aqueous NP suspension is neither practical nor efficient for the sequenced
injection regime that is predominantly employed by the petroleum industry. Due to the very low
cost of extracting and re-injecting brine for waterflooding, sequenced injection appears to be a
surefire technique for minimizing cost and maximizing crude oil displacement for petroleum
engineering applications. Furthermore, under a sequenced injection scenario the low
concentration silica nanofluid is optimal for oil mobilization, due to the caveats associated with
the injection of brine during waterflooding described by Worthen et al. and Hussain et al. in their
research on the behavior of emulsions and porous media (respectively) in a saline environment.
Injecting a lower concentration silica nanofluid reduces the (already low) cost of adding additional
NPs to the chemical-EOR fluid. When considering the costs and benefits of implementing these
injection strategies at the scale of an oil field, the additional expense of increasing the order of
magnitude of NP concentration is likely significantly greater than the expense associated with a
preemptive waterflooding event.
Future applications of this research involve testing oils with different properties such as
viscosity and density, including Nigerian heavy Antan, Brentheimer, and Lloydminster. The
combination of WTI crude oil and 20/40 silica sand with various chemical-EOR systems produced
the specific set of results described earlier in this paper, but it is very likely that these
45
experiments, if repeated, would result in slightly different fractional and cumulative crude oil
displacement. As seen in Table 1, every pair of experimental replicates was responsible for slightly
different levels of cumulative oil displacement. Heterogeneities within the column sandpack,
including preferential flow paths, macropore flow, varying degrees of compression and
compaction, and different degrees of crude oil imbibement may all contribute to variability
between the results of experiments subjected to seemingly identical conditions. Heterogeneities
within the porous media are especially responsible for the behavior of different systems, as even
though 520.5 g of sand are added to each column, the orientation, packing, and
permeability/hydraulic conductivity characteristics of each sandpack system are as unique as the
three-dimensional geometry of the volume of sand grains within. For this reason, nanofluids with
higher and lower NP concentrations could also be studied for applications with different physical
and chemical properties of the reservoir, various crude oil characteristics, and other types of
porous media. A broader range of experimental concentrations of silica NPs would likely provide a
more robust data set for analysis. Other silica NP concentrations may prove optimal for chemical-
EOR of types of crude oil and porous media not considered within the scope of this research
project. Testing different surfactants and different types of NPs, such as aluminum oxide,
nanocellulose and quantum dots, in the chemical-EOR fluid may also provide relevant results.
Silica NPs were used in this paper due their low cost and widespread availability. Based on the
results of the experiments described above, as well as the many other similar projects across the
scientific community, there are limitless variations and opportunities for applying chemical-EOR to
increase the productivity of oil fields within the constraints of the natural environment.
46
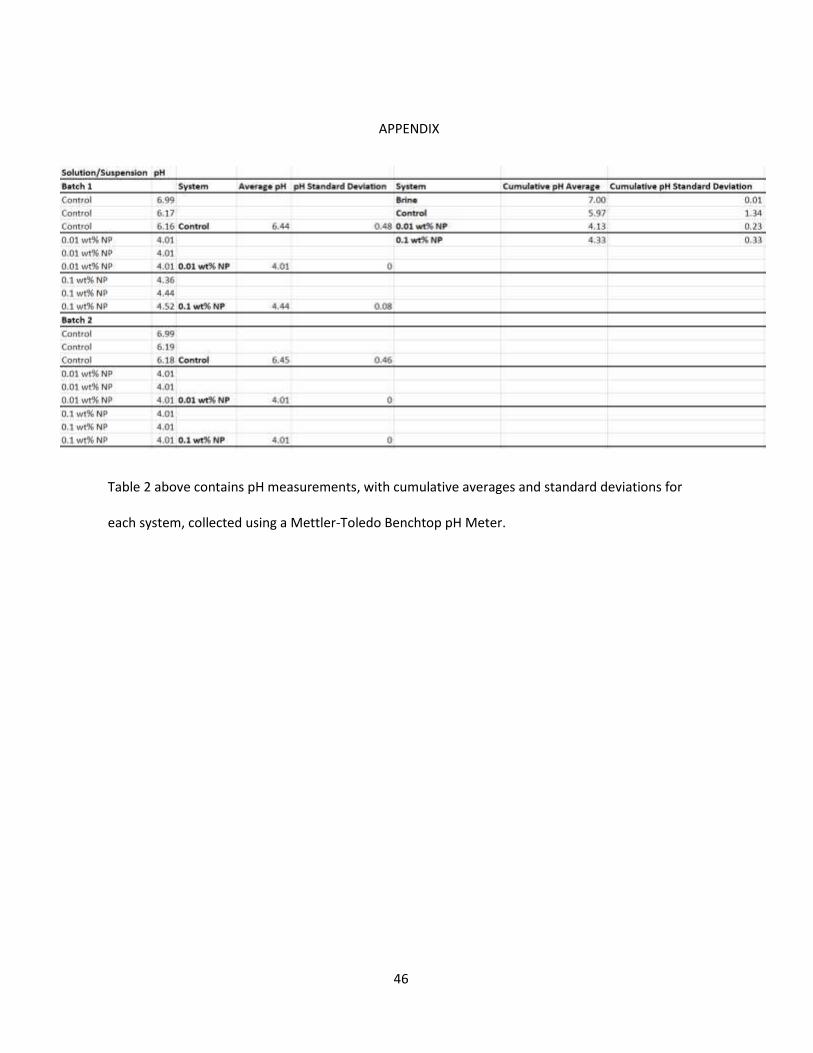
APPENDIX
Table 2 above contains pH measurements, with cumulative averages and standard deviations for
each system, collected using a Mettler-Toledo Benchtop pH Meter.
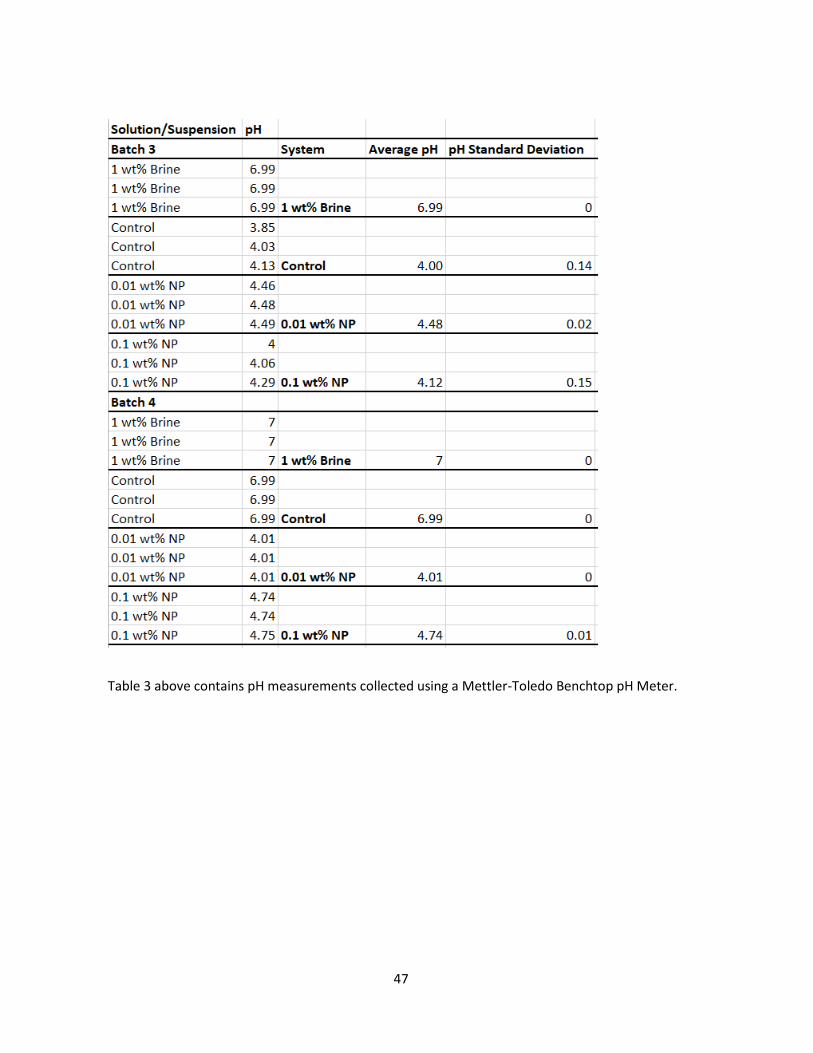
47
Table 3 above contains pH measurements collected using a Mettler-Toledo Benchtop pH Meter.
48
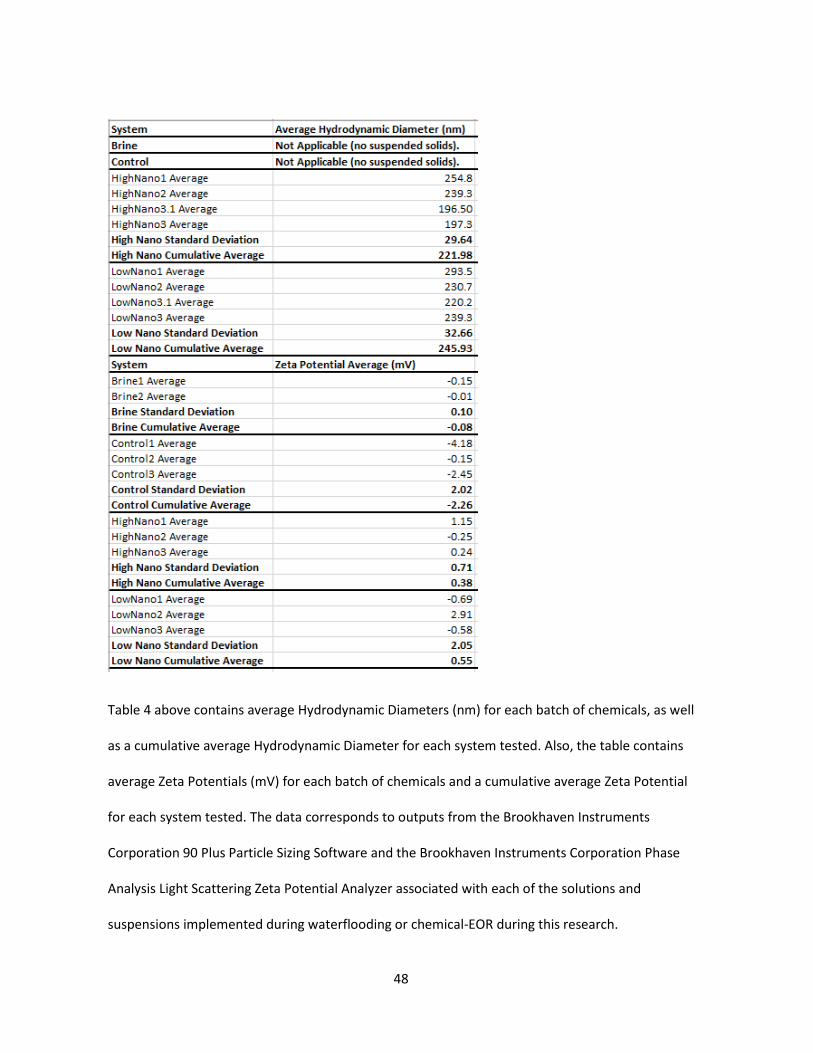
Table 4 above contains average Hydrodynamic Diameters (nm) for each batch of chemicals, as well
as a cumulative average Hydrodynamic Diameter for each system tested. Also, the table contains
average Zeta Potentials (mV) for each batch of chemicals and a cumulative average Zeta Potential
for each system tested. The data corresponds to outputs from the Brookhaven Instruments
Corporation 90 Plus Particle Sizing Software and the Brookhaven Instruments Corporation Phase
Analysis Light Scattering Zeta Potential Analyzer associated with each of the solutions and
suspensions implemented during waterflooding or chemical-EOR during this research.
49
REFERENCES
Binks, B. P., Kirkland, M., & Rodrigues, J. A. (2008). Origin of stabilisation of aqueous foams in
nanoparticle-surfactant mixtures. Soft Matter, 4(12), 2373–2382.
https://doi.org/10.1039/b811291f
Binks, B. P., & Rodrigues, J. A. (2007). Enhanced stabilization of emulsions due to surfactant-
induced nanoparticle flocculation. Langmuir, 23(14), 7436–7439.
https://doi.org/10.1021/la700597k
Bjorlykke, K. (2010). Petroleum Geoscience. https://doi.org/10.1007/978-3-642-02332-3
Dong, M., Ma, S., & Liu, Q. (2009). Enhanced heavy oil recovery through interfacial instability: A
study of chemical flooding for Brintnell heavy oil. Fuel, 88(6), 1049–1056.
https://doi.org/10.1016/j.fuel.2008.11.014
Hosseini-Nasab, S. M., & Zitha, P. L. J. (2017). Investigation of Chemical-Foam Design as a Novel
Approach toward Immiscible Foam Flooding for Enhanced Oil Recovery. Energy and Fuels,
31(10), 10525–10534. https://doi.org/10.1021/acs.energyfuels.7b01535
Huibers, B. M. J., Pales, A. R., Bai, L., Li, C., Mu, L., Ladner, D., … Darnault, C. J. G. (2017).
Wettability alteration of sandstones by silica nanoparticle dispersions in light and heavy
crude oil. Journal of Nanoparticle Research, 19(9). https://doi.org/10.1007/s11051-017-
4011-7
50
Hussain, F., Zeinijahromi, A., Bedrikovetsky, P., Badalyan, A., Carageorgos, T., & Cinar, Y. (2013).
Journal of Petroleum Science and Engineering An experimental study of improved oil recovery
through fi nes-assisted water fl ooding. 109, 187–197.
https://doi.org/10.1016/j.petrol.2013.08.031
Johannessen, A. M., & Spildo, K. (2013). Enhanced oil recovery (EOR) by combining surfactant with
low salinity injection. Energy and Fuels, 27(10), 5738–5749.
https://doi.org/10.1021/ef400596b
Joonaki, E., & Ghanaatian, S. (2014). The application of nanofluids for enhanced oil recovery:
Effects on interfacial tension and coreflooding process. Petroleum Science and Technology,
32(21), 2599–2607. https://doi.org/10.1080/10916466.2013.855228
Mid-Con Energy Partners, LP (2014). Oil Recovery Overview. Retrieved from
http://www.midconenergypartners.com/oil-recovery-overview.php
Osei-Bonsu, K., Grassia, P., & Shokri, N. (2017). Relationship between bulk foam stability,
surfactant formulation and oil displacement efficiency in porous media. Fuel, 203, 403–410.
https://doi.org/10.1016/j.fuel.2017.04.114
Polymer Properties Database (2015). Microemulsion Polymerization. Retrieved from
http://polymerdatabase.com/polymer%20chemistry/Microemulsion%20Polymerization.html
Ravari, R. R., Strand, S., & Austad, T. (2011). Combined surfactant-enhanced gravity drainage
(SEGD) of oil and the wettability alteration in carbonates: The effect of rock permeability and
interfacial tension (IFT). Energy and Fuels, 25(5), 2083–2088.
https://doi.org/10.1021/ef200085t
51
Singh, R., & Mohanty, K. K. (2015). Synergy between nanoparticles and surfactants in stabilizing
foams for oil recovery. Energy and Fuels, 29(2), 467–479. https://doi.org/10.1021/ef5015007
Sun, Q., Li, Z., Li, S., Jiang, L., Wang, J., & Wang, P. (2014). Utilization of surfactant-stabilized foam
for enhanced oil recovery by adding nanoparticles. Energy and Fuels, 28(4), 2384–2394.
https://doi.org/10.1021/ef402453b
United States Department of Energy (n.d.). Enhanced Oil Recovery. Retrieved from
https://www.energy.gov/fe/science-innovation/oil-gas-research/enhanced-oil-recovery
Wang, Y., Zhang, C., Wei, N., Oostrom, M., Wietsma, T. W., Li, X., & Bonneville, A. (2013).
Experimental study of crossover from capillary to viscous fingering for supercritical CO 2 -
water displacement in a homogeneous pore network. Environmental Science and
Technology, 47(1), 212–218. https://doi.org/10.1021/es3014503
Wei, B., Li, Q., Jin, F., Li, H., & Wang, C. (2016). The Potential of a Novel Nanofluid in Enhancing Oil
Recovery. Energy and Fuels, 30(4), 2882–2891.
https://doi.org/10.1021/acs.energyfuels.6b00244
Worthen, A. J., Foster, L. M., Dong, J., Bollinger, J. A., Peterman, A. H., Pastora, L. E., … Johnston, K.
P. (2014). Synergistic formation and stabilization of oil-in-water emulsions by a weakly
interacting mixture of zwitterionic surfactant and silica nanoparticles. Langmuir, 30(4), 984–
994. https://doi.org/10.1021/la404132p
Yang, W., Wang, T., Fan, Z., Miao, Q., Deng, Z., & Zhu, Y. (2017). Foams Stabilized by in Situ-
Modified Nanoparticles and Anionic Surfactants for Enhanced Oil Recovery. Energy and
Fuels, 31(5), 4721–4730. https://doi.org/10.1021/acs.energyfuels.6b03217
52
Zargartalebi, M., Barati, N., & Kharrat, R. (2014). Journal of Petroleum Science and Engineering In
fl uences of hydrophilic and hydrophobic silica nanoparticles on anionic surfactant
properties : Interfacial and adsorption behaviors. Journal of Petroleum Science and
Engineering, 119, 36–43. https://doi.org/10.1016/j.petrol.2014.04.010
Zhang, H., Nikolov, A., & Wasan, D. (2014). Enhanced oil recovery (EOR) using nanoparticle
dispersions: Underlying mechanism and imbibition experiments. Energy and Fuels, 28(5),
3002–3009. https://doi.org/10.1021/ef500272r