Embed Size (px)
Citation preview
Preparation of silica nanoparticles
Process: Sol - Gel - Synthesis - Precipitation
Chemical reactions: Hydrolysis - Polycondensation
Hydrolysis:
Si(OC2H5)4 + 4 H2O Si(OH)4 + 4 C2H5OH pH 11 - 12 (NH3)
Suspension in ethanol
Tetra ethyl orthosilicate (TEOS) Silicon tetra hydroxide Ethanol
Polycondensation:
Si(OH) SiO (S l) + 2 H OSuspension in ethanol
Si(OH)4 nano- SiO2 (Sol) + 2 H2O
Silicon tetra hydroxide Silica
pH 11 - 12 (NH3)
Principles: Nucleation, nucleus growth, Ostwald ripening, (agglomeration)
Silicon tetra hydroxide Silica
p g p g gg
Controlled double jet precipitation (CDJP)
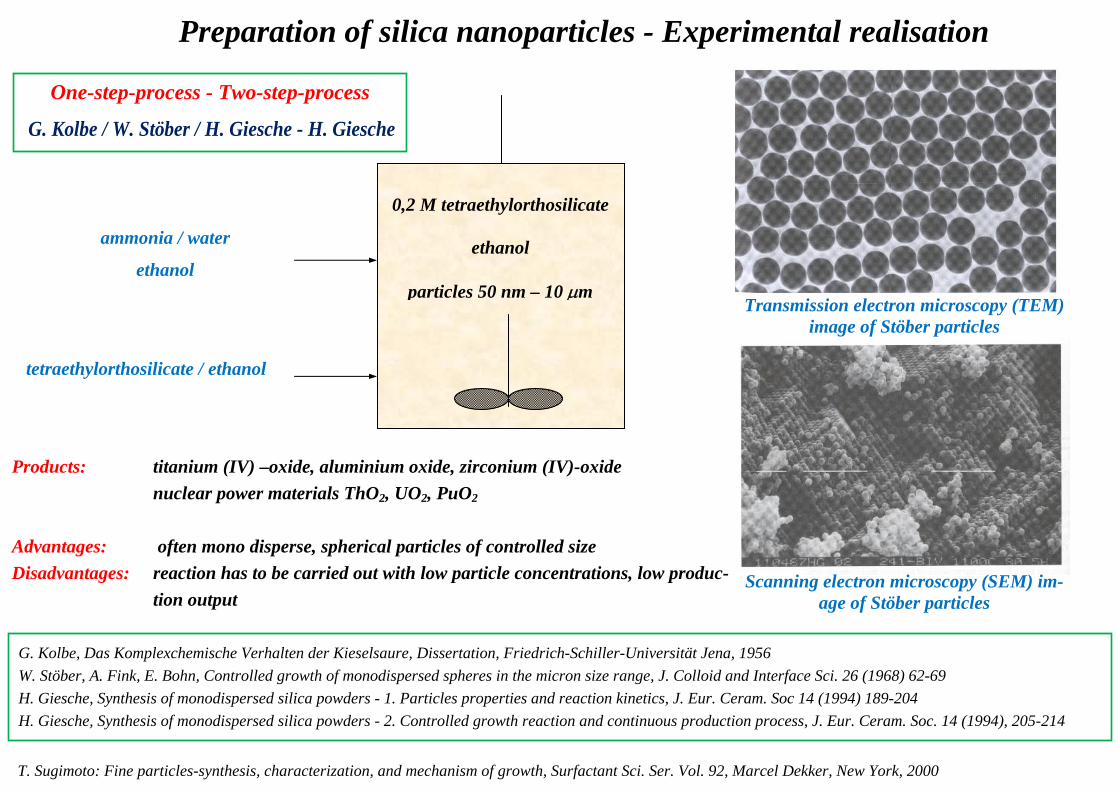
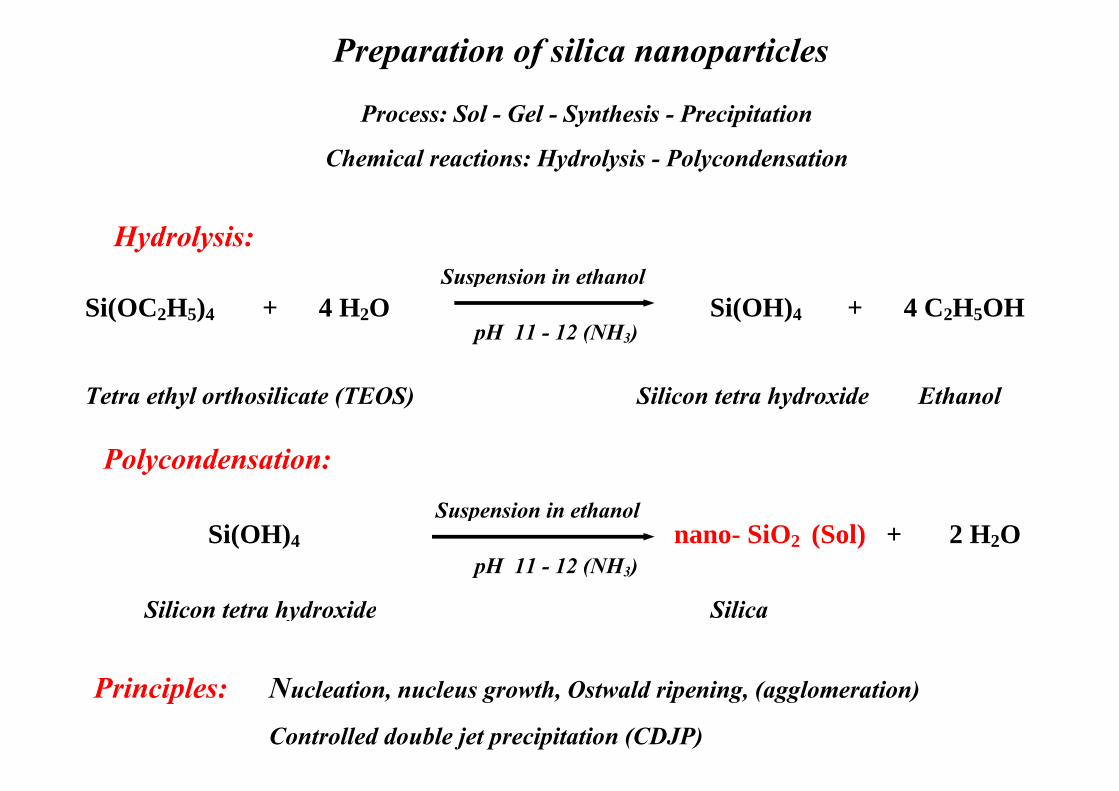
Preparation of silica nanoparticles - Experimental realisation
G. Kolbe, Das Komplexchemische Verhalten der Kieselsaure, Dissertation, Friedrich-Schiller-Universität Jena, 1956 W. Stöber, A. Fink, E. Bohn, Controlled growth of monodispersed spheres in the micron size range, J. Colloid and Interface Sci. 26 (1968) 62-69 H. Giesche, Synthesis of monodispersed silica powders - 1. Particles properties and reaction kinetics, J. Eur. Ceram. Soc 14 (1994) 189-204 H. Giesche, Synthesis of monodispersed silica powders - 2. Controlled growth reaction and continuous production process, J. Eur. Ceram. Soc. 14 (1994), 205-214
Transmission electron microscopy (TEM) image of Stöber particles
Scanning electron microscopy (SEM) im-age of Stöber particles
T. Sugimoto: Fine particles-synthesis, characterization, and mechanism of growth, Surfactant Sci. Ser. Vol. 92, Marcel Dekker, New York, 2000
Products: titanium (IV) –oxide, aluminium oxide, zirconium (IV)-oxide nuclear power materials ThO2, UO2, PuO2
Advantages: often mono disperse, spherical particles of controlled size Disadvantages: reaction has to be carried out with low particle concentrations, low produc-
tion output
0,2 M tetraethylorthosilicate
ethanol
particles 50 nm – 10 μm
ammonia / water
ethanol
tetraethylorthosilicate / ethanol
One-step-process - Two-step-process
G. Kolbe / W. Stöber / H. Giesche - H. Giesche
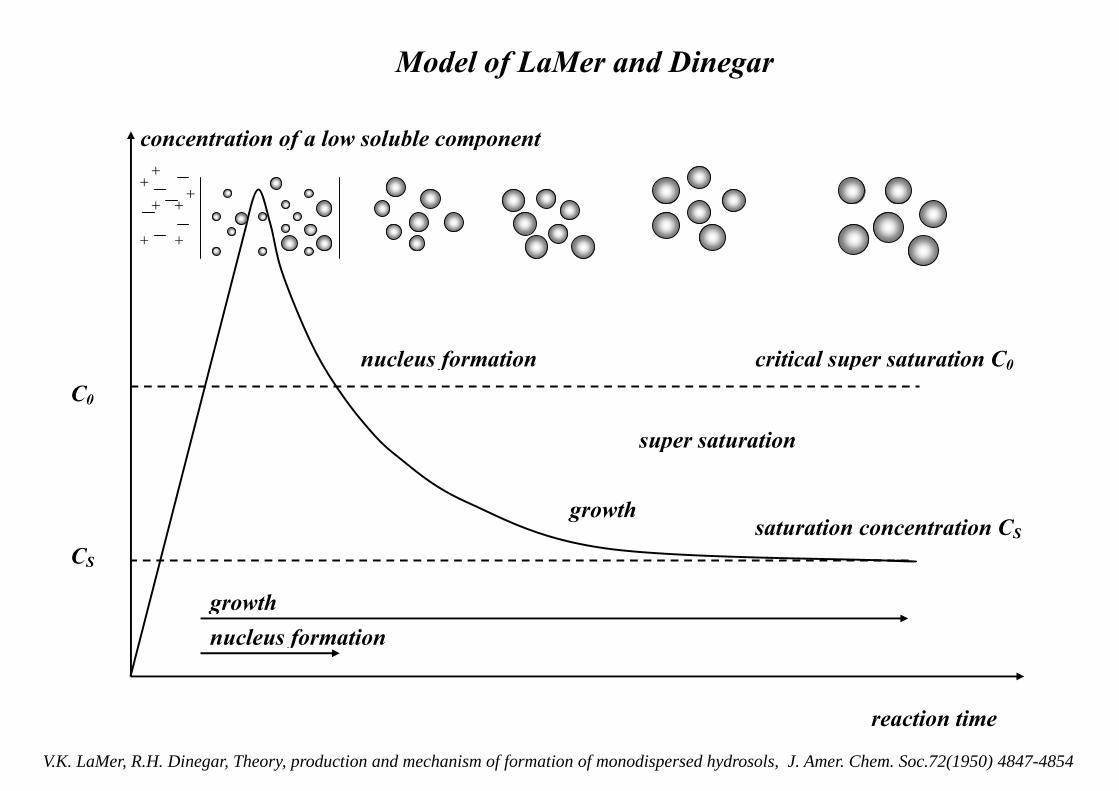
Model of LaMer and Dinegar
concentration of a low soluble component+
+
+
+
+ +
+
l f i i i l i C
super saturation
nucleus formation critical super saturation C0
C0
saturation concentration C
super saturation
growth saturation concentration CS
CS
growth nucleus formation
reaction time
V.K. LaMer, R.H. Dinegar, Theory, production and mechanism of formation of monodispersed hydrosols, J. Amer. Chem. Soc.72(1950) 4847-4854
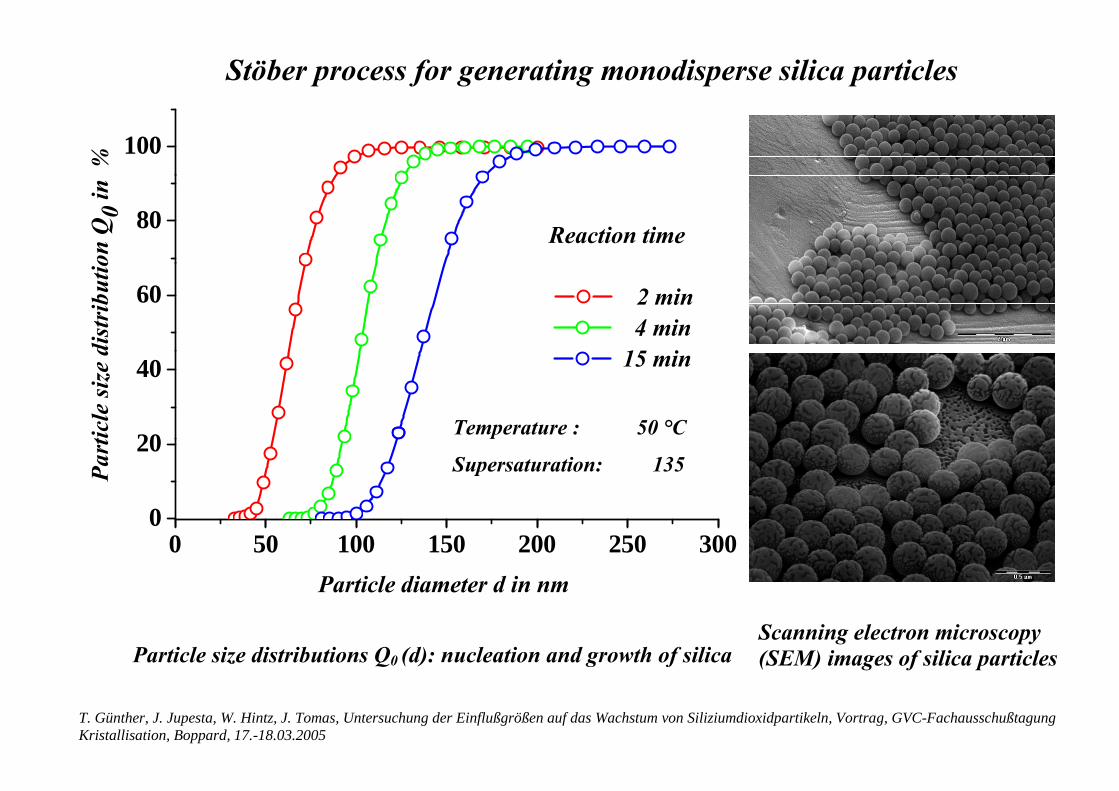
Stöber process for generating monodisperse silica particles
100
%
80 Reaction time
on Q
0 in
60 2 min 4 min
15 idist
ribu
tio
Temperature : 50 °C 20
40 15 min
ticle
size
d
Supersaturation: 135
0
20
Part
0 50 100 150 200 250 300Particle diameter d in nm
Particle size distributions Q0 (d): nucleation and growth of silica Scanning electron microscopy (SEM) images of silica particles
T. Günther, J. Jupesta, W. Hintz, J. Tomas, Untersuchung der Einflußgrößen auf das Wachstum von Siliziumdioxidpartikeln, Vortrag, GVC-Fachausschußtagung Kristallisation, Boppard, 17.-18.03.2005
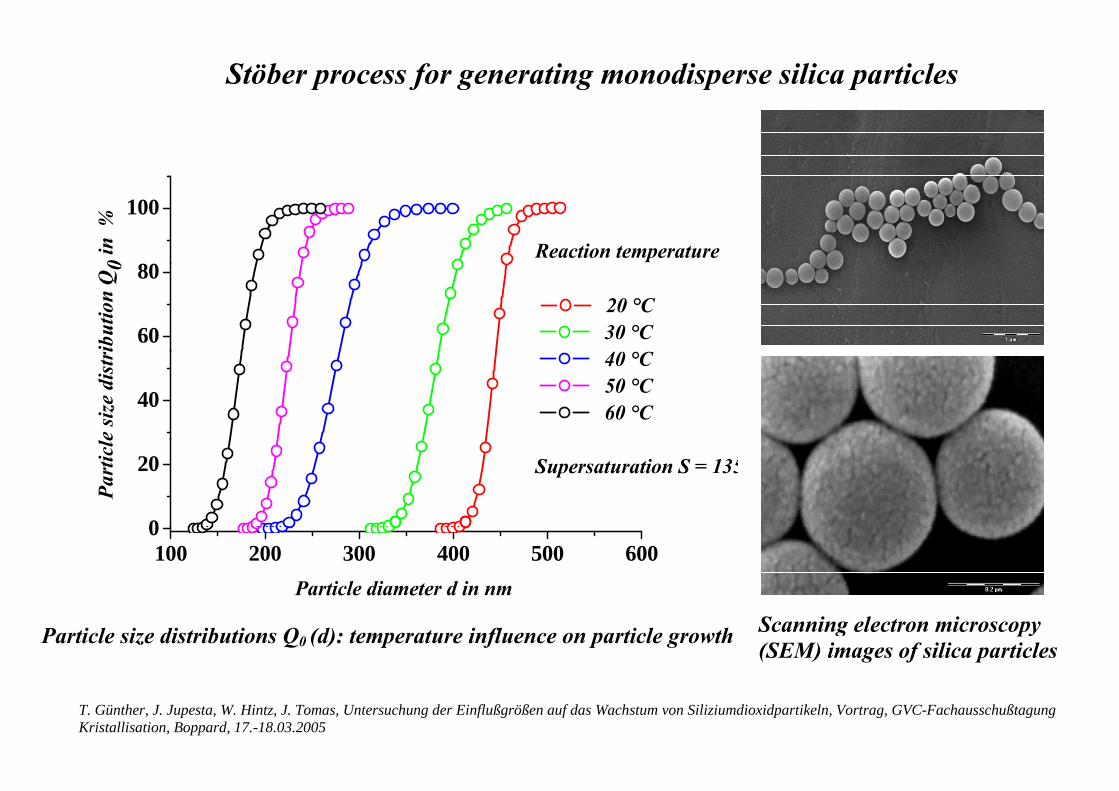
Stöber process for generating monodisperse silica particles
p f g g p p
80
100
Reaction temperature 0 in %
60
80 20 °C 30 °Cib
utio
n Q
0
40
40 °C 50 °C 60 °C
e si
ze d
istr
i
0
20 Supersaturation S = 135 Pa
rtic
le
100 200 300 400 500 6000
Particle diameter d in nm
Particle size distributions Q0 (d): temperature influence on particle growth Scanning electron microscopy (SEM) images of silica particles
T. Günther, J. Jupesta, W. Hintz, J. Tomas, Untersuchung der Einflußgrößen auf das Wachstum von Siliziumdioxidpartikeln, Vortrag, GVC-Fachausschußtagung Kristallisation, Boppard, 17.-18.03.2005
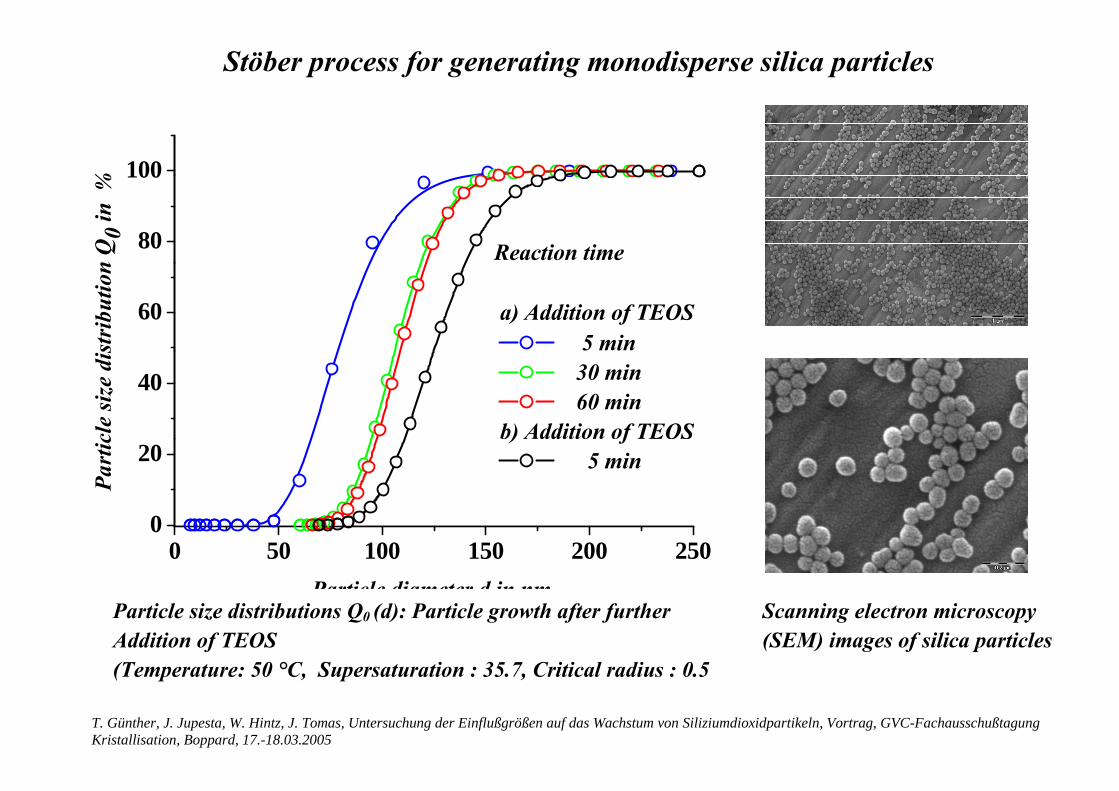
Stöber process for generating monodisperse silica particles
100%
80
100
Reaction timen Q
0 in %
60 a) Addition of TEOS 5 minst
ribu
tion
40 30 min 60 min b) Addition of TEOS cl
e si
ze d
is
0
20) f
5 min Pa
rtic
0 50 100 150 200 2500
Particle diameter d in nm Particle size distributions Q0 (d): Particle growth after further Scanning electron microscopyParticle size distributions Q0 (d): Particle growth after further Addition of TEOS (Temperature: 50 °C, Supersaturation : 35.7, Critical radius : 0.5
Scanning electron microscopy (SEM) images of silica particles
T. Günther, J. Jupesta, W. Hintz, J. Tomas, Untersuchung der Einflußgrößen auf das Wachstum von Siliziumdioxidpartikeln, Vortrag, GVC-Fachausschußtagung Kristallisation, Boppard, 17.-18.03.2005
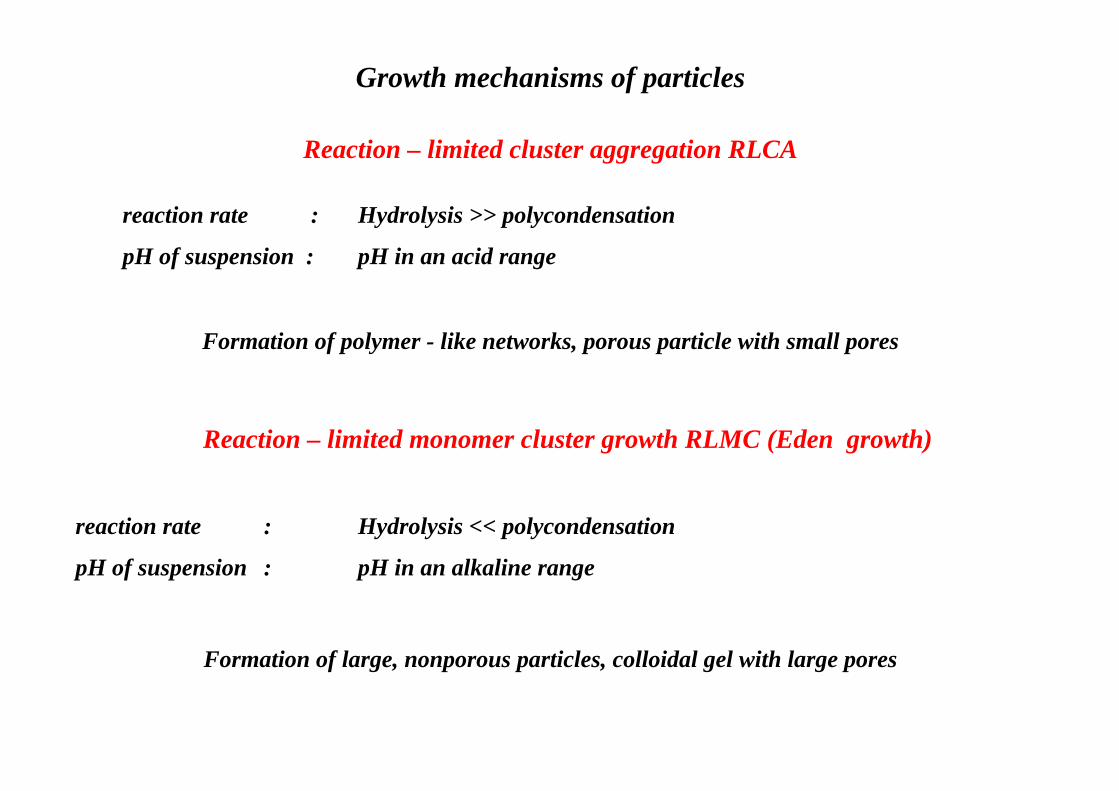
Growth mechanisms of particles
Reaction – limited cluster aggregation RLCA
reaction rate : Hydrolysis >> polycondensation
pH of suspension : pH in an acid range
Formation of polymer - like networks, porous particle with small pores
Reaction – limited monomer cluster growth RLMC (Eden growth)
reaction rate : Hydrolysis << polycondensation
pH of suspension : pH in an alkaline range
Formation of large, nonporous particles, colloidal gel with large pores
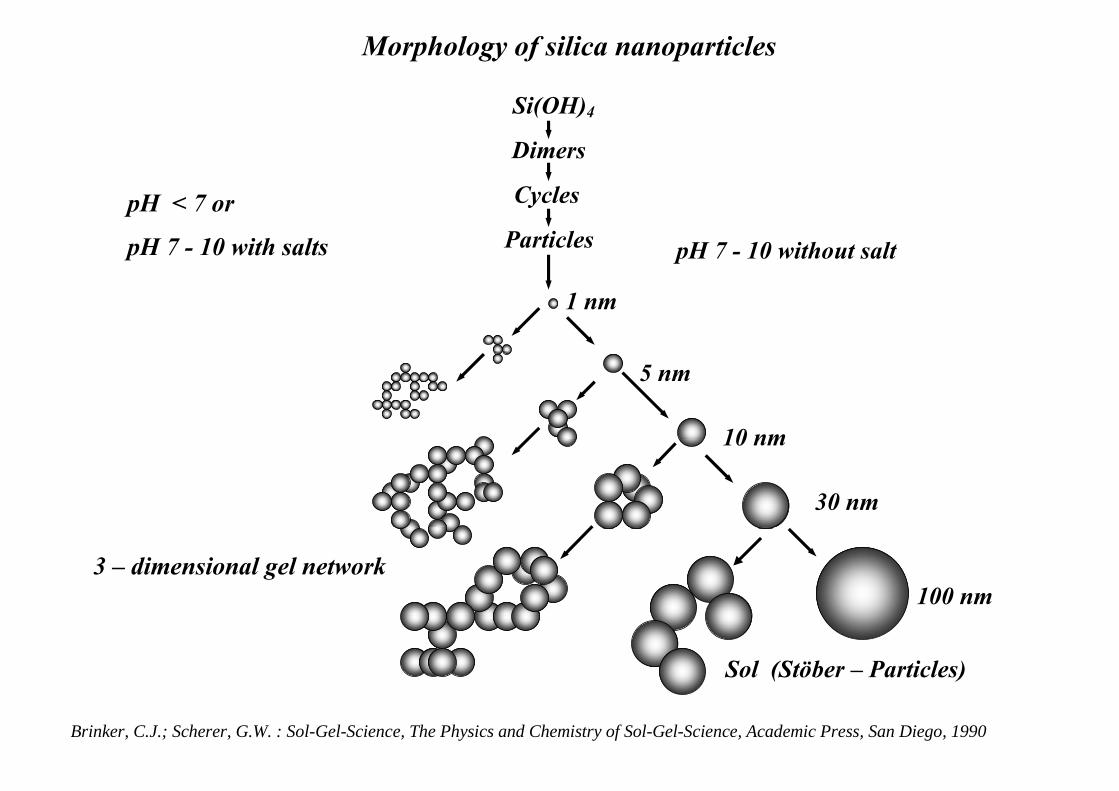
Morphology of silica nanoparticles
Si(OH)4
Dimers
pH < 7 or
pH 7 - 10 with salts
Cycles
Particles pH 7 - 10 without salt
1 nm
p
5 nm
10 nm10 nm
30 nm
3 – dimensional gel network 100 nm
Sol (Stöber – Particles)
Brinker, C.J.; Scherer, G.W. : Sol-Gel-Science, The Physics and Chemistry of Sol-Gel-Science, Academic Press, San Diego, 1990
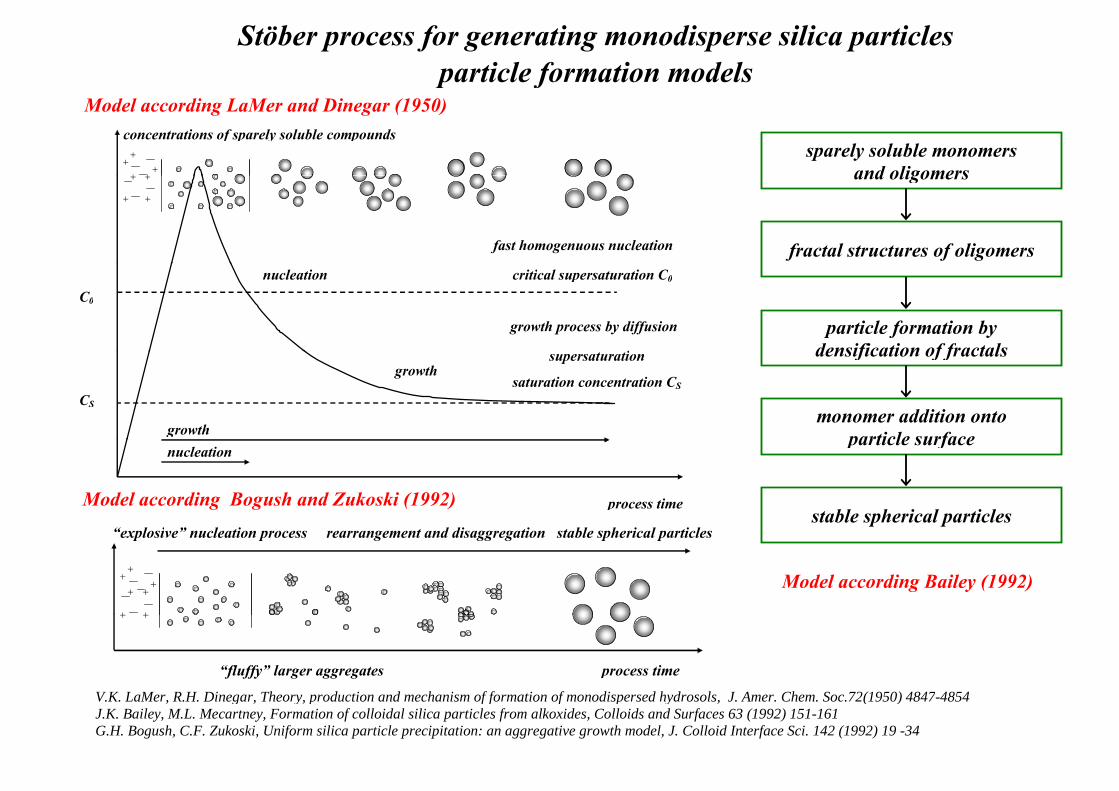
Stöber process for generating monodisperse silica particles
particle formation models p f
concentrations of sparely soluble compounds+
+++
+
Model according LaMer and Dinegar (1950)
sparely soluble monomers and oligomers
+
+
+
+
fast homogenuous nucleation
and oligomers
fractal structures of oligomers
i
nucleation critical supersaturation C0
C0
growth process by diffusion particle formation by densification of fractals
saturation concentration CS
CS
supersaturation growth
growth
densification of fractals
monomer addition onto particle surface
process time
nucleationparticle surface
stable spherical particles Model according Bogush and Zukoski (1992)
+
+
+
+
+ +
+
“explosive” nucleation process rearrangement and disaggregation stable spherical particles
Model according Bailey (1992)
“fluffy” larger aggregates process time
+ +
V.K. LaMer, R.H. Dinegar, Theory, production and mechanism of formation of monodispersed hydrosols, J. Amer. Chem. Soc.72(1950) 4847-4854 , g , y, p f f f p y , ( )J.K. Bailey, M.L. Mecartney, Formation of colloidal silica particles from alkoxides, Colloids and Surfaces 63 (1992) 151-161 G.H. Bogush, C.F. Zukoski, Uniform silica particle precipitation: an aggregative growth model, J. Colloid Interface Sci. 142 (1992) 19 -34
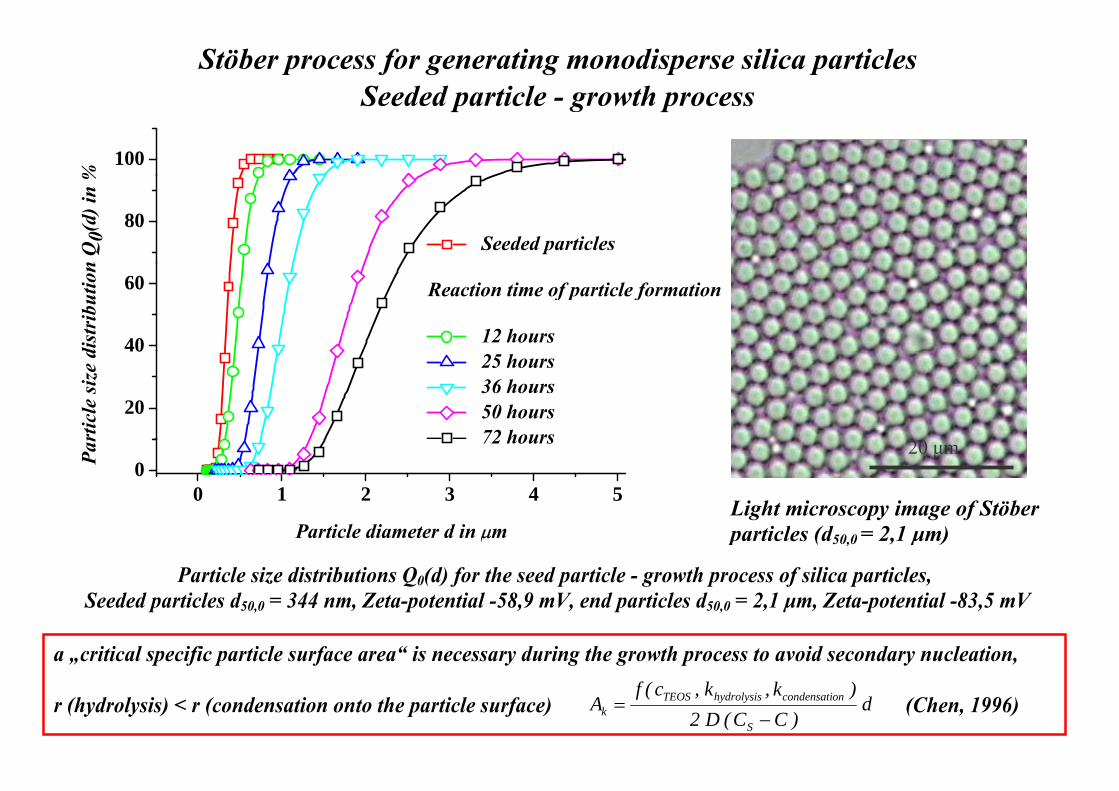
Stöber process for generating monodisperse silica particles S d d i l h
100
%Seeded particle - growth process
80
n Q
0(d)
in %
Seeded particles
40
60
dist
ribu
tion
Reaction time of particle formation
12 hours
20
40
rtic
le si
ze d 25 hours
36 hours 50 hours
72 hours
0 1 2 3 4 50Pa
r
P ti l di t d i
72 hours
20 μm
Light microscopy image of Stöber i l (d 2 1 )Particle diameter d in μm
Particle size distributions Q0(d) for the seed particle - growth process of silica particles, Seeded particles d50,0 = 344 nm, Zeta-potential -58,9 mV, end particles d50,0 = 2,1 μm, Zeta-potential -83,5 mV
particles (d50,0 = 2,1 μm)
a „critical specific particle surface area“ is necessary during the growth process to avoid secondary nucleation,
r (hydrolysis) < r (condensation onto the particle surface) (Chen 1996)d)k,k,c(f
A oncondensatihydrolysisTEOSr (hydrolysis) < r (condensation onto the particle surface) (Chen, 1996) d)CC(D2
AS
y yk −=
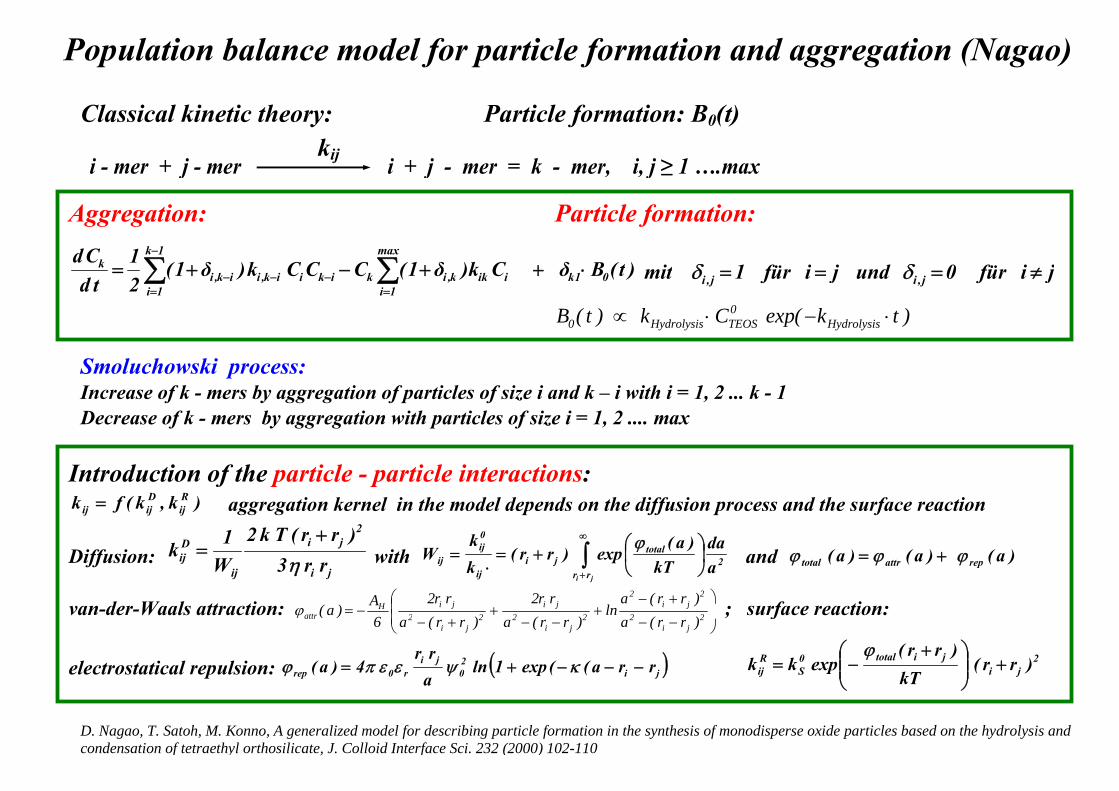
Population balance model for particle formation and aggregation (Nagao)
Classical kinetic theory: Particle formation: B0(t) i - mer + j - mer i + j - mer = k - mer, i, j ≥ 1 ….max
kij
Aggregation: Particle formation:
)(BδCk)δ1(CCCk)δ1(1Cd max1kk ∑∑
−
j j , , j
)t(BδCk)δ1(CCCk)δ1(2td 01k
1iiikk,ik
1iikiik,iik,i
k ⋅++−+= ∑∑==
−−− jifür0undjifür1mit j,ij,i ≠=== δδ
)tk(expCk)t(B Hydrolysis0TEOSHydrolysis0 ⋅−⋅∝
Smoluchowski process: Increase of k - mers by aggregation of particles of size i and k – i with i = 1, 2 ... k - 1 Decrease of k - mers by aggregation with particles of size i = 1, 2 .... max
Introduction of the particle - particle interactions: )k,k(fk R
ijDijij = aggregation kernel in the model depends on the diffusion process and the surface reaction
2
Diffusion: ji
2ji
ij
Dij rr3
)rr(Tk2W1k
η+
= with ∫∞
+
⎟⎠⎞
⎜⎝⎛+=
⋅=
ji rr2
totalji
ij
0ij
ij ada
kT)a(exp)rr(
kk
W ϕ and )a()a()a( repattrtotal ϕϕϕ +=
van-der-Waals attraction: ⎟⎟⎞
⎜⎜⎛ +−
++−= 22
2ji
2
22ji
22jiH
attr
)rr(aln
rr2rr2A)a(ϕ ; surface reaction: van de Waals att action: ⎟⎠
⎜⎝ −−
+−−
++− 2
ji22
ji22
ji2attr )rr(a
ln)rr(a)rr(a6
)a(ϕ ; su face eaction:
electrostatical repulsion: ( )ji20
jir0rep rra((exp1ln
arr
4)a( −−−+= κψεεπϕ 2ji
jitotal0S
Rij )rr(
kT)rr(
expkk +⎟⎟⎠
⎞⎜⎜⎝
⎛ +−=ϕ
D. Nagao, T. Satoh, M. Konno, A generalized model for describing particle formation in the synthesis of monodisperse oxide particles based on the hydrolysis and condensation of tetraethyl orthosilicate, J. Colloid Interface Sci. 232 (2000) 102-110
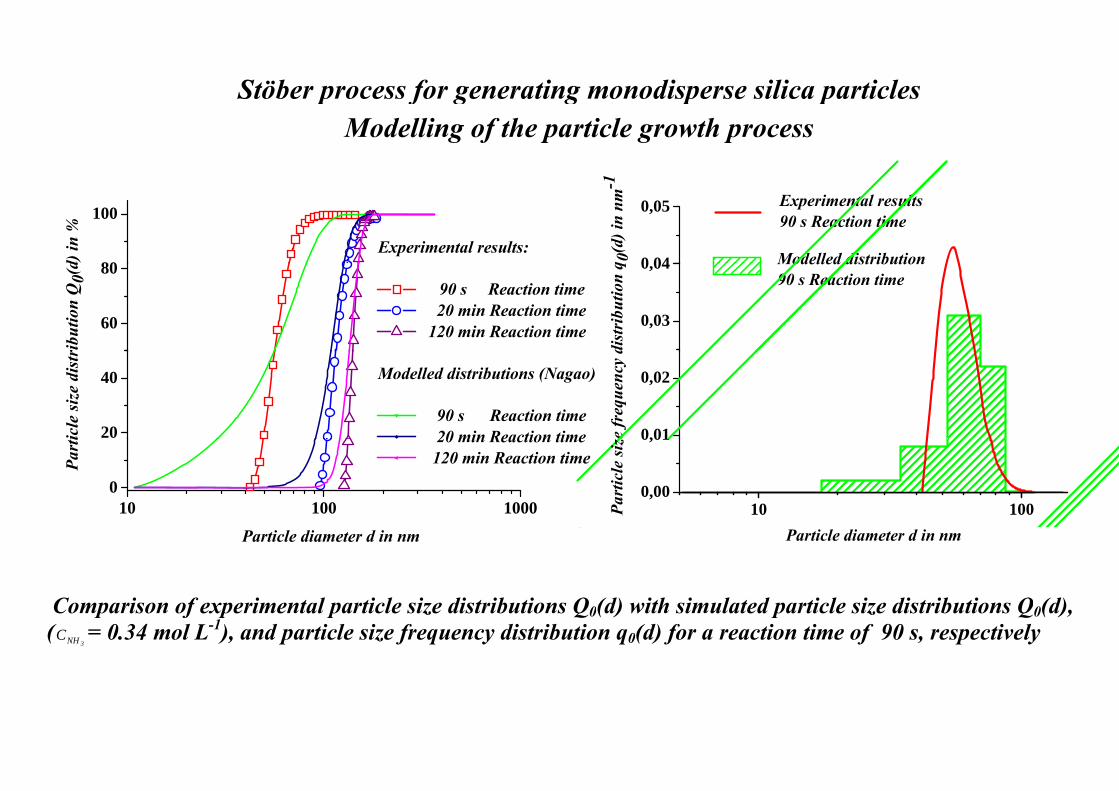
Stöber process for generating monodisperse silica particlesStöber process for generating monodisperse silica particlesModelling of the particle growth process
80
100
d) in
%
Experimental results:0 04
0,05 Experimental results90 s Reaction time
q 0(d
) in
nm-1
Modelled distribution
60
80
ribu
tion
Q0(
d
90 s Reaction time 20 min Reaction time 120 min Reaction time
0,03
0,04
dist
ribu
tion
q Modelled distribution90 s Reaction time
20
40
icle
size
dis
tr
Modelled distributions (Nagao)
90 s Reaction time20 min Reaction time 0,01
0,02
ze fr
eque
ncy
d
10 100 10000
Part
i 20 min Reaction time 120 min Reaction time
10 1000,00
0,01
Part
icle
siz
Particle diameter d in nm
Comparison of experimental particle size distributions Q0(d) with simulated particle size distributions Q0(d),
Particle diameter d in nm
p f p p z Q0( ) p z Q0( ),(
3NHC = 0.34 mol L-1), and particle size frequency distribution q0(d) for a reaction time of 90 s, respectively
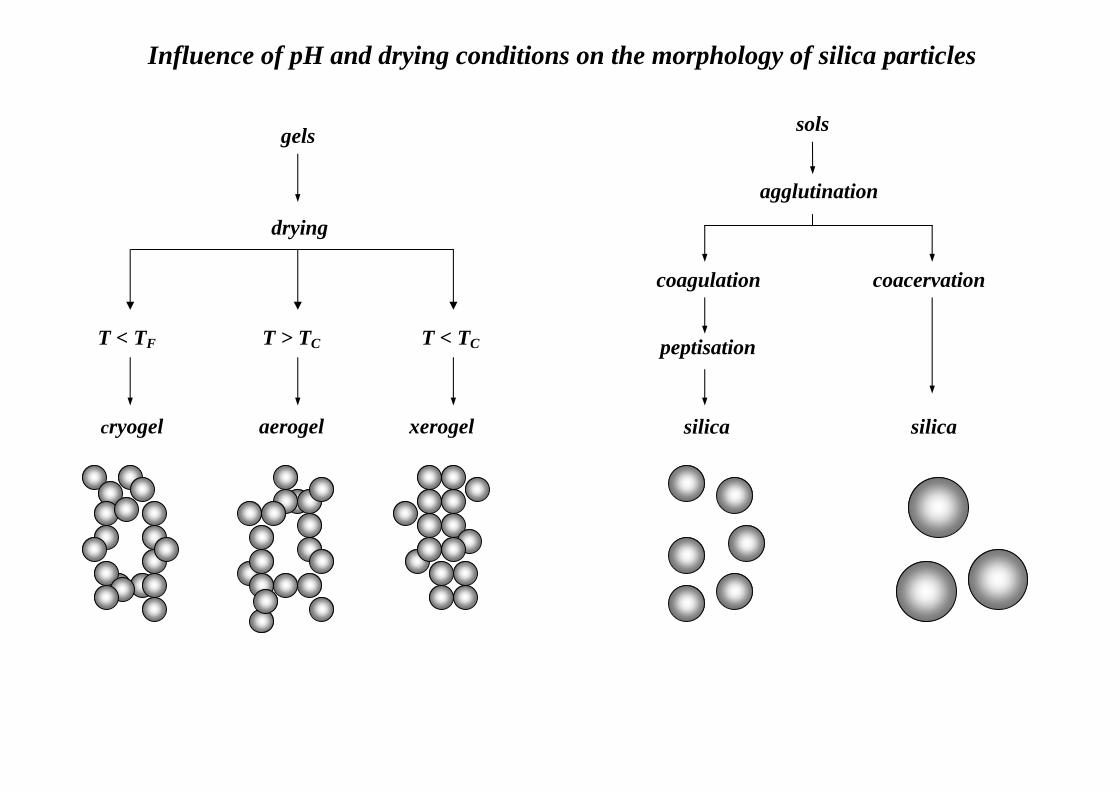
gels drying T < TF T > TC T < TC cryogel aerogel xerogel
Influence of pH and drying conditions on the morphology of silica particles
sols agglutination coagulation coacervation peptisation
silica silica
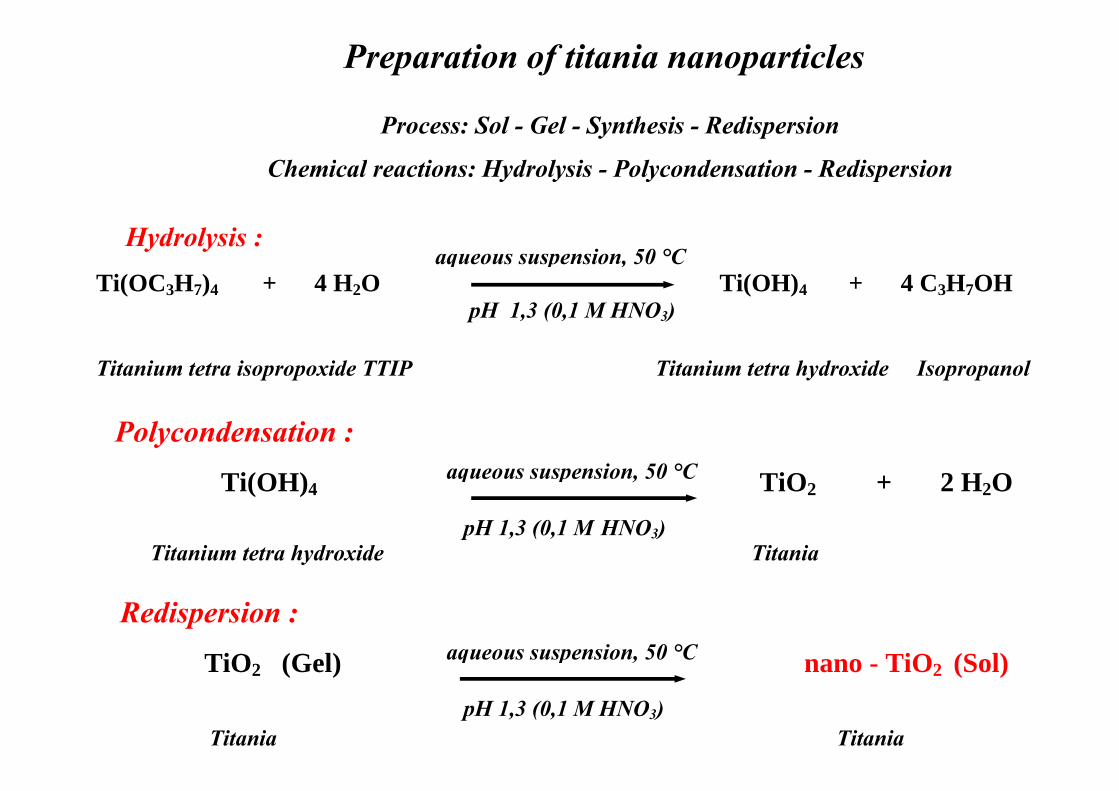
Preparation of titania nanoparticles
Process: Sol - Gel - Synthesis - Redispersion
Chemical reactions: Hydrolysis - Polycondensation - RedispersionChemical reactions: Hydrolysis Polycondensation Redispersion
Hydrolysis :
aqueous suspension, 50 °C
Ti(OC3H7)4 + 4 H2O Ti(OH)4 + 4 C3H7OH
pH 1,3 (0,1 M HNO3)
aqueous suspension, 50 C
Titanium tetra isopropoxide TTIP Titanium tetra hydroxide Isopropanol
Polycondensation :
Polycondensation :
Ti(OH)4 TiO2 + 2 H2O pH 1 3 (0 1 M HNO )
aqueous suspension, 50 °C
Titanium tetra hydroxide Titania
Redispersion :
pH 1,3 (0,1 M HNO3)
Redispersion :
TiO2 (Gel) nano - TiO2 (Sol) H 1 3 (0 1 M HNO )
aqueous suspension, 50 °C
Titania Titania pH 1,3 (0,1 M HNO3)
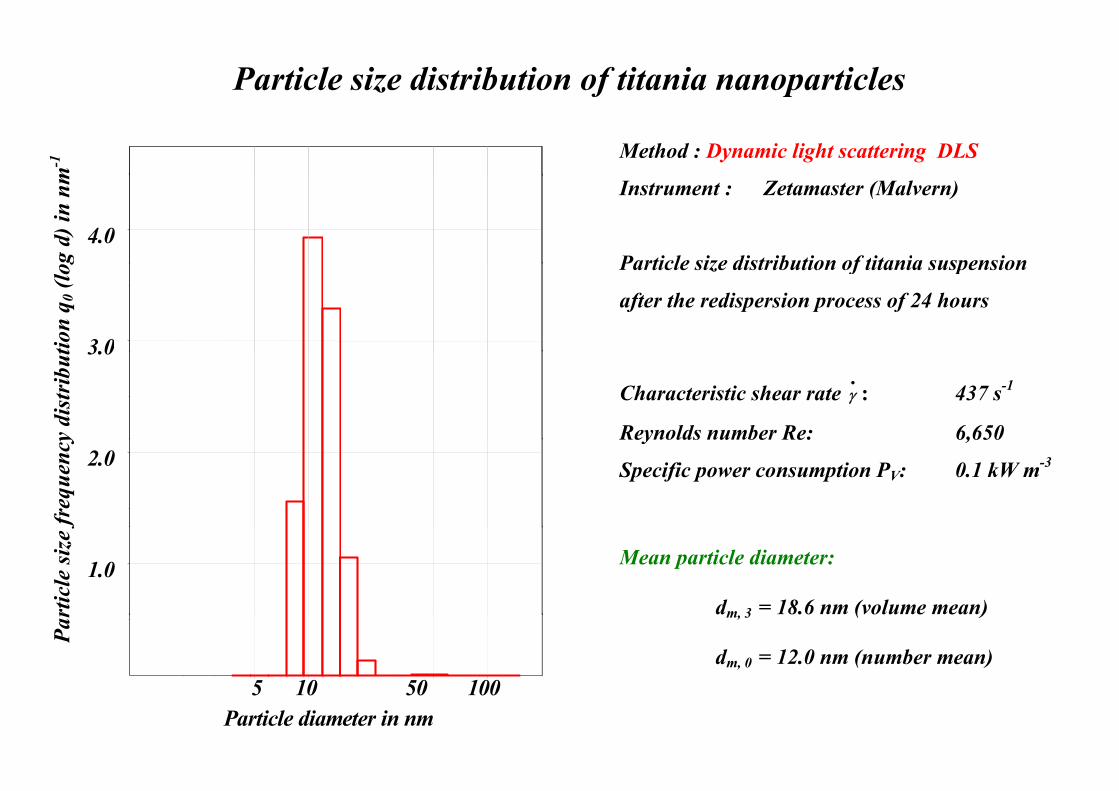
Particle size distribution of titania nanoparticlesParticle size distribution of titania nanoparticles
Method : Dynamic light scattering DLS
m-1
Instrument : Zetamaster (Malvern)
Particle size distribution of titania suspension4.0
g d)
in n
m
Particle size distribution of titania suspension
after the redispersion process of 24 hours
3.0tion
q 0 (l
og
Characteristic shear rate •
γ : 437 s-1
Reynolds number Re: 6,650
3.0
y di
stri
but
Reynolds number Re: 6,650
Specific power consumption PV: 0.1 kW m-3
2.0
freq
uenc
y
Mean particle diameter:
dm 3 = 18.6 nm (volume mean)
1.0
rtic
le si
ze f
m, 3 ( )
dm, 0 = 12.0 nm (number mean) 5 10 50 100
Par
Particle diameter in nm
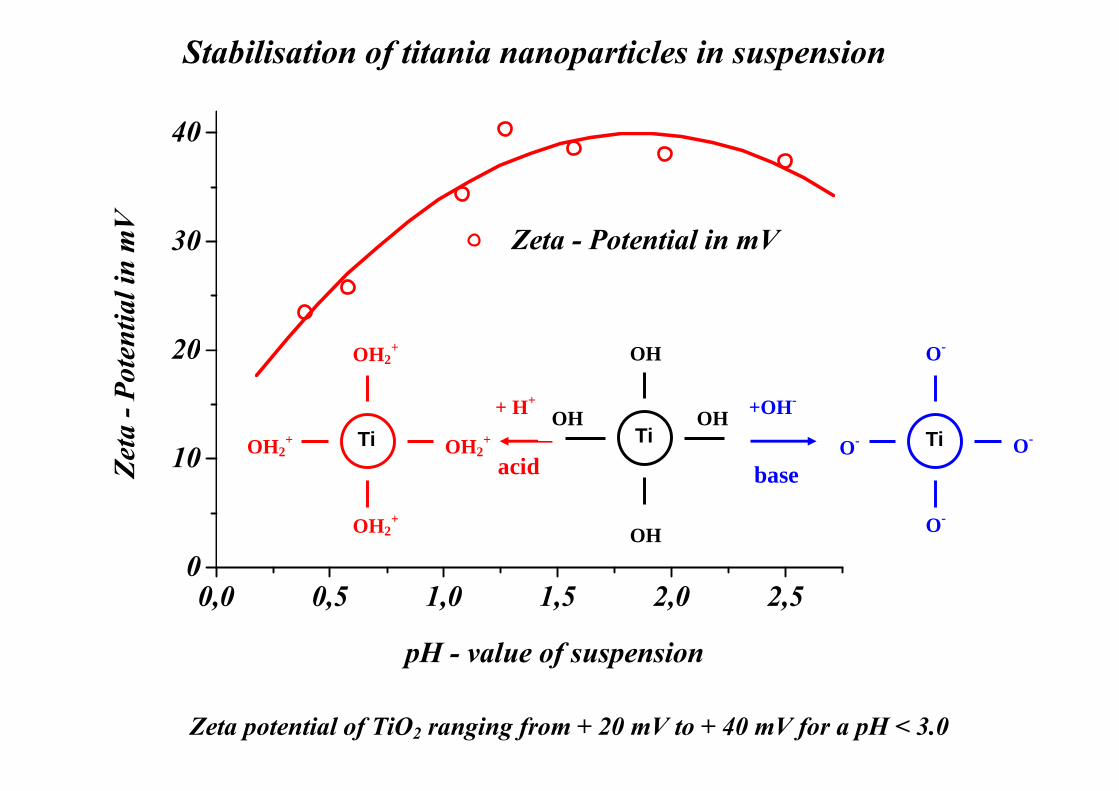
Stabilisation of titania nanoparticles in suspension
40
30 Zeta - Potential in mV
n m
V
20entia
l in
O-OH + OH20
ta -
Pote
++ Ti O
O
+ H+
TiOH OH +OH-
OH2 OH
Ti10Ze
t
OH2+OH2
+ Ti O-
O-
Ti
base
OH2+
O- Tiacid
0,0 0,5 1,0 1,5 2,0 2,50
OOHOH2
pH - value of suspension
Zeta potential of TiO2 ranging from + 20 mV to + 40 mV for a pH < 3.0
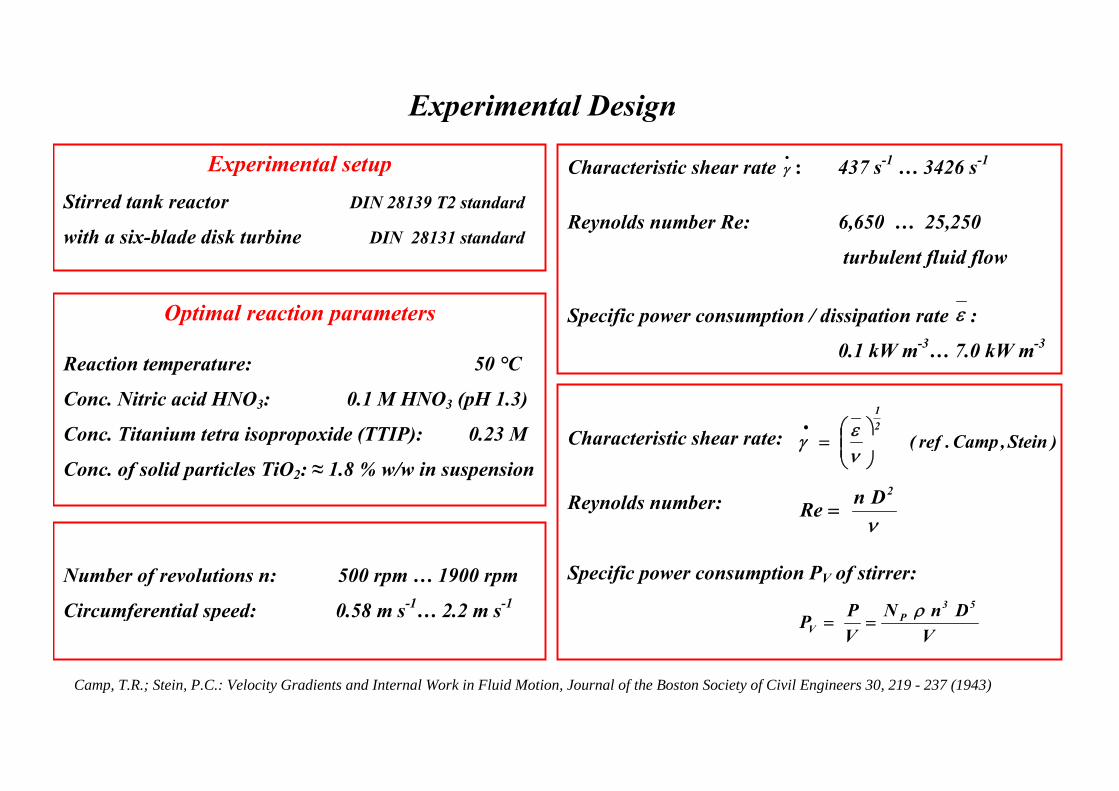
Experimental Design
Characteristic shear rate•
γ : 437 s-1 … 3426 s-1 Experimental setup
γ
Reynolds number Re: 6,650 … 25,250
turbulent fluid flow
p pStirred tank reactor DIN 28139 T2 standard
with a six-blade disk turbine DIN 28131 standard
turbulent fluid flow
Specific power consumption / dissipation rate ε :
0 1 kW m-3 7 0 kW m-3
Optimal reaction parameters
0.1 kW m … 7.0 kW m Reaction temperature: 50 °C
Conc. Nitric acid HNO3: 0.1 M HNO3 (pH 1.3)
Conc. Titanium tetra isopropoxide (TTIP): 0.23 M
Characteristic shear rate: )SteinCampref(
21
⎟⎟⎞
⎜⎜⎛• εγ
Conc. Titanium tetra isopropoxide (TTIP): 0.23 M
Conc. of solid particles TiO2: ≈ 1.8 % w/w in suspension Characteristic shear rate: Reynolds number:
)Stein,Camp.ref(⎟⎟⎠
⎜⎜⎝
=ν
γ
ν
2DnRe =
Number of revolutions n: 500 rpm … 1900 rpm
Circumferential speed: 0.58 m s-1… 2.2 m s-1
Specific power consumption PV of stirrer:
ν
DnNP 53P ρCircumferential speed: 0.58 m s … 2.2 m s
VDnN
VPP P
Vρ
==
Camp, T.R.; Stein, P.C.: Velocity Gradients and Internal Work in Fluid Motion, Journal of the Boston Society of Civil Engineers 30, 219 - 237 (1943)
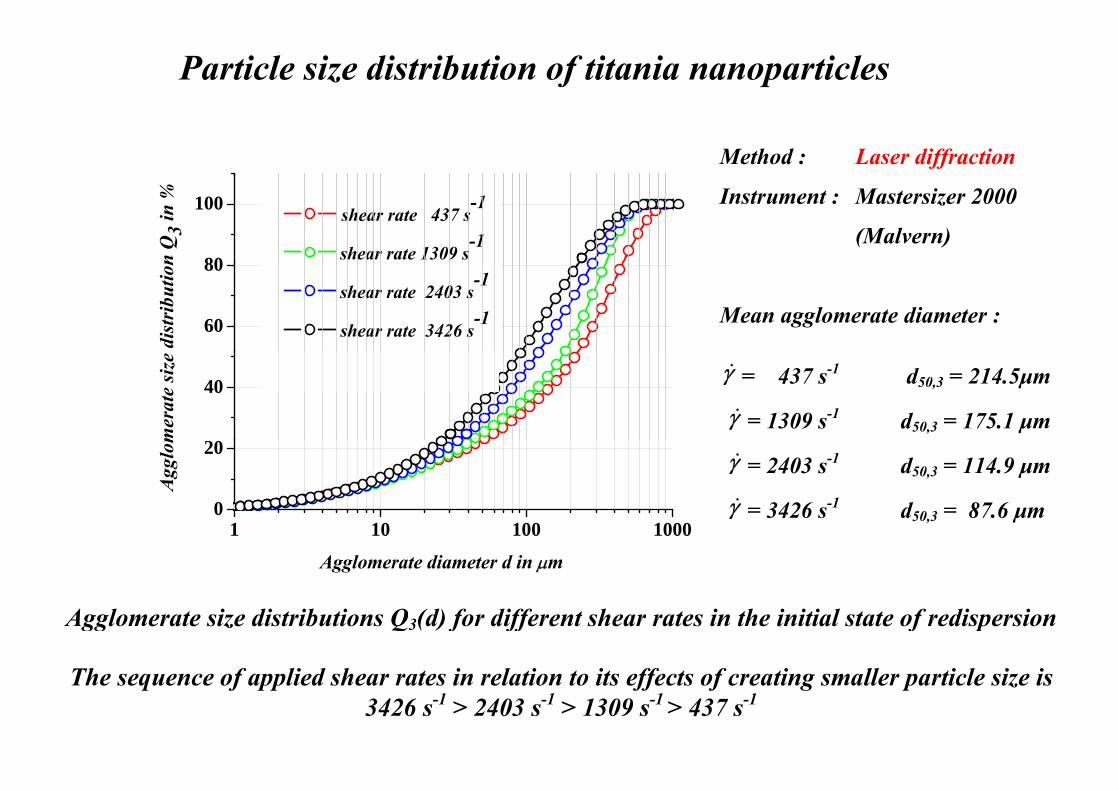
Particle size distribution of titania nanoparticles
Method : Laser diffraction
80
100 shear rate 437 s-1
shear rate 1309 s-1
n Q
3 in % Instrument : Mastersizer 2000
(Malvern)
60
80 shear rate 2403 s
-1
shear rate 3426 s-1
dist
ribu
tion
Mean agglomerate diameter :
40
mer
ate
size
γ& = 437 s-1 d50,3 = 214.5μm
γ& = 1309 s-1 d50,3 = 175.1 μm
1 10 100 10000
20
Agg
lom
γ& = 2403 s-1 d50,3 = 114.9 μm
γ& = 3426 s-1 d50,3 = 87.6 μm 1 10 100 1000
Agglomerate diameter d in μm Agglomerate size distributions Q (d) for different shear rates in the initial state of redispersionAgglomerate size distributions Q3(d) for different shear rates in the initial state of redispersion
The sequence of applied shear rates in relation to its effects of creating smaller particle size is
3426 -1 > 2403 -1 > 1309 -1 > 437 -13426 s 1 > 2403 s 1 > 1309 s 1 > 437 s 1
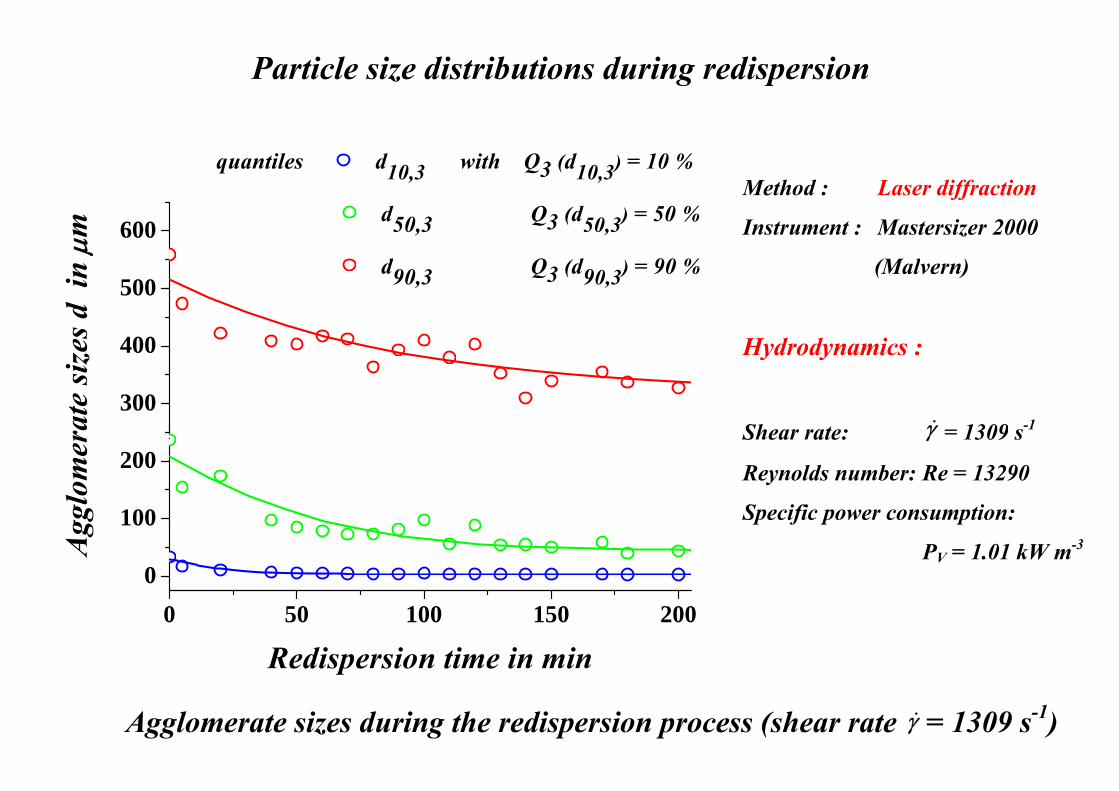
Particle size distributions during redispersion
quantiles d10 3 with Q3 (d10 3) = 10 %
600
μm
10,3 3 10,3
d50,3 Q3 (d50,3) = 50 %
d Q (d ) 90 %
Method : Laser diffraction
Instrument : Mastersizer 2000
(Malvern)
400
500
es d
in d90,3 Q3 (d90,3) = 90 %
(Malvern)
Hydrodynamics :
300
400
ra
te si
ze Hydrodynamics :
Shear rate: γ& = 1309 s-1
100
200
gglo
mer Shear rate: γ 1309 s
Reynolds number: Re = 13290
Specific power consumption:
0 50 100 150 2000
Ag
PV = 1.01 kW m-3
0 50 100 150 200
Redispersion time in min
Agglomerate sizes during the redispersion process (shear rate γ& = 1309 s-1)
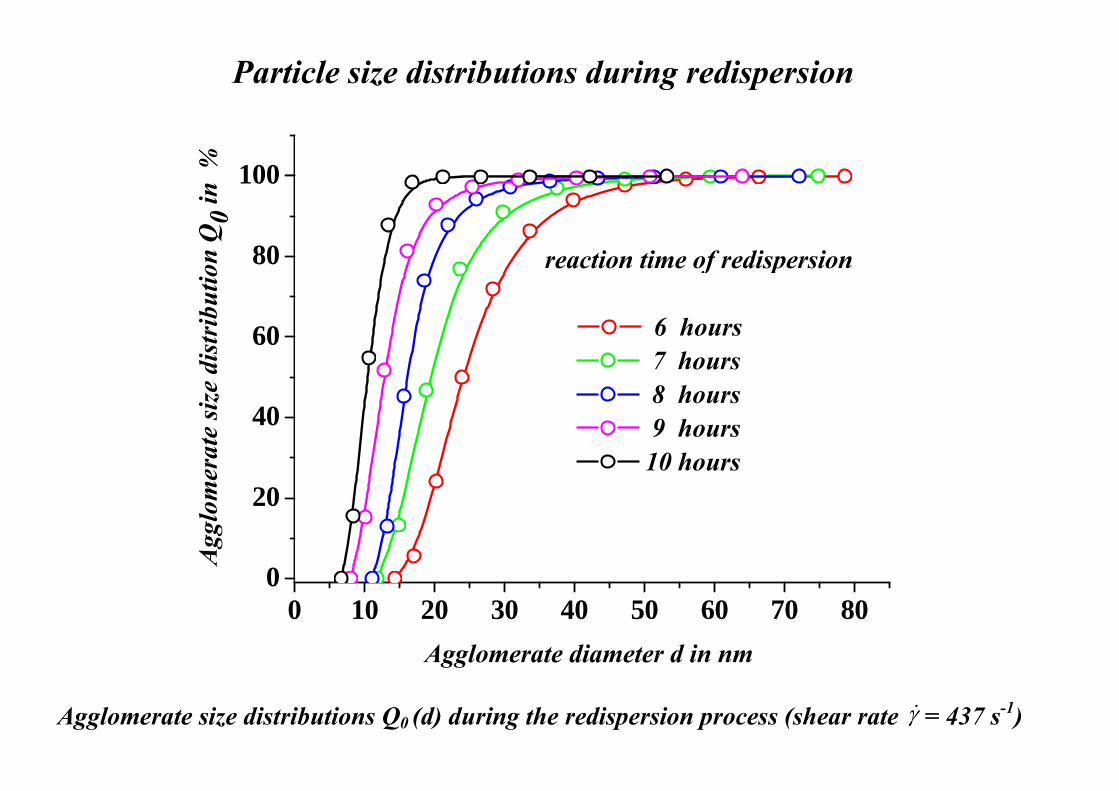
Particle size distributions during redispersiong p
100% 80
100
reaction time of redispersionn Q
0 in
60
80 reaction time of redispersion
6 hourshst
ribu
tion
40
7 hours 8 hours 9 hourste
size
dis
20 10 hours
glom
erat
0 10 20 30 40 50 60 70 800
Agg
0 10 20 30 40 50 60 70 80Agglomerate diameter d in nm
1Agglomerate size distributions Q0 (d) during the redispersion process (shear rate γ& = 437 s-1)
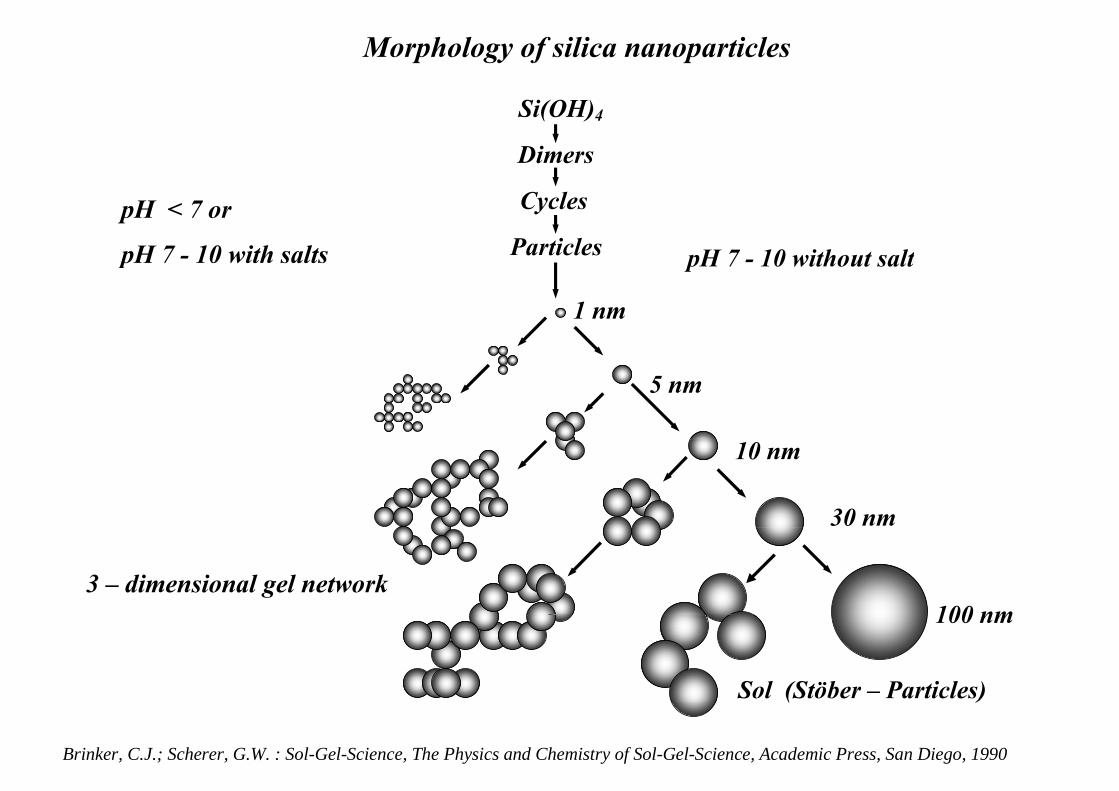
Morphology of silica nanoparticles
Si(OH)4
Dimers
pH < 7 or
pH 7 - 10 with salts
Cycles
Particles pH 7 - 10 without saltp
1 nm
pH 7 10 without salt
5 nm
10 nm
30 nm
3 – dimensional gel network 100 nm100 nm
Sol (Stöber – Particles)
Brinker, C.J.; Scherer, G.W. : Sol-Gel-Science, The Physics and Chemistry of Sol-Gel-Science, Academic Press, San Diego, 1990
( )
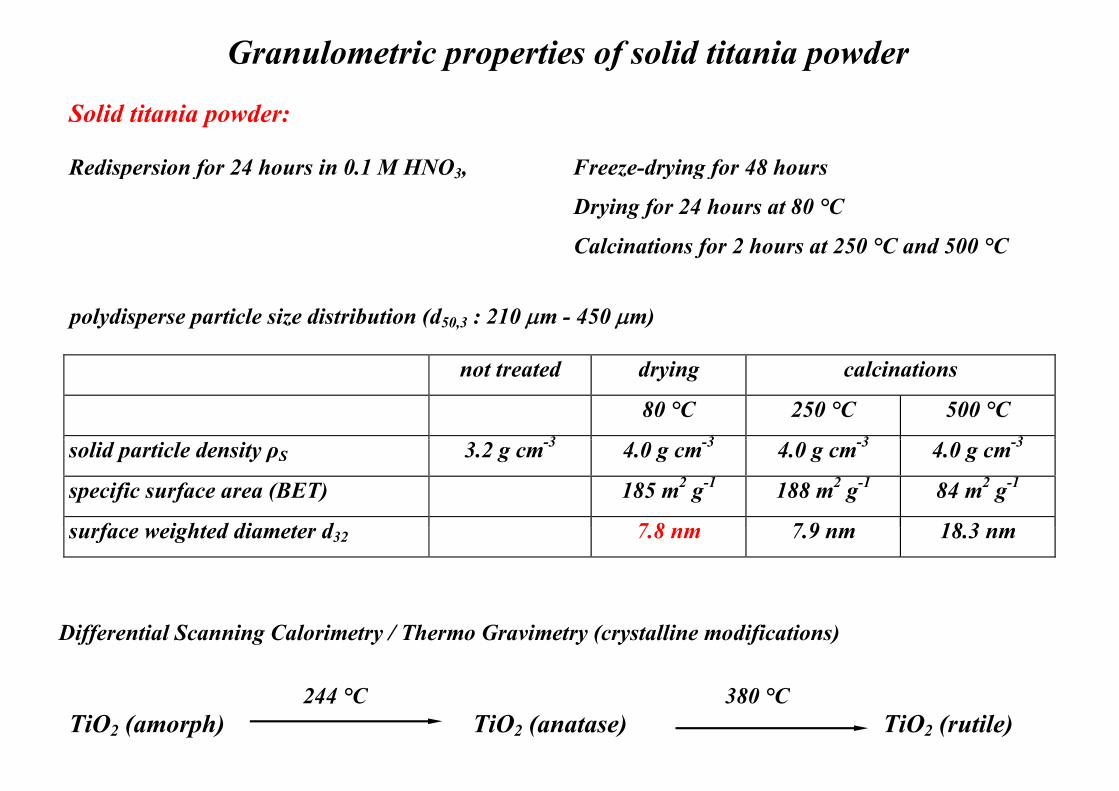
Granulometric properties of solid titania powder
Solid titania powder: Redispersion for 24 hours in 0.1 M HNO3, Freeze-drying for 48 hours
p f 3, z y g f
Drying for 24 hours at 80 °C
Calcinations for 2 hours at 250 °C and 500 °C
polydisperse particle size distribution (d50,3 : 210 μm - 450 μm)
not treated drying calcinations
80 °C 250 °C 500 °C 3 3 3 3solid particle density ρS 3.2 g cm-3 4.0 g cm-3 4.0 g cm-3 4.0 g cm-3
specific surface area (BET) 185 m2 g-1 188 m2 g-1 84 m2 g-1
f i ht d di t d 7 8 7 9 18 3
surface weighted diameter d32 7.8 nm 7.9 nm 18.3 nm
Differential Scanning Calorimetry / Thermo Gravimetry (crystalline modifications)
244 °C 380 °C 244 C 380 CTiO2 (amorph) TiO2 (anatase) TiO2 (rutile)
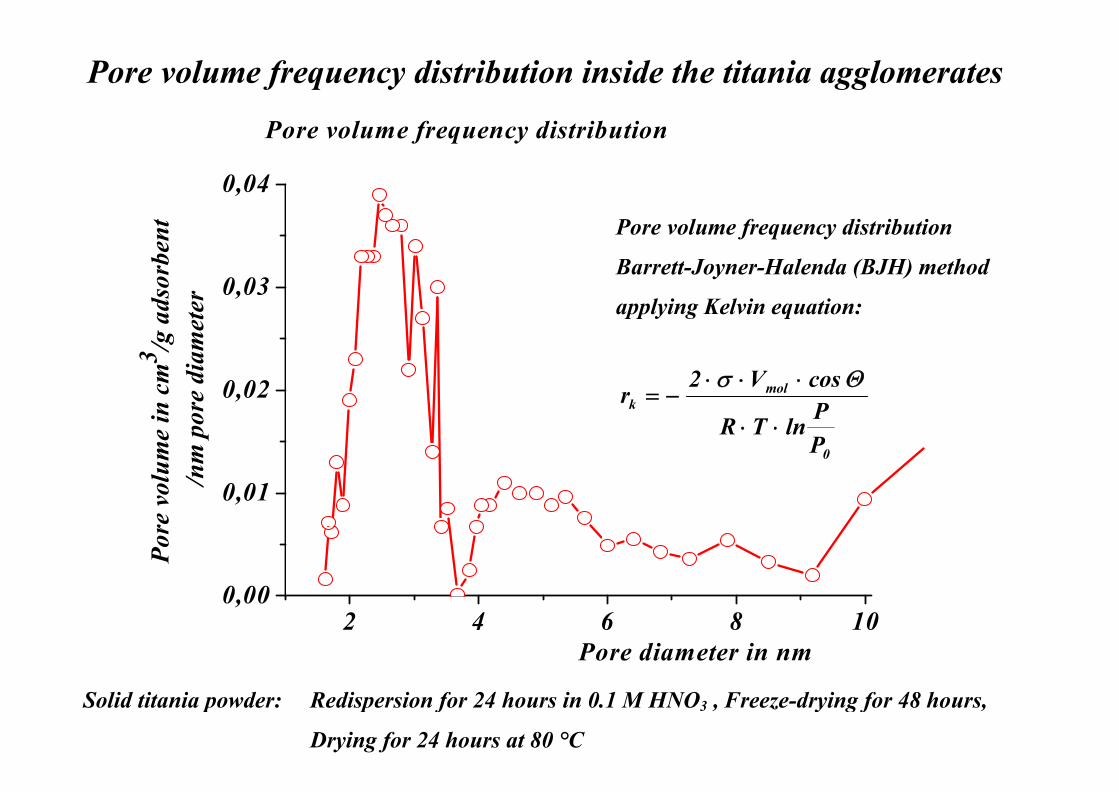
Pore volume frequency distribution inside the titania agglomerates
0 04
Pore volume frequency distribution
f q y gg
0,04be
nt Pore volume frequency distribution
B tt J H l d (BJH) th d0,03
/g a
dsor
bm
eter
Barrett-Joyner-Halenda (BJH) method
applying Kelvin equation:
0,02
e in
cm
3 /po
re d
ia
molk
PPlnTR
cosV2r
⋅⋅
⋅⋅⋅−=
Θσ
0,01
re v
olum
e/n
m p
0P
2 4 6 8 100,00
Por
2 4 6 8 10Pore diameter in nm
Solid titania powder: Redispersion for 24 hours in 0 1 M HNO3 Freeze-drying for 48 hoursSolid titania powder: Redispersion for 24 hours in 0.1 M HNO3 , Freeze-drying for 48 hours,
Drying for 24 hours at 80 °C
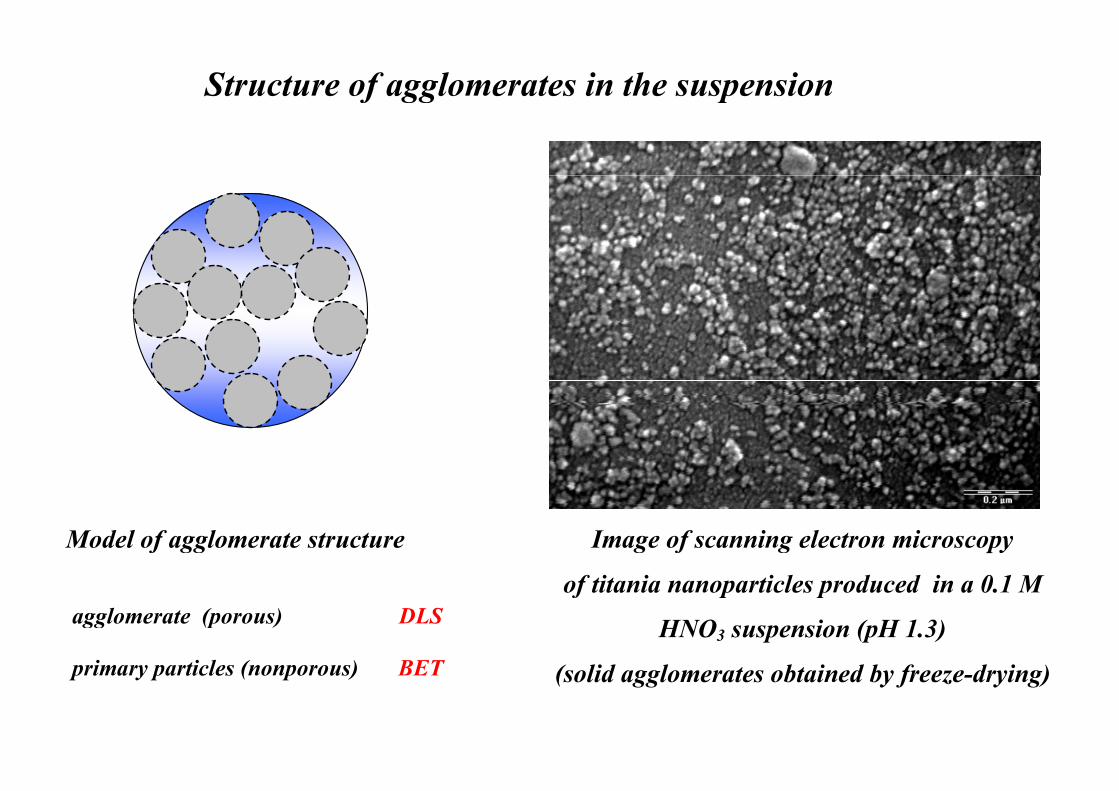
Structure of agglomerates in the suspensionStructure of agglomerates in the suspension
Model of agglomerate structure Image of scanning electron microscopy
of titania nanoparticles produced in a 0.1 M agglomerate (porous) DLS HNO3 suspension (pH 1.3)
(solid agglomerates obtained by freeze-drying)
agglomerate (porous) DLS
primary particles (nonporous) BET
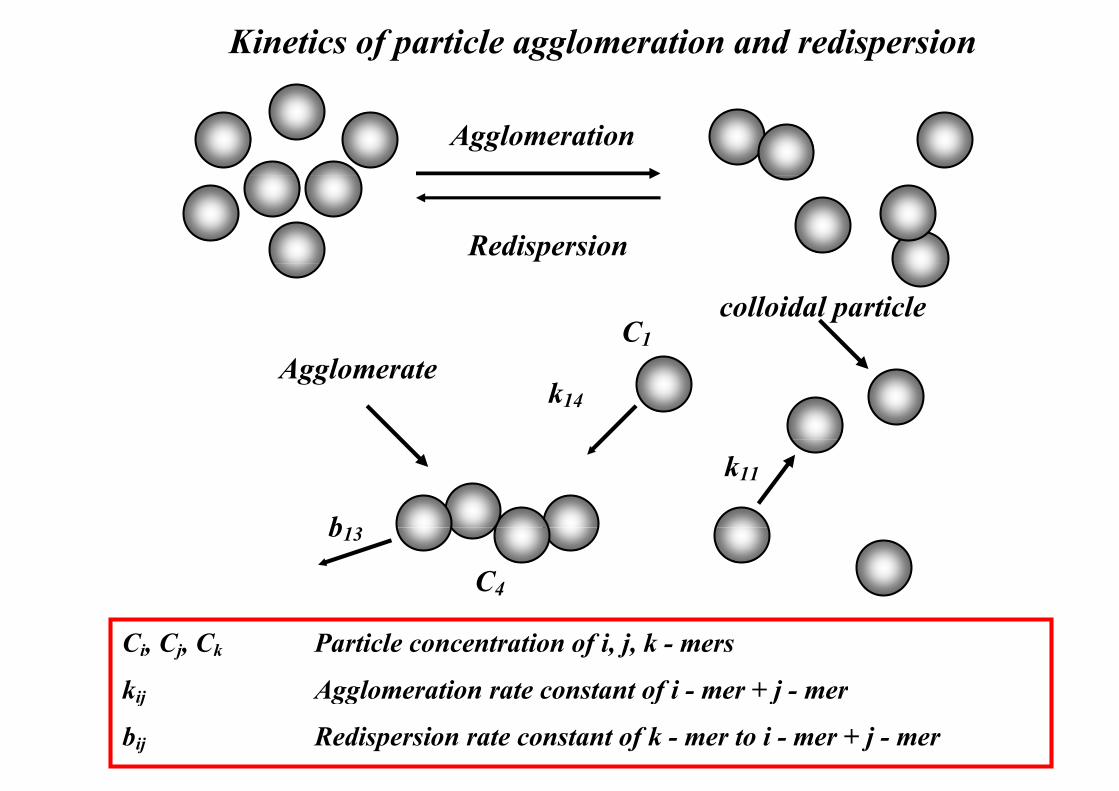
Kinetics of particle agglomeration and redispersion
Agglomeration
Redispersion
colloidal particle C1
Agglomerate k14
k11
b C4
b13
Ci, Cj, Ck Particle concentration of i, j, k - mers
kij Agglomeration rate constant of i - mer + j - mer
ij gg f j
bij Redispersion rate constant of k - mer to i - mer + j - mer
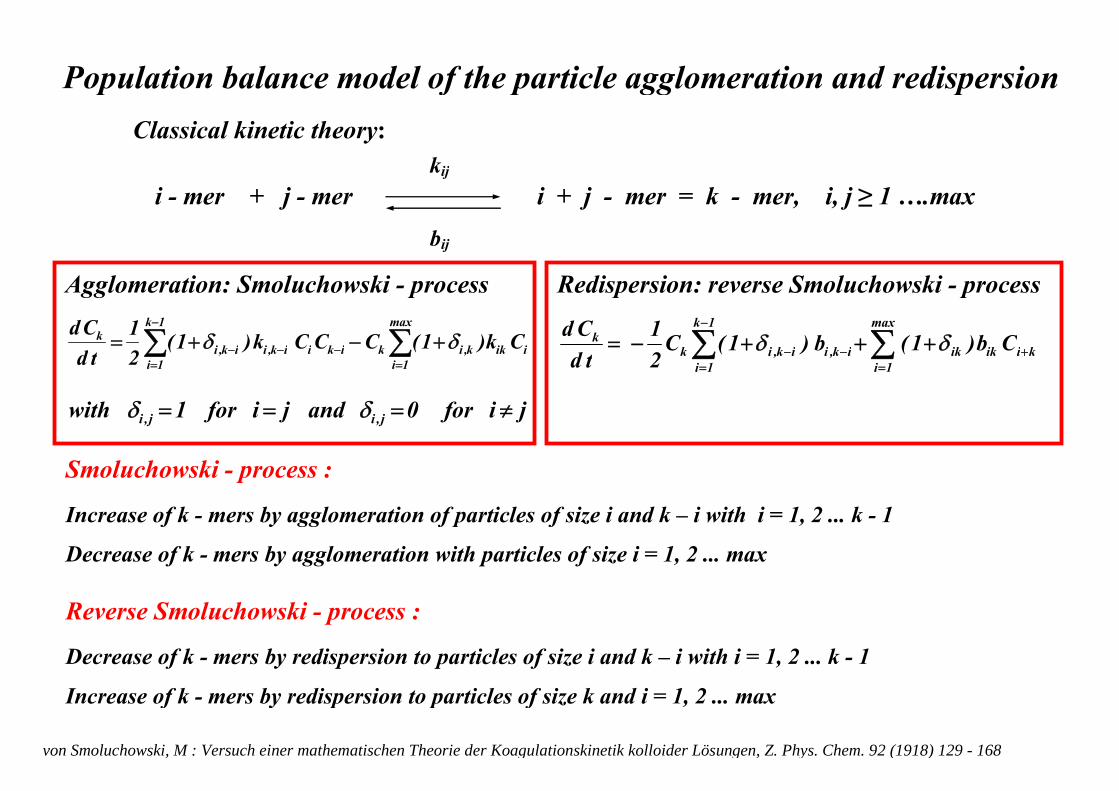
Population balance model of the particle agglomeration and redispersionPopulation balance model of the particle agglomeration and redispersion Classical kinetic theory:
kij
i - mer + j - mer i + j - mer = k - mer, i, j ≥ 1 ….max
ij
bij
Redispersion: reverse Smoluchowski - process
∑∑ +
−
+++−=max
kiikik
1k
ikiikikk Cb)1(b)1(C1Cd δδ
Agglomeration: Smoluchowski - process
∑∑−
−−− +−+=max
iikkik
1k
ikiikiikik Ck)1(CCCk)1(
21
dCd
δδ ∑∑=
+=
−−1i
kiikik1i
ik,iik,ik )()(2td
∑∑== 1i
iikk,ik1i
ikiik,iik,i )()(2td
jifor0andjifor1with j,ij,i ≠=== δδ
Smoluchowski - process :
Increase of k - mers by agglomeration of particles of size i and k – i with i = 1, 2 ... k - 1
Decrease of k - mers by agglomeration with particles of size i = 1, 2 ... max
Reverse Smoluchowski - process :Reverse Smoluchowski - process :
Decrease of k - mers by redispersion to particles of size i and k – i with i = 1, 2 ... k - 1
Increase of k - mers by redispersion to particles of size k and i = 1, 2 ... maxIncrease of k mers by redispersion to particles of size k and i 1, 2 ... max von Smoluchowski, M : Versuch einer mathematischen Theorie der Koagulationskinetik kolloider Lösungen, Z. Phys. Chem. 92 (1918) 129 - 168
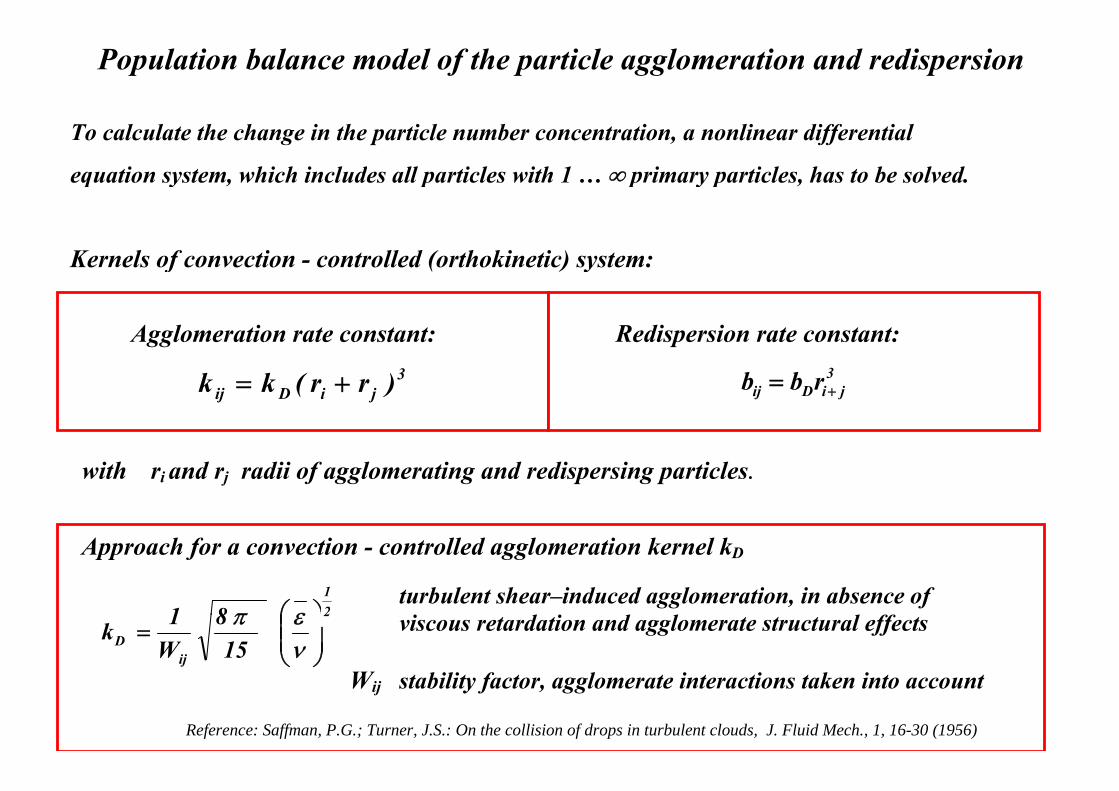
Population balance model of the particle agglomeration and redispersion
To calculate the change in the particle number concentration, a nonlinear differential
equation system which includes all particles with 1 ∞ primary particles has to be solvedequation system, which includes all particles with 1 … ∞ primary particles, has to be solved.
Kernels of convection - controlled (orthokinetic) system:Kernels of convection controlled (orthokinetic) system:
Agglomeration rate constant:
Redispersion rate constant:
3jiDij )rr(kk +=
3jiDij rbb +=
with ri and rj radii of agglomerating and redispersing particles.
Approach for a convection - controlled agglomeration kernel kD
21
81 ⎟⎞
⎜⎛ επ
turbulent shear–induced agglomeration, in absence of i d i d l l ff
2
ijD 15
8W1k ⎟⎟
⎠
⎞⎜⎜⎝
⎛=
νεπ
viscous retardation and agglomerate structural effects
Wij stability factor, agglomerate interactions taken into account
Reference: Saffman, P.G.; Turner, J.S.: On the collision of drops in turbulent clouds, J. Fluid Mech., 1, 16-30 (1956)
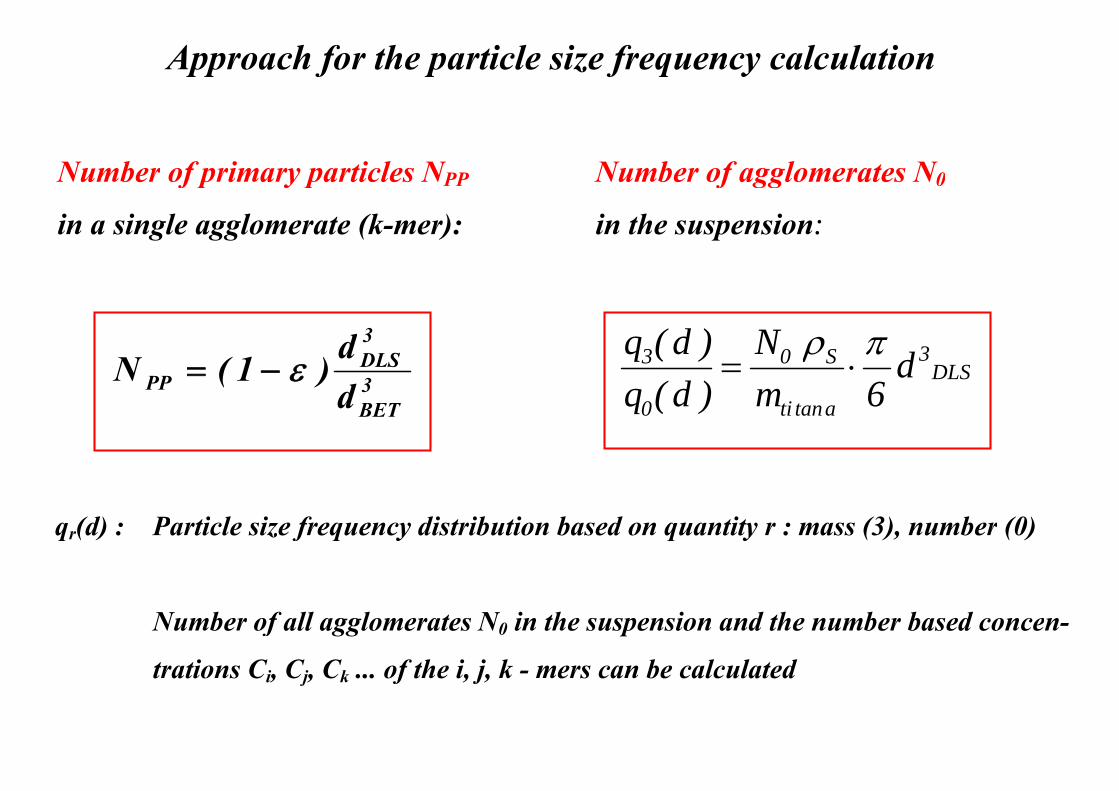
Approach for the particle size frequency calculation Number of primary particles NPP Number of agglomerates N0Number of primary particles NPP Number of agglomerates N0
in a single agglomerate (k-mer): in the suspension:
3d 3S03 N)d(q πρ
3BET
DLSPP d
d)1(N ε−=
DLS3
atanti
S0
0
3 d6m
N)d(q)d(q πρ
⋅=
q (d) : Particle size frequency distribution based on quantity r : mass (3) number (0)qr(d) : Particle size frequency distribution based on quantity r : mass (3), number (0)
N b f ll l t N i th i d th b b dNumber of all agglomerates N0 in the suspension and the number based concen-
trations Ci, Cj, Ck ... of the i, j, k - mers can be calculated
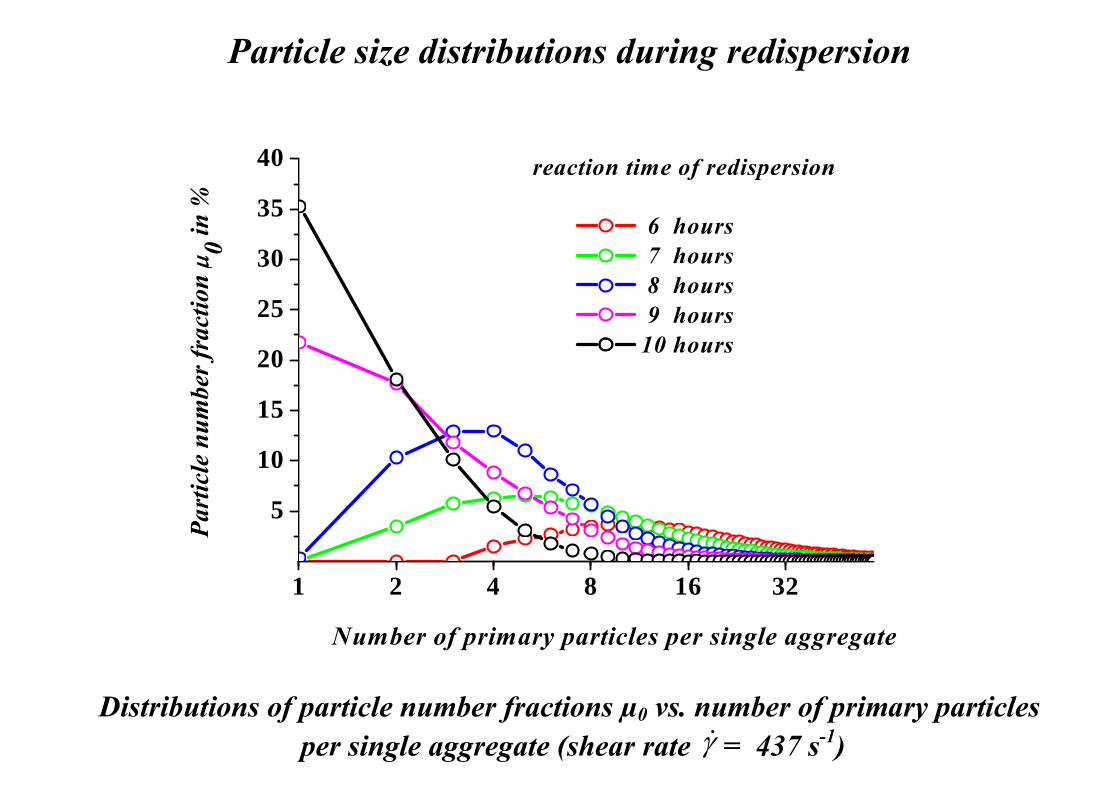
Particle size distributions during redispersion
40 reaction time of redispersion
30
35μ 0 in
%f p
6 hours 7 hours
20
25
30
frac
tion μ 7 ou s 8 hours 9 hours
10 hours
15
20
num
ber f
10 hours
5
10
Part
icle
n
1 2 4 8 16 32
P
Number of primary particles per single aggregate
Distributions of particle number fractions vs number of primary particlesDistributions of particle number fractions µ0 vs. number of primary particles per single aggregate (shear rate γ& = 437 s-1)
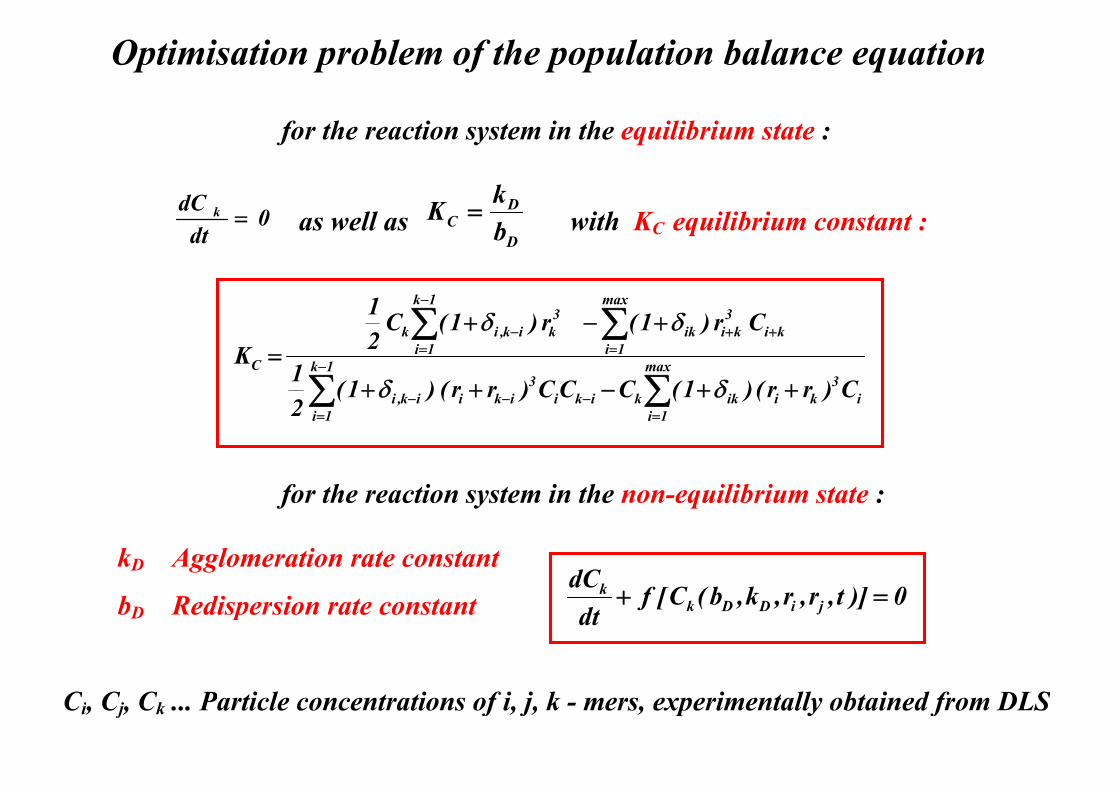
Optimisation problem of the population balance equation
for the reaction system in the equilibrium state :
0dt
dC k = as well as D
DC b
kK = with KC equilibrium constant :
∑∑
=++
−
=− +−+
max
1iki
3kiik
1k
1i
3kik,ik Cr)1(r)1(C
21
Kδδ
∑ ∑−
= =−−−
==
++−++= 1k
1i
max
1ii
3kiikkiki
3ikiik,i
1i1iC
C)rr()1(CCC)rr()1(21
Kδδ
for the reaction system in the non-equilibrium state :
kD Agglomeration rate constant
bD Redispersion rate constant 0)]t,r,r,k,b(C[fdt
dCjiDDk
k =+D p
Ci Cj Ck Particle concentrations of i j k - mers experimentally obtained from DLS
dt
Ci, Cj, Ck ... Particle concentrations of i, j, k - mers, experimentally obtained from DLS
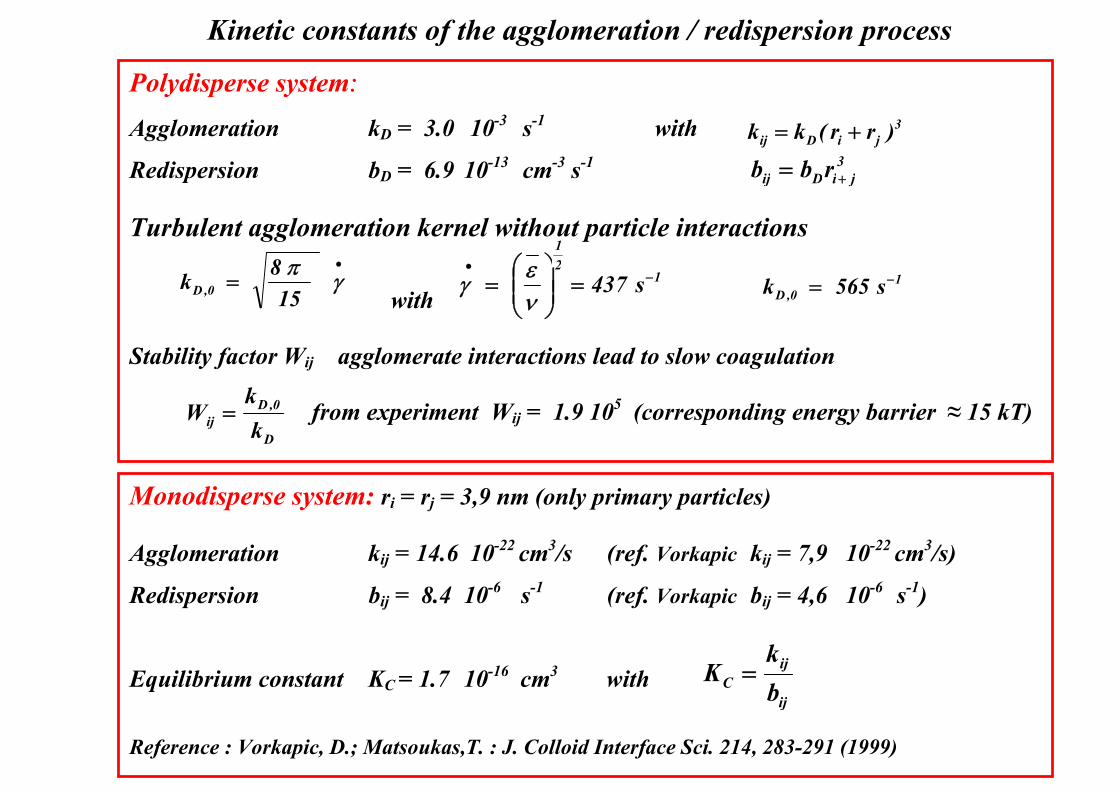
Kinetic constants of the agglomeration / redispersion process Polydisperse system:
Polydisperse system:
Agglomeration kD = 3.0 10-3 s-1 with
Redispersion bD = 6.9 10-13 cm-3 s-1 3jiDij rbb =
3jiDij )rr(kk +=
Redispersion bD 6.9 10 cm s Turbulent agglomeration kernel without particle interactions
•8
jiDij rbb +
21
⎞⎛
with St bilit f t W l t i t ti l d t l l ti
•
= γπ15
8k 0,D 1
2
s437 −•
=⎟⎟⎠
⎞⎜⎜⎝
⎛=
νεγ
10,D s565k −=
Stability factor Wij agglomerate interactions lead to slow coagulation from experiment Wij = 1.9 105 (corresponding energy barrier ≈ 15 kT)
D
0,Dij k
kW =
Monodisperse system: ri = rj = 3,9 nm (only primary particles)
D
Agglomeration kij = 14.6 10-22 cm3/s (ref. Vorkapic kij = 7,9 10-22 cm3/s)
Redispersion bij = 8.4 10-6 s-1 (ref. Vorkapic bij = 4,6 10-6 s-1)
Equilibrium constant KC = 1.7 10-16 cm3 with ij
ijC b
kK =
Reference : Vorkapic, D.; Matsoukas,T. : J. Colloid Interface Sci. 214, 283-291 (1999)
ij
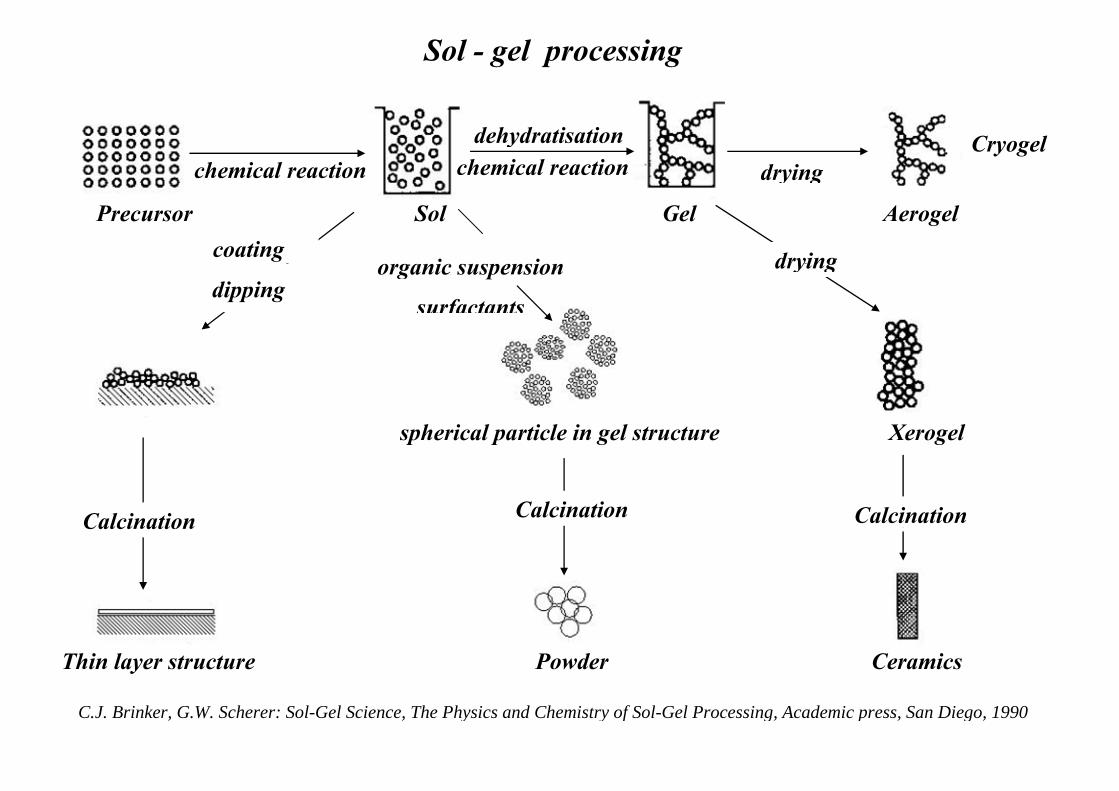
Sol - gel processing
Cryogel chemical reaction
dehydratisation chemical reaction drying
Precursor Sol Gel Aerogel
chemical reaction drying
dryingcoating i i drying
dipping organic suspension
surfactants
spherical particle in gel structure Xerogel spherical particle in gel structure Xerogel
Calcination Calcination Calcination
Calcination
Thin layer structure Powder Ceramics
C.J. Brinker, G.W. Scherer: Sol-Gel Science, The Physics and Chemistry of Sol-Gel Processing, Academic press, San Diego, 1990
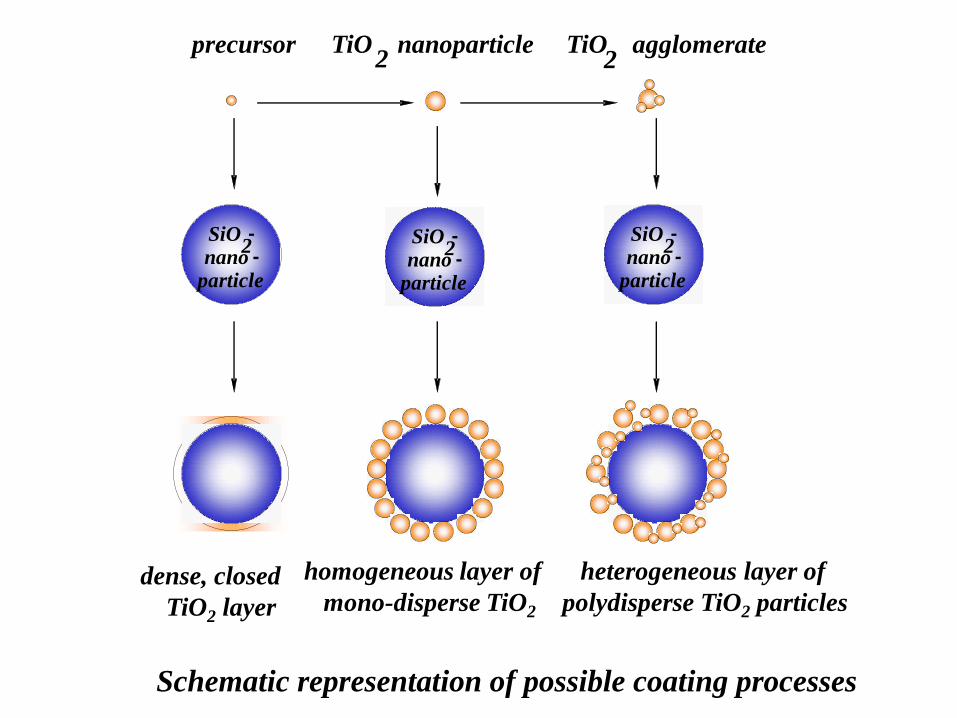
precursor TiO2 nanoparticle
SiO2-nano -particle
dense, closed TiO2 layer
TiO2 agglomerate
SiO2-nano -particle
SiO2-nano -particle
homogeneous layer of heterogeneous layer of mono-disperse TiO2 polydisperse TiO2 particles
Schematic representation of possible coating processes
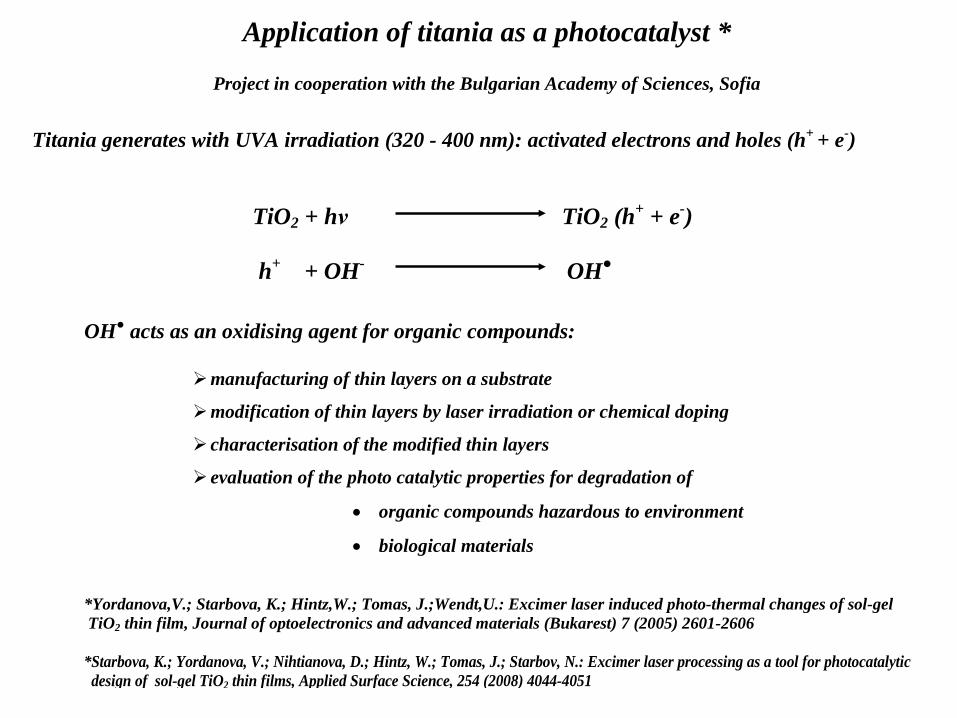
Application of titania as a photocatalyst *
Project in cooperation with the Bulgarian Academy of Sciences, Sofia
Titania generates with UVA irradiation (320 - 400 nm): activated electrons and holes (h+ + e-) TiO2 + hν TiO2 (h+ + e-) h+ + OH- OH●
OH● acts as an oxidising agent for organic compounds:
manufacturing of thin layers on a substrate
modification of thin layers by laser irradiation or chemical doping
characterisation of the modified thin layers
evaluation of the photo catalytic properties for degradation of
• organic compounds hazardous to environment
• biological materials
*Yordanova,V.; Starbova, K.; Hintz,W.; Tomas, J.;Wendt,U.: Excimer laser induced photo-thermal changes of sol-gel TiO2 thin film, Journal of optoelectronics and advanced materials (Bukarest) 7 (2005) 2601-2606 *Starbova, K.; Yordanova, V.; Nihtianova, D.; Hintz, W.; Tomas, J.; Starbov, N.: Excimer laser processing as a tool for photocatalytic design of sol-gel TiO2 thin films, Applied Surface Science, 254 (2008) 4044-4051
2 4 6 8 10 12
-40
-20
0
20
40 silica particles titania particles
Zeta
-pot
entia
l in
mV
pH value
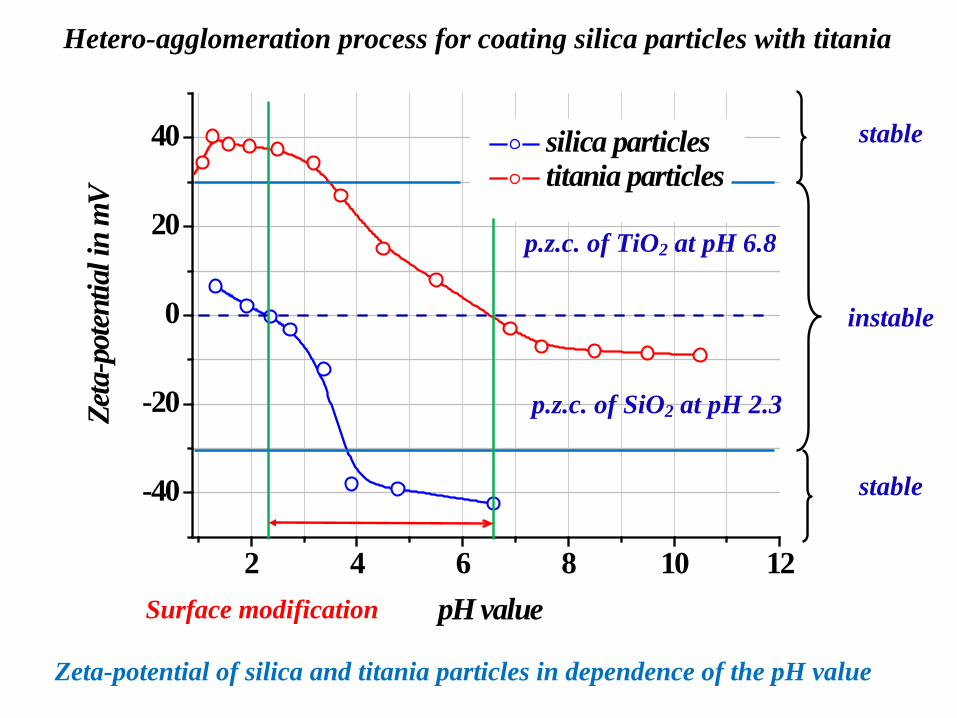
Hetero-agglomeration process for coating silica particles with titania
Zeta-potential of silica and titania particles in dependence of the pH value
Surface modification
p.z.c. of TiO2 at pH 6.8
p.z.c. of SiO2 at pH 2.3
instable
stable
stable
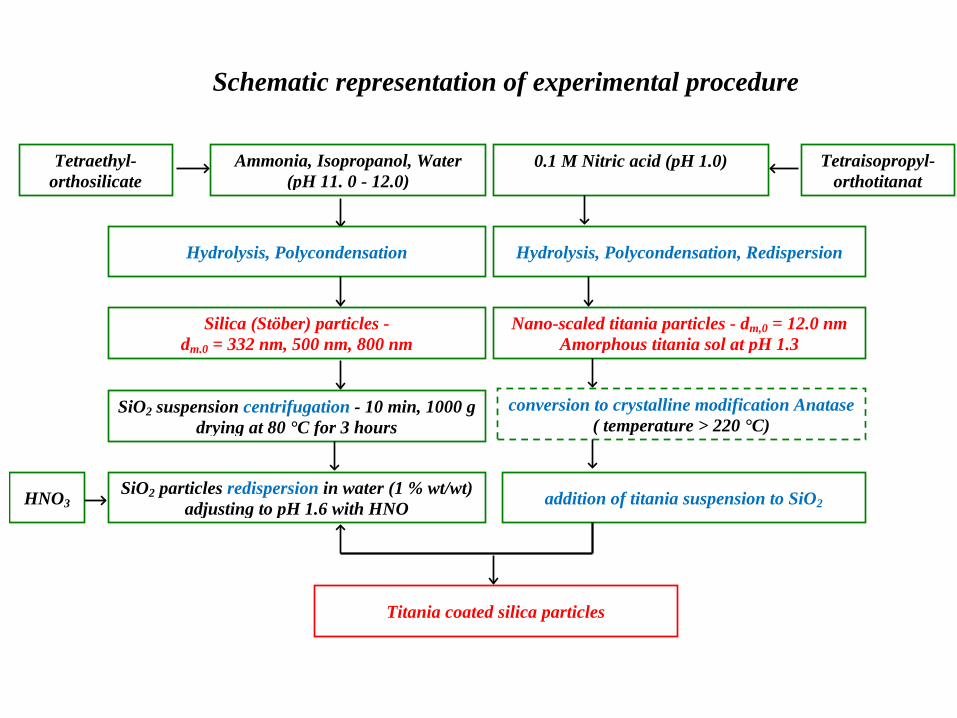
Schematic representation of experimental procedure
0.1 M Nitric acid (pH 1.0)
Hydrolysis, Polycondensation, Redispersion
Nano-scaled titania particles - dm,0 = 12.0 nm Amorphous titania sol at pH 1.3
conversion to crystalline modification Anatase ( temperature > 220 °C)
addition of titania suspension to SiO2
Tetraisopropyl-orthotitanat
SiO2 suspension centrifugation - 10 min, 1000 g drying at 80 °C for 3 hours
Ammonia, Isopropanol, Water (pH 11. 0 - 12.0)
Tetraethyl-orthosilicate
Hydrolysis, Polycondensation
Silica (Stöber) particles - dm,0 = 332 nm, 500 nm, 800 nm
SiO2 particles redispersion in water (1 % wt/wt) adjusting to pH 1.6 with HNO
HNO3
Titania coated silica particles

Zeta-potential of coated and non-coated silica particles
Zeta-potential of coated and non-coated 332 nm silica particles - coating with 2 % wt/wt, 10 % wt/wt, 20 % wt/wt TiO2 on SiO2
1 2 3 4 5 6 7
-40
-20
0
20
40 silica particles TiO2/SiO2 2 wt% TiO2/SiO2 10 wt% TiO2/SiO2 20 wt%
Zeta
-pot
entia
l in
mV
pH value
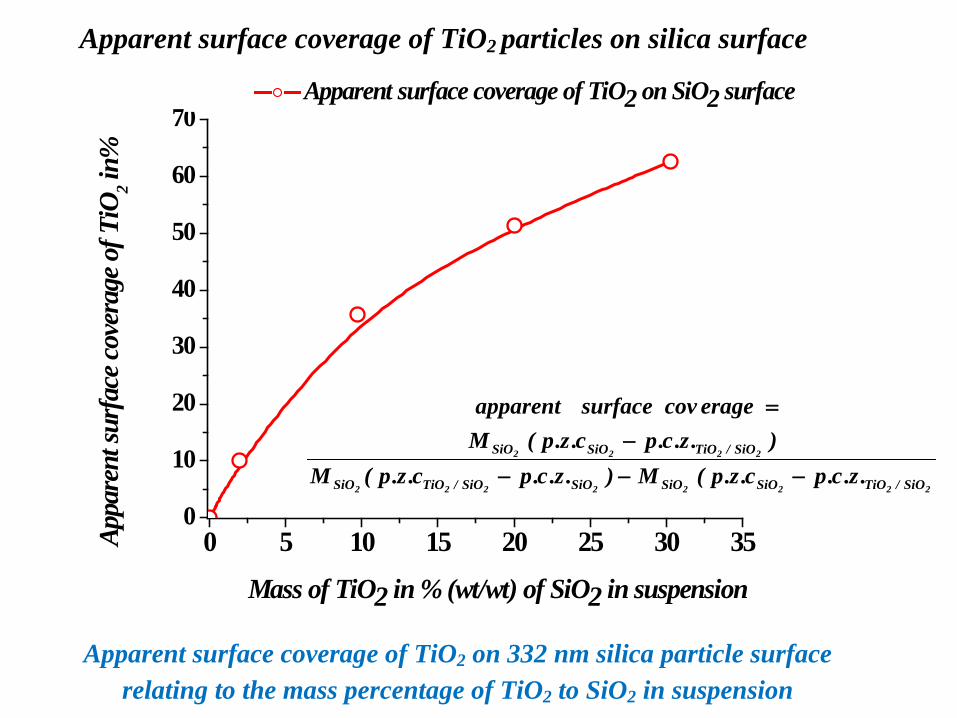
22222222
2222
SiO/TiOSiOSiOSiOSiO/TiOSiO
SiO/TiOSiOSiO
.z.c.pc.z.p(M).z.c.pc.z.p(M).z.c.pc.z.p(M
eragecovsurfaceapparent
−−−
−=
Apparent surface coverage of TiO2 particles on silica surface
Apparent surface coverage of TiO2 on 332 nm silica particle surface relating to the mass percentage of TiO2 to SiO2 in suspension
0 5 10 15 20 25 30 350
10
20
30
40
50
60
70Ap
pare
nt su
rfac
e cov
erag
e of T
iO2 i
n%
Mass of TiO2 in % (wt/wt) of SiO2 in suspension
Apparent surface coverage of TiO2 on SiO2 surface
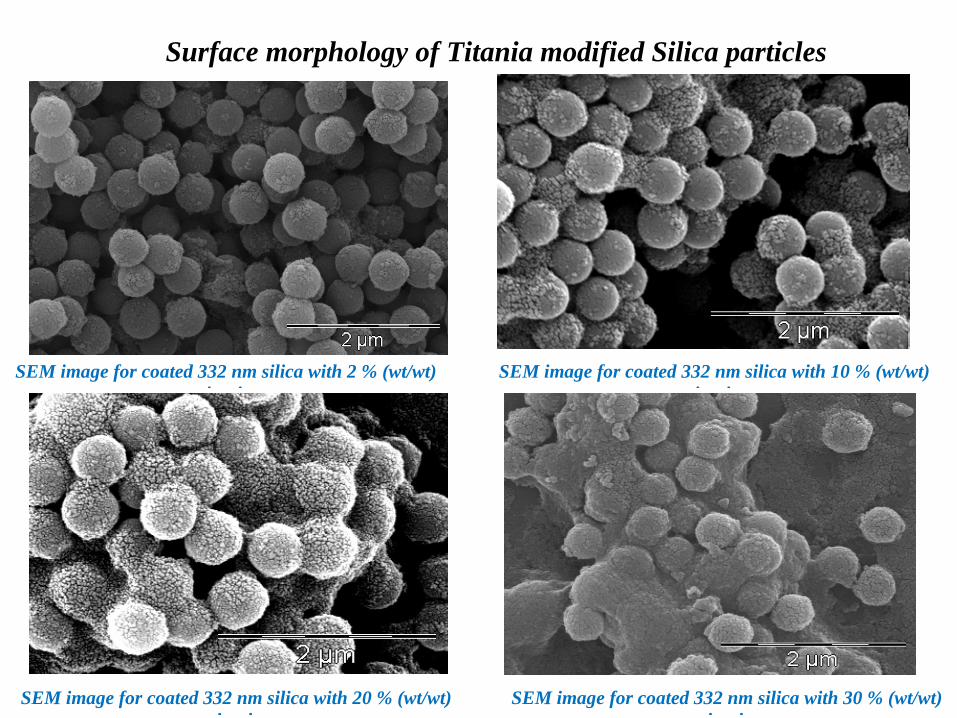
Surface morphology of Titania modified Silica particles
SEM image for coated 332 nm silica with 2 % (wt/wt) i i
SEM image for coated 332 nm silica with 10 % (wt/wt) i i
SEM image for coated 332 nm silica with 30 % (wt/wt) i i
SEM image for coated 332 nm silica with 20 % (wt/wt) i i