Embed Size (px)
Citation preview

1
ENHANCED CHIROPRACTIC COVERAGE UNDER OHIP AS A MEANS
OF REDUCING HEALTH CARE COSTS, ATTAINING BETTER HEALTH
OUTCOMES AND ACHIEVING EQUITABLE ACCESS TO
HEALTH SERVICES*
Pran Manga, Ph.D.Professor
Health EconomicsUniversity of Ottawa
and
Professor Doug AngusDirector
Masters Program in Health AdministrationUniversity of Ottawa
February, 1998
* The opinions and analysis in this report are the responsibility of the authors alone.

TABLE OF CONTENTS
Item Page
Executive Summary............................................................................................................. 3-4Introduction ............................................................................................................................5Choosing between Alternative Providers of Care .....................................................................5Costing an Episode of Illness, Disease or Injury.......................................................................9Patient Flows for NMS Disorders..........................................................................................12Neuromusculoskeletal Disorders ...........................................................................................15Utilization of Chiropractic Services, and the Impact of User Fees ..........................................16Comparative Cost of Chiropractors & Medical Doctors under Various Health Insurance Systems................................................................................................................19
USA Studies..............................................................................................................19Foreign Studies..........................................................................................................40
The Economics of Enhanced Coverage of Chiropractic in Ontario .........................................43The Potential Economic Savings from Enhanced Chiropractic Coverage................................49Conclusion ............................................................................................................................58References ............................................................................................................................62Table 1..................................................................................................................................21Table 2..................................................................................................................................22Table 3..................................................................................................................................23Table 4..................................................................................................................................24Table 5..................................................................................................................................25Table 6..................................................................................................................................26Table 7..................................................................................................................................29Table 8..................................................................................................................................30Table 9..................................................................................................................................32Table 10................................................................................................................................34Table 11................................................................................................................................35Table 12................................................................................................................................37Table 13................................................................................................................................40Table 14................................................................................................................................42Table 15................................................................................................................................46Table 16................................................................................................................................50Table 17................................................................................................................................50Table 18................................................................................................................................51Table 19................................................................................................................................52Table 20................................................................................................................................56Table 21................................................................................................................................57Table 22................................................................................................................................57Figure 1 ..................................................................................................................................6Figure 2 ................................................................................................................................11Figure 3 ................................................................................................................................14Figure 4 ................................................................................................................................54
3
EXECUTIVE SUMMARY
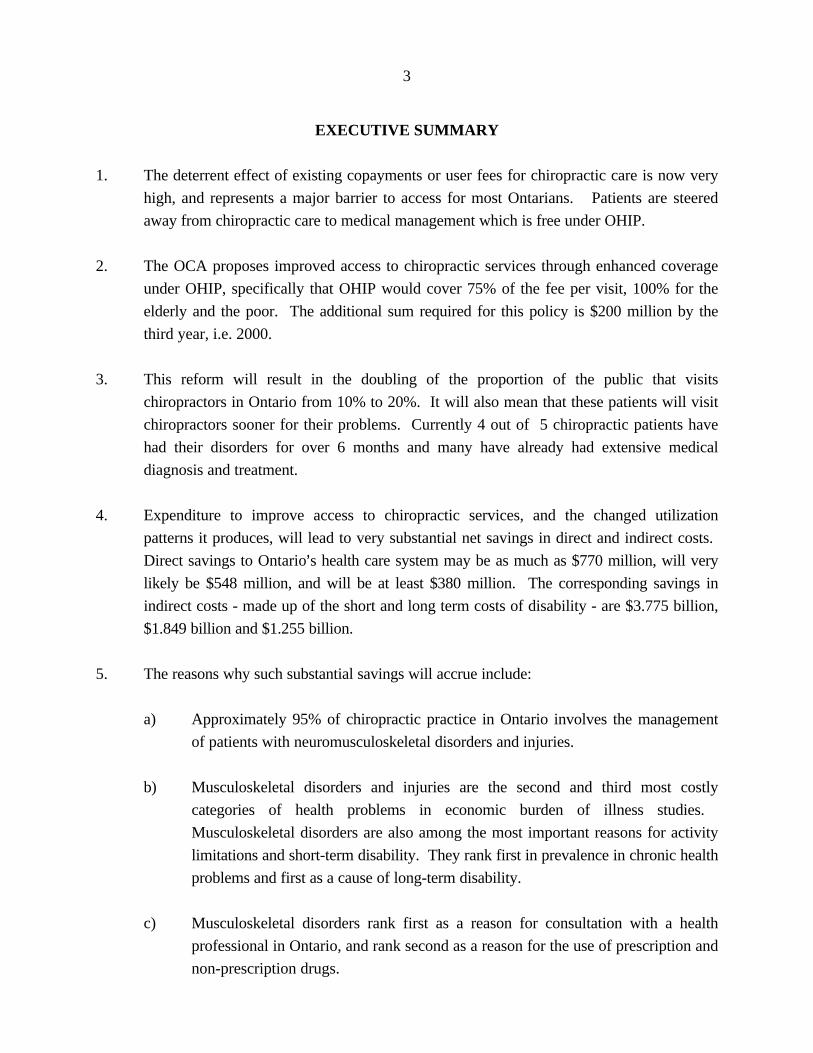
1. The deterrent effect of existing copayments or user fees for chiropractic care is now very
high, and represents a major barrier to access for most Ontarians. Patients are steered
away from chiropractic care to medical management which is free under OHIP.
2. The OCA proposes improved access to chiropractic services through enhanced coverage
under OHIP, specifically that OHIP would cover 75% of the fee per visit, 100% for the
elderly and the poor. The additional sum required for this policy is $200 million by the
third year, i.e. 2000.
3. This reform will result in the doubling of the proportion of the public that visits
chiropractors in Ontario from 10% to 20%. It will also mean that these patients will visit
chiropractors sooner for their problems. Currently 4 out of 5 chiropractic patients have
had their disorders for over 6 months and many have already had extensive medical
diagnosis and treatment.
4. Expenditure to improve access to chiropractic services, and the changed utilization
patterns it produces, will lead to very substantial net savings in direct and indirect costs.
Direct savings to Ontario=s health care system may be as much as $770 million, will very
likely be $548 million, and will be at least $380 million. The corresponding savings in
indirect costs - made up of the short and long term costs of disability - are $3.775 billion,
$1.849 billion and $1.255 billion.
5. The reasons why such substantial savings will accrue include:
a) Approximately 95% of chiropractic practice in Ontario involves the management
of patients with neuromusculoskeletal disorders and injuries.
b) Musculoskeletal disorders and injuries are the second and third most costly
categories of health problems in economic burden of illness studies.
Musculoskeletal disorders are also among the most important reasons for activity
limitations and short-term disability. They rank first in prevalence in chronic health
problems and first as a cause of long-term disability.
c) Musculoskeletal disorders rank first as a reason for consultation with a health
professional in Ontario, and rank second as a reason for the use of prescription and
non-prescription drugs.

4
d) The poor and lower-middle income groups and the elderly are low users of
chiropractic mainly due to the deterrent effect of the high copayments or user fees.
Yet the prevalence of neuromusculoskeletal conditions is highest among these
socio-economic groups.
e) There is considerable empirical support for the cost-effectiveness and the safety of
chiropractic management of musculoskeletal disorders. This means that
chiropractic care can bring about improved health outcomes at a lower cost.
6. The proposed reform is consistent with the Government of Ontario=s health care reform
agenda and business plan.
7. The reduction in health care costs is consistent with the Government=s emphasis on value
for money and its objectives of reducing hospital and drug expenditure, and the fiscal
objectives of reducing the deficit and the levels of taxation.
8. An interesting variation and an improvement on the OCA=s proposed reform is to make
the patient=s first visit to a chiropractor free of any copayment. This would further
enhance access and increase net savings.
9. The Ministry of Health of Ontario should employ chiropractors on a salaried basis in
hospitals, community health centres, and long-term care institutions.
10. More workers with neuromusculoskeletal disorders covered by the Workers= Safety and
Insurance Board should be channelled to chiropractic care.
11. Medical doctors and chiropractors are both substitutes for and complementary to each
other in the management of neuromusculoskeletal conditions and injuries.
Interprofessional relations between the two have improved over the years, and is
evidenced by official pronouncements and greater inter-referral of patients between the
two professions.
12. Significant reduction of health care costs, improved health outcomes, and equitable access
to services are all important objectives for the Ontario health care system. Any one would
be sufficient reason for the proposed reform in funding for chiropractic services. The fact
that this reform meets all three objectives makes the case urgent and compelling.

5
INTRODUCTION
This is a special report written for the OCA in its continuing dialogue with the Ministry of Health
of Ontario which, like all provinces in Canada, is considering major health care reform. The
principal conclusion of the report is that greater OHIP coverage of chiropractic services is part of
the solution to a set of three interrelated problems:
(a) high health care costs for neuromusculoskeletal conditions and injuries
(b) inadequate and inequitable access to such services
(c) poor or worrisome health outcomes of medically managed neuromusculoskeletal diseases,
illnesses or injuries.
Greater chiropractic coverage under public health insurance plans can improve health outcomes,
significantly reduce health care costs, and improve accessibility to needed health services on the
part of several socio-economic groups who under the current OHIP coverage do not have
adequate access to care.
The central argument that leads us to this conclusion is that chiropractors are highly cost-effective
alternative providers of care for neuromusculoskeletal conditions. In what follows, the meaning
of alternative provider of care is discussed. This is followed by a presentation of empirical
evidence in support of this concept and the claim of significant cost-savings, improved access and
better health outcomes. We then offer estimates of the savings in health care costs from
enhanced coverage of chiropractic care under OHIP. Finally, some health policy and health
insurance implications of all of the above are offered.
CHOOSING BETWEEN ALTERNATIVE PROVIDERS OF CARE
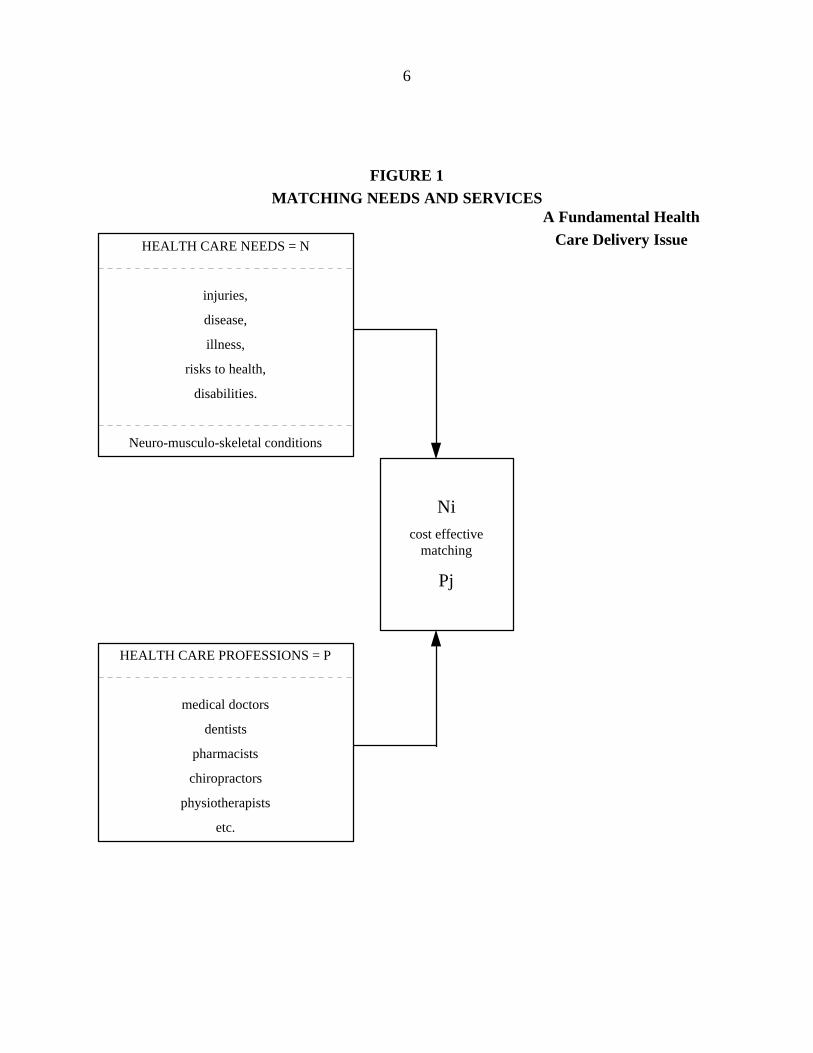
Figure 1 illustrates one of the essential health care delivery problems that public and private
insurance authorities face in providing health care services. In this figure Ahealth care needs@
consist of the incidence and prevalence of diseases, illnesses, injuries, disabilities and risks to
health. These needs generate a demand for a wide range of health care services. Such services
are offered by a number of health care professions, some of whom are uniquely competent to
respond to some of the needs of the public.
However for many of the needs, and the example given here is neuromusculoskeletal conditions
which include spinal pain, sciatica and headache, two or more professions may be more or less
competent to offer the needed care. Under such situations the proper objective of the insurance
plan authorities is to bring about the most cost-effective pairing of specific health care needs and
health care providers. Where there is a choice in matching needs with competing professions,
there is a concomitant opportunity for health care reform. Needless to say the cost-effective
matching of needs and caregivers should be based on evidence and not merely on tradition and the
unquestioned acceptance of the status quo.
6
FIGURE 1MATCHING NEEDS AND SERVICES
A Fundamental HealthCare Delivery IssueHEALTH CARE NEEDS = N
injuries,
disease,
illness,
risks to health,
disabilities.
Neuro-musculo-skeletal conditions
Ni
cost effectivematching
Pj
HEALTH CARE PROFESSIONS = P
medical doctors
dentists
pharmacists
chiropractors
physiotherapists
etc.

7
If we are serious about health care reform, we ought to be principally interested in answering the
question: given that certain services must be provided to patients, which of the alternative
caregivers who have been educated and trained to provide the services can provide them most
appropriately and cost-effectively, having regard also to quality of care, safety of treatments and
patient preferences? This is the classic manpower substitution or health human resources
substitution question. It is a question about professional turf as well, because it raises the issue of
who should provide care to patients with specific needs. Huge savings are certain if such
substitutions are carefully implemented. Examples include substituting family practitioners for
specialists, midwives for obstetricians for uncomplicated deliveries, nurses practitioners for
general practitioners, dental hygienists for dentists; pharmacy technicians for pharmacists and so
on (Manga and Campbell, 1994). There are literally dozens of studies pointing to such evidence-
based manpower substitution but for a variety of professional, political, insurance practices and
other administrative reasons, many of those health human resources substitutions have yet to
occur.
There is an immense amount of research aimed at discovering which of the several professions is
best able to treat or manage specific health problems, assuming that they are all more or less
competent and qualified to do so. It is assumed that the different professions bring to bear quite
different diagnostic and therapeutic models, approaches or paradigms to the health problem that
must be dealt with. For example, osteopaths, medical doctors, physiotherapists and chiropractors,
all claim to be able to deal with low-back pain or neck pain or other neuromusculoskeletal
conditions. Medical doctors and chiropractors both can and do deal with various kinds of
headaches. We are referring to the patient's problem being more or less managed entirely by one
or another alternative caregiver. It thus follows that if an insurance plan, public or private,
chooses one caregiver rather than another, there will be implications for both the effectiveness and
the costs of the care thus rendered. A wrong choice would lead to poorer outcomes or higher
costs or a combination of the two.
This form of substitution has traditionally received very little attention but is now assuming
greater importance and relevance. We note that the importance of matching needs with the most
cost-effective caregiver is not obviated nor reduced by the development of clinical practice
guidelines (CPGS). There are far too few CPGS in medicine. Worse, in most countries, and in
Canada specifically, it is up to medical doctors to integrate and use CPGS in their clinical practice.
Only half of medical doctors use CPGS at least once a month, and less than a third report having
changed their practice even once in a year because of CPGS (Hayward et al. 1997). Medical
doctors have little confidence in CPGS prepared by private health insurance plans (3%);
provincial governments (9%) and federal government (16%); though 75% have confidence in
CPGS prepared by official medical organizations. However there is little use of these guidelines.
In the case of back pain no Canadian guidelines have been developed and very few Canadian

8
doctors use the CPGS developed by the American Agency for Health Care Policy and Research
(AHCPR), which have been corroborated by British guidelines (Dyer, 1997). ABoth the American
and British guidelines were products of exhaustive literature searches... (and) represent a
substantial shift from the traditional approach.@ (Deyo, 1996, 1343). These facts make the
importance of a cost-effective matching of needs with any qualified caregivers, all the more
compelling and urgent.
Traditionally, virtually all health care problems were managed almost exclusively by medical
doctors. High costs and poor outcomes have forced us to question this assumption, as have the
emergence of competing professions and the demand by the public to have the right to choose the
caregiver. As a result, both private and public insurance systems are now asking the question that
should have been addressed many decades ago: which caregiver is most cost-effective in
managing an episode of a specific problem? Indeed, the answer to this question should have been
the basis of organizing the health insurance plans. Instead, our insurance plans presuppose just
one type of gatekeeper and caregiver, and relegate all others as subservient, subordinate or
complementary to the medical profession. To put it yet another way, the creators of insurance
plans did not ask what health conditions and care should be insured and then determine who
should provide the thus identified care. They merely assumed that all patients needed the care
offered or ordered by medical doctors. This exclusivity and monopoly is bred into the very design
of insurance plans.
ASafety and consumer protection issues are often cited as reasons for restricting non-physician
services. But the restrictions appear not to be based on empirical findings. Studies have
repeatedly shown that qualified non-physician providers - such as midwives, nurses, and
chiropractors - can perform many health and medical services traditionally performed by
physicians - with comparable health outcomes, lower costs, and high patient satisfaction@ (Blevin,
1995, 1).
Chiropractors and medical doctors are not only substitutes for one another but complement each
other in the treatment of neuromusculoskeletal (NMS) conditions. Both substitution and
complementarity are a result of the fact that there is considerable overlap in the specific conditions
they treat. There is also an asymmetry in this relationship in that medical doctors are substitute
providers of care for virtually every patient chiropractors treat but chiropractors are substitutes
for only some of the patients medical doctors treat. Medical doctors, after all, provide a far
greater range of services than chiropractors. One economic implication of this observation is that
chiropractic care is thus likely to be much more sensitive to user fees, copayments, coinsurance
and so forth than medical care. This is in fact borne out by empirical evidence as we point out
later in this report.

9
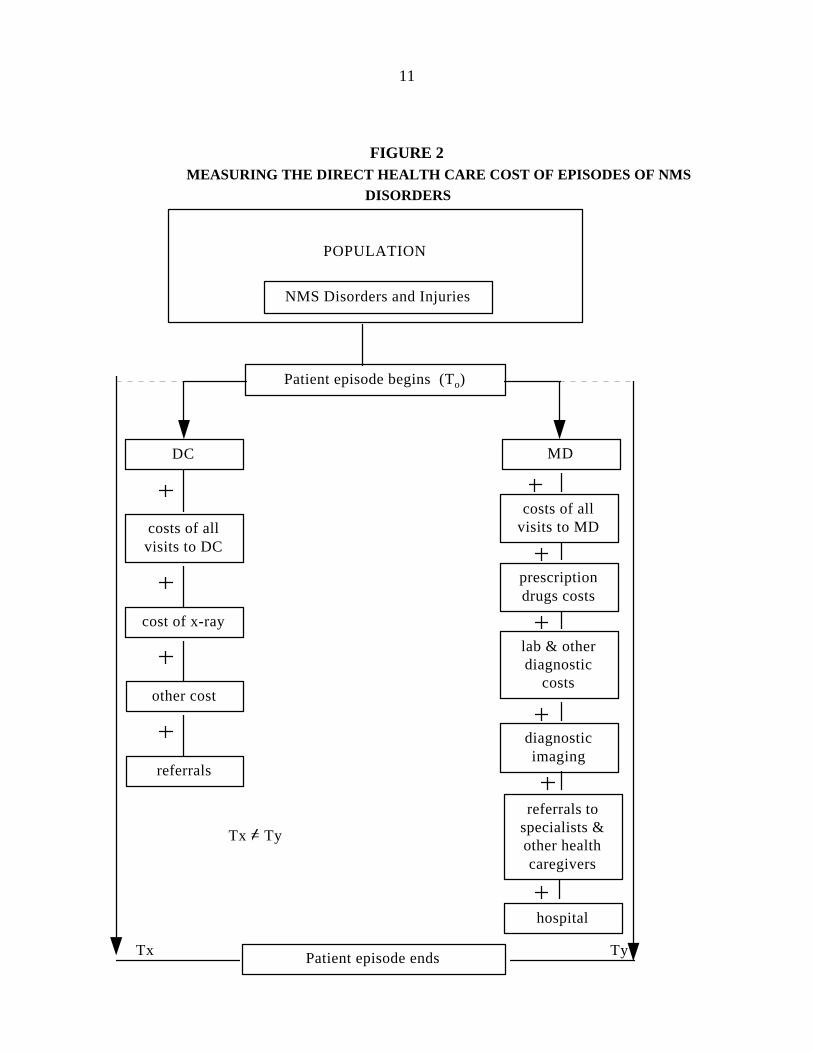
COSTING AN EPISODE OF ILLNESS, DISEASE, OR INJURY
Consider Figure 2 below. Those in the total population, who need to obtain professional care for
NMS conditions have a choice of seeing medical doctors (MD), doctors of chiropractic (DC),
physiotherapists (PT), osteopaths (DO) or others, but for the sake of simplicity we will consider
just two of the professions, namely DCs and MDs.
It is important to measure the full costs of managing an episode of a specific health condition no
matter which caregiver is chosen to manage it. An episode of low-back pain, managed by a family
practitioner for instance, must include the cost of drugs, diagnostic imaging and tests, the referrals
to PTs or medical specialists, and hospitalization, if such costs were involved in managing the
episode of low-back pain. If DCs manage such cases, the cost of X-rays and other therapeutic
modalities must also be included. Just looking at fees paid to the professional caregivers is
inadequate and gives an erroneous view of who is most cost-effective. This may seem obvious,
but many studies make surprising mistakes in this area.
Another important point that needs to be emphasized here is that the alternative caregivers are
and can be substitutes for one another. A patient need not get care from 2 or more different
caregivers. This does not, however, preclude patients from getting care from two or more
caregivers if the situation warrants it or if there were important complementarities between them
and referral is legitimate and necessary. As well, and very importantly, if a patient cannot get a
satisfactory resolution of his/her condition from one profession one would naturally expect the
patient to obtain care from an alternative professional. It is this very point that should compel the
insurance plans to get the right answer to the question: which of the alternative caregivers will
offer the most cost-effective therapy for patients with a specific health problem. For patients to
go to the wrong or suboptimal caregivers first (for reasons of habit, convention, design of
insurance plans, low or no cost, etc.) only to then have to go to the more optimal caregiver later
clearly implies unnecessary costs of care and poorer health outcomes.
Figure 2 underscores the need to include and aggregate all costs for the entire episode of illness or
injury. It so happens that DC management of many conditions is highly "own-labour" intensive
(i.e. doctors of chiropractic provide mostly hands-on therapy and very little else), whereas medical
management is a lot more complex and costly involving one or more prescription drugs; referrals
to other caregivers including specialists and physiotherapists; laboratory tests and diagnostic
imaging, and sometimes hospitalization as well. The literature on costing medical and
chiropractic management of low-back pain shows that payments to chiropractors for their own
services constitute more than 80% of the costs per episode. In the case of medical management
the payments to medical doctors is only about 23% of the costs per episode (Manga et al. 1993).
Costing out an entire episode of care cannot be done with existing data systems in Canada,

10
though it can and has been done elsewhere.
In our review of the literature - presented later in the report - we did not encounter a single study
that measured the direct health care costs of an episode of illness fully. However, a few studies
came close to doing so.
Even Figure 2 does not represent the full extent of the economic cost differentials between
medical doctors and chiropractors. Firstly, some important direct costs are not included in the
figure. For example, non-prescription drugs are a significant cost for some neuromusculoskeletal
conditions. Secondly and most significantly, Figure 2 only looks at treatment costs or direct
costs, and not a range of indirect costs. These are often larger than direct treatment costs for
many NMS conditions because of the high burden of disability associated with such conditions
(e.g. back pain, sciatica, headache).
In Figure 2, Tx need not equal Ty and in fact is not likely to given the very different treatment
philosophies and approaches of medicine and chiropractic. Thus the duration of episodes may be
different, but it is the cost incurred for the whole episode that must be the key statistic of interest
in a proper evaluation. The other key parameters of interest are, of course, the effectiveness of
medical and chiropractic management, the safety of the treatment and patient acceptance and
preference for the different therapies and caregivers.
A medically managed episode of care involves many cost items often not recognized in some
studies comparing medical and chiropractic management of illnesses and injury. This is specially
true for some conditions such as low-back pain. Apart from data difficulties and proper analytical
methodologies, there is also the problem of defining the "episode" of illness, injury or disease
itself. When does it begin and, more problematically, when does it end? This is a subtle but
extremely significant point. Comparing costs per episode for two professions is only legitimate if
both professions were equally successful in resolving their patients health problems. The concept
of cost per episode is a preferred concept for purposes of analysis but, as we explain later, is a
source of error that invalidates some study findings.
11
FIGURE 2MEASURING THE DIRECT HEALTH CARE COST OF EPISODES OF NMS
DISORDERS
POPULATION
NMS Disorders and Injuries
Patient episode begins (To)
DC
costs of allvisits to DC
cost of x-ray
MD
costs of allvisits to MD
prescriptiondrugs costs
Patient episode ends
hospital
referrals tospecialists &other healthcaregivers
lab & otherdiagnostic
costs
diagnosticimaging
other cost
Tx Ty
referrals
Tx = Ty
12
Unfortunately, there is no comparative data of the kind suggested in Figure 2 in Canada. We
simply do not have the medical or chiropractic costs per episode for any of many specific
diagnosis that are collectively referred to as neuromusculoskeletal conditions and injuries. Such
data would naturally facilitate an economic assessment of substituting chiropractic management
for medical management of NMS conditions or injuries. Even if we had such comparative costs
data, we would still need additional data for evaluating the overall effect of enhanced OHIP
coverage of chiropractic services. We would need to know exactly how the enhanced coverage
would affect the level of fees for chiropractic visits, and especially its impact on the out-of-pocket
(co-payment) costs to patients. In this study we assume that the patient copayment per visit,
presently approximately $18, will be $10 or less after three years. Greater OHIP coverage must
lead to a reduction in the co-payments paid by patients in order to improve access to chiropractic
care and increase the rate of utilization as measured by the proportion of the Ontario population
that visit chiropractors for needed care.
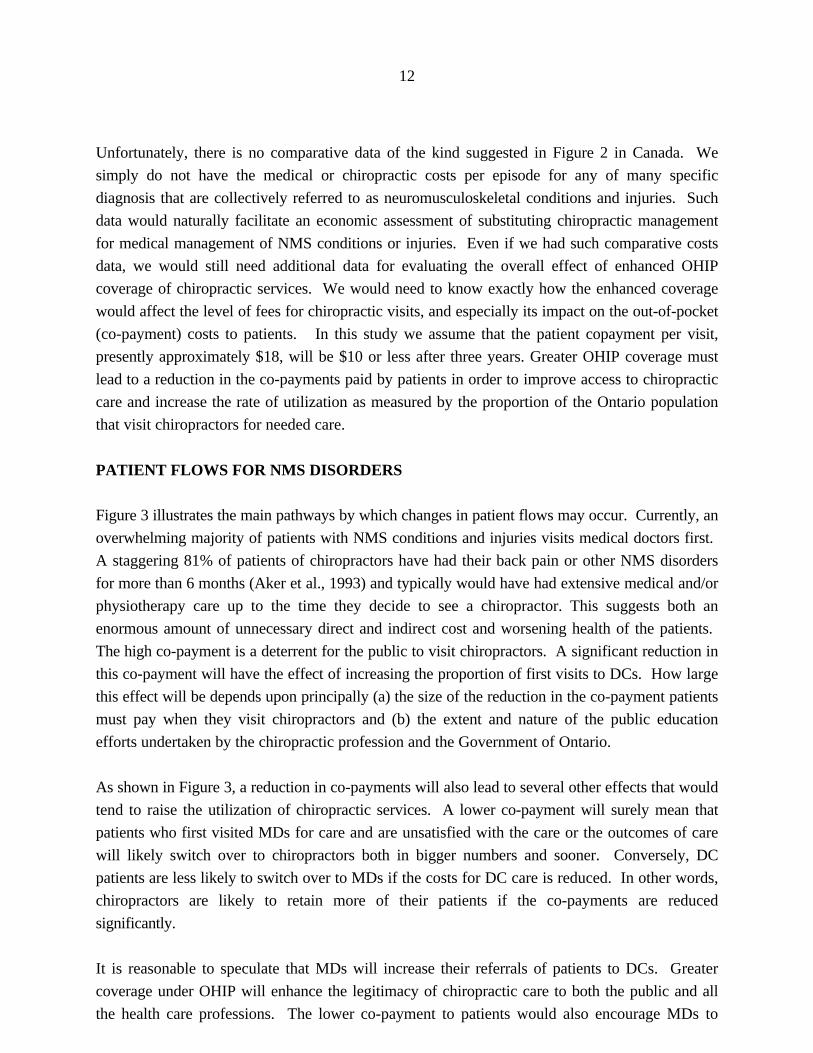
PATIENT FLOWS FOR NMS DISORDERS
Figure 3 illustrates the main pathways by which changes in patient flows may occur. Currently, an
overwhelming majority of patients with NMS conditions and injuries visits medical doctors first.
A staggering 81% of patients of chiropractors have had their back pain or other NMS disorders
for more than 6 months (Aker et al., 1993) and typically would have had extensive medical and/or
physiotherapy care up to the time they decide to see a chiropractor. This suggests both an
enormous amount of unnecessary direct and indirect cost and worsening health of the patients.
The high co-payment is a deterrent for the public to visit chiropractors. A significant reduction in
this co-payment will have the effect of increasing the proportion of first visits to DCs. How large
this effect will be depends upon principally (a) the size of the reduction in the co-payment patients
must pay when they visit chiropractors and (b) the extent and nature of the public education
efforts undertaken by the chiropractic profession and the Government of Ontario.
As shown in Figure 3, a reduction in co-payments will also lead to several other effects that would
tend to raise the utilization of chiropractic services. A lower co-payment will surely mean that
patients who first visited MDs for care and are unsatisfied with the care or the outcomes of care
will likely switch over to chiropractors both in bigger numbers and sooner. Conversely, DC
patients are less likely to switch over to MDs if the costs for DC care is reduced. In other words,
chiropractors are likely to retain more of their patients if the co-payments are reduced
significantly.
It is reasonable to speculate that MDs will increase their referrals of patients to DCs. Greater
coverage under OHIP will enhance the legitimacy of chiropractic care to both the public and all
the health care professions. The lower co-payment to patients would also encourage MDs to

13
refer their patients to DCs. There is widespread belief and some evidence that MDs are referring
patients to DCs in greater numbers already. A survey of Ontario family physicians by Patel-
Christopher (1990) indicated that 62% were referring patients to chiropractors and that the rate
was increasing for musculoskeletal disorders. Interestingly 9.5% of physicians had received
chiropractic care themselves. Scientific evidence, and clinical guidelines are underscoring the
effectiveness of chiropractic management of NMS conditions. The trend will simply be reinforced
and given further impetus by the enhanced coverage of chiropractic services under OHIP.
It is difficult to say whether referrals by chiropractors to MDs will increase or decrease under this
broad policy change. A reasonable conjecture might be that the rate at which chiropractors will
refer their patients to MD will not change, but that there will be more timely referral of patients
who need medical care.
14
FIGURE 3PATIENT FLOWS FOR NEUROMUSCULOSKELETAL CONDITIONS AND INJURIES
POPULATION
NMS conditions & injuries
PATIENT’S CHOICE OF FIRST VISITS
CHIROPRACTORS
MEDICAL
DOCTORS
Rdc.md
DC patients choosing to visit MDs
Pdc.Pmd
MD patients choosing to visit DCs
Pmd.dc
MDs referring patients to DCs
Rmd.dc
DCs referring patients to MDs
= the likely on patient flows from enhanced coverage ofchiropractic care under OHIP.
= very significant increase
= very significant decrease
= increase
= decrease
P.DC P.MD
/
15
NEUROMUSCULOSKELETAL DISORDERS
There are statistical reasons for our main focus on NMS conditions in this analysis. About 96%
of chiropractic care in Ontario is for patients with NMS disorders, with 67% for back pain, 6%
for headaches, 16% for arthritis and rheumatism. At present about 33% of back pain suffers in
Ontario are eventually treated by chiropractors (Aker et al., 1993).
An analysis of the 1990 Ontario Health Survey found that musculoskeletal disorders ranked first
in prevalence as the cause of chronic health problems, long-term disabilities, and consultations
with a health professional, and that they ranked second for restricted activity days and use of both
prescription and non-prescription drugs. No other body systems ranked invariably within the top
2 ranks for the morbidity indices examined (Badley et al., 1994). There is also evidence that
musculoskeletal disability is associated with rising age, lower levels of schooling, lower income
and unemployment (Badley and Ibanez, 1994).
Another important economic indicator is that the incidence and prevalence of NMS disorders are
increasing over time. The epidemiological data on back pain is expansive and shows a clear
upward trend for both men and women (Manga et al. 1993). The prevalence of arthritis and
rheumatism increased from 14% in 1978-79 to 21% in 1991; for migraines from 6% in 1978-79 to
9% in 1991 (Statistics Canada, 1994). NMS disorders are common among working age men and
women and the elderly. They also tend to be more prevalent among the lowest and lower middle
income populations (Statistics Canada, 1994). Back problems and arthritis are the first and
second most common causes for long-term activity limitations among the population aged 15 and
over (Statistics Canada, 1994). In another Statistics Canada report it is noted that Athe majority
of the household population aged 55 and over - 72% of men and 78% of women, 4.3 million
people altogether - reported having at least one chronic condition in 1994-95.@ The relatively
high prevalence of musculoskeletal problems is consistent with the results of earlier Canadian
surveys (Wilkins and Park, 1997, p. 8).
Wilkins and Park (1997) analysed the 1994-95 Natural Population Health Survey and generated
the percentage of people over the age of 15 hospitalized in the previous 12 months by age and sex
for various illnesses. For arthritis/rheumatism the male and female figures respectively were
13.9% and 16.5%; for back problems 12.3% and 17.5%; for migraine headaches 8.9% and
16.2%; for activity-limiting injury 11.8% and 14.3%; for long-term disability 18.8% and 13.6%.
Those with inadequate incomes are more likely to be hospitalized, especially women. Yet another
study showed that hospital admission rates in Ontario were almost twice as high among the poor
as for non-poor people (Katz et al. 1996). The greater admission rates and use of hospital care by
the poor may suggest that Medicare works but it also is evidence that there is a continuing failure
to offer equitable access to effective primary care (Katz et al. 1996). This is true in general but
notably for musculoskeletal conditions (Badley and Ibanez, 1994).
16
In Canada, about 19% of the migrainous population never consults a caregiver. About half the
lapsed consulters (former migraine patients of medical doctors) were not satisfied with the care or
experienced problems with medications. A very high 41% of migraineurs were referred to a
specialist (Edmeads et al. 1993). Of those who visited a medical doctor 62% received a
prescription but only a third of these patients continued to use the medication. There is
considerable disagreement among medical doctors in the diagnosis of migraine headaches.
ADespite the higher prevalence of migraine in low income individuals, consultation rates for
migraine in such patients may be lower than anticipated@ (Stang et al., 1994, 551).
Later in the report we document the fact that musculoskeletal conditions are the second most
costly class of diagnosis in Canada, with injuries as a group being third. In brief, both for reasons
of prevalence and cost, the management of NMS disorders deserves very serious
reconsideration, and the issue of cost-effectiveness is key to designing the appropriate public
policy response.
If we had the medical and chiropractic costs per episode for each of the NMS diagnoses, the
incidence of such diagnoses, and the current and future flows of patients by diagnosis as depicted
in Figure 3, we would have most of the key data needed to accurately evaluate the economic
consequences of a policy of enhancing chiropractic coverage under OHIP. In fact we do not have
all of this data, and must make reasonable assumptions and provide a range of economic results.
UTILIZATION OF CHIROPRACTIC SERVICES, AND THE IMPACT OF USER FEES
Eisenberg et al. (1993) reported that 34% of the US population used one or more alternative
therapies in 1990 and that 18 million Americans (7% of the population), made an average of 13
visits per year for chiropractic services. The popularity and value of such non-medical care is
further underscored by the fact that 70% of the expenditure for such care was borne by the
patients themselves out-of-pocket, with insurers and governments paying the remaining 30%. .
By contrast, only 17% of the total medical services expenditure was paid out-of-pocket (Blevin,
1995, 3). The US Department of Health and Human Services (1984) reported a 4% utilization
rate for chiropractic care in 1980. There is thus a significant growth in the use of chiropractic
care in the USA. Manga et al. (1993) show that in Canada the chiropractic utilization rate
doubled from 5% of population in 1980 to 10% of the population by 1990. There is thus a
growing recognition and acceptance of chiropractic care by the public, despite the rising and now
high levels of co-payments.
The Ontario figure of 10% is also confirmed for 1991 by Statistics Canada (1994). The study
also suggests that about 90% of NMS suffers contact general practitioners / family physicians for
their problem, and that a significant number contact a medical specialist (39% for arthritis and
rheumatism and 36% for recurring migraine headaches). Interestingly it notes wide variations in

17
the use of chiropractic services by province. AAlthough Quebec had the highest supply of licensed
chiropractors per capita in 1990, the utilization of chiropractors in this province (7%) was quite
low. This may be attributable to the fact that provincial insurance in Quebec does not extend to
chiropractic services@ (p. 116-17). At 10%, Ontario=s rate is quite a lot lower than Alberta (12%),
British Columbia (13%), Manitoba (15%) and Saskatchewan (17%). There are significant
differences in the utilization rate of chiropractic care by income class. The lower middle class at
6%, and the poor at 8% compare unfavourably to the upper middle class (11%) even though the
former groups have a higher prevalence of NMS disorders.
A more recent study based on Statistics Canada=s National Population Health Survey of 1994/5
suggested a national utilization rate of chiropractic care of 10.5%. (So, 1997) It also found that
users of such care tend to be upper-middle income, informed and educated, less likely to be
smokers or those who have quit, undertake regular physical activities, more likely to practice
some form of disease prevention, and more likely Ato suffer chronic conditions such as back
problems and chronic pain@ (p. 75). Users of alternative care also found the care they received
from conventional medical physicians to be inadequate.
The same National Population Health Survey 1994-95 suggests that the Ontario chiropractic
utilization rate is less than the national average of 10.5% at 9.78% and lower than the 10% level
attained in 1990. The rate naturally varies by age and sex. It is highest for the age groups 45-64
(12.27%) and 25-44 (10.6%), and lowest for younger groups and those of 65 years of age or
more 7.79%. The data suggests that while the utilization rate doubled from 1980 to 1990 despite
rising levels of copayments, this growth has terminated and perhaps reversed itself somewhat
since then. This change would seem to be due to the still higher levels of copayments for
chiropractic care, caused in part by reduced OHIP financing and in the past by the worsening
economic climate that gripped Ontario for most of the 90's.
Private insurance coverage for chiropractic services in Ontario has increased somewhat but
remains unavailable to most Ontarians for a combination of legislative and employment reasons.
Private insurance coverage of the copayment was illegal until an amendment to the regulations
under the Health Insurance Act in August 1996. A legacy of the former law is that most
employee benefits insurance plans only cover chiropractic services once OHIP coverage has
expired. Currently that is after approximately 22 treatment visits and only approximately 10% of
patients utilizing chiropractic services have that many treatments. The end result is that the costs
of chiropractic care are not covered by private insurance for 90-95% of patients. They therefore
have an economic reason to visit medical doctors and physical therapists instead of chiropractors.
Shekelle et al (1995) have shown empirically that copayments for chiropractic care of about 25%
of the cost, or poor insurance coverage in general, are significant deterrents to the use of
chiropractic care. There is also a very large body of literature generally indicating that user fees in
any form for health services acts as a significant barrier to access. This is particularly the case
18
where, as in Ontario now, one service has a user fee (chiropractic) and other available alternatives
(medical and physiotherapy) do not.
Chiropractic care is subject to very high price elasticity of demand, and Ais more sensitive than
overall health care expenses, outpatient health care expenses, and dental expenses@ (Shekelle,
1994). Patient cost sharing of 25% results in a decrease in chiropractic expenditure by about half,
according to data from the RAND Health Insurance Experiment in the USA, which was a
randomized controlled trial of the effect of insurance on the use of health services. AAccess to
free chiropractic care among persons assigned to an HMO resulted in a ninefold increase in the
use of chiropractic care, compared with persons in the HMO without access to free chiropractic
care. Among persons who had to pay 95% of the cost of their chiropractic care, access to free
medical care in an HMO resulted in an 80% decrease in the use of chiropractic care compared
with persons in the fee-for-service plan@. The RAND data Aare certainly compatible with a
substantial cross price effect (substitution of one service for another depending on price), in light
of the increased price sensitivity of chiropractic care relative to outpatient medical care@. (Later
we express concerns about cost analyses made by Shekelle et al, but these figures on cross price
effect appear to be reported accurately). Cross price effect, more correctly termed cross price
elasticity of demand, simply refers to what the percentage increase in the use of medical care is
when the price of chiropractic care increases. For these patients medical care becomes a
substitute for chiropractic care.
In the U.S. expenditures for chiropractic services increased from $1 billion in 1980 to over $4
billion by 1988 (Stano, 1992). Neuromusculoskeletal disorders accounted for more than 80% of
this expenditure.
In terms of economic analysis and potential utilization rates, it is crucially important to note that
the utilization rate of chiropractic care increased from 5% of the population in 1980 to 10% in
1990 despite a huge increase in the level of co-payment payable by patients for chiropractic visits.
This illustrates that the public preferred to see chiropractors despite a strong financial deterrence
and the known high price elasticity discussed above. If this financial deterrence is reduced to the
point where it becomes relatively insignificant, we can expect to see a large increase in the
proportion of the public visiting chiropractors, especially for common NMS conditions and
injuries for which chiropractic care has been shown to be safer and more effective than alternative
management. A doubling of the utilization rate from 10% to 20% is to be expected, especially if
an effective marketing campaign is launched and sustained after the Government of Ontario
announces its policy reform. Anecdotally, chiropractors report a doubling in the utilization rate
when the patient copayment was reduced to 20% in 1970 when OHIP coverage was introduced.
19
COMPARATIVE COST OF CHIROPRACTORS AND MEDICAL DOCTORSUNDER VARIOUS HEALTH INSURANCE SYSTEMS
In this section we present a number of studies that compare chiropractors and medical doctors in
terms of costs, insurance payments, utilization, effectiveness or outcomes and patient satisfaction
levels. These studies provide a basis for assessing the effects of enhanced chiropractic coverage
under OHIP. Evidence from the USA is presented first. This is followed by evidence from the
UK, Canada and Australia.
USA STUDIES
In two very recent studies by Smith and Stano (1997) and Stano and Smith (1996), the health
insurance payments (costs) and patient utilization patterns for episodes of common lumbar and
low-back conditions managed by chiropractors and medical doctors are compared. The analysis is
particularly important because the patients studied had insurance allowing them to commence and
then obtain all the care needed for their conditions from either a chiropractor or a medical doctor,
though copayment levels were different.
The data used by Smith and Stano are derived from fee-for-service claims information of large
corporations with a population of about 2 million beneficiaries. The so-called MEDSTAT
database covers a period of 2 years from July 1, 1988 to June 30, 1990. The studies looked at
chiropractic and medical use and costs for 208 International Classification of Diseases, 9th
Revision, Clinical Modification (ICD-9-CM) codes for NMS disorders. It is "by far the largest
known source of information on chiropractic care, and probably among the largest in existence,
for patients with NMS disorders" (Stano and Smith, 1996, p. 194).
The total patient count was 7,077 involving 8,018 episodes of care initiated by clearly identified
chiropractic or medical physicians. The analysis was conducted using "episodes of care" which
incorporate all health services utilized by a patient in diagnosis and treatment of a particular NMS
condition from the beginning to the end of the patient's condition. It is thus consistent with our
conceptual framework suggested in Figure 2. The entire claims history and hence costs are
known, with the exception only of some data on medical prescriptions and physical therapy.
Smith and Stano analysed 9 high-frequency NMS ICD-9-CM "trigger" codes which are typically
used in the U.S. by both MDs and DCs as the first diagnostic code during an episode of care.
They considered "only patients with clearly identified medical or chiropractic first-contact
providers" and hence their study is especially relevant for our analysis of the implications of
enhanced chiropractic coverage under OHIP.
There were 6,183 patients with at least one episode of care, 4,608 of whom saw an MD and
1,575 of whom saw a DC for the 9 NMS conditions for their first episodes. (The difference in
20
first visits in favour of MDs is not a measure of patient preference because it is influenced by the
fact that chiropractic visits entailed substantially higher coinsurance rates). If second and
subsequent episodes of these patients are included, the total goes up to 8,018 episodes. Table 1
(Stano and Smith, 1996, p. 195) shows the details of first and total number of episodes by
diagnostic code.
The distribution of first episodes shows that 75% of the patients visited MDs for their care versus
25% for DCs. For total episodes of care, 70% of episodes were managed by MDs versus 30%
by DCs. This suggests that the retention rate by DCs is higher than for MDs and that patients are
more likely to switch from MDs to DCs for their subsequent episodes rather than the reverse.
(This is consistent with other studies reporting higher satisfaction with chiropractic care than
medical care for back pain, and is relevant to estimating some of flows depicted in Figure 3
above).
The sample of patients visiting DCs and MDs had at the very least "equal severity conditions"
(Stano and Smith, 1996, p. 196) though in the later paper Smith and Stano (1997) point out that
Achronic NMS cases may tend to gravitate@ to chiropractic. Smith and Stano (1997,9) point out
that A31.6% of chiropractic first episodes limited to a recurrence is significantly greater than
16.3% of medical episodes@. To gain an extra measure of standardization and control they
analysed each of the nine major episode conditions separately, as well as together.
It might be noted here that several studies have found that chiropractic patients are in fact more
sick or have more severe conditions, and have experienced longer duration of pain, have a history
of back pain often not successfully resolved by medical doctors, and have greater number of
illnesses (Hurwitz, 1994; US Dept. of Veterans Affairs, 1990; Nyiendo, 1991).

21
TABLE 1
NINE "TRIGGER" ICD-9-CM LUMBAR AND LOW-BACK CODES
Code Description Medicala Chiropractic
Firstepisode
Total Firstepisode
Total
722.10 Intervertebral disk disorders, displacement of thoracicor lumbar intervertebral disk without myelopathy
421 (555) 104 (147)
722.52 Intervertebral disk disorders, degeneration of thoracicor lumbar intervertebral disk, lumbar or lumbosacralintervertebral disk
194 (247) 40 (57)
724.2 Other and unspecified disorders of back, lumbago 2,088 (2,458) 354 (558)
724.3 Other and unspecified disorders of back, sciatica 262 (315) 68 (110)
724.6 Other and unspecified disorders of back, disorders ofsacrum
82 (122) 105 (154)
839.2 Thoracic and lumbar vertebra, closed, lumbarvertebra
45 (55) 116 (179)
846 Sprains and strains of sacroiliac region 132 (158) 77 (104)
846.0 Sprains and strains of sacroiliac region, lumbosacraljoint, ligament
635 (777) 319 (490)
847.2 Sprains and strains of other and unspecified parts ofback, lumbar
749 (923) 392 (609)
TOTAL 4,608 (5,610) 1,575 (2,408)
ICD-9-CM; International Classification of Diseases, 9th Revision, Clinical Modification.a Number of medical and chiropractic patients/first episodes. The total number of episodes isshown in parentheses.
Source: Stano and Smith (1996, p. 195).
Results
As shown in Table 2, chiropractic cases show longer average episodes of care at 37 days
compared to 19 days for medical management of these 9 NMS disorders. However, the longer
average length of episodes does not mean higher costs. The average total insurance payments for
medically managed episodes is $1,020, virtually double the $518 for the average chiropractic

22
episodes. For outpatient costs too, the average payment for medically managed episodes is $598
compared to $447 for chiropractic episodes, a difference of 34%. Much of the higher total
payments for medically managed episodes is due to inpatient costs. Note that these differences
are underestimated since "some reporting plans exclude prescription drug payments" (Stano and
Smith, 1996, p. 197). In an earlier paper, Stano describes in detail the data sources used in this
study. The possible bias in the cost estimates is acknowledged. "We do know, however, that
medical care is underreported in this database (e.g. prescription drugs, physical therapy), due to
the decentralized delivery of medical services and the difficulties relating to the documentation of
that care" (Stano, 1994, p. 443). Such drugs and physical therapy of course, are typically
employed by MDs and not used by DCs in managing NMS disorders.
TABLE 2
MD DC
Mean Median SD Mean Median SD
Total paymentsa ($) 1,020 221 3,045 518 175 1,142
Outpatient paymentsa,b ($)
Total outpatienta 598 218 1,145 447 175 858
Episode length (days)a 19 1 39 37 9 70
Source: Stano and Smith (1996, p. 196).
Stano and Smith controlled for a number of important differences between the medical and
chiropractic cohorts by conducting a regression analysis of total payments and outpatient
payments and using as independent variables the age and sex of the patients, location, relation to
insurance plan (employee or dependent), insurance plan type (major medical or comprehensive),
class of insurance plan (in terms of whether they do or do not restrict access to chiropractic care),
the levels of deductibles and co-payment patients are liable for, and so on. The regression analysis
makes the two patient population groups as similar as possible, strengthening the comparison of
costs per episode. The results show that for each NMS condition and for all 9 together, insurance
payments for medical care is greater than for chiropractic care for both "total payments" and for
"outpatient payments". Table 3 shows the details.
23
TABLE 3SUMMARY OF ESTIMATED RATIOS OF PAYMENTS FOR
MEDICAL OVER CHIROPRACTIC FIRST EPISODES
Code NTotal
PaymentsOutpatientPayments
All 9a 6168 1,61b
(1.50-1.74)
1.47b
(1.37-1.57)
722.10 518 3.17b
(2.32-4.35)
1.94b
(1.48-2.56)
722.52 239 2.32b
(1.47-3.67)
1.88b
(1.25-2.82)
724.2 2440 1.75b
(1.53-2.01)
1.61b
(1.42-1.83)
724.3 330 1.16
(0.82-1.64)
1.13
(0.83-1.54)
724.6 186 2.11b
(1.07-3.03)
1.85b
(1.32-2.61)
839.2 161 1.27
(0.82-1.96)
1.27
(0.82-1.96)
846 208 1.03
(0.73-1.45)
1.01
(0.72-1.42)
846.0 953 1.53b
(1.29-1.80)
1.43b
(1.22-1.67)
847.2 1139 1.30b
(1.13-1.51)
1.27b
(1.11-1.46)
Source: Stano and Smith, 1996, p. 201.b = significant at the 1% level.
The 95% confidence intervals are shown in parentheses.
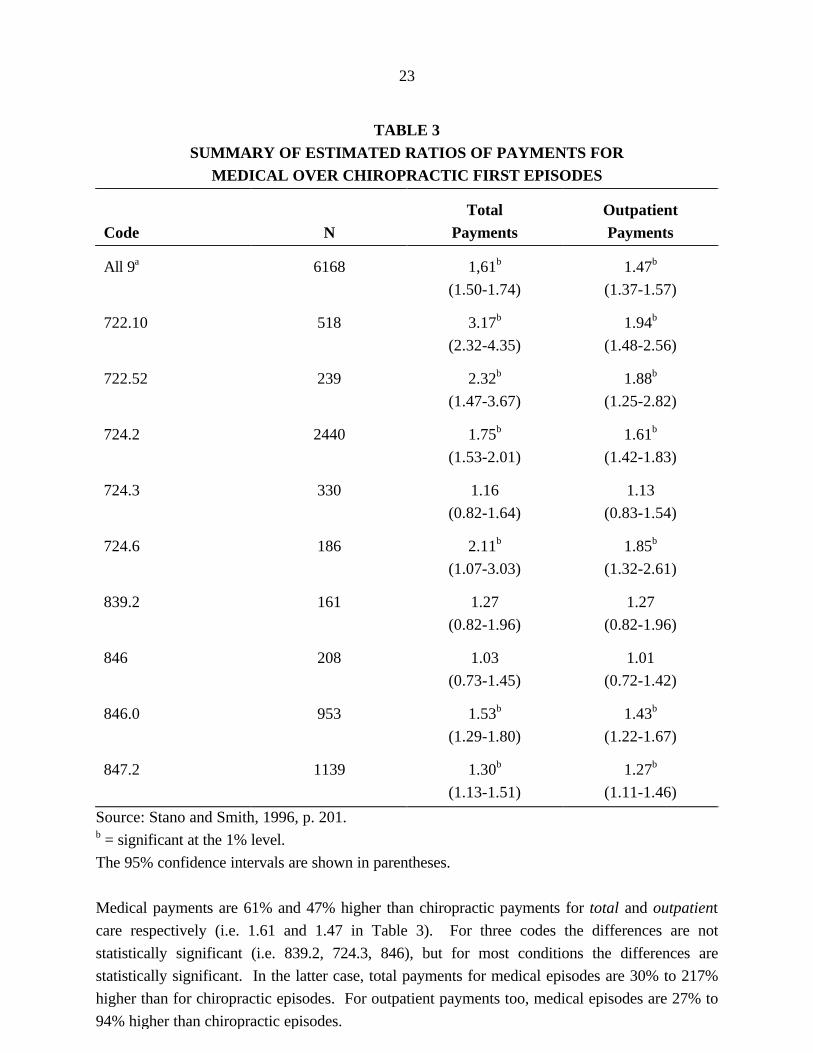
Medical payments are 61% and 47% higher than chiropractic payments for total and outpatient
care respectively (i.e. 1.61 and 1.47 in Table 3). For three codes the differences are not
statistically significant (i.e. 839.2, 724.3, 846), but for most conditions the differences are
statistically significant. In the latter case, total payments for medical episodes are 30% to 217%
higher than for chiropractic episodes. For outpatient payments too, medical episodes are 27% to
94% higher than chiropractic episodes.
24
The overall finding of these studies, that the cost of medical management of NMS disorders is as
much as 61% greater than chiropractic management per episode of NMS disorders, is most
significant. Yet even this is a biased result. It actually underestimates the true difference in as
much as it omits several costs items (drugs, physiotherapy) from medically managed episodes of
NMS disorders. In our opinion, given the rich data base and the rigorous analytical methodology
employed in these studies, the results are more reliable and noteworthy than others comparing
medical and chiropractic costs of care.
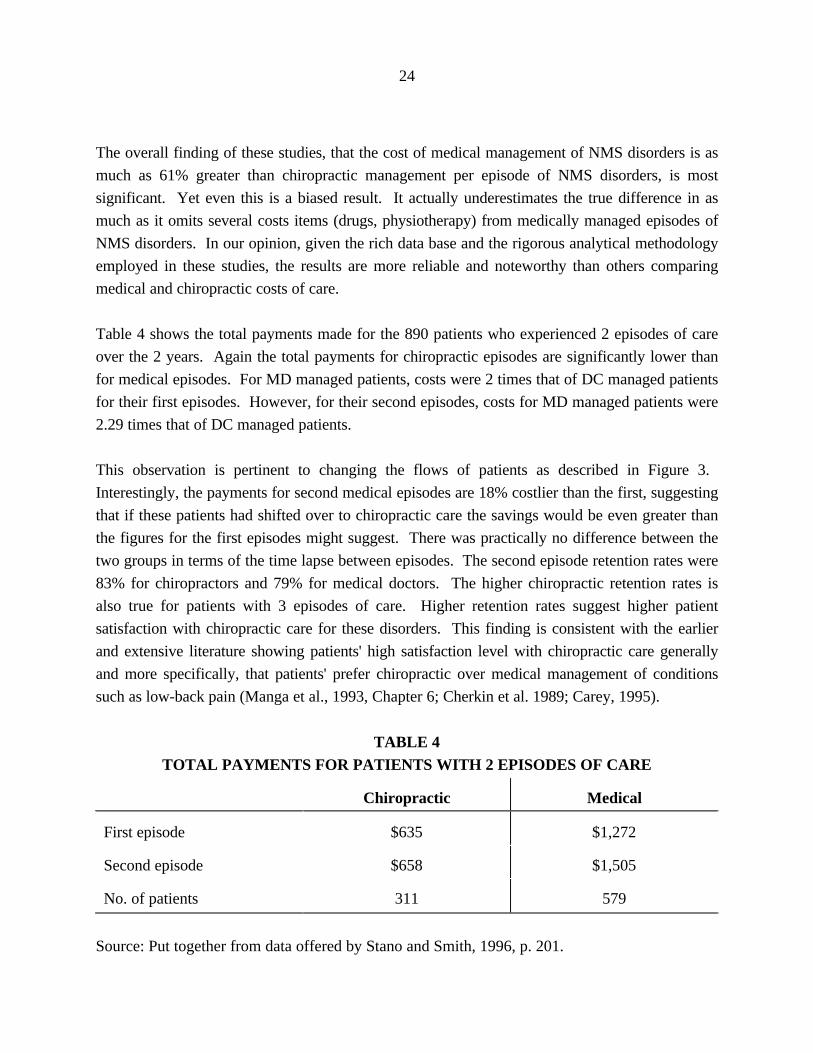
Table 4 shows the total payments made for the 890 patients who experienced 2 episodes of care
over the 2 years. Again the total payments for chiropractic episodes are significantly lower than
for medical episodes. For MD managed patients, costs were 2 times that of DC managed patients
for their first episodes. However, for their second episodes, costs for MD managed patients were
2.29 times that of DC managed patients.
This observation is pertinent to changing the flows of patients as described in Figure 3.
Interestingly, the payments for second medical episodes are 18% costlier than the first, suggesting
that if these patients had shifted over to chiropractic care the savings would be even greater than
the figures for the first episodes might suggest. There was practically no difference between the
two groups in terms of the time lapse between episodes. The second episode retention rates were
83% for chiropractors and 79% for medical doctors. The higher chiropractic retention rates is
also true for patients with 3 episodes of care. Higher retention rates suggest higher patient
satisfaction with chiropractic care for these disorders. This finding is consistent with the earlier
and extensive literature showing patients' high satisfaction level with chiropractic care generally
and more specifically, that patients' prefer chiropractic over medical management of conditions
such as low-back pain (Manga et al., 1993, Chapter 6; Cherkin et al. 1989; Carey, 1995).
TABLE 4TOTAL PAYMENTS FOR PATIENTS WITH 2 EPISODES OF CARE
Chiropractic Medical
First episode $635 $1,272
Second episode $658 $1,505
No. of patients 311 579
Source: Put together from data offered by Stano and Smith, 1996, p. 201.

25
TABLE 5COMPARISON OF CHIROPRACTIC AND MEDICAL MANAGEMENT OF
CHRONIC, RECURRENT CONDITIONS OVER TWO AND THREE EPISODES OFCARE FOR PATIENTS WITH TWO EPISODES (SECOND EPISODE SAME
PROVIDER). DC AND MD REPRESENTS FIRST-CONTACT CHIROPRACTIC ORMEDICAL PROVIDER. TOTPAY REPRESENTS TOTAL PAYMENTS, AND LAPSE
REPRESENTS THE INTERVAL (IN DAYS) FROM THE BEGINNING OF ONEEPISODE TO THE BEGINNING OF THE NEXT EPISODE
First and second episode provider
DCMean (SD)
MDMean (SD)
p-value
n
TOTPAY, 1st
TOTPAY, 2nd
TOTPAY, both
LAPSE
257
612 (1484)
646 (2746)
1258 (3189)
198 (136)
456
1129 (2939)
1261 (4155)
2390 (5152)
185 (117)
.002
.018
.000
.184
Source: Smith and Stano (1997, p.9)
The rich database allowed the authors to generate other comparisons. Table 5 shows the costsper episode for only those patients who had both their episodes of NMS conditions treated byeither and MD or a DC. Again, costs per episode for chiropractic-managed patients were half ofthose for patients managed by medical doctors.
26
TABLE 6
COMPARISON OF CHIROPRACTIC AND MEDICAL MANAGEMENT OFCHRONIC, RECURRENT CONDITIONS OVER TWO AND THREE EPISODES OF
CARE FOR PATIENTS WITH THREE EPISODES (ALL EPISODES SAMEPROVIDER). DC AND MD REPRESENTS FIRST-CONTACT CHIROPRACTIC ORMEDICAL PROVIDER. TOTPAY REPRESENTS TOTAL PAYMENTS, AND LAPSE
REPRESENTS THE INTERVAL (IN DAYS) FROM THE BEGINNING OF ONEEPISODE TO THE BEGINNING OF THE NEXT EPISODE
First, second and third episode provider
DCMean (SD)
MDMean (SD)
p-value
n
TOTPAY, 1st
TOTPAY, 2nd
TOTPAY, 3rd
TOTPAY, all
LAPSE, 1st to 2nd
LAPSE, 2nd to 3rd
97
$282 (445)
439 (1529)
318 (617)
1038 (1968)
141 (85)
152 (100)
101
$919 (3255)
983 (2415)
1166 (2824)
3068 (4897)
165 (98)
147 (86)
.054
.059
.004
.000
.068
.721
Source: Smith and Stano (1997, p.10)
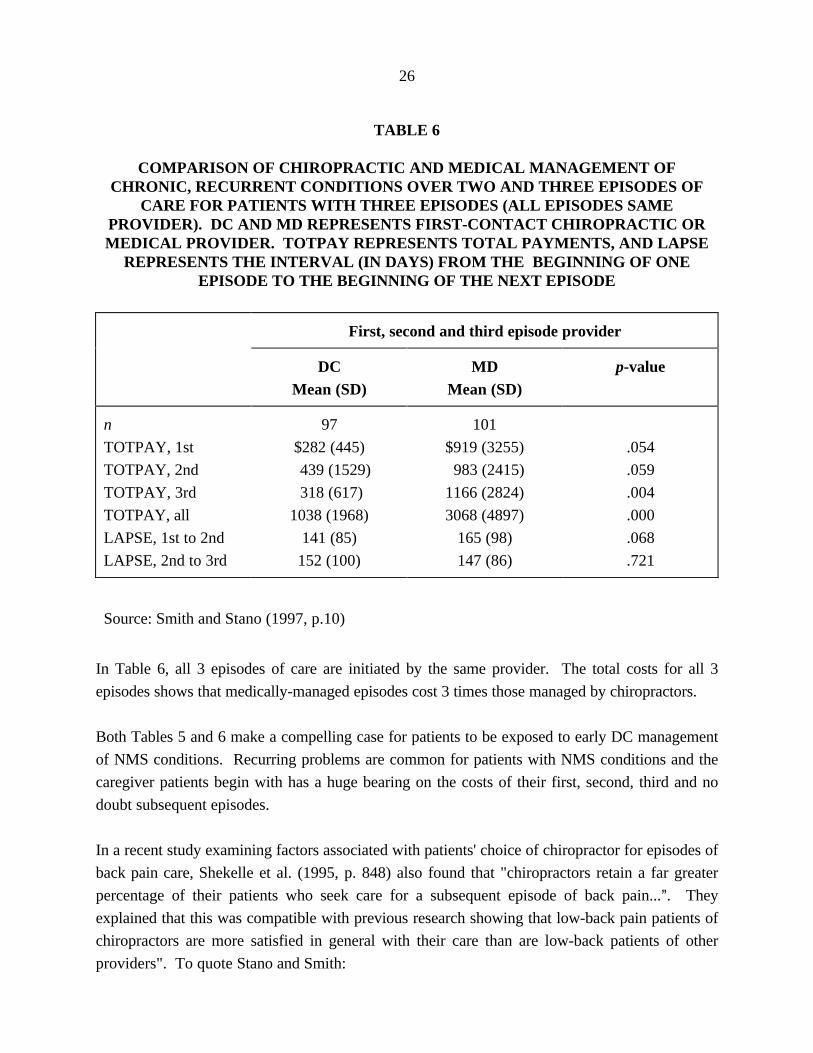
In Table 6, all 3 episodes of care are initiated by the same provider. The total costs for all 3
episodes shows that medically-managed episodes cost 3 times those managed by chiropractors.
Both Tables 5 and 6 make a compelling case for patients to be exposed to early DC management
of NMS conditions. Recurring problems are common for patients with NMS conditions and the
caregiver patients begin with has a huge bearing on the costs of their first, second, third and no
doubt subsequent episodes.
In a recent study examining factors associated with patients' choice of chiropractor for episodes of
back pain care, Shekelle et al. (1995, p. 848) also found that "chiropractors retain a far greater
percentage of their patients who seek care for a subsequent episode of back pain...@. They
explained that this was compatible with previous research showing that low-back pain patients of
chiropractors are more satisfied in general with their care than are low-back patients of other
providers". To quote Stano and Smith:

27
"In an analysis of patients with three episodes, we found that exposure to a
chiropractic provider is more likely to affect medical provider retention than
exposure to a medical provider affects chiropractic retention. Patients choosing
medical care who were exposed to a chiropractic provider for an intervening
episode were 23 times more likely not to return to a medical provider than those
not exposed to a chiropractic provider for an intervening episode. Patients
choosing chiropractic care with a medical intervening episode were nine times
more likely not to return to a chiropractic provider than those without a medical
intervening episode". (Stano and Smith, 1996, p. 201)
These Smith and Stano studies (1997, 1996) reaffirm several analyses undertaken by Stano
earlier. Stano (1995) compared MD versus DC costs and lengths of care per episode of 9
different types of lumbar and low-back pain and found that when all episodes are considered,
including 1 day episodes, the average medical episode was $1,000 versus $493 for chiropractic
episodes. If 1 day episodes are excluded, the averages are $1,991 and $760 for medical and
chiropractic episodes respectively. That is, medically managed episodes were 2.62 times costlier
than chiropractic managed episodes for the NMS conditions. This huge cost differential exists
despite longer duration of care by chiropractors, namely 58 days versus 44 (for MDs) for episodes
which involves episodes longer than 1 day; and 36 days versus 21 (for MDs) for all episodes (i.e.
that include 1 day episodes). When specific diagnostic codes are considered separately, these
differences still hold except for a few codes. In this analysis too, Stano controlled for variables
that might have confounded the comparison by using regression analysis to control for such
variables. In light of his findings Stano suggests that "both the chiropractor's role of first-contact
provider and his or her effectiveness as future NMS gatekeeper deserve careful consideration"
(Stano, 1995, p. 141).
In another study, Stano (1994) compared medical and chiropractic treatment of patients with
various lumbar and low-back disorders. In this study, however, there are a few very important
properties which must be noted. In this study only patients who have insurance benefit plans
without any special chiropractic or medical restrictions are included in the analysis. Furthermore,
only those insurance plans with the lowest co-insurance (less than 15%) and deductibles (less than
$200 annually) are included in the analysis. In other words, Stano restricted his analysis to those
patients who had virtually identical insurance coverage and under which both medical and
chiropractic services were offered virtually Aunder uniform terms and conditions@, to use a well-
known Canadian expression. The purpose of this sampling was to counter the suspicion that the
favourable cost differences previously reported were related to insurance restrictions on
chiropractic benefits. In this study the insurance coverage of medical and chiropractic benefits
were the same.

28
Table 7 shows the various disorders included in this study. (Stano, 1994). The different ICD-9
codes are aggregated into focus groups, specifically 847.2 (lumbar strains and sprains), 353.4 (L5
root lesions) and Groups 1, 2 and 3.
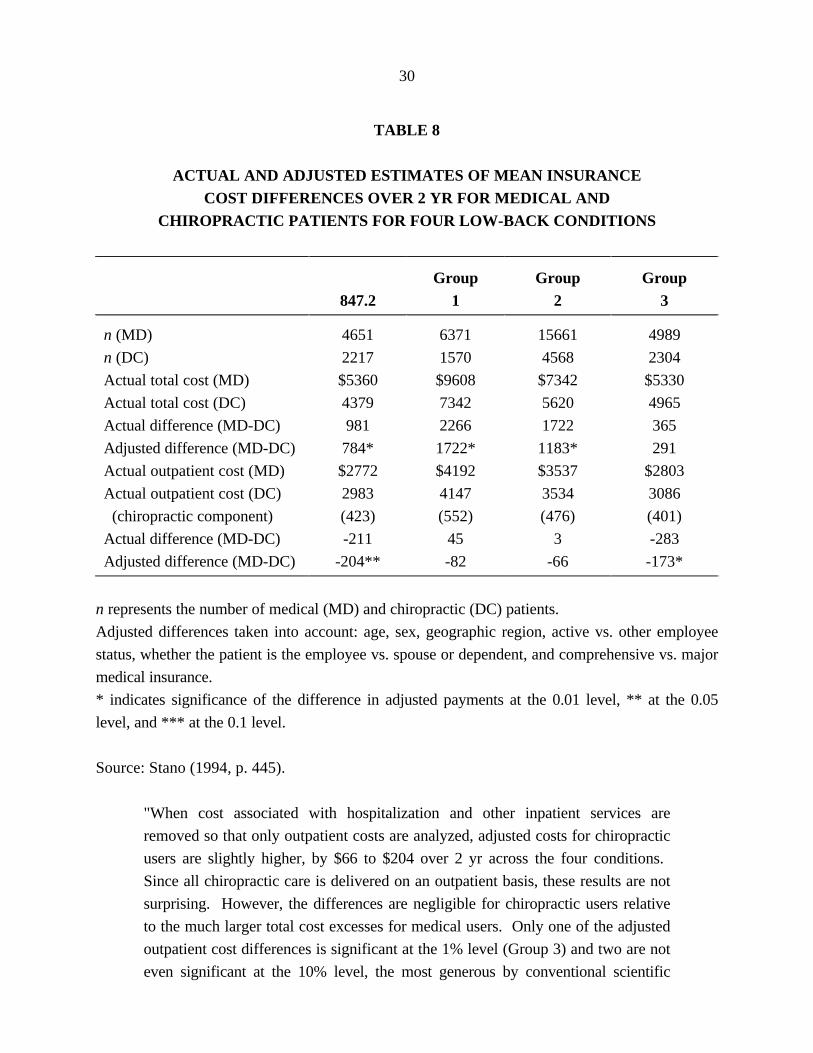
The analysis of the insurance claims data controlled for the patient's age, sex, location, employee
status (active vs other), employee relationship (self or dependent) and plan type (comprehensive
versus major medical). Table 8 presents the mean values of total insurance cost and total
outpatient cost on an actual and adjusted basis.
The actual differences per patient between MDs and DCs range from $365 (for Group 3
conditions) to $2,266 (for Group 1 conditions). Group 3, as shown in Table 5, includes only two
classes of diagnosis for sprains. Group 1 and 2 include more diagnosis, and ones that are
clinically more serious. The adjusted difference in insurance costs per patient ranges from $291 to
$1722. As shown in Table 6, medical management of NMS conditions included in the study are
significantly costlier than chiropractic management of the same conditions for patients with the
same insurance plans.

29
TABLE 7
ICD-9-CM CODES AND GROUPINGS FOR SELECTED LOW-BACK CONDITIONS
ICD-9 Description
847.2 Lumbar strains and sprains
353.4 LS root lesions
Group 1 721.3 Lumbosacral (LS) spondylosis without myelopathy
722.10 Lumbar intervertebral disk (IVD) without myelopathy
722.52 Lumbar, lumbosacral IVD degeneration
722.83 Patients with lumbar, postlaminectomy syndrome
722.93 Other and unspecified lumbar disk disorders
Group 2 724.02 Lumbar signal stenosis
724.2 Lumbago
724.3 Sciatica
724.4 Thoracic or lumbosacral neuritis or radiculitis
724.6 Disorders of sacrum
Group 3 846 Stains and sprains of sacroiliac (SI) region
846.0 LS (joint) (ligament) sprains and strains
846.9 Strains and sprains of SI region, unspecified site
Source: Stano (1994, p. 444).
30
TABLE 8
ACTUAL AND ADJUSTED ESTIMATES OF MEAN INSURANCECOST DIFFERENCES OVER 2 YR FOR MEDICAL AND
CHIROPRACTIC PATIENTS FOR FOUR LOW-BACK CONDITIONS
847.2Group
1Group
2Group
3
n (MD)
n (DC)
Actual total cost (MD)
Actual total cost (DC)
Actual difference (MD-DC)
Adjusted difference (MD-DC)
Actual outpatient cost (MD)
Actual outpatient cost (DC)
(chiropractic component)
Actual difference (MD-DC)
Adjusted difference (MD-DC)
4651
2217
$5360
4379
981
784*
$2772
2983
(423)
-211
-204**
6371
1570
$9608
7342
2266
1722*
$4192
4147
(552)
45
-82
15661
4568
$7342
5620
1722
1183*
$3537
3534
(476)
3
-66
4989
2304
$5330
4965
365
291
$2803
3086
(401)
-283
-173*
n represents the number of medical (MD) and chiropractic (DC) patients.
Adjusted differences taken into account: age, sex, geographic region, active vs. other employee
status, whether the patient is the employee vs. spouse or dependent, and comprehensive vs. major
medical insurance.
* indicates significance of the difference in adjusted payments at the 0.01 level, ** at the 0.05
level, and *** at the 0.1 level.
Source: Stano (1994, p. 445).
"When cost associated with hospitalization and other inpatient services are
removed so that only outpatient costs are analyzed, adjusted costs for chiropractic
users are slightly higher, by $66 to $204 over 2 yr across the four conditions.
Since all chiropractic care is delivered on an outpatient basis, these results are not
surprising. However, the differences are negligible for chiropractic users relative
to the much larger total cost excesses for medical users. Only one of the adjusted
outpatient cost differences is significant at the 1% level (Group 3) and two are not
even significant at the 10% level, the most generous by conventional scientific
31
standards. Finally, the outpatient component for medical patients in our database
underreports some components of costs, such as prescription drug costs. If such
costs could be included, the medical only outpatient costs would likely increase, as
would the total medical care costs". (Stano, 1994, p. 445)
We would like to point out that there is yet a further bias that Stano himself notes in his paper,
namely, that MD inpatient costs do not include all of the costs of physical therapy. MDs tend to
refer their NMS patients to physical therapists rather frequently and were this cost alone added to
the medical management, the medical outpatient costs would surely exceed chiropractic outpatient
costs.
It is crucially important to note that in our extensive search through the empirical literature we
found that the medically managed costs are invariably understated. While this is true of Stano=s
studies (a bias he recognizes) it is even more true in other U.S. studies and indeed studies from
other countries. Solid, comprehensive and reliable costing of medically managed NMS conditions
on an episodic basis is difficult. In Canada, sadly, we have no comparative cost data of the type
developed in Stano=s studies.
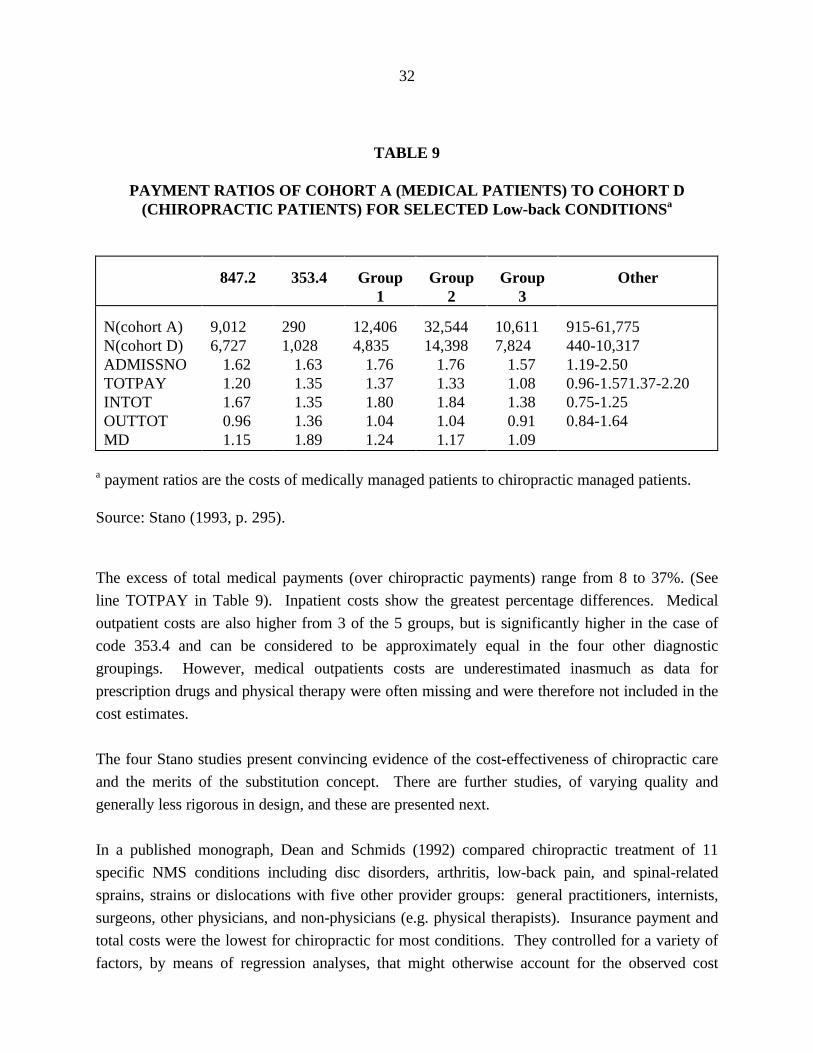
In another study, Stano (1993) looked at the same 15 NMS conditions as shown in Table 7 but
this time the sample sizes are much bigger since no restrictions on the type of insurance plans
were made. Thirteen of the conditions were placed in three groups just as in Table 7. The results
are summarized in Table 9 in which the ratio of medically managed patient costs to chiropractic
patient managed costs are given.
32
TABLE 9
PAYMENT RATIOS OF COHORT A (MEDICAL PATIENTS) TO COHORT D(CHIROPRACTIC PATIENTS) FOR SELECTED Low-back CONDITIONSa
847.2 353.4 Group1
Group2
Group3
Other
N(cohort A)N(cohort D)ADMISSNOTOTPAYINTOTOUTTOTMD
9,0126,727 1.62 1.20 1.67 0.96 1.15
2901,028 1.63 1.35 1.35 1.36 1.89
12,4064,835 1.76 1.37 1.80 1.04 1.24
32,54414,398 1.76 1.33 1.84 1.04 1.17
10,6117,824 1.57 1.08 1.38 0.91 1.09
915-61,775440-10,3171.19-2.500.96-1.571.37-2.200.75-1.250.84-1.64
a payment ratios are the costs of medically managed patients to chiropractic managed patients.
Source: Stano (1993, p. 295).
The excess of total medical payments (over chiropractic payments) range from 8 to 37%. (See
line TOTPAY in Table 9). Inpatient costs show the greatest percentage differences. Medical
outpatient costs are also higher from 3 of the 5 groups, but is significantly higher in the case of
code 353.4 and can be considered to be approximately equal in the four other diagnostic
groupings. However, medical outpatients costs are underestimated inasmuch as data for
prescription drugs and physical therapy were often missing and were therefore not included in the
cost estimates.
The four Stano studies present convincing evidence of the cost-effectiveness of chiropractic care
and the merits of the substitution concept. There are further studies, of varying quality and
generally less rigorous in design, and these are presented next.
In a published monograph, Dean and Schmids (1992) compared chiropractic treatment of 11
specific NMS conditions including disc disorders, arthritis, low-back pain, and spinal-related
sprains, strains or dislocations with five other provider groups: general practitioners, internists,
surgeons, other physicians, and non-physicians (e.g. physical therapists). Insurance payment and
total costs were the lowest for chiropractic for most conditions. They controlled for a variety of
factors, by means of regression analyses, that might otherwise account for the observed cost
33
differentials favouring chiropractic. These factors include health status, gender, race, age,
education and income class. The 11 condition-specific regression analysis results "support the
overall contention that chiropractic care is a lower cost alternative to general GP/specialist
treatment regimens" (Dean and Schmids, 1992, p. 45). In this study also the costs of care
provided by MDs were understated in that the costs of pharmaceuticals and referrals to specialists
and others were not fully incorporated in the total costs of medically-managed cases.
The unit of analysis in this study is the cost for treating the specified condition. Charges by the
practitioners for professional services alone is just one component of the total cost of treating the
condition. While this should be obvious, it is very frequently overlooked in studies and
commentaries by officials of ministries of health and workers compensation boards.
Chiropractors typically provide an almost all encompassing treatment regimen. As Stano's studies
also suggested "the relevant figure is not the cost per practitioner but rather the cost of treating
the condition" (Dean and Schmids, 1992, p. 25). Thus, a patient may visit a G.P. only 2 to 3
times for low-back pain but is often prescribed drugs and referred to other practitioners for more
specialized care. As shown in Table 10, GP billings represents only 23% of the total costs of the
conditions they treated in this study. Payments to chiropractors for their own professional
services account for 80% of the total cost of care. In this chiropractors are very different from
other health care professions treating NMS disorders. Their care is "own-labour" intensive.
These figures in this study are similar to those suggested by other studies.

34
TABLE 10
PROFESSIONAL CHARGES (FEES, PAYMENTS TO) AS A PROPORTIONOF TOTAL COST FOR TWO BROAD CLASSES OF CONDITIONS
Practitioner Musculoskeletal Strains/Sprains
ChiropractorGen. PractitionerInternistSurgeonOther MDsNon-physicians (physical therapy)
802322241824
792136312137
Source: Abstracted from Dean and Schmidts, 1992.
"Chiropractic therapy is almost wholly hands-on care. There is a nominal use of
auxiliary services, no to little use of drugs, and little hospitalization. Payments to
chiropractors for services they provide is 80% or more of the total cost of care.
For physician management of low-back pain the proportions are virtually reversed.
Prescription drugs, laboratory tests, referrals to specialists, and hospital in-patient
care leads to a four or five fold increase in total health care costs of the physician's
own billing for medical services". (Manga et al. 1993, p. 80)
In the USA, there have been numerous studies comparing medical versus chiropractic
management of workers compensation cases. These studies are relevant to our present analyses
inasmuch as chiropractors and medical doctors are widely regarded and actually practice as
alternative providers in the sense shown in Figure 2. An injured worker treated by a chiropractor
generally does not have to visit a medical doctor for care, and vice-versa, precisely the situation in
which we ought to discover which of the two professions is the more cost-effective. A recent
review of the many studies in the USA and elsewhere demonstrates that chiropractic management
is clearly the more cost-effective, (Manga et al. 1993, Chapter 5)
In a recent, better designed study by Jarvis et al. (1991), the cost per case of back injuries in
claims with identical diagnostic ICD-9 codes managed by chiropractors and medical doctors was
compared. The data are from the Workers Compensation Fund of Utah for cases starting in the
calendar year 1986 and ending in early 1989. Surgical cases, cases treated by both MDs and DCs
(crossovers), and cases treated by non-MDs or non-DCs were excluded from the study. The use
35
of ICD-9 codes is an attempt to establish comparability of patients exclusively managed by MDs
or DCs. Only those specific ICD-9 categories containing at least 50 cases treated by MDs and
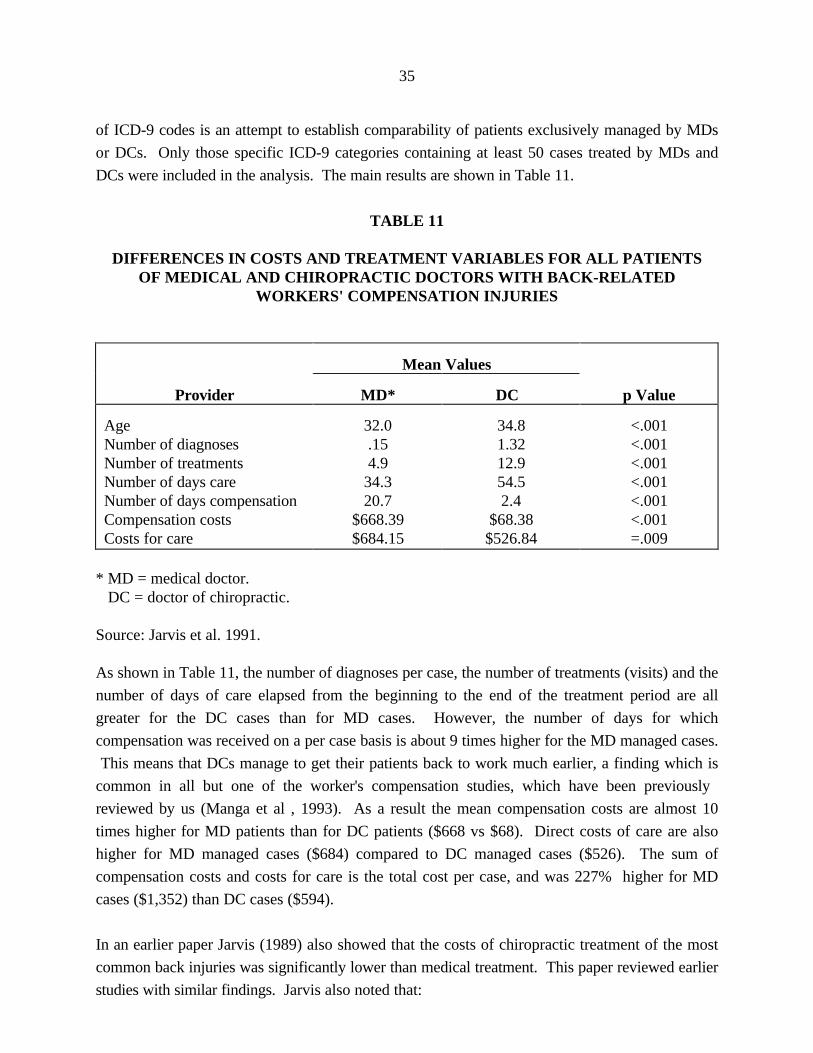
DCs were included in the analysis. The main results are shown in Table 11.
TABLE 11
DIFFERENCES IN COSTS AND TREATMENT VARIABLES FOR ALL PATIENTSOF MEDICAL AND CHIROPRACTIC DOCTORS WITH BACK-RELATED
WORKERS' COMPENSATION INJURIES
Mean Values
Provider MD* DCHH p Value
AgeNumber of diagnosesNumber of treatmentsNumber of days careNumber of days compensationCompensation costsCosts for care
32.0.154.9
34.320.7
$668.39$684.15
34.81.3212.954.52.4
$68.38$526.84
<.001<.001<.001<.001<.001<.001=.009
* MD = medical doctor.H DC = doctor of chiropractic.
Source: Jarvis et al. 1991.
As shown in Table 11, the number of diagnoses per case, the number of treatments (visits) and the
number of days of care elapsed from the beginning to the end of the treatment period are all
greater for the DC cases than for MD cases. However, the number of days for which
compensation was received on a per case basis is about 9 times higher for the MD managed cases.
This means that DCs manage to get their patients back to work much earlier, a finding which is
common in all but one of the worker's compensation studies, which have been previously
reviewed by us (Manga et al , 1993). As a result the mean compensation costs are almost 10
times higher for MD patients than for DC patients ($668 vs $68). Direct costs of care are also
higher for MD managed cases ($684) compared to DC managed cases ($526). The sum of
compensation costs and costs for care is the total cost per case, and was 227% higher for MD
cases ($1,352) than DC cases ($594).
In an earlier paper Jarvis (1989) also showed that the costs of chiropractic treatment of the most
common back injuries was significantly lower than medical treatment. This paper reviewed earlier
studies with similar findings. Jarvis also noted that:

36
"One seventh of all claims were back injury claims. One thirteenth of all claims
were treated by chiropractors, the second largest professional group treating
industrial claims. Chiropractors treated nearly half of all back injury claims, yet
those claims make up only 28.8% of the back injury claim costs". (Jarvis, 1989, p.
75).
The potential for shifting patients from MDs to DCs and thereby saving on health care cost and
workers= compensation costs is very significant.
As stated before there are numerous other US studies comparing MD and DC management of
workers compensation cases and there is an extensive and recent review of this literature (Manga
et al, 1993). Suffice to say, all but one of about 20 studies support the findings reported above.
A recent study focussing on patients with low-back pain covered by Metropolitan Life, found that
average outpatient charges per claimant by DCs was $416 and by MDs the average charges were
$542 for outpatients treated in physician offices (i.e. no hospitalization). (Mushinski, 1995).
In another recent study specially relevant to our analysis Schifrin, who is both an economist and a
clinical professor of preventive medicine, evaluated mandated health insurance coverage for
chiropractic treatment, an idea similar to the OCA=s current proposal to the Ministry of Health of
Ontario. After a thorough review of the empirical literature on the subject, he concluded that Aa
fair interpretation of the evidence accumulated to date indicates that the impact of chiropractic
mandates comes close to the Abest case@ scenario of low costs and high benefits. Accordingly, the
continuation of mandated chiropractic provider services in health care appears both reasonable
and sound. It is a cost-effective provision in health insurance, and one that also serves the
important goal of health care cost containment@. (Schifrin, 1992).
Chiropractors have also been found to be cost-effective in the one comparison published from a
managed care setting for managing back or neck pain (Mosley et al, 1996). Analysis of claims
over a one-year period in a Louisiana HMO in which patients were permitted direct access to
either a primary care gatekeeper physician or a participating chiropractor revealed comparative
data shown in Table 12.

37
TABLE 12
CHIROPRACTORS VERSUS MEDICAL PRACTITIONERSIN A MANAGED CARE SETTING
ItemChiropractic
PatientsMedicalPatients p value
Rate of imaging (%)
Imaging cost/patient
Prescriptions/patient
Surgical cases (%)
Total cost per patient
4.9
$30.49
1.1
2.5
$539.33
16.5
$94.27
2.3
2.5
$774.06
0.001
0.001
0.001
0.002
Source: Mosley et al. (1996, p. 281).
It is evident from Table 12 that, even in the cost-controlled environment of an HMO, medical
patients are prescribed more drugs for their conditions and exposed to more diagnostic imaging
tests. The total costs per chiropractic patient is 70% of that for medical patients. The NMS
conditions included in this analysis were back and neck pain ICD-9 codes 720 to 724. The
authors concluded that Achiropractic care was substantially more cost-effective than conventional
care, yet had similar clinical outcomes for back and neck pain@ (Mosley et al. 1996, 281).
Interestingly, the authors also noted that Athe number of visits to chiropractors was fewer than
previously reported. We believe that this result can be explained by our pre-certification
requirements@ (Mosley et al, 1996, 281). Another contributing factor might be that in this
managed care plan patients see chiropractors directly and earlier than under other insured and
uninsured environments.
There are two studies that are inconsistent with the rest of the research in that they do not report
reduced cost for patients choosing chiropractic care. Interestingly, they both have significant
design problems from an economist=s point of view, and they illustrate the importance of fully
accounting for all the costs of care and employing proper methodological, analytical and statistical
approaches.
Carey et al (1995) found outpatient costs per episode were lowest in a group-model HMO for
primary care providers and highest for urban chiropractors and orthopaedists. The reason for the
high cost for chiropractic care was the larger number of visits for chiropractic episodes.
Chiropractic managed patients however reported a higher degree of satisfaction with their care

38
than medically managed patients.
The study has these limitations. Firstly and very importantly, only out-patient costs and not total
costs per episode were considered in this study. Secondly neither the mix of diagnoses nor the
severity of the cases were known. Thirdly charges rather than actual payments were used to
estimate costs. Payments are often substantially less than charges, and discounting is typically
larger for chiropractors than for medical doctors. Fourthly the study did not consider the co-
morbidities often associated with low-back pain, nor did it separate acute from chronic cases,
probably because many medical and chiropractic physicians often do not record this information.
Chronic cases necessarily imply both longer episodes and more visits and hence higher costs.
Finally the data for this study are drawn from a localized area in North Carolina and a very small
sample. This study may be valuable in some of its other findings, but its economic conclusions are
flawed.
Shekelle et al (1995) have also compared the cost of services from different health care
professionals for management of episodes of back pain, including the services of chiropractors,
general medical practitioners, medical specialists, osteopaths and others. This was potentially an
important study as it comes from the RAND Corporation and was published in the peer reviewed
journal Spine. Using data from the RAND Health Insurance Experiment it finds that chiropractic
services are not less costly than most general practitioner services per episode of back pain.
However the authors acknowledge a number of methodological problems and admit their inability
to explain some surprising findings, such as the fact that DC patients had the highest prescription
drug costs per episode of back pain. We have reviewed this study carefully and conclude that it
does not present reliable evidence or conclusions, for reasons we now explain..
Firstly, while the paper was published recently, the data used in the analysis comes from a study
undertaken 24-16 years ago. Medical technologies and costs for the diagnosis and treatment of
back pain have changed markedly since that time. Secondly the sample is small, there were very
large geographic variations, the causes of these are not known, and it is acknowledged by the
authors that the results are not generalizable. Indeed, in four of the six sites of the study,
chiropractors were the lowest cost providers of care per episode of back pain.
Our next concern is that the data as presented appear to be inaccurate. We summarize this
concern in Table 13, which duplicates and expands Table 1 in this study. Columns 1-4 are from
Shekelle et al, we have added Columns 5-7. The figures in Column 3 (number of visits) should be
equal to Column 1 (number of episodes) multiplied by Column 2 (mean number of visits per
episode). They are not, and no explanation is given. There are large discrepancies that invalidate

39
the analysis. It seems the discrepancies are probably due to referrals from one category of
provider to others for care. If so that represents a very significant problem in a cost analysis. It
may be that many of the visits under >other= are to physical therapists on referral from a general
practitioner. If so, those costs per episode should be aggregated with the costs of the referring
physician. Referrals and their costs are not discussed by Shekelle et al, which is surprising given
their central importance in a cost analysis.
Yet another methodological problem is found in the definition of the fundamental unit for the cost
comparison, an >episode of back pain=. In this study it is decided that, if the patient has had 3
months without care and then seeks treatment, there is a new episode of back pain. This
overlooks the different management patterns of different health professionals. A general medical
practitioner may see a patient 1 or 2 times then tell the patient to rest and prescribe medication. If
the patient returns 4 months later that is said in this study to represent a separate episode of back
pain. Under chiropractic management the same patient would typically have a course of
chiropractic treatments, and there would likely not be a space of 3 months between these
treatments and a visit 4 months later. For such a patient, in this study, the cost of medical care
would be spread over 2 episodes of back pain, whereas the cost of chiropractic care would be
related to 1 episode of back pain. If total costs of medical care and chiropractic care were the
same, this study would report the chiropractic care as being twice as costly because of the
definition of episode of back pain.
Finally there are problems with attribution of costs. In Table 13 the provider category Other, as
already suggested, presumably includes physical therapists. Based upon the figures reported by
Shekelle et al in Columns 1 and 2, one would expect a total number of visits of 413, as shown by
us in Column 6. However 1451 visits are reported (Column 3), a discrepancy of 1038 (Column
7). If these visits were rendered on referral from a general practitioner. Their costs should be
aggregated into GP costs per episode. More problematic still are double attribution errors.
Shekelle et al were puzzled by the observation that in some chiropractic episodes of care, during
which time no provider other than a chiropractor was requesting reimbursement for services,
patients were purchasing prescription medications for up to several months. They attribute these
costs to chiropractic management. This is surprising since the prescription must have been made
by a medical or osteopathic doctor. To attribute these costs to chiropractic management creates a
double attribution cost problem.

40
TABLE 13
MEAN NUMBER OF VISITS PER EPISODE AND MEANCOST PER VISIT, BY PROVIDER TYPE(STANDARD ERROR IN PARENTHESIS)
Provider No. ofEpisodes
(1)
Mean No.of Visits per
Episode
(2)
No. ofVisits
(3)
Mean Costper Visit
(4)
CalculatedMean No. of
Visits perEpisode
(5)
CalculatedNo. of Visits
(6)
DifferenceBetween No.
of Visits(3-6)(7)
Chiropractor 412 10.4(0.67) 5,335 $19.45(0.15) 12.9 4,285 1,050
GeneralPractitioner
262 2.3(0.26) 807 $20.21(1.93) 3.1 603 204
Orthopaedist 85 5.0(0.8) 456 $38.53(4.16) 5.4 425 31
Internist 60 3.4(0.67) 235 $21.85(1.05) 3.9 204 31
Osteopath 72 5.3(1.32) 510 $22.18(0.66) 7.1 382 128
Other 129 3.2(0.53) 1,451 $37.66(2.16) 11.2 413 1,038
Source: Shekelle et al. (1995) with the last 3 columns added by us.
(5) Number of visits reported by Shekelle et al divided by number of episodes.(6) Number of episodes multiplied by mean number of visits per episode reported by Shekelle et al.(7) The number of visits reported by Shekelle et al minus the calculated number of visits.
We now present studies from other countries that also support the cost-effectiveness of
chiropractic management of NMS conditions. They also offer support for the notion that cost-
shifting must be recognized and incorporated in the design of public and private insurance
systems.
FOREIGN STUDIES
Meade et al (1990, 1995) undertook one of the most discussed randomized controlled clinical
trials, a trial comparing chiropractic with hospital outpatient treatment of mechanical low-back
pain in Britain. They found that chiropractic treatment was more effective than hospital
outpatient management, especially for patients with severe or chronic back pain. The differential
benefit was evident at 6 months, 1 year, and 2 years since treatment. With respect to cost-
shifting, Meade et al noted that:
41
"Some 300,000 patients are referred to hospital for back pain each year, of whom
about 72,000 would be expected to have no contra-indications to manipulation. If
all these patients were referred for chiropractic instead of hospital treatment the
annual cost would be about ,4m. Our results suggest that there might be a
reduction of some 290,000 days in sickness absence during two years, saving
about ,13m in output and ,2-9m in social security payments. As it was not clear,
however, that the improvement in those treated by chiropractic was related to the
number of treatments the cost of essential chiropractic treatment might be
substantially less than ,4m. The possibility that patients treated in hospital would
need more treatment during the second year than those treated by chiropractic (see
above and Table VI) also has to be borne in mind. There is, therefore, economic
support for use of chiropractic in low-back pain, though the obvious clinical
improvement in pain and disability attributable to chiropractic treatment is in itself
an adequate reason for considering the use of chiropractic" (1990, p.1435).
In the follow-up study of the same patients Meade et al report that "at three years the results
confirm the findings of an earlier report that when chiropractic or hospital therapists treat patients
with low-back pain as they would in day-to-day practice those treated by chiropractic derive more
benefit and long-term satisfaction than those treated by hospitals." Unfortunately, beyond this
suggestion, Meade et al. did not estimate the longer term savings from the greater long-term
effectiveness of chiropractic care.
In the UK, the number of chiropractors has doubled in the last 5 years. They are increasingly
recognized by the National Health Service, and the British Medical Association and Royal College
of General Practitioners have openly supported the trend of increased medical referral of patients
to chiropractors. Managers in the National Health Service are increasingly interested in drug-free
treatments and are very mindful of the cost-effectiveness of alternative therapists (Jones, 1996).
An Australian study by Ebrall (1992) is also pertinent to our analysis. He analysed two well
matched samples of 1996 workers= compensation cases solely managed by either a chiropractor or
a medical practitioner. The overall cost results are presented in Table 13.

42
TABLE 14
AVERAGE PAYMENTS PER CLAIMANT
Chiropractor$
MedicalPractitioner
$
All payments Compensation payment Non-compensation payment Provider payment Other payments
963.47392.02571.45369.01202.44
2,308.101,569.93738.17209.60528.57
N.B. (provider + other) = non-compensation payments (non-compensation + compensation) = all payments
Source: Ebrall (1992, p. 50).
The total cost per case for DC managed cases was $963 versus $2,308 for MD managed cases.
Note that while the average provider payment for DCs ($369) exceeds that for MDs ($209) the
reverse is true for other payments (e.g. drugs, tests, referrals, etc.) so that the total non-
compensation payments for the average DC managed cases is significantly lower ($571) than that
for MD managed cases ($738). There is a large difference in compensation payments, a finding in
virtually all WCB studies. The higher compensation costs for MD managed cases is due to the
much higher loss of days at work. Ebrall also found that a greater number of patients managed by
MDs became chronic (11.6%) compared to patients managed by DCs (1.9%). The greater
tendency to chronicity has obvious implications direct and indirect.
Ebrall found that the average number of visits per chiropractic workers= compensation patient was
14.25 in Victoria, Australia. This figure is slightly higher than the range of 9 to 14 for such cases
in United States and Canada. These rates are lower, however, than the treatment rates of similar
patients by physiotherapists on medical referral (Patijn et al, 1991; Jochumsen, 1991).
Ebrall estimated that Aif the Victorian chiropractors managed a similar proportion (40%) of these
injuries as do Oregon (USA) chiropractors, then the direct savings within the Victoria workcare
scheme for this period (one year in 1990-91) would have been $10 million over 7,482 claims@.
Analogous figures in Ontario would be many times this figure. Ebrall used the figure of 40%
because this was the utilization rate prevailing in some jurisdictions in the USA. Higher utilization
(substitution) would increase estimated savings.

43
In our 1993 study we offered evidence that medical management led to more iatrogenic
complications than chiropractic management of back pain. These adverse outcomes add to the
cost of health care. Indeed it is very important to note that no study has ever included the costs
that either medical or chiropractic patients incur after their treatment, as distinct from their
episodes, Aends@ - i.e. when patients no longer see their caregiver but their problem continues.
The cost of poor outcomes and iatrogenic complications should be added to the cost of care,
whoever happens to be the caregiver. If this more comprehensive kind of costing were to be done
by taking a longer view of an episode of NMS conditions, we estimate that medically-managed
cases would be found to have disproportionate additional costs. A proportion of patients visiting
chiropractors are former patients of medical doctors whose conditions were not resolved (i.e.
their episode has in fact not ended). Medical care has ended but the patient=s episode continues.
We have not come across a single study that incorporates the problem of unsuccessful treatment
in an analysis of the costs of care, or that limits the comparison of costs only to cases that were
successfully treated or resolved.
THE ECONOMICS OF ENHANCED COVERAGE OF CHIROPRACTIC IN ONTARIO
We have shown that there is substantial and solid evidence favouring a policy of enhanced OHIP
coverage of chiropractic services in Ontario, 96% of which are for neuromusculoskeletal (NMS)
disorders. Just what form this enhancement should take is the subject of this section. How
exactly should greater OHIP coverage be implemented?
We presume that a fee-per-visit modality of paying chiropractors will be maintained. Fee-per-visit
is very different from the fee-for-service system applicable to medical doctors under which the
practitioner can bill for several services rendered during a single visit. The typical bill per visit
from an MD is several times that of the OHIP fee-per-visit for chiropractors. Indeed the latter is
even lower than the OHIP fee-per-visit for physiotherapists (Wells, 1994).
The Ministry of Health may also wish to use a small part of the additional funding to support
salaried or sessional positions for chiropractors in hospitals, hospital outpatient departments,
long-term care facilities, community health centres, health service organizations or comprehensive
health organizations. We made this recommendation 5 years ago (Manga et al, 1993) and it was
supported in the Chiropractic Services Review Committee Report (1994). We also recommended
a greater involvement of chiropractors in the Workers= Safety and Insurance Board. This is best
done through salaried positions. All of these recommendations constitute cost-effective
deployment of chiropractic but would account for a small fraction of the additional funding
requested by the OCA. The bulk of the new funding would of necessity involve the fee-per-visit
method of remunerating chiropractors.

44
We understand that the OCA is requesting additional coverage of $200 million by year 3 (year
2000), which would bring the total coverage to 1.5% of that year=s budget for health care
assuming that the current health care budget grows at 1.3% per year. The current coverage is
only about 0.47% of the health care budget. It is our considered view that the incremental budget
for chiropractic care is best devoted to reducing the copayment patients now pay to zero. Such
services do not have any patient copayment under Medicare in Canada. There is no reason to
perpetuate the existing perverse situation in which cost-effective and safer services are subject to
a copayment which inhibits access to them, whereas care which is less effective and safe and more
costly is offered free of any copayments. The elimination of the copayment will most certainly
meet with public approval since there is strong evidence that patients prefer chiropractic over
medical management of NMS conditions. An annual cost ceiling per patient is a legitimate
control device and it should be reset in the light of the new financing arrangements.
The next best proposal in our view is a package in which (a) the copayment per visit for the
second visit onwards is about 20% with the OHIP fee being 80% of the fee (b) the first visit is
free, (c) the annual cost ceiling per patient should be renegotiated in light of these new financial
arrangements. Incidentally the best way to determine the ceiling is by first negotiating the
maximum number of visits OHIP is liable for and then costing out this number of visits.
In our view this is a practical proposal and is fairly easy to administer. Very importantly, making
the first visit free would dramatically reduce the deterrent effect of the current financing of
chiropractic care in which the first visit is invariably the most expensive for patients.
In 1970, OHIP paid 83% ($5) of the average fee-per-visit of $6 and the patient paid 17% ($1).
OHIP currently pays 33% of the fee. The increase in the Consumer Price Index since 1970 is
about 342% and the average fee-per-visit increased by 331%. The patient copayment has
increased 5 times faster than the rate of inflation since 1970.
The next best solution might be that proposed by the OCA itself in its 1996 submission to the
government, that OHIP cover 75% of the fee for most patients, as it used to, and the entire fee for
seniors and patients on social assistance. (OCA, 1996). This proposal would have the difficulty of
requiring patients to declare and presumably prove that they are on social assistance.
Furthermore, some patients are on social assistance for only a limited or short duration. These are
not insurmountable problems in light of the modern information technologies available in health
care administration, but do however add a degree of complexity to the OCA=s reform proposal. A
25% copayment is not an insignificant deterrent to the use of chiropractic care. The OCA
proposal will not adequately address the barrier to access of the significant number of the

45
population we might characterize as the working poor and those at the lower end of the middle
class.
We also presume that in the event that copayments are in fact maintained under the enhanced
coverage of chiropractic care that current private insurance coverage will be maintained to cover
costs for those patients - presently 10% - whose costs of treatment exceed the annual ceiling.
Thus in our second best option and the OCA=s proposal, financing from OHIP, patients and
private insurance is envisioned. Worker=s Safety and Insurance Board cases will be paid for in the
same manner as they are now.
Our recommendation is based on the analysis and arguments summarized in Table 15. The first
row is the status quo and is simply the basic formula that shows that the current budget or
expenditure for chiropractic care can be thought of as the number of patients (P) multiplied by the
average number of visits (V) per patients, all multiplied by the average fee (F) per visit. The latter
is the sum of the OHIP fee and the copayment paid by patients. Enhanced coverage will of course
change the values of each of these parameters. We consider 7 propositions as shown in Table A.
The first proposition entails raising the OHIP fee alone and leaving intact the current copayment.
The likely outcome of this initiative is no or little change in the number of patients who visit
chiropractors and an increase in the average number of visits per patient. Consequently, there
would be hardly any improvement in accessibility and at best a small improvement in health
outcomes. The savings in health care costs are likely to be negative. In short, this proposition
does not serve the public interest. Its main effect would be to raise the incomes of chiropractors.
Propositions 2, 3, and 4 can be considered together. As shown in Table 15, the greater the
reduction in the level of copayment, while keeping the overall fee level constant, the greater is the
increase in the number of patients visiting chiropractors. Correspondingly, the OHIP fee must rise
to allow for the reduction in copayments. The average number of visits may rise at first but if the
increase in patients rises significantly, we can expect the average number of visits per patient to
decrease. This is due to earlier patient self-referral, medical referrals, and patients making
chiropractors their first choice of caregiver for NMS conditions and injuries. If patients visit
chiropractors earlier when their conditions are more acute (rather than as currently, when a large
proportion present themselves with chronic conditions) it is likely they will not have to visit
chiropractors as frequently on average. This would yield dividends both in terms of a reduction in
health care costs and better health status of the patients.
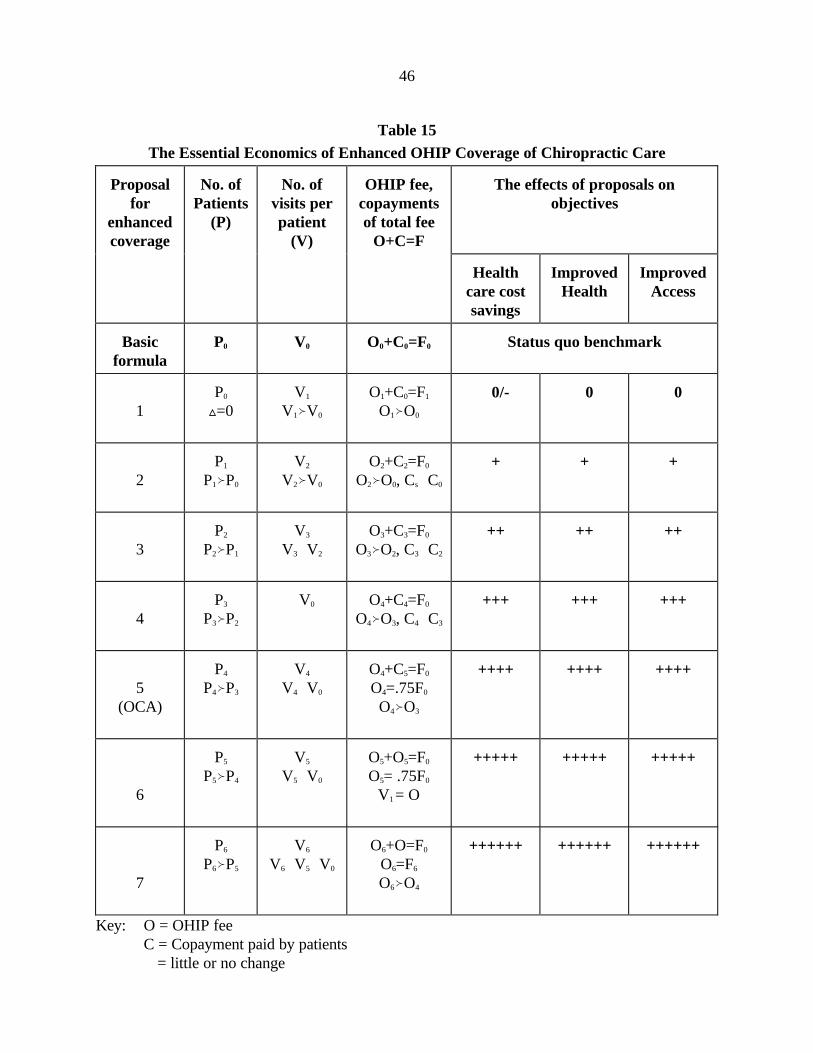
46
Table 15The Essential Economics of Enhanced OHIP Coverage of Chiropractic Care
Proposalfor
enhancedcoverage
No. ofPatients
(P)
No. ofvisits perpatient
(V)
OHIP fee,copaymentsof total fee
O+C=F
The effects of proposals onobjectives
Healthcare costsavings
ImprovedHealth
ImprovedAccess
Basicformula
P0 V0 O0+C0=F0 Status quo benchmark
1P0
ª=0V1
V1™V0
O1+C0=F1
O1™O0
ÑÑ0/- ÑÑ0 ÑÑ0
2P1
P1™P0
V2
V2™V0
O2+C2=F0
O2™O0, Cs—C0
+ + +
3P2
P2™P1
V3
V3—V2
O3+C3=F0
O3™O2, C3—C2
++ ++ ++
4P3
P3™P2
ÑV0 O4+C4=F0
O4™O3, C4—C3
+++ +++ +++
5(OCA)
P4
P4™P3
V4
V4—V0
O4+C5=F0
O4=.75F0
O4™O3
++++ ++++ ++++
6
P5
P5™P4
V5
V5—V0
O5+O5=F0
O5= .75F0
V1 = O
+++++ +++++ +++++
7
P6
P6™P5
V6
V6—V5—V0
O6+O=F0
O6=F6
O6™O4
++++++ ++++++ ++++++
Key: O = OHIP feeC = Copayment paid by patientsÑ = little or no change

47
+ = Improvement in the attainment of the objective- = Failure to meet the objective
48
Proposition 5 is what the OCA proposed to the Ministry of Health. There is no doubt that it
would lead to very substantial gains in each of the three objectives of accessibility, improved
health and health care cost savings. A more practical solution may be to make the first visit to
chiropractors free and impose a copayment for second and subsequent visits only, as was
described above. This is Proposition 6 in Table 15. Such a scheme could be expected to more
than double the number of patients visiting chiropractors. We believe that going this further step
of eliminating the copayment entirely will lead both to a higher level of patients visiting
chiropractors and a further reduction in the average number of visits per patient. Under
Proposition 7 of Table 15 the flow of patients to chiropractors will naturally be maximized and
patients will seek chiropractic care as soon as they see fit or necessary. This proposition allows
the greatest freedom of choice of caregivers on the part of patients, since medical care and
chiropractic care would be treated almost equally under OHIP. We say Aalmost@ because there
are no ceilings on the number of visits nor total costs per patient for medical management under
OHIP but we do envision such ceilings for chiropractic care. Nonetheless, our proposal radically
alters the set of choices for patients. A high proportion of patients choose to see chiropractors
only when medical and/or other treatments fail to resolve their problems. The levels by which the
three objectives are met are therefore somewhat greater under Proposition 7 than under
Proposition 6.
The essential economic argument can be stated succinctly. In order for the Ministry of Health to
maximize the savings in health care costs, it should maximize the flow of patients with NMS
conditions and injuries to chiropractors. This can best be done with no copayment. It is simply
illogical to impose a copayment - a user fee that deters access - on care that has been proven to
be cost-effective and safe while making alternative care that is not as cost-effective nor as safe
available for >free=. The current situation fails to conform with the principle illustrated in Figure 2
earlier, that the government should make the most cost-effective matching between specific health
care needs of the public and recognized, available health care providers.
The only argument for imposing a copayment on cost-effective care is lack of fiscal capacity. We
cannot see how such an argument can apply in this matter. If affordability was in fact a real
constraint in accepting our recommendation of no patient copayments, then it would be wiser in
principle for the Ministry of Health to impose a medical visit copayment by patients. Since this
would violate the Canada Health Act, the next best alternative policy would be to reduce the
OHIP fee levels for medical doctors for select NMS conditions and injuries within the chiropractic
scope of practice, thus encouraging referral of patients for more cost-effective care.

49
THE POTENTIAL ECONOMIC SAVINGS FROM ENHANCEDCHIROPRACTIC COVERAGE
We now offer several estimates of how much we can reasonably expect to save in both direct
health care costs and indirect costs from the additional coverage of chiropractic services under
OHIP.
As we explained earlier, there are no data of the type suggested in Figures 2 and 3. Fortunately,
we do have the direct and indirect costs of illness by diagnostic categories for all of Canada for
the years 1993 and 1986 from Health Canada (Wigle et al, 1993; Moore et al, 1997). The
relevant figures for 1986 are reported in Table 15. We note that indirect costs for
musculoskeletal (MS) conditions are 4.36 times greater than the direct costs and that for injuries
indirect costs are 3.24 times greater than the direct costs (ie. including drugs, medical, and
hospital care only). Furthermore, Wigle et al. (1993, p.1) note that in 1986 in terms of total costs
Amusculoskeletal disorders and injuries ranked second and third@ among all diagnostic categories,
and were exceeded only by cardiovascular diseases. This ranking remained the same in 1993
(Moore et al. 1997, p.11). Musculoskeletal diseases alone accounted for 35.2% of all the long-
term disability costs and 10% of short-term disability costs (Moore et al., 1997, p.32-33).
Table 16 contains data for the year 1993 using the same categories and definitions of direct and
indirect costs. As far as we know, these are the only such data available for the direct and indirect
costs for Canada, and there are no comparable for the years since 1993.
Table 17 shows the growth in both direct and indirect costs from 1986 to 1993 for each of the 3
diagnostic categories. It is apparent that both the direct and especially the indirect costs of
musculo-skeletal conditions have grown much more rapidly than the direct and indirect costs for
all diseases in Canada.
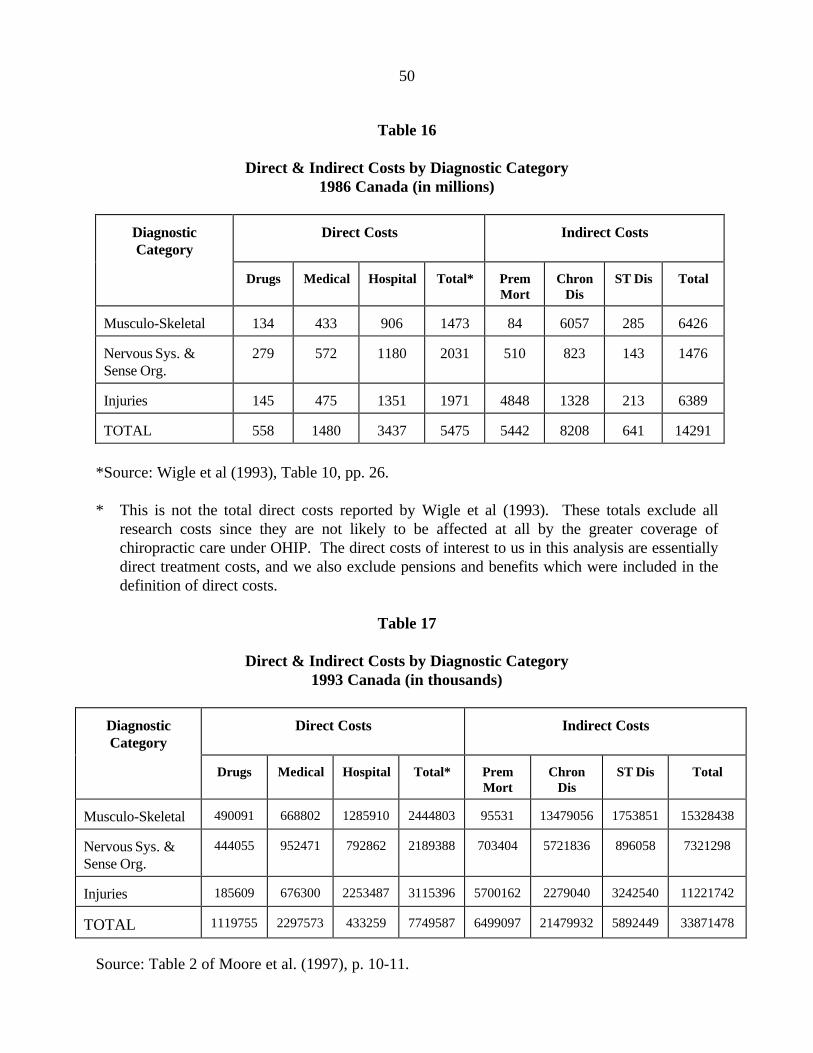
50
Table 16
Direct & Indirect Costs by Diagnostic Category1986 Canada (in millions)
DiagnosticCategory
Direct Costs Indirect Costs
Drugs Medical Hospital Total* PremMort
ChronDis
ST Dis Total
Musculo-Skeletal 134 433 906 1473 84 6057 285 6426
Nervous Sys. &Sense Org.
279 572 1180 2031 510 823 143 1476
Injuries 145 475 1351 1971 4848 1328 213 6389
TOTAL 558 1480 3437 5475 5442 8208 641 14291
*Source: Wigle et al (1993), Table 10, pp. 26.
* This is not the total direct costs reported by Wigle et al (1993). These totals exclude allresearch costs since they are not likely to be affected at all by the greater coverage ofchiropractic care under OHIP. The direct costs of interest to us in this analysis are essentiallydirect treatment costs, and we also exclude pensions and benefits which were included in thedefinition of direct costs.
Table 17
Direct & Indirect Costs by Diagnostic Category1993 Canada (in thousands)
DiagnosticCategory
Direct Costs Indirect Costs
Drugs Medical Hospital Total* PremMort
ChronDis
ST Dis Total
Musculo-Skeletal 490091 668802 1285910 2444803 95531 13479056 1753851 15328438
Nervous Sys. &Sense Org.
444055 952471 792862 2189388 703404 5721836 896058 7321298
Injuries 185609 676300 2253487 3115396 5700162 2279040 3242540 11221742
TOTAL 1119755 2297573 433259 7749587 6499097 21479932 5892449 33871478
Source: Table 2 of Moore et al. (1997), p. 10-11.

51
Table 18
Growth in Direct & Indirect Costs of Select Diagnostic Categoriesfrom 1986 to 1993 Canada (in millions)
DiagnosticCategory
Total Direct Costs Total Indirect Costs
1986 1993 %increase
1986 1993 %increase
Musculo-Skeletal 1473 2444.8 66.0 6426 15328.4 138.5
Nervous Sys. &Sense Org.
2031 2189.4 7.8 1476 7321.3 396.0
Injuries 1971 3115.4 58.1 6389 11221.7 75.6
All Diseases 27662 43617.5 57.7 47020 85122.7 81.0
Total direct costs includes expenditures for drugs, medical & hospitals. Total indirect costsincludes the costs of premature mortality, long term disability and short-term disability.
In order to derive estimates for Ontario for the year 1998, we first calculated 40% of the 1993
Canadian figures and then increased them by 8.4%, which represents the growth in direct health
costs for all health care services over the period from 1993 to 1998. This 8.4% is derived from
the known increase in expenditure from 1993 to 1997 and a further estimated increase of 1.4%
from 1997 to 1998 (CIHI, 1997). These estimates are shown in Table 18. It is likely that the
estimates for musculoskeletal conditions are below the real figures, but in the absence of good up-
to-date evidence we chose to proceed with conservative estimates.
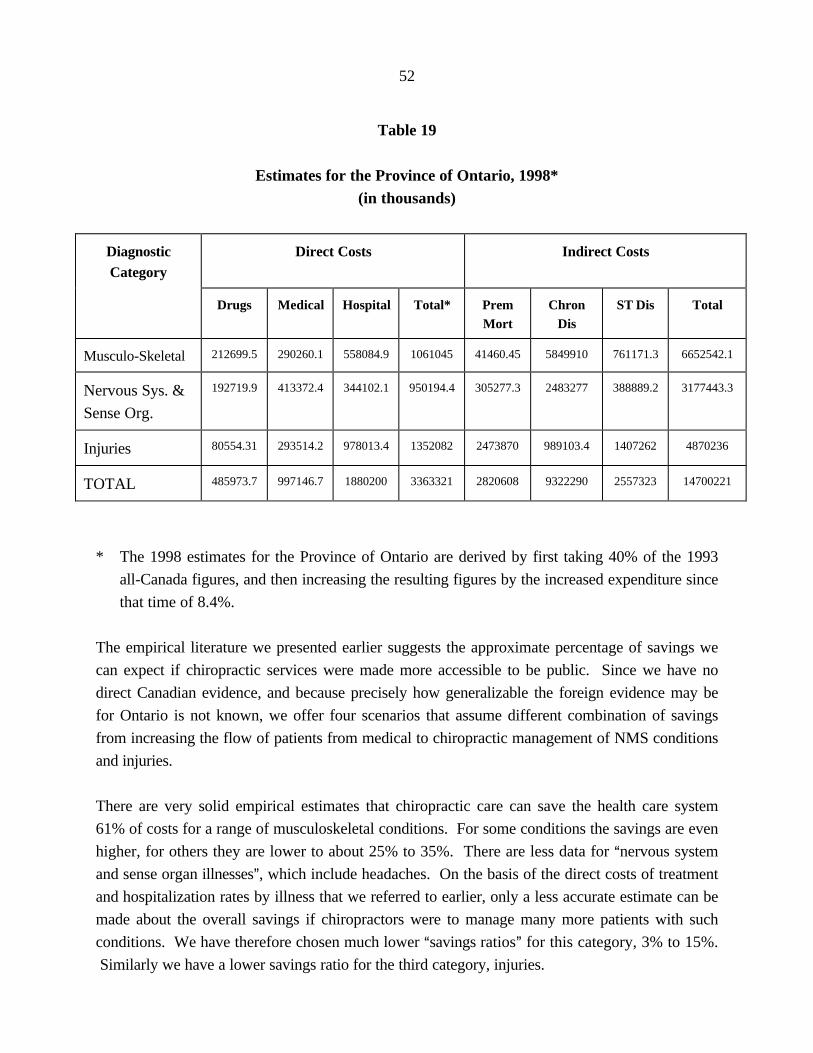
52
Table 19
Estimates for the Province of Ontario, 1998*(in thousands)
DiagnosticCategory
Direct Costs Indirect Costs
Drugs Medical Hospital Total* PremMort
ChronDis
ST Dis Total
Musculo-Skeletal 212699.5 290260.1 558084.9 1061045 41460.45 5849910 761171.3 6652542.1
Nervous Sys. &
Sense Org.
192719.9 413372.4 344102.1 950194.4 305277.3 2483277 388889.2 3177443.3
Injuries 80554.31 293514.2 978013.4 1352082 2473870 989103.4 1407262 4870236
TOTAL 485973.7 997146.7 1880200 3363321 2820608 9322290 2557323 14700221
* The 1998 estimates for the Province of Ontario are derived by first taking 40% of the 1993
all-Canada figures, and then increasing the resulting figures by the increased expenditure since
that time of 8.4%.
The empirical literature we presented earlier suggests the approximate percentage of savings we
can expect if chiropractic services were made more accessible to be public. Since we have no
direct Canadian evidence, and because precisely how generalizable the foreign evidence may be
for Ontario is not known, we offer four scenarios that assume different combination of savings
from increasing the flow of patients from medical to chiropractic management of NMS conditions
and injuries.
There are very solid empirical estimates that chiropractic care can save the health care system
61% of costs for a range of musculoskeletal conditions. For some conditions the savings are even
higher, for others they are lower to about 25% to 35%. There are less data for Anervous system
and sense organ illnesses@, which include headaches. On the basis of the direct costs of treatment
and hospitalization rates by illness that we referred to earlier, only a less accurate estimate can be
made about the overall savings if chiropractors were to manage many more patients with such
conditions. We have therefore chosen much lower Asavings ratios@ for this category, 3% to 15%.
Similarly we have a lower savings ratio for the third category, injuries.
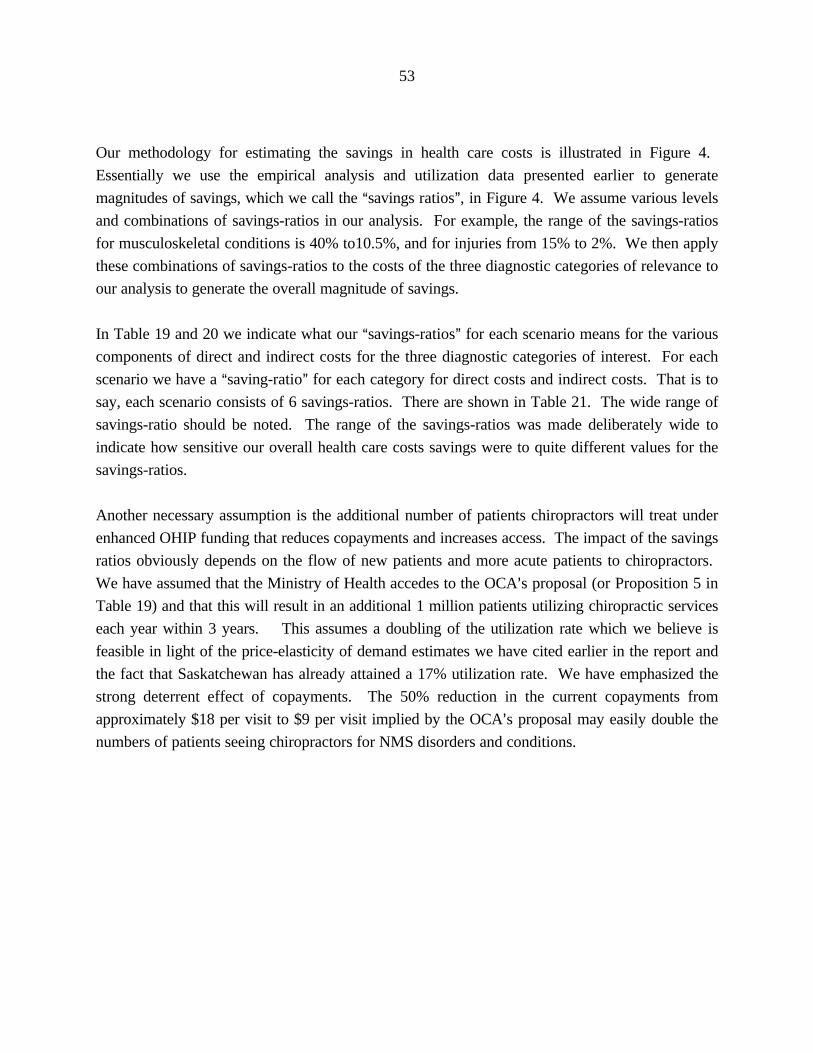
53
Our methodology for estimating the savings in health care costs is illustrated in Figure 4.
Essentially we use the empirical analysis and utilization data presented earlier to generate
magnitudes of savings, which we call the Asavings ratios@, in Figure 4. We assume various levels
and combinations of savings-ratios in our analysis. For example, the range of the savings-ratios
for musculoskeletal conditions is 40% to10.5%, and for injuries from 15% to 2%. We then apply
these combinations of savings-ratios to the costs of the three diagnostic categories of relevance to
our analysis to generate the overall magnitude of savings.
In Table 19 and 20 we indicate what our Asavings-ratios@ for each scenario means for the various
components of direct and indirect costs for the three diagnostic categories of interest. For each
scenario we have a Asaving-ratio@ for each category for direct costs and indirect costs. That is to
say, each scenario consists of 6 savings-ratios. There are shown in Table 21. The wide range of
savings-ratio should be noted. The range of the savings-ratios was made deliberately wide to
indicate how sensitive our overall health care costs savings were to quite different values for the
savings-ratios.
Another necessary assumption is the additional number of patients chiropractors will treat under
enhanced OHIP funding that reduces copayments and increases access. The impact of the savings
ratios obviously depends on the flow of new patients and more acute patients to chiropractors.
We have assumed that the Ministry of Health accedes to the OCA=s proposal (or Proposition 5 in
Table 19) and that this will result in an additional 1 million patients utilizing chiropractic services
each year within 3 years. This assumes a doubling of the utilization rate which we believe is
feasible in light of the price-elasticity of demand estimates we have cited earlier in the report and
the fact that Saskatchewan has already attained a 17% utilization rate. We have emphasized the
strong deterrent effect of copayments. The 50% reduction in the current copayments from
approximately $18 per visit to $9 per visit implied by the OCA=s proposal may easily double the
numbers of patients seeing chiropractors for NMS disorders and conditions.
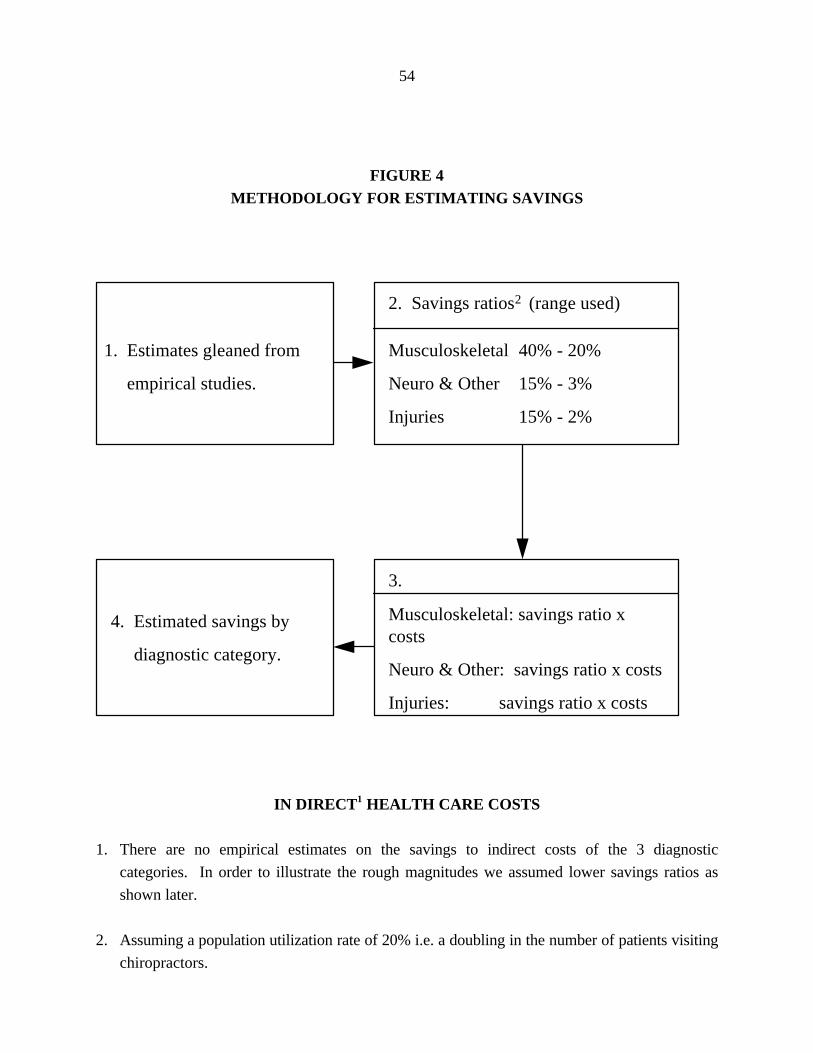
54
FIGURE 4METHODOLOGY FOR ESTIMATING SAVINGS
IN DIRECT1 HEALTH CARE COSTS
1. There are no empirical estimates on the savings to indirect costs of the 3 diagnostic
categories. In order to illustrate the rough magnitudes we assumed lower savings ratios as
shown later.
2. Assuming a population utilization rate of 20% i.e. a doubling in the number of patients visiting
chiropractors.
1. Estimates gleaned from
empirical studies.
4. Estimated savings by
diagnostic category.
2. Savings ratios2 (range used)
Musculoskeletal 40% - 20%
Neuro & Other 15% - 3%
Injuries 15% - 2%
3.
Musculoskeletal: savings ratio xcosts
Neuro & Other: savings ratio x costs
Injuries: savings ratio x costs

55
Table 20 shows the details of the resulting savings for both direct and indirect costs for each
diagnostic category. The savings ratios we have used for each of the three scenarios shown in
Table 21 can be found in Table 22. Thus, Scenario 1 assumes ratios of 40%, 15% and 15% for
the direct treatment costs for the diagnostic categories respectively assuming 1 million new
patients being seen by chiropractors. The savings in direct treatment costs under this scenario are
$769.8 million. If we assume a lower set of savings ratios (i.e. 30%, 10%, and 10%) the savings
in total direct treatment costs drops to $548.5 million as shown in Scenario 2. Under yet lower
savings-ratios in Scenario 3 of 25%, 5% and 5%, the direct savings are $380.4 million and
indirect costs are in excess of $1 billion as can be observed in the last column of Table 20.
In Table 20, we present Scenario 4 which assumes savings in direct health care costs equals the
additional $200 million required by the OCA=s proposal of enhanced coverage of chiropractic care
under OHIP. More precisely, if we assume very low - and in our opinion very unreasonably so -
savings ratios of 10.5%, 3% and 2% respectively, the total savings in direct treatment costs will
match the additional financing of chiropractic care that the OCA is requesting. It is difficult to
think that given the high rate of hospital use for some neurological conditions (eg. migraine and
other headaches) and all that they entail (drugs, diagnostic imaging, other laboratory tests, etc.)
and the high incidence and prevalence of these conditions, that chiropractic management of them
would result in a savings of a mere 3%. Even more unbelievable to us is a savings of only 10.5%
for musculoskeletal disorders which constitutes the bulk of the cases of chiropractors. Still, our
purpose for using these very low savings-ratios was to illustrate the implications of assuming a
break-even hypothesis. In calling it the Abreak-even@ scenario, we recognize that we are in fact
ignoring the savings of $795.2 million in indirect costs under this scenario.
Table 21 summarizes the assumptions we made that comprise the scenarios shown in Tables 19
and 20. It also shows the total savings under each scenarios, which are of course taken from
Tables 21 and 22.
It is apparent that under any scenario the savings in indirect costs are much higher than the
savings in direct costs. The Ministry of Health will no doubt be principally interested in net direct
health care costs savings. We conclude that these are significant on the most conservative
reasonable estimates. Savings will significantly exceed the costs of the expanded coverage of
chiropractic services under OHIP. Needless to say other scenarios can also be worked out by
applying different savings-ratios to Table 18.

56
Table 20
3 Scenarios of Savings to Direct and Indirect Costs($ thousands)
DiagnosticCategory
Direct Costs Indirect Costs
Drugs Medical Hospital Total* PremMort
ChronDis
ST Dis Total
Scenario 1
Musculo-Skeletal 85079.8 116104 223234 424417.8 0 2339964 304468.5 2661016.8
Nervous Sys. &Sense Org.
28907.98 62005.86 51615.32 142529.2 0 496655.4 77777.83 635488.67
Injuries 12083.15 44027.13 146702 202812.3 0 197820.7 281452.5 479273.14
TOTAL 126070.9 222137 421551.3 769759.2 0 3034440 663698.8 3775778.6
Scenario 2
Musculo-Skeletal 63809.85 87078.02 167425.5 318313.4 0 1169982 152234.3 1322216.3
Nervous Sys. &Sense Org.
19271.99 41337.24 34410.21 95019.44 0 248327.7 38888.92 287216.6
Injuries 8055.431 29351.42 97801.34 135208.2 0 1517220 331849.4 1849069.5
TOTAL 91137.27 157766.7 299637 548541 0 1517220 331849.4 1849069.5
Scenario 3
Musculo-Skeletal 53174.87 72565.02 139521.2 265261.1 0 877486.5 114175.7 991662.25
Nervous Sys. &Sense Org.
9635.994 20668.62 17205.11 47509.72 0 124163.8 19444.46 143608.3
Injuries 4027.715 14675.71 48900.67 67604.09 0 49455.17 70363.12 119818.29
TOTAL 66838.58 107909.3 205627 380374.9 0 1051106 203983.3 1255088.8
Key: Prem Mort = premature mortalityChron Dis = chronic disabilitySt Dis = short-term disability

57
Table 21
The Break-even Scenario($ thousands)
DiagnosticCategory
Direct Costs Indirect Costs
Drugs Medical Hospital Total* PremMort
ChronDis
ST Dis Total
Scenario 4
Musculo-Skeletal 22333.4 30477.3 58599 111409.7 0 584991 76117 661100
Nervous Sys. &Sense Org.
9635.994 20668.62 17205.11 47509.72 0 74498 11667 86165
Injuries 2416.629 8805.426 29340.4 40562.46 0 19782 28145 47927
TOTAL 34386.1 59951.3 105144.5 149482.9 0 679271 115929 795200
Table 22
Assumptions About Savings Radios under each of the 4 Scenarios
DiagnosticCategory
Total Direct Costs Total Indirect Costs
Scenario1
Scenario2
Scenario3
Scenario4
Scenario1
Scenario2
Scenario3
Scenario4
Musculo-Skeletal.40 .30 .25 .105 .30 .20 .15 .10
Nervous Sys. &Sense Org.
.15 .10 .05 .03 .20 .10 0.05 .03
Injuries.15 .10 .05 .02 .20 .10 .05 .02
Total savings inmillions
769.8 548.5 380.4 199.5 3037 1849 1255.1 795.2
Interpretation: For Scenario 4 we assume that the enhanced coverage of chiropractic care willpermit a saving of 10.5% (0.105) of the direct treatment costs of musculo-skeletal disorders; 3%

58
(0.03) of nervous system diseases and illnesses, and 2% (0.02) of injuries. The total savings indirect treatment costs is about $200 million.
The savings indicated in Tables 20, 10 and summarized in Table 22 are huge. Under Scenario 1
for instance, a savings of $770 million in direct costs means a savings of $770 per patient. This is
possible because of the high costs of laboratory diagnosis, imaging, surgery and hospitalization.
The savings for one patient for whom back fusion surgery is avoided may be $18,000 or more.
Put another way, the additional $200 million in funding for chiropractic care amounts to about
$20 per capita for a saving of about $77 per capita. Our most conservative estimate of savings in
direct health care costs is $380 million, that is, less than half of the savings under Scenario 1. Our
middle estimate is $548 million. We are confident that very significant savings in direct treatment
costs can be realized under the enhanced coverage of chiropractic care under OHIP. We can only
wish that far more direct and detailed data were available for this analysis, and wish to encourage
the Ministry of Health to help establish the desired data and initiate the kind of research suggested
earlier.
Finally, it should not be assumed from the foregoing that we think the indirect costs of the three
diagnostic categories are less important. No health economists would adopt this view. It is the
total savings, including both direct and indirect costs, that should determine the wisdom or
otherwise of a specific health care reform. Governments, more than anyone else need to take a
more comprehensive view of the benefits and costs of any reform. After all, much of the indirect
costs eventually translates into a direct burden for one or another ministry of the Government of
Ontario (for eg. health, labour, social services, housing, finance, etc.) . From this wider
perspective the case for the proposed reform becomes particularly strong and convincing.
CONCLUSION
The burden of much of the previous sections was to point out that chiropractic and medical
management of many NMS disorders and injuries are substitutes. We recognize that there are
complementarities between the two professions as well. We have presented much evidence that
NMS disorders and injuries are very prevalent and costly. They cause a disproportionate amount
of chronic illness and disability. We then presented sophisticated studies and analyses, especially
those by Stano and Smith, demonstrating that chiropractic care is significantly more cost-effective
than medical care within a common scope of practice. We also cited evidence favouring
chiropractic in terms of safety and patient preference.
All of these observations point to a clear need for greater coverage of chiropractic care under
private and public insurance systems. This will assure gains in both efficiency (producing health

59
care services at the lowest costs) and effectiveness (getting the best health outcomes per dollar
spent). Furthermore, greater insurance coverage will also mean greater access to chiropractic
care, especially for population groups who are presently deterred from visiting chiropractors for
financial reasons. We presented evidence that the poor, lower middle class and the elderly were
significantly less likely to access and use chiropractic care even though they suffer from a greater
prevalence of NMS disorders. This no doubt contributes to the high use among these groups of
medical services, drugs and hospital care. High out-of-pocket payment is a major deterrent to the
utilization of chiropractic services. The patients are steered to medical doctors resulting in higher
costs and, often, poorer health outcomes.
Many Ontario patients, with their histories of NMS disorders, constitute Aliving evidence@ of the
overall statistical picture we have established in this report. The testimonials of two are appended
to the Chiropractic Services Review Committee Report. The Ministry of Health could find many
others who can offer anecdotal evidence corroborating our analysis. As we pointed out earlier,
four out of five patients of chiropractors have had their problems for more than six months and
have typically had medical and/or physiotherapy care before their visit to the chiropractor. This
fact alone calls for the kind of reform we have analyzed here.
Increasing the funding for chiropractic care is consistent with the Government of Ontario=s
Business Plan of 1997 which called for reallocating resources for evidence-based frontline
services in a community setting. This initiative substitutes community-based services for
institutional and hospital care, and emphasizes getting Athe right care from the right provider at
the right time.@ It is consistent with the government=s emphasis on primary health care reform and
its effort to move away from the fee-for-service method of reimbursement. The policy would
assist the WSIB to reform its management of neuromusculoskeletal disorders in the workplace.
The literature and clinical guidelines on back pain, neck pain and headache indicate a fundamental
change in managing such conditions from a biomedical model (extensive use of diagnostic testing,
drugs, bed rest, physiotherapy) to a biopsychosocial model (use of early activities/exercise, patient
education, spinal manipulation, over-the-counter drugs and restoration of function). Finally, it
would allow chiropractic services to be better integrated into the larger health care delivery
system, especially if some of our recommendations pertinent to the wider use of chiropractic are
implemented. The evidence is that chiropractic services should be frontline services for many
NMS disorders rather than the default system of care when all else fails, as it seems to be for
many patients.
Unlike the past there is now mutual respect and greater inter-referral of patients between medical
and chiropractic doctors. There are no doubt many medical doctors who would support greater
OHIP coverage of chiropractic services. The College of Physicians and Surgeons of Ontario has

60
recently acknowledged the value of chiropractic and made the policy declaration that it is not
misconduct to refer patients to such Acomplementary@ practitioners when appropriate. Since the
policy we have suggested in this study would diminish the wide gap in the way the two
professions are treated under OHIP, but does not favour chiropractic more than medicine and
does not directly reduce medical coverage for NMS conditions, we do not anticipate open
opposition to this reform on the part of organized medicine in Ontario.
Thomas L. Wells, a former Ontario Minister of Health, chaired the Chiropractic Services Review
Committee in 1993-1994. The CSRC Report, popularly referred to as the Wells Report, made
many recommendations vis-a-vis chiropractic which dealt with health human resources planning
and education, radiology services, specialist referrals, diagnostic code revisions, laboratory
diagnosis, access and funding, and finally, research and clinical guidelines.
We repeat some of the recommendations that are most relevant to our analysis. The Wells Report
recommended that:
AThat the citizens of Ontario should have improved and genuine freedom of choice of
chiropractic services. To achieve this a number of barriers to access should be removed@
(Wells, 1994, p. ii).
AThat the current level of copayments for chiropractic services, particularly in a multi-
disciplinary health care system where other services have no copayment, represents an
inequitable barrier to access which should be minimized@ (Wells, 1994, p. iii).
Our report offers concrete support for these recommendations, and is based on the economic
argument that additional coverage of chiropractic services to reduce or eliminate patient
copayments will yield major savings in both direct health care costs and indirect costs.
There is a final principle that is important is making decisions about manpower substitution in the
health care system, one that is repeatedly overlooked or discounted by health care bureaucracies
and decision makers. We are referring to the principle of distributive justice which is hardly ever
mentioned, let alone seriously considered, in studies of manpower substitution. We would argue
that the principle of distributive justice requires that the government implement all cost-effective
substitutions because failure to do so results in unfairness to the taxpayers and the health care
professionals concerned. It is clear that some professions enjoy economic rent at the expense of
the taxpayers, and thus the distribution of the burden and benefits of publicly supported health
insurance is inequitable from the standpoint of the taxpayers. OHIP is more costly than it needs
to be, hence taxes in Ontario are correspondingly higher than they should be. The imposition of

61
the high copayment for chiropractic care, when publicly financed medical services are free, results
in a higher tax burden on the public to cover the less cost-effective medical management of
prevalent conditions such as common back pain - a major cause of disability in the community.
This result should be of concern to a government that emphasizes the need to reduce taxes in
Ontario. The monopolization of health care services turf is also inequitable from a related
perspective. It denies some professions equal opportunity to earn income commensurate with
their ability, effectiveness and effort.
Equity is likely to become more important in the immediate future as the struggle over the health
care turf becomes fiercer, and as taxpayers demand more value for the taxes they pay. Inefficient
use of health manpower is not just economically wasteful, generating higher levels of taxation, it
is also inequitable, and the greater the realization of this fact the greater will be the pressure on
governments to do something about the problem. Curiously, the professions that have and still
suffer the adverse effects of the inefficient use of our health manpower have not used this
argument forcefully to encourage and urge the desired reforms. They should.

62
REFERENCES
Aker, P, Haginor, C, and Mior, S. Utilization of Chiropractic Services in Ontario, Canada,
Abstracts of Original research, World Federation of Chiropractic, 1993.
Badley, E.M., Rosooly, I. et al. ARelative Importance of Musculoskeletal Disorders as a Cause of
Chronic Health Problems, Disability, and Health Care Utilization: Findings from the 1990
Ontario Health Survey@, The Journal of Rheumatology, Vol. 21, No. 3, 1994, pp. 505-514.
Badley, E.M. and Ibanez, D. ASocioeconomic Risk Factors and Musculoskeletal Disability@, TheJournal of Rheumatology, Vol. 21, No. 3, 1994, pp. 515-522.
Blevin, S.A. AThe Medical Monopoly: Protecting Consumers or Limiting Competition?, PolicyAnalysis, No. 246, December 15, 1995, pp. 1-36.
Brennan M.J. Demographic and professional characteristics of ACA membership: 1990annual survey and statistical results. American Chiropractic Association, January 1991.
Canadian Institute for Health Information, National Health Expenditure Trends 1975-1997,
CIHI, Ottawa, 1997.
Carey, T.M., Evans, A., Hadler, N., et al. Care-seeking among individuals with chronic low-back pain. Spine 1995; 20:312.
Carey, T.S., Garett, J. et al. North Carolina Back Pain Project. New England Journal of
Medicine, 1995. Vol. 333, pp. 913-917.
63
Cherkin, D.C., MacCornack, F.A. Patient evaluations of low-back pain care from familyphysicians and chiropractors, 1989. Western Journal of Medicine, Vol. 150, No. 3,
pp. 351-355.
Dean, H., Schmids, R. A Comparison of the Cost of Chiropractors Versus AlternativeMedical Practitioners, 1992. Virginia Chiropractic Association.
Deyo, R.A. AAcute Low-back Pain: A New Paradigm for Management@ British MedicalJournal, Vol. 313, November 1996, pp. 1343-44.
Dyer, E. ABack Pain: Deciding Who Should Treat It and Preventing Chronic Pain are Today=s Key
Challenges@, Health Policy Forum, November 1997, pp. 4-5.
Ebrall, P.S. Mechanical low-back pain: a comparison of medical and chiropracticmanagement within the Victorian workcare scheme, 1992. Chiropractic Journal of
Australia, Vol. 22, No. 2, pp. 47-53.
Edmeads, J., Findlay, H. et al. AImpact of Migraine and Tension-Type Headache on Lifestyle,
Consulting Behaviour and Medication Use: A Canadian Population Survey@, CanadianJournal of Neurological Sciences, Vol. 20, 1993, pp. 131-37.
Eisenberg, D.M., Kessler, R.C., Foster, C. et al. Unconventional medicine in the UnitedStates: Prevalence, costs, and patterns of use, 1993. N Engl J Med. 328: pp. 246-52.
64
Eisenberg, D.M., Kessler, R.C. AUnconventional Medicine in the United States@, New EnglandJournal of Medicine, Vol. 328, No. 4, pp. 246-256.
Gort, E.H., Coburn, D. Naturopathy in Canada: Changing relationship to medicine,chiropractic and the state, 1988. Soc. Sci. Med. 26:1061.
Hayward, R.S.A., Guyatt, G.H. et al. ACanadian Physician Attitudes about and Preferences
Regarding Clinical Practice Guidelines@, Canadian Medical Association Journal, Vol. 156,
No. 12, 1997, pp. 1715-23.
Hurwitz, E.L. The relative impact of chiropractic vs. medical management of low-back painon health status in a multispecialty group practice, 1994. Journal of Manipulative and
Physiological Therapeutics. Vol. 17, No.2, p. 74-82.
Jarvis, K.B. Cost per case analysis of Utah industrial back injury claims: chiropracticmanagement versus medical management for diagnostically equivalent conditions, 1989.
D.C. Tracts, Vol. 1, No. 2, pp. 67-79.
Jarvis, K.B., Phillips, R.B., Morris, E.K. Cost per case comparison of back injury ofchiropractic versus medical management for conditions with identical diagnosis codes1991. J. Occup. Med. Vol. 33, No. 8, pp. 847-852.
Jacobs, P. Recent Evaluations of the Effectiveness and Efficiency of ChiropracticTreatment for Lower Back Pain: Policy Implications, 1993. Edmonton, Alberta. p. 13.

65
Jette, M.A., Smith, K. et al. APhysical Therapy Episodes of Care for Patients with Low-back
Pain@, Physther, Vol. 74, 1994, pp. 101-10.
Jochumsen, O.H. ALow-back Pain Treated by Medical Doctors and Chiropractors@ in S.
Haldeman (editor) proceedings of the Scientific Symposium of the World Federation of
Chiropractic, Toronto, 1991, pp. 1-2.
Jones, J. Quacks no More as Therapies Get NHS Approval, The Observer, 20 August, 1995.
Katz, S.J. and Ibanez, D. ASocioeconomic Disparities in Preventive Care Resist Despite Universal
Coverage. Breast and Cervical Cancer Screening in Ontario and the United States@,
American Medical Association Journal, Vol. 272, No. 7, 1994, pp. 530-4.
Katz, S.J., Hofer, T.P., et al. AHospital Utilization in Ontario and the United States: The Impact
of Socioeconomic Status and Health Status@, Canadian Journal of Public Health, Vol. 87,
No. 4, 1996, p. 253-5.
Manga, P., Campbell, T. Health Manpower Substitution: A Literature Review, 1994.
University of Ottawa, p. 117.
Manga, P., Angus, D., Papadopoulos, C., et al. The effectiveness and cost-effectiveness ofchiropractic management of low-back pain, 1993. Richmond Hill, Ontario, Canada:
Kenilworth Publishing.

66
Meade, T.W. Comparison of chiropractic and hospital outpatient management of low-backpain: a feasibility study, 1986. Journal of Epidemiology and Community Health, Vol. 40,
pp. 12-17.
Meade, T.W., Dyer, S., Browne, W., Townsend, J., Fran, A.O. Low-back pain of mechanicalorigin: Randomised comparison of chiropractic and hospital outpatient treatment. British Medical Journal 1990; Vol. 300, pp. 1431-1437.
Meade, T.W., Dyer, S., Browne, W., et al. Randomised comparison of chiropractic andhospital outpatient management for low-back pain: Results from extended follow-up.
British Medical Journal 1995; 311:349.
Mosley, C.D., Cohen, I.G., and Arnold, R.M. ACost-Effectiveness of Chiropractic Care in a
Managed Care Setting@, The American Journal of Managed Care, 1996, Vol. 11, pp. 280-
282.
Mosley, C.D., Cohen, I.G., et al. ACost-Effectiveness of Chiropractic Care in a Managed Care
Setting@, The American Journal of Managed Care, Vol. 11, No. 3, 1996, pp. 280-282.
Mushinski M. Treatment of back pain outpatient service charges, 1993. Stat. Bull Metrop.
Insur. Co. July-September 1995:32.
Nyiendo, J. Disabling low-back Oregon Workers' Compensation claims: Diagnostic
67
treatment procedures and associated costs. Journal of Manipulative and Physiological
Therapeutics 1991a, Vol. 14, No. 4, pp. 231-239.
Nyiendo, J. Disabling low-back Oregon Workers' Compensation claims. Part III: diagnostic and treatment procedures and associated costs. Journal of Manipulative and
Physiological Therapeutics 1991b, Vol. 14, No. 5, pp. 287-297.
Nyiendo, J., Lamm, L. Disabling low-back Oregon worker's compensation claims. Part I: methodology and clinical categorization of chiropractic and medical cases. Journal of
Manipulative and Physiological Therapeutics, Vol. 14, No. 3, pp. 177-184.
Ontario Chiropractic Association AA Partnership Plan for Improved Access, Funding and
Accountability@, Submission to Government of Ontario, September, 1996.
Patijn, J. and Durinck, J.R. AEffects of Manual Medicine on Absenteeism@, Journal of ManualMedicine, Vol. 6, 1991, pp. 49-53.
Schifrin, L.G. Mandated Health Insurance Coverage for Chiropractic Treatment: AnEconomic Arrangement with Implications for the Commonwealth of Virginia, 1992.
Richmond, Virginia.
Shekelle, P.G., Adams, A.H., Chassin, M.R., et al. Spinal manipulation for low-back pain,
1992. Ann Intern Med; 117:590.
68
Shekelle, P.G., Markovich, M., Louie, R. Comparing the costs between provider types ofepisodes of back pain care. Spine, Vol. 20, No. 2, 1995, pp. 221-27.
Shekelle, P.G., Markovich, M. and Louie, R. Factors Associated with Choosing aChiropractor for Episodes of Back Pain Care, Medical Care, Vol. 33, No. 8, 1995, pp.
842-850.
Smith, M. and Stano, M. ACosts and Recurrences of Chiropractic and Medical Episodes of Low-
Back Care@, Journal of Manipulative and Physiological Therapeutics, Vol. 20, No. 1,
1997, pp. 5-12.
So, J. AUtilization of Alternative Therapies by the Canadian Population@, in Taking Charge ofHealth: Exploring Alternative Health Care, Trent University, 1997, pp. 59-81.
Stang, P.E., Osterhaus, J.T. et al. AMigraine: Patterns of Healthcare Use@, Neurology, Vol. 44
(Suppl. 4), 1994, 547-55.
Stano, M. The Economic Role of Chiropractic: Further Analysis of Relative InsuranceCosts for Low-back Care, JNMS, 1995, Vol. 3, No. 3, 139-144.
Stano, M. and Smith, M. Chiropractic and Medical Costs for Low-back Care, Medical Care,
1966, Vol. 34, No. 3, 191-204.
Stano, M. A Comparison of Health Care Costs for Chiropractic and Medical Patients,

69
JMPT, Vol. 16, No. 5, 291-299.
Stano, M. Further Analysis of Health Care Costs for Chiropractic and Medical Patients,
JMPT, Vol. 17, No. 4, 442-446.
Statistics Canada. Health Status of Canadians: Report of the 1991 General Social Survey,
Ottawa, 1994.
US Department of Health and Human Services. National Medical Care Utilization andExpenditure Survey, 1980. Persons receiving care from selected health care practitioners,
United States, Series B. Hyattsville, MD: US Department of Health and Human Services.
September 1984. DHHS Publication No. 84-20206.
US Department of Health and Human Services. Clinical Practice Guideline #14: Acute Low-back Problems in Adults. Rockville, MD: Agency for Health Care Policy and Research.
December 1994. AHCPR Publication No. 95-0642.
US Department of Veterans Affairs. Chiropractic Services Pilot Program Evaluation Study.
Washington, DC: US Department of Veterans Affairs. April 1990. SDR # 86-09.
Weller, G.R., Manga, P. The development of health policy in Canada in Atkinson, M.A. and
Chandler, M.A. (eds), 1983. The Politics of Canadian Public Policy University of Toronto
Press, Toronto, pp. 223-246.

70
Wells, T.L. Chiropractic Services Review: Final Report, November 1994, Toronto.
Wilkins, K. and Park, E. ACharacteristics of Hospital Users@, Health Reports, Vol. 9, No. 3,
1997, pp. 27-36.
Wilkins, K. and Park, E. Chronic Conditions, Physical Limitations and Dependency AmongSeniors Living in the Community Health Reports, Vol. 8, No. 3, 1996, pp. 7-17.