Embed Size (px)
Citation preview
ENGINEERING PROPERTIES OF LIGHTWEIGHT FOAMED CONCRETE
INCORPORATED WITH PALM OIL FUEL ASH (POFA)
YONG CHUN YIP
A project report submitted in partial fulfilment of the
requirements for the award of the degree of
Bachelor (Hons.) of Civil Engineering
Faculty of Engineering and Science
Universiti Tunku Abdul Rahman
May 2013
ii
DECLARATION
I hereby declare that this project report is based on my original work except for
citations and quotations which have been duly acknowledged. I also declare that it
has not been previously and concurrently submitted for any other degree or award at
UTAR or other institutions.
Signature : _________________________
Name : YONG CHUN YIP_________
ID No. : 09UEB07968______________
Date : ________
iii
APPROVAL FOR SUBMISSION
I certify that this project report entitled “ENGINEERING PROPERTIES OF
LIGHTWEIGHT FOAMED CONCRETE INCORPORATED WITH PALM
OIL FUEL ASH (POFA)” was prepared by YONG CHUN YIP has met the
required standard for submission in partial fulfilment of the requirements for the
award of Bachelor of Engineering (Hons.) Civil Engineering at Universiti Tunku
Abdul Rahman.
Approved by,
Signature : _________________________
Supervisor : Dr. LIM SIONG KANG
Date : _________________________
iv
The copyright of this report belongs to the author under the terms of the
copyright Act 1987 as qualified by Intellectual Property Policy of University Tunku
Abdul Rahman. Due acknowledgement shall always be made of the use of any
material contained in, or derived from, this report.
© 2013, YONG CHUN YIP. All right reserved.
v
ACKNOWLEDGEMENTS
First of all, I would like to thank everyone who had contributed to the successful
completion of this project. I would like to express my gratitude to my research
supervisor, Dr. Lim Siong Kang for his invaluable advice, guidance and his
enormous patience throughout the development of the research. In addition, I would
like to dedicate my appreciation to my parents and friends for their support,
encouragement and helping throughout the research too.
vi
ENGINEERING PROPERTIES OF LIGHTWEIGHT FOAMED CONCRETE
INCORPORATED WITH PALM OIL FUEL ASH (POFA)
ABSTRACT
Malaysia is one of the main crude palm oil producer and exporter in the world.
Meanwhile, million tonnes of agro wastes such as palm oil fuel ash (POFA) is being
produced every year and it causes a problem in disposing POFA, a by-product of
palm oil mill. However, POFA has the high potential to be used as recycle
construction materials in production of lightweight foamed concrete (LFC) as it
contains high content of silica which possesses pozzolanic behaviour. For strength
activity index of POFA, it was observed that the specimen’s strength for
incorporation of 20% POFA into a cement mortar as a part of binder has achieved
and complied as Class F pozzolan in accordance with Specification C618. The main
objective of this research is to study the effects of Palm Oil Fuel Ash (POFA) on
engineering properties of LFC with 1300kg/m3 of density in terms of compressive,
flexural and splitting tensile strengths, Poisson’s ratio and compressive toughness. In
this study, three types of foamed concrete were prepared, namely i) LFC with 100 %
sand as filler as control mix (LFC-CM), ii) LFC with 25% POFA replacement as part
of filler (LFC-PF25) and iii) LFC with 50% POFA replacement as part of filler
(LFC-PF50). All the specimens were cured in water before being tested. The results
indicated that lightweight foamed concrete incorporated with 25% and 50% POFA as
a part of filler has improved its compressive, flexural and splitting tensile strengths,
ductility as well as compressive toughness.
vii
TABLE OF CONTENTS
DECLARATION ii
APPROVAL FOR SUBMISSION iii
ACKNOWLEDGEMENTS v
ABSTRACT vi
TABLE OF CONTENTS vii
LIST OF TABLES xi
LIST OF FIGURES xii
LIST OF SYMBOLS / ABBREVIATIONS xiv
LIST OF APPENDICES xv
CHAPTER
1 INTRODUCTION 1
1.1 Introduction 1
1.2 Background of Study 2
1.3 Objectives of Study 3
1.4 Scopes of Study 4
1.5 Significance of Study 5
1.6 Layout of Report 5
2 LITERATURE REVIEW 7
2.1 Introduction 7
2.2 Advantages of Lightweight Foamed Concrete 8
2.3 Disadvantages of Lightweight Foamed Concrete 9
2.4 Application of Lightweight Foamed Concrete 9
2.5 Compressive Strength 10
viii
2.6 Flexural and Splitting Tensile Strengths 10
2.7 Thermal Conductivity 11
2.8 Poisson’s Ratio and Compressive Toughness 11
2.9 Foam 12
2.10 Ordinary Portland Cement 13
2.10.1 Chemical Composition of Portland Cement 13
2.10.2 Compound Composition of Portland Cement 13
2.11 Pozzolanic Material 14
2.11.1 Pozzolanic Reaction 14
2.11.2 Origin of POFA 15
2.11.3 Chemical Properties of POFA 15
2.11.4 Properties of Fineness of POFA on
Concrete Strength 16
2.11.5 Strength Development of Normal Weight
Concrete Incorporated with POFA 17
2.12 Summary 19
METHODOLOGY 20
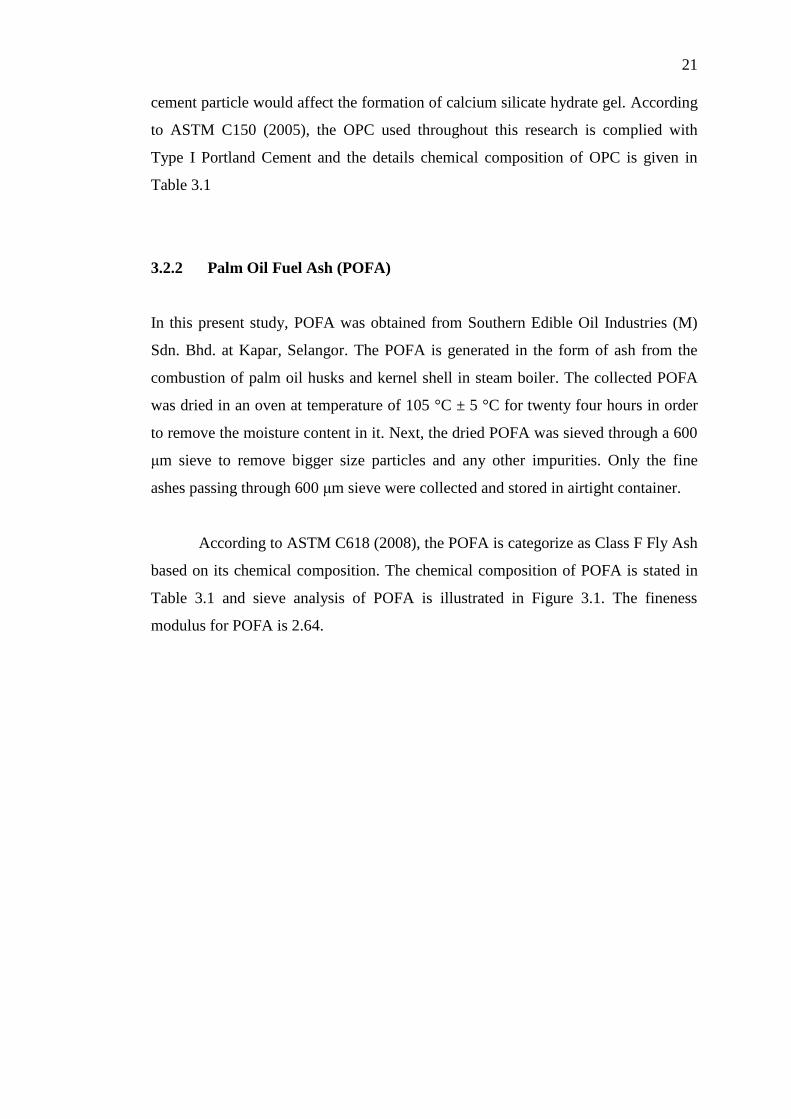
3.1 Introduction 20
3.2 Raw Materials 20
3.2.1 Ordinary Portland Cement 20
3.2.2 Palm Oil Fuel Ash (POFA) 21
3.2.3 Sand 23
3.2.4 Water 23
3.2.5 Foaming Agent 24
3.3 Mix Proportions and Trial Mix 25
3.4 Mixing Procedure 25
3.5 Curing Condition 25
3.6 Fresh Concrete Testing Method 26
3.6.1 Fresh Density Test 26
3.6.2 Flow Table Test 27
3.6.3 Inverted Slump Test 27
3.7 Hardened Concrete Testing 28
ix
3.7.1 Compression Test 28
3.7.2 Splitting Tensile Test 30
3.7.3 Flexural Strength Test 32
3.7.4 Poisson’s Ratio Test 33
3.7.5 Compressive Toughness 35
3.7.6 Strength Activity Index Test 35
3.8 Consistency and Stability 36
3.9 Performance Index 36
3.10 Microstructure Image Analysis 37
l3.11 Summary 38
4 TRIAL MIXES 40
4.1 Introduction 40
4.2 Strength Activity Index of POFA 40
4.3 Mix Proportions 41
4.4 Compressive Strength 42
4.5 Performance Index 44
4.6 Summary 46
5 RESULTS AND DISCUSSION 48
5.1 Introduction 48
5.2 Compressive Strength 48
5.3 Splitting Tensile Strength 50
5.4 Flexural Strength 52
5.5 Poisson’s Ratio 54
5.6 Compressive Toughness 55
5.7 Performance Index 57
5.8 Summary 58
6 CONCLUSION AND RECOMMENDATIONS 60
6.1 Conclusion 60
6.2 Recommendations 61

x
REFERENCES 62
APPENDICES 68
xi
LIST OF TABLES
TABLE TITLE PAGE
2.1 General Composition Limits of Portland Cement
(Neville, 2010) 13
2.2 Main Compunds of Portland Cement (Neville,
2010) 13
2.3 Chemical Composition of POFA Used in Various
Researches (Awal, 1997; Tangchirapat, 2007;
Eldagal, 2008) 15
3.1 Chemical Composition of OPC (SGS analysis
report, 2007) and POFA (Tangchirapat et al.,2006) 22
4.1 Compressive Strength and Strength Activity Index
at 7 Days and 28 Days 41
4.2 Trial Mixes Mix Porportions for Various Type of
LFC 42
5.1 Effect of Incorporation of POFA in LFC on its
Compressive Strength Development at 90 Days of
Age 50
5.2 Effect of Incorporation of POFA in LFC on its
Splitting Tensile Strength Development at 90 Days
of Age 52
5.3 Effect of Incorporation of POFA in LFC on its
Flexural Strength Development at 90 Days of Age 54
5.4 28 Days Poisson’s Ratio for LFC-CM, LFC-PF25
and LFC-PF50 54
5.5 Compressive Toughness of LFC, LFC-PF25 and
LFC-PF50 at 28 Days of Age 57
5.6 Compressive Performance Index of Lightweight
Foamed Concrete 58
xii
LIST OF FIGURES
FIGURE TITLE PAGE
2.1 Effect of Finess of Ash on Concrete Compressive
Strength (Awal, 1998) 16
2.2 Compressive Strength for OPC to POFA Mixes
(Sata, 2010) 17
2.3 Compressive Strength for OPF to POFA Mixes
(Tangchirapat, et al., 2009) 18
3.1 Sieve Analysis of Raw POFA and Sand 22
3.2 Sieve Analysis of Refined POFA and Sand 23
3.3 Foam Generator 24
3.4 Water Curing 26
3.5 Flow Table Test 27
3.6 Inverted Slump Test 28
3.7 INSTRON 5582 Testing Machine 29
3.8 Specimen’s Dimension Is Being Measure and
Recored 30
3.9 Splitting Tensile Strength Test of LFC 31
3.10 Flexural Strength Test of LFC 33
3.11 Poisson’s Ratio Test 34
3.12 Coating of Specimen Before SEM Analysis 38
3.13 Hitachi VP_SEM S-3700N 38
xiii
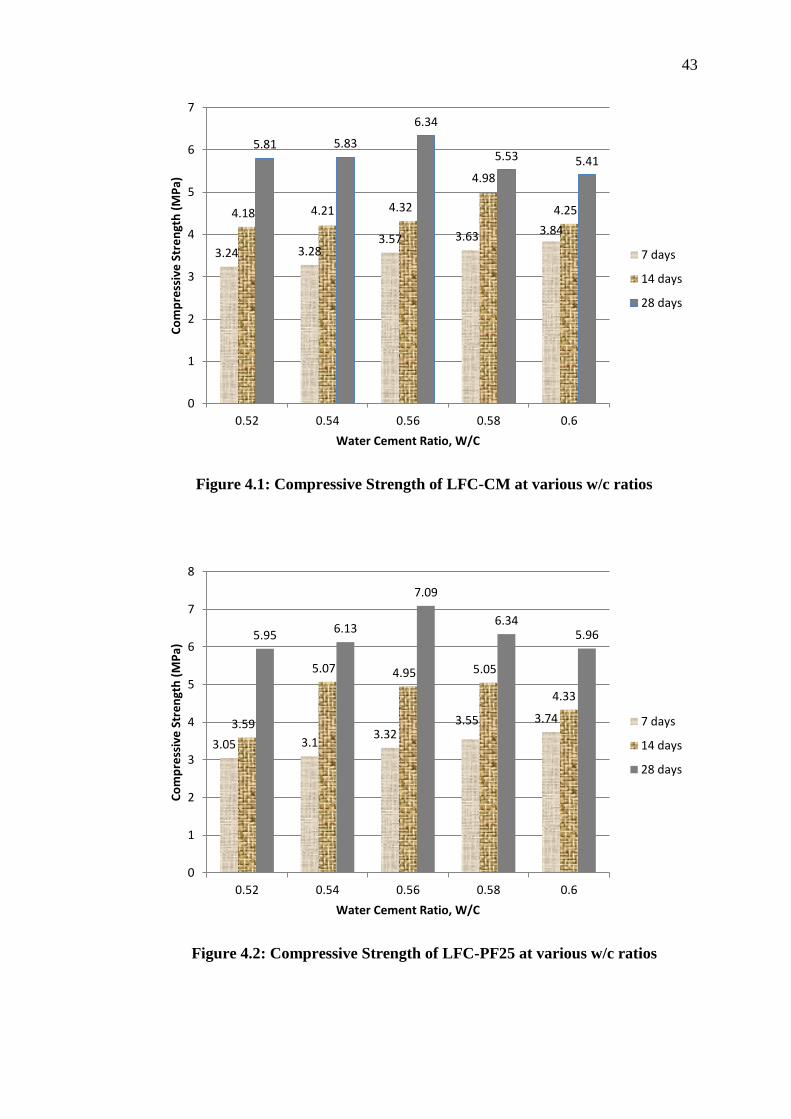
4.1 Compressive Strength of LFC-CM at various w/c
ratios 43
4.2 Compressive Strength of LFC-PF25 at various w/c
ratios 43
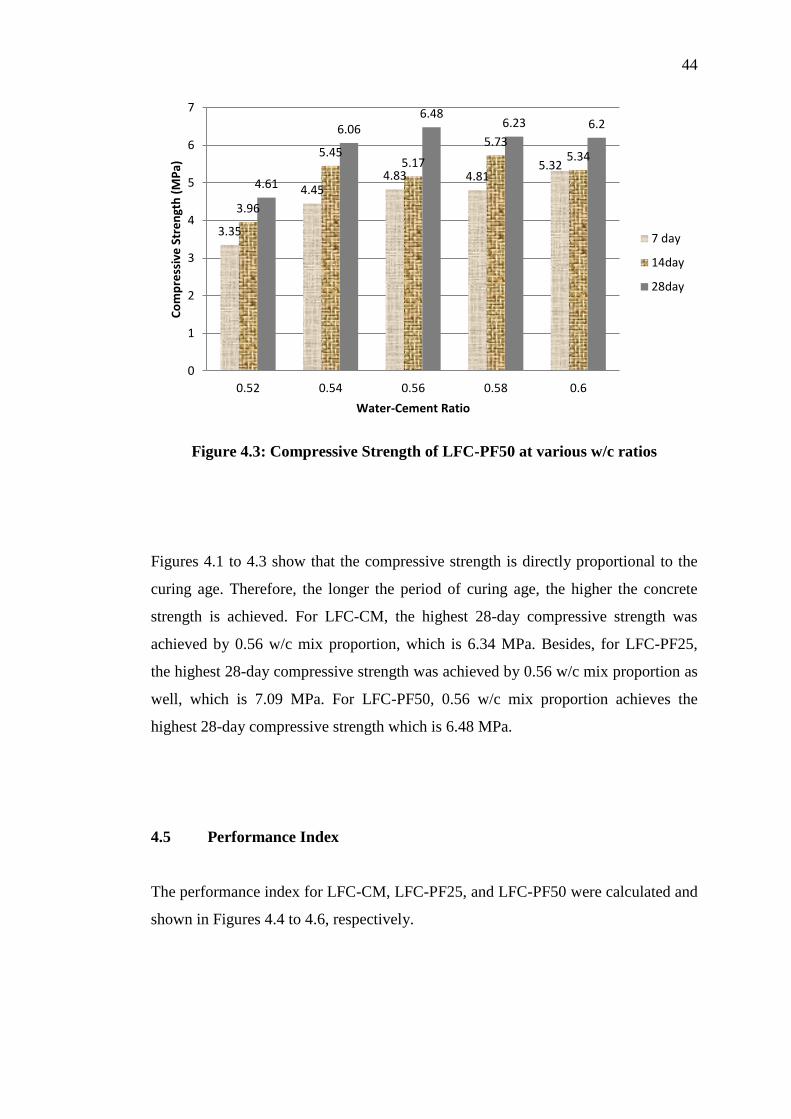
4.3 Compressive Strength of LFC-PF50 at various w/c
ratios 44
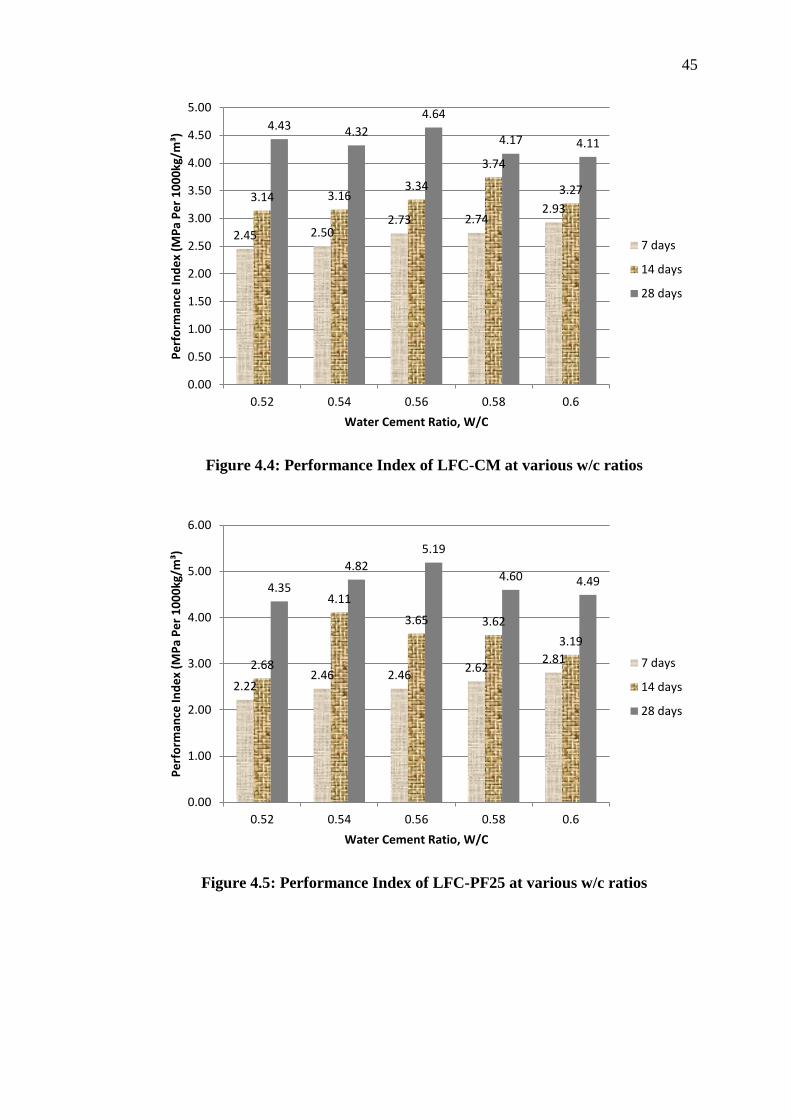
4.4 Performance index of LFC-CM at various w/c
ratios 45
4.5 Performance index of LFC-PF25 at various w/c
ratios 45
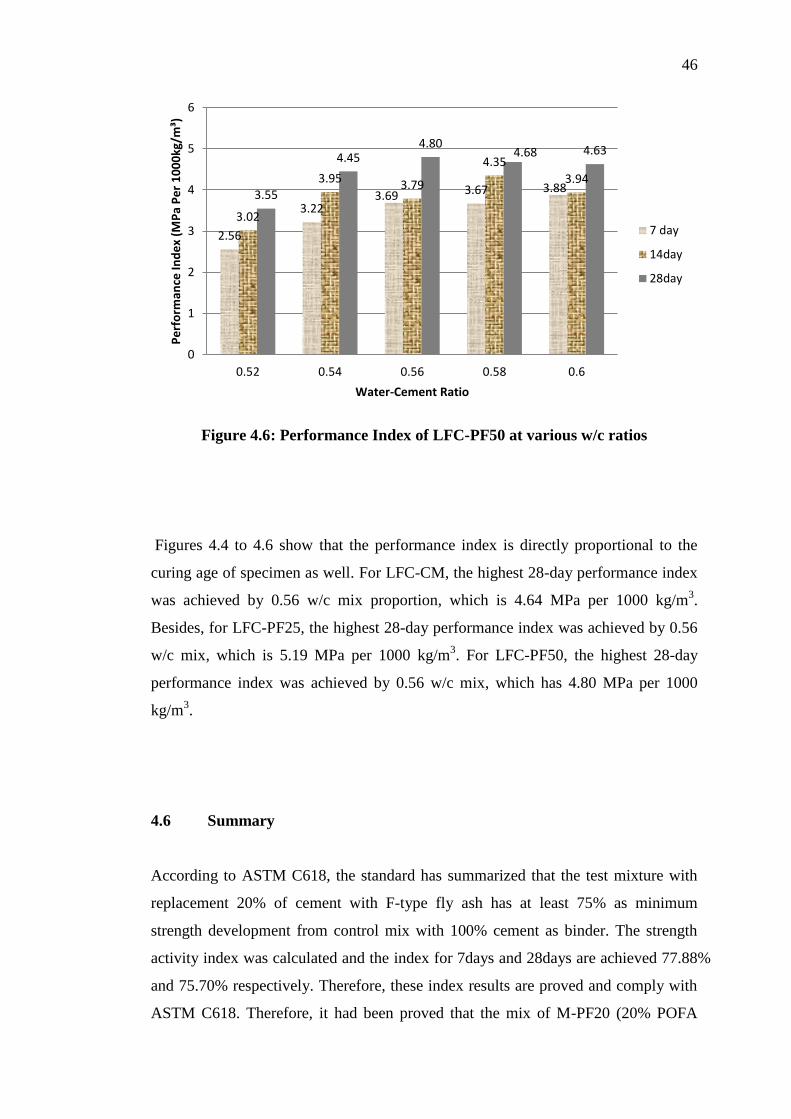
4.6 Performance index of LFC-PF50 at various w/c
ratios 46
5.1 Compressive Strength Development up To 90 days
of Age for LFC-CM, LFC-PF25 and LFC-PF50 49
5.2 Splitting Tensile Strength Development Up To 90
days of Age for LFC-CM, LFC-PF25 and LFC-
PF50 50
5.3 Relationship of Splitting Tensile Strength-
Compressive Strength for LFC-CM, LFC-PF25
and LFC-PF50 Up to 90 days of Age 51
5.4 Flexural Strength Development up To 90 days of
Age for LFC-CM, LFC-PF25 and LFC-PF50 52
5.5 Relationship of Flexural Strength-Compressive
Strength of LFC-CM, LFC-PF25 and LFC-PF50 53
5.6 28 Days Stress-Strain Relationship of LFC-CM 55
5.7 28 Days Stress-Strain Relationship of LFC-PF25 56
5.8 28 Days Stress-Strain Relationship of LFC-PF50 56
xiv
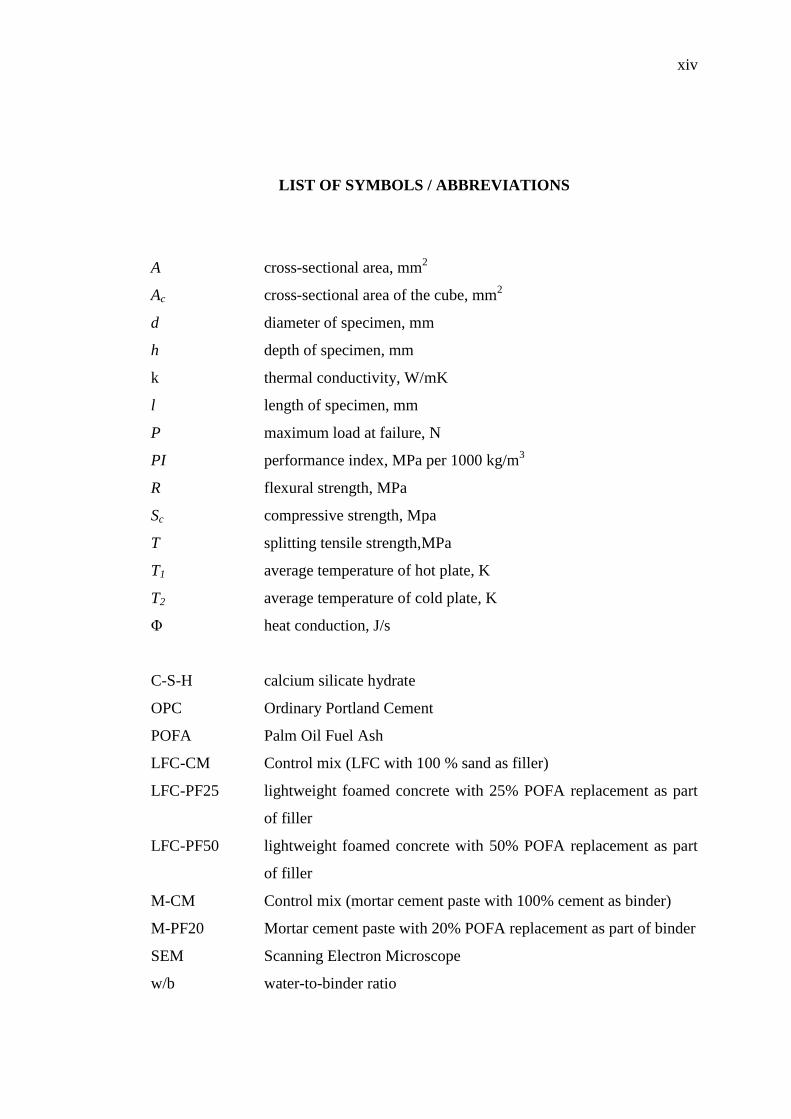
LIST OF SYMBOLS / ABBREVIATIONS
A cross-sectional area, mm2
Ac cross-sectional area of the cube, mm2
d diameter of specimen, mm
h depth of specimen, mm
k thermal conductivity, W/mK
l length of specimen, mm
P maximum load at failure, N
PI performance index, MPa per 1000 kg/m3
R flexural strength, MPa
Sc compressive strength, Mpa
T splitting tensile strength,MPa
T1 average temperature of hot plate, K
T2 average temperature of cold plate, K
Φ heat conduction, J/s
C-S-H calcium silicate hydrate
OPC Ordinary Portland Cement
POFA Palm Oil Fuel Ash
LFC-CM Control mix (LFC with 100 % sand as filler)
LFC-PF25 lightweight foamed concrete with 25% POFA replacement as part
of filler
LFC-PF50 lightweight foamed concrete with 50% POFA replacement as part
of filler
M-CM Control mix (mortar cement paste with 100% cement as binder)
M-PF20 Mortar cement paste with 20% POFA replacement as part of binder
SEM Scanning Electron Microscope
w/b water-to-binder ratio
xv
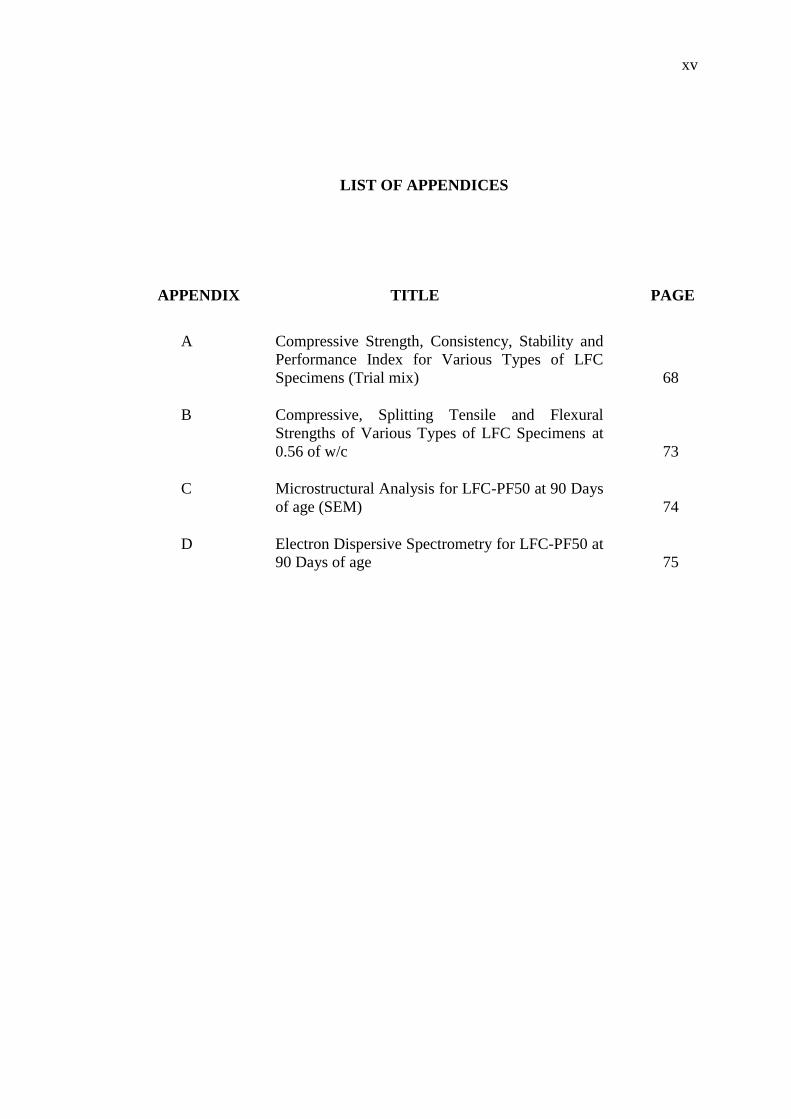
LIST OF APPENDICES
APPENDIX TITLE PAGE
A Compressive Strength, Consistency, Stability and
Performance Index for Various Types of LFC
Specimens (Trial mix) 68
B Compressive, Splitting Tensile and Flexural
Strengths of Various Types of LFC Specimens at
0.56 of w/c 73
C Microstructural Analysis for LFC-PF50 at 90 Days
of age (SEM) 74
D Electron Dispersive Spectrometry for LFC-PF50 at
90 Days of age 75
1
CHAPTER 1
1 INTRODUCTION
1.1 Introduction
Concrete is one of the composite construction material that composed primarily of
aggregate, water and cement. It has been used widely in the field of construction for
making various structures such as architectural structures, foundations, pavements,
bridges and so forth. Therefore, the various concrete types available nowadays are
attributed to the continuous research and development of concrete over the years to
provide more alternative construction material for making construction structure.
However, the popularly utilise of lightweight concrete, also known as aerated
concrete in the European countries construction field due to its versatilities and
lightness, which has brought a offer application of new alternative building material
for the improvement of Malaysia building technology. The classification of concrete
type is mainly depending on the concrete density. By using the lightweight concrete
which possesses low density properties, it is capable of contributing towards the
reduction of building dead load and resulting in more economic structural design
(Short and Kinniburgh,1978; Narayanan and Ramamurthy, 2000b) as reduction of
dead load may consequently the reduction of size of bearing load structure. The
practical range of concrete density for lightweight concrete is between 300 kg/m3 and
1850 kg/m3 (Neville, 2006). Besides that, other than lightweight concrete possess the
advantage of low density properties, it is also good in fire resistance and thermal
insulation properties.
2
On the other hand, the continuous research of producing a new concrete
material of palm oil fuel ash (POFA) was developed. Malaysia is a country with full
of resources and it was being the largest producer and exporter of palm oil in the
world, accounting for 52% of the total world oil and fats exports in year 2006
(Sumathi et al., 2008). Hence, it has led to higher volume of palm oil mill by-product
such as POFA generated and being dumped in the landfill. In this scenario, it is
predicted that larger amount of POFA will be discarded as environmental polluting
waste in future. Therefore, POFA had been chosen in research as new concrete
material to process this material for other applications in order to convert the
environmentally polluting by-product problem into beneficial for the development of
human civilization. In addition, success in producing palm oil fuel ash based aerated
concrete not only could reduce the quantity of ashes as environmental waste but also
introduce new agro based aerated concrete which is adequate for the use in tropical
countries.
1.2 Background of Study
Malaysia, Indonesia and Thailand are the main palm oil producer and exporter in the
world, which is a leading agricultural cash crop in these tropical countries. Malaysia
is concentrating on bio-technology industry and its objective is to produce better and
quality agriculture products. In addition, palm oil is listed as one of the main
commodities to be exported internationally and consequently it will being generate
bigger amount of palm oil fuel ash and being dumped in the landfill. Palm oil fuel
ash (POFA) is an agro-waste or industry by-product resulting from the combustion of
oil palm plant residue in palm oil industry. Approximately 5% of POFA is generated
from the combustion of palm oil husks and kernel shell in steam boiler to generates
electricity for use in palm oil mills (Tangchirapat et al., 2007).
Palm oil fuel ash (POFA) has the high potential to be used as recycle
construction materials as pozzolans. It is because POFA possesses high contents of
silica oxide, which met the pozzolanic properties criteria to react with calcium
hydroxide (Ca(OH)) from the hydration process which is deteriorated to concrete and
3
pozzolanic reaction produce more calcium silicate hydrate (C-S-H) which is a gel
compound that contributes to the strength of the concrete and subsequently produce
stronger and denser concrete as well as enhance the durability of the concrete.
Therefore, POFA has potential to be used as cement replacement or as filler to
produce strong and durable concrete (Awal and Hussin, 1997).
On the other hand, aerated concrete is also known as cellular concrete,
cellular aerated concrete, gas concrete or foamed concrete. This type of concrete is
essentially an aerated cement paste or mortar made by entraining air or gas in the
form or small bubbles with diameter from 0.1 to 1.0mm into a plain cement paste or
mortar mix during the mixing process (Tam et. al., 1987). The air bubbles are
uniformly distributed in the plain cement paste and are retained in the matrix on
setting and hardening to form a cellular structure (AAC 1.1, 1990). The classification
of aerated concrete is based upon the method of formation (Narayanan &
Ramamurthy, 2000b) and it can be, basically, divided into two types that are foamed
concrete and gas concrete.
1.3 Objectives of Study
The objectives of this study are:
1. To produce lightweight foamed concrete with 1300 ±50 kg/m3of density.
2. To obtain optimum w/c ratios for three types of LFC.
3. To study the effect of POFA on fresh properties in terms of workability and
fresh density of concrete.
4. To study the effect of Palm Oil Fuel Ash (POFA) on engineering properties
of lightweight foamed concrete in terms of compressive, flexural and splitting
tensile strengths, Poisson’s ratio and compressive toughness.
4
1.4 Scopes of Study
The present research is to study the engineering properties of lightweight foamed
concrete incorporated with palm oil fuel ash (POFA) in term of compressive,
splitting tensile and flexural strength, Poisson’s ratio, and strength activity index. On
overall, this study has to produce a mix proportion for POFA cement based aerated
concrete as well as producing a normal aerated concrete that was used as control
subject with targeted density of 1300 kg/m3 and tolerance of 50 kg/m
3. Three types
of foamed concrete were prepared, namely i) LFC with 100 % sand filler as control
mix (LFC-LFC-CM), ii) LFC with 25 % POFA replacement as part of filler (LFC-
PF25) and iii) LFC with 50 % POFA replacement as part of filler (LFC-PF20).
During the laboratory work, flow table test were carried out before the plain mortar
added with foam to measure the consistency of fresh concrete. Besides that, inverted
slump test is also carried out to measure the workability of fresh concrete. However,
in order to study the maximum compressive strength of foamed concrete produced,
optimum w/c ratio must be determined through a trial mixes with various w/c ratio.
In this study, the trial w/c ratio for respective mix ranging was started from 0.52 to
0.62 with increased by an interval of 0.02. The water curing method is used for
further hydration process of concrete cubes. Then the water cured of concrete cubes
for 7 days, 14 days and 28 days were tested by compressive strength test in order to
calculate the performance index of POFA based aerated concrete and to obtain the
optimum w/c ratio for each mix proportion respectively.
After obtained optimum w/c ratio, new set of specimens including cubes,
cylinders and prisms were casted with optimum w/c ratio and cured in water for 7
days, 28 days, 56 days and 90 days. The specimens were then oven dried for a day
before and tested in term of compressive strength, splitting tensile strength and
flexural strength respectively. Besides that, another set of cube specimens was water
cured for 7 and 28 days and oven dried for a day before undergoing Strength Activity
Index test. Moreover, the cylinders were water cured for 28 days before undergoing
testing by Poisson’s ratio test. Lastly, the crushed pieces of foamed concrete at 90
days were used for microstructure studies by using Scanning Electron Microscope
(SEM). The engineering properties of LFC-LFC-CM, LFC-PF25 and LFC-PF50
were then studied and discussed.
5
1.5 Significance of Study
The significances of this study are as follows:
1. Incorporating POFA as partial sand replacement material in the mix as to
encourage the use of agriculture waste and create a more sustainable
environment besides its own ability to enhance the compressive strength of
the concrete.
2. Developing the mix proportion to produce lightweight foamed concrete
incorporated with POFA and study the engineering properties in terms of
compressive strength, splitting tensile strength, flexural strength, Poisson’s
ratio, compressive toughness and strength activity index.
1.6 Layout of Report
This report consists of 6 chapters. Chapter 1 discusses the introduction of the study,
background of the research, objectives of the research, scopes of research,
significance of research and finally the layout of report.
Chapter 2 discusses the review of lightweight foamed concrete incorporated
with POFA. This includes the review on materials used such as POFA, sand, cement
and foam. Besides, the properties of lightweight foamed concrete are also discussed
in this chapter.
Chapter 3 discusses the methodologies used in this study. The material
preparation, mix proportion of trial mixes and mixing procedure are discussed in this
chapter. In addition, the testing methods used in testing the specimens are also
discussed in this chapter.
Chapter 4 mainly presents and discusses the results of trial mixes. The w/c
ratio for LFC-CM, LFC-PF25 and LFC-PF50 were determined based on screening of
trial mixes’ results, respectively.
6
Chapter 5 mainly presents and discusses about the laboratory results of
lightweight foamed concrete incorporated with POFA in terms of compressive
strength, splitting tensile strength, flexural strength, strength activity index, Poisson’s
ratio and compressive toughness.
Chapter 6 concludes the whole study. Few conclusions have been drawn with
respective objectives listed based on the results obtained from this study. Besides that,
there are few recommendations listed in this chapter for future studies.
7
CHAPTER 2
2 LITERATURE REVIEW
2.1 Introduction
Lightweight foamed concrete is categorized as one type of lightweight concrete. It is
because, foamed concrete is containing no large aggregates, only fine sand and with
extremely light weight materials containing cement, water and foam. In other words,
it is one type of lightweight material consisting of Portland cement paste or cement
filler matrix, with a homogeneous void or pore structure created by air-voids, which
are entrapped in mortar or cement paste by suitable foaming agent (Ramamurthy et
al., 2009). However, the pore-formation method in aerated concrete can affect the
microstructure as well as its properties. The material structure of aerated concrete is
characterised by its solid microporous matrix and macropores (Narayanan and
Ramamurthy, 2000). Macropores is defined as pores with a diameter of more than 60
µm (Petrov and Schlegel, 1994). The formation of macropores is due to the
expansion of the mass caused by aeration. Besides, the micropores also appear in the
walls between the macropores (Alexanderson, 1979).
The properties of foamed concrete are low self-weight, high workability,
consists of low compressive strength, minimum consumption of aggregate and good
thermal insulation properties. Therefore, lightweight foamed concrete is famous to be
used due to its lightness and versatility. By using the appropriate composition of
foam, the range of densities between 400kg/m3 to 1600kg/m
3 of foamed concrete can
be achieved for application to structural, partition, insulation and filling grades
(Ramamurthy et al., 2009).
8
On the other hand, palm oil fuel ash (POFA) is one of the potential recycles
by-product from palm oil industry which possesses high content of siliceous
compositions and reacted as pozzolans in order to produce a stronger and denser
concrete. Therefore, there are many researches and experimental works were
conducted for the use of variety of agro waste which contains high silica content in
amorphous form as constituent in concrete and can be used as pozzolans
(Tangchirapat et al., 2007). Other than POFA, slag (Hogan el al., 1981; Arreshvhina,
2002), fly ash (Metha, 1985; Chindaprasirt et al., 2004), rice-husk ash (Mehta, 1977)
and sawdust ash (Udoeyo and Dashibil, 2002) also had been studied as a constituent
in concrete to react as pozzolanic material.
Successful in production of POFA cement based aerated concrete not only
can convert the environmentally polluting by-product problem into beneficial for the
development of human civilization but it also enhance concrete properties in term of
strength, thermal conductivity, fire resistance and so forth. Therefore, POFA has
potential to be used as cement replacement or as filler to produce strong and durable
concrete (Awal and Hussin, 1997).
2.2 Advantages of Lightweight Foamed Concrete
Lightweight foamed concrete is famous to be used nowadays because it possesses
low density properties and consequently contribute towards the reduction of building
dead load and resulting in more economic structural design in term of concrete cost
due to reduction of size of bearing load structure, such as foundation, columns and
thickness of walls. Moreover, it also possesses superior fire resistance and high
workability. In addition, lightweight foamed concrete is also good in thermal
insulation and acoustic insulation due to higher porous structure contained itself as
the heat energy and sound wave are diffused much more slowly in medium of air
compared to solid state (Kim et al., 2011). Besides, foam concrete can control the air
humidity in a room by absorbing and releasing moisture during the day and night.
Foam concrete also increases the construction speed several times compared to the
normal concrete. On the other hand, foam concrete is also an eco-compatibility
9
material as it does not produce any toxic substances. Last but not least, foam
concrete is also a lot cheaper than the normal concrete in terms of transportation as
well as reduction in manpower.
2.3 Disadvantages of Lightweight Foamed Concrete
Foamed concrete also carries a few disadvantages. First of all, it is very sensitive
with water content in the mixtures. Besides, it is also very difficult to place and finish
because of the porosity and angularity of the aggregate. In some mixes, the cement
mortar may separate the aggregate and float towards the surface. In addition, the
mixing time is longer than conventional concrete to assure proper mixing. One of the
major disadvantages of foam concrete has been the inability to provide consistent
compressive strengths and density throughout the entire area. (Neville, 1985)
2.4 Application of Lightweight Foamed Concrete
Foamed concrete can be used for a wide range of applications as insulation, infill and
lightweight foundations. It is used in securing old mine-workings, shafts tunnels and
other underground voids. Besides, it also can be used to fill redundant sewers,
pipelines fuel-tanks, culverts and subways. Other than that, foam concrete is also
used in rodent exclusion infill beneath railway station platforms, infill spandrel
arches under bridges and viaducts, roof screeds and floor insulation, soil stabilization
and replacement, harbour retaining wall backfill, airport aircraft arrestor beds,
annulus fill of pipelines, tunnel-liner backfill, road foundations and many more.
(Neville, 1985)
10
2.5 Compressive Strength
Compressive strength is the most important mechanical properties of every concrete
including lightweight foamed concrete as it is playing a very important role in
construction in order to sustain the load and transfer the entire load on top to the
foundation and ground. The compressive strength decreases exponentially with a
reduction in density of lightweight foamed concrete (Kearsley, 1996). Besides that,
in general, there are also some factors will affect the strength of aerated concrete
other than concrete’s density, such as the specimen shape and size, method of pore
formation, direction of loading, curing age, water content, characteristic of
ingredients used and the method of curing are reported to influence the strength of
lightweight foamed concrete (Valore, 1954). In addition, other factors such as the
cement-sand and water-cement ratios, curing regime, type and particle size
distribution of sand and type of foaming agent used also can affecting the
compressive strength of lightweight concrete as well (Aldridge, 2005; Hamidah et al.,
2005). On the other hand, compressive strength is inversely proportional to the void
diameter, especially with a dry density foamed concrete between 500 and 1000 kg/m3.
The composition of the paste determines the compressive strength (Visagie and
Kearsley, 2002) in densities higher than 1000 kg/m3
because the air-void is far apart
to have an effect on the compressive strength. On the other hand, compressive
strength of lightweight foamed concrete is not affected by small changes in w/c ratio
(Jones and McCarthy, 2006). Meanwhile, the increases in w/c ratio within the
consistency and stability limit provide an increase in strength of foamed concrete (De
Rose & Morris, 1999; Tam et al., 1987). The compressive strength of lightweight
foamed concrete for various mixture composition and densities was summarized and
reported in literature (Ramamurthy and Nambiar, 2009).
2.6 Flexural and Splitting Tensile Strengths
According to Ramamurthy and Nambiar (2009), the ratio of flexural strength to
compressive strength of lightweight foamed concrete is in the range of 0.25-0.35
11
(Valore, 1954). On the other hand, the splitting tensile strength of lightweight
foamed concrete is lower than normal weight concrete (Ramamurthy et al., 2009).
2.7 Thermal Conductivity
Lightweight foamed concrete possesses good thermal insulation properties due to the
air-void structure contained itself. A study by Aldridge and Ansell (2001) showed
that the thermal conductivity of lightweight foamed concrete of density 1000kg/m3 is
approximately one-sixth the value of typical cement-sand mortar. In addition, the
range of thermal conductivity for dry densities value of 600-1600 kg/m3
is between
0.1 and 0.7 W/mK, reducing with decreasing densities (Jones et al., 2005).
Meanwhile, the thermal conductivity of lightweight foamed concrete is 5 to 30 % of
those measured on normal weight concrete had been proved by Jones and McCarthy
(2005).
2.8 Poisson’s Ratio and Compressive Toughness
Poisson’s ratio represents the ratio of the size change in the direction perpendicular
to the applied force over the expanded length in the direction of the force. Poisson’s
ratio provides the essential metric by which to compare the performance of any
material when strained elastically. Every materials has different Poisson’s ratio as
every material owns different capacity of distortion resistance under mechanical load.
The numerical limits are set by 1/2 and -1, between which all stable isotropic
materials are found. However, Poisson’s ratio is intimately connected with the way
structural elements are packed. For densest metal, the Poisson’s ratio is greater than
0.5 due to the variety of atom sizes. For less densely packed like steel, Poisson’s
ratio is around 1/3. By contrast, the density of covalent solids is directly proportional
to the Poisson’s ratio. On the other hand, Poisson’s ratio is inversely proportional to
the connectivity of structures because the stiff arms in cross-linked structures against
transverse contraction upon tensile loading. ( Lakes, 2011)
12
Compressive toughness is the amount of energy per volume that a material
can absorb before fracturing. There are two factors that affect the compressive
toughness of a material, such as compressive strength and the ductility of the
material. It is because a ductile material can absorb more energy than a brittle
material as it can deform more under the same amount of mechanical forces.
Therefore, a negative Poisson’s ratio can results enhanced in compressive toughness.
( Michael, 2012)
2.9 Foam
According to Ramamurthy and Nambiar (2009), there are two different ways to
produce foamed concrete in which it can produced by pre-foaming method or mixed
foaming method. For pre-foaming method, base mix and stable preformed aqueous
foam are produce individually and then the foam is added into the base mix and
blended thoroughly. For mixed foaming method, the surface active agent is added
and mixed into the base mix ingredient. Next, the foam is produced resulting the void
structure develop in concrete during the mixing process (Byun et al., 1998). The
foam produced must be stable and firm in order to resists the pressure of the mortar
until the cement achieves its initial set and built up with a strong skeleton of concrete
around the void filled with air (Koudriashoff, 1949). The pre-formed foam can be
categorized as wet and dry foam. The wet foam is produced by spraying a solution of
foaming agent over a fine mesh, has 2mm to5 mm bubble size and is relatively less
stable. Dry foam is produced by forcing the foaming agent solution through a series
of high density restrictions and forcing compressed air simultaneously into mixing
chamber. Dry foam is extremely stable and has size smaller than 1 mm. this makes it
easier application in base material required in producing a pump able foam concrete
(Aldridge, 2005). There are some factors may affect the formation of stable foam
concrete mix which are selection of foaming agent, material section and mixture
design strategies, production of foam concrete, performance with respect to fresh and
hardened state are of greater significance, method of foam preparation and addition
for uniform air-voids distribution.
13
2.10 Ordinary Portland Cement
Ordinary Portland Cement (OPC) was classified as Type I cement as according to
ASTM C150 (2005). OPC was the most common cement in use in construction
industry in the world when there is no exposure to sulphates in soil or groundwater
(Neville, 2010).
2.10.1 Chemical Composition of Portland Cement
Generally, the chemical compositions of Portland cement are varying due to supply
from different manufacturers. However, the main chemical compositions contains in
OPC are limestone, alumina and silica because these chemical compositions are
playing an important role in hydration process in order to form calcium silicate
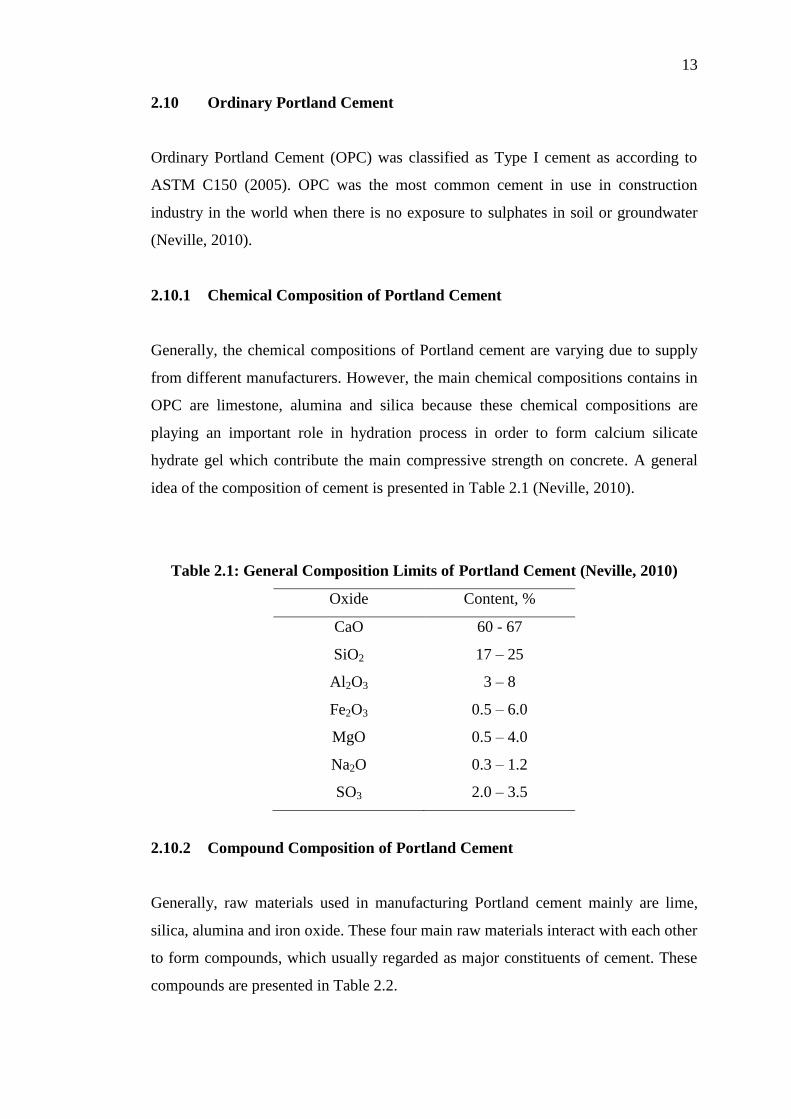
hydrate gel which contribute the main compressive strength on concrete. A general
idea of the composition of cement is presented in Table 2.1 (Neville, 2010).
Table 2.1: General Composition Limits of Portland Cement (Neville, 2010)
Oxide Content, %
CaO 60 - 67
SiO2 17 – 25
Al2O3 3 – 8
Fe2O3 0.5 – 6.0
MgO 0.5 – 4.0
Na2O 0.3 – 1.2
SO3 2.0 – 3.5
2.10.2 Compound Composition of Portland Cement
Generally, raw materials used in manufacturing Portland cement mainly are lime,
silica, alumina and iron oxide. These four main raw materials interact with each other
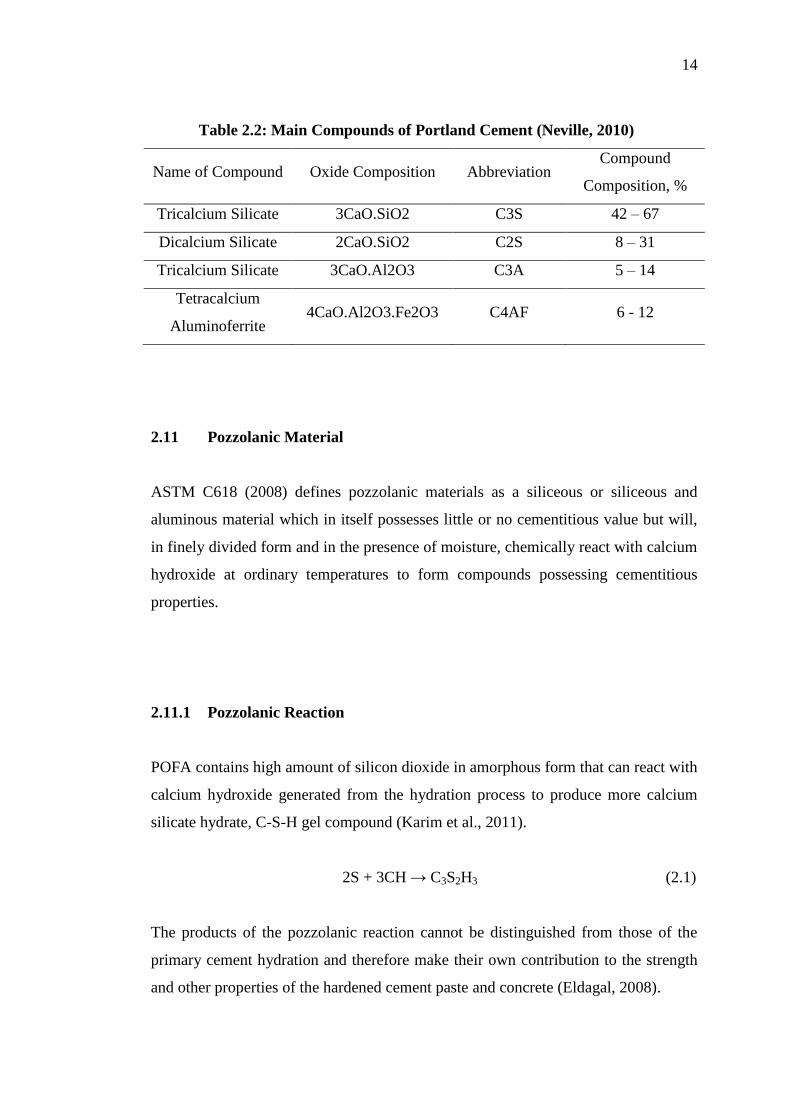
to form compounds, which usually regarded as major constituents of cement. These
compounds are presented in Table 2.2.
14
Table 2.2: Main Compounds of Portland Cement (Neville, 2010)
Name of Compound Oxide Composition Abbreviation Compound
Composition, %
Tricalcium Silicate 3CaO.SiO2 C3S 42 – 67
Dicalcium Silicate 2CaO.SiO2 C2S 8 – 31
Tricalcium Silicate 3CaO.Al2O3 C3A 5 – 14
Tetracalcium
Aluminoferrite 4CaO.Al2O3.Fe2O3 C4AF 6 - 12
2.11 Pozzolanic Material
ASTM C618 (2008) defines pozzolanic materials as a siliceous or siliceous and
aluminous material which in itself possesses little or no cementitious value but will,
in finely divided form and in the presence of moisture, chemically react with calcium
hydroxide at ordinary temperatures to form compounds possessing cementitious
properties.
2.11.1 Pozzolanic Reaction
POFA contains high amount of silicon dioxide in amorphous form that can react with
calcium hydroxide generated from the hydration process to produce more calcium
silicate hydrate, C-S-H gel compound (Karim et al., 2011).
2S + 3CH → C3S2H3 (2.1)
The products of the pozzolanic reaction cannot be distinguished from those of the
primary cement hydration and therefore make their own contribution to the strength
and other properties of the hardened cement paste and concrete (Eldagal, 2008).
15
2.11.2 Origin of POFA
As discussed in previous chapter, Malaysia is being the largest palm oil producing
and exporting country in the world. In 2011, the Malaysian Palm Oil Board (MPOB)
predicted that the total oil palm planted area in Malaysia is 5 million hectares.
Besides, the total amount of fresh fruit bunches processes are approximately 98.5
million tonnes and approximated 68.9 million tonnes of solid waste by-products in
the form of fibers, kernels and empty fruit bunches are produced, which is about 70 %
of fresh fruit bunches processed (MPOB, 2011). The combustion of palm oil husk
and palm kernel shell in the steam boiler produces POFA, which is approximately 5 %
of solid waste by-product, equivalent to 3.5 million tonnes in Malaysia in 2011
(Tangchirapat et al., 2007).
Based on the MPOB annual report, it is clearly show that the amount of
POFA produced had been increased compared to last year, which lead to increase in
solid waste by-product were discarded as environmental polluting waste in future
(Tangchirapat et al., 2007). However, POFA had been proved that can be recycled
and reused as cement replacement material or as filler in concrete due to the
pozzolanic properties it possesses (Tay, 1995; Hussin and Awal, 1997; Tangchirapat
et al., 2007).
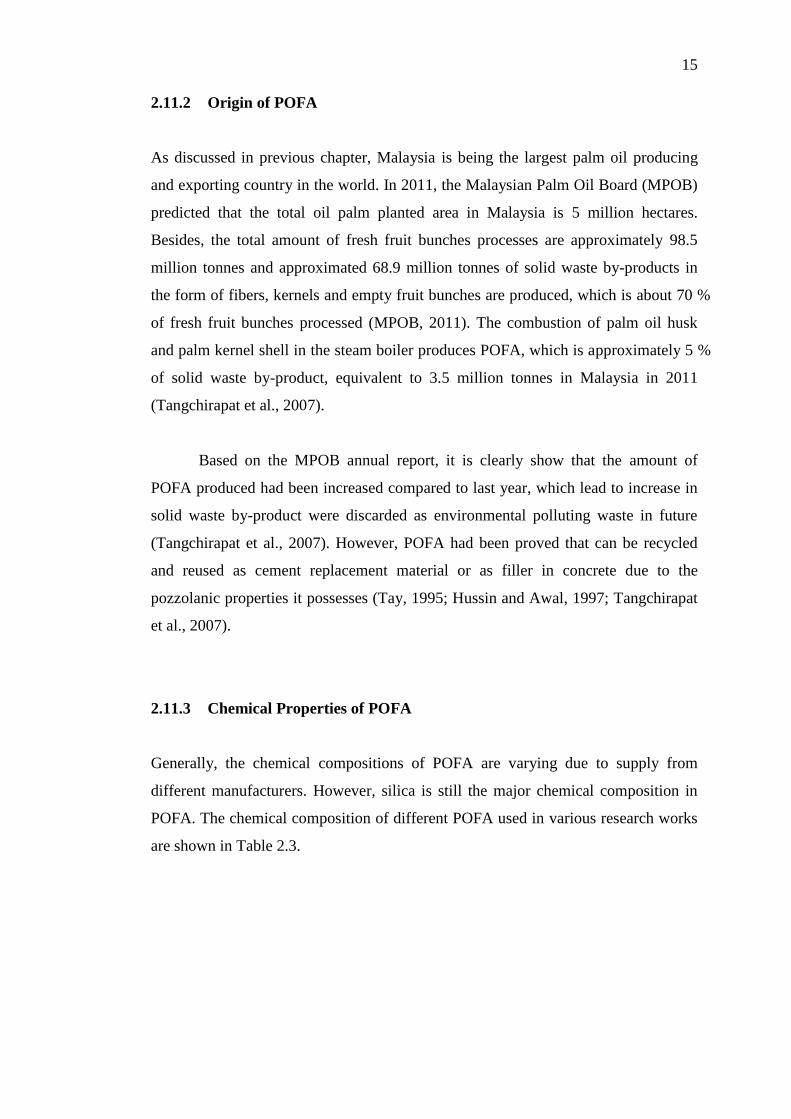
2.11.3 Chemical Properties of POFA
Generally, the chemical compositions of POFA are varying due to supply from
different manufacturers. However, silica is still the major chemical composition in
POFA. The chemical composition of different POFA used in various research works
are shown in Table 2.3.
16
Table 2.3: Chemical Composition of POFA Used In Various Researches (Awal,
1997; Tangchirapat, 2007; Eldagal, 2008 )
Chemical Composition Awal Tangchirapat Eldagal
Silicon dioxiode (SiO2) 43.60 57.71 48.99
Aluminum oxide (Al2O3) 11.50 4.56 3.78
Ferric oxide (Fe2O3) 4.70 3.30 4.89
Calcium oxide (CaO) 8.40 6.55 11.69
Magnesium oxide (MgO) 4.80 4.23 1.22
Sulphur oxide (SO3) 2.80 0.25 -
Sodium oxide (Na2O) 0.39 0.50 0.73
Potassium oxide (K2O) 3.50 8.27 4.01
Loss of ignition (LOI) 18.00 10.52 10.51
*All values are in percentage
According to ASTM C618 (2008), fly ash can be classified into three class, namely
Class N fly ash, Class F fly ash and Class C fly ash. Based on the chemical
composition of different POFA used in various research works, it shows that
generally POFA is classified as Class F fly ash as complied with ASTM C618 (2008).
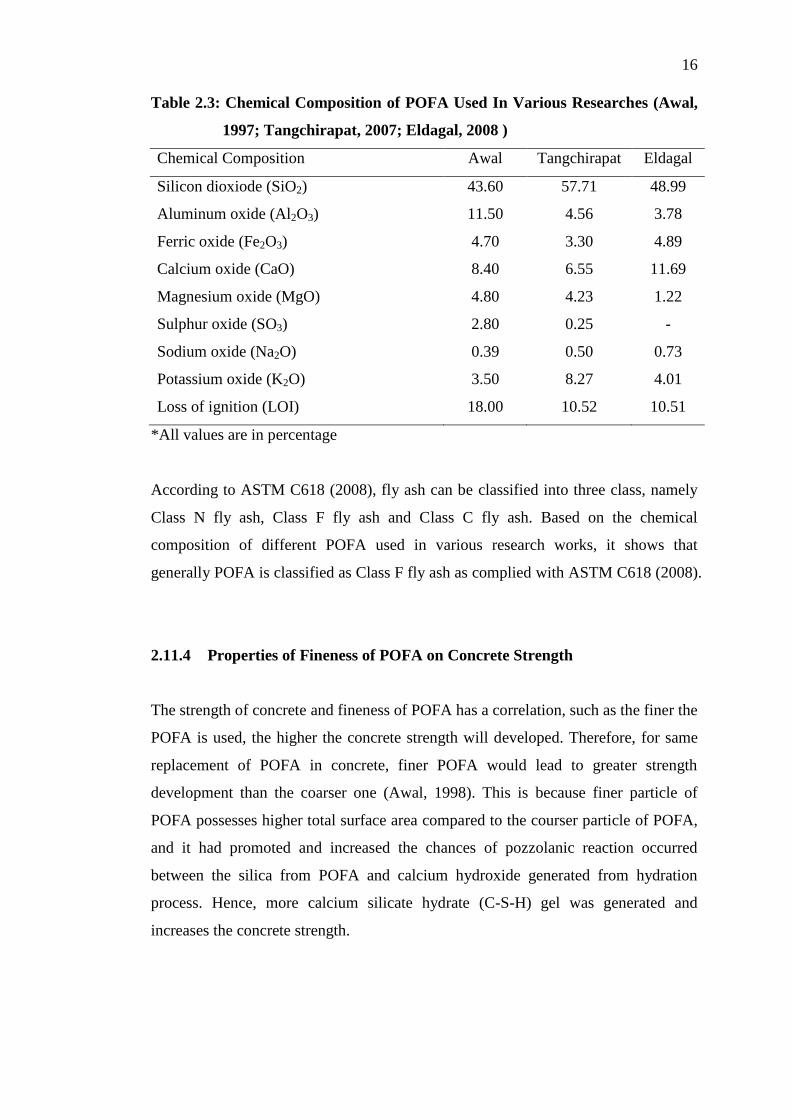
2.11.4 Properties of Fineness of POFA on Concrete Strength
The strength of concrete and fineness of POFA has a correlation, such as the finer the
POFA is used, the higher the concrete strength will developed. Therefore, for same
replacement of POFA in concrete, finer POFA would lead to greater strength
development than the coarser one (Awal, 1998). This is because finer particle of
POFA possesses higher total surface area compared to the courser particle of POFA,
and it had promoted and increased the chances of pozzolanic reaction occurred
between the silica from POFA and calcium hydroxide generated from hydration
process. Hence, more calcium silicate hydrate (C-S-H) gel was generated and
increases the concrete strength.
17
Figure 2.1: Effect of Fineness of Ash on Concrete Compressive Strength (Awal,
1998)
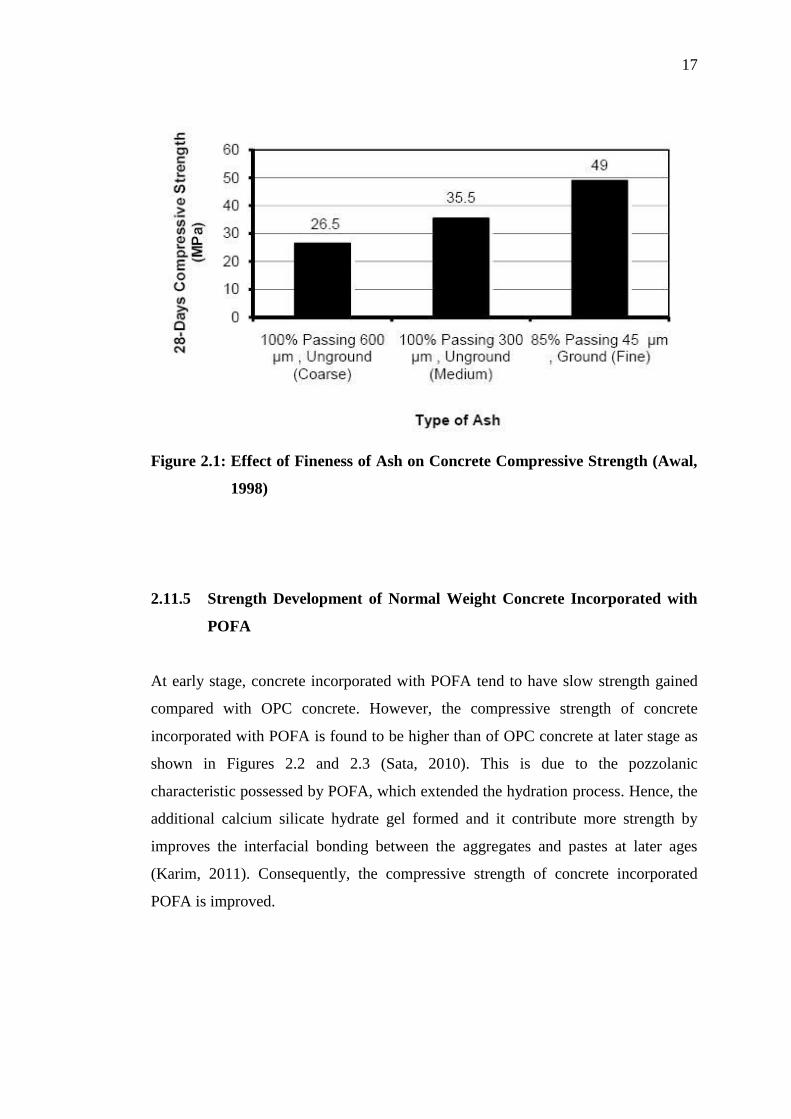
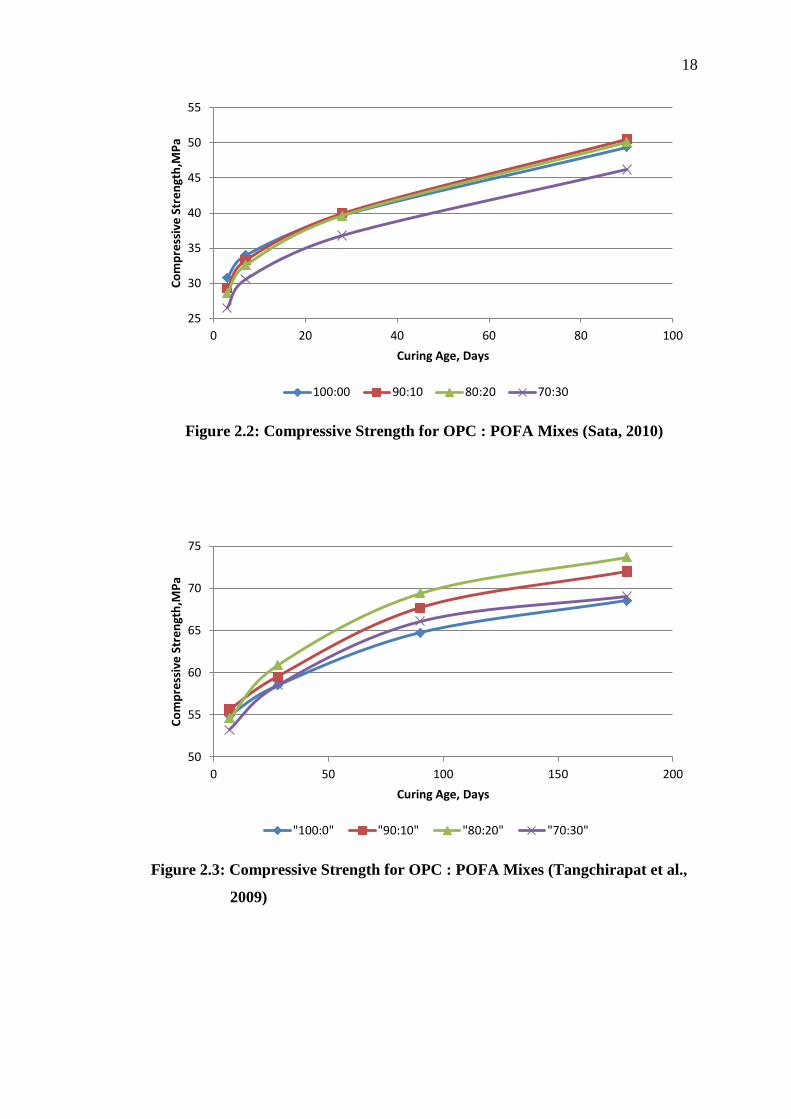
2.11.5 Strength Development of Normal Weight Concrete Incorporated with
POFA
At early stage, concrete incorporated with POFA tend to have slow strength gained
compared with OPC concrete. However, the compressive strength of concrete
incorporated with POFA is found to be higher than of OPC concrete at later stage as
shown in Figures 2.2 and 2.3 (Sata, 2010). This is due to the pozzolanic
characteristic possessed by POFA, which extended the hydration process. Hence, the
additional calcium silicate hydrate gel formed and it contribute more strength by
improves the interfacial bonding between the aggregates and pastes at later ages
(Karim, 2011). Consequently, the compressive strength of concrete incorporated
POFA is improved.
18
Figure 2.2: Compressive Strength for OPC : POFA Mixes (Sata, 2010)
Figure 2.3: Compressive Strength for OPC : POFA Mixes (Tangchirapat et al.,
2009)
25
30
35
40
45
50
55
0 20 40 60 80 100
Co
mp
ress
ive
Str
en
gth
,MP
a
Curing Age, Days
100:00 90:10 80:20 70:30
50
55
60
65
70
75
0 50 100 150 200
Co
mp
ress
ive
Str
en
gth
,MP
a
Curing Age, Days
"100:0" "90:10" "80:20" "70:30"
19
2.12 Summary
Lightweight foamed concrete is categorized as one type of lightweight concrete as it
is containing no large aggregates, only fine sand and with extremely light weight
materials containing cement, water and incorporation of foam, where a homogeneous
void or pore structure created by entraining the forming agent in a form of bubble in
mortar or cement paste. Lightweight foamed concrete can be produced by either pre-
foaming method or mixed foaming method.
Lightweight foamed concrete can be used to provide more economic
structural design due to its low density properties and it may lead reduction of size of
bearing load structure as well. The ease of handling the lightweight foamed concrete
due to its high workability has save labour cost and speed up the construction process.
Besides, lightweight foamed concrete is also good in thermal insulation and
acoustical insulation due to its higher porous structure properties.
POFA is a by-product from palm oil industries which contains high amount
of silicon dioxide in amorphous form. By incorporate of POFA with lightweight
foamed concrete, it can react with calcium hydroxide generated from the hydration
process to produce more calcium silicate hydrate, C-S-H gel compound and it
contribute more strength to the concrete by improves the interfacial bonding between
the aggregates and pastes at later ages. Consequently, the compressive strength of
concrete incorporated POFA is improved.
20
CHAPTER 3
METHODOLOGY
3.1 Introduction
This chapter describes the materials used, the mixing procedures and the test
methods followed in conducting various experimental investigations. The strength
and density of lightweight foamed concrete incorporated with POFA are the two
major areas of study in determining the optimum mix proportions. At the beginning,
the collection and preparation of materials are presented in details, followed by
presentation of the mixing procedures and test procedures for the lightweight foamed
concrete specimens with POFA as part of filler.
3.2 Raw Materials
The specimen production for lightweight foamed concrete incorporated with POFA
consist of five types of raw material, namely ordinary Portland cement, POFA, sand,
water and foam.
3.2.1 Ordinary Portland Cement
The Ordinary Portland Cement (OPC) which is produced by YTL Cement Sdn. Bhd
under the brand name of “ORANG KUAT” was used throughout the study. The OPC
was sieved through 600μm sieve and was stored in an airtight container in order to
maintain the quality of cement such as to prevent air moisture contact as hydrated
21
cement particle would affect the formation of calcium silicate hydrate gel. According
to ASTM C150 (2005), the OPC used throughout this research is complied with
Type I Portland Cement and the details chemical composition of OPC is given in
Table 3.1
3.2.2 Palm Oil Fuel Ash (POFA)
In this present study, POFA was obtained from Southern Edible Oil Industries (M)
Sdn. Bhd. at Kapar, Selangor. The POFA is generated in the form of ash from the
combustion of palm oil husks and kernel shell in steam boiler. The collected POFA
was dried in an oven at temperature of 105 °C ± 5 °C for twenty four hours in order
to remove the moisture content in it. Next, the dried POFA was sieved through a 600
μm sieve to remove bigger size particles and any other impurities. Only the fine
ashes passing through 600 μm sieve were collected and stored in airtight container.
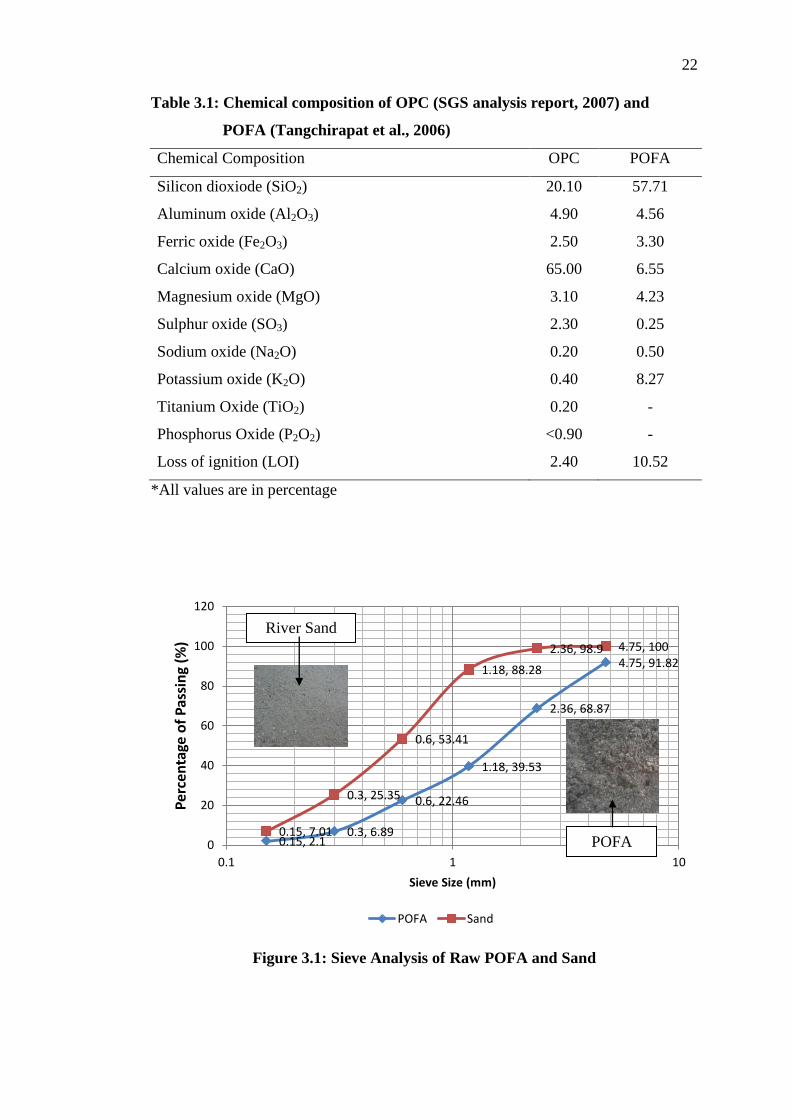
According to ASTM C618 (2008), the POFA is categorize as Class F Fly Ash
based on its chemical composition. The chemical composition of POFA is stated in
Table 3.1 and sieve analysis of POFA is illustrated in Figure 3.1. The fineness
modulus for POFA is 2.64.
22
Table 3.1: Chemical composition of OPC (SGS analysis report, 2007) and
POFA (Tangchirapat et al., 2006)
Chemical Composition OPC POFA
Silicon dioxiode (SiO2) 20.10 57.71
Aluminum oxide (Al2O3) 4.90 4.56
Ferric oxide (Fe2O3) 2.50 3.30
Calcium oxide (CaO) 65.00 6.55
Magnesium oxide (MgO) 3.10 4.23
Sulphur oxide (SO3) 2.30 0.25
Sodium oxide (Na2O) 0.20 0.50
Potassium oxide (K2O) 0.40 8.27
Titanium Oxide (TiO2) 0.20 -
Phosphorus Oxide (P2O2) <0.90 -
Loss of ignition (LOI) 2.40 10.52
*All values are in percentage
Figure 3.1: Sieve Analysis of Raw POFA and Sand
4.75, 91.82
2.36, 68.87
1.18, 39.53
0.6, 22.46
0.3, 6.89 0.15, 2.1
4.75, 100 2.36, 98.9
1.18, 88.28
0.6, 53.41
0.3, 25.35
0.15, 7.01 0
20
40
60
80
100
120
0.1 1 10
Per
cen
tage
of
Pas
sin
g (%
)
Sieve Size (mm)
POFA Sand
River Sand
POFA
23
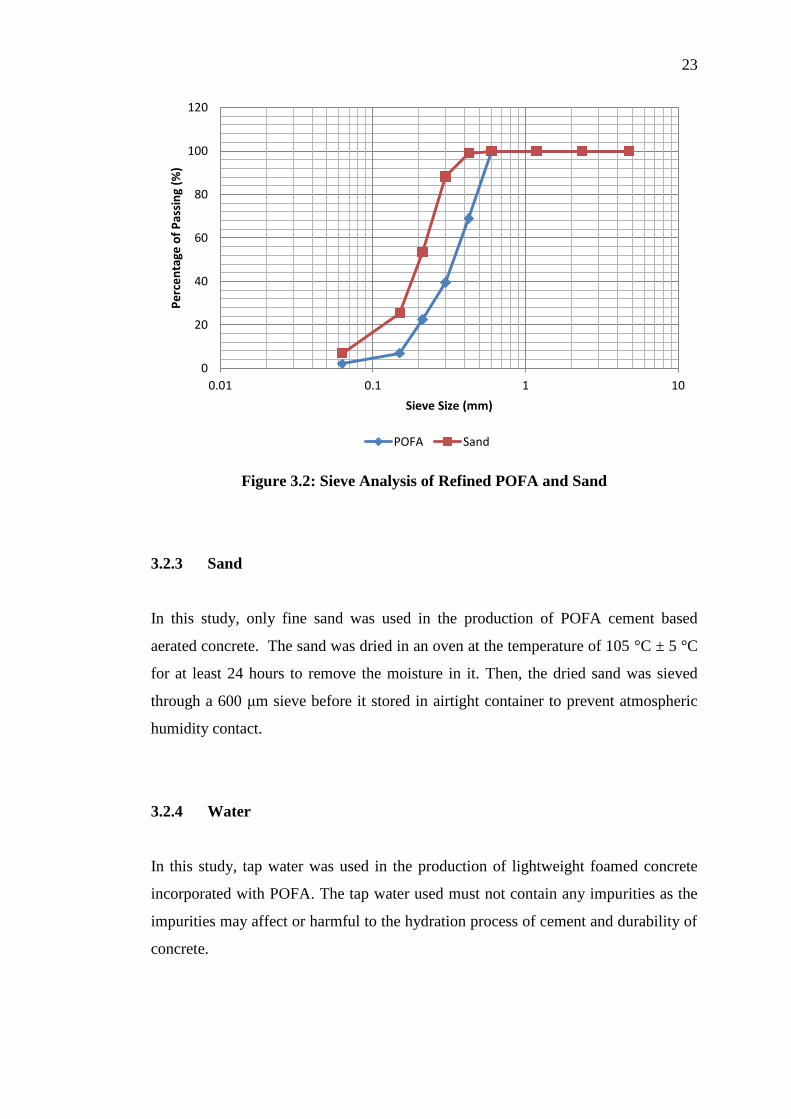
Figure 3.2: Sieve Analysis of Refined POFA and Sand
3.2.3 Sand
In this study, only fine sand was used in the production of POFA cement based
aerated concrete. The sand was dried in an oven at the temperature of 105 °C ± 5 °C
for at least 24 hours to remove the moisture in it. Then, the dried sand was sieved
through a 600 μm sieve before it stored in airtight container to prevent atmospheric
humidity contact.
3.2.4 Water
In this study, tap water was used in the production of lightweight foamed concrete
incorporated with POFA. The tap water used must not contain any impurities as the
impurities may affect or harmful to the hydration process of cement and durability of
concrete.
0
20
40
60
80
100
120
0.01 0.1 1 10
Pe
rce
nta
ge o
f P
assi
ng
(%)
Sieve Size (mm)
POFA Sand
24
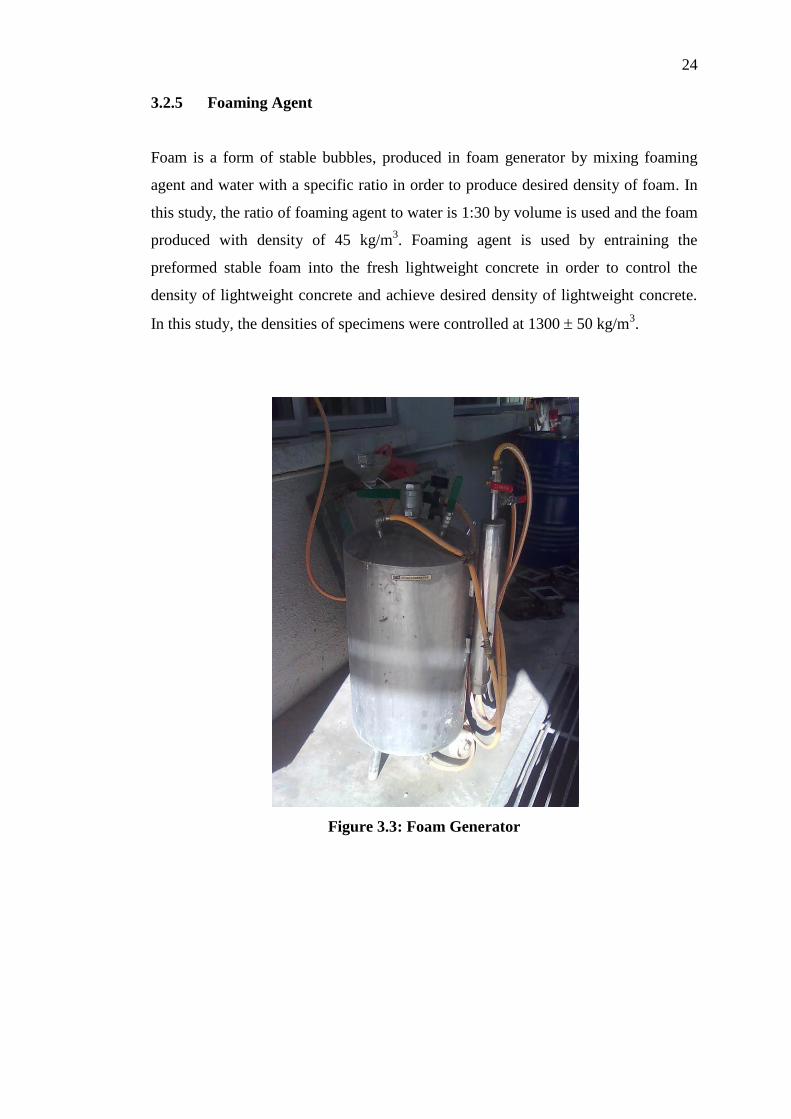
3.2.5 Foaming Agent
Foam is a form of stable bubbles, produced in foam generator by mixing foaming
agent and water with a specific ratio in order to produce desired density of foam. In
this study, the ratio of foaming agent to water is 1:30 by volume is used and the foam
produced with density of 45 kg/m3. Foaming agent is used by entraining the
preformed stable foam into the fresh lightweight concrete in order to control the
density of lightweight concrete and achieve desired density of lightweight concrete.
In this study, the densities of specimens were controlled at 1300 50 kg/m3.
Figure 3.3: Foam Generator
25
3.3 Mix Proportions and Trial Mix
A trial and error process is commonly adopted to achieve foamed concrete with the
desired properties (Nehdi et al., 2001). In this study, this method is adopted in term
of w/c ratio in trial mixes in order to obtain the optimum mix proportion of the
normal aerated concrete containing 100% of sand and lightweight foamed concrete
incorporated with POFA. The optimum mix proportion was obtained based on
density and strength of lightweight foamed concrete incorporated with POFA.
In this study, during trial mixing, three types of mix proportion were casted
such as LFC with 100 % sand as filler (LFC-CM) which was used as control
specimen, 25 % POFA replacement as part of filler (LFC-PF25) and 50 % POFA
replacement as part of filler (LFC-PF50). The water to cement ratio for each type of
mix proportion was tried from the range of 0.52 to 0.60 with the increment of 0.02
for each mix. Density for every mix was controlled to 1300 kg/m3 ± 50 kg/m
3.
3.4 Mixing Procedure
Firstly, OPC, Sand and POFA were weighted and mixed in dry condition in a
concrete mixer until the dry mix was uniformly mixed. Next, water was weighted
and added into the dry mix and mixed until the wet mix was uniformly mixed. After
that, an amount of foam was weighted and added into the wet mix repeatedly until
the desired density, 1300 ± 50 kg/m3
was achieved. Lastly, inverted slump test was
carried out before fresh lightweight foamed concrete was poured into the mould.
3.5 Curing Condition
Curing condition is very important in gaining the strength of lightweight foamed
concrete as it provides good condition for hydration process of concrete specimens.
In this study, water curing method was adopted and all specimens were cure in water
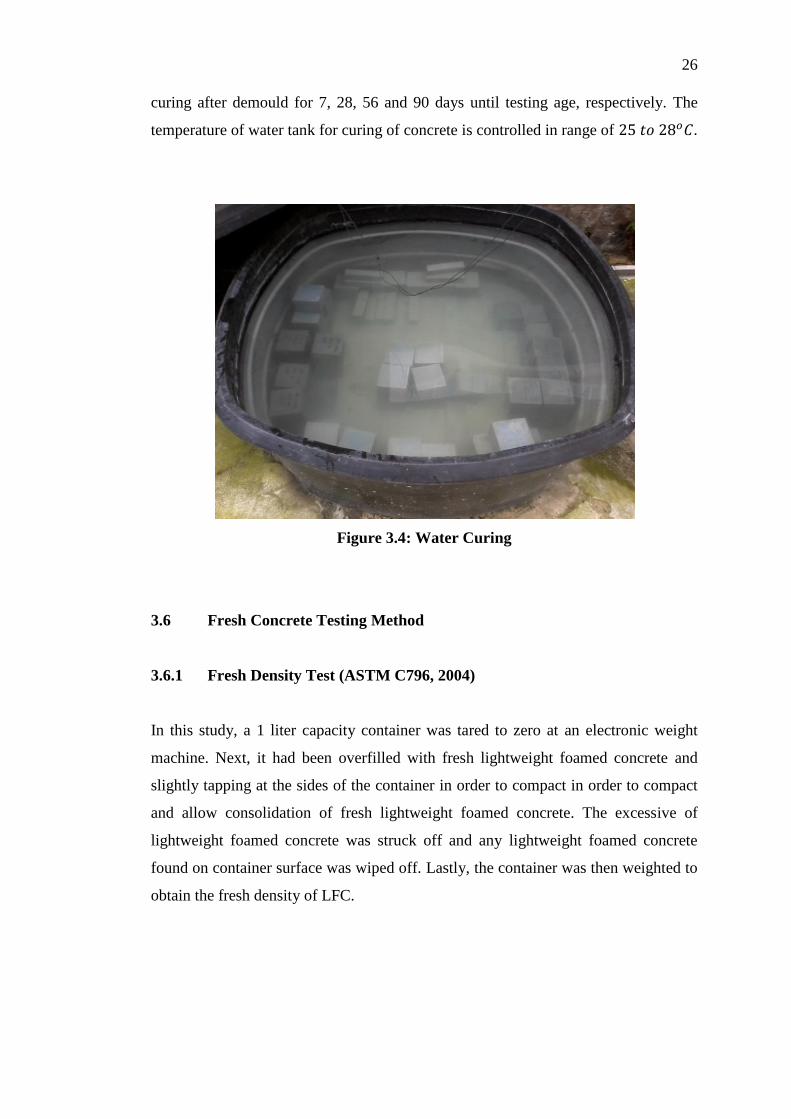
26
curing after demould for 7, 28, 56 and 90 days until testing age, respectively. The
temperature of water tank for curing of concrete is controlled in range of
Figure 3.4: Water Curing
3.6 Fresh Concrete Testing Method
3.6.1 Fresh Density Test (ASTM C796, 2004)
In this study, a 1 liter capacity container was tared to zero at an electronic weight
machine. Next, it had been overfilled with fresh lightweight foamed concrete and
slightly tapping at the sides of the container in order to compact in order to compact
and allow consolidation of fresh lightweight foamed concrete. The excessive of
lightweight foamed concrete was struck off and any lightweight foamed concrete
found on container surface was wiped off. Lastly, the container was then weighted to
obtain the fresh density of LFC.
27
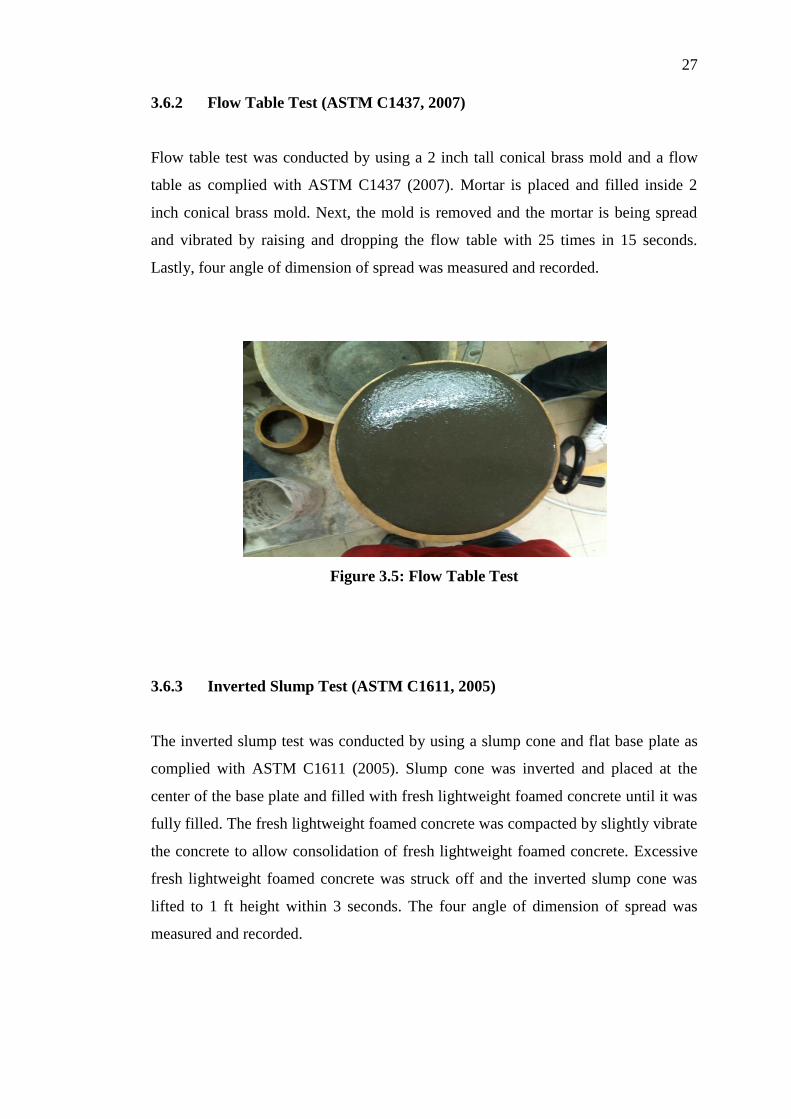
3.6.2 Flow Table Test (ASTM C1437, 2007)
Flow table test was conducted by using a 2 inch tall conical brass mold and a flow
table as complied with ASTM C1437 (2007). Mortar is placed and filled inside 2
inch conical brass mold. Next, the mold is removed and the mortar is being spread
and vibrated by raising and dropping the flow table with 25 times in 15 seconds.
Lastly, four angle of dimension of spread was measured and recorded.
Figure 3.5: Flow Table Test
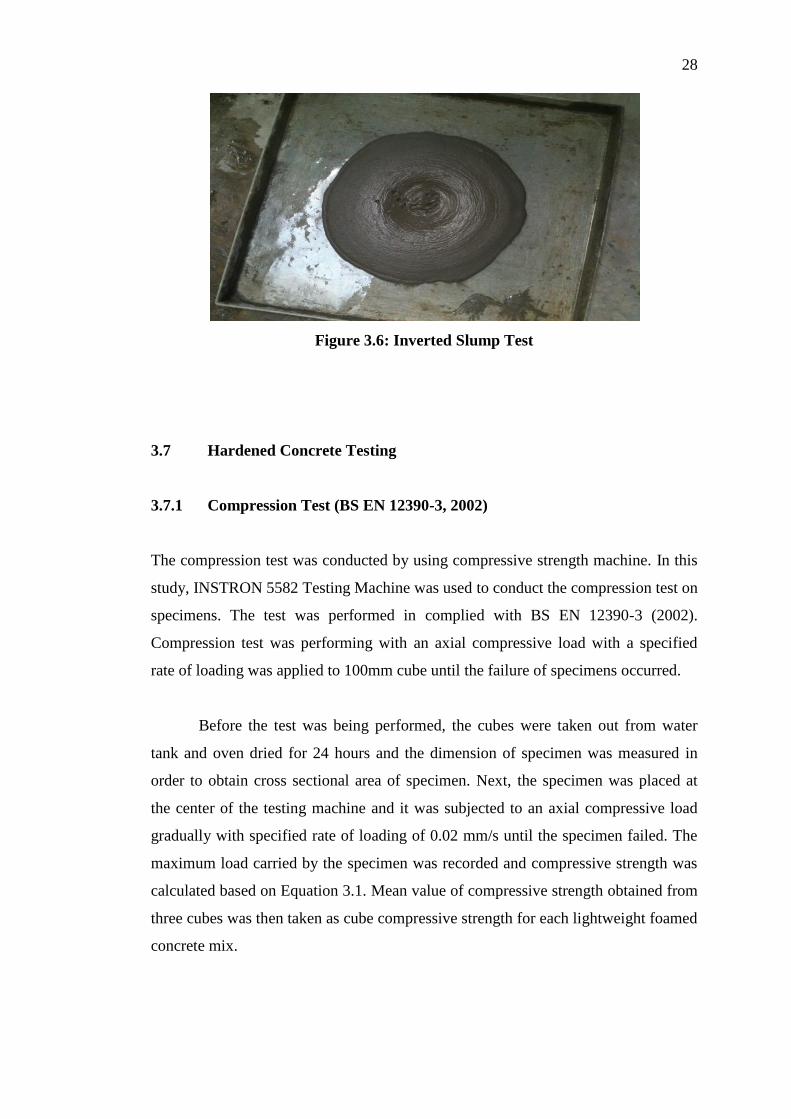
3.6.3 Inverted Slump Test (ASTM C1611, 2005)
The inverted slump test was conducted by using a slump cone and flat base plate as
complied with ASTM C1611 (2005). Slump cone was inverted and placed at the
center of the base plate and filled with fresh lightweight foamed concrete until it was
fully filled. The fresh lightweight foamed concrete was compacted by slightly vibrate
the concrete to allow consolidation of fresh lightweight foamed concrete. Excessive
fresh lightweight foamed concrete was struck off and the inverted slump cone was
lifted to 1 ft height within 3 seconds. The four angle of dimension of spread was
measured and recorded.
28
Figure 3.6: Inverted Slump Test
3.7 Hardened Concrete Testing
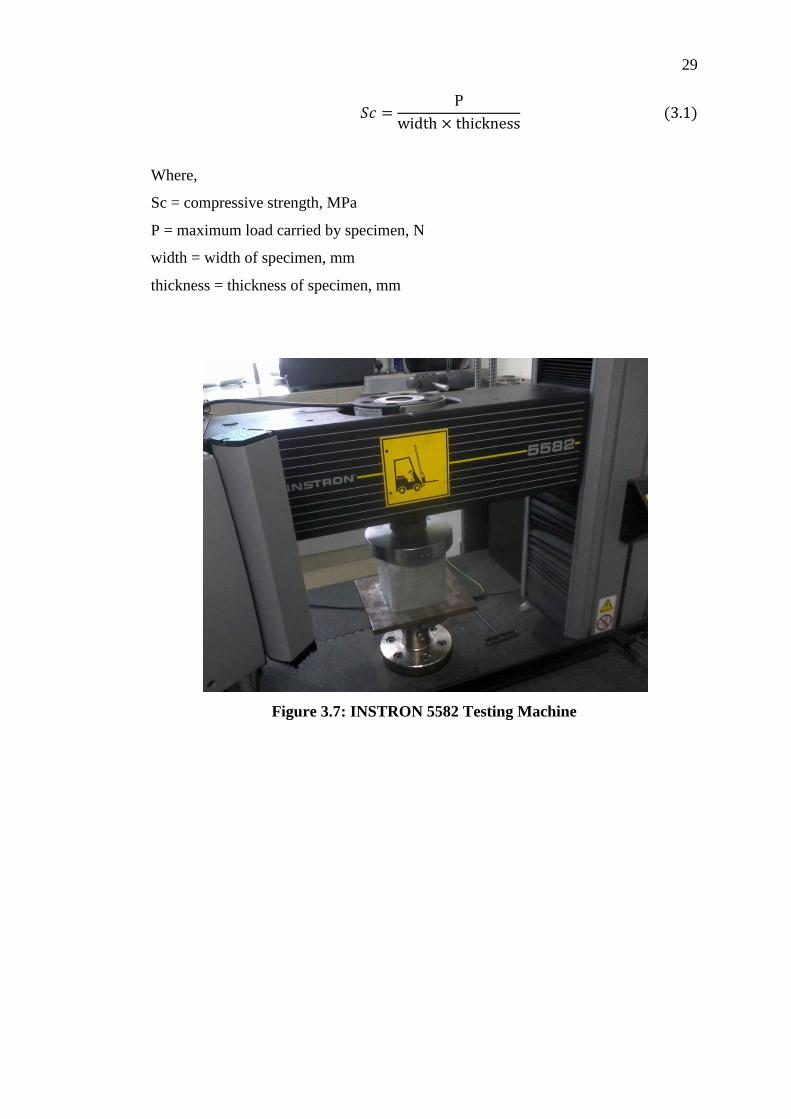
3.7.1 Compression Test (BS EN 12390-3, 2002)
The compression test was conducted by using compressive strength machine. In this
study, INSTRON 5582 Testing Machine was used to conduct the compression test on
specimens. The test was performed in complied with BS EN 12390-3 (2002).
Compression test was performing with an axial compressive load with a specified
rate of loading was applied to 100mm cube until the failure of specimens occurred.
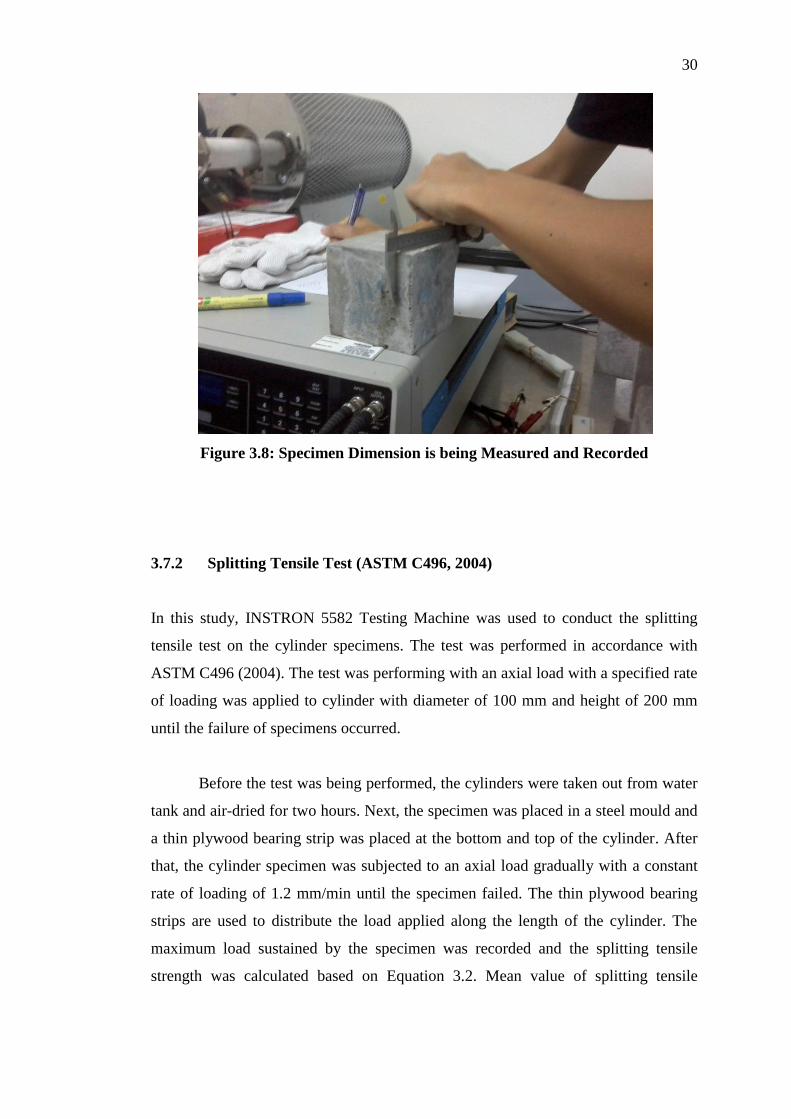
Before the test was being performed, the cubes were taken out from water
tank and oven dried for 24 hours and the dimension of specimen was measured in
order to obtain cross sectional area of specimen. Next, the specimen was placed at
the center of the testing machine and it was subjected to an axial compressive load
gradually with specified rate of loading of 0.02 mm/s until the specimen failed. The
maximum load carried by the specimen was recorded and compressive strength was
calculated based on Equation 3.1. Mean value of compressive strength obtained from
three cubes was then taken as cube compressive strength for each lightweight foamed
concrete mix.
29
Where,
Sc = compressive strength, MPa
P = maximum load carried by specimen, N
width = width of specimen, mm
thickness = thickness of specimen, mm
Figure 3.7: INSTRON 5582 Testing Machine
30
Figure 3.8: Specimen Dimension is being Measured and Recorded
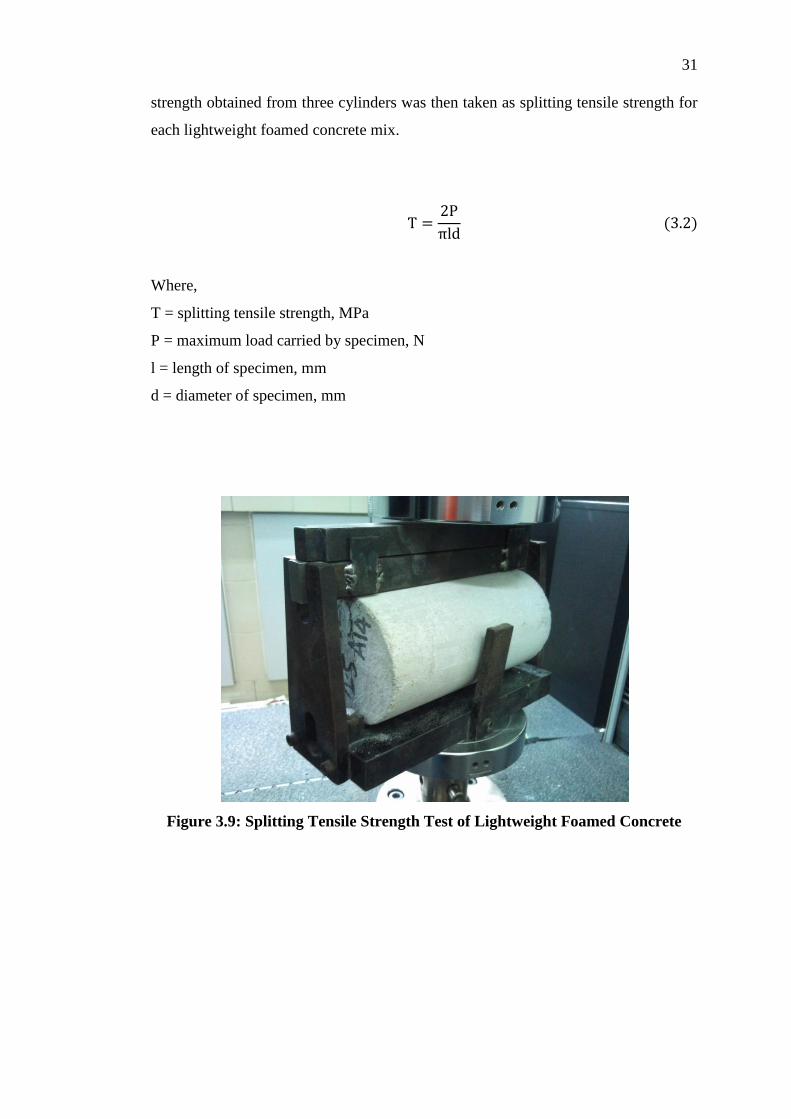
3.7.2 Splitting Tensile Test (ASTM C496, 2004)
In this study, INSTRON 5582 Testing Machine was used to conduct the splitting
tensile test on the cylinder specimens. The test was performed in accordance with
ASTM C496 (2004). The test was performing with an axial load with a specified rate
of loading was applied to cylinder with diameter of 100 mm and height of 200 mm
until the failure of specimens occurred.
Before the test was being performed, the cylinders were taken out from water
tank and air-dried for two hours. Next, the specimen was placed in a steel mould and
a thin plywood bearing strip was placed at the bottom and top of the cylinder. After
that, the cylinder specimen was subjected to an axial load gradually with a constant
rate of loading of 1.2 mm/min until the specimen failed. The thin plywood bearing
strips are used to distribute the load applied along the length of the cylinder. The
maximum load sustained by the specimen was recorded and the splitting tensile
strength was calculated based on Equation 3.2. Mean value of splitting tensile
31
strength obtained from three cylinders was then taken as splitting tensile strength for
each lightweight foamed concrete mix.
Where,
T = splitting tensile strength, MPa
P = maximum load carried by specimen, N
l = length of specimen, mm
d = diameter of specimen, mm
Figure 3.9: Splitting Tensile Strength Test of Lightweight Foamed Concrete
32
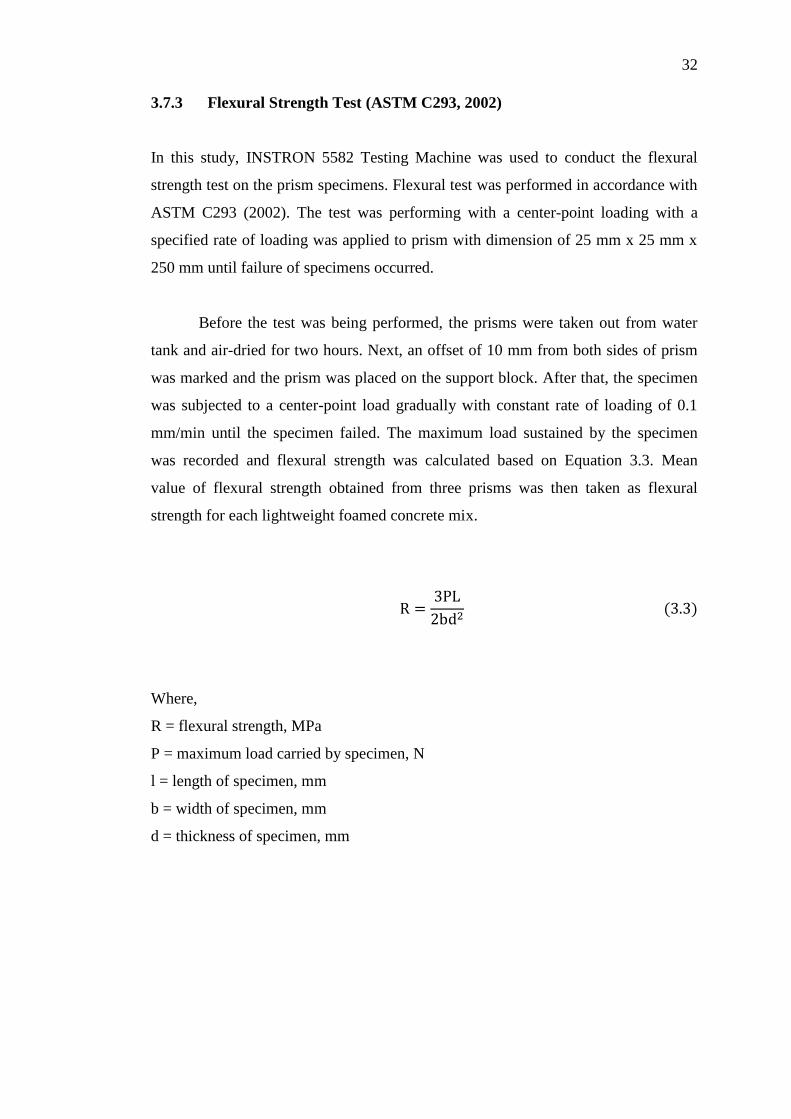
3.7.3 Flexural Strength Test (ASTM C293, 2002)
In this study, INSTRON 5582 Testing Machine was used to conduct the flexural
strength test on the prism specimens. Flexural test was performed in accordance with
ASTM C293 (2002). The test was performing with a center-point loading with a
specified rate of loading was applied to prism with dimension of 25 mm x 25 mm x
250 mm until failure of specimens occurred.
Before the test was being performed, the prisms were taken out from water
tank and air-dried for two hours. Next, an offset of 10 mm from both sides of prism
was marked and the prism was placed on the support block. After that, the specimen
was subjected to a center-point load gradually with constant rate of loading of 0.1
mm/min until the specimen failed. The maximum load sustained by the specimen
was recorded and flexural strength was calculated based on Equation 3.3. Mean
value of flexural strength obtained from three prisms was then taken as flexural
strength for each lightweight foamed concrete mix.
Where,
R = flexural strength, MPa
P = maximum load carried by specimen, N
l = length of specimen, mm
b = width of specimen, mm
d = thickness of specimen, mm
33
Figure 3.10: Flexural Strength Test of Lightweight Foamed Concrete
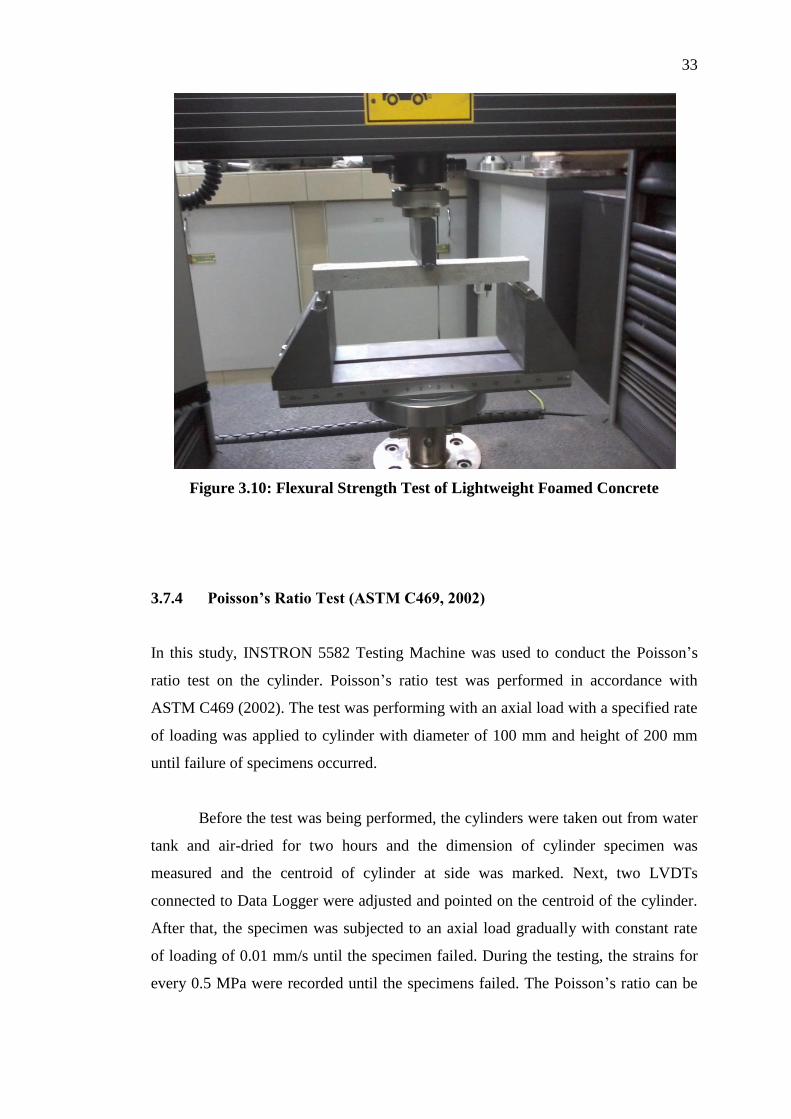
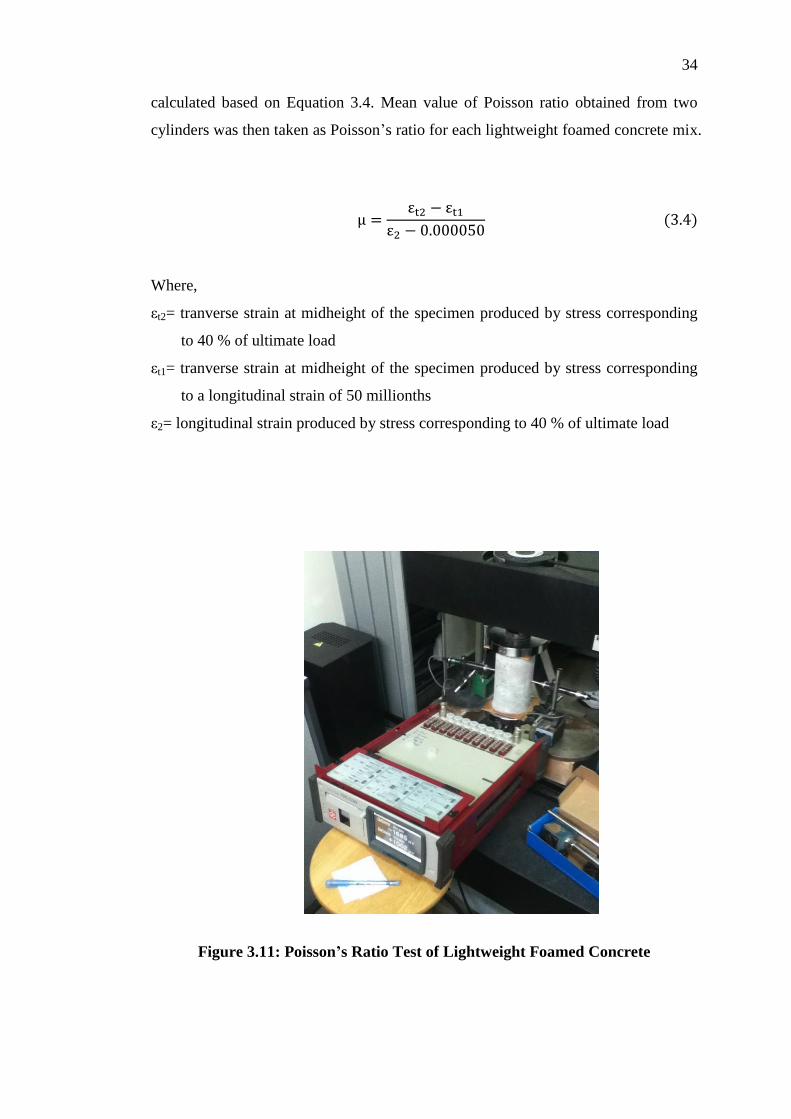
3.7.4 Poisson’s Ratio Test (ASTM C469, 2002)
In this study, INSTRON 5582 Testing Machine was used to conduct the Poisson’s
ratio test on the cylinder. Poisson’s ratio test was performed in accordance with
ASTM C469 (2002). The test was performing with an axial load with a specified rate
of loading was applied to cylinder with diameter of 100 mm and height of 200 mm
until failure of specimens occurred.
Before the test was being performed, the cylinders were taken out from water
tank and air-dried for two hours and the dimension of cylinder specimen was
measured and the centroid of cylinder at side was marked. Next, two LVDTs
connected to Data Logger were adjusted and pointed on the centroid of the cylinder.
After that, the specimen was subjected to an axial load gradually with constant rate
of loading of 0.01 mm/s until the specimen failed. During the testing, the strains for
every 0.5 MPa were recorded until the specimens failed. The Poisson’s ratio can be
34
calculated based on Equation 3.4. Mean value of Poisson ratio obtained from two
cylinders was then taken as Poisson’s ratio for each lightweight foamed concrete mix.
Where,
εt2= tranverse strain at midheight of the specimen produced by stress corresponding
to 40 % of ultimate load
εt1= tranverse strain at midheight of the specimen produced by stress corresponding
to a longitudinal strain of 50 millionths
ε2= longitudinal strain produced by stress corresponding to 40 % of ultimate load
Figure 3.11: Poisson’s Ratio Test of Lightweight Foamed Concrete
35
3.7.5 Compressive Toughness
The Poisson’s ratio toughness is determined based on Poisson’s ratio stress-strain
diagrams plotted. The areas under the vertical deformation of Poisson’s ratio stress-
strain diagrams that represented the total energy to fracture each specimen, also
known as toughness of the material were computed by using integration method as
shown in Equation 3.5.
∫
where,
ut = toughness (J/m3)
ε = strain (10-6
mm/mm)
εf = strain upon failure (10-6
mm/mm)
σ = Maximum compressive strength (MPa)
3.7.6 Strength Activity Index Test
Strength Activity Index test is one of the compression test and it was
performed with 50mm cubes in accordance with Test Method C 109/C 109M.
Before the test was being performed, the cubes were taken out from water tank and
oven dried for 24 hours and the dimension of specimen was measured in order to
obtain cross sectional area of specimen. Next, the specimen was placed at the center
of the testing machine and it was subjected to an axial compressive load gradually
with a loading rate in range of 900 to 1800 N/s until the specimen failed. The
maximum load carried by the specimen was recorded and compressive strength was
calculated based on Equation 3.1. Mean value of compressive strength obtained from
three cubes was then taken as cube compressive strength for each mortar concrete
mix. For the strength activity index with Portland cement, it was calculated based on
Equation 3.6.
36
(
)
where,
A = average compressive strength of test mixture cubes (MPa), and
B = average compressive strength of control mix cubes (MPa).
3.8 Consistency and Stability
The fresh density and hardened density was used to check the stability and
consistency of the mix. If the ratio of fresh density to designated density is
approximately to one, then the mix is considered to be consistent. Meanwhile, if the
ratio of fresh density to hardened density is approximately to one, the mix is
considered to be stable. The consistency of the mix is determined by Equation 3.7
(Ramamurthy, 2009) while the stability of the mix is determined by Equation 3.8.
3.9 Performance Index
Theoretically, the density of concrete is directly proportional to compressive strength.
In this study, the density of lightweight foamed concrete was controlled within 1300
± 50 kg/m3. Therefore, performance index of concrete was calculated to increase the
accuracy of the results obtained due to the various density for each specimen was
obtained. The equation for performance index is shown in Equation 3.9.
37
⁄
where
PI = Performance Index, MPa per 1000 kg/m3
Sc = Compressive Strength, MPa
3.10 Microstructure Image Analysis
In this study, Hitachi VP-SEM S-3700N was used to conduct microstructure image
analysis by using the mean of Scanning Electron Microscope (SEM). The analysis
was carried out in accordance with ASTM C1723 (2010). Before the analysis was
being performed, the specimens for each mix proportion were coated with a gold
layer and the accelerating voltage of the SEM was set to 15 kV and image with 250×,
1000× and 5000× of magnifications were selected for analysis. Next, the analysis
was performed with a small piece of crushed cube in high vacuum with the
application of a conductive coating. SEM imaging and EDS were carried out on 90
days specimens only.
Figure 3.12: Coating of Specimen Before SEM Analysis
38
Figure 3.13: Hitachi VP-SEM S-3700N
3.11 Summary
Lightweight foamed concrete incorporated with POFA was produced by the pre-
foaming method, where the stable and dry foam was entrained into fresh lightweight
concrete until the desired density of 1300 kg/m3
achieved. A density of 45 kg/m3
stable and dry foam was produced in a foam generator by mixing the liquid synthetic
foaming agent and water with ratio of 1:30. Three LFC mix proportions were
prepared in this study namely LFC-CM, LFC-PF25 and LFC-PF50. A total of fifteen
100 mm cubes, eighteen cylinders with height of 200 mm and diameter of 100 mm,
fifteen 25 mm × 25 mm × 250 mm prisms. Besides that, two mortar mix proportions
were prepared in this study namely M-CM and M-PF20 for the purpose to investigate
the strength activity index of POFA. A total three 50 mm × 50 mm × 50 mm cubes
were produced for each mix proportions. Water curing method was adopted and the
specimens were cured in water for 7, 28, 56 and 90 days before carry out the
following test sessions, such as compression test, splitting tensile test, flexural
strength test, Poisson’s ratio test and strength activity index test. For microstructure
image analysis, a small piece of crushed cube of LFC-PF50 at 90 days was
39
undergoing SEM and EDS. The accelerating voltage of the SEM was set to 15 kV
and image with 250×, 1000× and 5000× of magnifications were selected for analysis.
40
CHAPTER 4
4 TRIAL MIXES
4.1 Introduction
This chapter discusses the results about the strength activity index between the
mortar cement paste (M-CM) and the test mixture with POFA (M-PF20). These
specimens where cured in water for 7 and 28 days for testing. Besides that, this
chapter also discusses and screens trial mixes results for lightweight foamed concrete
incorporated with POFA in obtaining the mix proportion for LFC-CM, LFC-PF25
and LFC-PF50. The specimens for each mix proportions were cure in water for 7, 14
and 28 days before carry out compression test.
4.2 Strength Activity Index of POFA
The compressive strength and strength activity index for M-CM and M-PF20 are
listed in Table 4.1.
41
Table 4.1: Compressive Strength and Strength Activity Index at 7 Days and 28
Days
Curing
Age
Mix Compressive
Strength (MPa)
Strength
Activity Index
Sieve analysis (% of
POFA passing through
μ within an hour)
7 days M-CM 28.03 77.88
8.9% M-PF20 21.83
28days M-CM 44.23 75.70
M-PF20 33.48
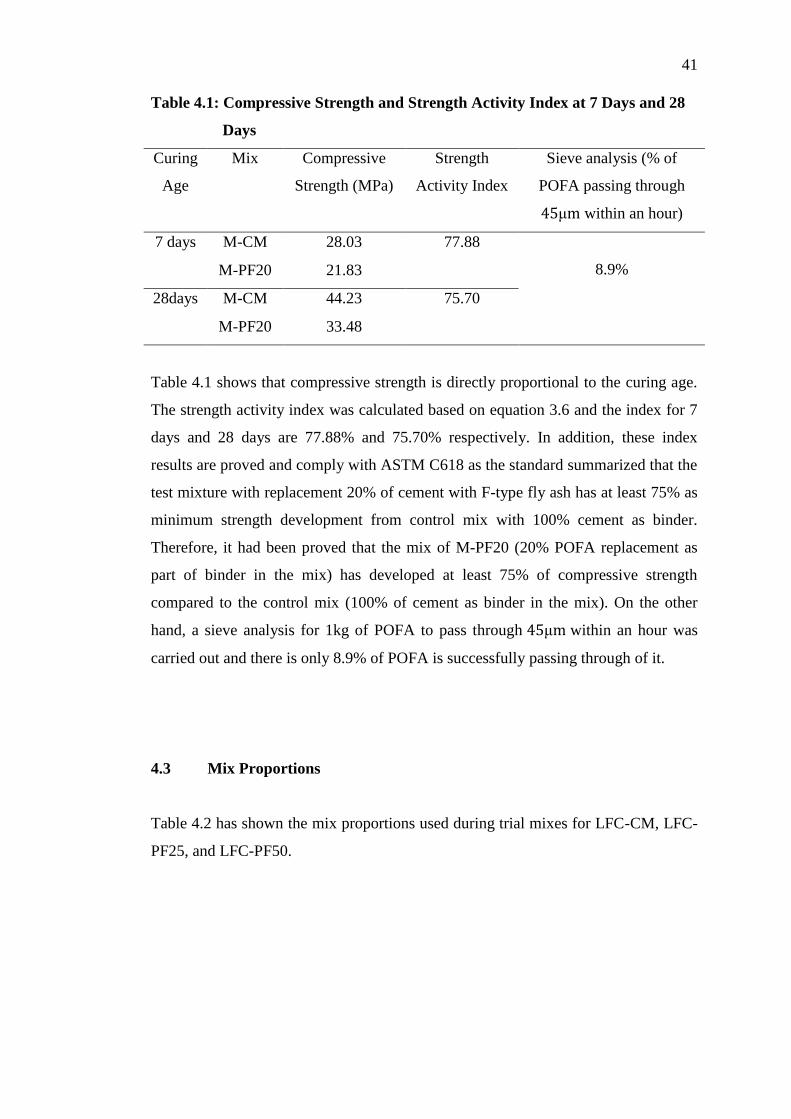
Table 4.1 shows that compressive strength is directly proportional to the curing age.
The strength activity index was calculated based on equation 3.6 and the index for 7
days and 28 days are 77.88% and 75.70% respectively. In addition, these index
results are proved and comply with ASTM C618 as the standard summarized that the
test mixture with replacement 20% of cement with F-type fly ash has at least 75% as
minimum strength development from control mix with 100% cement as binder.
Therefore, it had been proved that the mix of M-PF20 (20% POFA replacement as
part of binder in the mix) has developed at least 75% of compressive strength
compared to the control mix (100% of cement as binder in the mix). On the other
hand, a sieve analysis for 1kg of POFA to pass through μ within an hour was
carried out and there is only 8.9% of POFA is successfully passing through of it.
4.3 Mix Proportions
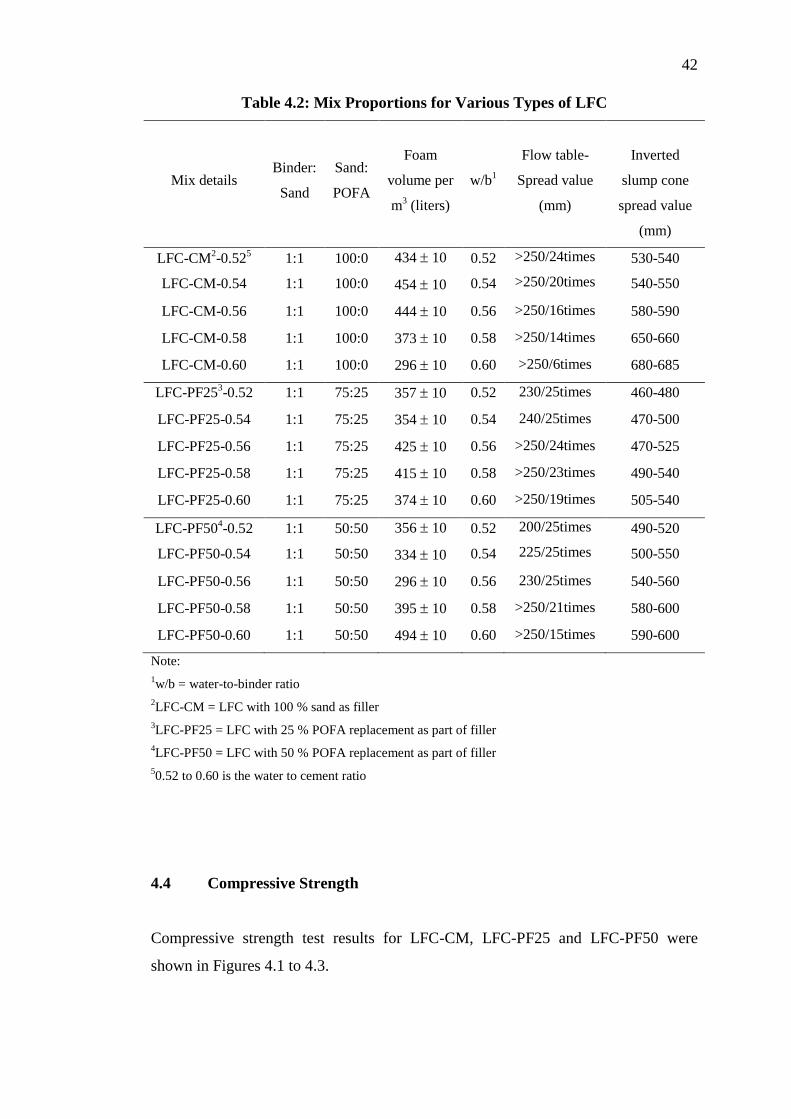
Table 4.2 has shown the mix proportions used during trial mixes for LFC-CM, LFC-
PF25, and LFC-PF50.
42
Table 4.2: Mix Proportions for Various Types of LFC
Mix details Binder:
Sand
Sand:
POFA
Foam
volume per
m3 (liters)
w/b1
Flow table-
Spread value
(mm)
Inverted
slump cone
spread value
(mm)
LFC-CM2-0.52
5
LFC-CM-0.54
1:1
1:1
100:0
100:0
434 10
454 10
0.52
0.54
>250/24times
>250/20times
530-540
540-550
LFC-CM-0.56 1:1 100:0 444 10 0.56 >250/16times 580-590
LFC-CM-0.58 1:1 100:0 373 10 0.58 >250/14times 650-660
LFC-CM-0.60 1:1 100:0 296 10 0.60 >250/6times 680-685
LFC-PF253-0.52 1:1 75:25 357 10 0.52 230/25times 460-480
LFC-PF25-0.54 1:1 75:25 354 10 0.54 240/25times 470-500
LFC-PF25-0.56 1:1 75:25 425 10 0.56 >250/24times 470-525
LFC-PF25-0.58 1:1 75:25 415 10 0.58 >250/23times 490-540
LFC-PF25-0.60 1:1 75:25 374 10 0.60 >250/19times 505-540
LFC-PF504-0.52
LFC-PF50-0.54
1:1
1:1
50:50
50:50
356 10
334 10
0.52
0.54
200/25times
225/25times
490-520
500-550
LFC-PF50-0.56 1:1 50:50 296 10 0.56 230/25times 540-560
LFC-PF50-0.58 1:1 50:50 395 10 0.58 >250/21times 580-600
LFC-PF50-0.60 1:1 50:50 494 10 0.60 >250/15times 590-600
Note:
1w/b = water-to-binder ratio
2LFC-CM = LFC with 100 % sand as filler
3LFC-PF25 = LFC with 25 % POFA replacement as part of filler
4LFC-PF50 = LFC with 50 % POFA replacement as part of filler
50.52 to 0.60 is the water to cement ratio
4.4 Compressive Strength
Compressive strength test results for LFC-CM, LFC-PF25 and LFC-PF50 were
shown in Figures 4.1 to 4.3.
43
Figure 4.1: Compressive Strength of LFC-CM at various w/c ratios
Figure 4.2: Compressive Strength of LFC-PF25 at various w/c ratios
3.24 3.28 3.57 3.63 3.84
4.18 4.21 4.32
4.98
4.25
5.81 5.83
6.34
5.53 5.41
0
1
2
3
4
5
6
7
0.52 0.54 0.56 0.58 0.6
Co
mp
ress
ive
Str
en
gth
(M
Pa)
Water Cement Ratio, W/C
7 days
14 days
28 days
3.05 3.1 3.32
3.55 3.74 3.59
5.07 4.95 5.05
4.33
5.95 6.13
7.09
6.34 5.96
0
1
2
3
4
5
6
7
8
0.52 0.54 0.56 0.58 0.6
Co
mp
ress
ive
Str
en
gth
(M
Pa)
Water Cement Ratio, W/C
7 days
14 days
28 days
44
Figure 4.3: Compressive Strength of LFC-PF50 at various w/c ratios
Figures 4.1 to 4.3 show that the compressive strength is directly proportional to the
curing age. Therefore, the longer the period of curing age, the higher the concrete
strength is achieved. For LFC-CM, the highest 28-day compressive strength was
achieved by 0.56 w/c mix proportion, which is 6.34 MPa. Besides, for LFC-PF25,
the highest 28-day compressive strength was achieved by 0.56 w/c mix proportion as
well, which is 7.09 MPa. For LFC-PF50, 0.56 w/c mix proportion achieves the
highest 28-day compressive strength which is 6.48 MPa.
4.5 Performance Index
The performance index for LFC-CM, LFC-PF25, and LFC-PF50 were calculated and
shown in Figures 4.4 to 4.6, respectively.
3.35
4.45 4.83 4.81
5.32
3.96
5.45 5.17
5.73 5.34
4.61
6.06 6.48
6.23 6.2
0
1
2
3
4
5
6
7
0.52 0.54 0.56 0.58 0.6
Co
mp
ress
ive
Str
en
gth
(M
Pa)
Water-Cement Ratio
7 day
14day
28day
45
Figure 4.4: Performance Index of LFC-CM at various w/c ratios
Figure 4.5: Performance Index of LFC-PF25 at various w/c ratios
2.45 2.50 2.73 2.74
2.93 3.14 3.16
3.34
3.74
3.27
4.43 4.32
4.64
4.17 4.11
0.00
0.50
1.00
1.50
2.00
2.50
3.00
3.50
4.00
4.50
5.00
0.52 0.54 0.56 0.58 0.6
Pe
rfo
rman
ce In
de
x (M
Pa
Pe
r 1
00
0kg
/m³)
Water Cement Ratio, W/C
7 days
14 days
28 days
2.22 2.46 2.46
2.62 2.81 2.68
4.11
3.65 3.62
3.19
4.35
4.82
5.19
4.60 4.49
0.00
1.00
2.00
3.00
4.00
5.00
6.00
0.52 0.54 0.56 0.58 0.6
Pe
rfo
rman
ce In
de
x (M
Pa
Pe
r 1
00
0kg
/m³)
Water Cement Ratio, W/C
7 days
14 days
28 days
46
Figure 4.6: Performance Index of LFC-PF50 at various w/c ratios
Figures 4.4 to 4.6 show that the performance index is directly proportional to the
curing age of specimen as well. For LFC-CM, the highest 28-day performance index
was achieved by 0.56 w/c mix proportion, which is 4.64 MPa per 1000 kg/m3.
Besides, for LFC-PF25, the highest 28-day performance index was achieved by 0.56
w/c mix, which is 5.19 MPa per 1000 kg/m3. For LFC-PF50, the highest 28-day
performance index was achieved by 0.56 w/c mix, which has 4.80 MPa per 1000
kg/m3.
4.6 Summary
According to ASTM C618, the standard has summarized that the test mixture with
replacement 20% of cement with F-type fly ash has at least 75% as minimum
strength development from control mix with 100% cement as binder. The strength
activity index was calculated and the index for 7days and 28days are achieved 77.88%
and 75.70% respectively. Therefore, these index results are proved and comply with
ASTM C618. Therefore, it had been proved that the mix of M-PF20 (20% POFA
2.56
3.22 3.69 3.67 3.88
3.02
3.95 3.79
4.35
3.94 3.55
4.45 4.80
4.68 4.63
0
1
2
3
4
5
6
0.52 0.54 0.56 0.58 0.6
Pe
rfo
rman
ce In
de
x (M
Pa
Pe
r 1
00
0kg
/m³)
Water-Cement Ratio
7 day
14day
28day
47
replacement as part of binder in the mix) has developed at least 75% of compressive
strength compared to the control mix (100% of cement as binder in the mix).
On the other hand, based on the results obtained and represented in bar chart,
it had clearly shown that the compressive strength of lightweight foamed concrete
incorporated with POFA has increased compared to the control specimen. This is
mainly due to the POFA proportions which having a content of high reactive silica
which can reacted as pozzolans with calcium hydroxide from cement in the presence
of moisture to form compounds with cementitious properties. The pozzolanic
reaction had generated additional C-S-H gel which contribute more strength to the
concrete and subsequently produce more strong and dense concrete.
Generally, compressive strength and performance index are directly
proportional to curing age. For LFC-CM, the highest 28-day compressive strength
and performance index were achieved by 0.56 w/c mix proportion, which are 6.34
MPa and 4.64 MPa per 1000 kg/m3 respectively. For LFC-PF25, the highest 28-day
compressive strength and performance index were achieved in 0.56 w/c mix
proportion, which are 7.09 MPa and 5.19 MPa per 1000 kg/m3 respectively. Besides,
for LFC-PF50, the highest 28-day compressive strength and performance index were
achieved in 0.56 w/c mix proportion, which are 6.48 MPa and 4.80 MPa per 1000
kg/m3 respectively.
48
CHAPTER 5
5 RESULTS AND DISCUSSION
5.1 Introduction
This chapter discusses about the results of lightweight foamed concrete incorporated
with POFA in term of compressive, splitting tensile and flexural strength and
Poisson’s ratio. The specimens were cured in water for 7, 28, 58 and 90 days for
testing.
5.2 Compressive Strength
The compressive strength for LFC-CM, LFC-PF25 and LFC-PF50 are illustrated in
Figure 5.1.
49
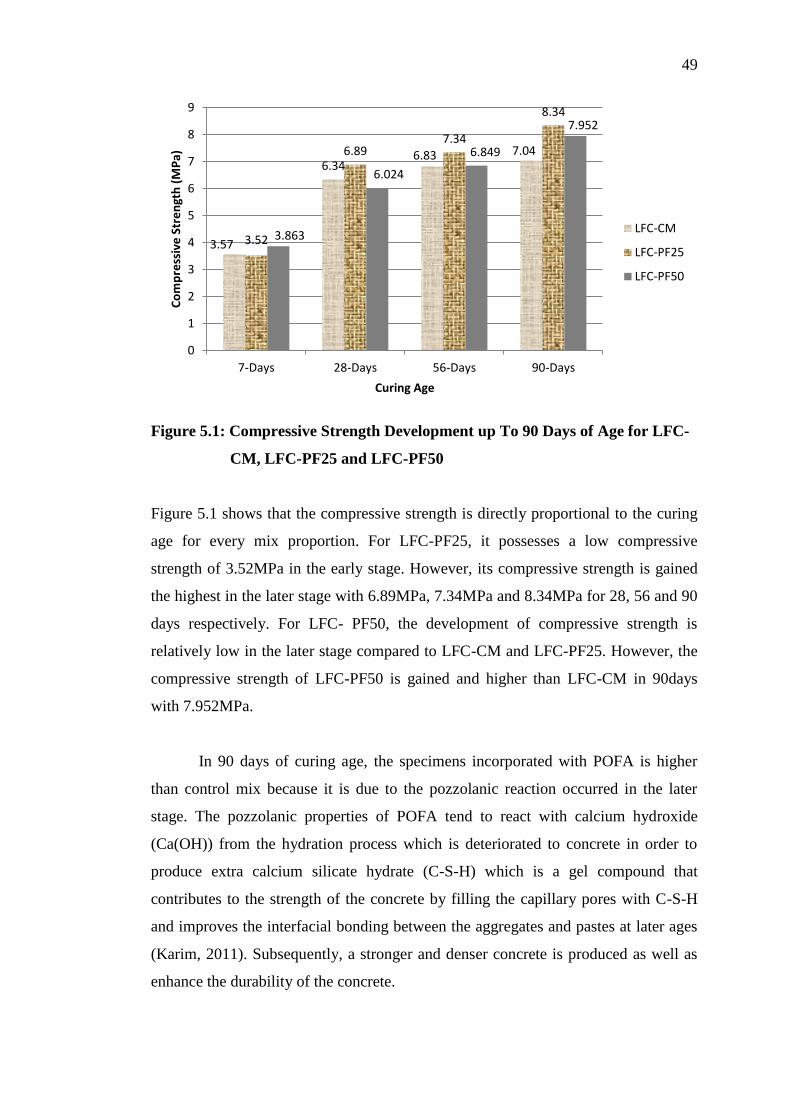
Figure 5.1: Compressive Strength Development up To 90 Days of Age for LFC-
CM, LFC-PF25 and LFC-PF50
Figure 5.1 shows that the compressive strength is directly proportional to the curing
age for every mix proportion. For LFC-PF25, it possesses a low compressive
strength of 3.52MPa in the early stage. However, its compressive strength is gained
the highest in the later stage with 6.89MPa, 7.34MPa and 8.34MPa for 28, 56 and 90
days respectively. For LFC- PF50, the development of compressive strength is
relatively low in the later stage compared to LFC-CM and LFC-PF25. However, the
compressive strength of LFC-PF50 is gained and higher than LFC-CM in 90days
with 7.952MPa.
In 90 days of curing age, the specimens incorporated with POFA is higher
than control mix because it is due to the pozzolanic reaction occurred in the later
stage. The pozzolanic properties of POFA tend to react with calcium hydroxide
(Ca(OH)) from the hydration process which is deteriorated to concrete in order to
produce extra calcium silicate hydrate (C-S-H) which is a gel compound that
contributes to the strength of the concrete by filling the capillary pores with C-S-H
and improves the interfacial bonding between the aggregates and pastes at later ages
(Karim, 2011). Subsequently, a stronger and denser concrete is produced as well as
enhance the durability of the concrete.
3.57
6.34 6.83 7.04
3.52
6.89 7.34
8.34
3.863
6.024
6.849
7.952
0
1
2
3
4
5
6
7
8
9
7-Days 28-Days 56-Days 90-Days
Co
mp
ress
ive
Str
en
gth
(M
Pa)
Curing Age
LFC-CM
LFC-PF25
LFC-PF50
50
Table 5.1: Effect of Incorporation of POFA in LFC on its Compressive Strength
Development at 90 Days of Age
Age Mix Strength development as percentage of control mix at
90 days of curing age
90
days
LFC-CM 100
LFC-PF25 118
LFC-PF50 113
Table 5.1 shows that the development of compressive strength of LFC-PF25 and
LFC-PF50 are 18% and 13% higher than LFC-CM at 90 days respectively.
5.3 Splitting Tensile Strength
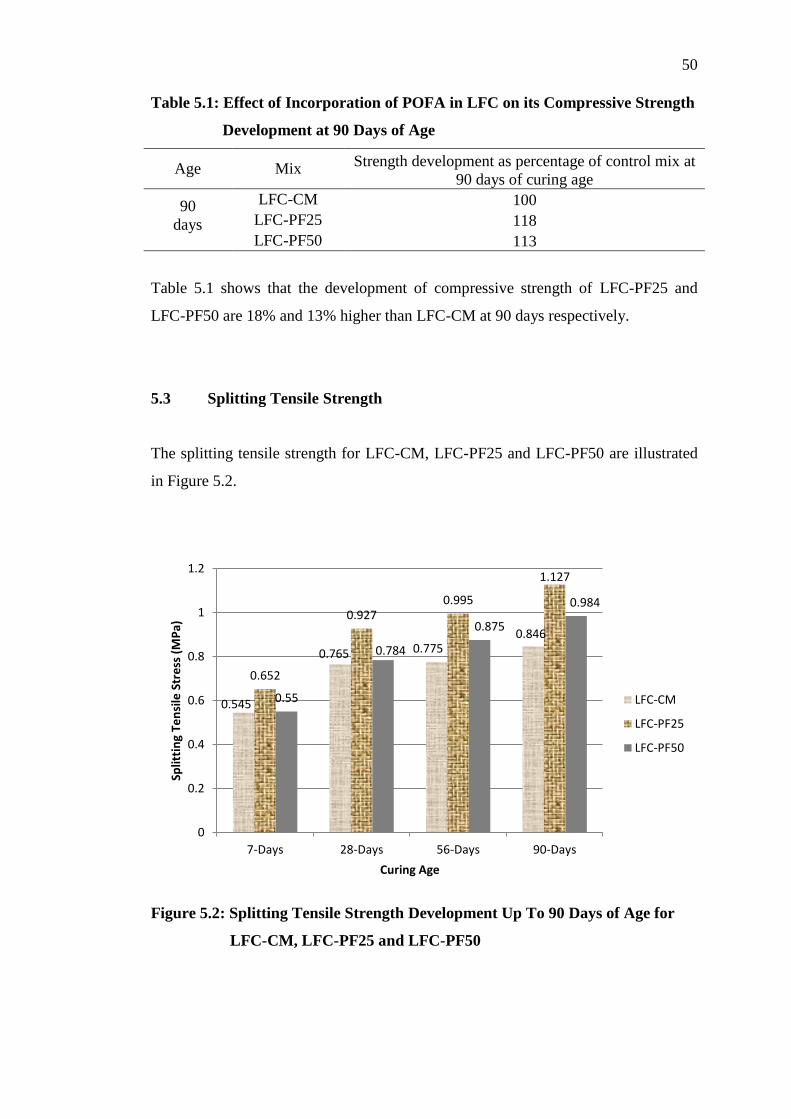
The splitting tensile strength for LFC-CM, LFC-PF25 and LFC-PF50 are illustrated
in Figure 5.2.
Figure 5.2: Splitting Tensile Strength Development Up To 90 Days of Age for
LFC-CM, LFC-PF25 and LFC-PF50
0.545
0.765 0.775 0.846
0.652
0.927 0.995
1.127
0.55
0.784
0.875
0.984
0
0.2
0.4
0.6
0.8
1
1.2
7-Days 28-Days 56-Days 90-Days
Split
tin
g Te
nsi
le S
tre
ss (
MP
a)
Curing Age
LFC-CM
LFC-PF25
LFC-PF50
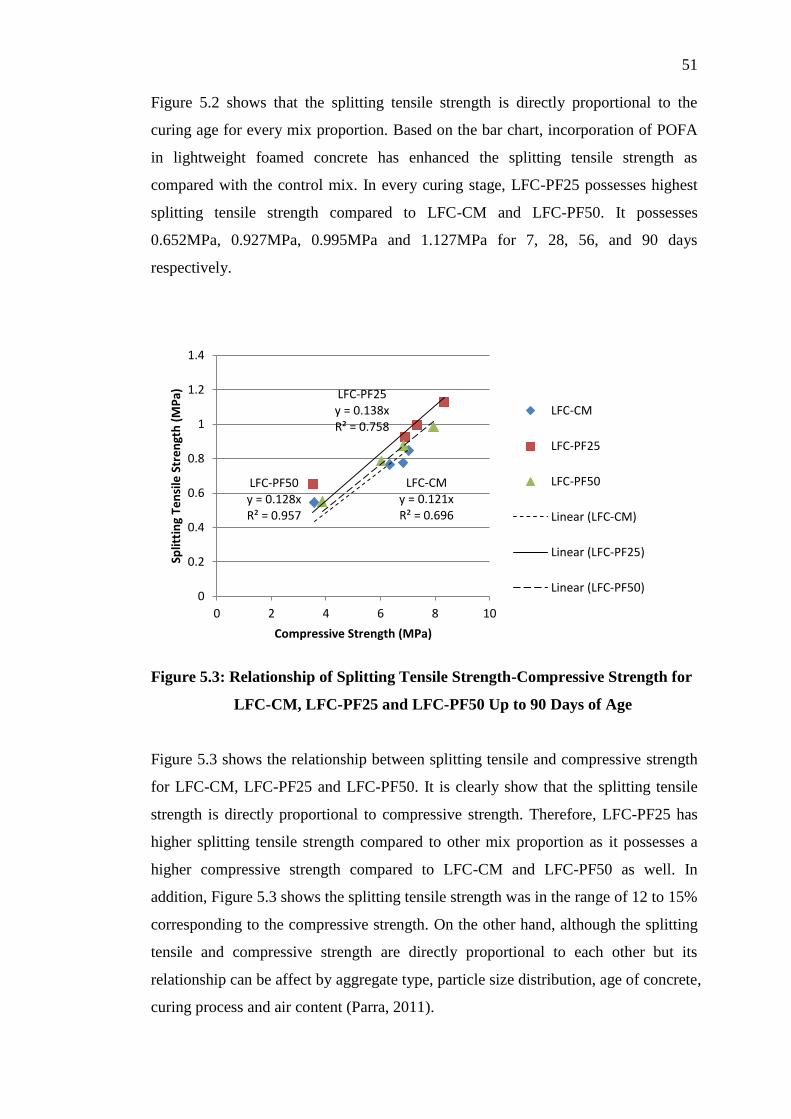
51
Figure 5.2 shows that the splitting tensile strength is directly proportional to the
curing age for every mix proportion. Based on the bar chart, incorporation of POFA
in lightweight foamed concrete has enhanced the splitting tensile strength as
compared with the control mix. In every curing stage, LFC-PF25 possesses highest
splitting tensile strength compared to LFC-CM and LFC-PF50. It possesses
0.652MPa, 0.927MPa, 0.995MPa and 1.127MPa for 7, 28, 56, and 90 days
respectively.
Figure 5.3: Relationship of Splitting Tensile Strength-Compressive Strength for
LFC-CM, LFC-PF25 and LFC-PF50 Up to 90 Days of Age
Figure 5.3 shows the relationship between splitting tensile and compressive strength
for LFC-CM, LFC-PF25 and LFC-PF50. It is clearly show that the splitting tensile
strength is directly proportional to compressive strength. Therefore, LFC-PF25 has
higher splitting tensile strength compared to other mix proportion as it possesses a
higher compressive strength compared to LFC-CM and LFC-PF50 as well. In
addition, Figure 5.3 shows the splitting tensile strength was in the range of 12 to 15%
corresponding to the compressive strength. On the other hand, although the splitting
tensile and compressive strength are directly proportional to each other but its
relationship can be affect by aggregate type, particle size distribution, age of concrete,
curing process and air content (Parra, 2011).
LFC-CM y = 0.121x R² = 0.696
LFC-PF25 y = 0.138x R² = 0.758
LFC-PF50 y = 0.128x R² = 0.957
0
0.2
0.4
0.6
0.8
1
1.2
1.4
0 2 4 6 8 10
Split
tin
g Te
nsi
le S
tre
ngt
h (
MP
a)
Compressive Strength (MPa)
LFC-CM
LFC-PF25
LFC-PF50
Linear (LFC-CM)
Linear (LFC-PF25)
Linear (LFC-PF50)
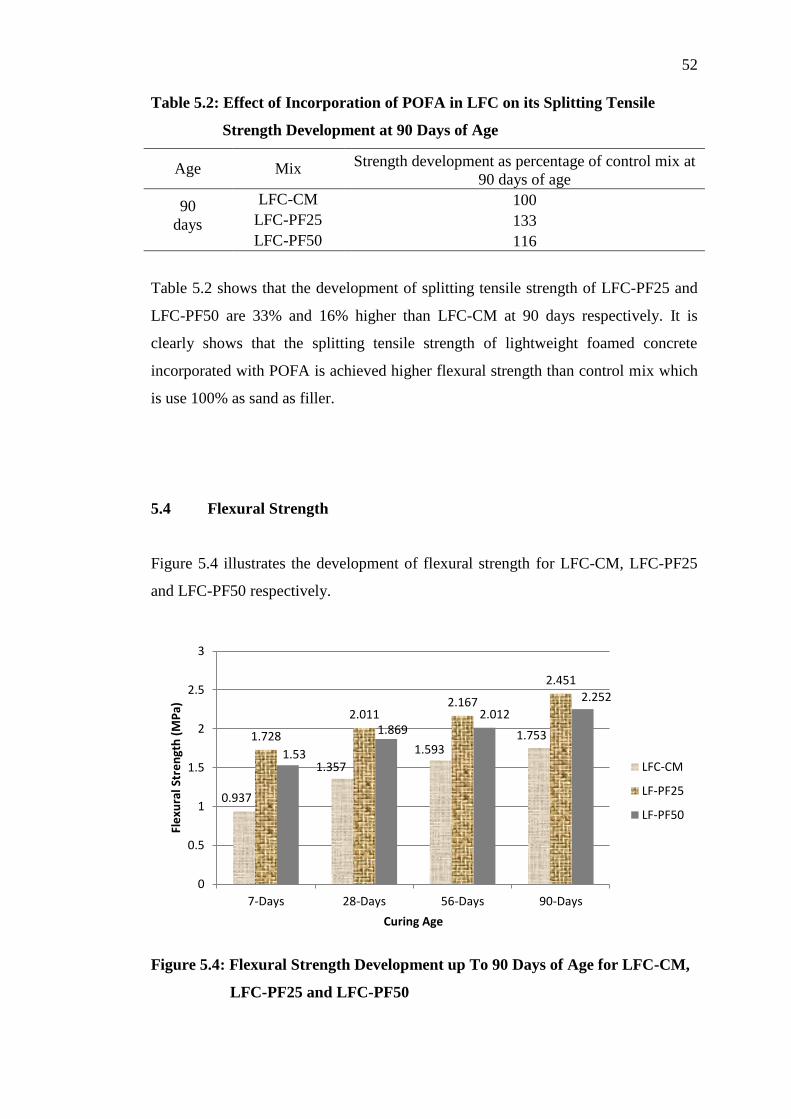
52
Table 5.2: Effect of Incorporation of POFA in LFC on its Splitting Tensile
Strength Development at 90 Days of Age
Age Mix Strength development as percentage of control mix at
90 days of age
90
days
LFC-CM 100
LFC-PF25 133
LFC-PF50 116
Table 5.2 shows that the development of splitting tensile strength of LFC-PF25 and
LFC-PF50 are 33% and 16% higher than LFC-CM at 90 days respectively. It is
clearly shows that the splitting tensile strength of lightweight foamed concrete
incorporated with POFA is achieved higher flexural strength than control mix which
is use 100% as sand as filler.
5.4 Flexural Strength
Figure 5.4 illustrates the development of flexural strength for LFC-CM, LFC-PF25
and LFC-PF50 respectively.
Figure 5.4: Flexural Strength Development up To 90 Days of Age for LFC-CM,
LFC-PF25 and LFC-PF50
0.937
1.357
1.593 1.753 1.728
2.011 2.167
2.451
1.53
1.869 2.012
2.252
0
0.5
1
1.5
2
2.5
3
7-Days 28-Days 56-Days 90-Days
Fle
xura
l Str
en
gth
(M
Pa)
Curing Age
LFC-CM
LF-PF25
LF-PF50
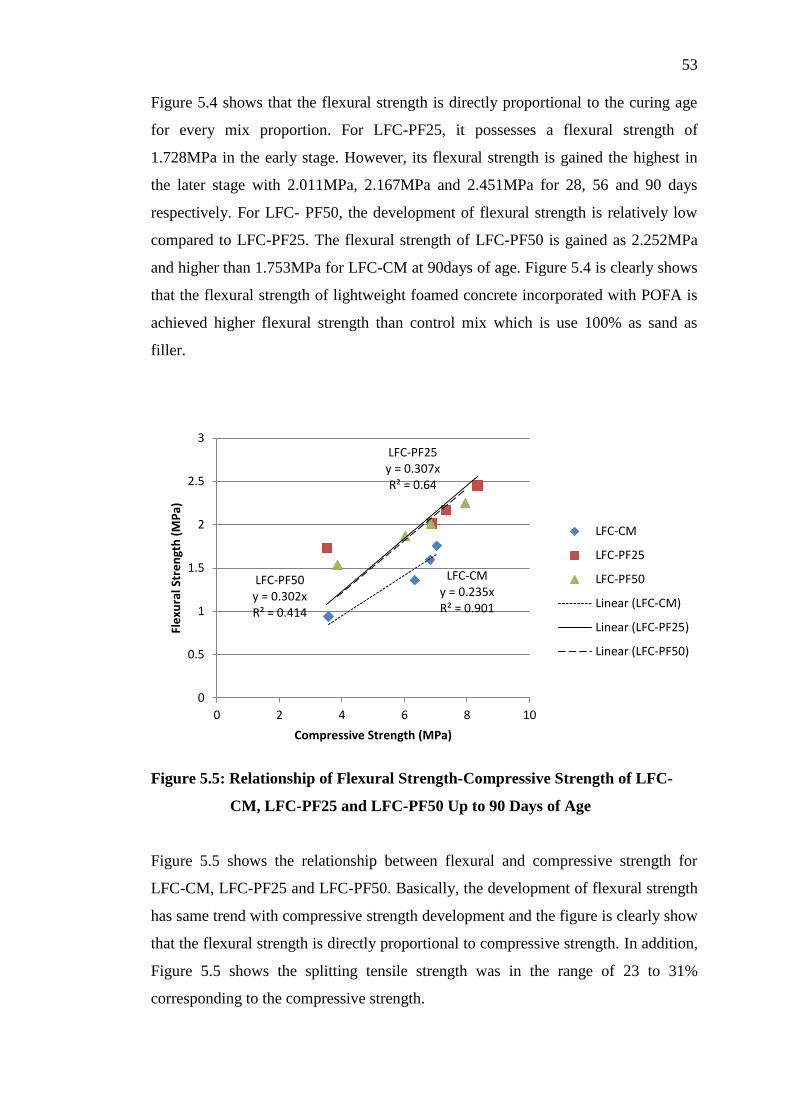
53
Figure 5.4 shows that the flexural strength is directly proportional to the curing age
for every mix proportion. For LFC-PF25, it possesses a flexural strength of
1.728MPa in the early stage. However, its flexural strength is gained the highest in
the later stage with 2.011MPa, 2.167MPa and 2.451MPa for 28, 56 and 90 days
respectively. For LFC- PF50, the development of flexural strength is relatively low
compared to LFC-PF25. The flexural strength of LFC-PF50 is gained as 2.252MPa
and higher than 1.753MPa for LFC-CM at 90days of age. Figure 5.4 is clearly shows
that the flexural strength of lightweight foamed concrete incorporated with POFA is
achieved higher flexural strength than control mix which is use 100% as sand as
filler.
Figure 5.5: Relationship of Flexural Strength-Compressive Strength of LFC-
CM, LFC-PF25 and LFC-PF50 Up to 90 Days of Age
Figure 5.5 shows the relationship between flexural and compressive strength for
LFC-CM, LFC-PF25 and LFC-PF50. Basically, the development of flexural strength
has same trend with compressive strength development and the figure is clearly show
that the flexural strength is directly proportional to compressive strength. In addition,
Figure 5.5 shows the splitting tensile strength was in the range of 23 to 31%
corresponding to the compressive strength.
LFC-CM y = 0.235x R² = 0.901
LFC-PF25 y = 0.307x R² = 0.64
LFC-PF50 y = 0.302x R² = 0.414
0
0.5
1
1.5
2
2.5
3
0 2 4 6 8 10
Fle
xura
l Str
en
gth
(M
Pa)
Compressive Strength (MPa)
LFC-CM
LFC-PF25
LFC-PF50
Linear (LFC-CM)
Linear (LFC-PF25)
Linear (LFC-PF50)
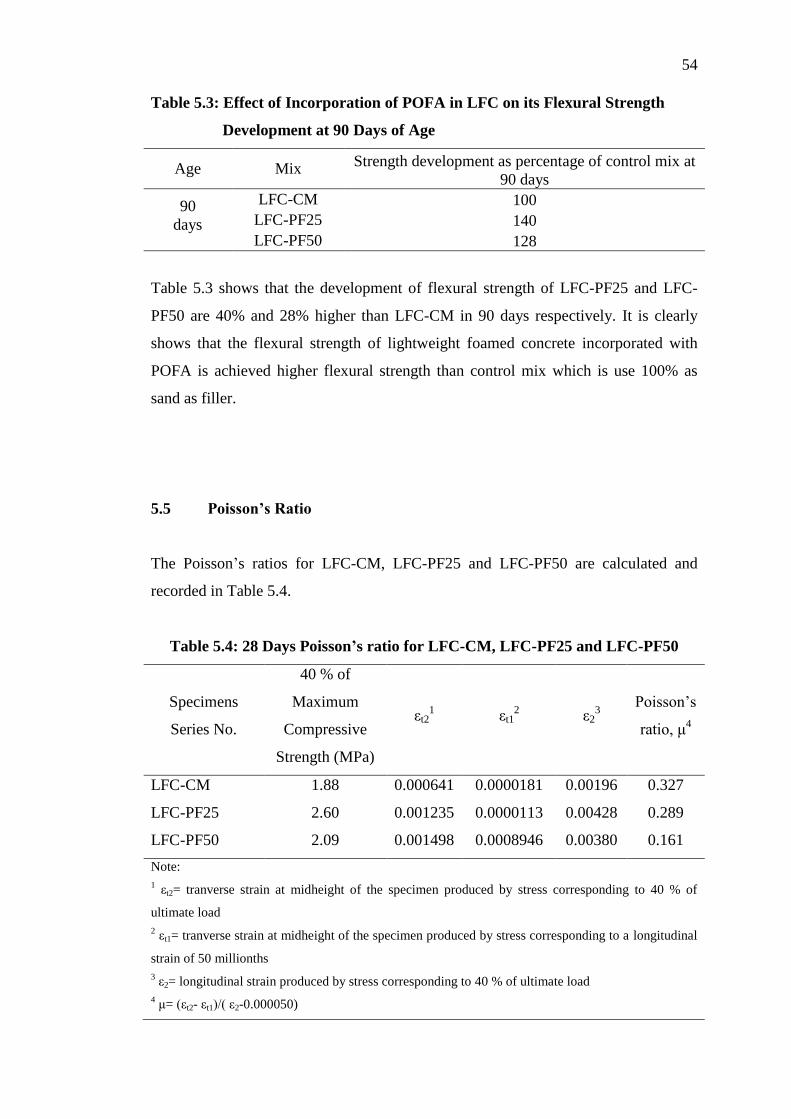
54
Table 5.3: Effect of Incorporation of POFA in LFC on its Flexural Strength
Development at 90 Days of Age
Age Mix Strength development as percentage of control mix at
90 days
90
days
LFC-CM 100
LFC-PF25 140
LFC-PF50 128
Table 5.3 shows that the development of flexural strength of LFC-PF25 and LFC-
PF50 are 40% and 28% higher than LFC-CM in 90 days respectively. It is clearly
shows that the flexural strength of lightweight foamed concrete incorporated with
POFA is achieved higher flexural strength than control mix which is use 100% as
sand as filler.
5.5 Poisson’s Ratio
The Poisson’s ratios for LFC-CM, LFC-PF25 and LFC-PF50 are calculated and
recorded in Table 5.4.
Table 5.4: 28 Days Poisson’s ratio for LFC-CM, LFC-PF25 and LFC-PF50
Specimens
Series No.
40 % of
Maximum
Compressive
Strength (MPa)
εt21 εt1
2 ε2
3 Poisson’s
ratio, μ4
LFC-CM 1.88 0.000641 0.0000181 0.00196 0.327
LFC-PF25 2.60 0.001235 0.0000113 0.00428 0.289
LFC-PF50 2.09 0.001498 0.0008946 0.00380 0.161
Note:
1 εt2= tranverse strain at midheight of the specimen produced by stress corresponding to 40 % of
ultimate load
2 εt1= tranverse strain at midheight of the specimen produced by stress corresponding to a longitudinal
strain of 50 millionths
3 ε2= longitudinal strain produced by stress corresponding to 40 % of ultimate load
4 μ= (εt2- εt1)/( ε2-0.000050)
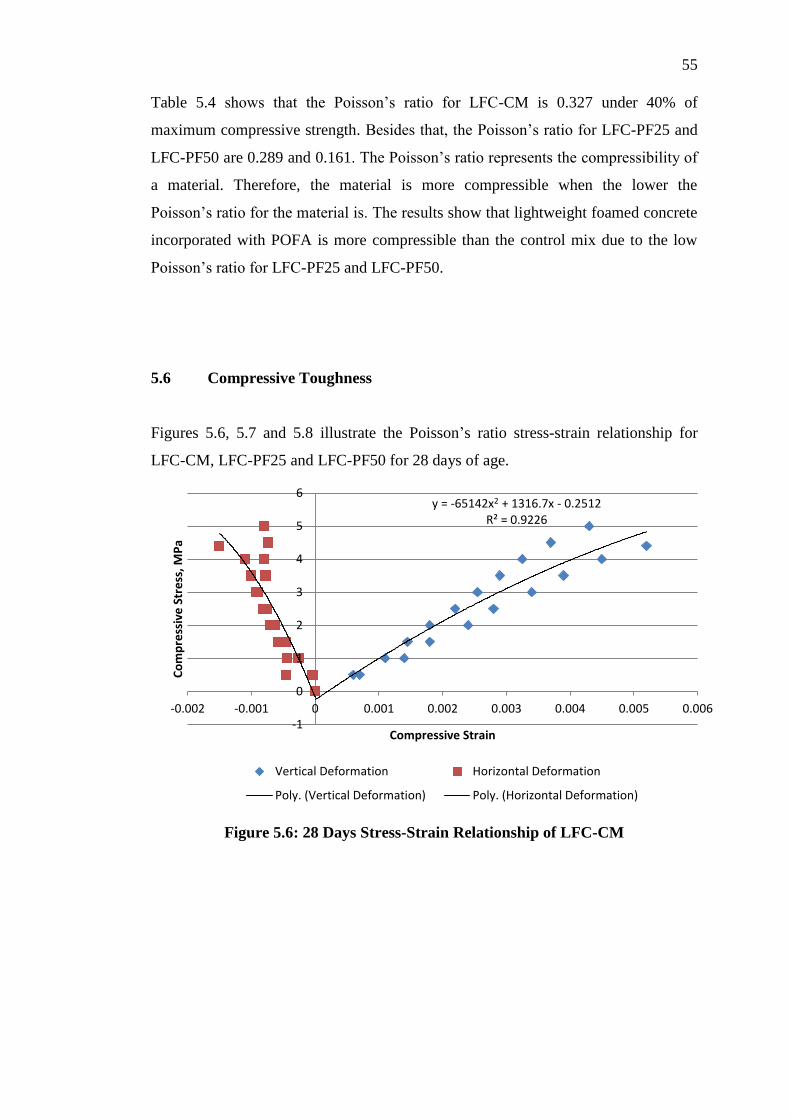
55
Table 5.4 shows that the Poisson’s ratio for LFC-CM is 0.327 under 40% of
maximum compressive strength. Besides that, the Poisson’s ratio for LFC-PF25 and
LFC-PF50 are 0.289 and 0.161. The Poisson’s ratio represents the compressibility of
a material. Therefore, the material is more compressible when the lower the
Poisson’s ratio for the material is. The results show that lightweight foamed concrete
incorporated with POFA is more compressible than the control mix due to the low
Poisson’s ratio for LFC-PF25 and LFC-PF50.
5.6 Compressive Toughness
Figures 5.6, 5.7 and 5.8 illustrate the Poisson’s ratio stress-strain relationship for
LFC-CM, LFC-PF25 and LFC-PF50 for 28 days of age.
Figure 5.6: 28 Days Stress-Strain Relationship of LFC-CM
y = -65142x2 + 1316.7x - 0.2512 R² = 0.9226
-1
0
1
2
3
4
5
6
-0.002 -0.001 0 0.001 0.002 0.003 0.004 0.005 0.006
Co
mp
ress
ive
Str
ess
, MP
a
Compressive Strain
Vertical Deformation Horizontal Deformation
Poly. (Vertical Deformation) Poly. (Horizontal Deformation)
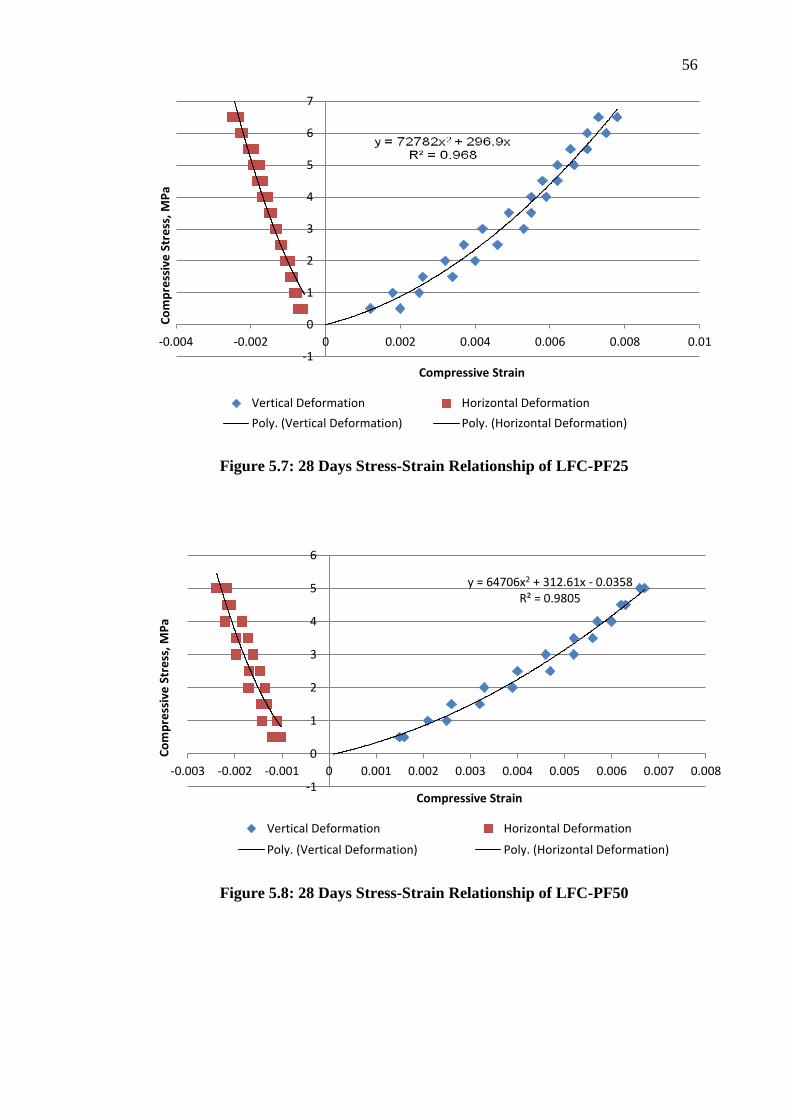
56
Figure 5.7: 28 Days Stress-Strain Relationship of LFC-PF25
Figure 5.8: 28 Days Stress-Strain Relationship of LFC-PF50
-1
0
1
2
3
4
5
6
7
-0.004 -0.002 0 0.002 0.004 0.006 0.008 0.01
Co
mp
ress
ive
Str
ess
, MP
a
Compressive Strain
Vertical Deformation Horizontal Deformation
Poly. (Vertical Deformation) Poly. (Horizontal Deformation)
y = 64706x2 + 312.61x - 0.0358 R² = 0.9805
-1
0
1
2
3
4
5
6
-0.003 -0.002 -0.001 0 0.001 0.002 0.003 0.004 0.005 0.006 0.007 0.008
Co
mp
ress
ive
Str
ess
, MP
a
Compressive Strain
Vertical Deformation Horizontal Deformation
Poly. (Vertical Deformation) Poly. (Horizontal Deformation)
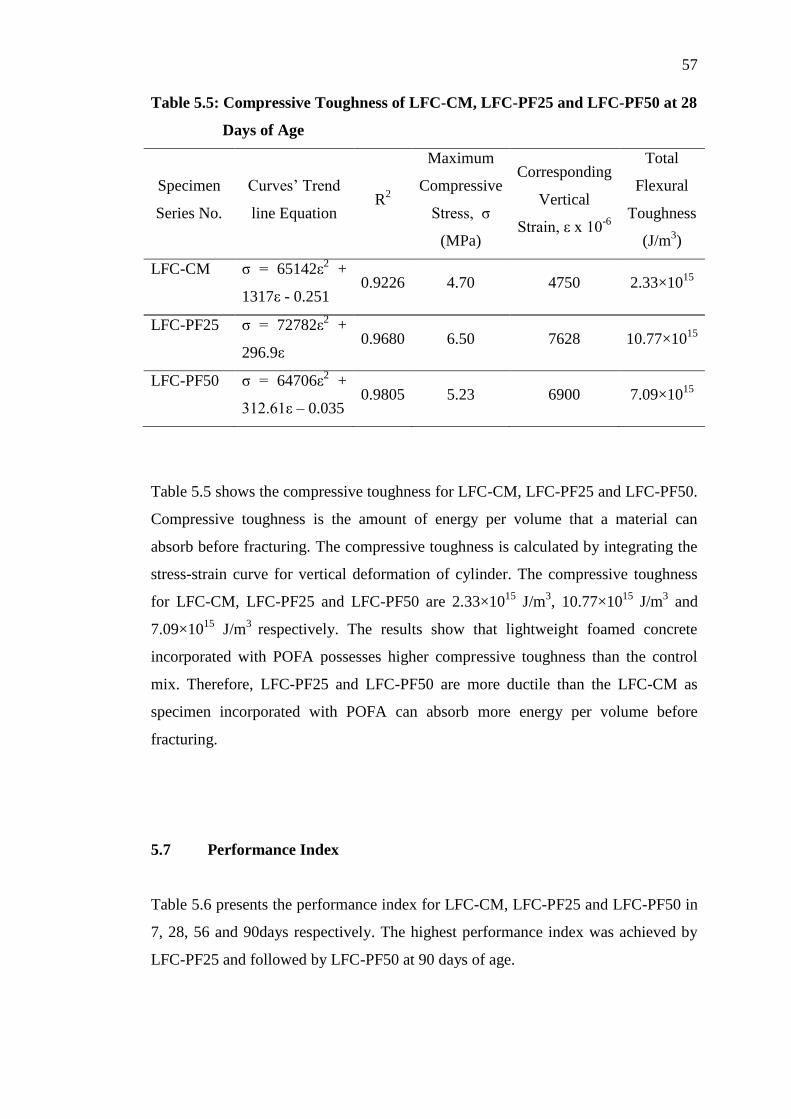
57
Table 5.5: Compressive Toughness of LFC-CM, LFC-PF25 and LFC-PF50 at 28
Days of Age
Specimen
Series No.
Curves’ Trend
line Equation R
2
Maximum
Compressive
Stress, σ
(MPa)
Corresponding
Vertical
Strain, ε x 10-6
Total
Flexural
Toughness
(J/m3)
LFC-CM σ = 65142ε2 +
1317ε - 0.251 0.9226 4.70 4750 2.33×10
15
LFC-PF25 σ = 72782ε2 +
296.9ε 0.9680 6.50 7628 10.77×10
15
LFC-PF50 σ = 64706ε2 +
312.61ε – 0.035 0.9805 5.23 6900 7.09×10
15
Table 5.5 shows the compressive toughness for LFC-CM, LFC-PF25 and LFC-PF50.
Compressive toughness is the amount of energy per volume that a material can
absorb before fracturing. The compressive toughness is calculated by integrating the
stress-strain curve for vertical deformation of cylinder. The compressive toughness
for LFC-CM, LFC-PF25 and LFC-PF50 are 2.33×10¹⁵
J/m3, 10.77×10
15 J/m
3 and
7.09×10¹⁵
J/m3
respectively. The results show that lightweight foamed concrete
incorporated with POFA possesses higher compressive toughness than the control
mix. Therefore, LFC-PF25 and LFC-PF50 are more ductile than the LFC-CM as
specimen incorporated with POFA can absorb more energy per volume before
fracturing.
5.7 Performance Index
Table 5.6 presents the performance index for LFC-CM, LFC-PF25 and LFC-PF50 in
7, 28, 56 and 90days respectively. The highest performance index was achieved by
LFC-PF25 and followed by LFC-PF50 at 90 days of age.
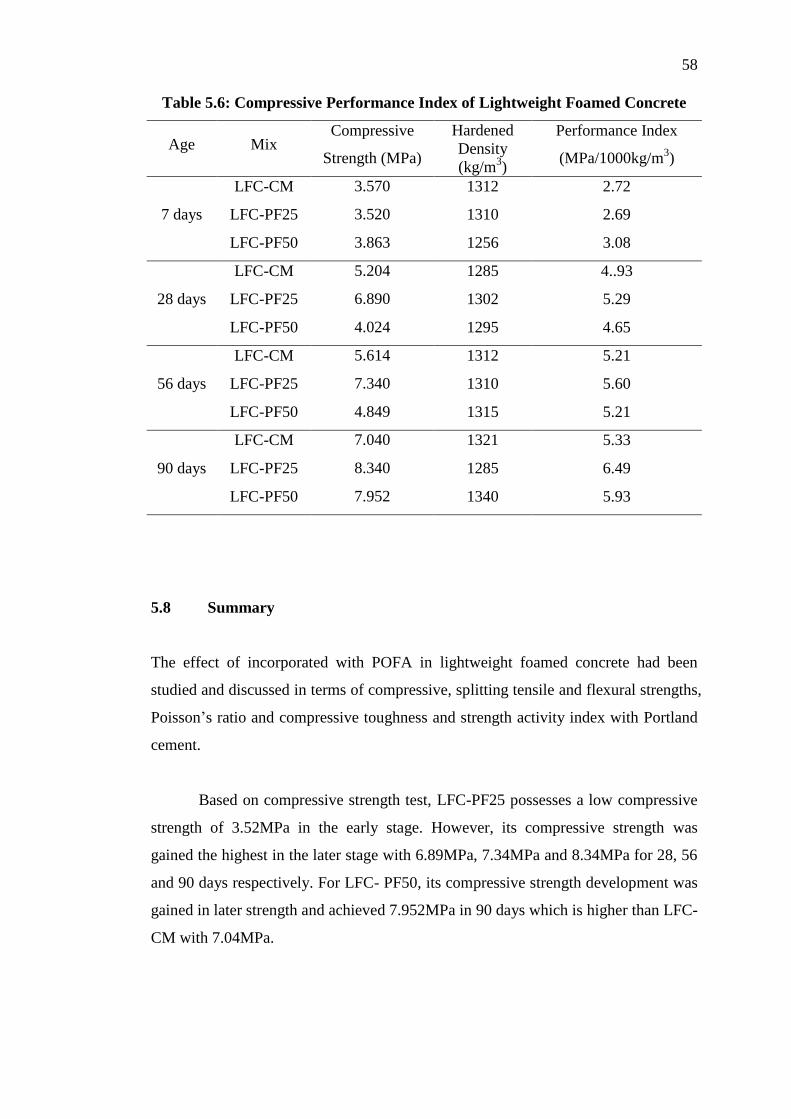
58
Table 5.6: Compressive Performance Index of Lightweight Foamed Concrete
Age Mix Compressive
Strength (MPa)
Hardened
Density
(kg/m3)
Performance Index
(MPa/1000kg/m3)
7 days
LFC-CM 3.570 1312 2.72
LFC-PF25 3.520 1310 2.69
LFC-PF50 3.863 1256 3.08
28 days
LFC-CM 5.204 1285 4..93
LFC-PF25 6.890 1302 5.29
LFC-PF50 4.024 1295 4.65
56 days
LFC-CM 5.614 1312 5.21
LFC-PF25 7.340 1310 5.60
LFC-PF50 4.849 1315 5.21
90 days
LFC-CM 7.040 1321 5.33
LFC-PF25 8.340 1285 6.49
LFC-PF50 7.952 1340 5.93
5.8 Summary
The effect of incorporated with POFA in lightweight foamed concrete had been
studied and discussed in terms of compressive, splitting tensile and flexural strengths,
Poisson’s ratio and compressive toughness and strength activity index with Portland
cement.
Based on compressive strength test, LFC-PF25 possesses a low compressive
strength of 3.52MPa in the early stage. However, its compressive strength was
gained the highest in the later stage with 6.89MPa, 7.34MPa and 8.34MPa for 28, 56
and 90 days respectively. For LFC- PF50, its compressive strength development was
gained in later strength and achieved 7.952MPa in 90 days which is higher than LFC-
CM with 7.04MPa.
59
For splitting tensile strength properties, it is directly proportional to the
curing age for every mix proportion. LFC-PF25 possesses highest of splitting tensile
strength compared to LFC-CM and LFC-PF50. It possesses 0.652MPa, 0.927MPa,
0.995MPa and 1.127MPa for 7, 28, 56, and 90 days respectively. Besides that,
splitting tensile strength is also directly proportional to the compressive strength as
well. Besides that, splitting tensile strength of lightweight foamed concrete
incorporated with POFA achieved higher flexural strength compared to that of
control mix.
Next, flexural strength is directly proportional to the curing age for every mix
proportion. For LFC-PF25, it possesses a flexural strength of 1.728MPa in the early
stage and it gained the highest in the later stage with 2.011MPa, 2.167MPa and
2.451MPa for 28, 56 and 90 days respectively. The development of flexural strength
for LFC- PF50 is relatively low compared with LFC-PF25. It gained 1.53MPa of
flexural strength in early age and it achieved 1.869MPa, 2.012 and 2.252MPa in 28,
56 and 90 days of curing age, respectively. Besides that, flexural strength of
lightweight foamed concrete incorporated with POFA is achieved higher flexural
strength compared to that of control mix.
Incorporation of POFA in LFC has reduced its Poisson’s ratio. However, the
Poisson’s ratio toughness of specimens with POFA has increased. The compressive
toughness for LFC-CM, LFC-PF25 and LFC-PF50 are 2.33×10¹⁵
J/m3, 10.77×10
15
J/m3 and 7.09×10
15 J/m
3 respectively. The results show that lightweight foamed
concrete incorporated with POFA possesses higher compressive toughness than that
of control mix.
60
CHAPTER 6
6 CONCLUSION AND RECOMMENDATIONS
6.1 Conclusion
Based on the laboratory results, the following conclusions can be drawn
corresponding to the respective objective that are listed out at the beginning of this
study.
The first objective is to produce lightweight foamed concrete incorporated
with POFA with dry-bulk density of 1300±50 kg/m3. This was achieved as three
types of foamed concrete were prepared, which included LFC-CM, LFC-PF25 and
LFC-PF50. The results are shown in Appendix A (Tables A1 to A3).
The second objective is to obtain optimum w/c ratios for LFC-CM, LFC-
PF25 and LFC-PF50. This was achieved through trial mixes, where the optimum w/c
ratios for LFC-CM, LFC-PF25 and LFC-PF50 are 0.56, 0.56 and 0.56, respectively.
The third objective is to study the effect of POFA on fresh properties in terms
of fresh density and workability of concrete. It had been studied in accordance with
ASTM C1437 and C1611 respectively. Incorporation of POFA as part of filler
replacement in lightweight foamed concrete has reduced the workability compared to
that of lightweight foamed concrete with 100% sand as filler.
The last objective is to study the effects of Palm Oil Fuel Ash (POFA) on
engineering properties of lightweight foamed concrete in terms of compressive,
61
flexural and splitting tensile strengths, Poisson’s ratio and compressive toughness.
Except Poisson’s ratio, incorporation of POFA into lightweight foamed concrete has
increased its compressive strength, flexural strength, splitting tensile strength and
compressive toughness than those of mix with 100 % sand as filler.
6.2 Recommendations
The research work on lightweight foamed concrete incorporated with POFA is still
limited. But it promises a great scope for future studies. Following aspects related to
the properties of lightweight foamed concrete need to be further study and
investigate:
1. The effect of higher replacement level of sand with POFA on engineering
properties of LFC.
2. The effect of longer period of curing age on engineering properties of LFC in
terms of compressive strength, splitting tensile strength, flexural strength,
Poisson’s ratio, compressive toughness and strength activity index with
Portland cement.
3. The effect of other curing methods on engineering properties of LFC in term
of compressive strength, splitting tensile strength, flexural strengths,
Poisson’s ratio, compressive toughness and strength activity index with
Portland cement.
62
REFERENCES
Aldridge, D., (2005), Introduction to Foamed Concrete What, Why, and How?. Use
of Foamed Concrete in Construction. London: Thomas Telford, 1005: 1-14.
Aldridge, D., Ansell, T., (2001), Foamed Concrete: Production and Equipment
Design, Properties, Applications and Potential. Proceedings of One Day Seminar
on Foamed Concrete: Properties, Applications and Latest Technology
Developments. Loughborough University.
American Society for Testing and Materials (2002). Standard Test Methods for
Compressive Strength of Hydraulic Cement Mortars (Using 2-in. Or [50-mm]
Cube Specimens (ASTM C109/C 109M)
American Society for Testing and Materials (2005). Standard Specification for
Portland Cement (ASTM C150 – 05)
American Society for Testing and Materials (2008). Standard Specification for Flow
Table for Use in Tests of Hydraulic Cement (ASTM C230-08)
American Society for Testing and Materials (2002). Standard Test Method for
Flexural Strength of Concrete (Using Simple Beam with Center-Point Loading)
(ASTM C293-02)
American Society for Testing and Materials (2007). Standard Test Methods for
Sampling and Testing Fly Ash or Natural Pozzolans for Use in Portland-Cement
Concrete (ASTM C311-07)
63
American Society for Testing and Materials (2002). Standard Test Method for Static
Modulus of Elasticity and Poisson’s Ratio of Concrete in Compression (ASTM
C469-02)
American Society for Testing and Materials (2004). Standard Test Method for
Splitting Tensile Strength of Cylindrical Concrete Specimens (ASTM C496-04)
American Society for Testing and Materials (2008). Standard Specification for Coal
Fly Ash and Raw or Calcined Natural Pozzolan for Use in Concrete (ASTM C618
– 08a)
American Society for Testing and Materials (2007). Standard Test Method for Flow
of Hydraulic Cement Mortar (ASTM C1437-07)
ASTM C1611: Standard test method for slump flow of self consolidating concrete.
American Society of Testing and Materials; 2005.
American Society for Testing and Materials (2010). Standard Guide for Examination
of Hardened Concrete Using Scanning Electron Microscopy (ASTM C1723-10)
Awal, A.S.M. and Hussin, M.W. (1997). Some Aspects of Durability Performances
of Concrete Incorporating Palm Oil Fuel Ash, Proceedings of 5th
International
Conference on Structural Failure, Durability and Retrofitting, Singapore, 210 –
217
Arreshvhina, N. (2002) Application of Slag Cement Based Aerated Lightweight
Concrete in Non- Load Bearing Wall Panels. Master Thesis, Universiti Teknologi
Malaysia, Malaysia, 140 pp.
Awal, A.S.M. (1998). A Study of Strength and Durability Performances of Concrete
Containing Palm Oil Fuel Ash, PhD Thesis, Universiti Teknologi Malaysia.
Alexanderson, J. (1979) Relations between structure and mechanical properties of
autoclaved aerated concrete.Cement Concrete Research, 9, 507-514.
64
British Standards Institution (1970). Testing hardened concrete–Part 5: Method of
Testing Hardened Concrete for Other Than Strength. London: BS 1885-5:1970
British Standards Institution (2002). Testing hardened concrete–Part 3: Compressive
strength of test specimens. London: BS EN 12390-3:2002
British Standards Institution (2001). Thermal Performance of Building Materials and
Products. Determination of Thermal Resistance by Means of Guarded Hot Plate
and Heat Flow Meter Methods. Dry and Moist Products of Medium and Low
Thermal Resistance. London: BS EN 12664:2001
Byun, K.J., Song, H.W., Park, S.S. (1998). Development of Structural Lightweight
Foamed Concrete Using Polymer Foam Agent. ICPIC-98: 9.
Chindaprasirt, P., Homwuttiwong, S. and Sirivivatnanon, V. (2004) Influence of fly
ash fineness on strength, drying shrinkage and sulfate resistance of blended
cement mortar. Cement and Concrete Research. 34. 1087 - 1092.
De Rose L, Morris J. (1999) The influence of mix design on the properties of
microcellularconcrete. In: Dhir RK, Handerson NA, editors. Specialist techniques
and materials forconstruction. London, Thomas Telford, 185–97.
Eldagal, O.E.A. (2008). Study On The Behaviour of High Strength Palm Oil Fuel
Ash (POFA) Concrete, Master Thesis, Universiti Teknologi Malaysia.
Hamidah, M.S, Azmi, I., Ruslan, M.R.A., Kartini, K., Fahil, N.M. (2005).
Optimisation of Foamed Concrete Mix of Different Sand – Cement Ratio and
Curing Conditions. Use of Foamed Concrete in Construction. London: Thomas.
Hogan, F. J. and Muesel, J. W. (1981) Evaluation for durability and strength
development of a ground granulated blast furnace slag. Cement, Concrete and
Aggregate. 3(1). 40-52
65
Jones, M.R., McCarthy, A., Dhir, R.K. (2005). Recycled and Secondary Aggregate
in Foamed Concrete. WRAP Research Report, The Waste and Resources Action
Programme. Banbury, Oxon.
Karim, M. R., Zain, M. F. M., Jamil, M., Islam, M. N. (2011). Strength of Concrete
as Influenced by Palm Oil Fuel Ash. Australian Journal of Basic and Applied
Sciences, 5(5): 990 – 997.
Kearsley, E.P. (1996). The Use of Foamed Concrete for Affordable Development in
Third World Countries. Appropriate Concrete Technology. London: E&FN Spon.
233-234.
Kim, H.K., Jeon, J.H., Lee, H.K (2011). Workability, and Mechanical, Acoustic and
Thermal Properties of Lightweight Aggregate Concrete with A High Volume of
Entrained Air. Construction and Building Material, 29: 193-200.
Koudriashoff, I.T., (1942), Manufacture of Reinforced Foam Concrete Roof Slabs. J
Am Concrete Institution. 21(1): 37-48
Lakes, R. S.,Greaves, G. N., Greer, A. L., and Rouxel, T. (2011), "Poisson's Ratio
and Modern Materials", Nature Materials, 10, 823-837
Mehta, P. K., (1977), Properties of blended cements made from rice-husk ash. ACI
Journal, 74: 440-442.
Mehta, P. K. (1985) Studies on chemical resistance of low water / cement ratio
concretes. Cement and Concrete Research. 15. 969 - 978.
Malaysia Palm Oil Board. (2010). Overview of the Malaysian Oil Palm Industry
2010. Kajang.
Michael R. L. (2012), Civil Engineering Reference Manual for the PE Exam
Thirteenth Edition, Professional Publication, Inc. (PPI)
66
Narayanan, N. & Ramamurthy, K. (2000) Structure and properties of aerated
concrete: a review. Cement and Concrete Composites, 22, 321-329.
Narayanan,N & Ramamurthy,K. 2000b. Structure And Properties Of Aerated
Concrete :A Review Cement & Concrete Composite. (22) 321-329
Nehdi, M., Djebbar, Y. & Khan, A. (2001) Neural network model for preformed
foam cellular concrete. ACI Mater J, 98, 402-409.
Neville, A.M. (1985), Properties of concrete, Pitman.
Neville, A. M. (2010). Properties of Concrete (4th
ed.). London: Pearson, 10 – 17, 65
– 71, 83 – 86, 598-599, 688.
Parra, C., Valcuende, M., and Gomez, F. (2011) Splitting tensile and modulus of
elasticity of self-compacting concrete. Construction and Building Materials. 25:
201-207.
Petrov, I. & Schlegel, E. (1994) Application of automatic image analysis for
theinvestigation of autoclaved aerated concrete structure. Cement Concrete
Research, 24, 830-840.
Ramamurthy, K., Kunhanandan Nambiar, E.K., Indu Siva Ranjani, G. (2009). A
Classification of Studies on Properties of Foam Concrete. Cement & Concrete
Composite, 31: 388-396.
Sata, V., Jaturapitakkul, C., and Chaiyanunt, R. (2010). Compressive Strength and
Heat Evolution of Concretes Containing Palm Oil Fuel Ash. Journal of Materials
in Civil Engineering, 22(10): 1033-1038.
Salihuddin, R. S. (1998) Relationships between Engineering Properties and
Microstructural Characteristics of Mortar Containing Agricultural Ash. PhD
Thesis. Universiti Teknologi Malaysia, Malaysia, 425 pp.
67
Schnider, U. (1982). Behavior of Concrete at High Temperature. Deutscher
Aussehuss fur Stahlbeton, Heft 337, Berlin.
Short & Kinniburgh. 1978. Lightweight Concrete. 3rd Edition Applied Science
Publisher Limited.
Steiger, R.W., Hurd, M.K. (1978). Lightweight Insulating Concrete for Floors and
Roof Decks. Concrete Construction. 23(7): 411-422.
Sumathi, S., Chai, S. P. and Mohamed, A. R. (2008) Utilization of oil palm as a
source of renewable energy in Malaysia. Renewable and Sustainable Energy
Reviews, 12. 2404 – 2421.
Tam, C.T. Lim,T.Y. Ravindarajah, R.S. and Lee, S.L. (1987). Relationship Between
Strength And Volumetric Composition Of Moist-Cured Cellular Aerated Concrete.
Magazine Of Concrete Research Vol.39 (138) 12-18.
Tangchirapat, W., Saeting, T., Jaturapitakkul, C., Kiattikomol, K., and
Siripanichgorn, A. (2007). Use of waste ash from palm oil industry in concrete,
Waste Management, 27: 81 – 88.
Tangchirapat, W., Jaturapitakkul, C., and Chindaprasirt, P. (2009). Use of Palm Oil
Fuel Ash as a Supplementary Cementitous Material for Producing High-strength
Concrete. Construction and Building Materials, 23(7): 2641-2646.
Tay, J.H. and K.Y. Show, (1995). Use of Ash Derived from Oil-Palm Waste
Incineration as a Cement Replacement Material. Resources, Conservation and
Recycling, 13: 27-36.
Udoeyo, F. F., Dashibil, P. U. (2002). Sawdust ash as concrete material. Journal of
Materials in Civil Engineering, 173 – 176.
Valore, R.C. (1954). Cellular Concrete Part 1: Composisiton and Method of
Production, ACI Journal, 50: 773-796.
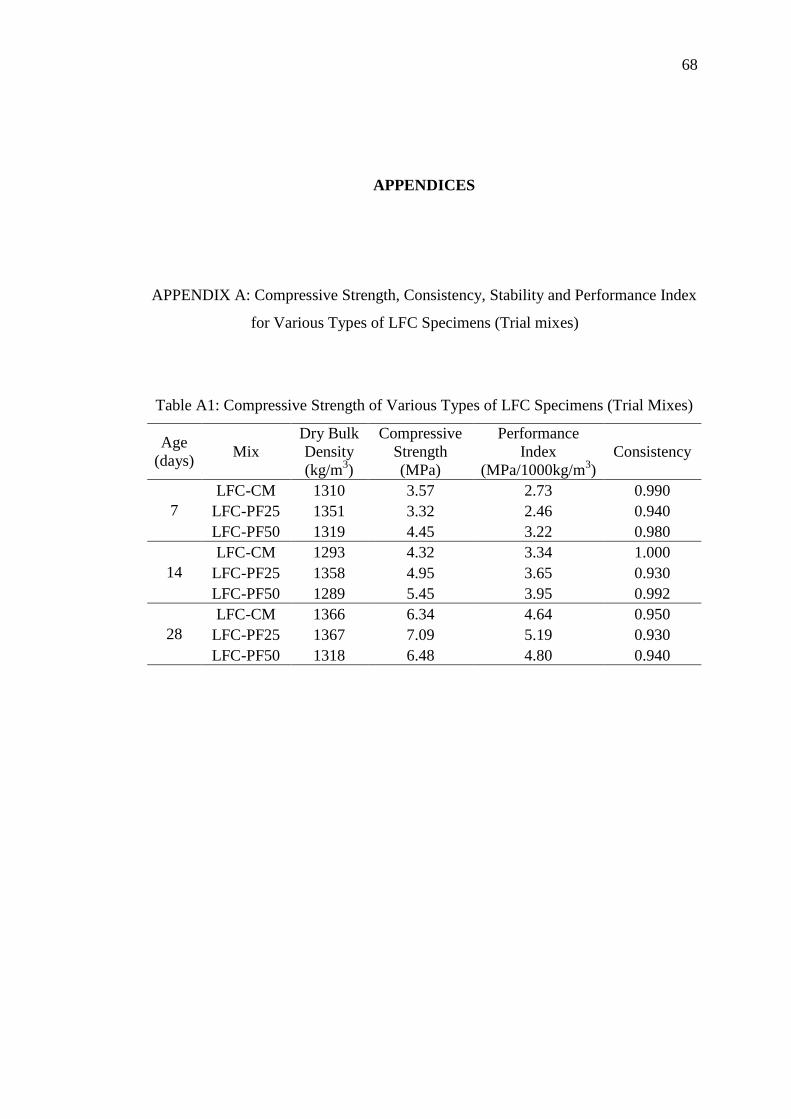
68
APPENDICES
APPENDIX A: Compressive Strength, Consistency, Stability and Performance Index
for Various Types of LFC Specimens (Trial mixes)
Table A1: Compressive Strength of Various Types of LFC Specimens (Trial Mixes)
Age
(days) Mix
Dry Bulk
Density
(kg/m3)
Compressive
Strength
(MPa)
Performance
Index
(MPa/1000kg/m3)
Consistency
7
LFC-CM 1310 3.57 2.73 0.990
LFC-PF25 1351 3.32 2.46 0.940
LFC-PF50 1319 4.45 3.22 0.980
14
LFC-CM 1293 4.32 3.34 1.000
LFC-PF25 1358 4.95 3.65 0.930
LFC-PF50 1289 5.45 3.95 0.992
28
LFC-CM 1366 6.34 4.64 0.950
LFC-PF25 1367 7.09 5.19 0.930
LFC-PF50 1318 6.48 4.80 0.940
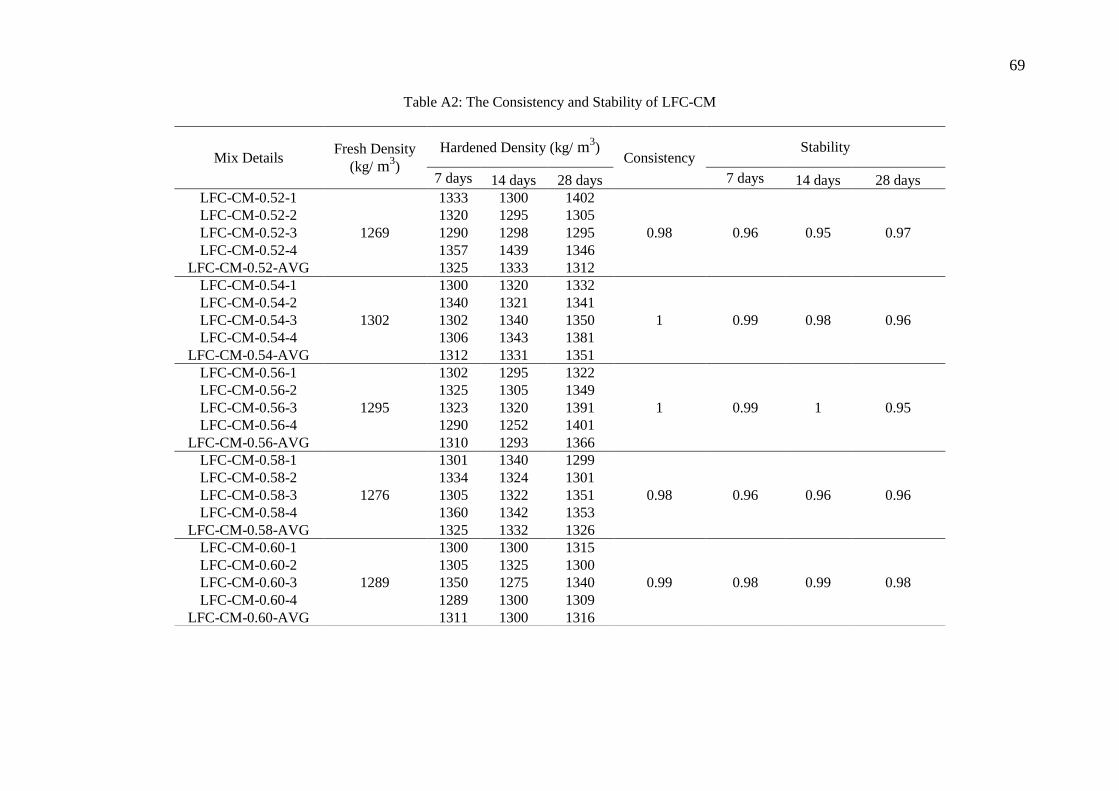
69
Table A2: The Consistency and Stability of LFC-CM
Mix Details Fresh Density
(kg/ m3)
Hardened Density (kg/ m3)
Consistency Stability
7 days 14 days 28 days 7 days 14 days 28 days
LFC-CM-0.52-1
1269
1333 1300 1402
0.98 0.96 0.95 0.97
LFC-CM-0.52-2 1320 1295 1305
LFC-CM-0.52-3 1290 1298 1295
LFC-CM-0.52-4 1357 1439 1346
LFC-CM-0.52-AVG 1325 1333 1312
LFC-CM-0.54-1
1302
1300 1320 1332
1 0.99 0.98 0.96
LFC-CM-0.54-2 1340 1321 1341
LFC-CM-0.54-3 1302 1340 1350
LFC-CM-0.54-4 1306 1343 1381
LFC-CM-0.54-AVG 1312 1331 1351
LFC-CM-0.56-1
1295
1302 1295 1322
1 0.99 1 0.95
LFC-CM-0.56-2 1325 1305 1349
LFC-CM-0.56-3 1323 1320 1391
LFC-CM-0.56-4 1290 1252 1401
LFC-CM-0.56-AVG 1310 1293 1366
LFC-CM-0.58-1
1276
1301 1340 1299
0.98 0.96 0.96 0.96
LFC-CM-0.58-2 1334 1324 1301
LFC-CM-0.58-3 1305 1322 1351
LFC-CM-0.58-4 1360 1342 1353
LFC-CM-0.58-AVG 1325 1332 1326
LFC-CM-0.60-1
1289
1300 1300 1315
0.99 0.98 0.99 0.98
LFC-CM-0.60-2 1305 1325 1300
LFC-CM-0.60-3 1350 1275 1340
LFC-CM-0.60-4 1289 1300 1309
LFC-CM-0.60-AVG 1311 1300 1316
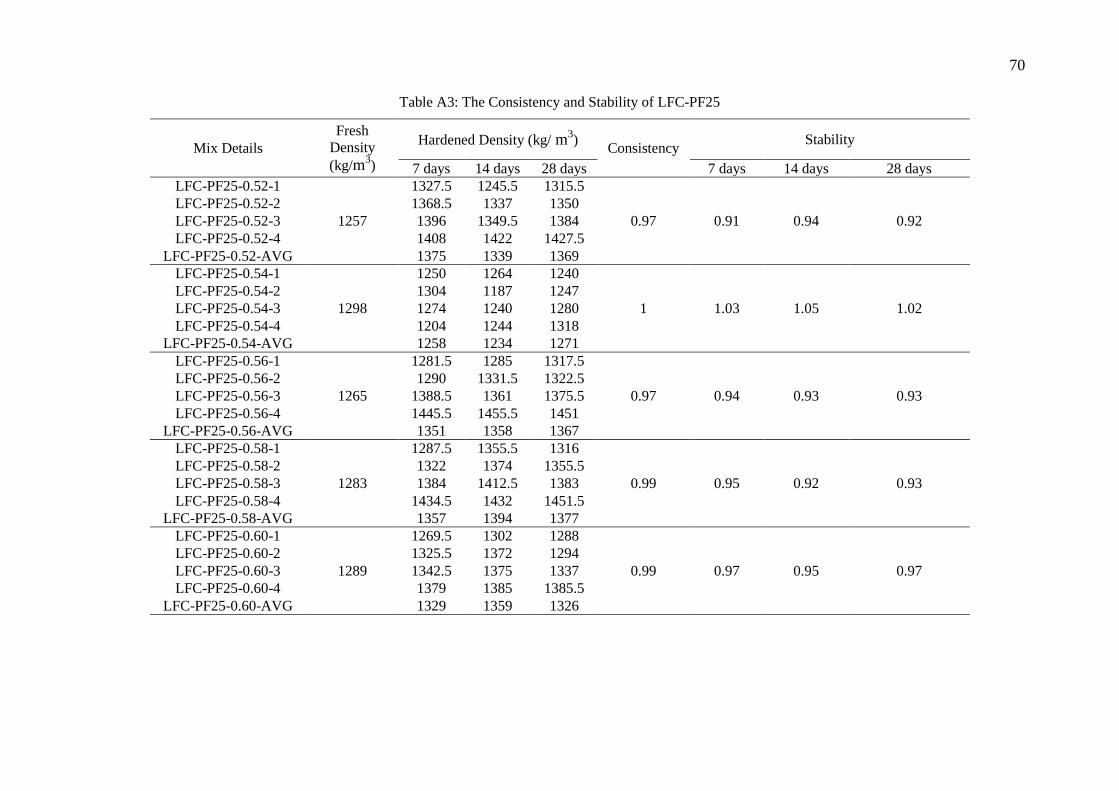
70
Table A3: The Consistency and Stability of LFC-PF25
Mix Details
Fresh
Density
(kg/m3)
Hardened Density (kg/ m3)
Consistency Stability
7 days 14 days 28 days 7 days 14 days 28 days
LFC-PF25-0.52-1
1257
1327.5 1245.5 1315.5
0.97 0.91 0.94 0.92
LFC-PF25-0.52-2 1368.5 1337 1350
LFC-PF25-0.52-3 1396 1349.5 1384
LFC-PF25-0.52-4 1408 1422 1427.5
LFC-PF25-0.52-AVG 1375 1339 1369
LFC-PF25-0.54-1
1298
1250 1264 1240
1 1.03 1.05 1.02
LFC-PF25-0.54-2 1304 1187 1247
LFC-PF25-0.54-3 1274 1240 1280
LFC-PF25-0.54-4 1204 1244 1318
LFC-PF25-0.54-AVG 1258 1234 1271
LFC-PF25-0.56-1
1265
1281.5 1285 1317.5
0.97 0.94 0.93 0.93
LFC-PF25-0.56-2 1290 1331.5 1322.5
LFC-PF25-0.56-3 1388.5 1361 1375.5
LFC-PF25-0.56-4 1445.5 1455.5 1451
LFC-PF25-0.56-AVG 1351 1358 1367
LFC-PF25-0.58-1
1283
1287.5 1355.5 1316
0.99 0.95 0.92 0.93
LFC-PF25-0.58-2 1322 1374 1355.5
LFC-PF25-0.58-3 1384 1412.5 1383
LFC-PF25-0.58-4 1434.5 1432 1451.5
LFC-PF25-0.58-AVG 1357 1394 1377
LFC-PF25-0.60-1
1289
1269.5 1302 1288
0.99 0.97 0.95 0.97
LFC-PF25-0.60-2 1325.5 1372 1294
LFC-PF25-0.60-3 1342.5 1375 1337
LFC-PF25-0.60-4 1379 1385 1385.5
LFC-PF25-0.60-AVG 1329 1359 1326
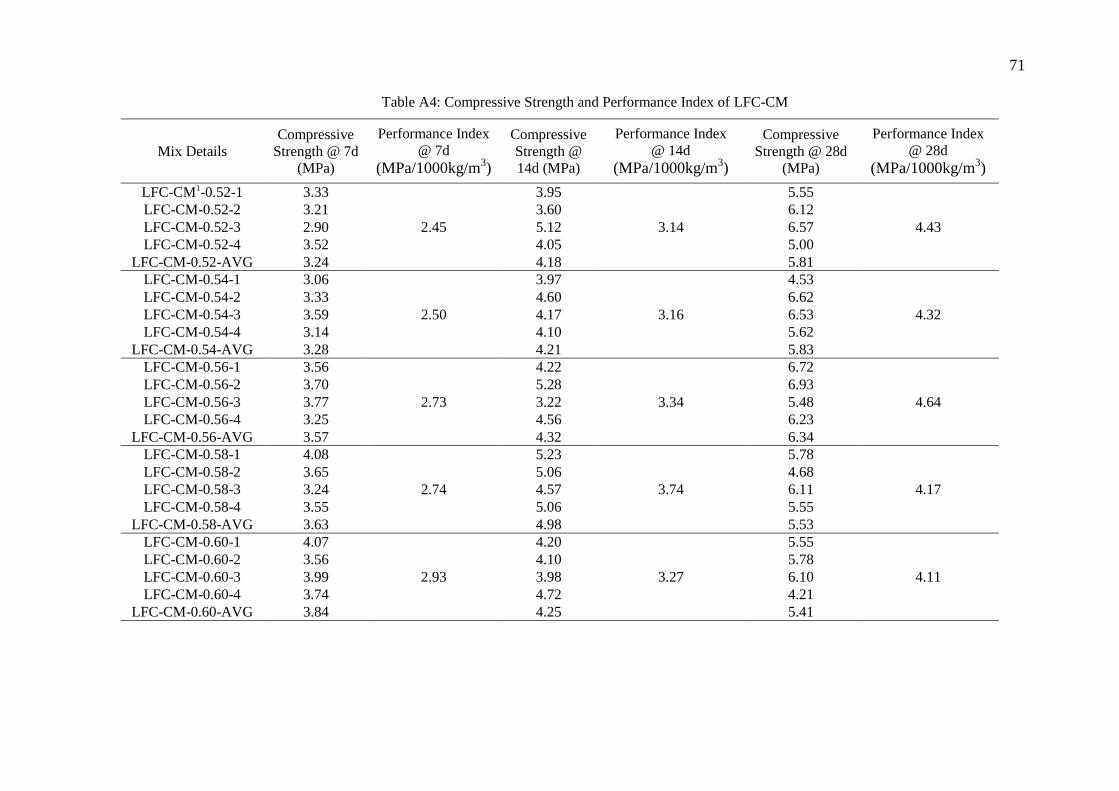
71
Table A4: Compressive Strength and Performance Index of LFC-CM
Mix Details
Compressive
Strength @ 7d
(MPa)
Performance Index
@ 7d
(MPa/1000kg/m3)
Compressive
Strength @
14d (MPa)
Performance Index
@ 14d
(MPa/1000kg/m3)
Compressive
Strength @ 28d
(MPa)
Performance Index
@ 28d
(MPa/1000kg/m3)
LFC-CM1-0.52-1 3.33
2.45
3.95
3.14
5.55
4.43
LFC-CM-0.52-2 3.21 3.60 6.12
LFC-CM-0.52-3 2.90 5.12 6.57
LFC-CM-0.52-4 3.52 4.05 5.00
LFC-CM-0.52-AVG 3.24 4.18 5.81
LFC-CM-0.54-1 3.06
2.50
3.97
3.16
4.53
4.32
LFC-CM-0.54-2 3.33 4.60 6.62
LFC-CM-0.54-3 3.59 4.17 6.53
LFC-CM-0.54-4 3.14 4.10 5.62
LFC-CM-0.54-AVG 3.28 4.21 5.83
LFC-CM-0.56-1 3.56
2.73
4.22
3.34
6.72
4.64
LFC-CM-0.56-2 3.70 5.28 6.93
LFC-CM-0.56-3 3.77 3.22 5.48
LFC-CM-0.56-4 3.25 4.56 6.23
LFC-CM-0.56-AVG 3.57 4.32 6.34
LFC-CM-0.58-1 4.08
2.74
5.23
3.74
5.78
4.17
LFC-CM-0.58-2 3.65 5.06 4.68
LFC-CM-0.58-3 3.24 4.57 6.11
LFC-CM-0.58-4 3.55 5.06 5.55
LFC-CM-0.58-AVG 3.63 4.98 5.53
LFC-CM-0.60-1 4.07
2.93
4.20
3.27
5.55
4.11
LFC-CM-0.60-2 3.56 4.10 5.78
LFC-CM-0.60-3 3.99 3.98 6.10
LFC-CM-0.60-4 3.74 4.72 4.21
LFC-CM-0.60-AVG 3.84 4.25 5.41
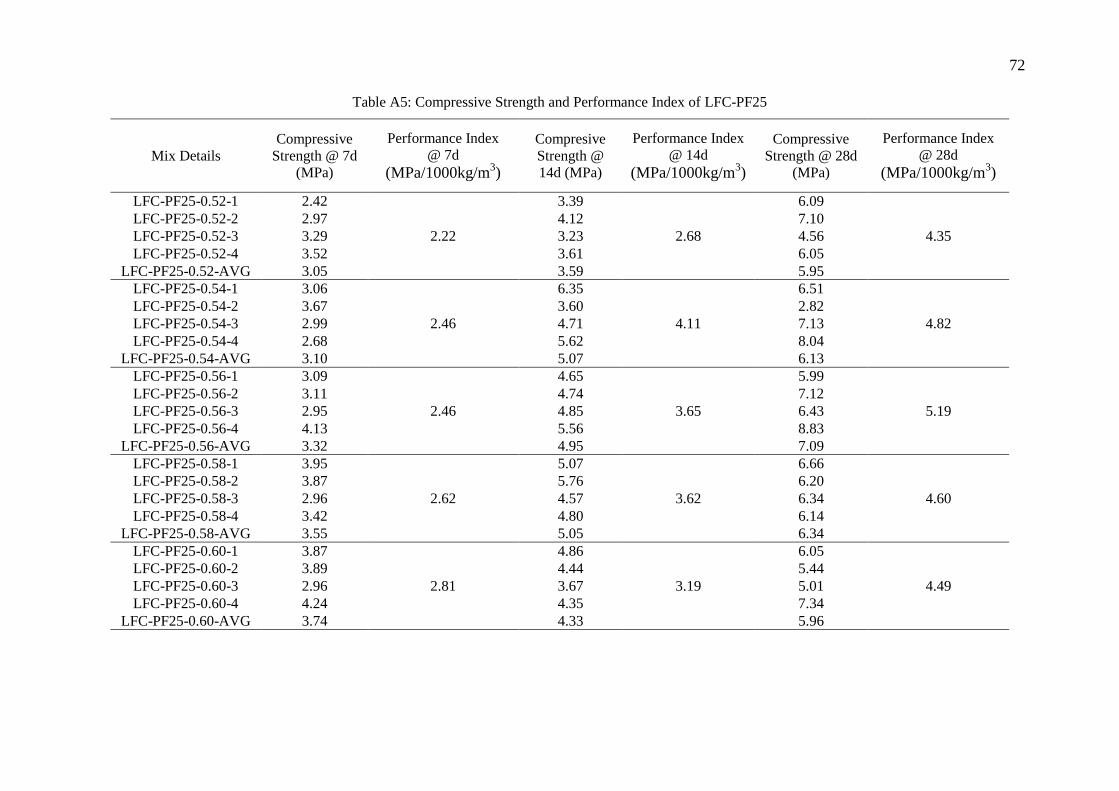
72
Table A5: Compressive Strength and Performance Index of LFC-PF25
Mix Details
Compressive
Strength @ 7d
(MPa)
Performance Index
@ 7d
(MPa/1000kg/m3)
Compresive
Strength @
14d (MPa)
Performance Index
@ 14d
(MPa/1000kg/m3)
Compressive
Strength @ 28d
(MPa)
Performance Index
@ 28d
(MPa/1000kg/m3)
LFC-PF25-0.52-1 2.42
2.22
3.39
2.68
6.09
4.35
LFC-PF25-0.52-2 2.97 4.12 7.10
LFC-PF25-0.52-3 3.29 3.23 4.56
LFC-PF25-0.52-4 3.52 3.61 6.05
LFC-PF25-0.52-AVG 3.05 3.59 5.95
LFC-PF25-0.54-1 3.06
2.46
6.35
4.11
6.51
4.82
LFC-PF25-0.54-2 3.67 3.60 2.82
LFC-PF25-0.54-3 2.99 4.71 7.13
LFC-PF25-0.54-4 2.68 5.62 8.04
LFC-PF25-0.54-AVG 3.10 5.07 6.13
LFC-PF25-0.56-1 3.09
2.46
4.65
3.65
5.99
5.19
LFC-PF25-0.56-2 3.11 4.74 7.12
LFC-PF25-0.56-3 2.95 4.85 6.43
LFC-PF25-0.56-4 4.13 5.56 8.83
LFC-PF25-0.56-AVG 3.32 4.95 7.09
LFC-PF25-0.58-1 3.95
2.62
5.07
3.62
6.66
4.60
LFC-PF25-0.58-2 3.87 5.76 6.20
LFC-PF25-0.58-3 2.96 4.57 6.34
LFC-PF25-0.58-4 3.42 4.80 6.14
LFC-PF25-0.58-AVG 3.55 5.05 6.34
LFC-PF25-0.60-1 3.87
2.81
4.86
3.19
6.05
4.49
LFC-PF25-0.60-2 3.89 4.44 5.44
LFC-PF25-0.60-3 2.96 3.67 5.01
LFC-PF25-0.60-4 4.24 4.35 7.34
LFC-PF25-0.60-AVG 3.74 4.33 5.96
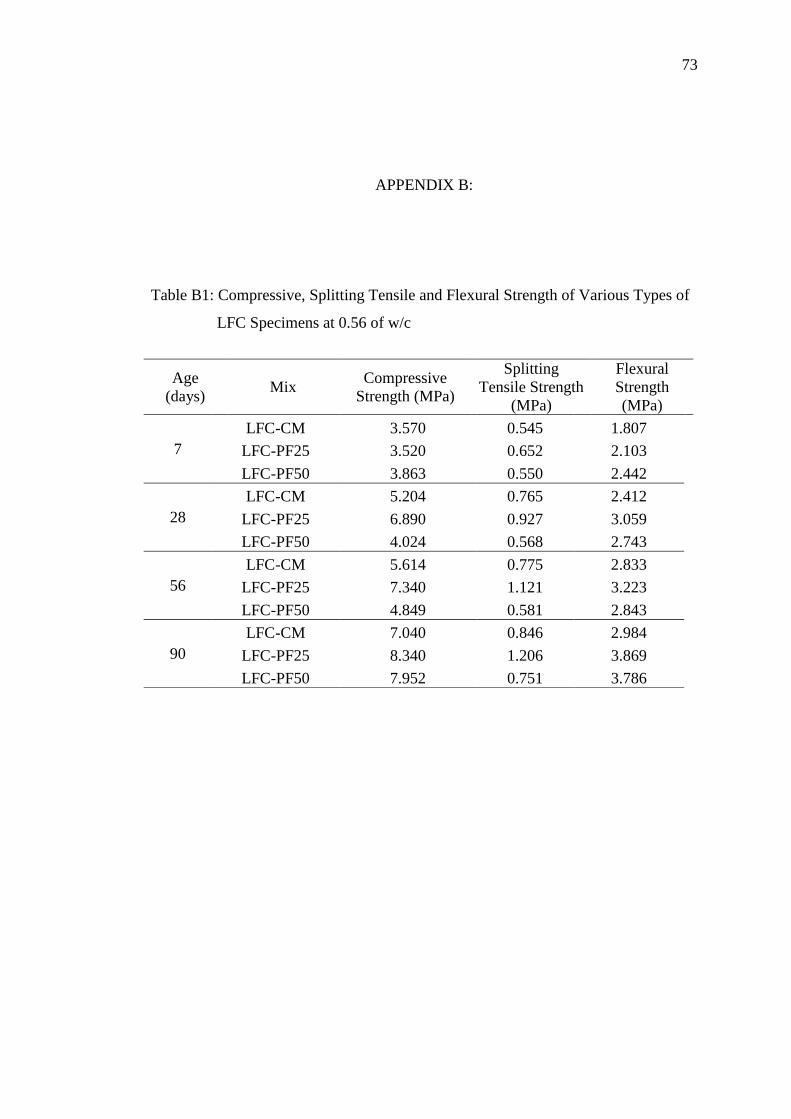
73
APPENDIX B:
Table B1: Compressive, Splitting Tensile and Flexural Strength of Various Types of
LFC Specimens at 0.56 of w/c
Age
(days) Mix
Compressive
Strength (MPa)
Splitting
Tensile Strength
(MPa)
Flexural
Strength
(MPa)
7
LFC-CM 3.570 0.545 1.807
LFC-PF25 3.520 0.652 2.103
LFC-PF50 3.863 0.550 2.442
28
LFC-CM 5.204 0.765 2.412
LFC-PF25 6.890 0.927 3.059
LFC-PF50 4.024 0.568 2.743
56
LFC-CM 5.614 0.775 2.833
LFC-PF25 7.340 1.121 3.223
LFC-PF50 4.849 0.581 2.843
90
LFC-CM 7.040 0.846 2.984
LFC-PF25 8.340 1.206 3.869
LFC-PF50 7.952 0.751 3.786
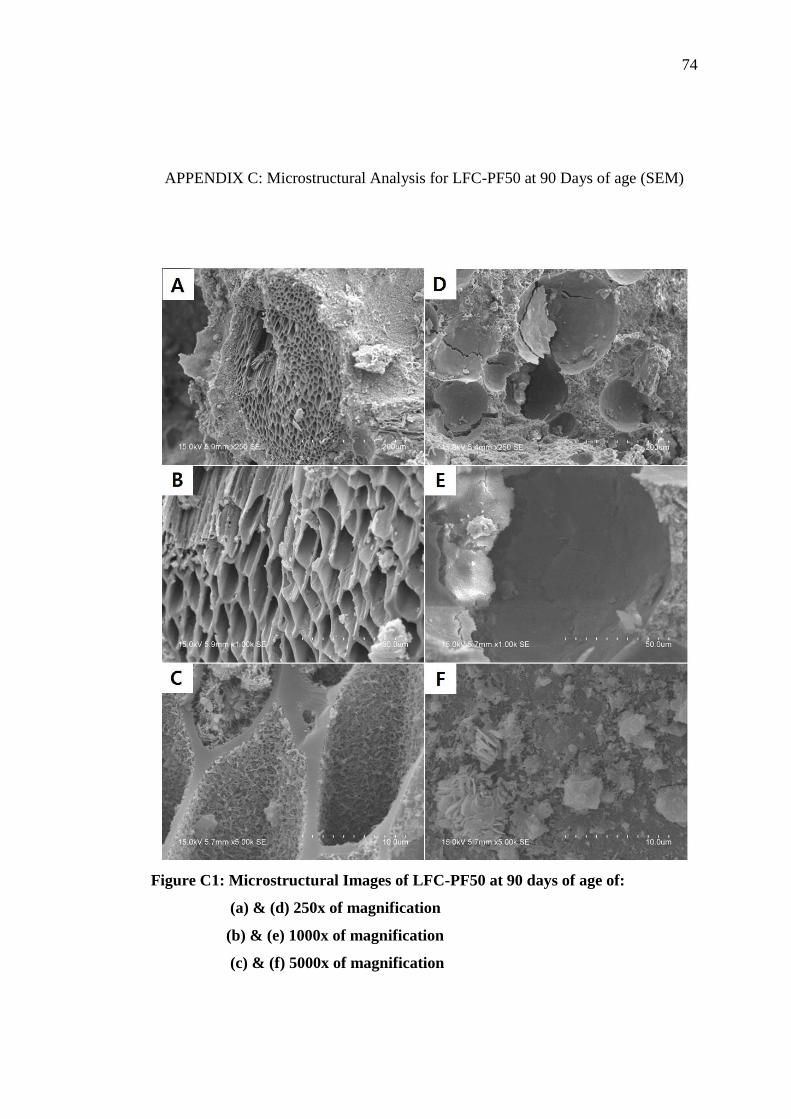
74
APPENDIX C: Microstructural Analysis for LFC-PF50 at 90 Days of age (SEM)
Figure C1: Microstructural Images of LFC-PF50 at 90 days of age of:
(a) & (d) 250x of magnification
(b) & (e) 1000x of magnification
(c) & (f) 5000x of magnification
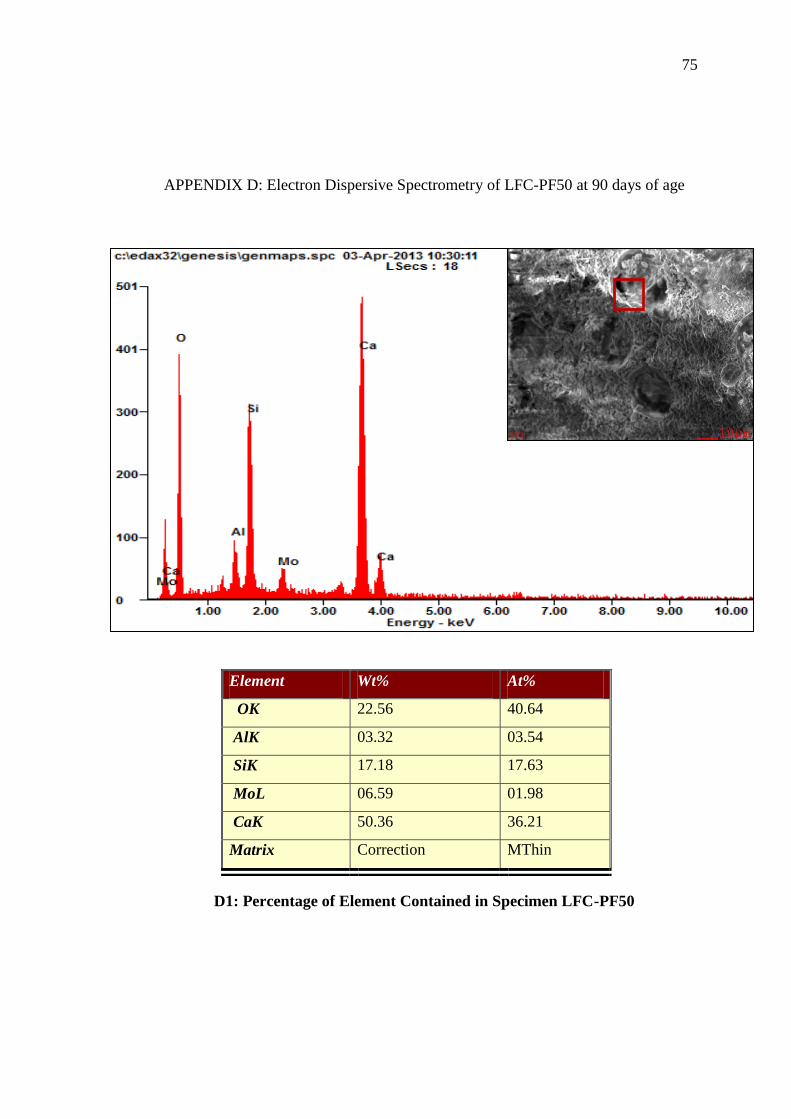
75
APPENDIX D: Electron Dispersive Spectrometry of LFC-PF50 at 90 days of age
D1: Percentage of Element Contained in Specimen LFC-PF50
Element Wt% At%
OK 22.56 40.64
AlK 03.32 03.54
SiK 17.18 17.63
MoL 06.59 01.98
CaK 50.36 36.21
Matrix Correction MThin