Embed Size (px)
Citation preview

Engineering Office
Sector Analysis

Sector Analysis 2
TABLE OF CONTENT
1. Market Overview ...................................................................................................................... 14
2. Engineering Office Sector ........................................................................................................ 17
2.1 Laborers .................................................................................................................... 17
2.1.1 Government Spending............................................................................. 22
2.1.2 Companies .............................................................................................. 24
2.1.3 Relation ................................................................................................... 25
2.2 Asir ............................................................................................................................ 30
2.2.1 Laborers .................................................................................................. 30
2.2.2 Companies .............................................................................................. 35
2.2.3 Relations .................................................................................................. 35
2.3 Baha .......................................................................................................................... 38
2.3.1 Laborer .................................................................................................... 38
2.3.2 Companies .............................................................................................. 43
2.3.3 Relations .................................................................................................. 43
2.4 Eastern ...................................................................................................................... 45
2.4.1 Laborer .................................................................................................... 45
2.4.2 Companies .............................................................................................. 50
2.4.3 Relations .................................................................................................. 51
2.5 Hail ............................................................................................................................ 53
2.5.1 Laborers .................................................................................................. 53
2.5.2 Companies .............................................................................................. 57
2.5.3 Relation ................................................................................................... 57
2.6 Jazan ......................................................................................................................... 60
2.6.1 Laborers .................................................................................................. 60
2.6.2 Companies .............................................................................................. 64
2.6.3 Relation ................................................................................................... 65
2.7 Jouf ............................................................................................................................ 68
2.7.1 Laborers .................................................................................................. 68
2.7.2 Companies .............................................................................................. 72
2.7.3 Relation ................................................................................................... 73
Sector Analysis 3
2.8 Madinah ..................................................................................................................... 75
2.8.1 Laborers .................................................................................................. 75
2.8.2 Companies .............................................................................................. 79
2.8.3 Relation ................................................................................................... 80
2.9 Makkah ...................................................................................................................... 83
2.9.1 Laborer .................................................................................................... 83
2.9.2 Companies .............................................................................................. 88
2.9.3 Relation ................................................................................................... 89
2.10 Najran ........................................................................................................................ 92
2.10.1 Laborer .................................................................................................... 92
2.10.2 Companies .............................................................................................. 96
2.10.3 Relation ................................................................................................... 96
2.11 Northern ..................................................................................................................... 99
2.11.1 Laborers .................................................................................................. 99
2.11.2 Companies ............................................................................................ 103
2.11.3 Relation ................................................................................................. 103
2.12 Qassim .................................................................................................................... 106
2.12.1 Laborers ................................................................................................ 106
2.12.2 Companies ............................................................................................ 110
2.12.3 Relation ................................................................................................. 111
2.13 Riyadh ..................................................................................................................... 113
2.13.1 Laborers ................................................................................................ 113
2.13.2 Companies ............................................................................................ 117
2.13.3 Relation ................................................................................................. 118
2.14 Tabouk ..................................................................................................................... 121
2.14.1 Laborer .................................................................................................. 121
2.14.2 Companies ............................................................................................ 125
2.14.3 Relation ................................................................................................. 125
Sector Analysis 4
List of Tables
Table 1. TOP 5 SKILLED AND UNSKILLED JOBS BASED ON NUMBER OF LABORERS .................................................................................................................... 20
Table 2. TOP 5 SKILLED AND UNSKILLED JOBS IN YOUTH (AGE 16-30) BASED ON NUMBER OF LABORERS ....................................................................................... 20
Table 3. TOP 5 SKILLED AND UNSKILLED JOBS IN MID-AGE (AGE 31-45) BASED ON NUMBER OF LABORERS ....................................................................................... 21
Table 4. TOP 5 SKILLED AND UNSKILLED JOBS IN OLD-AGE (AGE ABOVE 45 YEARS) BASED ON NUMBER OF LABORERS ........................................................... 21
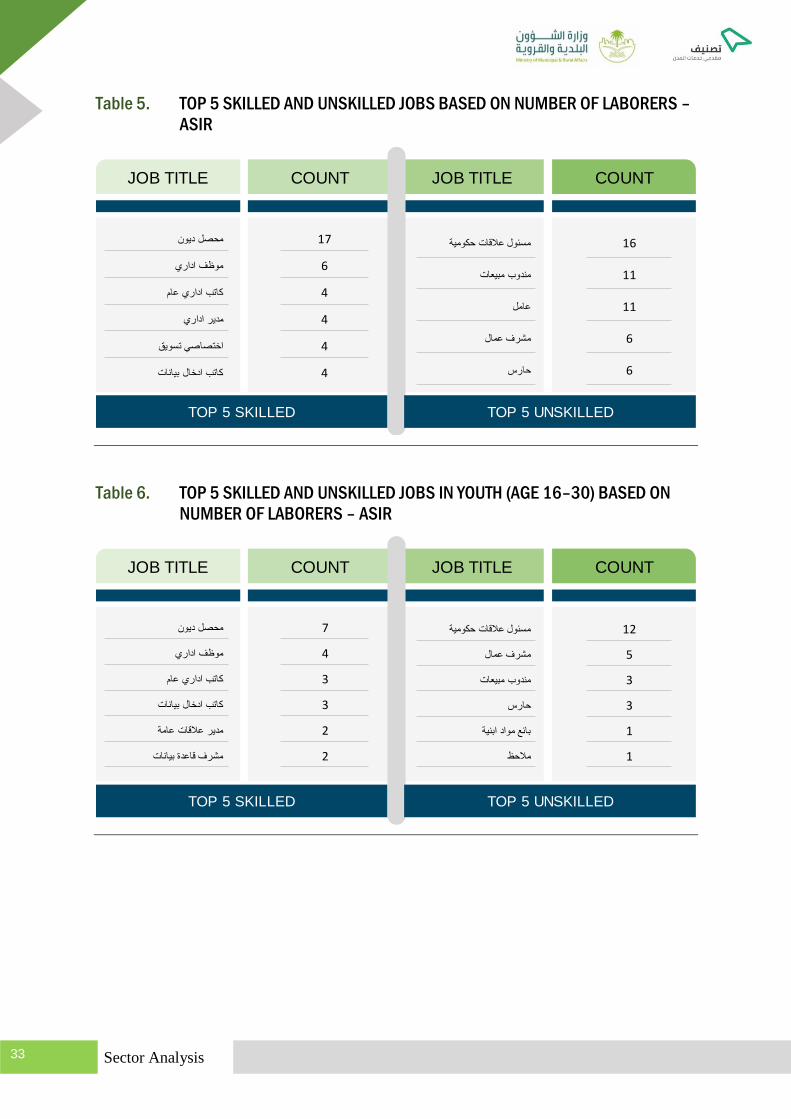
Table 5. TOP 5 SKILLED AND UNSKILLED JOBS BASED ON NUMBER OF LABORERS – ASIR ....................................................................................................... 33
Table 6. TOP 5 SKILLED AND UNSKILLED JOBS IN YOUTH (AGE 16–30) BASED ON NUMBER OF LABORERS – ASIR .......................................................................... 33
Table 7. TOP 5 SKILLED AND UNSKILLED JOBS IN MIDDLE-AGE (AGE 31–45) BASED ON NUMBER OF LABORERS – ASIR ............................................................. 34
Table 8. TOP 5 SKILLED AND UNSKILLED JOBS IN ELDERLY (AGE ABOVE 45 YEARS) BASED ON NUMBER OF LABORERS – ASIR .............................................. 34
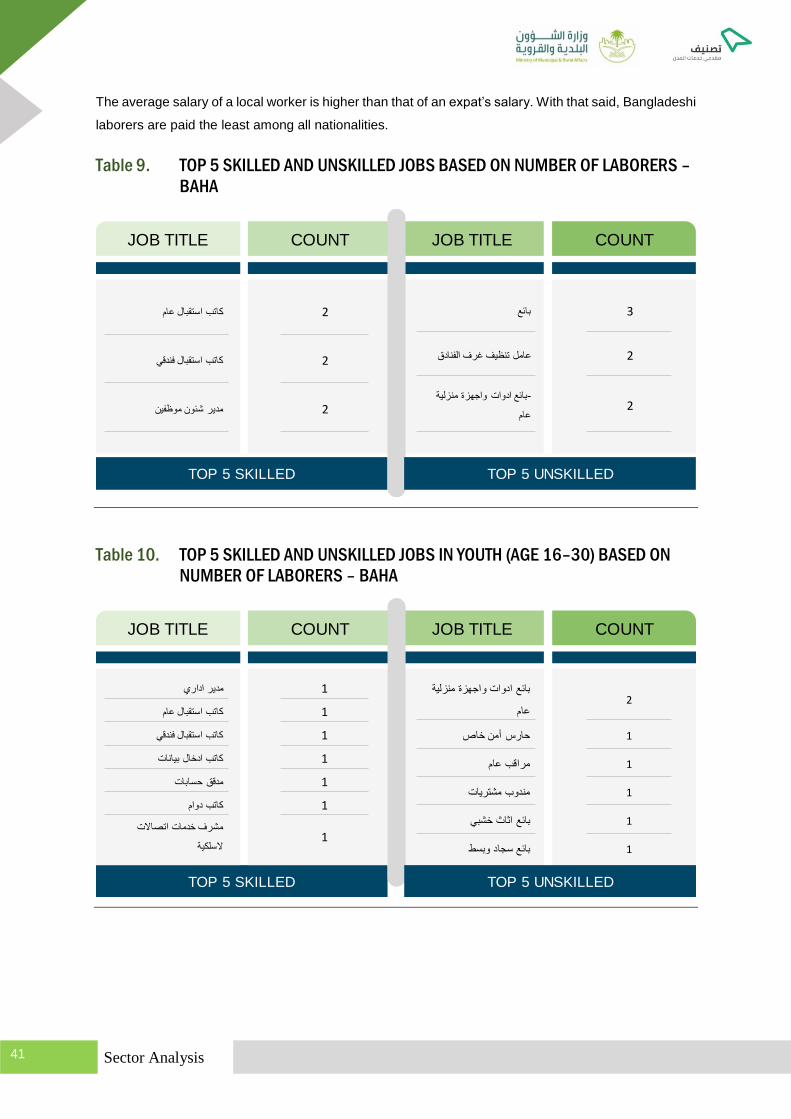
Table 9. TOP 5 SKILLED AND UNSKILLED JOBS BASED ON NUMBER OF LABORERS – BAHA ...................................................................................................... 41
Table 10. TOP 5 SKILLED AND UNSKILLED JOBS IN YOUTH (AGE 16–30) BASED ON NUMBER OF LABORERS – BAHA ......................................................................... 41
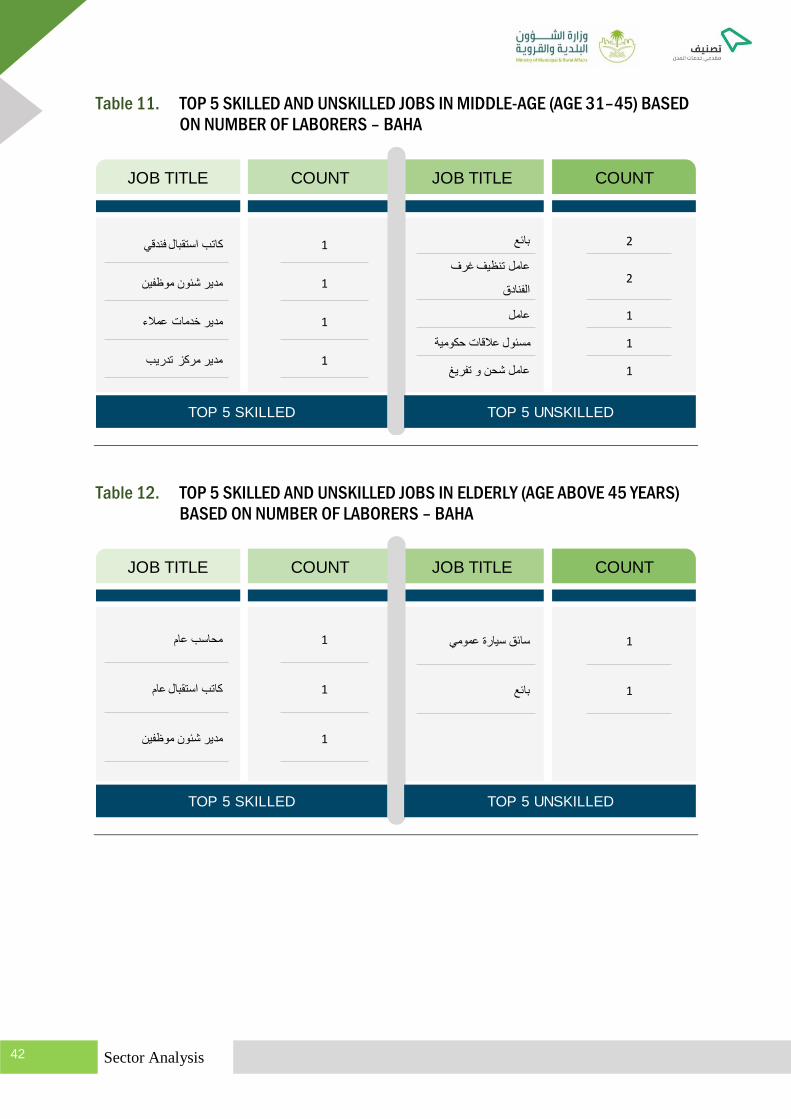
Table 11. TOP 5 SKILLED AND UNSKILLED JOBS IN MIDDLE-AGE (AGE 31–45) BASED ON NUMBER OF LABORERS – BAHA ........................................................... 42
Table 12. TOP 5 SKILLED AND UNSKILLED JOBS IN ELDERLY (AGE ABOVE 45 YEARS) BASED ON NUMBER OF LABORERS – BAHA ............................................. 42
Table 13. TOP 5 SKILLED AND UNSKILLED JOBS BASED ON NUMBER OF LABORERS – EASTERN ............................................................................................... 48
Table 14. TOP 5 SKILLED AND UNSKILLED JOBS IN YOUTH (AGE 16–30) BASED ON NUMBER OF LABORERS – EASTERN ................................................................. 48
Table 15. TOP 5 SKILLED AND UNSKILLED JOBS IN MIDDLE-AGE (AGE 31–45) BASED ON NUMBER OF LABORERS – EASTERN .................................................... 49
Table 16. TOP 5 SKILLED AND UNSKILLED JOBS IN ELDERLY (AGE ABOVE 45 YEARS) BASED ON NUMBER OF LABORERS – EASTERN ...................................... 49
Table 17. TOP 5 SKILLED AND UNSKILLED JOBS BASED ON NUMBER OF LABORERS – HAIL ........................................................................................................ 55
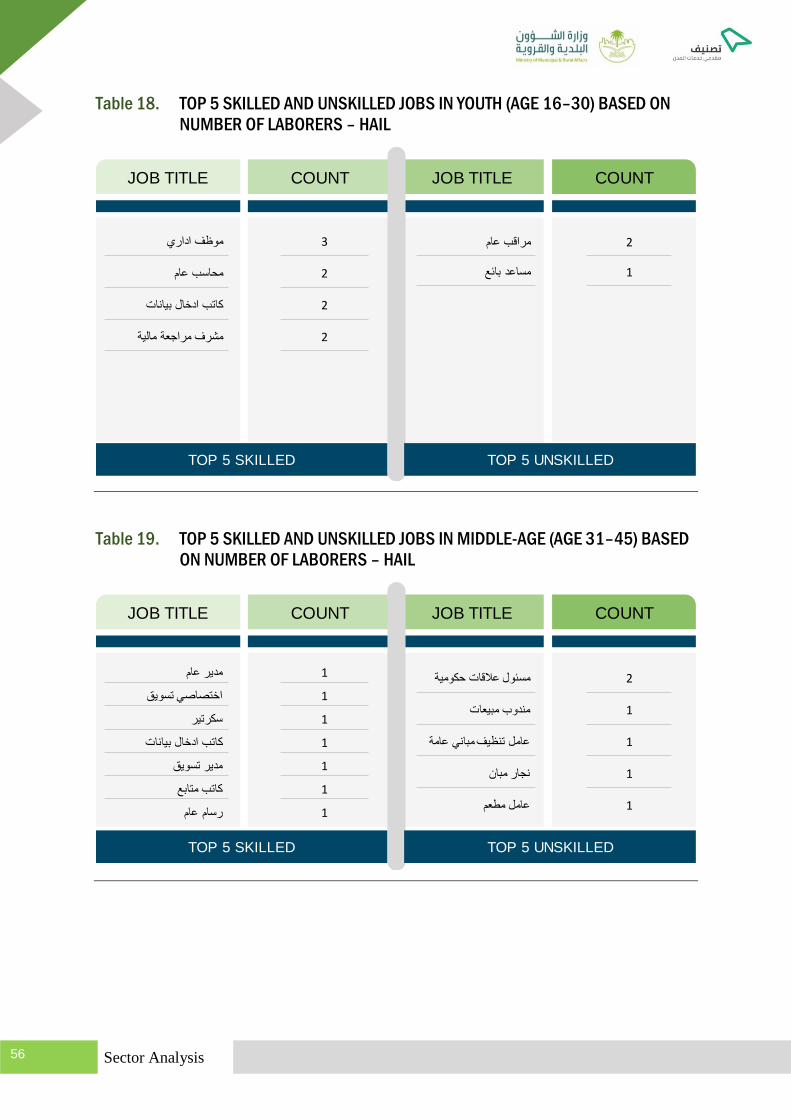
Table 18. TOP 5 SKILLED AND UNSKILLED JOBS IN YOUTH (AGE 16–30) BASED ON NUMBER OF LABORERS – HAIL .......................................................................... 56
Table 19. TOP 5 SKILLED AND UNSKILLED JOBS IN MIDDLE-AGE (AGE 31–45) BASED ON NUMBER OF LABORERS – HAIL ............................................................. 56

Sector Analysis 5
Table 20. TOP 5 SKILLED AND UNSKILLED JOBS IN ELDERLY (AGE ABOVE 45 YEARS) BASED ON NUMBER OF LABORERS – HAIL ............................................... 57
Table 21. TOP 5 SKILLED AND UNSKILLED JOBS BASED ON NUMBER OF LABORERS – JAZAN .................................................................................................... 62
Table 22. TOP 5 SKILLED AND UNSKILLED JOBS IN YOUTH (AGE 16–30) BASED ON NUMBER OF LABORERS – JAZAN ....................................................................... 63
Table 23. TOP 5 SKILLED AND UNSKILLED JOBS IN MIDDLE-AGE (AGE 31–45) BASED ON NUMBER OF LABORERS – JAZAN .......................................................... 63
Table 24. TOP 5 SKILLED AND UNSKILLED JOBS IN ELDERLY (AGE ABOVE 45 YEARS) BASED ON NUMBER OF LABORERS – JAZAN ........................................... 64
Table 25. TOP 5 SKILLED AND UNSKILLED JOBS BASED ON NUMBER OF LABORERS – JOUF ...................................................................................................... 70
Table 26. TOP 5 SKILLED AND UNSKILLED JOBS IN YOUTH (AGE 16–30) BASED ON NUMBER OF LABORERS – JOUF ......................................................................... 71
Table 27. TOP 5 SKILLED AND UNSKILLED JOBS IN MIDDLE-AGE (AGE 31–45) BASED ON NUMBER OF LABORERS – JOUF ............................................................ 71
Table 28. TOP 5 SKILLED AND UNSKILLED JOBS IN ELDERLY (AGE ABOVE 45 YEARS) BASED ON NUMBER OF LABORERS – JOUF ............................................. 72
Table 29. TOP 5 SKILLED AND UNSKILLED JOBS BASED ON NUMBER OF LABORERS – MADINAH ............................................................................................... 77
Table 30. TOP 5 SKILLED AND UNSKILLED JOBS IN YOUTH (AGE 16–30) BASED ON NUMBER OF LABORERS – MADINAH .................................................................. 78
Table 31. TOP 5 SKILLED AND UNSKILLED JOBS IN MIDDLE-AGE (AGE 31–45) BASED ON NUMBER OF LABORERS – MADINAH..................................................... 78
Table 32. TOP 5 SKILLED AND UNSKILLED JOBS IN ELDERLY (AGE ABOVE 45 YEARS) BASED ON NUMBER OF LABORERS – MADINAH ...................................... 79
Table 33. TOP 5 SKILLED AND UNSKILLED JOBS BASED ON NUMBER OF LABORERS – MAKKAH ................................................................................................ 86
Table 34. TOP 5 SKILLED AND UNSKILLED JOBS IN YOUTH (AGE 16–30) BASED ON NUMBER OF LABORERS – MAKKAH ................................................................... 86
Table 35. TOP 5 SKILLED AND UNSKILLED JOBS IN MIDDLE-AGE (AGE 31–45) BASED ON NUMBER OF LABORERS – MAKKAH ...................................................... 87
Table 36. TOP 5 SKILLED AND UNSKILLED JOBS IN ELDERLY (AGE ABOVE 45 YEARS) BASED ON NUMBER OF LABORERS – MAKKAH ....................................... 87
Table 37. TOP 5 SKILLED AND UNSKILLED JOBS BASED ON NUMBER OF LABORERS – NAJRAN ................................................................................................. 94
Table 38. TOP 5 SKILLED AND UNSKILLED JOBS IN YOUTH (AGE 16–30) BASED ON NUMBER OF LABORERS – NAJRAN .................................................................... 95
Table 39. TOP 5 SKILLED AND UNSKILLED JOBS IN MIDDLE-AGE (AGE 31–45) BASED ON NUMBER OF LABORERS – NAJRAN ....................................................... 95

Sector Analysis 6
Table 40. TOP 5 SKILLED AND UNSKILLED JOBS IN ELDERLY (AGE ABOVE 45 YEARS) BASED ON NUMBER OF LABORERS – NAJRAN ........................................ 96
Table 41. TOP 5 SKILLED AND UNSKILLED JOBS BASED ON NUMBER OF LABORERS – NORTHERN ......................................................................................... 101
Table 42. TOP 5 SKILLED AND UNSKILLED JOBS IN YOUTH (AGE 16–30) BASED ON NUMBER OF LABORERS – NORTHERN ............................................................ 102
Table 43. TOP 5 SKILLED AND UNSKILLED JOBS IN MIDDLE-AGE (AGE 31–45) BASED ON NUMBER OF LABORERS – NORTHERN ............................................... 102
Table 44. TOP 5 SKILLED AND UNSKILLED JOBS IN ELDERLY (AGE ABOVE 45 YEARS) BASED ON NUMBER OF LABORERS – NORTHERN ................................ 103
Table 45. TOP 5 SKILLED AND UNSKILLED JOBS BASED ON NUMBER OF LABORERS – QASSIM ................................................................................................ 108
Table 46. TOP 5 SKILLED AND UNSKILLED JOBS IN YOUTH (AGE 16–30) BASED ON NUMBER OF LABORERS – QASSIM .................................................................. 109
Table 47. TOP 5 SKILLED AND UNSKILLED JOBS IN MIDDLE-AGE (AGE 31–45) BASED ON NUMBER OF LABORERS – QASSIM ..................................................... 109
Table 48. TOP 5 SKILLED AND UNSKILLED JOBS IN ELDERLY (AGE ABOVE 45 YEARS) BASED ON NUMBER OF LABORERS – QASSIM ....................................... 110
Table 49. TOP 5 SKILLED AND UNSKILLED JOBS BASED ON NUMBER OF LABORERS – RIYADH ................................................................................................ 115
Table 50. TOP 5 SKILLED AND UNSKILLED JOBS IN YOUTH (AGE 16–30) BASED ON NUMBER OF LABORERS – RIYADH ................................................................... 116
Table 51. TOP 5 SKILLED AND UNSKILLED JOBS IN MIDDLE-AGE (AGE 31–45) BASED ON NUMBER OF LABORERS – RIYADH ...................................................... 116
Table 52. TOP 5 SKILLED AND UNSKILLED JOBS IN ELDERLY (AGE ABOVE 45 YEARS) BASED ON NUMBER OF LABORERS – RIYADH ....................................... 117
Table 53. TOP 5 SKILLED AND UNSKILLED JOBS BASED ON NUMBER OF LABORERS – TABOUK ............................................................................................... 123
Table 54. TOP 5 SKILLED AND UNSKILLED JOBS IN YOUTH (AGE 16–30) BASED ON NUMBER OF LABORERS – TABOUK .................................................................. 124
Table 55. TOP 5 SKILLED AND UNSKILLED JOBS IN MIDDLE-AGE (AGE 31–45) BASED ON NUMBER OF LABORERS – TABOUK .................................................... 124
Table 56. TOP 5 SKILLED AND UNSKILLED JOBS IN ELDERLY (AGE ABOVE 45 YEARS) BASED ON NUMBER OF LABORERS – TABOUK ...................................... 125
Sector Analysis 7
List of Figures
Figure 1. DISTRIBUTION FOR NUMBER OF LABORER ............................................................ 14
Figure 2. OVERALL LABORER DISTRIBUTION ACROSS 5 SECTORS .................................... 15
Figure 3. AVERAGE WAGE DISTRIBUTION ACROSS SECTORS ............................................. 16
Figure 4. LABORER’S DISTRIBUTION BY AGE, GENDER AND NATIONALITY ....................... 17
Figure 5. TYPE-WISE LABORER’S DISTRIBUTION AMONG NATIONALITIES ......................... 18
Figure 6. TYPE-WISE LABORER’S DISTRIBUTION ACROSS NATIONALITIES ....................... 18
Figure 7. HEAT MAP FOR AVERAGE WAGE (IN SAR) IN ENGINEERING OFFICE SECTOR ........................................................................................................................ 19
Figure 8. YEARLY DISTRIBUTION OF NUMBER OF PROJECTS .............................................. 22
Figure 9. YEARLY DISTRIBUTION OF AVERAGE PROJECT VALUE ....................................... 23
Figure 10. BIG 10 COMPANIES IN ENGINEERING OFFICE SECTOR BASED ON LABORER COUNT ARE AS BELOW ............................................................................ 24
Figure 11. HEATMAP FOR AVERAGE WAGES (IN SAR) - AGE GROUP VS NATIONALITY ................................................................................................................ 25
Figure 12. REGION-WISE LABORER DISTRIBUTION FOR SKILLED/UNSKILLED AVERAGE WAGES (IN SAR) FOR SAUDI LABORERS .............................................. 25
Figure 13. REGION-WISE LABORER DISTRIBUTION FOR SKILLED/UNSKILLED AVERAGE WAGES (IN SAR) FOR NON-SAUDI LABORERS ..................................... 26
Figure 14. GOVERNMENT SPENDING ACROSS REGIONS ........................................................ 26
Figure 15. CATEGORY-WISE DISTRIBUTION OF COMPANIES IN ENGINEERING OFFICE SECTOR .......................................................................................................... 27
Figure 16. GENDER AND TYPE-WISE DISTRIBUTION OF LABORERS – ASIR ......................... 30
Figure 17. AGE VS NATIONALITY DISTRIBUTION OF LABORERS – ASIR................................ 30
Figure 18. TYPE-WISE LABORER DISTRIBUTION ACROSS NATIONALITIES – ASIR ....................................................................................................................................... 31
Figure 19. TYPE-WISE LABORER DISTRIBUTION AMONG NATIONALITIES – ASIR ............... 31
Figure 20. HEAT MAP FOR AVERAGE WAGES (IN SAR) IN ENGINEERING OFFICE SECTOR – ASIR ............................................................................................................ 32
Figure 21. HEAT MAP FOR AVERAGE WAGES (IN SAR) AGE VS NATIONALITY – ASIR ............................................................................................................................... 35
Figure 22. CATEGORY-WISE COMPANY DISTRIBUTION – ASIR .............................................. 36
Figure 23. GENDER AND TYPE-WISE DISTRIBUTION OF LABORERS – BAHA ....................... 38
Figure 24. AGE VS NATIONALITY DISTRIBUTION OF LABORERS – BAHA .............................. 39

Sector Analysis 8
Figure 25. TYPE-WISE LABORER DISTRIBUTION ACROSS NATIONALITIES – BAHA .............................................................................................................................. 39
Figure 26. TYPE-WISE LABORER DISTRIBUTION AMONG NATIONALITIES – BAHA ....................................................................................................................................... 40
Figure 27. HEAT MAP FOR AVERAGE WAGES (IN SAR) IN ENGINEERING OFFICE SECTOR – BAHA .......................................................................................................... 40
Figure 28. HEAT MAP FOR AVERAGE WAGES (IN SAR) AGE VS NATIONALITY – BAHA .............................................................................................................................. 43
Figure 29. CATEGORY-WISE COMPANY DISTRIBUTION – BAHA ............................................. 43
Figure 30. GENDER AND TYPE-WISE DISTRIBUTION OF LABORERS – EASTERN ................ 45
Figure 31. AGE VS NATIONALITY DISTRIBUTION OF LABORERS – EASTERN ....................... 45
Figure 32. TYPE-WISE LABORER DISTRIBUTION ACROSS NATIONALITIES – EASTERN ...................................................................................................................... 46
Figure 33. TYPE-WISE LABORER DISTRIBUTION AMONG NATIONALITIES – EASTERN ...................................................................................................................... 46
Figure 34. HEAT MAP FOR AVERAGE WAGES (IN SAR) IN ENGINEERING OFFICE SECTOR – EASTERN ................................................................................................... 47
Figure 35. HEAT MAP FOR AVERAGE WAGES (IN SAR) AGE VS NATIONALITY – EASTERN ...................................................................................................................... 51
Figure 36. CATEGORY-WISE COMPANY DISTRIBUTION – EASTERN ...................................... 51
Figure 37. GENDER AND TYPE-WISE DISTRIBUTION OF LABORERS – HAIL ......................... 53
Figure 38. AGE VS NATIONALITY DISTRIBUTION OF LABORERS – HAIL ................................ 53
Figure 39. TYPE-WISE LABORER DISTRIBUTION ACROSS NATIONALITIES – HAIL ....................................................................................................................................... 54
Figure 40. TYPE-WISE LABORER DISTRIBUTION AMONG NATIONALITIES – HAIL ................ 54
Figure 41. HEAT MAP FOR AVERAGE WAGES (IN SAR) IN ENGINEERING OFFICE SECTOR – HAIL ............................................................................................................ 55
Figure 42. HEAT MAP FOR AVERAGE WAGES (IN SAR) AGE VS NATIONALITY – HAIL ............................................................................................................................... 57
Figure 43. CATEGORY-WISE COMPANY DISTRIBUTION – HAIL ............................................... 58
Figure 44. GENDER AND TYPE-WISE DISTRIBUTION OF LABORERS ..................................... 60
Figure 45. AGE VS NATIONALITY DISTRIBUTION OF LABORERS ............................................ 60
Figure 46. TYPE-WISE LABORER DISTRIBUTION ACROSS NATIONALITIES – JAZAN ............................................................................................................................ 61
Figure 47. TYPE-WISE LABORER DISTRIBUTION AMONG NATIONALITIES – JAZAN ............................................................................................................................ 61

Sector Analysis 9
Figure 48. HEAT MAP FOR AVERAGE WAGES (IN SAR) IN ENGINEERING OFFICE SECTOR – JAZAN ......................................................................................................... 62
Figure 49. HEAT MAP FOR AVERAGE WAGES (IN SAR) AGE VS NATIONALITY – JAZAN ............................................................................................................................ 65
Figure 50. CATEGORY-WISE COMPANY DISTRIBUTION – JAZAN ........................................... 66
Figure 51. GENDER AND TYPE-WISE DISTRIBUTION OF LABORERS – JOUF ........................ 68
Figure 52. AGE VS NATIONALITY DISTRIBUTION OF LABORERS – JOUF............................... 68
Figure 53. TYPE-WISE LABORER DISTRIBUTION ACROSS NATIONALITIES – JOUF .............................................................................................................................. 69
Figure 54. TYPE-WISE LABORER DISTRIBUTION AMONG NATIONALITIES – JOUF ....................................................................................................................................... 69
Figure 55. HEAT MAP FOR AVERAGE WAGES (IN SAR) IN ENGINEERING OFFICE SECTOR – JOUF ........................................................................................................... 70
Figure 56. HEAT MAP FOR AVERAGE WAGES (IN SAR) AGE VS NATIONALITY – JOUF .............................................................................................................................. 73
Figure 57. CATEGORY-WISE COMPANY DISTRIBUTION – JOUF ............................................. 73
Figure 58. GENDER AND TYPE-WISE DISTRIBUTION OF LABORERS – MADINAH ................ 75
Figure 59. AGE VS NATIONALITY DISTRIBUTION OF LABORERS – MADINAH ....................... 75
Figure 60. TYPE-WISE LABORER DISTRIBUTION ACROSS NATIONALITIES – MADINAH ....................................................................................................................... 76
Figure 61. TYPE-WISE LABORER DISTRIBUTION AMONG NATIONALITIES – MADINAH ....................................................................................................................... 76
Figure 62. HEAT MAP FOR AVERAGE WAGES (IN SAR) IN ENGINEERING OFFICE SECTOR – MADINAH .................................................................................................... 77
Figure 63. HEAT MAP FOR AVERAGE WAGES (IN SAR) AGE VS NATIONALITY – MADINAH ....................................................................................................................... 80
Figure 64. CATEGORY-WISE COMPANY DISTRIBUTION – MADINAH ...................................... 81
Figure 65. GENDER AND TYPE-WISE DISTRIBUTION OF LABORERS – MAKKAH .................. 83
Figure 66. AGE VS NATIONALITY DISTRIBUTION OF LABORERS – MAKKAH ......................... 83
Figure 67. TYPE-WISE LABORER DISTRIBUTION ACROSS NATIONALITIES – MAKKAH ........................................................................................................................ 84
Figure 68. TYPE-WISE LABORER DISTRIBUTION AMONG NATIONALITIES – MAKKAH ........................................................................................................................ 84
Figure 69. HEAT MAP FOR AVERAGE WAGES (IN SAR) IN ENGINEERING OFFICE SECTOR – MAKKAH ..................................................................................................... 85
Figure 70. HEAT MAP FOR AVERAGE WAGES (IN SAR) AGE VS NATIONALITY – MAKKAH ........................................................................................................................ 89

Sector Analysis 10
Figure 71. CATEGORY-WISE COMPANY DISTRIBUTION – MAKKAH ........................................ 90
Figure 72. GENDER AND TYPE-WISE DISTRIBUTION OF LABORERS – NAJRAN ................... 92
Figure 73. AGE VS NATIONALITY DISTRIBUTION OF LABORERS – NAJRAN ......................... 92
Figure 74. TYPE-WISE LABORER DISTRIBUTION ACROSS NATIONALITIES – NAJRAN ......................................................................................................................... 93
Figure 75. TYPE-WISE LABORER DISTRIBUTION AMONG NATIONALITIES – NAJRAN ......................................................................................................................... 93
Figure 76. HEAT MAP FOR AVERAGE WAGES (IN SAR) IN ENGINEERING OFFICE SECTOR – NAJRAN ...................................................................................................... 94
Figure 77. HEAT MAP FOR AVERAGE WAGES (IN SAR) AGE VS NATIONALITY – NAJRAN ......................................................................................................................... 96
Figure 78. CATEGORY-WISE COMPANY DISTRIBUTION – NAJRAN ........................................ 97
Figure 79. GENDER AND TYPE-WISE DISTRIBUTION OF LABORERS – NORTHERN ................................................................................................................... 99
Figure 80. AGE VS NATIONALITY DISTRIBUTION OF LABORERS ............................................ 99
Figure 81. TYPE-WISE LABORER DISTRIBUTION ACROSS NATIONALITIES – NORTHERN ................................................................................................................. 100
Figure 82. TYPE-WISE LABORER DISTRIBUTION AMONG NATIONALITIES – NORTHERN ................................................................................................................. 100
Figure 83. HEAT MAP FOR AVERAGE WAGES (IN SAR) IN ENGINEERING OFFICE SECTOR – NORTHERN .............................................................................................. 101
Figure 84. HEAT MAP FOR AVERAGE WAGES (IN SAR) AGE VS NATIONALITY – NORTHERN ................................................................................................................. 103
Figure 85. CATEGORY-WISE COMPANY DISTRIBUTION – NORTHERN ................................ 104
Figure 86. GENDER AND TYPE-WISE DISTRIBUTION OF LABORERS – QASSIM ................. 106
Figure 87. AGE VS NATIONALITY DISTRIBUTION OF LABORERS – QASSIM ........................ 106
Figure 88. TYPE-WISE LABORER DISTRIBUTION ACROSS NATIONALITIES – QASSIM ....................................................................................................................... 107
Figure 89. TYPE-WISE LABORER DISTRIBUTION AMONG NATIONALITIES – QASSIM ....................................................................................................................... 107
Figure 90. HEAT MAP FOR AVERAGE WAGES (IN SAR) IN ENGINEERING OFFICE SECTOR –QASSIM ..................................................................................................... 108
Figure 91. HEAT MAP FOR AVERAGE WAGES (IN SAR) AGE VS NATIONALITY – QASSIM ....................................................................................................................... 111
Figure 92. CATEGORY-WISE COMPANY DISTRIBUTION – QASSIM ....................................... 111
Figure 93. GENDER AND TYPE-WISE DISTRIBUTION OF LABORERS – RIYADH ................. 113
Sector Analysis 11
Figure 94. AGE VS NATIONALITY DISTRIBUTION OF LABORERS – RIYADH ........................ 113
Figure 95. TYPE-WISE LABORER DISTRIBUTION ACROSS NATIONALITIES – RIYADH ........................................................................................................................ 114
Figure 96. TYPE-WISE LABORER DISTRIBUTION AMONG NATIONALITIES – RIYADH ........................................................................................................................ 114
Figure 97. HEAT MAP FOR AVERAGE WAGES (IN SAR) IN ENGINEERING OFFICE SECTOR – RIYADH ..................................................................................................... 115
Figure 98. HEAT MAP FOR AVERAGE WAGES (IN SAR) AGE VS NATIONALITY – RIYADH ........................................................................................................................ 118
Figure 99. CATEGORY-WISE COMPANY DISTRIBUTION – RIYADH ....................................... 119
Figure 100. GENDER AND TYPE-WISE DISTRIBUTION OF LABORERS – TABOUK ................ 121
Figure 101. AGE VS NATIONALITY DISTRIBUTION OF LABORERS – TABOUK ....................... 121
Figure 102. TYPE-WISE LABORER DISTRIBUTION ACROSS NATIONALITIES – TABOUK ....................................................................................................................... 122
Figure 103. TYPE-WISE LABORER DISTRIBUTION AMONG NATIONALITIES – TABOUK ....................................................................................................................... 122
Figure 104. HEAT MAP FOR AVERAGE WAGES (IN SAR) IN ENGINEERING OFFICE SECTOR –TABOUK .................................................................................................... 123
Figure 105. HEAT MAP FOR AVERAGE WAGES (IN SAR) AGE VS NATIONALITY – TABOUK ....................................................................................................................... 125
Figure 106. CATEGORY-WISE COMPANY DISTRIBUTION – TABOUK ...................................... 126

Sector Analysis 12
Introduction
This research report provides insights on the sectors that provide various services to the regions in
Saudi Arabia. The scope of the study covers analysis on the establishments, workforce, financial
spending, and others of the engineering office sector. The report will provide comprehensive analysis
of the sector in regions such as Asir, Baha, Eastern, Hail, Jazan, Jouf, Madinah, Makkah, Najran,
Northern, Qassim, Riyadh, and Tabouk.
The aim of the study is to analyze the data gathered by administrative information to highlight laborer
distribution, government financial spending, and company distribution across the mentioned regions.
The Report Guidance
Chapter 1 covers a brief market overview across all sectors based on the laborers data.
Chapter 2 focuses on the engineering office sector, which highlights the share of skilled and
unskilled laborers, key companies in the sector, key job profiles along with skilled and unskilled
laborers, and government spending.
Chapter 3 covers the overall conclusion of the engineering office sector.
Sector Analysis 13
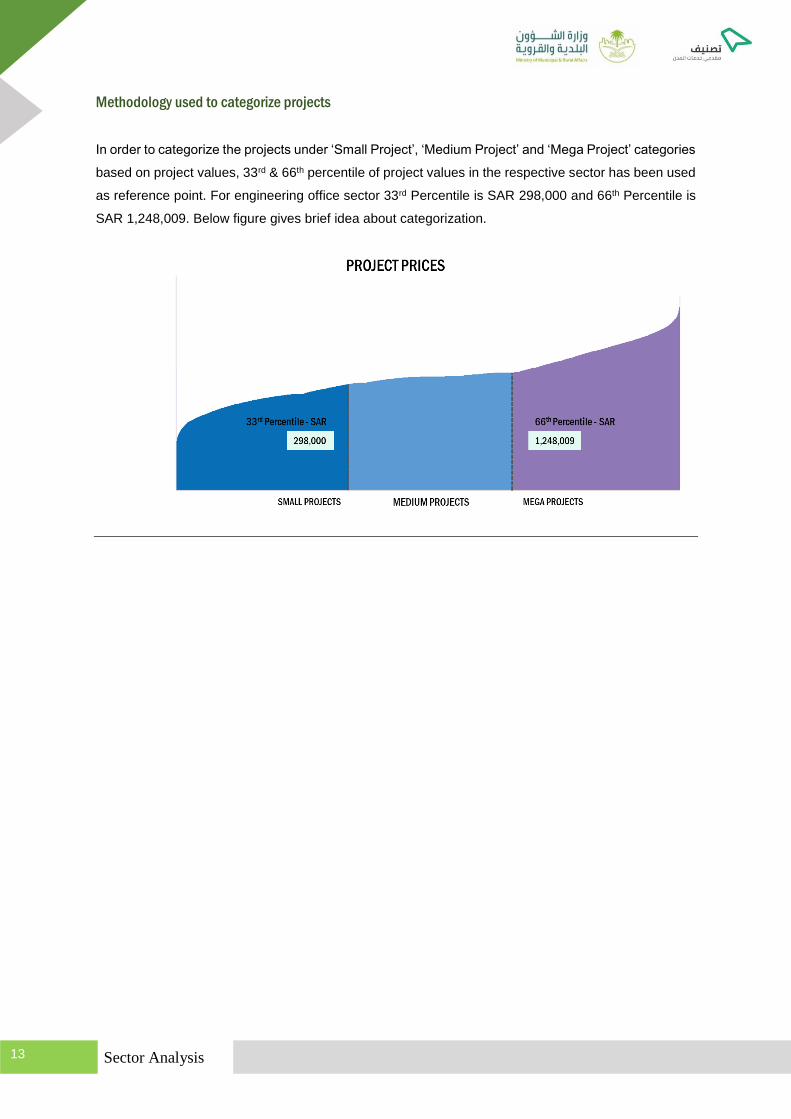
Methodology used to categorize projects
In order to categorize the projects under ‘Small Project’, ‘Medium Project’ and ‘Mega Project’ categories
based on project values, 33rd & 66th percentile of project values in the respective sector has been used
as reference point. For engineering office sector 33rd Percentile is SAR 298,000 and 66th Percentile is
SAR 1,248,009. Below figure gives brief idea about categorization.

Sector Analysis 14
1. Market Overview
Figure 1. DISTRIBUTION FOR NUMBER OF LABORER
Note: The chart labels are on basis of translation provided by Google translators for Nitaqat sector.
The above figure provides overall distribution of laborer count in different sectors across the Saudi
Arabian region. The construction sector held the largest share with more than 2.2 million (31%) laborers,
of which ~2 million laborers are non-Saudi in the total 2.2 million laborer population. The laborers have
a profound role in the overall activities in the construction sector and play a significant part in the
development of infrastructure and growth of the industry.
The maintenance & operation sector held the second largest share in the distribution of laborer in Saudi
Arabia, accounting for 6% of overall laborer share with about 5 lakhs laborers. Moreover, the nutrition
& subsistence sector held 3% share in the laborer distribution, whereas both engineering office and
communications & information technology sectors have 1% contribution in the overall laborer share.
Lastly, the rest of the sectors in the region are consolidated under others segment, which accounted
for 58% share in the laborer distribution.
31%
6%
3%
1%
1%
58%
The Construction Sector
Maintenance and operation Sector
Nutrition and subsitence Sector
Engineering office Sector
Communications and information technology sector
Others
Total Laborer

Sector Analysis 15
Figure 2. OVERALL LABORER DISTRIBUTION ACROSS 5 SECTORS
The figure shown above briefly illustrates the composition of skilled and unskilled laborers among the
Saudi and non-Saudi nationalities working in the Saudi Arabian regions. The proportion of unskilled
laborers is notably higher than that of skilled laborers across the construction and maintenance &
operation sectors. However, the selected sectors such as engineering office and communication &
information technology have a larger share of skilled workforce than that of unskilled workforce,
whereas the nutrition & subsistence sector, the proportion of skilled and unskilled laborers is observed
to be equal.
17
% 19
%
34
%
27
%
44
%
12
%
11
%
12
%
21
%
22
%
9%
10
%
4% 7
% 9%
0%
0%
0%
0%
0%
18%19%
17%
13% 13%
5% 7
%
7%
7%
5%
38
%
34
%
25
%
25
%
6%
0% 1% 0% 0% 0%0%
10%
20%
30%
40%
50%
60%
Construction Maintenance &
Operations
Nutrition &
Substences
Engineering Offices Communications &
Information
Technology
Saudi Skilled Male Saudi Skilled Female Non-Saudi Skilled Male
Non-Saudi Skilled Female Saudi Unskilled Male Saudi Unskilled Female
Non-Saudi Unskilled Male Non-Saudi Unskilled Female
Sector Analysis 16
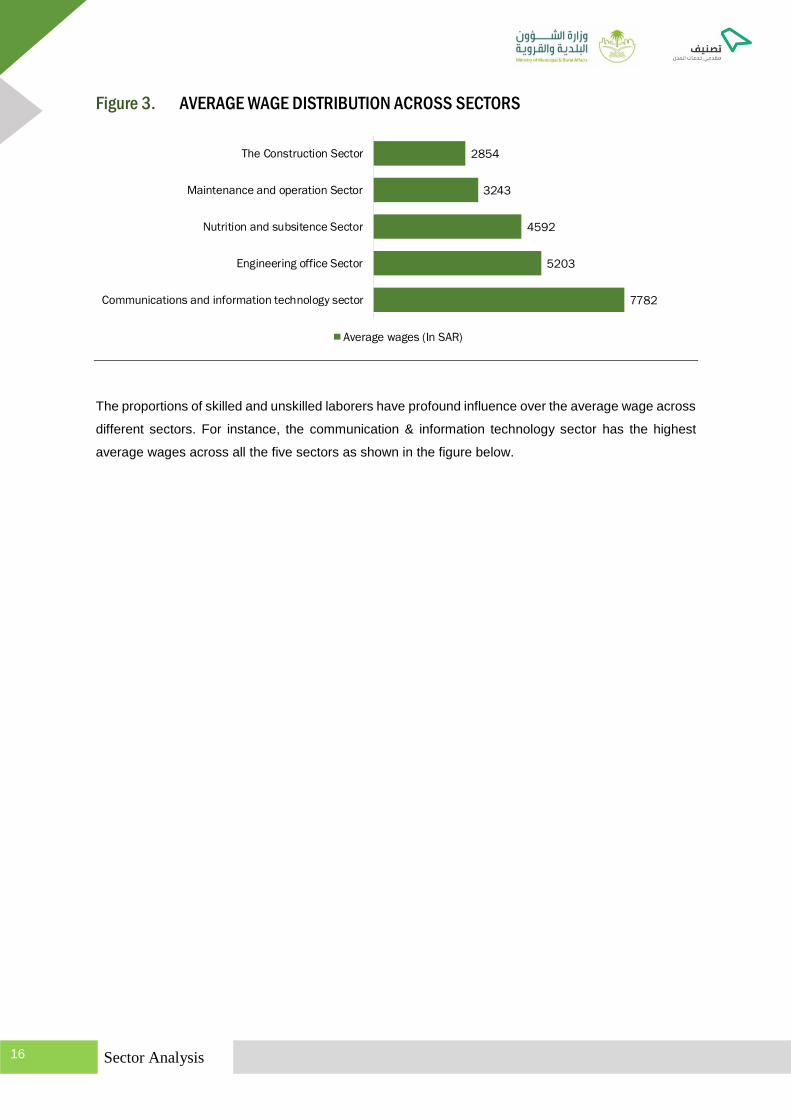
Figure 3. AVERAGE WAGE DISTRIBUTION ACROSS SECTORS
The proportions of skilled and unskilled laborers have profound influence over the average wage across
different sectors. For instance, the communication & information technology sector has the highest
average wages across all the five sectors as shown in the figure below.
2854
3243
4592
5203
7782
The Construction Sector
Maintenance and operation Sector
Nutrition and subsitence Sector
Engineering office Sector
Communications and information technology sector
Average wages (In SAR)

Sector Analysis 17
2. Engineering Office Sector
2.1 Laborers
Figure 4. LABORER’S DISTRIBUTION BY AGE, GENDER AND NATIONALITY
The figure shown above briefly provides the distribution of laborers across nationalities, age groups,
and gender across the Saudi Arabian region. Based on laborer distribution, by gender, the composition
of male laborers is observed to account for a significantly higher share than that of female laborers.
Moreover, based on laborer distribution, by nationality, the Saudi Arabian laborers accounted for the
largest share (82%) of the total labor force in the Saudi region, followed by Bangladesh and Egypt with
4% and 3%, respectively.
Lastly, the laborer distribution with regard to age versus nationality, the key categories of laborer
considered are youth (from 16 to 30 years), middle-aged (from 31 to 45 years), and elderly (beyond 45
years). A generalized trend is observed throughout the Saudi regions where the laborers comprising
the youth age group are mainly the Saudi nationalities, whereas among the middle-aged laborer group,
the local laborer dominates non-Saudi nationalities. However, in the elderly age group the composition
of Saudi and non-Saudi nationalities were almost equal among all the regions.
Age Vs Nationality distribution
Gender wise Distribution of Laborer Nationality in Maintenance & Operation sector
82%
4%
3%
3%
3%
2%
1%
1%
1%
1%
0%
Saudi Arabia
Bangladesh
Egypt
Yemen
India
Pakistan
Sudan
Syria
Philippines
Jordan
Nepal
Total Laborer
2%
10%
23%20%
13%
6%3% 2% 3%
1%
3%
4%
3%3%
4%
0%
5%
10%
15%
20%
25%
16-20 Years 21-25 Years 26-30 Years 31-35 Years 36-40 Years 41-45 Years 46-50 Years 51-55 Years 56 & AboveYears
Saudi Non-Saudi
50%32%
4%
0%
3%
0%
3%
0%
2%
0%
2% 0%
Male Female
Saudi Arabia Bangladesh Egypt Yemen India Pakistan Sudan Syria Philippines Jordan Nepal Others
Sector Analysis 18
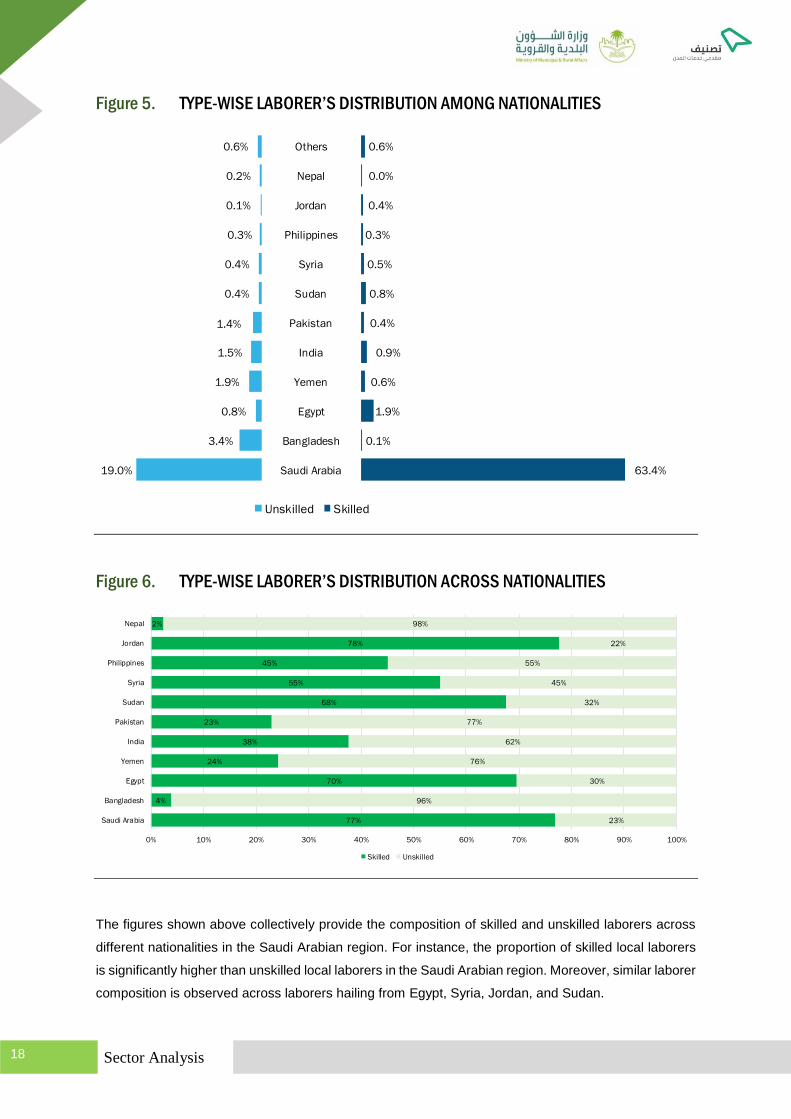
Figure 5. TYPE-WISE LABORER’S DISTRIBUTION AMONG NATIONALITIES
Figure 6. TYPE-WISE LABORER’S DISTRIBUTION ACROSS NATIONALITIES
The figures shown above collectively provide the composition of skilled and unskilled laborers across
different nationalities in the Saudi Arabian region. For instance, the proportion of skilled local laborers
is significantly higher than unskilled local laborers in the Saudi Arabian region. Moreover, similar laborer
composition is observed across laborers hailing from Egypt, Syria, Jordan, and Sudan.
Saudi Arabia
Bangladesh
Egypt
Yemen
India
Pakistan
Sudan
Syria
Philippines
Jordan
Nepal
Others
19.0%
3.4%
0.8%
1.9%
1.5%
1.4%
0.4%
0.4%
0.3%
0.1%
0.2%
0.6%
63.4%
0.1%
1.9%
0.6%
0.9%
0.4%
0.8%
0.5%
0.3%
0.4%
0.0%
0.6%
Unskilled Skilled
77%
4%
70%
24%
38%
23%
68%
55%
45%
78%
2%
23%
96%
30%
76%
62%
77%
32%
45%
55%
22%
98%
0% 10% 20% 30% 40% 50% 60% 70% 80% 90% 100%
Saudi Arabia
Bangladesh
Egypt
Yemen
India
Pakistan
Sudan
Syria
Philippines
Jordan
Nepal
Skilled Unskilled

Sector Analysis 19
However, the proportion of unskilled laborers from countries such as Bangladesh, India, Pakistan,
Philippines, Yemen, and Nepal is notably higher than skilled laborers.
Figure 7. HEAT MAP FOR AVERAGE WAGE (IN SAR) IN ENGINEERING OFFICE SECTOR
The figures shown above highlight the distribution of wages across nationalities and laborer skills in the
engineering office sector. It is observed that the skilled laborers are highly paid due to their superior
education qualifications and technical expertise. Moreover, the male workers receive higher salary than
female workers. In addition, the local laborers in the engineering office sector are paid higher than the
expats. However, Bangladeshi workers account for the largest share of laborers among the expats and
the pay received by this group of laborers is the lowest.
Among expats, the notable share of unskilled Bangladesh laborers has contributed in the country’s
lower salary average in the engineering office sector, whereas laborers from the Jordan region receive
the highest wage averages in the engineering office sector.
LOW
MED
IUM
HIG
H
Skilled - Male Unskilled - Male
Saudi Arabia
Bangladesh
Egypt
Yemen
India
Pakistan
Sudan
Syria
Philippines
Jordan
Nepal
Skilled - Female Unskilled - Female
Saudi Arabia
Philippines
LOWMEDIUMHIGH
Sector Analysis 20
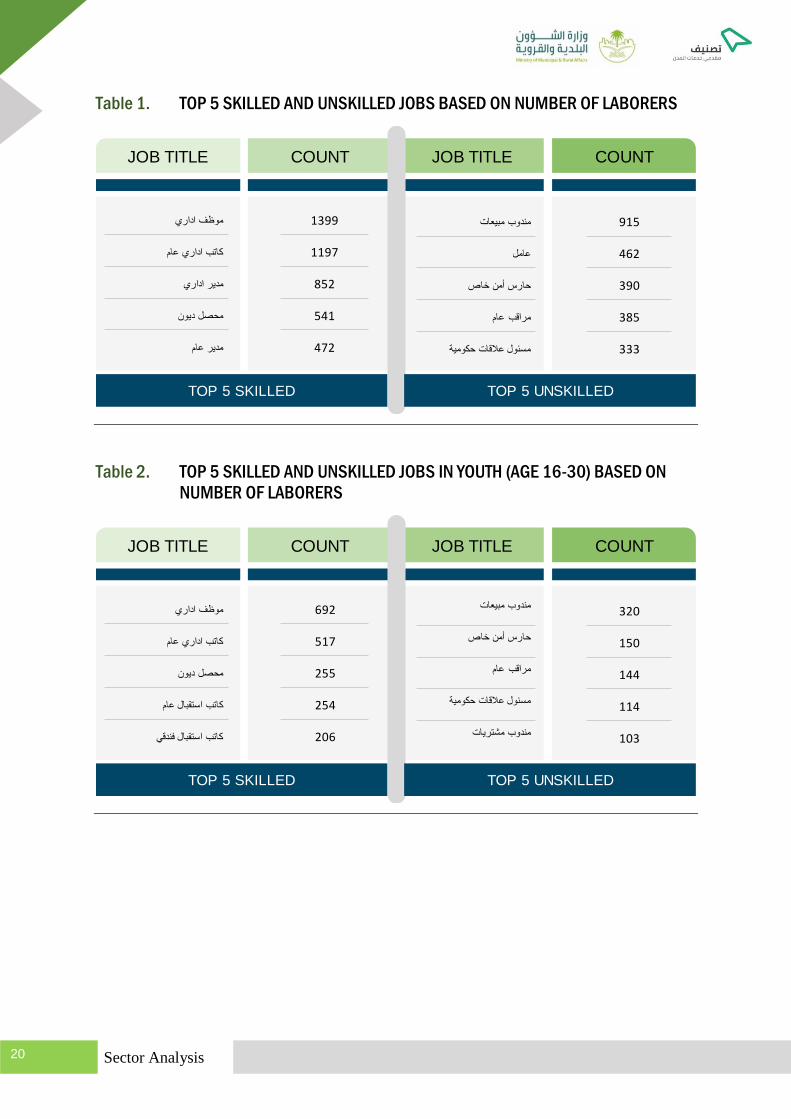
Table 1. TOP 5 SKILLED AND UNSKILLED JOBS BASED ON NUMBER OF LABORERS
Table 2. TOP 5 SKILLED AND UNSKILLED JOBS IN YOUTH (AGE 16-30) BASED ON
NUMBER OF LABORERS
TOP 5 SKILLED
JOB TITLE COUNTCOUNT JOB TITLE
1399
1197
852
541
472
TOP 5 UNSKILLED
915
462
390
385
333
TOP 5 SKILLED
JOB TITLE COUNTCOUNT JOB TITLE
692
517
255
254
206
TOP 5 UNSKILLED
320
150
144
114
103

Sector Analysis 21
Table 3. TOP 5 SKILLED AND UNSKILLED JOBS IN MID-AGE (AGE 31-45) BASED ON
NUMBER OF LABORERS
Table 4. TOP 5 SKILLED AND UNSKILLED JOBS IN OLD-AGE (AGE ABOVE 45 YEARS)
BASED ON NUMBER OF LABORERS
TOP 5 SKILLED
JOB TITLE COUNTCOUNT JOB TITLE
658
604
560
252
243
TOP 5 UNSKILLED
412
209
158
133
114
TOP 5 SKILLED
JOB TITLE COUNTCOUNT JOB TITLE
195
173
145
88
76
TOP 5 UNSKILLED
348
183
86
82
54

Sector Analysis 22
2.1.1 Government Spending
Figure 8. YEARLY DISTRIBUTION OF NUMBER OF PROJECTS

Sector Analysis 23
Figure 9. YEARLY DISTRIBUTION OF AVERAGE PROJECT VALUE
Note: The values for mega Project are plotted on secondary axes
The figures shown above collectively provide the analysis of government spending on different project
categories, namely small project, medium project and mega project (refer methodology in the
introduction chapter above). Based on the contracts data available, the engineering office sector had
990 projects in last three years. The total number of projects in all three categories is almost same
based on the project value.
In 2018, the engineering office sector received the highest number of projects in the Saudi Arabian
region. On the other hand, the average cost per project has witnessed changes in the past three years
for different project categories. For instance, the average cost per project has been steady for small
project in the past three years, whereas the average cost per project for medium project had increased
slightly in 2019, it dropped in 2020. Lastly, the mega project witnessed a sudden drop in 2019 & it
remains steady in 2020.

Sector Analysis 24
2.1.2 Companies
Figure 10. BIG 10 COMPANIES IN ENGINEERING OFFICE SECTOR BASED ON LABORER
COUNT ARE AS BELOW
1
2
3
4
5
TOP 10 COMPANIES - LARGE SIZE
Company Name Region Sum of Total Laborer
Makkah 670
Riyadh 550
Makkah 429
Riyadh 527
Riyadh 2359
Riyadh 1180
Makkah 1
4
1
4
4
1
1
4
1
2
3
4
5
6
7
TOP 10 MEDIUM COMPANIES
Company Name Region Sum of Total Laborer
Jazan 232
Makkah 254
Riyadh 247
Qassim 445
Riyadh 215
Riyadh 259
Riyadh 247
Riyadh 230
Riyadh 266
Riyadh 230
1
4
7
4
4
4
1
4
4
4

Sector Analysis 25
2.1.3 Relation
Figure 11. HEATMAP FOR AVERAGE WAGES (IN SAR) - AGE GROUP VS NATIONALITY
Figure 12. REGION-WISE LABORER DISTRIBUTION FOR SKILLED/UNSKILLED AVERAGE
WAGES (IN SAR) FOR SAUDI LABORERS
LOW
MED
IUM
HIG
H
Saudi
ArabiaBangladesh Egypt Yemen India Pakistan Sudan Syria Philippines Jordan Nepal
16-20
21-25
26-30
31-35
36-40
41-45
46-50
51-55
55 and
above
38
12
40
71
71
75
32
76
67
12
32
00
62
49 7
38
1
41
76
29
17
33
54
11
49
5
35
81
30
71
28
56 4
26
7
30
00
35
69
30
00 40
19
42
65
32
60
30
00
28
62
52
69
32
22
Skilled Unskilled

Sector Analysis 26
Figure 13. REGION-WISE LABORER DISTRIBUTION FOR SKILLED/UNSKILLED AVERAGE
WAGES (IN SAR) FOR NON-SAUDI LABORERS
As shown in the figure above, the skilled and unskilled laborers in Saudi receive higher wages in Riyadh,
Eastern, and Makkah regions compared with other regions mentioned. Furthermore, the non-Saudi
skilled laborers are paid with higher wages in Madinah, Makkah, and Eastern regions than those in
other regions in Saudi Arabia. Likewise, the non-Saudi unskilled laborers receive higher wages in
Eastern, Riyadh, and Makkah regions.
Figure 14. GOVERNMENT SPENDING ACROSS REGIONS
74
7
28
87
13
67
11
57
40
0
60
47
29
62
10
00
50
0
12
36
27
54
16
56
64
3
56
3
12
83
60
0
72
3
60
0 89
5 12
90
61
5
74
0
64
3 10
96
62
5
Skilled Unskilled
Sector Analysis 27
As shown in the figure above, based on contract data, it is observed that the Madinah region had
received the highest spending, i.e., SAR 450 million in the Saudi Arabian region for the engineering
office sector. Further, the Jazan & Riyadh held the next two position among all regions with regard to
spending. The Asir region held the lowest position among all regions with regard to spending in the
Saudi Arabian region.
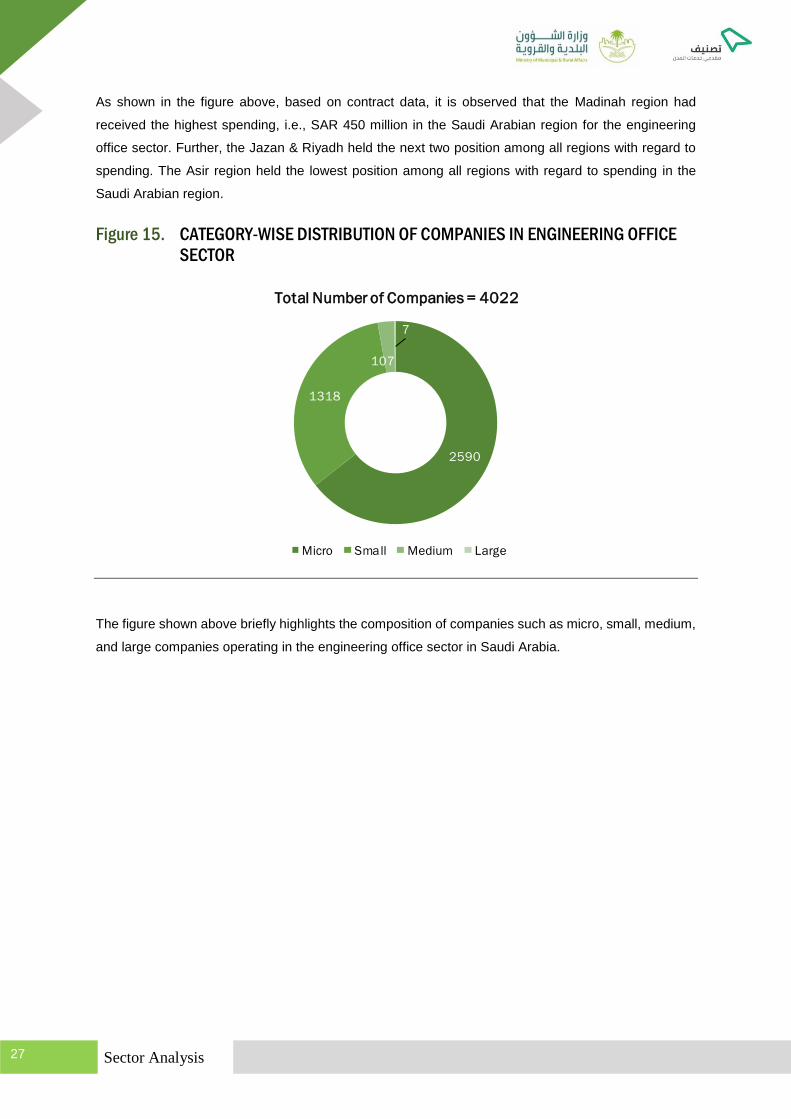
Figure 15. CATEGORY-WISE DISTRIBUTION OF COMPANIES IN ENGINEERING OFFICE
SECTOR
The figure shown above briefly highlights the composition of companies such as micro, small, medium,
and large companies operating in the engineering office sector in Saudi Arabia.
2590
1318
107
7
Total Number of Companies = 4022
Micro Small Medium Large

Sector Analysis 28

Sector Analysis 29
Sub Table of Content
2.2 Asir ............................................................................................................................ 30
2.2.1 Laborers .................................................................................................. 30
2.2.2 Companies .............................................................................................. 35
2.2.3 Relations .................................................................................................. 35
ASIR

Sector Analysis 30
2.2 Asir
2.2.1 Laborers
Figure 16. GENDER AND TYPE-WISE DISTRIBUTION OF LABORERS – ASIR
As per the figure for ‘Nationality-wise laborer distribution’ shown above, Saudi Arabia accounted for the
largest percentage of workers, i.e., 70% in terms of worker nationality. Workers from Bangladesh and
Pakistan contributed for the second and third largest share, i.e., 11% and 5%, respectively, in Asir.
Based on ‘Gender Vs Nationality’ chart, the workforce in Asir is extensively dominated by the male
(Saudi males, 52% and Non-Saudi males, 30%).
Figure 17. AGE VS NATIONALITY DISTRIBUTION OF LABORERS – ASIR
52%
30%
18%
Gender Vs Nationality
Saudi Male
Non-Saudi Male
Saudi Female
Non-Saudi Female
70%
11%
3%
1%
2%
5%
2%
1%
0%
0%
4%
1.4%
Saudi Arabia
Bangladesh
Egypt
Yemen
India
Pakistan
Sudan
Syria
Philippines
Jordan
Nepal
Others
Number of laborers
5%
16% 15%13%
5% 5%3% 2%
5%
1%
5% 4%
5%4%
11%
16-20 Years 21-25 Years 26-30 Years 31-35 Years 36-40 Years 41-45 Years 46-50 Years 51-55 Years 56 & AboveYears
Saudi Non-Saudi

Sector Analysis 31
In age-wise distribution, the youth category has Saudi laborers only, middle-age group has slightly
higher share of Saudi than that of non-Saudi laborers, and elderly group has a maximum share of
expats.
Figure 18. TYPE-WISE LABORER DISTRIBUTION ACROSS NATIONALITIES – ASIR
Figure 19. TYPE-WISE LABORER DISTRIBUTION AMONG NATIONALITIES – ASIR
Saudi Arabia
Bangladesh
Egypt
Yemen
India
Pakistan
Sudan
Syria
Philippines
Jordan
Nepal
Others
28.3%
10.8%
0.6%
0.6%
1.8%
4.2%
1.2%
0.6%
0.0%
0.0%
0.0%
3.0%
41.6%
0.0%
2.4%
0.6%
0.6%
0.6%
1.2%
0.6%
0.0%
0.0%
0.0%
1.2%
Unskilled Skilled
59%
0%
80%
50%
25%
13%
50%
50%
41%
100%
20%
50%
75%
88%
50%
50%
0% 10% 20% 30% 40% 50% 60% 70% 80% 90% 100%
Saudi Arabia
Bangladesh
Egypt
Yemen
India
Pakistan
Sudan
Syria
Skilled Unskilled

Sector Analysis 32
Among the skilled and unskilled laborer categories, Saudi Arabia accounted for the largest share of
skilled laborers, i.e., 42%, followed by Egypt with 2%. The unskilled laborer category is also dominated
by Saudi Arabia with 28%, followed by Bangladesh and Pakistan with 11% and 4%, respectively, in
Asir.
Among Saudi Arabian laborers, the proportion of skilled laborers is higher than the unskilled category.
In Yemen, Sudan, and Syria, the proportion is equal for skilled and unskilled laborers. The proportion
of skilled laborers is significantly higher than unskilled laborers who hail from Egypt. A reverse scenario
can be observed in laborers from Bangladesh, India, and Pakistan
Figure 20. HEAT MAP FOR AVERAGE WAGES (IN SAR) IN ENGINEERING OFFICE SECTOR
– ASIR
The average salary of a local worker is higher than that of an expat. As we do not have the share for
foreign female workers, we have not included the chart for female workers.
LOW
MED
IUM
HIG
H
Skilled - Male Unskilled - Male
Saudi Arabia
Bangladesh
Egypt
Yemen
India
Pakistan
Sudan
Syria
Sector Analysis 33
Table 5. TOP 5 SKILLED AND UNSKILLED JOBS BASED ON NUMBER OF LABORERS –
ASIR
Table 6. TOP 5 SKILLED AND UNSKILLED JOBS IN YOUTH (AGE 16–30) BASED ON
NUMBER OF LABORERS – ASIR
TOP 5 SKILLED
JOB TITLE COUNTCOUNT JOB TITLE
17
6
4
4
4
4
TOP 5 UNSKILLED
16
11
11
6
6
TOP 5 SKILLED
JOB TITLE COUNTCOUNT JOB TITLE
7
4
3
3
2
2
TOP 5 UNSKILLED
12
5
3
3
1
1

Sector Analysis 34
Table 7. TOP 5 SKILLED AND UNSKILLED JOBS IN MIDDLE-AGE (AGE 31–45) BASED
ON NUMBER OF LABORERS – ASIR
Table 8. TOP 5 SKILLED AND UNSKILLED JOBS IN ELDERLY (AGE ABOVE 45 YEARS)
BASED ON NUMBER OF LABORERS – ASIR
TOP 5 SKILLED
JOB TITLE COUNTCOUNT JOB TITLE
10
3
2
2
TOP 5 UNSKILLED
6
4
4
3
2
TOP 5 SKILLED
JOB TITLE COUNTCOUNT JOB TITLE
4
2
2
1
1
1
1
1
TOP 5 UNSKILLED
7
3
2
2
2
2
2
2
2
Sector Analysis 35
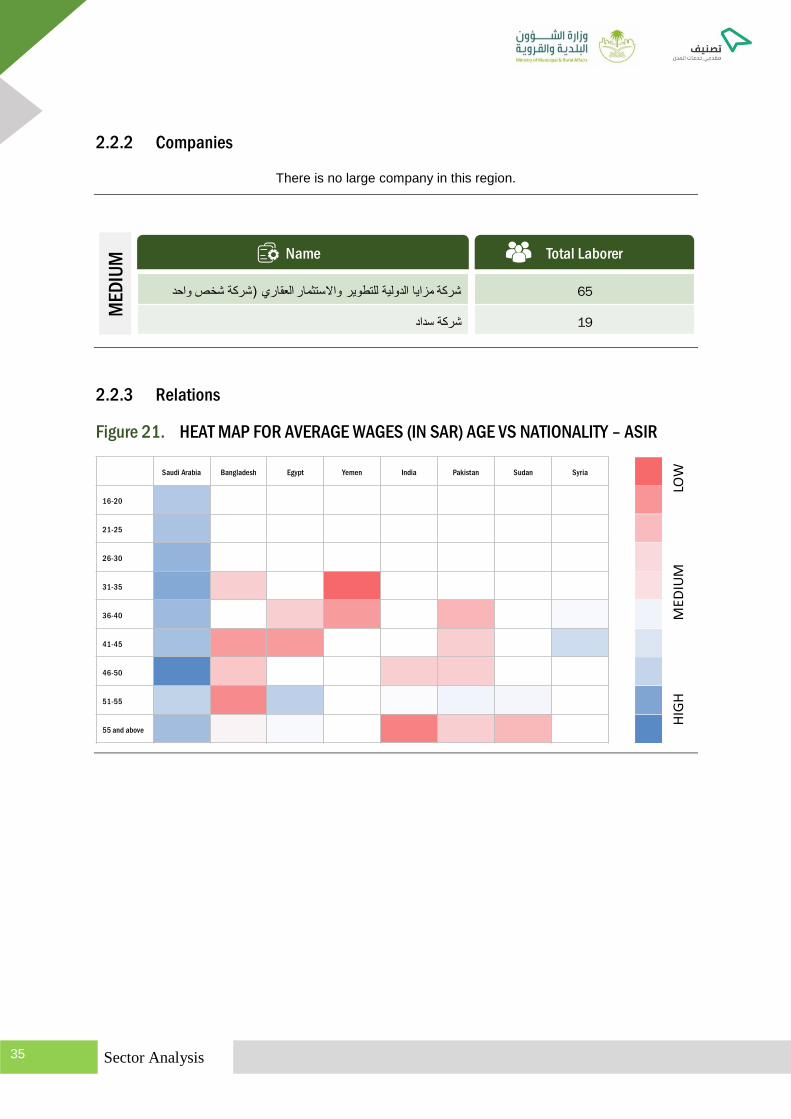
2.2.2 Companies
There is no large company in this region.
2.2.3 Relations
Figure 21. HEAT MAP FOR AVERAGE WAGES (IN SAR) AGE VS NATIONALITY – ASIR
Name Total Laborer
65
19
ME
DIU
M
LOW
MED
IUM
HIG
H
Saudi Arabia Bangladesh Egypt Yemen India Pakistan Sudan Syria
16-20
21-25
26-30
31-35
36-40
41-45
46-50
51-55
55 and above
Sector Analysis 36
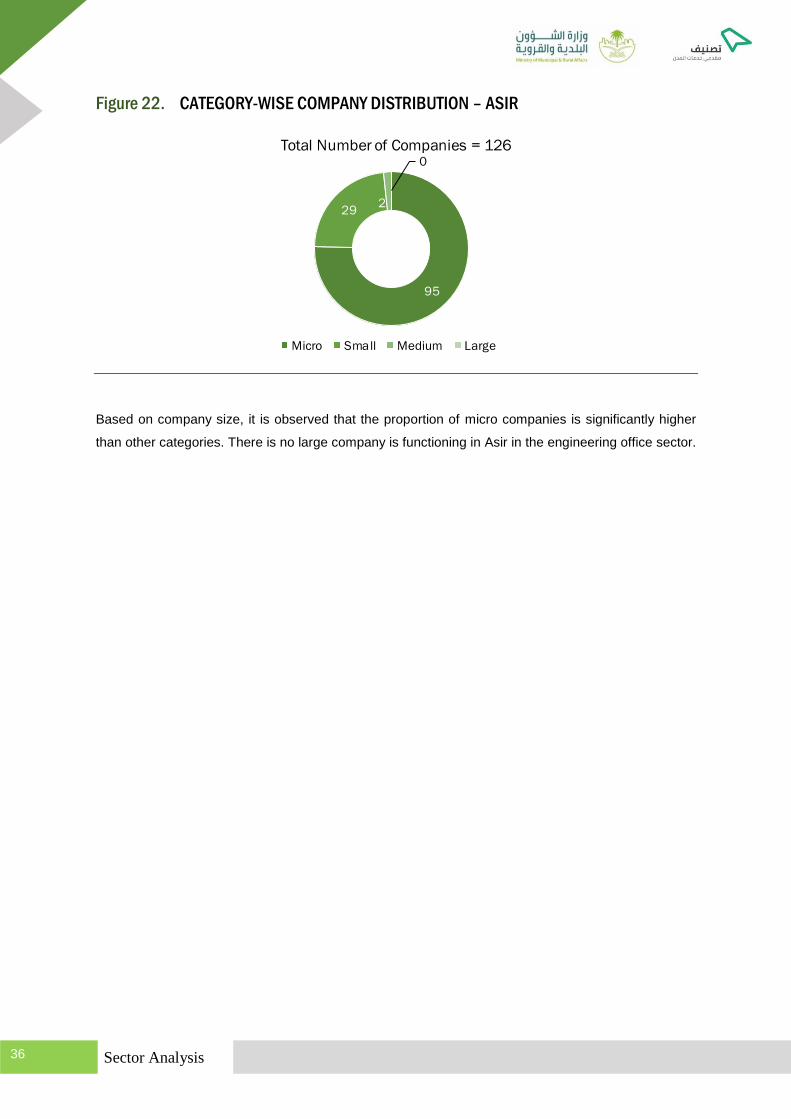
Figure 22. CATEGORY-WISE COMPANY DISTRIBUTION – ASIR
Based on company size, it is observed that the proportion of micro companies is significantly higher
than other categories. There is no large company is functioning in Asir in the engineering office sector.
95
292
0
Total Number of Companies = 126
Micro Small Medium Large

Sector Analysis 37
Sub Table of Content
2.3 Baha .......................................................................................................................... 38
2.3.1 Laborer .................................................................................................... 38
2.3.2 Companies .............................................................................................. 43
2.3.3 Relations .................................................................................................. 43
BAHA
Sector Analysis 38
2.3 Baha
2.3.1 Laborer
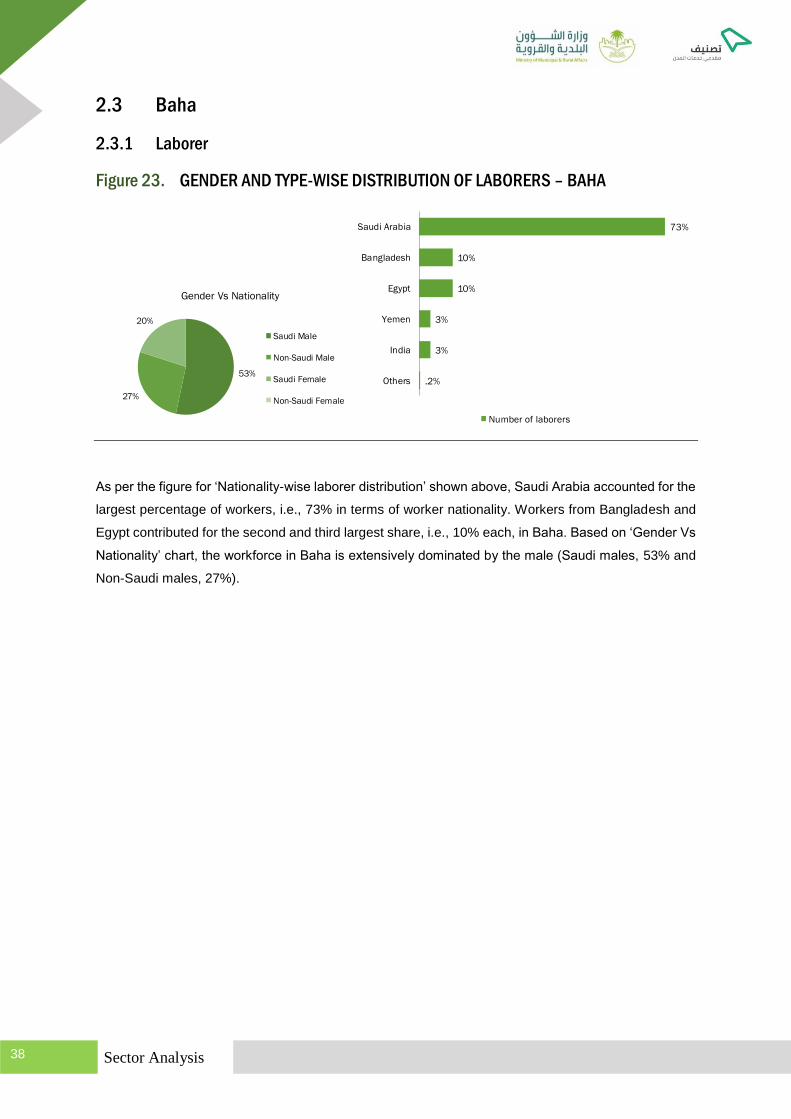
Figure 23. GENDER AND TYPE-WISE DISTRIBUTION OF LABORERS – BAHA
As per the figure for ‘Nationality-wise laborer distribution’ shown above, Saudi Arabia accounted for the
largest percentage of workers, i.e., 73% in terms of worker nationality. Workers from Bangladesh and
Egypt contributed for the second and third largest share, i.e., 10% each, in Baha. Based on ‘Gender Vs
Nationality’ chart, the workforce in Baha is extensively dominated by the male Saudi males, 53% and
Non-Saudi males, 27%).
53%
27%
20%
Gender Vs Nationality
Saudi Male
Non-Saudi Male
Saudi Female
Non-Saudi Female
73%
10%
10%
3%
3%
.2%
Saudi Arabia
Bangladesh
Egypt
Yemen
India
Others
Number of laborers

Sector Analysis 39
Figure 24. AGE VS NATIONALITY DISTRIBUTION OF LABORERS – BAHA
In age-wise distribution, the youth category has Saudi laborers only, middle-age group has almost equal
share of Saudi and non-Saudi laborers, and elderly group has a maximum share of local laborers.
Figure 25. TYPE-WISE LABORER DISTRIBUTION ACROSS NATIONALITIES – BAHA
7%
17%
23%
3%
13%
3%7%
10%
10% 3%
3%
16-20 Years 21-25 Years 26-30 Years 31-35 Years 36-40 Years 41-45 Years 46-50 Years 51-55 Years 56 & AboveYears
Saudi Non-Saudi
Saudi Arabia
Bangladesh
Egypt
Yemen
India
Pakistan
Sudan
Syria
Philippines
Jordan
Nepal
Others
26.7%
10.0%
10.0%
3.3%
3.3%
0.0%
0.0%
0.0%
0.0%
0.0%
0.0%
0.0%
46.7%0.0%
0.0%
0.0%
0.0%
0.0%
0.0%
0.0%
0.0%
0.0%
0.0%
0.0%
Unskilled Skilled

Sector Analysis 40
Figure 26. TYPE-WISE LABORER DISTRIBUTION AMONG NATIONALITIES – BAHA
Among the skilled and unskilled laborer categories, Saudi Arabia alone have share of skilled laborers,
i.e., 47%. The unskilled laborer category is also dominated by Saudi Arabia with 27%, followed by
Bangladesh and Egypt with 10% each, in Baha.
Among Saudi Arabian laborers, the proportion of unskilled laborers is higher than the skilled category.
For laborers who hail from Bangladesh, Egypt, India, and Yemen, only unskilled laborers have
contributed.
Figure 27. HEAT MAP FOR AVERAGE WAGES (IN SAR) IN ENGINEERING OFFICE SECTOR
– BAHA
64% 36%
100%
100%
100%
100%
0% 10% 20% 30% 40% 50% 60% 70% 80% 90% 100%
Saudi Arabia
Bangladesh
Egypt
Yemen
India
Skilled Unskilled
LOW
MED
IUM
HIG
HSkilled - Male Unskilled - Male
Saudi Arabia
Bangladesh
Egypt
Yemen
India
Sector Analysis 41
The average salary of a local worker is higher than that of an expat’s salary. With that said, Bangladeshi
laborers are paid the least among all nationalities.
Table 9. TOP 5 SKILLED AND UNSKILLED JOBS BASED ON NUMBER OF LABORERS –
BAHA
Table 10. TOP 5 SKILLED AND UNSKILLED JOBS IN YOUTH (AGE 16–30) BASED ON
NUMBER OF LABORERS – BAHA
TOP 5 SKILLED
JOB TITLE COUNTCOUNT JOB TITLE
2
2
2
TOP 5 UNSKILLED
3
2
2
TOP 5 SKILLED
JOB TITLE COUNTCOUNT JOB TITLE
1
1
1
1
1
1
1
TOP 5 UNSKILLED
2
1
1
1
1
1
Sector Analysis 42
Table 11. TOP 5 SKILLED AND UNSKILLED JOBS IN MIDDLE-AGE (AGE 31–45) BASED
ON NUMBER OF LABORERS – BAHA
Table 12. TOP 5 SKILLED AND UNSKILLED JOBS IN ELDERLY (AGE ABOVE 45 YEARS)
BASED ON NUMBER OF LABORERS – BAHA
TOP 5 SKILLED
JOB TITLE COUNTCOUNT JOB TITLE
1
1
1
1
TOP 5 UNSKILLED
2
2
1
1
1
TOP 5 SKILLED
JOB TITLE COUNTCOUNT JOB TITLE
1
1
1
TOP 5 UNSKILLED
1
1
Sector Analysis 43
2.3.2 Companies
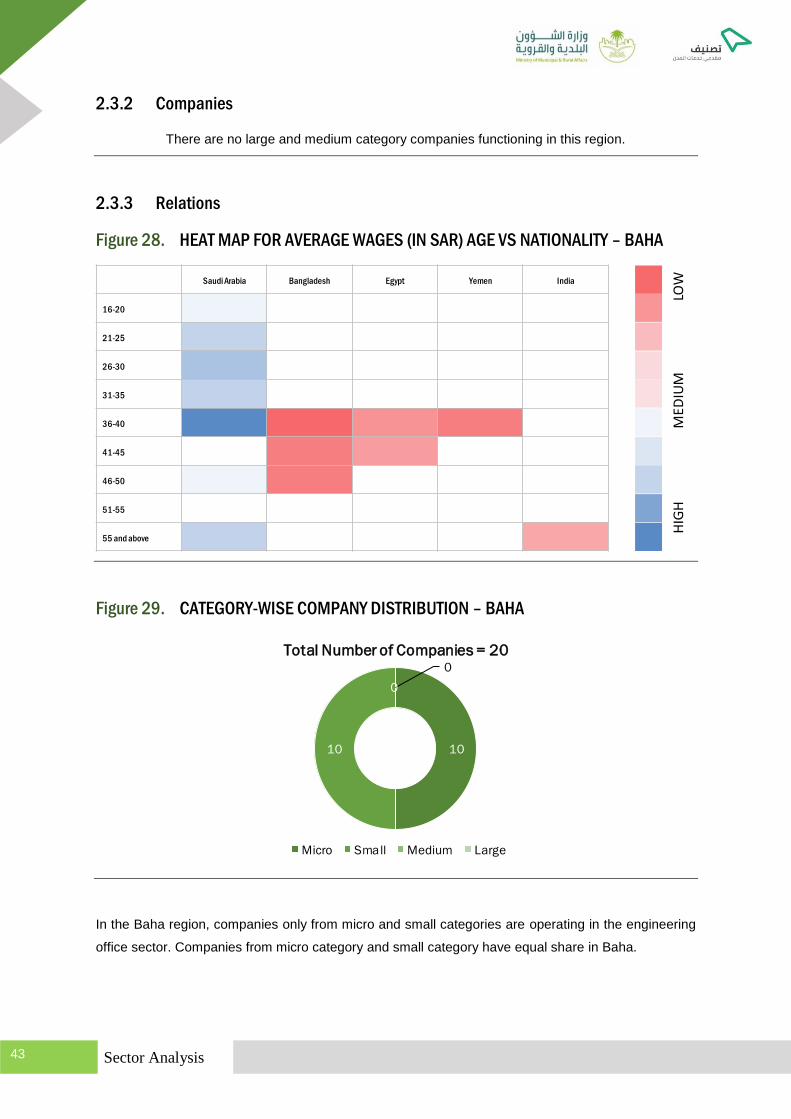
There are no large and medium category companies functioning in this region.
2.3.3 Relations
Figure 28. HEAT MAP FOR AVERAGE WAGES (IN SAR) AGE VS NATIONALITY – BAHA
Figure 29. CATEGORY-WISE COMPANY DISTRIBUTION – BAHA
In the Baha region, companies only from micro and small categories are operating in the engineering
office sector. Companies from micro category and small category have equal share in Baha.
LOW
MED
IUM
HIG
H
Saudi Arabia Bangladesh Egypt Yemen India
16-20
21-25
26-30
31-35
36-40
41-45
46-50
51-55
55 and above
1010
0
0
Total Number of Companies = 20
Micro Small Medium Large

Sector Analysis 44
Sub Table of Content
2.4 Eastern ...................................................................................................................... 45
2.4.1 Laborer .................................................................................................... 45
2.4.2 Companies .............................................................................................. 50
2.4.3 Relations .................................................................................................. 51
EASTERN
Sector Analysis 45
2.4 Eastern
2.4.1 Laborer
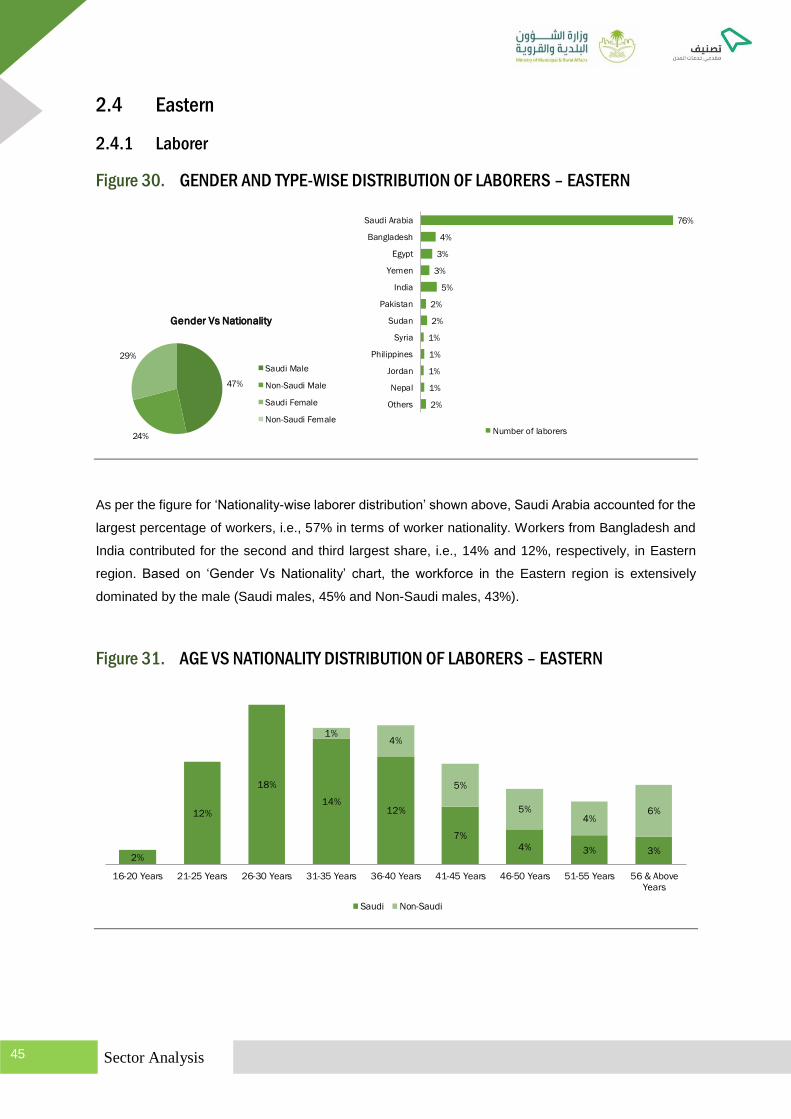
Figure 30. GENDER AND TYPE-WISE DISTRIBUTION OF LABORERS – EASTERN
As per the figure for ‘Nationality-wise laborer distribution’ shown above, Saudi Arabia accounted for the
largest percentage of workers, i.e., 57% in terms of worker nationality. Workers from Bangladesh and
India contributed for the second and third largest share, i.e., 14% and 12%, respectively, in Eastern
region. Based on ‘Gender Vs Nationality’ chart, the workforce in the Eastern region is extensively
dominated by the male (Saudi males, 45% and Non-Saudi males, 43%).
Figure 31. AGE VS NATIONALITY DISTRIBUTION OF LABORERS – EASTERN
76%
4%
3%
3%
5%
2%
2%
1%
1%
1%
1%
2%
Saudi Arabia
Bangladesh
Egypt
Yemen
India
Pakistan
Sudan
Syria
Philippines
Jordan
Nepal
Others
Number of laborers
47%
24%
29%
Gender Vs Nationality
Saudi Male
Non-Saudi Male
Saudi Female
Non-Saudi Female
2%
12%
18%
14%12%
7%
4% 3% 3%
1%4%
5%
5%4%
6%
16-20 Years 21-25 Years 26-30 Years 31-35 Years 36-40 Years 41-45 Years 46-50 Years 51-55 Years 56 & AboveYears
Saudi Non-Saudi

Sector Analysis 46
In age-wise distribution, the youth category has Saudi laborers only, middle-age group has slightly
higher share of Saudi than that of non-Saudi laborers, and elderly group has a maximum share of
expats.
Figure 32. TYPE-WISE LABORER DISTRIBUTION ACROSS NATIONALITIES – EASTERN
Figure 33. TYPE-WISE LABORER DISTRIBUTION AMONG NATIONALITIES – EASTERN
Saudi Arabia
Bangladesh
Egypt
Yemen
India
Pakistan
Sudan
Syria
Philippines
Jordan
Nepal
Others
22.3%
4.3%
0.7%
1.6%
3.3%
1.0%
0.7%
0.6%
0.7%
0.0%
1.1%
0.0%
53.4%
0.0%
2.8%
1.1%
1.5%
0.6%
1.2%
0.0%
0.0%
0.7%
0.0%
1.2%
Unskilled Skilled
71%
3%
81%
40%
31%
36%
64%
38%
40%
76%
0%
29%
97%
19%
60%
69%
64%
36%
63%
60%
24%
100%
0% 10% 20% 30% 40% 50% 60% 70% 80% 90% 100%
Saudi Arabia
Bangladesh
Egypt
Yemen
India
Pakistan
Sudan
Syria
Philippines
Jordan
Nepal
Skilled Unskilled
Sector Analysis 47
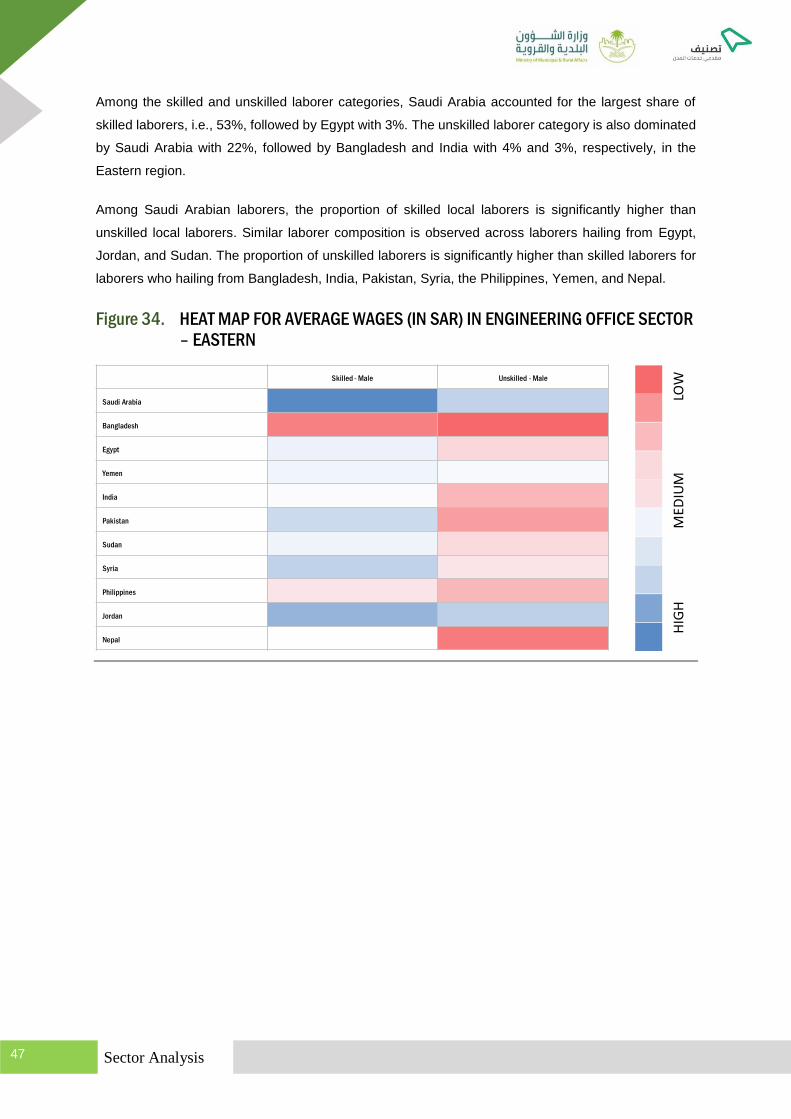
Among the skilled and unskilled laborer categories, Saudi Arabia accounted for the largest share of
skilled laborers, i.e., 53%, followed by Egypt with 3%. The unskilled laborer category is also dominated
by Saudi Arabia with 22%, followed by Bangladesh and India with 4% and 3%, respectively, in the
Eastern region.
Among Saudi Arabian laborers, the proportion of skilled local laborers is significantly higher than
unskilled local laborers. Similar laborer composition is observed across laborers hailing from Egypt,
Jordan, and Sudan. The proportion of unskilled laborers is significantly higher than skilled laborers for
laborers who hailing from Bangladesh, India, Pakistan, Syria, the Philippines, Yemen, and Nepal.
Figure 34. HEAT MAP FOR AVERAGE WAGES (IN SAR) IN ENGINEERING OFFICE SECTOR
– EASTERN
LOW
MED
IUM
HIG
H
Skilled - Male Unskilled - Male
Saudi Arabia
Bangladesh
Egypt
Yemen
India
Pakistan
Sudan
Syria
Philippines
Jordan
Nepal

Sector Analysis 48
Table 13. TOP 5 SKILLED AND UNSKILLED JOBS BASED ON NUMBER OF LABORERS –
EASTERN
Table 14. TOP 5 SKILLED AND UNSKILLED JOBS IN YOUTH (AGE 16–30) BASED ON
NUMBER OF LABORERS – EASTERN
TOP 5 SKILLED
JOB TITLE COUNTCOUNT JOB TITLE
82
78
69
68
52
TOP 5 UNSKILLED
140
69
63
53
34
TOP 5 SKILLED
JOB TITLE COUNTCOUNT JOB TITLE
52
42
28
25
21
TOP 5 UNSKILLED
49
25
20
13
10
Sector Analysis 49
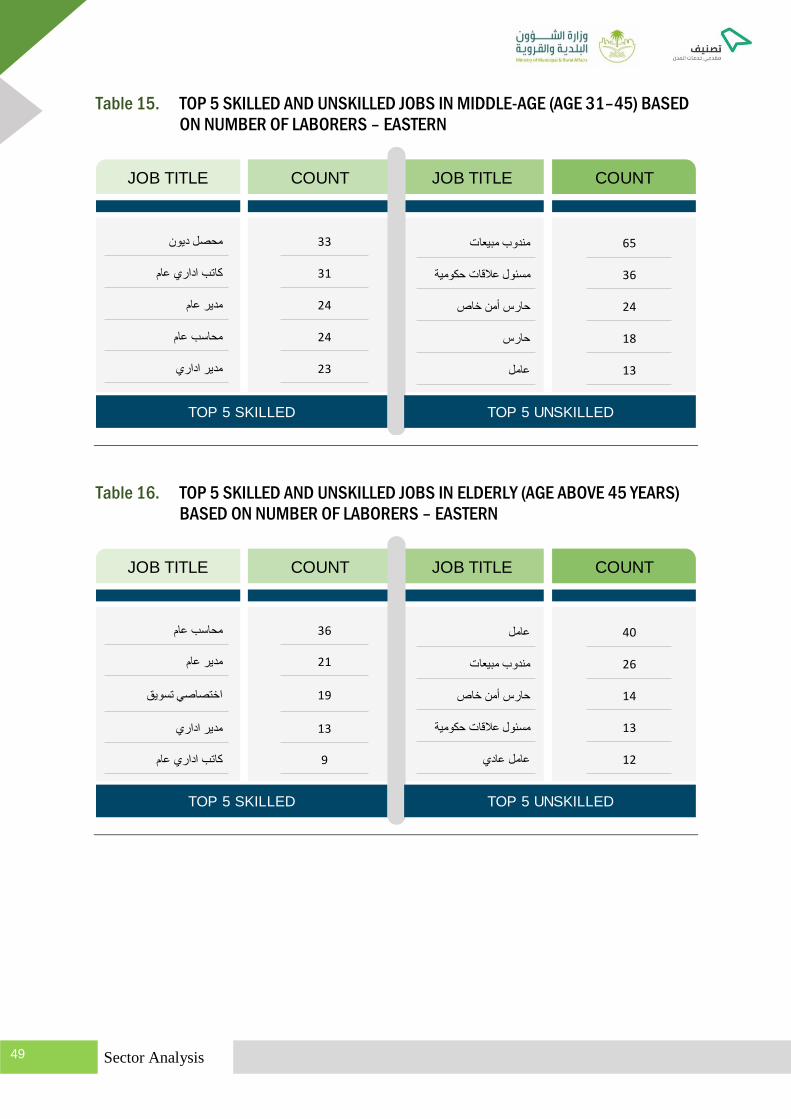
Table 15. TOP 5 SKILLED AND UNSKILLED JOBS IN MIDDLE-AGE (AGE 31–45) BASED
ON NUMBER OF LABORERS – EASTERN
Table 16. TOP 5 SKILLED AND UNSKILLED JOBS IN ELDERLY (AGE ABOVE 45 YEARS)
BASED ON NUMBER OF LABORERS – EASTERN
TOP 5 SKILLED
JOB TITLE COUNTCOUNT JOB TITLE
33
31
24
24
23
TOP 5 UNSKILLED
65
36
24
18
13
TOP 5 SKILLED
JOB TITLE COUNTCOUNT JOB TITLE
36
21
19
13
9
TOP 5 UNSKILLED
40
26
14
13
12
Sector Analysis 50
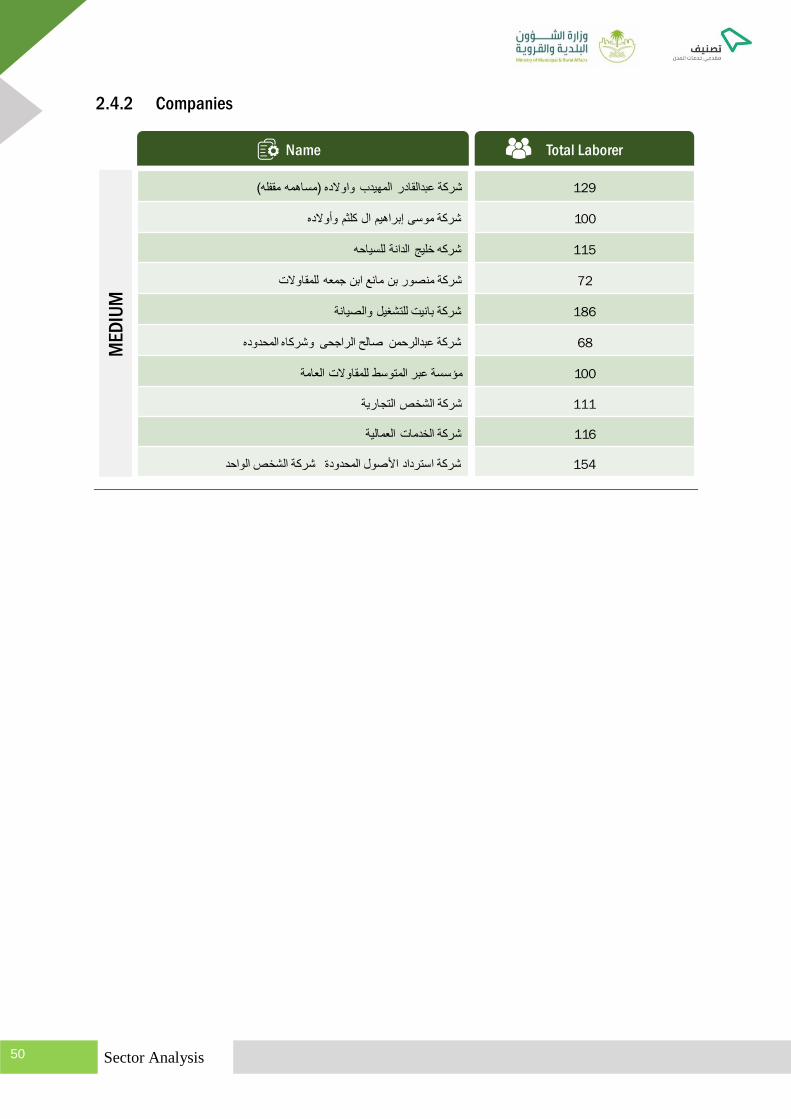
2.4.2 Companies
Name Total Laborer
129
100
115
72
186
68
100
111
116
154
ME
DIU
M

Sector Analysis 51
2.4.3 Relations
Figure 35. HEAT MAP FOR AVERAGE WAGES (IN SAR) AGE VS NATIONALITY – EASTERN
Figure 36. CATEGORY-WISE COMPANY DISTRIBUTION – EASTERN
There are 467 companies in the engineering office sector in the Eastern region. Micro category is
leading with regards to number of companies among all categories.
LOW
MED
IUM
HIG
H
Saudi
ArabiaBangladesh Egypt Yemen India Pakistan Sudan Syria Philippines Jordan Nepal
16-20
21-25
26-30
31-35
36-40
41-45
46-50
51-55
55 and
above
270
184
130
Total Number of Companies = 467
Micro Small Medium Large

Sector Analysis 52
Sub Table of Content
2.5 Hail ............................................................................................................................ 53
2.5.1 Laborers .................................................................................................. 53
2.5.2 Companies .............................................................................................. 57
2.5.3 Relation ................................................................................................... 57
HAIL

Sector Analysis 53
2.5 Hail
2.5.1 Laborers
Figure 37. GENDER AND TYPE-WISE DISTRIBUTION OF LABORERS – HAIL
As per the figure for ‘Nationality-wise laborer distribution’ shown above, Saudi Arabia accounted for the
largest percentage of workers, i.e., 75% in terms of worker nationality. Workers from Egypt and
Bangladesh & Yemen contributed for the second and third largest share, i.e., 8% and 6% each,
respectively, in Hail. Based on ‘Gender Vs Nationality’ chart, the workforce in Hail is extensively
dominated by the male (Saudi males, 42% and Non-Saudi males, 25%).
Figure 38. AGE VS NATIONALITY DISTRIBUTION OF LABORERS – HAIL
In age-wise distribution, the youth category has Saudi laborers only, middle-age group has almost equal
share of Saudi and non-Saudi laborers, and elderly group has a maximum share of expats.
42%
25%
33%
Gender Vs Nationality
Saudi Male
Non-Saudi Male
Saudi Female
Non-Saudi Female
75%
6%
8%
6%
3%
3%
Saudi Arabia
Bangladesh
Egypt
Yemen
Pakistan
Philippines
Number of laborers
14%
17%
22%
6%
11%
3% 3%
3%
6%
8%
6%
3%
16-20 Years 21-25 Years 26-30 Years 31-35 Years 36-40 Years 41-45 Years 46-50 Years 51-55 Years 56 & Above
Years
Saudi Non-Saudi
Sector Analysis 54
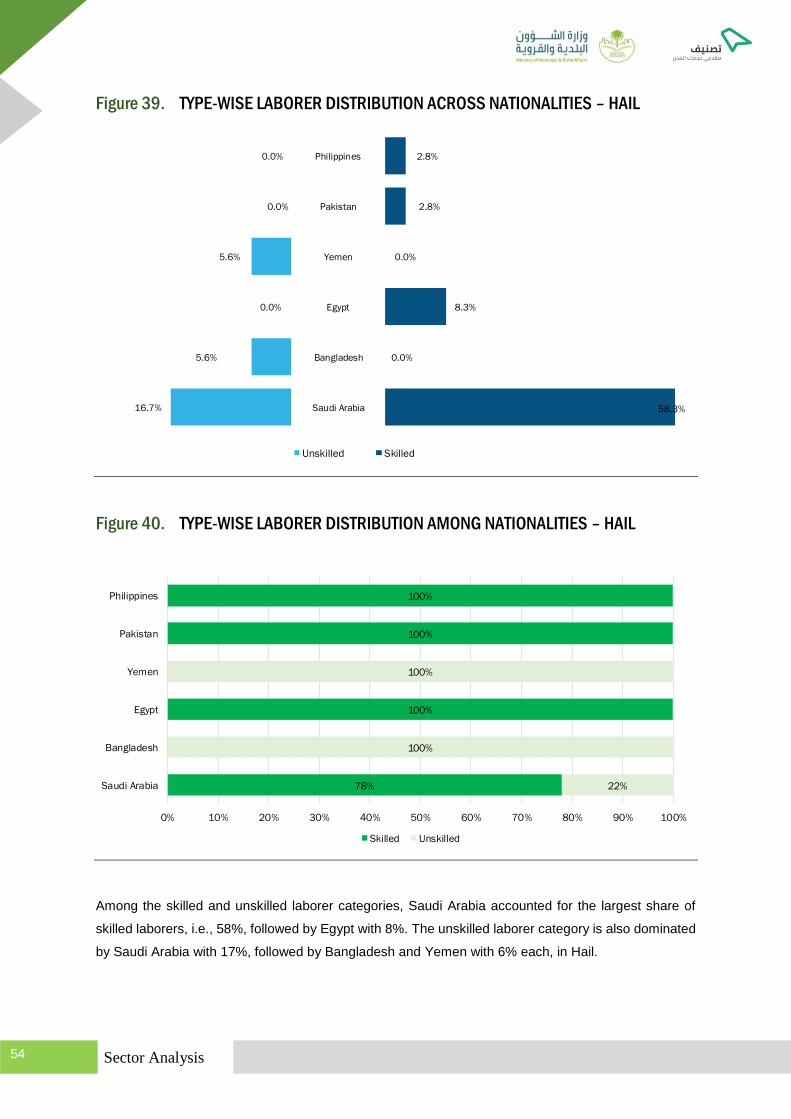
Figure 39. TYPE-WISE LABORER DISTRIBUTION ACROSS NATIONALITIES – HAIL
Figure 40. TYPE-WISE LABORER DISTRIBUTION AMONG NATIONALITIES – HAIL
Among the skilled and unskilled laborer categories, Saudi Arabia accounted for the largest share of
skilled laborers, i.e., 58%, followed by Egypt with 8%. The unskilled laborer category is also dominated
by Saudi Arabia with 17%, followed by Bangladesh and Yemen with 6% each, in Hail.
Saudi Arabia
Bangladesh
Egypt
Yemen
Pakistan
Philippines
16.7%
5.6%
0.0%
5.6%
0.0%
0.0%
58.3%
0.0%
8.3%
0.0%
2.8%
2.8%
Unskilled Skilled
78%
100%
100%
100%
22%
100%
100%
0% 10% 20% 30% 40% 50% 60% 70% 80% 90% 100%
Saudi Arabia
Bangladesh
Egypt
Yemen
Pakistan
Philippines
Skilled Unskilled

Sector Analysis 55
Among Saudi Arabian laborers, the proportion of skilled laborers is higher than that of the unskilled
category. The laborers who hail from Egypt, the Philippines, and Pakistan belongs to skilled category.
A reverse scenario can be observed in laborers from Bangladesh and Yemen.
Figure 41. HEAT MAP FOR AVERAGE WAGES (IN SAR) IN ENGINEERING OFFICE SECTOR
– HAIL
Table 17. TOP 5 SKILLED AND UNSKILLED JOBS BASED ON NUMBER OF LABORERS –
HAIL
LOW
MED
IUM
HIG
H
Skilled - Male Unskilled - Male
Saudi Arabia
Bangladesh
Egypt
Yemen
Pakistan
Philippines
TOP 5 SKILLED
JOB TITLE COUNTCOUNT JOB TITLE
3
3
2
2
2
TOP 5 UNSKILLED
2
2
2
1
1
1
1
Sector Analysis 56
Table 18. TOP 5 SKILLED AND UNSKILLED JOBS IN YOUTH (AGE 16–30) BASED ON
NUMBER OF LABORERS – HAIL
Table 19. TOP 5 SKILLED AND UNSKILLED JOBS IN MIDDLE-AGE (AGE 31–45) BASED
ON NUMBER OF LABORERS – HAIL
TOP 5 SKILLED
JOB TITLE COUNTCOUNT JOB TITLE
3
2
2
2
TOP 5 UNSKILLED
2
1
TOP 5 SKILLED
JOB TITLE COUNTCOUNT JOB TITLE
1
1
1
1
1
1
1
TOP 5 UNSKILLED
2
1
1
1
1

Sector Analysis 57
Table 20. TOP 5 SKILLED AND UNSKILLED JOBS IN ELDERLY (AGE ABOVE 45 YEARS)
BASED ON NUMBER OF LABORERS – HAIL
2.5.2 Companies
No companies in large and medium categories
2.5.3 Relation
Figure 42. HEAT MAP FOR AVERAGE WAGES (IN SAR) AGE VS NATIONALITY – HAIL
TOP 5 SKILLED
JOB TITLE COUNTCOUNT JOB TITLE
1
1
1
TOP 5 UNSKILLED
1
LOW
MED
IUM
HIG
H
Saudi Arabia Bangladesh Egypt Yemen Pakistan Philippines
16-20
21-25
26-30
31-35
36-40
41-45
46-50
51-55
55 and above

Sector Analysis 58
Figure 43. CATEGORY-WISE COMPANY DISTRIBUTION – HAIL
The Hail region does not have any ‘Large’ companies under the engineering office sector; the proportion
for ‘Micro’ companies is significantly high, i.e., of 43 companies, 33 fall under micro level.
2590
1318
107
7
Total Number of Companies = 4022
Micro Small Medium Large
Sector Analysis 59
Sub Table of Content
2.6 Jazan ......................................................................................................................... 60
2.6.1 Laborers .................................................................................................. 60
2.6.2 Companies .............................................................................................. 64
2.6.3 Relation ................................................................................................... 65
JAZAN

Sector Analysis 60
2.6 Jazan
2.6.1 Laborers
Figure 44. GENDER AND TYPE-WISE DISTRIBUTION OF LABORERS
As per the figure for ‘Nationality-wise laborer distribution’ shown above, Saudi Arabia accounted for the
largest percentage of workers, i.e., 54% in terms of worker nationality. Workers from Bangladesh and
India & Nepal contributed for the second and third largest share, i.e., 10% and 9% each, respectively,
in Jazan. Based on ‘Gender Vs Nationality’ chart, the workforce in Jazan is extensively dominated by
the male (Saudi males, 38% and Non-Saudi males, 46%). Non-Saudi male laborers hold higher share
than that of Saudi male laborers among the Jazan region.
Figure 45. AGE VS NATIONALITY DISTRIBUTION OF LABORERS
In age-wise distribution, the youth category has Saudi laborers only, middle-age group has almost equal
share of Saudi and non-Saudi laborers, and elderly group has a maximum share of expats.
38%
46%
16%
Gender Vs Nationality
Saudi Male
Non-Saudi Male
Saudi Female
Non-Saudi Female
54%
10%
4%
5%
9%
3%
1%
3%
9%
2%
Saudi Arabia
Bangladesh
Egypt
Yemen
India
Pakistan
Sudan
Philippines
Nepal
Others
Number of laborers
3%
11% 10%
14%11%
4%1%
3% 8%
13%
6%8%
8%
16-20 Years 21-25 Years 26-30 Years 31-35 Years 36-40 Years 41-45 Years 46-50 Years 51-55 Years 56 & Above
Years
Saudi Non-Saudi
Sector Analysis 61
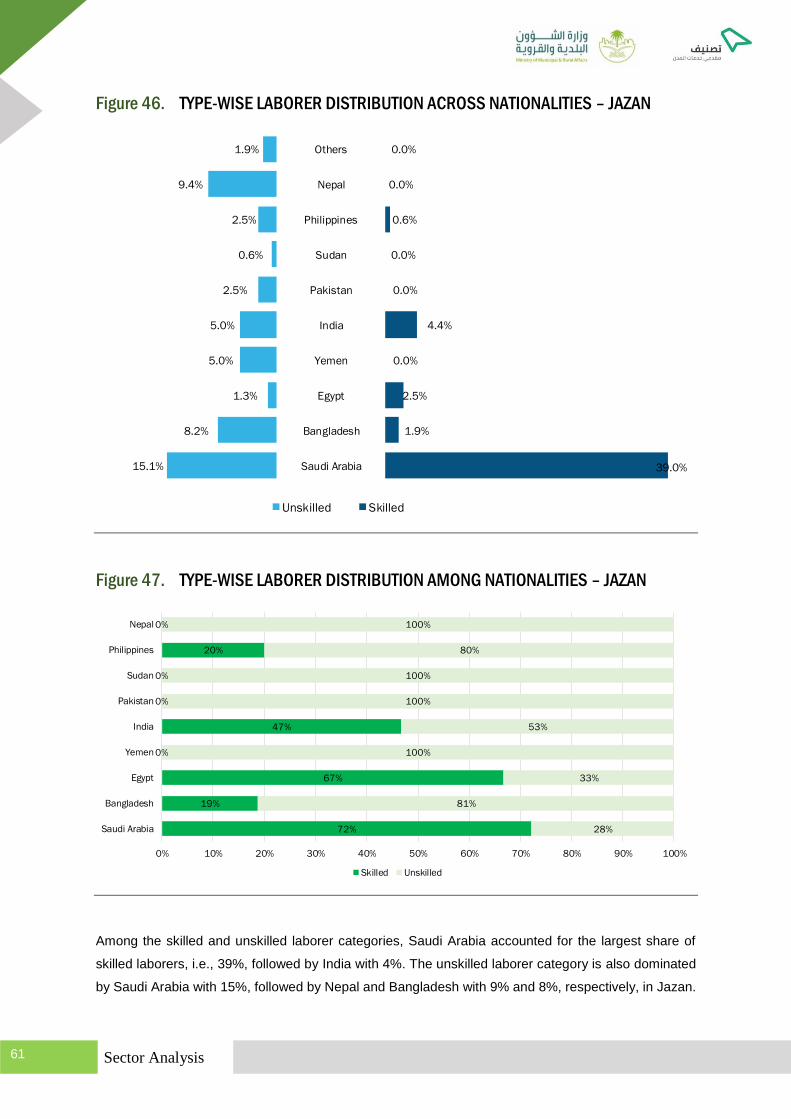
Figure 46. TYPE-WISE LABORER DISTRIBUTION ACROSS NATIONALITIES – JAZAN
Figure 47. TYPE-WISE LABORER DISTRIBUTION AMONG NATIONALITIES – JAZAN
Among the skilled and unskilled laborer categories, Saudi Arabia accounted for the largest share of
skilled laborers, i.e., 39%, followed by India with 4%. The unskilled laborer category is also dominated
by Saudi Arabia with 15%, followed by Nepal and Bangladesh with 9% and 8%, respectively, in Jazan.
Saudi Arabia
Bangladesh
Egypt
Yemen
India
Pakistan
Sudan
Philippines
Nepal
Others
15.1%
8.2%
1.3%
5.0%
5.0%
2.5%
0.6%
2.5%
9.4%
1.9%
39.0%
1.9%
2.5%
0.0%
4.4%
0.0%
0.0%
0.6%
0.0%
0.0%
Unskilled Skilled
72%
19%
67%
0%
47%
0%
0%
20%
0%
28%
81%
33%
100%
53%
100%
100%
80%
100%
0% 10% 20% 30% 40% 50% 60% 70% 80% 90% 100%
Saudi Arabia
Bangladesh
Egypt
Yemen
India
Pakistan
Sudan
Philippines
Nepal
Skilled Unskilled

Sector Analysis 62
Among Saudi Arabian and Egypt laborers, the proportion of skilled laborers is slightly higher than
unskilled one. The proportion of unskilled laborers is significantly higher than skilled laborers from rest
of the countries.
Figure 48. HEAT MAP FOR AVERAGE WAGES (IN SAR) IN ENGINEERING OFFICE SECTOR
– JAZAN
Table 21. TOP 5 SKILLED AND UNSKILLED JOBS BASED ON NUMBER OF LABORERS –
JAZAN
LOW
MED
IUM
HIG
H
Skilled - Male Unskilled - Male
Saudi Arabia
Bangladesh
Egypt
Yemen
India
Pakistan
Sudan
Philippines
Nepal
TOP 5 SKILLED
JOB TITLE COUNTCOUNT JOB TITLE
7
5
4
3
3
3
TOP 5 UNSKILLED
12
8
7
7
5

Sector Analysis 63
Table 22. TOP 5 SKILLED AND UNSKILLED JOBS IN YOUTH (AGE 16–30) BASED ON
NUMBER OF LABORERS – JAZAN
Table 23. TOP 5 SKILLED AND UNSKILLED JOBS IN MIDDLE-AGE (AGE 31–45) BASED
ON NUMBER OF LABORERS – JAZAN
TOP 5 SKILLED
JOB TITLE COUNTCOUNT JOB TITLE
5
3
2
2
2
2
2
TOP 5 UNSKILLED
2
2
1
1
1
1
TOP 5 SKILLED
JOB TITLE COUNTCOUNT JOB TITLE
3
3
2
2
2
2
2
2
2
2
TOP 5 UNSKILLED
9
6
4
4
3

Sector Analysis 64
Table 24. TOP 5 SKILLED AND UNSKILLED JOBS IN ELDERLY (AGE ABOVE 45 YEARS)
BASED ON NUMBER OF LABORERS – JAZAN
2.6.2 Companies
TOP 5 SKILLED
JOB TITLE COUNTCOUNT JOB TITLE
2
1
1
1
1
1
TOP 5 UNSKILLED
4
3
2
2
2
2
Name Total Laborer
232
58
ME
DIU
M

Sector Analysis 65
2.6.3 Relation
Figure 49. HEAT MAP FOR AVERAGE WAGES (IN SAR) AGE VS NATIONALITY – JAZAN
LOW
MED
IUM
HIG
H
Saudi
ArabiaBangladesh Egypt Yemen India Pakistan Sudan Philippines Nepal
16-20
21-25
26-30
31-35
36-40
41-45
46-50
51-55
55 and
above

Sector Analysis 66
Figure 50. CATEGORY-WISE COMPANY DISTRIBUTION – JAZAN
The Jazan region does not have any ‘Large’ company under the engineering office sector; the
proportion for companies under ‘Micro’ category is the highest, i.e., 68 out of 94 companies.
68
242
0
Total Number of Companies = 94
Micro Small Medium Large

Sector Analysis 67
Sub Table of Content
2.7 Jouf ............................................................................................................................ 68
2.7.1 Laborers .................................................................................................. 68
2.7.2 Companies .............................................................................................. 72
2.7.3 Relation ................................................................................................... 73
JOUF

Sector Analysis 68
2.7 Jouf
2.7.1 Laborers
Figure 51. GENDER AND TYPE-WISE DISTRIBUTION OF LABORERS – JOUF
As per the figure for ‘Nationality-wise laborer distribution’ shown above, Saudi Arabia accounted for the
largest percentage of workers, i.e., 74% in terms of worker nationality. Workers from Egypt and Yemen
contributed for the second and third largest share, i.e., 13% and 9%, respectively, in Jouf. Based on
‘Gender Vs Nationality’ chart, the workforce in Jouf is extensively dominated by the male (Saudi males,
61% and Non-Saudi males, 26%).
Figure 52. AGE VS NATIONALITY DISTRIBUTION OF LABORERS – JOUF
Overall, in the Jouf region the expat has significantly less contribution. It can be observed in the figure
titled ‘Age Vs Nationality distribution of laborers’. The figure shows that the native laborers dominate
the all categories.
61%
26%
13%
Gender Vs Nationality
Saudi Male
Non-Saudi Male
Saudi Female
Non-Saudi Female
74%
4%
13%
9%
Saudi Arabia
Bangladesh
Egypt
Yemen
Number of laborers
4%
30%
4%
22%
4% 4% 4%
9%
9%4%
4%
16-20 Years 21-25 Years 26-30 Years 31-35 Years 36-40 Years 41-45 Years 46-50 Years 51-55 Years 56 & AboveYears
Saudi Non-Saudi

Sector Analysis 69
Figure 53. TYPE-WISE LABORER DISTRIBUTION ACROSS NATIONALITIES – JOUF
Figure 54. TYPE-WISE LABORER DISTRIBUTION AMONG NATIONALITIES – JOUF
Among the skilled and unskilled laborer categories, Saudi Arabia accounted for the largest share of
skilled laborers, i.e., 30%, followed by Egypt with 4%. The unskilled laborer category is also dominated
by Saudi Arabia with 44%, followed by Yemen and Egypt with 9% each, in Jouf.
Among Saudi Arabian & Egypt laborers, the proportion of unskilled laborers is higher than skilled one.
The proportion of unskilled laborers is significantly higher than skilled laborers for laborers from rest of
the countries.
Saudi Arabia
Bangladesh
Egypt
Yemen
43.5%
4.3%
8.7%
8.7%
30.4%
0.0%
4.3%
0.0%
Unskilled Skilled
41%
33%
59%
100%
67%
100%
0% 10% 20% 30% 40% 50% 60% 70% 80% 90% 100%
Saudi Arabia
Bangladesh
Egypt
Yemen
Skilled Unskilled

Sector Analysis 70
Figure 55. HEAT MAP FOR AVERAGE WAGES (IN SAR) IN ENGINEERING OFFICE SECTOR
– JOUF
Table 25. TOP 5 SKILLED AND UNSKILLED JOBS BASED ON NUMBER OF LABORERS –
JOUF
Skilled - Male Unskilled - Male
Saudi Arabia
Bangladesh
Egypt
Yemen
LOWMEDIUMHIGH
TOP 5 SKILLED
JOB TITLE COUNTCOUNT JOB TITLE
2
1
1
1
1
1
1
TOP 5 UNSKILLED
5
3
2
1
1
1
1
1

Sector Analysis 71
Table 26. TOP 5 SKILLED AND UNSKILLED JOBS IN YOUTH (AGE 16–30) BASED ON
NUMBER OF LABORERS – JOUF
Table 27. TOP 5 SKILLED AND UNSKILLED JOBS IN MIDDLE-AGE (AGE 31–45) BASED
ON NUMBER OF LABORERS – JOUF
TOP 5 SKILLED
JOB TITLE COUNTCOUNT JOB TITLE
1
1
1
TOP 5 UNSKILLED
3
2
1
TOP 5 SKILLED
JOB TITLE COUNTCOUNT JOB TITLE
1
1
1
TOP 5 UNSKILLED
2
2
1
1
1
1

Sector Analysis 72
Table 28. TOP 5 SKILLED AND UNSKILLED JOBS IN ELDERLY (AGE ABOVE 45 YEARS)
BASED ON NUMBER OF LABORERS – JOUF
2.7.2 Companies
There are no companies listed in large and medium categories in this region
TOP 5 SKILLED
JOB TITLE COUNTCOUNT JOB TITLE
1
1
TOP 5 UNSKILLED
1

Sector Analysis 73
2.7.3 Relation
Figure 56. HEAT MAP FOR AVERAGE WAGES (IN SAR) AGE VS NATIONALITY – JOUF
Figure 57. CATEGORY-WISE COMPANY DISTRIBUTION – JOUF
The Jouf region does not have any ‘Large’ as well as ‘Medium’ companies in the engineering office
sector; the proportion for ‘Micro’ category is considerably high, with 22 out of 30 companies falling under
micro level.
LOW
MED
IUM
HIG
H
Saudi Arabia Bangladesh Egypt Yemen
16-20
21-25
26-30
31-35
36-40
41-45
46-50
51-55
55 and above
22
8
0
0
Total Number of Companies = 30
Micro Small Medium Large

Sector Analysis 74
Sub Table of Content
2.8 Madinah ..................................................................................................................... 75
2.8.1 Laborers .................................................................................................. 75
2.8.2 Companies .............................................................................................. 79
2.8.3 Relation ................................................................................................... 80
MADINAH
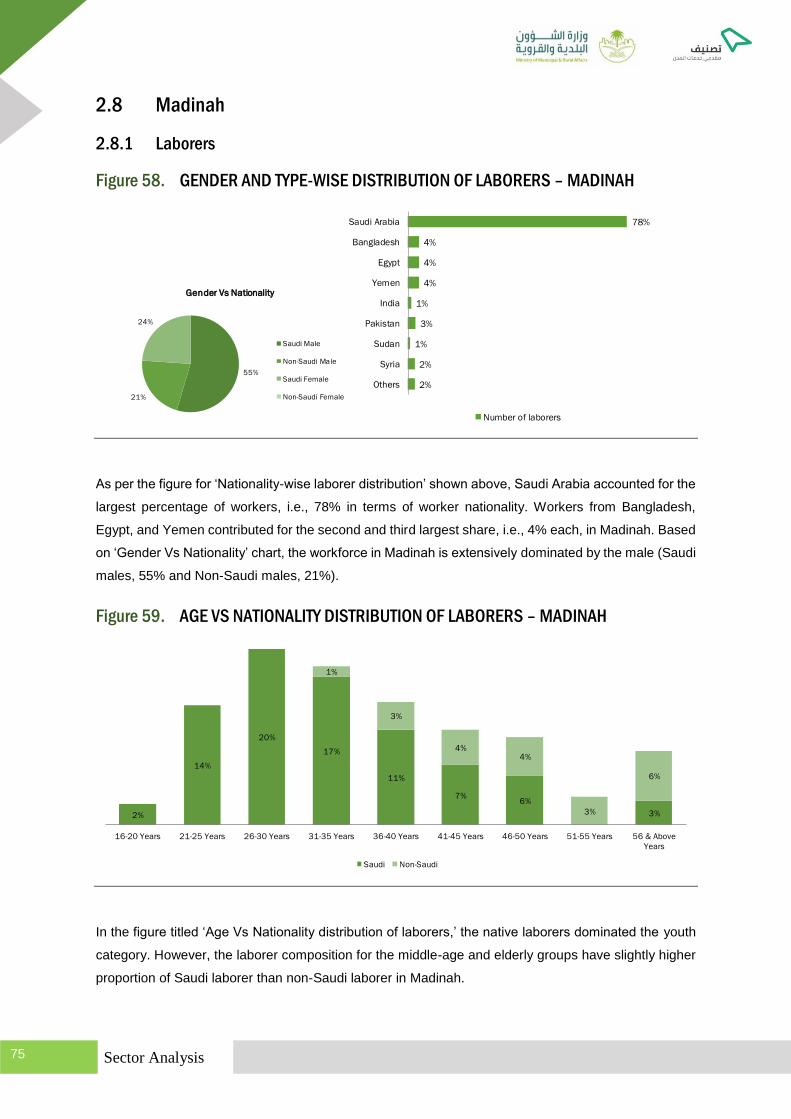
Sector Analysis 75
2.8 Madinah
2.8.1 Laborers
Figure 58. GENDER AND TYPE-WISE DISTRIBUTION OF LABORERS – MADINAH
As per the figure for ‘Nationality-wise laborer distribution’ shown above, Saudi Arabia accounted for the
largest percentage of workers, i.e., 78% in terms of worker nationality. Workers from Bangladesh,
Egypt, and Yemen contributed for the second and third largest share, i.e., 4% each, in Madinah. Based
on ‘Gender Vs Nationality’ chart, the workforce in Madinah is extensively dominated by the male (Saudi
males, 55% and Non-Saudi males, 21%).
Figure 59. AGE VS NATIONALITY DISTRIBUTION OF LABORERS – MADINAH
In the figure titled ‘Age Vs Nationality distribution of laborers,’ the native laborers dominated the youth
category. However, the laborer composition for the middle-age and elderly groups have slightly higher
proportion of Saudi laborer than non-Saudi laborer in Madinah.
55%
21%
24%
Gender Vs Nationality
Saudi Male
Non-Saudi Male
Saudi Female
Non-Saudi Female
78%
4%
4%
4%
1%
3%
1%
2%
2%
Saudi Arabia
Bangladesh
Egypt
Yemen
India
Pakistan
Sudan
Syria
Others
Number of laborers
2%
14%
20%
17%
11%
7%6%
3%
1%
3%
4%4%
3%
6%
16-20 Years 21-25 Years 26-30 Years 31-35 Years 36-40 Years 41-45 Years 46-50 Years 51-55 Years 56 & Above
Years
Saudi Non-Saudi

Sector Analysis 76
Figure 60. TYPE-WISE LABORER DISTRIBUTION ACROSS NATIONALITIES – MADINAH
Figure 61. TYPE-WISE LABORER DISTRIBUTION AMONG NATIONALITIES – MADINAH
Among the skilled and unskilled laborer categories, Saudi Arabia accounted for the largest share of
skilled laborers, i.e., 59%, followed by Egypt with 2%. The unskilled laborer category is also dominated
by Saudi Arabia with 20%, followed by Bangladesh and Yemen with 4% each, in Madinah.
Saudi Arabia
Bangladesh
Egypt
Yemen
India
Pakistan
Syria
Others
19.5%
4.0%
2.0%
3.6%
0.8%
1.6%
1.6%
2.0%
59.0%
0.0%
2.0%
0.0%
0.0%
1.2%
0.8%
1.0%
Unskilled Skilled
75%
50%
10%
33%
43%
50%
33%
25%
100%
50%
90%
67%
57%
50%
67%
0% 10% 20% 30% 40% 50% 60% 70% 80% 90% 100%
Saudi Arabia
Bangladesh
Egypt
Yemen
India
Pakistan
Sudan
Syria
Skilled Unskilled

Sector Analysis 77
Among the laborers from Saudi Arabia, the proportion of skilled laborers is significantly higher than
unskilled one.
The proportion of skilled and unskilled laborers is equal for laborers from Egypt and Sudan. The
proportion of unskilled laborers from rest of the countries working in Madinah is significantly higher than
skilled laborers.
Figure 62. HEAT MAP FOR AVERAGE WAGES (IN SAR) IN ENGINEERING OFFICE SECTOR
– MADINAH
Table 29. TOP 5 SKILLED AND UNSKILLED JOBS BASED ON NUMBER OF LABORERS –
MADINAH
LOW
MED
IUM
HIG
H
Skilled - Male Unskilled - Male
Saudi Arabia
Bangladesh
Egypt
Yemen
India
Pakistan
Sudan
Syria
TOP 5 SKILLED
JOB TITLE COUNTCOUNT JOB TITLE
15
11
11
10
7
7
TOP 5 UNSKILLED
13
12
11
6
6

Sector Analysis 78
Table 30. TOP 5 SKILLED AND UNSKILLED JOBS IN YOUTH (AGE 16–30) BASED ON
NUMBER OF LABORERS – MADINAH
Table 31. TOP 5 SKILLED AND UNSKILLED JOBS IN MIDDLE-AGE (AGE 31–45) BASED
ON NUMBER OF LABORERS – MADINAH
TOP 5 SKILLED
JOB TITLE COUNTCOUNT JOB TITLE
10
5
5
4
4
TOP 5 UNSKILLED
9
3
2
2
2
TOP 5 SKILLED
JOB TITLE COUNTCOUNT JOB TITLE
8
5
5
3
3
3
TOP 5 UNSKILLED
8
4
3
3
2
2
2

Sector Analysis 79
Table 32. TOP 5 SKILLED AND UNSKILLED JOBS IN ELDERLY (AGE ABOVE 45 YEARS)
BASED ON NUMBER OF LABORERS – MADINAH
2.8.2 Companies
TOP 5 SKILLED
JOB TITLE COUNTCOUNT JOB TITLE
4
2
2
2
2
TOP 5 UNSKILLED
9
2
2
2
Name Total Laborer
34
51
ME
DIU
M

Sector Analysis 80
2.8.3 Relation
Figure 63. HEAT MAP FOR AVERAGE WAGES (IN SAR) AGE VS NATIONALITY – MADINAH
LOW
MED
IUM
HIG
H
Saudi
ArabiaBangladesh Egypt Yemen India Pakistan Sudan Syria
16-20
21-25
26-30
31-35
36-40
41-45
46-50
51-55
55 and
above

Sector Analysis 81
Figure 64. CATEGORY-WISE COMPANY DISTRIBUTION – MADINAH
Madinah does not have any ‘Large’ company in the engineering office sector; the proportion for ‘Micro’
category is considerably high, as 125 of 183 companies fall under micro level. Small companies have
the next highest count.
125
56
2 0
Total Number of Companies = 183
Micro Small Medium Large
Sector Analysis 82
Sub Table of Content
2.9 Makkah ...................................................................................................................... 83
2.9.1 Laborer .................................................................................................... 83
2.9.2 Companies .............................................................................................. 88
2.9.3 Relation ................................................................................................... 89
MAKKAH
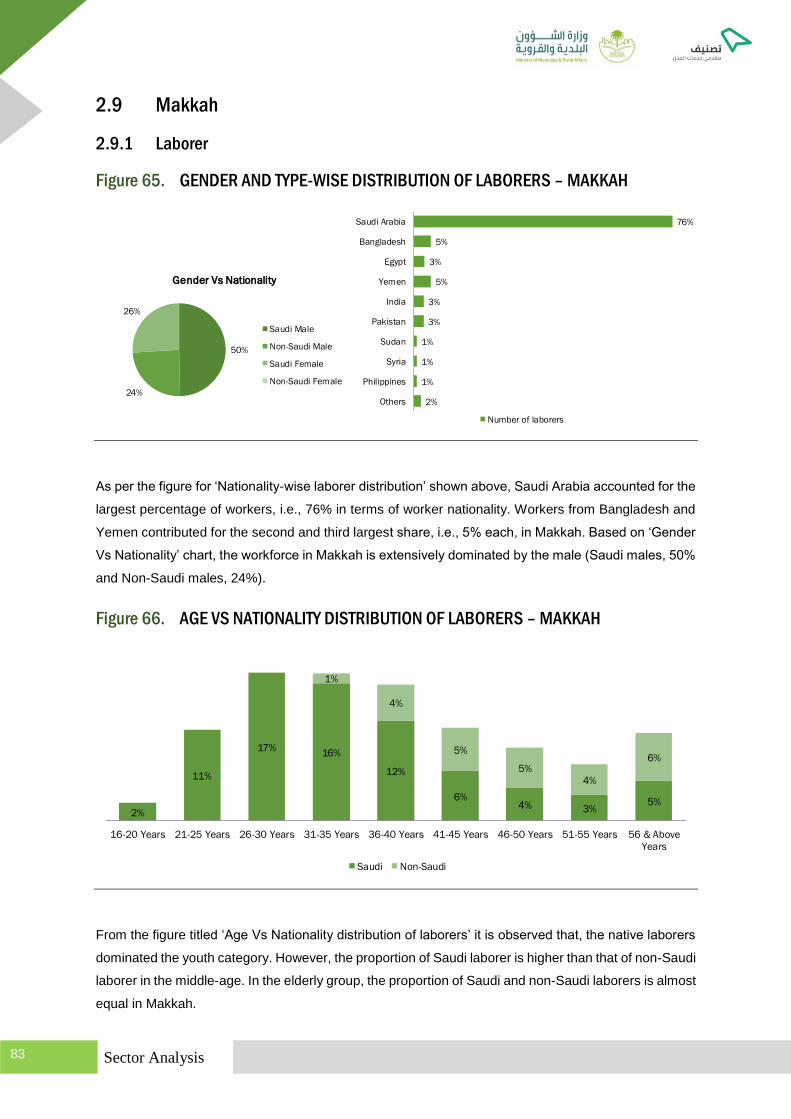
Sector Analysis 83
2.9 Makkah
2.9.1 Laborer
Figure 65. GENDER AND TYPE-WISE DISTRIBUTION OF LABORERS – MAKKAH
As per the figure for ‘Nationality-wise laborer distribution’ shown above, Saudi Arabia accounted for the
largest percentage of workers, i.e., 76% in terms of worker nationality. Workers from Bangladesh and
Yemen contributed for the second and third largest share, i.e., 5% each, in Makkah. Based on ‘Gender
Vs Nationality’ chart, the workforce in Makkah is extensively dominated by the male Saudi males, 50%
and Non-Saudi males, 24%).
Figure 66. AGE VS NATIONALITY DISTRIBUTION OF LABORERS – MAKKAH
From the figure titled ‘Age Vs Nationality distribution of laborers’ it is observed that, the native laborers
dominated the youth category. However, the proportion of Saudi laborer is higher than that of non-Saudi
laborer in the middle-age. In the elderly group, the proportion of Saudi and non-Saudi laborers is almost
equal in Makkah.
50%
24%
26%
Gender Vs Nationality
Saudi Male
Non-Saudi Male
Saudi Female
Non-Saudi Female
76%
5%
3%
5%
3%
3%
1%
1%
1%
2%
Saudi Arabia
Bangladesh
Egypt
Yemen
India
Pakistan
Sudan
Syria
Philippines
Others
Number of laborers
2%
11%
17%16%
12%
6%4% 3%
5%
1%
4%
5%
5%
4%
6%
16-20 Years 21-25 Years 26-30 Years 31-35 Years 36-40 Years 41-45 Years 46-50 Years 51-55 Years 56 & Above
Years
Saudi Non-Saudi
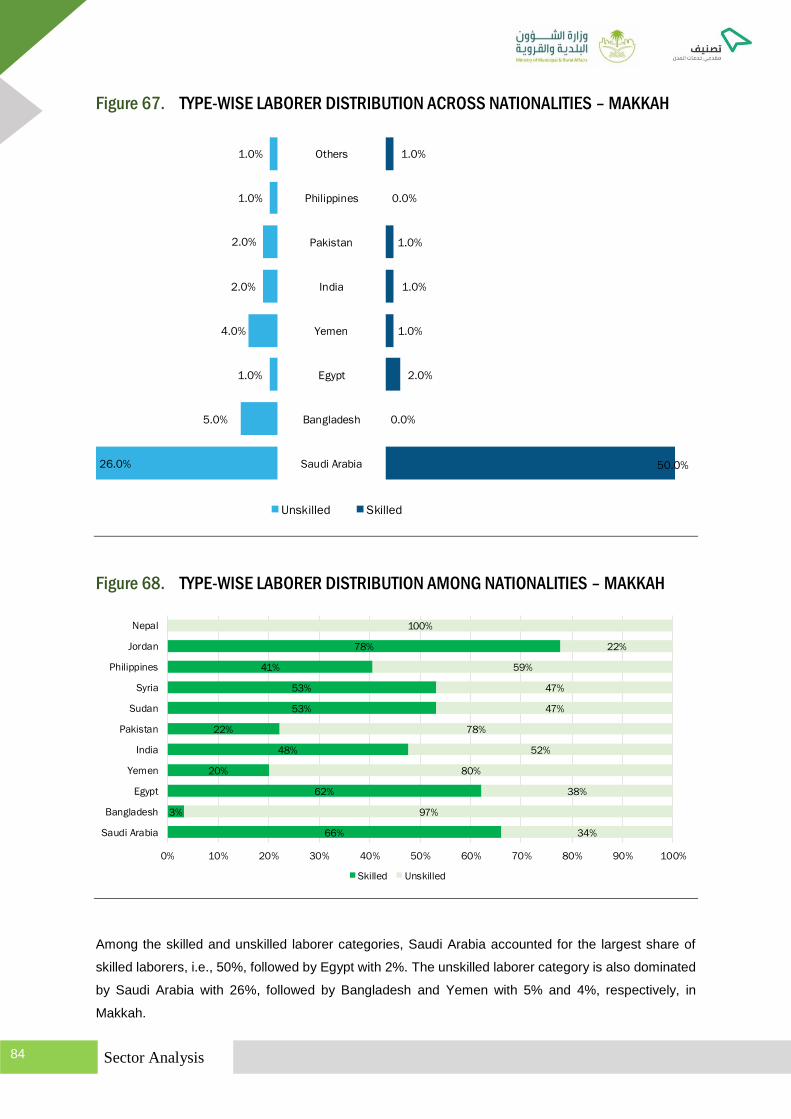
Sector Analysis 84
Figure 67. TYPE-WISE LABORER DISTRIBUTION ACROSS NATIONALITIES – MAKKAH
Figure 68. TYPE-WISE LABORER DISTRIBUTION AMONG NATIONALITIES – MAKKAH
Among the skilled and unskilled laborer categories, Saudi Arabia accounted for the largest share of
skilled laborers, i.e., 50%, followed by Egypt with 2%. The unskilled laborer category is also dominated
by Saudi Arabia with 26%, followed by Bangladesh and Yemen with 5% and 4%, respectively, in
Makkah.
Saudi Arabia
Bangladesh
Egypt
Yemen
India
Pakistan
Philippines
Others
26.0%
5.0%
1.0%
4.0%
2.0%
2.0%
1.0%
1.0%
50.0%
0.0%
2.0%
1.0%
1.0%
1.0%
0.0%
1.0%
Unskilled Skilled
66%
3%
62%
20%
48%
22%
53%
53%
41%
78%
34%
97%
38%
80%
52%
78%
47%
47%
59%
22%
100%
0% 10% 20% 30% 40% 50% 60% 70% 80% 90% 100%
Saudi Arabia
Bangladesh
Egypt
Yemen
India
Pakistan
Sudan
Syria
Philippines
Jordan
Nepal
Skilled Unskilled

Sector Analysis 85
Among Saudi Arabian laborers, the proportion of skilled laborers is higher than unskilled one. In Syria
and Sudan, the proportion is almost equal with slightly higher proportion of skilled one. The proportion
of skilled laborers is higher than unskilled laborers from Egypt and Jordan working in Makkah. A reverse
scenario can be observed in laborers from rest of the countries.
Figure 69. HEAT MAP FOR AVERAGE WAGES (IN SAR) IN ENGINEERING OFFICE SECTOR
– MAKKAH
LOW
MED
IUM
HIG
H
Skilled - Male Unskilled - Male
Saudi Arabia
Bangladesh
Egypt
Yemen
India
Pakistan
Sudan
Syria
Philippines
Jordan
Nepal
LOWMEDIUMHIGH
Skilled - Female Unskilled - Female
Saudi Arabia
Philippines
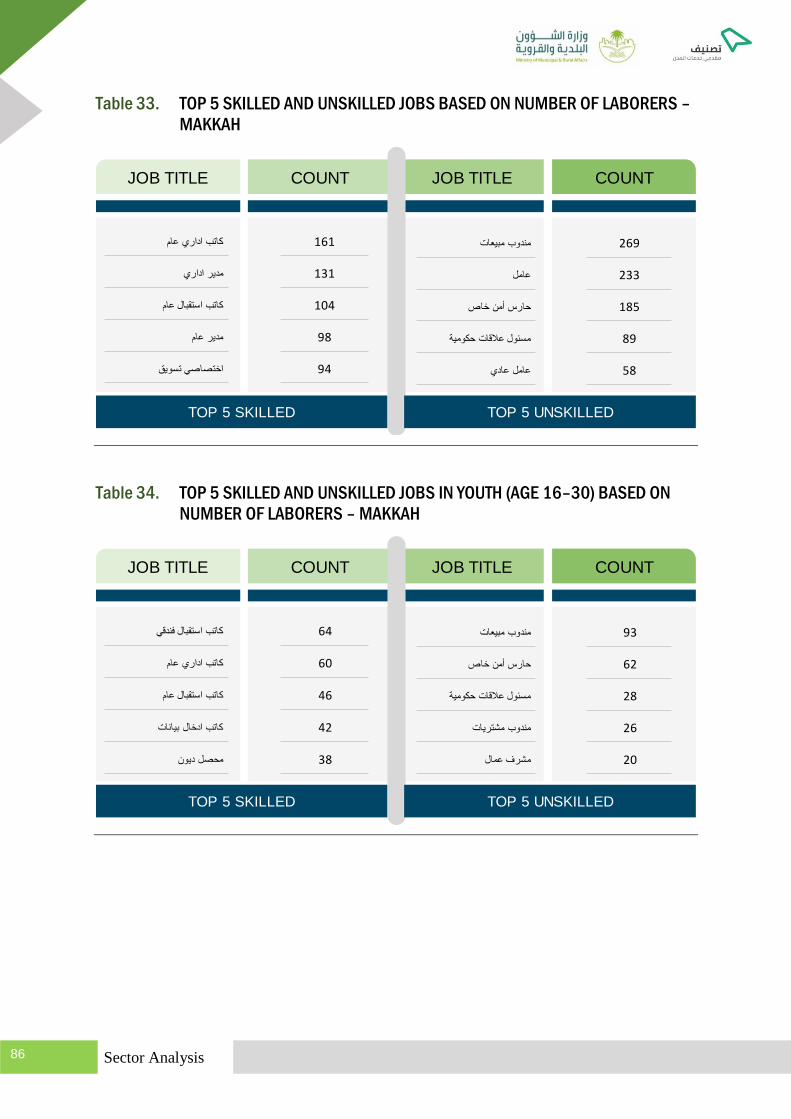
Sector Analysis 86
Table 33. TOP 5 SKILLED AND UNSKILLED JOBS BASED ON NUMBER OF LABORERS –
MAKKAH
Table 34. TOP 5 SKILLED AND UNSKILLED JOBS IN YOUTH (AGE 16–30) BASED ON
NUMBER OF LABORERS – MAKKAH
TOP 5 SKILLED
JOB TITLE COUNTCOUNT JOB TITLE
161
131
104
98
94
TOP 5 UNSKILLED
269
233
185
89
58
TOP 5 SKILLED
JOB TITLE COUNTCOUNT JOB TITLE
64
60
46
42
38
TOP 5 UNSKILLED
93
62
28
26
20

Sector Analysis 87
Table 35. TOP 5 SKILLED AND UNSKILLED JOBS IN MIDDLE-AGE (AGE 31–45) BASED
ON NUMBER OF LABORERS – MAKKAH
Table 36. TOP 5 SKILLED AND UNSKILLED JOBS IN ELDERLY (AGE ABOVE 45 YEARS)
BASED ON NUMBER OF LABORERS – MAKKAH
TOP 5 SKILLED
JOB TITLE COUNTCOUNT JOB TITLE
86
66
45
42
40
TOP 5 UNSKILLED
124
84
64
37
36
TOP 5 SKILLED
JOB TITLE COUNTCOUNT JOB TITLE
51
37
34
21
15
TOP 5 UNSKILLED
169
52
39
24
20

Sector Analysis 88
2.9.2 Companies
Name Total Laborer
670
429
1
LAR
GE
Name Total Laborer
86
92
254
85
204
88
171
143
91
133
ME
DIU
M

Sector Analysis 89
2.9.3 Relation
Figure 70. HEAT MAP FOR AVERAGE WAGES (IN SAR) AGE VS NATIONALITY – MAKKAH
LOW
MED
IUM
HIG
H
Saudi
ArabiaBangladesh Egypt Yemen India Pakistan Sudan Syria Philippines Jordan Nepal
16-20
21-25
26-30
31-35
36-40
41-45
46-50
51-55
55 and
above

Sector Analysis 90
Figure 71. CATEGORY-WISE COMPANY DISTRIBUTION – MAKKAH
Makkah has three ‘Large’ companies in the engineering office sector; the proportion for ‘Micro’ category
is considerably high, as 812 out of 1251 companies fall under micro level. Small companies have the
next highest count.
812
408
28
3
Total Number of Companies = 3961
Micro Small Medium Large
Sector Analysis 91
Sub Table of Content
2.10 Najran ........................................................................................................................ 92
2.10.1 Laborer .................................................................................................... 92
2.10.2 Companies .............................................................................................. 96
2.10.3 Relation ................................................................................................... 96
NAJRAN
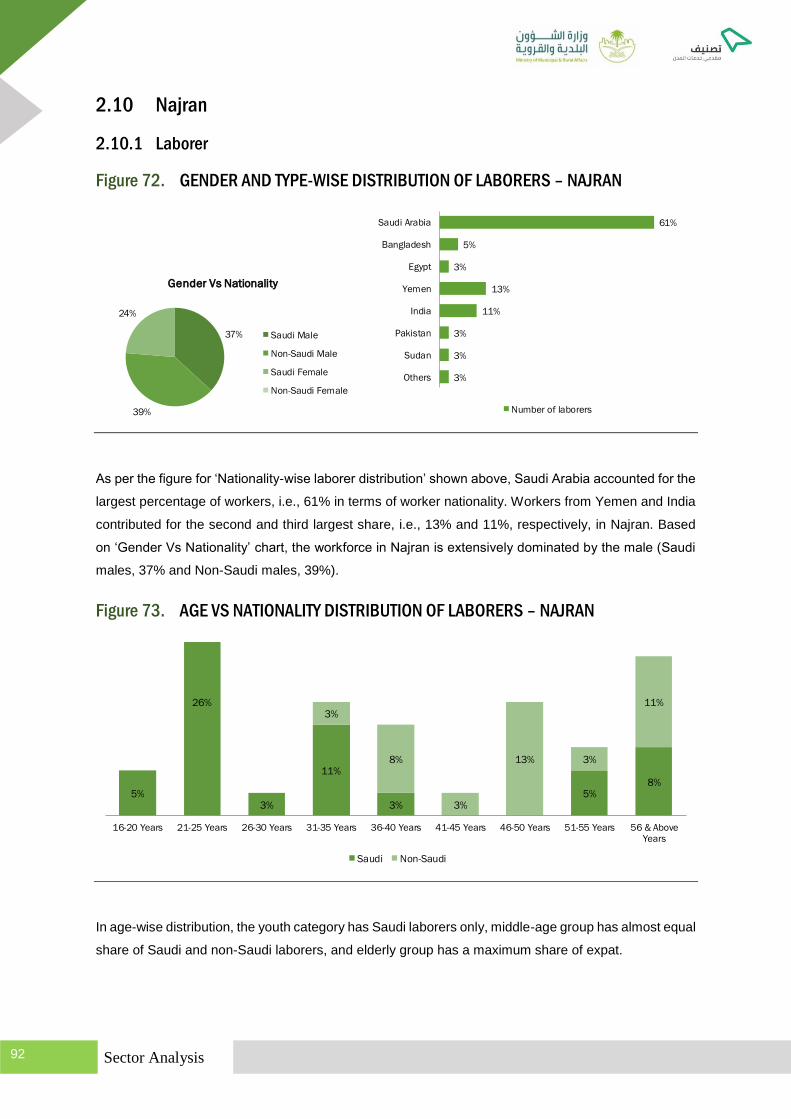
Sector Analysis 92
2.10 Najran
2.10.1 Laborer
Figure 72. GENDER AND TYPE-WISE DISTRIBUTION OF LABORERS – NAJRAN
As per the figure for ‘Nationality-wise laborer distribution’ shown above, Saudi Arabia accounted for the
largest percentage of workers, i.e., 61% in terms of worker nationality. Workers from Yemen and India
contributed for the second and third largest share, i.e., 13% and 11%, respectively, in Najran. Based
on ‘Gender Vs Nationality’ chart, the workforce in Najran is extensively dominated by the male Saudi
males, 37% and Non-Saudi males, 39%).
Figure 73. AGE VS NATIONALITY DISTRIBUTION OF LABORERS – NAJRAN
In age-wise distribution, the youth category has Saudi laborers only, middle-age group has almost equal
share of Saudi and non-Saudi laborers, and elderly group has a maximum share of expat.
37%
39%
24%
Gender Vs Nationality
Saudi Male
Non-Saudi Male
Saudi Female
Non-Saudi Female
61%
5%
3%
13%
11%
3%
3%
3%
Saudi Arabia
Bangladesh
Egypt
Yemen
India
Pakistan
Sudan
Others
Number of laborers
5%
26%
3%
11%
3%5%
8%
3%
8%
3%
13% 3%
11%
16-20 Years 21-25 Years 26-30 Years 31-35 Years 36-40 Years 41-45 Years 46-50 Years 51-55 Years 56 & AboveYears
Saudi Non-Saudi

Sector Analysis 93
Figure 74. TYPE-WISE LABORER DISTRIBUTION ACROSS NATIONALITIES – NAJRAN
Figure 75. TYPE-WISE LABORER DISTRIBUTION AMONG NATIONALITIES – NAJRAN
Among the skilled and unskilled laborer categories, Saudi Arabia accounted for the largest share of
skilled laborers, i.e., 34%, followed by Egypt with 3%. The unskilled laborer category is also dominated
by Saudi Arabia with 26%, followed by Yemen and India with 13% and 11%, respectively, in Najran.
Saudi Arabia
Bangladesh
Egypt
Yemen
India
Pakistan
Sudan
Others
26.0%
5.0%
0.0%
13.0%
11.0%
3.0%
0.0%
3.0%
34.0%
0.0%
3.0%
0.0%
0.0%
0.0%
3.0%
0.0%
Unskilled Skilled
57%
100%
100%
43%
100%
100%
100%
100%
0% 10% 20% 30% 40% 50% 60% 70% 80% 90% 100%
Saudi Arabia
Bangladesh
Egypt
Yemen
India
Pakistan
Sudan
Skilled Unskilled

Sector Analysis 94
Among Saudi Arabian laborers, the proportion of skilled laborers is higher than unskilled one. Only
skilled laborers are working from Egypt and Sudan in Najran. A reverse scenario can be observed in
laborers from Bangladesh, India, Pakistan, and Yemen.
Figure 76. HEAT MAP FOR AVERAGE WAGES (IN SAR) IN ENGINEERING OFFICE SECTOR
– NAJRAN
Table 37. TOP 5 SKILLED AND UNSKILLED JOBS BASED ON NUMBER OF LABORERS –
NAJRAN
LOW
ME
DIU
MH
IGH
Skilled - Male Unskilled - Male
Saudi Arabia
Bangladesh
Egypt
Yemen
India
Pakistan
Sudan
TOP 5 SKILLED
JOB TITLE COUNTCOUNT JOB TITLE
4
3
1
1
1
TOP 5 UNSKILLED
5
3
2
2
2

Sector Analysis 95
Table 38. TOP 5 SKILLED AND UNSKILLED JOBS IN YOUTH (AGE 16–30) BASED ON
NUMBER OF LABORERS – NAJRAN
Table 39. TOP 5 SKILLED AND UNSKILLED JOBS IN MIDDLE-AGE (AGE 31–45) BASED
ON NUMBER OF LABORERS – NAJRAN
TOP 5 SKILLED
JOB TITLE COUNTCOUNT JOB TITLE
3
2
1
1
1
TOP 5 UNSKILLED
3
1
1
TOP 5 SKILLED
JOB TITLE COUNTCOUNT JOB TITLE
2
1
1
TOP 5 UNSKILLED
2
2
1
1

Sector Analysis 96
Table 40. TOP 5 SKILLED AND UNSKILLED JOBS IN ELDERLY (AGE ABOVE 45 YEARS)
BASED ON NUMBER OF LABORERS – NAJRAN
2.10.2 Companies
There are no companies under large and medium category
2.10.3 Relation
Figure 77. HEAT MAP FOR AVERAGE WAGES (IN SAR) AGE VS NATIONALITY – NAJRAN
TOP 5 SKILLED
JOB TITLE COUNTCOUNT JOB TITLE
1
1
1
TOP 5 UNSKILLED
5
2
1
1
1
1
1
LOW
ME
DIU
MH
IGH
Saudi Arabia Bangladesh Egypt Yemen India Pakistan Sudan
16-20
21-25
26-30
31-35
36-40
41-45
46-50
51-55
55 and above

Sector Analysis 97
Figure 78. CATEGORY-WISE COMPANY DISTRIBUTION – NAJRAN
Najran has one ‘Large’ and ‘Medium’ company in the engineering office sector; the proportion for ‘Micro’
category is considerably high, as 22 out of 31 companies fall under micro level.
22
9
Total Number of Companies = 31
Micro Small Medium Large

Sector Analysis 98
Sub Table of Content
2.11 Northern ..................................................................................................................... 99
2.11.1 Laborers .................................................................................................. 99
2.11.2 Companies ............................................................................................ 103
2.11.3 Relation ................................................................................................. 103
NORTHERN

Sector Analysis 99
2.11 Northern
2.11.1 Laborers
Figure 79. GENDER AND TYPE-WISE DISTRIBUTION OF LABORERS – NORTHERN
As per the figure for ‘Nationality-wise laborer distribution’ shown above, Saudi Arabia accounted for the
largest percentage of workers, i.e., 65% in terms of worker nationality. Workers from Bangladesh,
Egypt, and Sudan held next position with regards to market share, i.e., 10% each, in Northern region.
Based on ‘Gender Vs Nationality’ chart, the workforce in Northern region is extensively dom inated by
the male (Saudi males, 35% and Non-Saudi males, 35%).
Figure 80. AGE VS NATIONALITY DISTRIBUTION OF LABORERS
In age-wise distribution, the youth category has Saudi laborers only, middle-age group has a maximum
share of expats, and elderly group has equal share of Saudi and non-Saudi laborers.
35%
35%
30%
Gender Vs Nationality
Saudi Male
Non-Saudi Male
Saudi Female
Non-Saudi Female
65%
10%
10%
5%
10%
Saudi
Arabia
Bangladesh
Egypt
Pakistan
Sudan
Number of laborers
10% 10%
20%
10%
5% 5% 5%
5%
10%
10%
10%
16-20 Years 21-25 Years 26-30 Years 31-35 Years 36-40 Years 41-45 Years 46-50 Years 51-55 Years 56 & Above
Years
Saudi Non-Saudi

Sector Analysis 100
Figure 81. TYPE-WISE LABORER DISTRIBUTION ACROSS NATIONALITIES – NORTHERN
Figure 82. TYPE-WISE LABORER DISTRIBUTION AMONG NATIONALITIES – NORTHERN
Among the skilled and unskilled laborer categories, Saudi Arabia accounted for the largest share of
skilled laborers, i.e., 60%, followed by Sudan with 10%. The unskilled laborer category is dominated by
Bangladesh and Egypt with 10%, followed by Saudi Arabia and Pakistan with 5% each, in Northern.
Among Saudi Arabian laborers, the proportion of skilled laborers is higher than unskilled one. Only
skilled laborers are working from Sudan in Northern. A reverse scenario can be observed in laborers
from Bangladesh, Egypt, and Pakistan.
Saudi Arabia
Bangladesh
Egypt
Pakistan
Sudan
5.0%
10.0%
10.0%
5.0%
0.0%
60.0%
0.0%
0.0%
0.0%
10.0%
Unskilled Skilled
92%
100%
8%
100%
100%
100%
0% 10% 20% 30% 40% 50% 60% 70% 80% 90% 100%
Saudi Arabia
Bangladesh
Egypt
Pakistan
Sudan
Skilled Unskilled
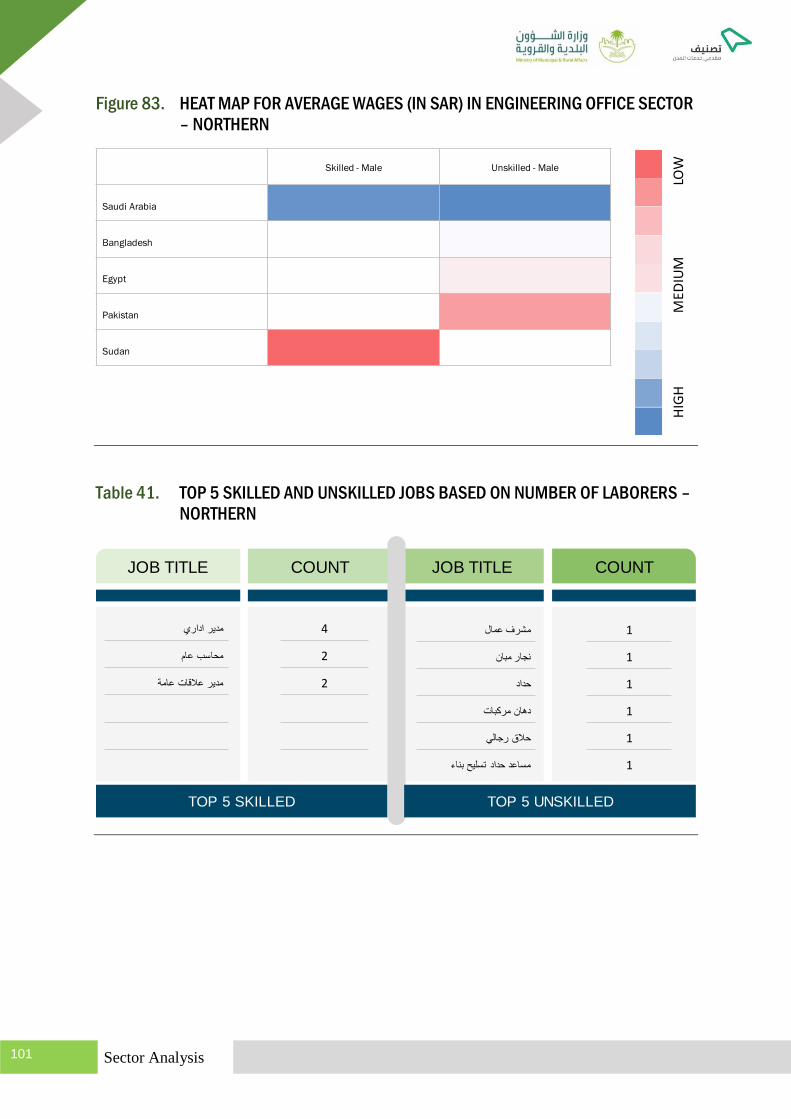
Sector Analysis 101
Figure 83. HEAT MAP FOR AVERAGE WAGES (IN SAR) IN ENGINEERING OFFICE SECTOR
– NORTHERN
Table 41. TOP 5 SKILLED AND UNSKILLED JOBS BASED ON NUMBER OF LABORERS –
NORTHERN
LOW
MED
IUM
HIG
H
Skilled - Male Unskilled - Male
Saudi Arabia
Bangladesh
Egypt
Pakistan
Sudan
TOP 5 SKILLED
JOB TITLE COUNTCOUNT JOB TITLE
4
2
2
TOP 5 UNSKILLED
1
1
1
1
1
1

Sector Analysis 102
Table 42. TOP 5 SKILLED AND UNSKILLED JOBS IN YOUTH (AGE 16–30) BASED ON
NUMBER OF LABORERS – NORTHERN
Table 43. TOP 5 SKILLED AND UNSKILLED JOBS IN MIDDLE-AGE (AGE 31–45) BASED
ON NUMBER OF LABORERS – NORTHERN
TOP 5 SKILLED
JOB TITLE COUNTCOUNT JOB TITLE
2
1
1
1
1
1
TOP 5 UNSKILLED
1
TOP 5 SKILLED
JOB TITLE COUNTCOUNT JOB TITLE
2
1
TOP 5 UNSKILLED
1
1
1
1
1

Sector Analysis 103
Table 44. TOP 5 SKILLED AND UNSKILLED JOBS IN ELDERLY (AGE ABOVE 45 YEARS)
BASED ON NUMBER OF LABORERS – NORTHERN
No unskilled jobs present in this region
2.11.2 Companies
There is no company categorized under large and medium project
2.11.3 Relation
Figure 84. HEAT MAP FOR AVERAGE WAGES (IN SAR) AGE VS NATIONALITY –
NORTHERN
TOP 5 SKILLED
JOB TITLE COUNTCOUNT JOB TITLE
1
1
1
1
TOP 5 UNSKILLED
LOW
ME
DIU
MH
IGH
Saudi Arabia Bangladesh Egypt Pakistan Sudan
16-20
21-25
26-30
31-35
36-40
41-45
46-50
51-55
55 and above

Sector Analysis 104
Figure 85. CATEGORY-WISE COMPANY DISTRIBUTION – NORTHERN
Northern does not have any ‘Large’ and ‘Medium’ companies in the engineering office sector; the
proportion for ‘Micro’ category is considerably high, as 17 out of 23 companies fall under micro level.
17
6
Total Number of Companies = 23
Micro Small Medium Large

Sector Analysis 105
Sub Table of Content
2.12 Qassim .................................................................................................................... 106
2.12.1 Laborers ................................................................................................ 106
2.12.2 Companies ............................................................................................ 110
2.12.3 Relation ................................................................................................. 111
QASSIM
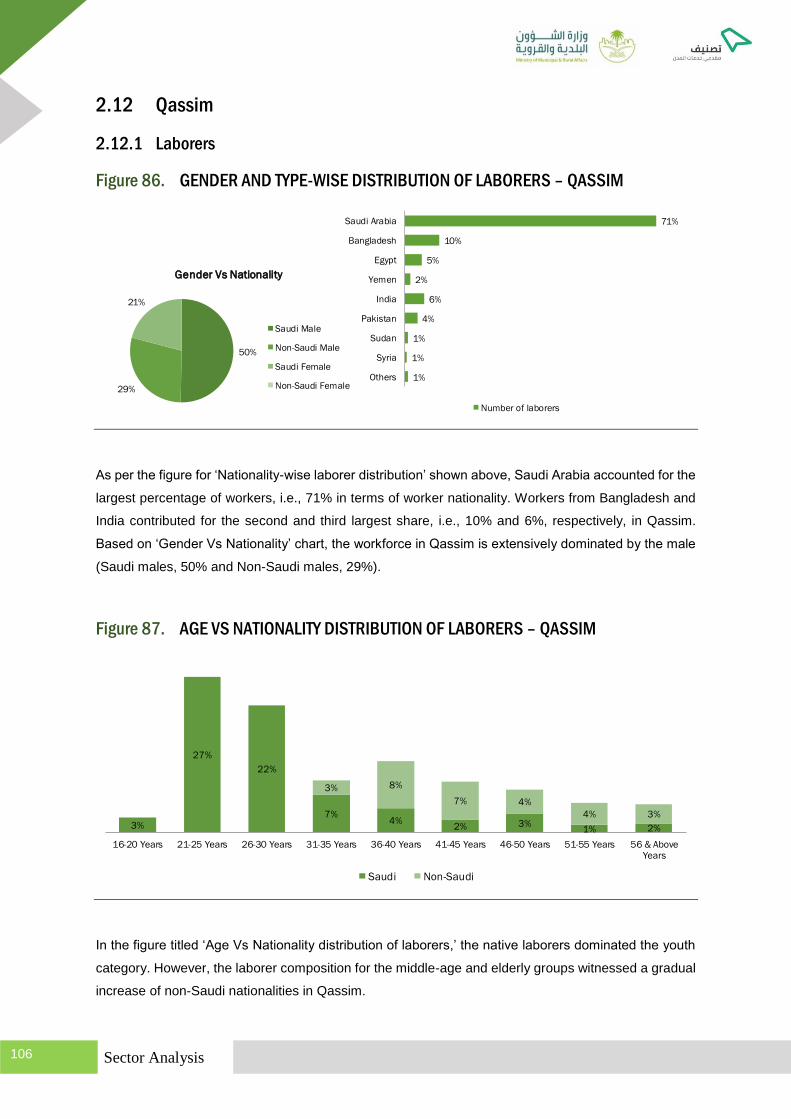
Sector Analysis 106
2.12 Qassim
2.12.1 Laborers
Figure 86. GENDER AND TYPE-WISE DISTRIBUTION OF LABORERS – QASSIM
As per the figure for ‘Nationality-wise laborer distribution’ shown above, Saudi Arabia accounted for the
largest percentage of workers, i.e., 71% in terms of worker nationality. Workers from Bangladesh and
India contributed for the second and third largest share, i.e., 10% and 6%, respectively, in Qassim.
Based on ‘Gender Vs Nationality’ chart, the workforce in Qassim is extensively dominated by the male
(Saudi males, 50% and Non-Saudi males, 29%).
Figure 87. AGE VS NATIONALITY DISTRIBUTION OF LABORERS – QASSIM
In the figure titled ‘Age Vs Nationality distribution of laborers,’ the native laborers dominated the youth
category. However, the laborer composition for the middle-age and elderly groups witnessed a gradual
increase of non-Saudi nationalities in Qassim.
50%
29%
21%
Gender Vs Nationality
Saudi Male
Non-Saudi Male
Saudi Female
Non-Saudi Female
71%
10%
5%
2%
6%
4%
1%
1%
1%
Saudi Arabia
Bangladesh
Egypt
Yemen
India
Pakistan
Sudan
Syria
Others
Number of laborers
3%
27%
22%
7%4%
2% 3%1% 2%
3% 8%
7% 4%
4% 3%
16-20 Years 21-25 Years 26-30 Years 31-35 Years 36-40 Years 41-45 Years 46-50 Years 51-55 Years 56 & AboveYears
Saudi Non-Saudi

Sector Analysis 107
Figure 88. TYPE-WISE LABORER DISTRIBUTION ACROSS NATIONALITIES – QASSIM
Figure 89. TYPE-WISE LABORER DISTRIBUTION AMONG NATIONALITIES – QASSIM
Among the skilled and unskilled laborer categories, Saudi Arabia accounted for the largest share of
skilled laborers, i.e., 60%, followed by Egypt with 3%. The unskilled laborer category is also dominated
by Saudi Arabia with 11%, followed by Bangladesh and India with 9% and 5%, respectively, in Qassim.
Saudi Arabia
Bangladesh
Egypt
Yemen
India
Pakistan
Sudan
Others
11.1%
9.5%
2.3%
1.6%
4.9%
3.6%
0.7%
0.7%
60.1%
0.0%
2.6%
0.0%
0.7%
0.0%
0.0%
0.0%
Unskilled Skilled
84%
3%
53%
12%
33%
50%
16%
97%
47%
100%
88%
100%
67%
50%
100%
100%
0% 10% 20% 30% 40% 50% 60% 70% 80% 90% 100%
Saudi Arabia
Bangladesh
Egypt
Yemen
India
Pakistan
Sudan
Syria
Jordan
Nepal
Skilled Unskilled
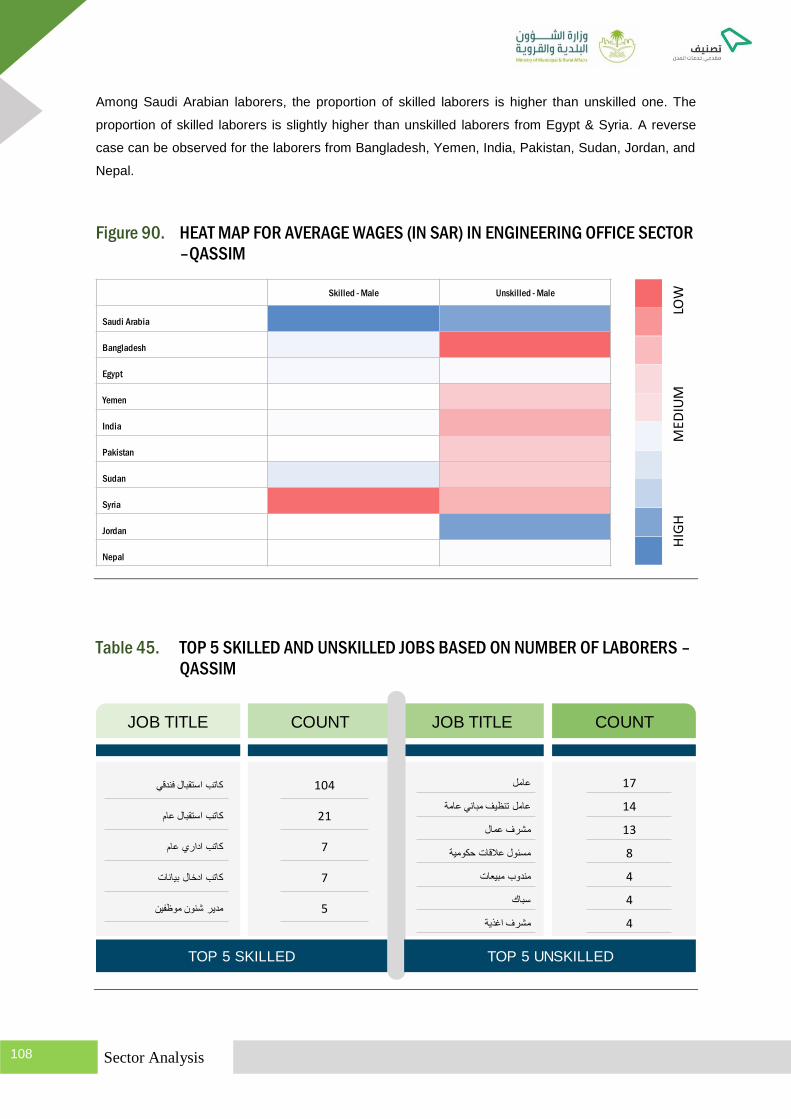
Sector Analysis 108
Among Saudi Arabian laborers, the proportion of skilled laborers is higher than unskilled one. The
proportion of skilled laborers is slightly higher than unskilled laborers from Egypt & Syria. A reverse
case can be observed for the laborers from Bangladesh, Yemen, India, Pakistan, Sudan, Jordan, and
Nepal.
Figure 90. HEAT MAP FOR AVERAGE WAGES (IN SAR) IN ENGINEERING OFFICE SECTOR
–QASSIM
Table 45. TOP 5 SKILLED AND UNSKILLED JOBS BASED ON NUMBER OF LABORERS –
QASSIM
LOW
MED
IUM
HIG
H
Skilled - Male Unskilled - Male
Saudi Arabia
Bangladesh
Egypt
Yemen
India
Pakistan
Sudan
Syria
Jordan
Nepal
TOP 5 SKILLED
JOB TITLE COUNTCOUNT JOB TITLE
104
21
7
7
5
TOP 5 UNSKILLED
17
14
13
8
4
4
4

Sector Analysis 109
Table 46. TOP 5 SKILLED AND UNSKILLED JOBS IN YOUTH (AGE 16–30) BASED ON
NUMBER OF LABORERS – QASSIM
Table 47. TOP 5 SKILLED AND UNSKILLED JOBS IN MIDDLE-AGE (AGE 31–45) BASED
ON NUMBER OF LABORERS – QASSIM
TOP 5 SKILLED
JOB TITLE COUNTCOUNT JOB TITLE
81
19
5
4
4
TOP 5 UNSKILLED
7
6
3
2
1
1
1
TOP 5 SKILLED
JOB TITLE COUNTCOUNT JOB TITLE
16
3
2
2
2
2
2
TOP 5 UNSKILLED
7
7
5
3
2
2
2
2
2

Sector Analysis 110
Table 48. TOP 5 SKILLED AND UNSKILLED JOBS IN ELDERLY (AGE ABOVE 45 YEARS)
BASED ON NUMBER OF LABORERS – QASSIM
2.12.2 Companies
There is no company under large category
TOP 5 SKILLED
JOB TITLE COUNTCOUNT JOB TITLE
7
2
1
1
1
1
TOP 5 UNSKILLED
10
7
2
2
Name Total Laborer
76
445
5ME
DIU
M

Sector Analysis 111
2.12.3 Relation
Figure 91. HEAT MAP FOR AVERAGE WAGES (IN SAR) AGE VS NATIONALITY – QASSIM
Figure 92. CATEGORY-WISE COMPANY DISTRIBUTION – QASSIM
There are 98 companies operating in the engineering office sector in the Qassim region. More than
75% of these companies fall under micro category.
LOW
MED
IUM
HIG
H
Saudi
Arabia
Banglad
eshEgypt Yemen India Pakistan Sudan Syria Jordan Nepal
16-20
21-25
26-30
31-35
36-40
41-45
46-50
51-55
55 and
above
74
213
0
Total Number of Companies = 98
Micro Small Medium Large
Sector Analysis 112
Sub Table of Content
2.13 Riyadh ..................................................................................................................... 113
2.13.1 Laborers ................................................................................................ 113
2.13.2 Companies ............................................................................................ 117
2.13.3 Relation ................................................................................................. 118
RIYADH

Sector Analysis 113
2.13 Riyadh
2.13.1 Laborers
Figure 93. GENDER AND TYPE-WISE DISTRIBUTION OF LABORERS – RIYADH
As per the figure for ‘Nationality-wise laborer distribution’ shown above, Saudi Arabia accounted for the
largest percentage of workers, i.e., 87% in terms of worker nationality, in Riyadh. Based on ‘Gender Vs
Nationality’ chart, the workforce in Riyadh is extensively dominated by the male (Saudi males, 51% and
Non-Saudi males, 13%).
Figure 94. AGE VS NATIONALITY DISTRIBUTION OF LABORERS – RIYADH
In the figure titled ‘Age Vs Nationality distribution of laborers,’ the native laborers dominated the youth
category. The proportion of local laborer is higher than that of expat in middle-age group and it is equal
in elderly group in Riyadh.
51%
13%
36%
Gender Vs Nationality
Saudi Male
Non-Saudi Male
Saudi Female
Non-Saudi Female
87%
2%
2%
2%
2%
1%
1%
1%
1%
Saudi Arabia
Bangladesh
Egypt
Yemen
India
Pakistan
Sudan
Syria
Others
Number of laborers
1%
9%
26%23%
14%
6%3% 2% 3%
1%
2%
3%
2%2% 3%
16-20 Years 21-25 Years 26-30 Years 31-35 Years 36-40 Years 41-45 Years 46-50 Years 51-55 Years 56 & AboveYears
Saudi Non-Saudi
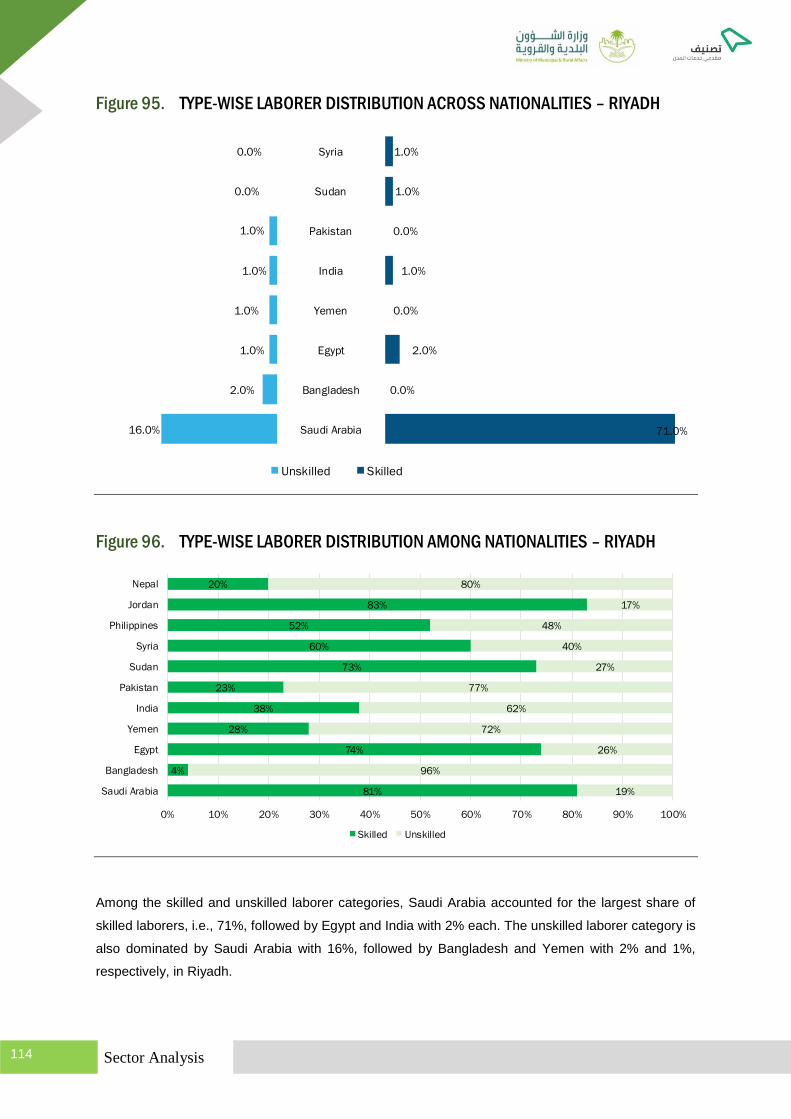
Sector Analysis 114
Figure 95. TYPE-WISE LABORER DISTRIBUTION ACROSS NATIONALITIES – RIYADH
Figure 96. TYPE-WISE LABORER DISTRIBUTION AMONG NATIONALITIES – RIYADH
Among the skilled and unskilled laborer categories, Saudi Arabia accounted for the largest share of
skilled laborers, i.e., 71%, followed by Egypt and India with 2% each. The unskilled laborer category is
also dominated by Saudi Arabia with 16%, followed by Bangladesh and Yemen with 2% and 1%,
respectively, in Riyadh.
Saudi Arabia
Bangladesh
Egypt
Yemen
India
Pakistan
Sudan
Syria
16.0%
2.0%
1.0%
1.0%
1.0%
1.0%
0.0%
0.0%
71.0%
0.0%
2.0%
0.0%
1.0%
0.0%
1.0%
1.0%
Unskilled Skilled
81%
4%
74%
28%
38%
23%
73%
60%
52%
83%
20%
19%
96%
26%
72%
62%
77%
27%
40%
48%
17%
80%
0% 10% 20% 30% 40% 50% 60% 70% 80% 90% 100%
Saudi Arabia
Bangladesh
Egypt
Yemen
India
Pakistan
Sudan
Syria
Philippines
Jordan
Nepal
Skilled Unskilled

Sector Analysis 115
Among Saudi Arabian laborers, the proportion of skilled laborers is significantly higher than unskilled
one. Similar case is observed among the laborers from Egypt, Sudan, Syria, the Philippines and Jordan.
A reverse scenario can be observed in laborers from Bangladesh, Yemen, India, Pakistan, and Nepal.
Figure 97. HEAT MAP FOR AVERAGE WAGES (IN SAR) IN ENGINEERING OFFICE SECTOR
– RIYADH
Table 49. TOP 5 SKILLED AND UNSKILLED JOBS BASED ON NUMBER OF LABORERS –
RIYADH
LOW
MED
IUM
HIG
H
Skilled - Male Unskilled - Male
Saudi Arabia
Bangladesh
Egypt
Yemen
India
Pakistan
Sudan
Syria
Philippines
Jordan
Nepal
TOP 5 SKILLED
JOB TITLE COUNTCOUNT JOB TITLE
1267
920
642
373
306
TOP 5 UNSKILLED
473
322
134
133
129

Sector Analysis 116
Table 50. TOP 5 SKILLED AND UNSKILLED JOBS IN YOUTH (AGE 16–30) BASED ON
NUMBER OF LABORERS – RIYADH
Table 51. TOP 5 SKILLED AND UNSKILLED JOBS IN MIDDLE-AGE (AGE 31–45) BASED
ON NUMBER OF LABORERS – RIYADH
TOP 5 SKILLED
JOB TITLE COUNTCOUNT JOB TITLE
622
398
180
130
103
TOP 5 UNSKILLED
171
114
68
62
59
TOP 5 SKILLED
JOB TITLE COUNTCOUNT JOB TITLE
616
474
458
173
172
TOP 5 UNSKILLED
204
188
48
42
39

Sector Analysis 117
Table 52. TOP 5 SKILLED AND UNSKILLED JOBS IN ELDERLY (AGE ABOVE 45 YEARS)
BASED ON NUMBER OF LABORERS – RIYADH
2.13.2 Companies
TOP 5 SKILLED
JOB TITLE COUNTCOUNT JOB TITLE
116
96
89
48
44
TOP 5 UNSKILLED
104
98
45
31
28
Name Total Laborer
550
527
2359
1180
LAR
GE

Sector Analysis 118
2.13.3 Relation
Figure 98. HEAT MAP FOR AVERAGE WAGES (IN SAR) AGE VS NATIONALITY – RIYADH
Name Total Laborer
247
215
259
247
172
230
266
230
177
158
ME
DIU
M
LOW
MED
IUM
HIG
H
Saudi
ArabiaBangladesh Egypt Yemen India Pakistan Sudan Syria Philippines Jordan Nepal
16-20
21-25
26-30
31-35
36-40
41-45
46-50
51-55
55 and
above

Sector Analysis 119
Figure 99. CATEGORY-WISE COMPANY DISTRIBUTION – RIYADH
There are more than 1,500 companies in the engineering office sector in Riyadh. Riyadh has four large
companies. Micro companies have highest share among all categories, in Riyadh region.
985
542
57
4
Total Number of Companies = 1588
Micro Small Medium Large

Sector Analysis 120
Sub Table of Content
2.14 Tabouk ..................................................................................................................... 121
2.14.1 Laborer .................................................................................................. 121
2.14.2 Companies ............................................................................................ 125
2.14.3 Relation ................................................................................................. 125
TABOUK
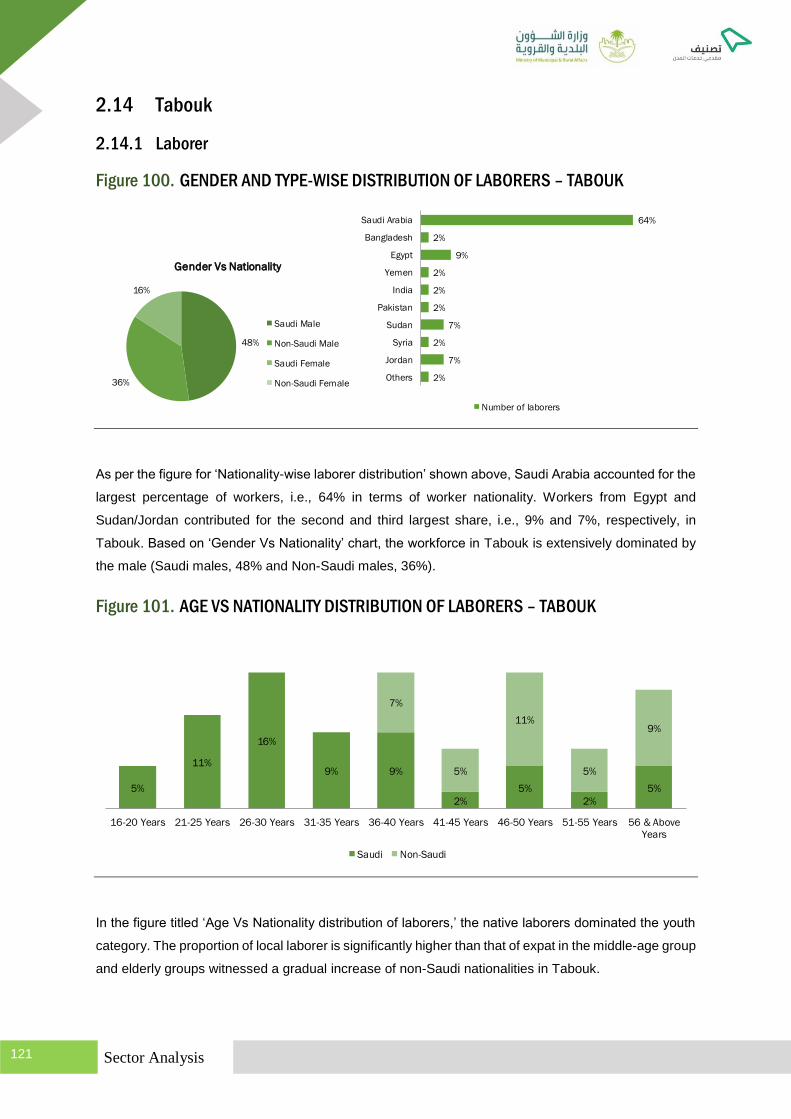
Sector Analysis 121
2.14 Tabouk
2.14.1 Laborer
Figure 100. GENDER AND TYPE-WISE DISTRIBUTION OF LABORERS – TABOUK
As per the figure for ‘Nationality-wise laborer distribution’ shown above, Saudi Arabia accounted for the
largest percentage of workers, i.e., 64% in terms of worker nationality. Workers from Egypt and
Sudan/Jordan contributed for the second and third largest share, i.e., 9% and 7%, respectively, in
Tabouk. Based on ‘Gender Vs Nationality’ chart, the workforce in Tabouk is extensively dominated by
the male (Saudi males, 48% and Non-Saudi males, 36%).
Figure 101. AGE VS NATIONALITY DISTRIBUTION OF LABORERS – TABOUK
In the figure titled ‘Age Vs Nationality distribution of laborers,’ the native laborers dominated the youth
category. The proportion of local laborer is significantly higher than that of expat in the middle-age group
and elderly groups witnessed a gradual increase of non-Saudi nationalities in Tabouk.
48%
36%
16%
Gender Vs Nationality
Saudi Male
Non-Saudi Male
Saudi Female
Non-Saudi Female
64%
2%
9%
2%
2%
2%
7%
2%
7%
2%
Saudi Arabia
Bangladesh
Egypt
Yemen
India
Pakistan
Sudan
Syria
Jordan
Others
Number of laborers
5%
11%
16%
9% 9%
2%
5%
2%
5%
7%
5%
11%
5%
9%
16-20 Years 21-25 Years 26-30 Years 31-35 Years 36-40 Years 41-45 Years 46-50 Years 51-55 Years 56 & Above
Years
Saudi Non-Saudi

Sector Analysis 122
Figure 102. TYPE-WISE LABORER DISTRIBUTION ACROSS NATIONALITIES – TABOUK
Figure 103. TYPE-WISE LABORER DISTRIBUTION AMONG NATIONALITIES – TABOUK
Among the skilled and unskilled laborer categories, Saudi Arabia accounted for the largest share of
skilled laborers, i.e., 43%, followed by Sudan with 7%. The unskilled laborer category is also dominated
by Saudi Arabia with 20%, followed by Egypt and Jordan with 5% each, in Tabouk.
Saudi Arabia
Bangladesh
Egypt
Yemen
India
Pakistan
Sudan
Syria
Jordan
Others
20.5%
2.3%
4.5%
0.0%
2.3%
2.3%
0.0%
0.0%
4.5%
2.3%
43.2%
0.0%
4.5%
2.3%
0.0%
0.0%
6.8%
2.3%
2.3%
0.0%
Unskilled Skilled
68%
50%
100%
100%
100%
33%
32%
100%
50%
100%
100%
67%
0% 10% 20% 30% 40% 50% 60% 70% 80% 90% 100%
Saudi Arabia
Bangladesh
Egypt
Yemen
India
Pakistan
Sudan
Syria
Jordan
Skilled Unskilled

Sector Analysis 123
Among Saudi Arabian laborers, the proportion of skilled laborers is significantly higher than unskilled
one. A reverse scenario can be observed in laborers from Jordan. The proportion of skilled & unskilled
laborers from Egypt working in Tabouk is equal. All the laborer from Yemen, Sudan, and Syria belongs
to skilled category. A reverse scenario can be observed in laborers from Bangladesh, India, and
Pakistan
Figure 104. HEAT MAP FOR AVERAGE WAGES (IN SAR) IN ENGINEERING OFFICE SECTOR
–TABOUK
Table 53. TOP 5 SKILLED AND UNSKILLED JOBS BASED ON NUMBER OF LABORERS –
TABOUK
LOW
MED
IUM
HIG
H
Skilled - Male Unskilled - Male
Saudi Arabia
Bangladesh
Egypt
Yemen
India
Pakistan
Sudan
Syria
Jordan
TOP 5 SKILLED
JOB TITLE COUNTCOUNT JOB TITLE
4
3
3
3
2
2
TOP 5 UNSKILLED
3
3
2
2
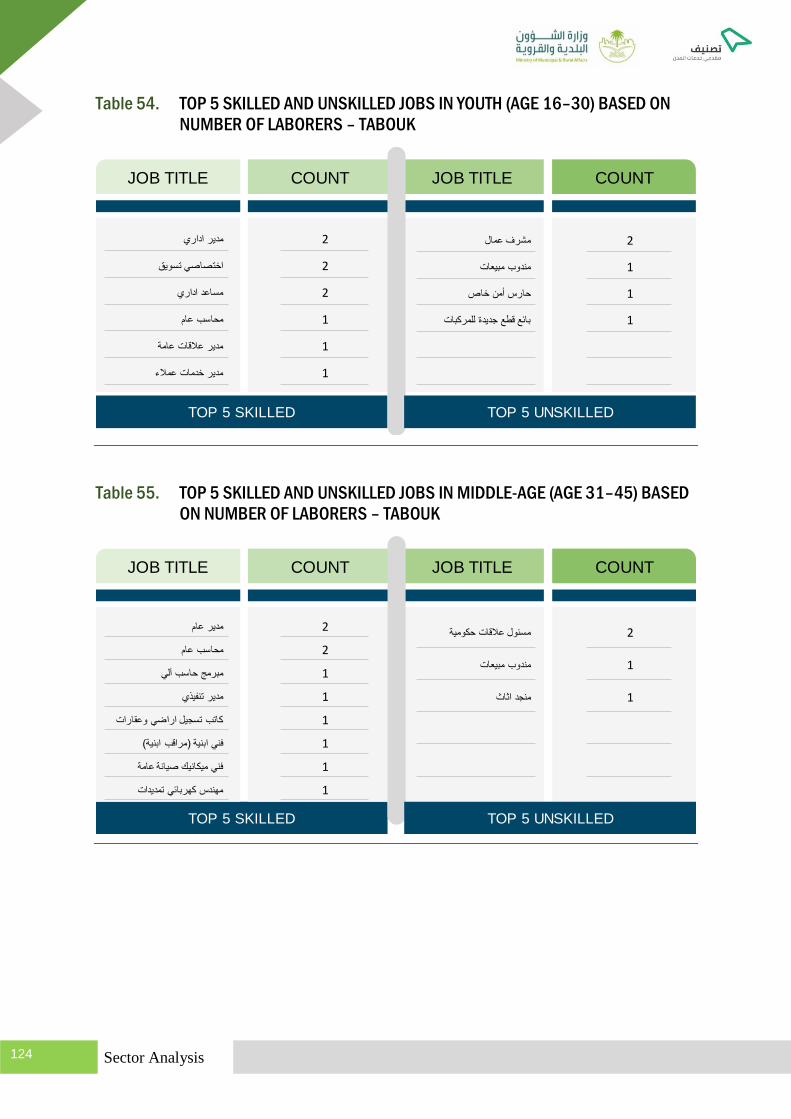
Sector Analysis 124
Table 54. TOP 5 SKILLED AND UNSKILLED JOBS IN YOUTH (AGE 16–30) BASED ON
NUMBER OF LABORERS – TABOUK
Table 55. TOP 5 SKILLED AND UNSKILLED JOBS IN MIDDLE-AGE (AGE 31–45) BASED
ON NUMBER OF LABORERS – TABOUK
TOP 5 SKILLED
JOB TITLE COUNTCOUNT JOB TITLE
2
2
2
1
1
1
TOP 5 UNSKILLED
2
1
1
1
TOP 5 SKILLED
JOB TITLE COUNTCOUNT JOB TITLE
2
2
1
1
1
1
1
1
TOP 5 UNSKILLED
2
1
1

Sector Analysis 125
Table 56. TOP 5 SKILLED AND UNSKILLED JOBS IN ELDERLY (AGE ABOVE 45 YEARS)
BASED ON NUMBER OF LABORERS – TABOUK
2.14.2 Companies
No large and medium category companies are operational in this region.
2.14.3 Relation
Figure 105. HEAT MAP FOR AVERAGE WAGES (IN SAR) AGE VS NATIONALITY – TABOUK
TOP 5 SKILLED
JOB TITLE COUNTCOUNT JOB TITLE
1
1
1
1
1
1
1
1
TOP 5 UNSKILLED
2
1
1
1
1
1
1
LOW
MED
IUM
HIG
HSaudi
ArabiaBangladesh Egypt Yemen India Pakistan Sudan Syria Jordan
16-20
21-25
26-30
31-35
36-40
41-45
46-50
51-55
55 and
above
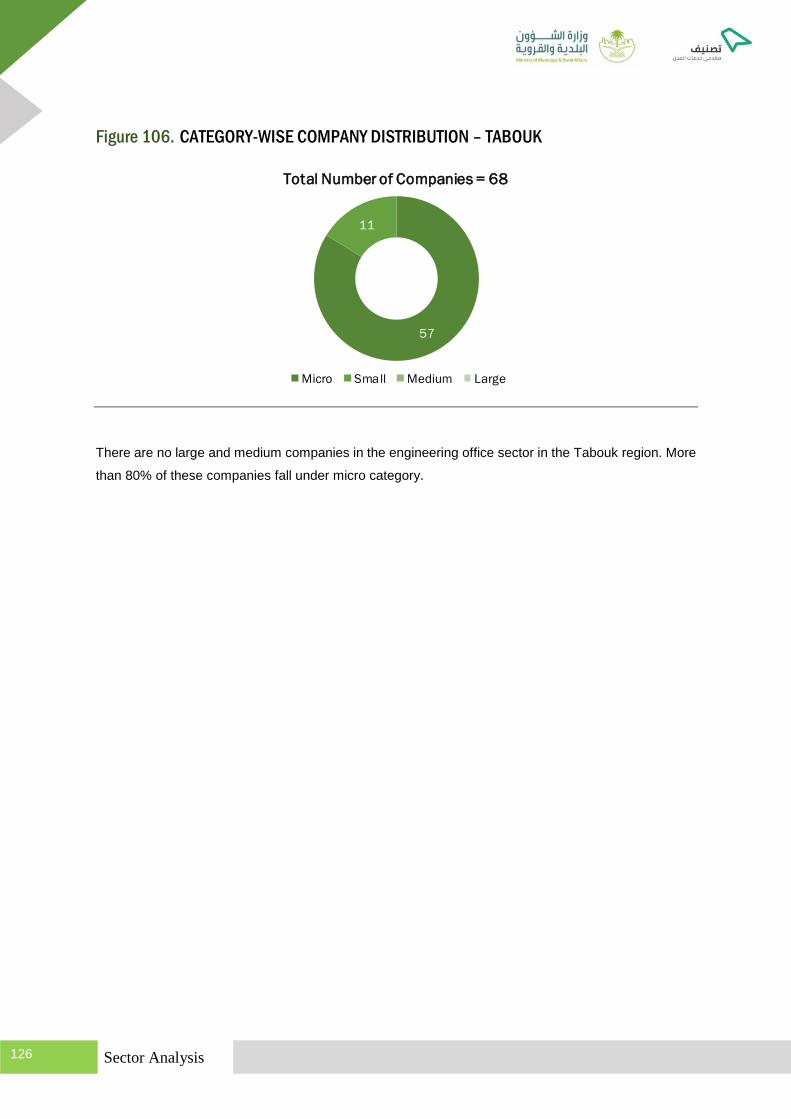
Sector Analysis 126
Figure 106. CATEGORY-WISE COMPANY DISTRIBUTION – TABOUK
There are no large and medium companies in the engineering office sector in the Tabouk region. More
than 80% of these companies fall under micro category.
57
11
Total Number of Companies = 68
Micro Small Medium Large

Sector Analysis 127
Conclusion
In the engineering office sector, skilled laborers held a larger share than unskilled laborers. Considering
the regions, Riyadh held the top position in all aspects, such as number of laborers, number of
companies, and government spending. Riyadh holds more than 60% share of the laborer market,
followed by Makkah and Eastern with respect to laborer count. The Riyadh region also has the highest
number of large companies.
With regard to government spending (the data is available from 2018 to 2020), it is observed that the
number of projects declined over the period of three years. Also, the number of projects are
considerably less in number than construction and maintenance & operation sectors.

Sector Analysis 128