Embed Size (px)
Citation preview
Engineering Fracture Mechanics 110 (2013) 281–289
Contents lists available at ScienceDirect
Engineering Fracture Mechanics
journal homepage: www.elsevier .com/locate /engfracmech
Comprehensive concrete fracture tests: Size effectsof Types 1 & 2, crack length effect and postpeak
0013-7944/$ - see front matter � 2013 Elsevier Ltd. All rights reserved.http://dx.doi.org/10.1016/j.engfracmech.2013.08.008
⇑ Corresponding author. Tel.: +1 847 491 4025; fax: +1 847 491 4011.E-mail addresses: [email protected], [email protected] (C.G. Hoover), [email protected] (Z.P. Bazant).
1 Present address: Massachusetts Institute of Technology, Cambridge, MA 02139, USA.
Christian G. Hoover a,1, Zdenek P. Bazant b,⇑a Northwestern University, 2145 Sheridan Road, Evanston, IL 60208, USAb McCormick Institute Professor and W.P. Murphy Professor of Civil Engineering and Materials Science, Northwestern University, 2145 Sheridan Road,CEE/A135, Evanston, IL 60208, USA
a r t i c l e i n f o
Article history:Received 7 February 2013Received in revised form 25 July 2013Accepted 3 August 2013Available online 23 August 2013
Keywords:Cohesive crack modelScaling of strengthFracture testingSize effect lawFlexural strength
a b s t r a c t
The comprehensive fracture tests of notched and unnotched beams presented in the pre-ceding paper are evaluated to clarify the size effects and fracture energy dissipation. Thetest results for beams with notches of various lengths agree closely with Bazant’s Type 2size effect law and yield the value of the initial fracture energy Gf. Since nearly completepost-peak softening load–displacement curves have been obtained, the total energy dissi-pation by fracture can be accurately evaluated and used to determine the RILEM total frac-ture energy GF. For the present concrete, GF/Gf � 2. The transition between the Type 1 and 2size effects are determined and is found to be very different from that assumed in Hu andDuan’s boundary effect model. Determination of a universal size effect law fitting the beamstrengths for all the sizes and all notch depths is relegated to a subsequent paper.
� 2013 Elsevier Ltd. All rights reserved.
1. Introduction and review of size effect and crack length effect
The preceding paper [1] presented an introduction to the problem and reported comprehensive test data for fracture ofconcrete. The experimental program, also described in [1,2], consisted of 128 three-point bend beams with 4 different depthsof 1.58, 3.66, 8.47 and 19.69 in. (40, 93, 215 and 500 mm), corresponding to a size range of 1:12.5. Five different relativenotch lengths, a/D = 0, 0.025, 0.075, 0.15, 0.30 were cut into the beams, except that the notch a/D = 0.025 was skipped forthe two smallest sizes because it would have been much shorter than the coarse aggregate diameter da and thus essentiallyequivalent to the case a = a/D = 0. A total of 18 different geometries (family of beams) were tested. The present paper will usethese data to analyze the effects of size, crack length and postpeak softening. All the notations from the preceding paper areretained.
The size effect on structural strength is generally described in terms of the nominal strength rNu of structure, which is aparameter of maximum (or ultimate) load Pu having the dimension of stress. It is defined as
rNu ¼ cNPu
bDð1Þ
where D = characteristic size (or dimension) of the specimen or structure, b = specimen thickness, and cN = constant dimen-sionless coefficient chosen for convenience. If there is no stress-singularity, cN can be chosen so as to make rNu represent themaximum stress in the structure. According to the classical theories of elasticity and plasticity, the nominal strength of
282 C.G. Hoover, Z.P. Bazant / Engineering Fracture Mechanics 110 (2013) 281–289
structure is independent of structure size, which came to be known as the case of no size effect. This is what is still assumedin most design codes and standards for concrete.
The size effect is defined as the dependence of rNu on D when geometrically similar structures are compared. For perfectlybrittle geometrically similar structures with similar cracks, linear elastic fracture mechanics (LEFM) shows that rNu de-creases with structure size as D�1/2. A salient feature of quasibrittle materials, containing at maximum load geometricallysimilar large cracks, is a size effect that is transitional between plasticity and LEFM. The transitional behavior is causedby the fact that the FPZ size, equal to several inhomogeneity sizes, is not negligible compared to the cross section dimension.
The size effect can best be shown in the plot of logrNu vs. logD. When geometrically similar beams contain a deep notchor a pre-existing stress-free crack of large depth a relative to structure size D, the size effect is of Type 2, which represents asmooth transition from a horizontal line for small sizes (corresponding to plasticity or strength theory) to an inclined asymp-tote of slope �1/2 for large-sizes (corresponding to LEFM). It is well described by the approximate size effect law (SEL) [4]:
rNu ¼Bf 0tffiffiffiffiffiffiffiffiffiffiffiffiffiffiffiffiffiffiffiffi
1þ D=D0
p ð2Þ
Here Bf 0t and the transitional structure size D0 are empirical parameters to be identified by optimum fitting of measured rN
values covering a broad enough size range. Eq. (2) was derived [5] by simple energy release analysis and later by severalother ways, especially by asymptotic matching based on the simple asymptotic power scaling laws for very large and verysmall D [6,4]. The coefficients of Eq. (2) have been shown [7] to be approximately related to the LEFM fracture characteristics,as follows:
rNu ¼
ffiffiffiffiffiffiffiffiffiffiffiffiffiffiffiffiffiffiffiffiffiffiffiffiffiffiffiffiffiffiffiffiffiffiffiffiffiE0Gf
gða0ÞDþ g0ða0Þcf
sð3Þ
where a = a/D = relative crack length, a0 = a0/D = initial value of a, g(a0) = k2(a0) = dimensionless energy release rate function oflinear elastic fracture mechanics (LEFM), kða0Þ ¼ b
ffiffið
pDÞKI=P, where KI = stress intensity factor, P = load; g0(a0) = dg(a0)/da0;
Gf = initial fracture energy = area under the initial tangent of the cohesive softening stress-separation law; E0 = E = Young’s mod-ulus for plane stress and E0 = E/(1 � m2) for plane strain (where m = Poisson ratio), and cf = characteristic length which representsabout a half of the FPZ length and is proportional to Irwin’s [10] characteristic length l0 = E Gf/f0t2 [10].
Note that the LEFM function g(a0) or k(a0) embodies information on the crack length effect and on the effect of structuregeometry (or shape). Thus Eq. (3) is actually a size-shape effect law for Type 2 failures.
The Type 1 size effect is observed in structures failing as soon as the macro-crack initiates from a smooth surface. In thiscase, the asymptotic large-size slope of the log–log size effect curve is, according to the cohesive crack model or nonlocaldamage model, a horizontal line, provided that the Weibull statistical size effect is unimportant, which is the case for thethree-point bend beams and is one reason for their selection.
Why is it unimportant?—Because the zone of high stress is here relatively concentrated, even in absence of a notch, andthis greatly restricts the chance for a critical crack to form at different locations of random strength. However, when the zoneof high stress is large, as in four-point bending and even more in direct tension specimens, the statistical size effect is notnegligible, and becomes important for large-sizes. Then the large size asymptote for Type 1 size effect is, in the log–log plot,a downward inclined straight line of a slope�n/m which is much milder than the slope �1/2 for LEFM [11,12]; here m = Wei-bull modulus (typically 24) and n = number of spatial dimensions of fracture growth (usually 2).
According to the cohesive crack model, the small-size asymptote must be a horizontal line and, for medium sizes, the sizeeffect is a transition between this and the large-size asymptote (power laws). This is the so-called ‘Type 1’ size effect. It hastwo forms depending on whether or not the asymptotic Weibull statistical size effect is significant: [6]:
rN ¼ f1rls
ls þ D
� �rn=m
þ rDb
Dþ lp
" #1=r
ðwith WeibullÞ ð4Þ
rN ¼ f1r 1þ rDb
Dþ lp
� �1=r
ðwithout WeibullÞ ð5Þ
Here fr,1, Db, lp, ls and r are empirical constants to be determined from tests; Db = depth of the boundary layer of cracking(roughly equal to the FPZ size), fr,1 = nominal strength for very large structures (assuming no Weibull statistical size effects),ls = statistical characteristic length, and lp = material characteristic length that is related to the maximum aggregate size.Introducing lp is necessary for mathematical reasons, as a means to satisfy the asymptotic requirement of the cohesive crackmodel to have a finite plastic limit for D ? 0 while ensuring the effect of lp to be negligible for D� lp. Note that lp differs fromIrwin’s characteristic length l0 ¼ EGf =f 2
t [10], which characterizes the length of the fracture process in the direction ofpropagation.
When the crack at failure is neither negligible nor large, the size effect trend is expected to be some sort of a transitionbetween the Types 1 and 2. To clarify this transition and thus obtain a combined, or ‘universal’, size-shape effect law is onekey objective of the comprehensive tests. In absence of test data, such a universal law was attempted purely theoretically in[13,14]. These formulations as well as a new ’universal’ size-shape effect law are discussed in [3].
C.G. Hoover, Z.P. Bazant / Engineering Fracture Mechanics 110 (2013) 281–289 283
Better understanding of the effects of structure size on the load capacity will improve the design of concrete structures.The present analysis of the comprehensive fracture tests will advance this objective.
2. Determination of fracture parameters and fitting by size effect law
One advantageous feature of the Type 2 size effect tests is that the measured nominal strength values make it possibledetermine the initial fracture energy Gf and the material characteristic length cf. Setting Eq. (2) equal to (3), one can expressthe fracture parameters in terms of the size effect parameters B, f0t, D0 and the LEFM function g(a0);
Table 1Statistic
MeaStanCoVLoweUppeg (a0
g0 (aGf (Ncf (mCoV
Gf ¼ðBf 0tÞ
2D0gða0ÞE0
; cf ¼D0gða0Þg0ða0Þ
ð6Þ
For notched three-point bend beams [15–19],
gða0Þ ¼ k2ða0Þ; kða0Þ ¼pD=Sða0Þ
ffiffiffiffiffia0p
ð1þ 2a0Þð1� a0Þ3=2 ð7Þ
For function pS/D(a0), Pastor [20] developed the following interpolation formula applicable to an arbitrary ratio of beamdepth D to span S (i.e., the distance between support resultants):
pS=Dða0Þ ¼ p1ða0Þ þ ð4D=SÞ½p4ða0Þ � p1ða0Þ� ð8Þ
where
p4ða0Þ ¼ 1:9� ða0Þ½�0:089þ 0:603ð1� a0Þ � 0:441ð1� a0Þ2 þ 1:223ð1� a0Þ3� ð9Þ
p1ða0Þ ¼ 1:989� ða0Þð1� a0Þ½0:448� 0:458ð1� a0Þ þ 1:226ð1� a0Þ2� ð10Þ
For the present tests S/D = 2.176, which gives g (a0) and g0(a0); see Table 1. Eq. (2) was fitted to the mean of each family ofbeams, using the trust-region-reflective optimization algorithm [8,9], with a a0 = 0.3 and a0 = 0.15, Gf and cf were then cal-culated using Eq. (6). This procedure was repeated by applying weights wi ¼ r�2
i =PN
i¼1r�2i , representing the inverse variance
of each beam family normalized with the sum of the inverse variances for all N families (N = 4), to the means of each beamfamily. In all cases, this weighting gave worse CoV of curve fit (defined as the root-mean-square of errors divided by datamean) than the unweighted means. The statistics of the unweighted fittings, Gf, cf and the CoV of curve fit, calculated fromboth relative notch depths are shown in Table (1). The fracture energy Gf from both relative notch depths are essentiallyidentical and the cf-values are also very close, suggesting that this procedure is valid for determining Gf and cf fora0 P 0.15. The strengths determined from the tests of crack initiation specimens were fitted using Eq. (5), and the resultingparameters are: Db = 2.88 in. (73.2 mm), lp = 4.98 in. (126.6 mm), fr,1 = 765 psi (5.27 MPa) and r = 0.52. The CoV of fit is 1.91%.The crack initiation data was also fit by applying weights wi, but the CoV was higher than the fit without weights.
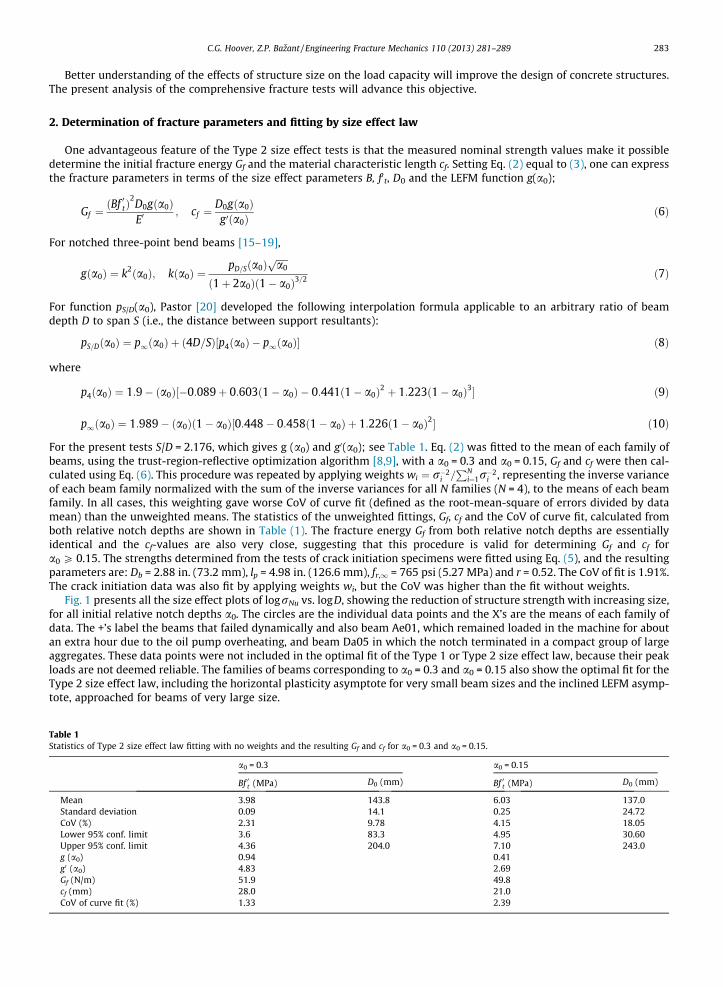
Fig. 1 presents all the size effect plots of logrNu vs. logD, showing the reduction of structure strength with increasing size,for all initial relative notch depths a0. The circles are the individual data points and the X’s are the means of each family ofdata. The +’s label the beams that failed dynamically and also beam Ae01, which remained loaded in the machine for aboutan extra hour due to the oil pump overheating, and beam Da05 in which the notch terminated in a compact group of largeaggregates. These data points were not included in the optimal fit of the Type 1 or Type 2 size effect law, because their peakloads are not deemed reliable. The families of beams corresponding to a0 = 0.3 and a0 = 0.15 also show the optimal fit for theType 2 size effect law, including the horizontal plasticity asymptote for very small beam sizes and the inclined LEFM asymp-tote, approached for beams of very large size.
s of Type 2 size effect law fitting with no weights and the resulting Gf and cf for a0 = 0.3 and a0 = 0.15.
a0 = 0.3 a0 = 0.15
Bf 0t (MPa) D0 (mm) Bf 0t (MPa) D0 (mm)
n 3.98 143.8 6.03 137.0dard deviation 0.09 14.1 0.25 24.72(%) 2.31 9.78 4.15 18.05r 95% conf. limit 3.6 83.3 4.95 30.60r 95% conf. limit 4.36 204.0 7.10 243.0) 0.94 0.410) 4.83 2.69/m) 51.9 49.8m) 28.0 21.0of curve fit (%) 1.33 2.39
log (D)
log
(σ)
Nlo
g (σ
)N
log
(σ)
N
log (D) log (D)
1 1.5 2 2.5 30.2
0.25
0.3
0.35
0.4
0.45
0.5
0.55
0.6
0.65
0.7
Bft
= 0.3
21
1 1.5 2 2.5 30.4
0.45
0.5
0.55
0.6
0.65
0.7
0.75
0.8 Bft
2
1
= 0.15
1 1.5 2 2.5 30.4
0.5
0.6
0.7
0.8
0.9
1
21
= 0.025
1 1.5 2 2.5 30.65
0.7
0.75
0.8
0.85
0.9
0.95
1
= 0
1 1.5 2 2.5 30.4
0.45
0.5
0.55
0.6
0.65
0.7
0.75
0.8
0.85
0.9
2
1
= 0.075
Fig. 1. Size effect curves for all notch depths.
284 C.G. Hoover, Z.P. Bazant / Engineering Fracture Mechanics 110 (2013) 281–289
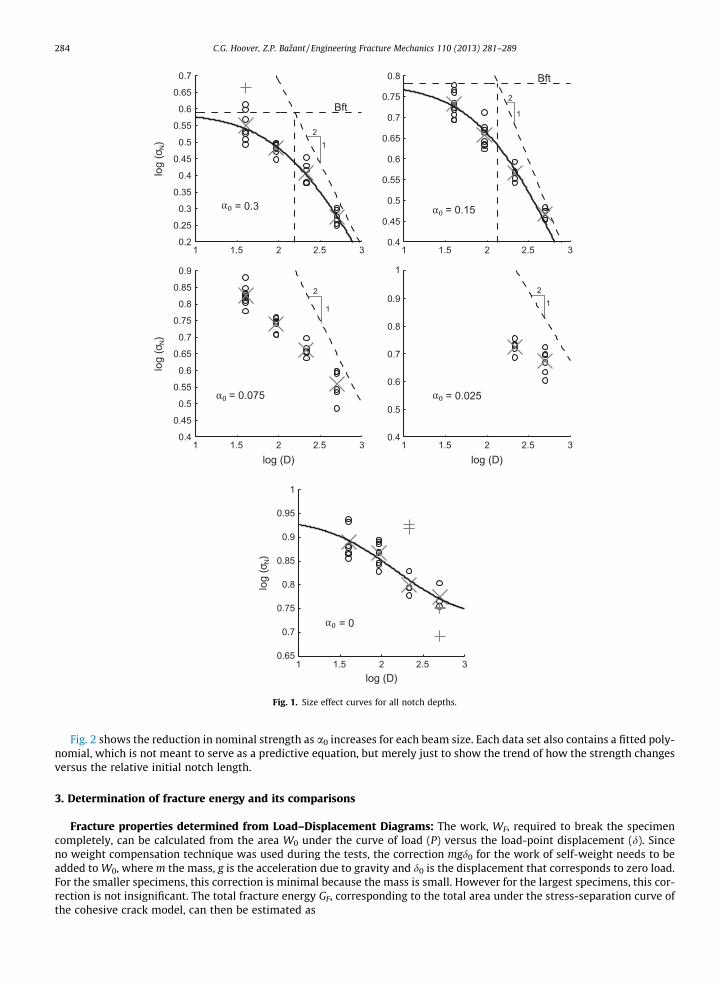
Fig. 2 shows the reduction in nominal strength as a0 increases for each beam size. Each data set also contains a fitted poly-nomial, which is not meant to serve as a predictive equation, but merely just to show the trend of how the strength changesversus the relative initial notch length.
3. Determination of fracture energy and its comparisons
Fracture properties determined from Load–Displacement Diagrams: The work, WF, required to break the specimencompletely, can be calculated from the area W0 under the curve of load (P) versus the load-point displacement (d). Sinceno weight compensation technique was used during the tests, the correction mgd0 for the work of self-weight needs to beadded to W0, where m the mass, g is the acceleration due to gravity and d0 is the displacement that corresponds to zero load.For the smaller specimens, this correction is minimal because the mass is small. However for the largest specimens, this cor-rection is not insignificant. The total fracture energy GF, corresponding to the total area under the stress-separation curve ofthe cohesive crack model, can then be estimated as
0 0.05 0.1 0.15 0.2 0.25 0.31
2
3
4
5
6
7
Depth is 500 mm
0 0.05 0.1 0.15 0.2 0.25 0.32
2.5
3
3.5
4
4.5
5
5.5
6
6.5
7
Depth is 215 mm
0 0.05 0.1 0.15 0.2 0.25 0.32
3
4
5
6
7
8
Depth is 93 mm
0 0.05 0.1 0.15 0.2 0.25 0.32
3
4
5
6
7
8
9
Depth is 40 mm
log
(σ) N
log
(σ) N
Fig. 2. Crack length effect curves.
Fig. 3. Shifted load vs load point Disp with fitted extrapolation function.
Table 2Comparison of Gf, GF and cf calculated from different methods.
a0 Type 2 SEL fit Area under Pd curve Prediction Eq’s
0.3 0.15 0.3 0.15
Mean CoV (%) Mean CoV (%)
Gf (N/m) 51.87 49.78 46.07a 31.75a 50.68 24.1 37.45 [24] 56.09 [26]GF (N/m) – – 96.94 16.88 111.09 20.72 93.63 [24] 85.37 [25]cf (mm) 27.97 20.99 – – – – 2.83 [24] 12.54 [26]
a If the two questionable values are removed from the analysis, then the mean Gf = 42.55 (N/m) and the CoV = 15.75%.
C.G. Hoover, Z.P. Bazant / Engineering Fracture Mechanics 110 (2013) 281–289 285
0 0.05 0.10
0.5
1
1.5BeamDa08
0 0.05 0.10
1
2BeamDa05
0 0.05 0.10
0.5
1
1.5
2 BeamDa06
0 0.10
0.5
1
1.5
2 BeamDa07
0 0.05 0.10
0.5
1
1.5BeamDa03
0 0.05 0.10
0.5
1
1.5BeamDa04
0 0.050
0.5
1
1.5
2 BeamDa01
0 0.10
0.5
1
1.5BeamDa02
0 0.10
1
2
3BeamCa06
0 0.1 0.20
1
2
3
4 BeamCa07
0 0.05 0.10
1
2
3
4 BeamCa08
0 0.10
1
2
3
4 BeamCa04
0 0.05 0.10
1
2
3
4 BeamCa05
0 0.1 0.20
1
2
3BeamCa01
0 0.05 0.10
1
2
3
4 BeamCa02
0 0.10
1
2
3BeamCa03
0 0.10
2
4
6
8 BeamBa04
0 0.1 0.20
2
4
6 BeamBa05
0 0.10
2
4
6 BeamBa06
0 0.1 0.20
2
4
6 BeamBa01
0 0.1 0.20
2
4
6BeamBa02
0 0.10
2
4
6BeamBa03
0 0.1 0.20
5
10 BeamAa04
0 0.1 0.20
5
10 BeamAa05
0 0.20
5
10BeamAa06
0 0.20
5
10BeamAa01
0 0.1 0.20
5
10
BeamAa03
0 0.50
5
10 BeamAa02
Vertical Displacement (mm)
Forc
e (k
N)
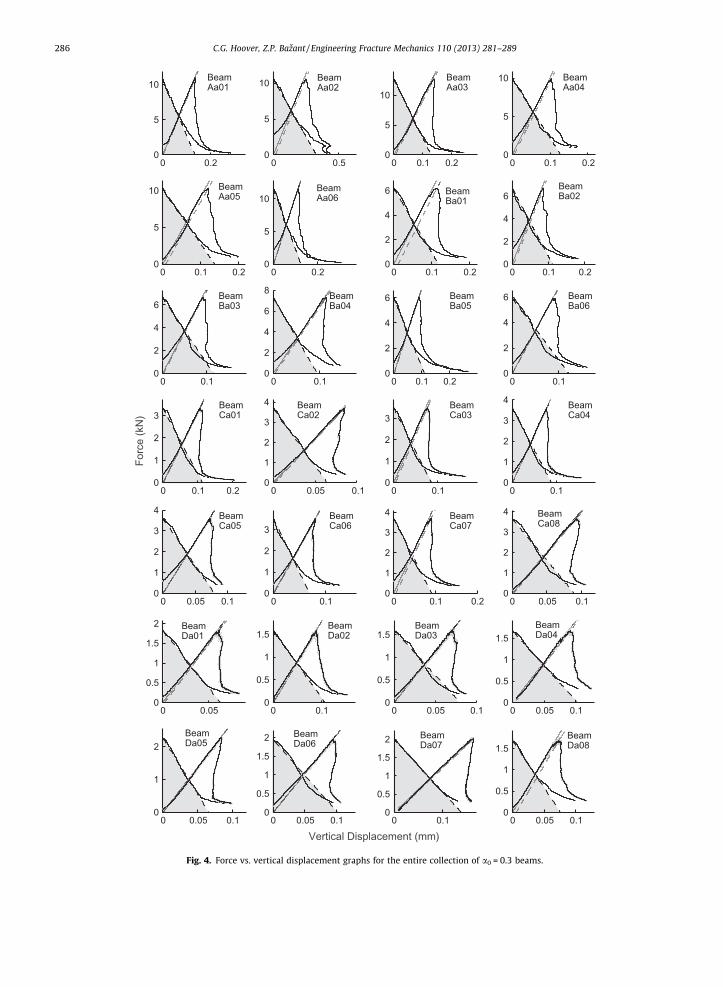
Fig. 4. Force vs. vertical displacement graphs for the entire collection of a0 = 0.3 beams.
286 C.G. Hoover, Z.P. Bazant / Engineering Fracture Mechanics 110 (2013) 281–289
C.G. Hoover, Z.P. Bazant / Engineering Fracture Mechanics 110 (2013) 281–289 287
GF ¼WF
bDð1� a0Þð11Þ
where WF = W0 + mgd0. This estimate was proposed for concrete (under the name of fictitious crack model) by Hillerborget al. [21] (following similar proposals for ceramics [22,23]) and is enshrined in a RILEM international recommendation [27].
Eq. (11) is only approximate. The main source of error is that, near the notch tip (and also near the end of the ligament),the energy to create the crack is not the same as it is in stationary propagation (the stationarity is required for GF to be equalto the J-integral). Also, the measured coefficient of variation (CoV) of scatter of GF is only slightly larger than that of Gf. Thisobservation apparently differs from the conclusion in [24], in which the CoV of scatter of GF was found to be more than twiceas large, but that work dealt with the scatter of combined data from many different concretes while the present study dealswith one concrete only.
According to the RILEM recommendation [21], WF is the area under the complete diagram of load versus load-point dis-placement. The diagram must include the effects of self-weight. The vertical displacement of the beams relative to the test-ing bed were recorded by two LVDT’s, one on each side of every beam. The effect of self-weight was added and thecompliances of the support fixtures were subtracted in calculating each of these load–displacement diagrams. Becausethe initial increase of slope of the diagram can be caused only by the closing of voids or gaps in the seating of supports, astraight elastic line was drawn through the linear portion of the rising load–displacement diagram and was then extendeddown to the x-axis. The entire diagram was then shifted to the left so that this elastic line would intersect the origin. All thediagrams for beams with a0 = 0.3 and a0 = 0.15 were generated in this manner.
GF can be accurately determined only when the load softens down to zero. This is usually difficult to achieve becauseeither the test would have to run for a very long time or the measured reaction force would become indiscernible fromthe inherent noise in the testing machine.
Since the measured softening curve does not extend to zero stress, it must be extrapolated. The extrapolation is assumedto be an exponential decay function Y = Ae�Bx, which is integrable up to1; Y = force, x = vertical displacement of beam, and A,B = constants to be calibrated by fitting the lower portion of the softening load–displacement diagram.
A snapback (i.e., postpeak response in which the slope reverts to positive) was observed in many of the diagrams of loadversus load-point displacement; see the right curve in Fig. 3. The total area enclosed between such diagram and the displace-ment axis is the dissipated energy. The area does not change by conversion to a diagram in which the elastic displacement issubtracted (or filtered out) from the total displacement, which may be more convenient for calculation (Fig. 3). This area hasbeen accurately evaluated using the trapezoidal rule. Eq. (11) has then been used to calculate GF for each beam; see Table 2.
The initial fracture energy Gf has also been determined from the diagram of the load versus the load-point displacement.Once the diagram of the load versus the LVDT displacement has been re-drawn, the initial steeply descending nearly straightpart of the softening diagram was approximated in the least-square sense by the thick dashed straight line emanating fromthe initial peak, as shown in Fig. 4. The shaded area under this line, augmented by the effect of self-weight and divided by theaverage cross sectional area of the beam, represents the initial fracture energy, Gf. The overall mean and CoV for Gf and GF
have then been calculated for all the beams with a0 = 0.30 and a0 = 0.15. The results are shown in Table 2.The statistics are significantly altered by beams Aa05 and Da07 Fig. 4, which are outliers exhibiting a much milder soft-
ening slope. They yield a Gf that is almost the double of the Gf value calculated from other beams of the same geometry. Thesetwo beams significantly increase the CoV and to a lesser extent also the mean Gf. However, no reason is seen for excludingthese two beams as defective outliers, and so they have been retained in the statistics.
4. Summary and conclusions
1. Stable post-peak load–deflection diagrams with softening down to 90% and in some cases by more than 95% of peak havebeen achieved. This allows a reliable estimation of the entire tail of the load–deflection diagram.
2. The nominal strengths rN of beams with relative notch depths a = 0.30 and 0.15 can each be fitted closely by Bazant’sType 2 size effect law (Eqs. (2) and (3)).
3. The nonlinear regressions of the logarithm of the mean of measured rN for each size versus logD, conducted separately for0.30 and 0.15, give relatively small CoV (root-mean-square of errors divided by data mean), as low as 2.39% as seen inTable 1. A nonlinear regression of these results, run jointly for a = 0.30 and 0.15 (with different g0 and g00 for each), givesa CoV of 4.0%, Gf = 0.28 lb/in. (Gf = 49.6 N/m) and cf = 0.88 in. (22.34 mm). It has been checked that applying weightswi ¼ r�2
i =PN
i¼1r�2i , gives Gf = 0.32 lb/in. (56.25 N/m) and cf = 1.17 in. (29.79 mm) but a CoV of 5.45%.
4. The measured data for beams with no notch (a = 0) agree well with the Type 1 size effect law (Eqs. (4 and 5)).5. The values of initial fracture energy Gf calculated from the area under the initial steep segment of the measured cohesive
softening curve match closely the Gf values obtained from the size effect, both for a = 0.30 and 0.15. This validates theconcept of a bilinear softening law.
6. For the present concrete, the measured total-to-initial fracture energy ratio, GF/Gf, is about 2.7. The measured data on nominal strength rN versus loga document a smooth transition from deep notches with a = 0.30 to
the case of zero notch. This observed transition deviates significantly from the curve assumed by Hu and Duan. [28–33],as shown in [34,35].
288 C.G. Hoover, Z.P. Bazant / Engineering Fracture Mechanics 110 (2013) 281–289
8. A notch of relative depth 0.15 used to be considered too shallow for fracture tests, but here the results are almost as goodas for depth 0.30.
9. For the present concrete, the empirical equations of Becq-Giraudon [24] and Bazant and Oh [26] give better predictions ofGF and Gf than does the CEB equation [25].
Acknowledgments
Financial support from the U.S. Department of Transportation, provided through Grant 20778 from the InfrastructureTechnology Institute of Northwestern University, is gratefully appreciated. Additional support for analysis was providedby NSF grant CMMI-1129449 to Northwestern University.
Appendix A. Empirical prediction of fracture parameters from concrete strength and composition
There has been a great desire to predict the fracture energy and characteristic length from concrete strength and mixparameters, but only very crude empirical formulas have been identified, as follows:
Gf ¼ a0f 0c
0:051
� �0:46
1þ da
11:27
� �0:22 wc
� ��0:3¼ 0:21 lb=in: ð37:45 N=mÞ ½24� ð12Þ
GF ¼ 2:5a0f 0c
0:051
� �0:46
1þ da
11:27
� �0:22 wc
� ��0:3¼ 0:53 lb=in: ð93:63 N=mÞ ½24� ð13Þ
cf ¼ exp c0f 0c
0:022
� ��0:019
1þ da
11:27
� �0:72 wc
� �0:2" #
¼ 0:11 in: ð2:83 mmÞ ½24� ð14Þ
Gf ¼ 2:72þ 0:0214f 0t
f 0t2 da
E
� �¼ 0:32 lb=in: ð56:09 N=mÞ ½26� ð15Þ
cf ¼ 1:811þ 0:0143f 0t ¼ 0:49 in: ð12:5 mmÞ ½26� ð16Þ
GF ¼ 0:0469d2a � 0:5da þ 26
� � f 0c10
� �0:7
¼ 0:49 lb=in: ð85:37 N=mÞ ½25� ð17Þ
where w/c is the water–cement ratio by weight, f 0c and f 0t are the compressive strength and tensile strength of the concrete, da
is the coarse aggregate diameter, c0 = a = 1 and E is Young’s modulus. Although a proper statistical evaluation of these for-mulas requires considering many different concretes (as done in [24]), it may be of interest to check the error of these for-mulas for the present concrete. The results, given in Table 2, show that the estimates are all quite poor, although the Gf from[26] and GF from [24] are relatively best.
References
[1] Hoover CG, Bazant ZP, Vorel J, Wendner R, Hubler MH. Comprehensive concrete fracture tests: description and results. Engng Fract Mech 2013. http://dx.doi.org/10.1016/j.engfracmech.2013.08.007.
[2] Hoover CG, Bazant ZP, Wendner R, Vorel J, Hubler MH, Kim K, et al. Experimental investigation of transitional size effect and crack length effect inconcrete fracture. In: Life-Cycle and sustainability of civil infrastructure systems: Proceedings of the 3rd International Symposium on Life-Cycle CivilEngineering (IALCCE), October 3–6, Hofburg Palace: Vienna Austria; 2012 [in press].
[3] Hoover CG, Bazant ZP. Universal size-shape effect law based on comprehensive concrete fracture tests. J Engng Mech 2012, [in press].[4] Bazant ZP, Planas J. Fracture and size effect in concrete and other quasibrittle materials. CRC Press; 1998.[5] Bazant ZP. Size effect in blunt fracture: concrete, rock, metal. ASCE J Engng Mech 1984;110(4):518–35.[6] Bazant ZP. Scaling of structural strength. Massachusetts: Elsevier Butterworth-Heinemann; 2005.[7] Bazant ZP, Kazemi MT. Size dependence of concrete fracture energy determined by RILEM work-of-fracture method. Int J Fracture 1991;51:121–38.[8] Coleman TF, Li Y. On the convergence of reflective Newton methods for large-scale nonlinear minimization subject to bounds. Math Program
1994;67(2):189–224.[9] Coleman TF, Li Y. An interior trust region approach for nonlinear minimization subject to bounds. SIAM J Optim 1996;6:418–45.
[10] Irwin GR. Fracture. Handbuch Phys 1958;6:551–90 (S. FlÃgge, ed., Springer, Berlin).[11] Weibull W. The phenomenon of rupture in solids proc. Roy Swed Inst Engng Res 1939;153:1–55. Ingenioersvetenskaps Akad. Handl., Stockholm.[12] Weibull W. A Statistical Distribution Function of Wide Applicability. J. Appl. Mech 1954;18:293–7.[13] Bazant ZP, Yu Q. Size effect in concrete specimens and structures: new problems and progress. fracture mechanics of concrete structures. In: Li VC,
Leung KY, Willam KJ, Billington SL, editors. Proc., FraMCoS-5, 5th int. conf. on fracture mech. of concrete and concr. structures, Vail, Colo., vol. 1, IA-FraMCoS; 2004. p. 153–62.
[14] Bazant ZP, Yu Q. Universal size effect law and effect of crack depth on quasi-brittle structure strength. J Engng Mech 2009;135(2):78–84.[15] Tada H, Paris PC, Irwin GR. The stress analysis of cracks handbook. 2nd ed. MO: Paris Productions Inc.; 1985.[16] Srawley JE. Wide range stress intensity factor expressions for ASTM e 399 standard fracture toughness specimens. Int J Fracture 1976;12:475–6.[17] Murakami Y. Stress intensity factors handbook. New York: Pergamon; 1987.[18] Broeck D. The practical use of fracture mechanics. Dordrecht, The Netherlands: Kluwer; 1988.
C.G. Hoover, Z.P. Bazant / Engineering Fracture Mechanics 110 (2013) 281–289 289
[19] Kanninen MF, Popelar CH. Advanced fracture mechanics. New York: Oxford University Press; 1985.[20] Elices M, Pastor JY, Guinea G. Nueva expresión del factor de intensidad de tensiones para la probeta de flexión en tres puntos. Anal Mecán Fract
1995;12:85–90.[21] Hillerborg A. The theoretical basis of a method to determine the fracture GF of concrete. Mater Struct 1985;18:291–6.[22] Nakayama J. Direct measurement of fracture energies of brittle heterogeneous material. J Am Ceram Soc 1965;48(11):583.[23] Tattersall HG, Tappin G. The work of fracture and its measurement in metals ceramics and other materials. J Mater Sci 1996;1(3):296–301.[24] Bazant ZP, Becq-Giraudon E. Statistical prediction of fracture parameters of concrete and implications for choice of testing standard. Cem Concr Res
2002;32(4):529–56.[25] Comite Euro-International du Beton CEB-FIP Model Code; 1991.[26] Bazant ZP, Oh BH. Crack band theory for fracture of concrete. Mater Struct 1983;16:155–77.[27] RILEM. Determination of the fracture energy of mortar and concrete by means of three-point bend tests on notched beams. Mater Struct 1985;18:285–
90.[28] Duan K, Hu X, Wittmann F. Scaling of quasi-brittle fracture: boundary and size effect. Mech Mater 2006;38:128–41.[29] Hu X. An asymptotic approach to size effect on fracture toughness and fracture energy of composites. Engng Fract Mech 2002;69:555–64.[30] Hu X, Duan K. Size effect: influence of proximity of fracture process zone to specimen boundary. Engng Fract Mech 2007;74:1093–100.[31] Hu X, Duan K. Size effect and quasi-brittle fracture: the role of FPZ. Int J Fract 2008;154:3–14.[32] Hu X, Duan K. Mechanism behind the size effect phenomenon. J Engng Mech 2010;136(1):60–8.[33] Hu X, Wittmann F. Size effect on toughness induced by crack close to free surface. Engng Fract Mech 2000;65:209–21.[34] Yu Q, Le JL, Hoover CG, Bazant ZP. Problems with Hu-Duan boundary effect model and its comparison to size-shape effect law for quasibrittle fracture. J
Engng Mech 2010;136(1):40–50.[35] Hoover CG, Bazant ZP. Comparison of Hu-Duan Boundary Effect Model to Size-Shape Effect Law for Quasibrittle Fracture Based on New Comprehensive
Fracture Tests. J. Engng. Mech, [in press].
![Engineering Fracture Mechanics · 2020. 6. 2. · lems, including: the crack growth with frictional contact [33], cohesive crack propagation [34–36], stationary and growing cracks](https://img.pdfslide.us/doc/110x75/60cb969feb2e1a3a012238f6/engineering-fracture-mechanics-2020-6-2-lems-including-the-crack-growth-with.jpg)