Embed Size (px)
Citation preview

Engineering Fracture Mechanics 104 (2013) 140–161
Contents lists available at SciVerse ScienceDirect
Engineering Fracture Mechanics
journal homepage: www.elsevier .com/locate /engfracmech
Crack initiation and fracture toughness of random Voronoihoneycombs
0013-7944/$ - see front matter � 2013 Elsevier Ltd. All rights reserved.http://dx.doi.org/10.1016/j.engfracmech.2013.03.017
⇑ Corresponding author. Tel.: +44 (0)20 7679 3754; fax: +44 (0)20 7388 0180.E-mail address: [email protected] (P.J. Tan).
I. Christodoulou, P.J. Tan ⇑Department of Mechanical Engineering, University College London, Torrington Place, London WC1E 7JE, UK
a r t i c l e i n f o a b s t r a c t
Article history:Received 12 April 2012Received in revised form 20 March 2013Accepted 20 March 2013Available online 2 April 2013
Keywords:Fracture toughnessVoronoiT-stressFinite elementsCellular solidsMode-mixity
The competing effects of cell-regularity and relative density upon the toughness of Voronoihoneycombs are investigated for different loading modes using finite elements. Mode Itoughness is shown to be the more sensitive to microstructural variations than mode IIalthough both retain a strong quadratic dependence upon relative density. Crack initiationis shown to occur at up to six cells from the crack-tip in regions of high localised strain and/or high strain gradient. The inclusion of T-stress dramatically changes the location of liga-ment fracture and the normalised effective toughness of a lattice. Ligament fracture is pre-dominantly due to bending.
� 2013 Elsevier Ltd. All rights reserved.
1. Introduction
The increased fracture risk for patients with osteoporosis is attributed to a reduction in the mass of bone, or relative den-sity qð� q�=qs where q⁄ and qs are the densities of the bone and cell wall material, respectively) [1–3]. This can be predictedby measuring the amount of bone loss in a non-invasive, dual energy X-ray absorptiometry (DEXA) scan. It is also widelysuspected that variations in cell architecture, too, have an effect upon the fracture toughness of trabecular bones [3,4]. Re-cent studies on the defect tolerance of periodic two-dimensional (2D) and three-dimensional (3D) lattice materials have re-vealed that their fracture toughness is sensitive to random dispersion of the wall vertices of their corresponding perfectlattice; the knockdown in toughness depends on the cell morphology [5–7]. But it remains unclear whether the same mightbe observed in lattices with non-periodic cells where its macroscopic response is dominated by the bending deformation atthe cell scale. The aim of the present study, which is part of a wider investigation into the osteoporotic fracture risks of tra-becular bones, is to clarify how the competing influences of relative density and architectural variations affect the fracturetoughness of cellular solids with a non-periodic cell morphology; an understanding of this has relevance to biomedical appli-cations [1,3,4].
It is well-known that the mode I toughness (KIC) of a perfect, elastic-brittle, hexagonal honeycomb scales with relativedensity q, the characteristic length of the cell l and the fracture strength of the cell wall material rf in accordance to
K IC ¼ Dqdrf
ffiffilp: ð1Þ
Eq. (1) assumes that crack advancement occurs when the cell wall immediately ahead of the crack-tip fractures and is validfor any crack length greater than seven-cells [1,8,9]. For periodic 2D lattices, it was shown in [5,6] that the severity of imper-

Nomenclature
A lattice areaB stress biaxiality ratioEs, E⁄ elastic modulus of cell wall material and honeycombGs, G⁄ shear modulus of cell wall material and honeycombG energy release rateI isotropy parameterKI, KII mode I and II stress intensity factor (SIF)KIC, KIIC mode I and II fracture toughnessKeff, Keff,C effective and critical effective stress intensity factorl, l characteristic and average cell wall lengthM mode-mixity parameterm number of cells in a honeycombr distance from crack tipT T-stresst cell wall thicknessUb, Ua, Us strain energy due to bending, axial stretch and shearu1, u2 displacement in the x1 and x2 directionsx1, x2 cartesian coordinates with origin centred at crack tipa crack length�ij straing ratio of bending to total strain energyh polar angleK cell-regularity parameterm⁄ Poisson’s ratio of honeycombq relative densityqs, q⁄ density of cell wall and lattice materialrf tensile fracture strength of cell wallrij stressrmax maximum tensile stress in an element
Sub/superscriptss material properties of cell wall⁄ elastic in-plane properties of honeycombps plane strain properties
I. Christodoulou, P.J. Tan / Engineering Fracture Mechanics 104 (2013) 140–161 141
fections and loading mode influence the pre-exponent D whilst the exponent d depends on the dominant mode of deforma-tion at the cell scale; Fleck and Qiu [5] found that d=1 and d=0.5 for perfect triangular and Kagome lattices, respectively. Thesame form of scaling law also applies to periodic 3D lattices [7]. However, the toughness of these perfect lattices are highlysensitive to imperfections in their microstructure; for example, misalignment of wall vertices in a regular hexagonal honey-comb can lead to a knockdown in its mode I toughness KIC by up to 40% [6]. By contrast, cellular solids with a non-periodiccell morphology, such as trabecular bones or stochastic foams, deform primarily by cell wall bending. Consequently, theirmode I toughness KIC is anticipated to scale with q2 although it is unclear to what extent increasing cell irregularity affectsthe pre-exponent D under different loading modes. Also, the effects of cell regularity upon the location of fracture initiationand the influence of T-stress upon their effective toughness have not previously been studied and are not well understood;these will be investigated here.
The focus of this paper will be on random 2D lattices generated by a Voronoi construction. Whilst it is recognised that thecell walls in trabecular bones follow the trajectories of principal stresses and it is the mechanical efficiency that shapes itsstructure [1], a Voronoi lattice has alluring micro-architectural features reminiscent of those seen in real bones. It is easilygenerated and deforms primarily by cell wall bending when loaded; this is why a Voronoi construct is widely used as a 2Drepresentation of the non-periodic cell microarchitecture of natural cellular solids [1,10–13]. Moreover, the regularity of itscells can be controlled through a non-dimensional parameter, to be introduced in the following section, which would allowthe competing roles of relative density loss and microstructural deterioration to be investigated. Therefore, 2D Voronoi lat-tices will be studied here to gain insights into the fracture response of natural cellular solids, such as trabecular bones.
This paper considers the asymptotic problem of an elastic-brittle Voronoi lattice (of relative density 0:001 6 q 6 0:3) con-taining a long, plane-strain crack subject to a displacement field, associated with the macroscopic K-field of linear elasticfracture mechanics (LEFM), which is applied at the remote boundary of the lattice. The regularity of the cells within the lat-tice is controlled by a non-dimensional scalar measure K which places a constraint on the minimum cell size and the spreadof the cell size distribution. This approach allows the response of lattices with different cell regularity, but of identical

142 I. Christodoulou, P.J. Tan / Engineering Fracture Mechanics 104 (2013) 140–161
relative density, to be compared. The aim is to quantify the sensitivity of the macroscopic lattice toughness in different load-ing modes and the location of fracture initiation to the different competing influences of cell-regularity K and relative den-sity q. The effects of T-stress (the non-singular stress parallel to the crack plane) to the above are also investigated.
This paper is structured as follows. Section 2 introduces a non-dimensional scalar measure K to generate d- and C-Voro-noi honeycombs of varying cell-regularity. Their in-plane elastic properties are first obtained and the assumption of isotropyassessed. Macroscopic fracture toughness of the 2D lattices are presented in Section 3 and the effects of mode mixity uponthe location of fracture initiation is explored for different K. The effects due to T-stress inclusion are explored in Section 4.Section 5 presents fracture map that shows the location of fracture initiation for different realisations of lattices with thesame regularity. Finally, in Section 6, continuous strain maps are generated to elucidate the deformations in regular and ran-dom lattices for different combinations of mode mixity and T-stress.
2. Voronoi lattices and their in-plane elastic properties
2.1. Definition of cell regularity
Denote the Euclidean distance between any two points p and q in 2D space by distðp; qÞ �ffiffiffiffiffiffiffiffiffiffiffiffiffiffiffiffiffiffiffiffiffiffiffiffiffiffiffiffiffiffiffiffiffiffiffiffiffiffiffiffiffiffiffiffiffiffiffiffiffixp
1 � xq1
� �2 þ xp2 � xq
2
� �2q
and letP :¼ {p1, p2, . . . , pm} be a set of m distinct random points on a plane (the domain), referred to hereinafter as nuclei, wheredist(pi,pj) – 0"i – j. If the plane is subdivided into m number of cells, one for each nuclei in the set P, according to the assign-ment rule where a point q in the cell corresponding to a nuclei pi if and only if dist(q,pi) < dist(q,pj) for each pj 2 P with j – i,the resulting 2D lattice is commonly known as a Voronoi honeycomb [1,14]. This assignment model places no constraint onthe final cell shape and size, or its distribution, and assumes that all cells nucleate at the same time and grow at the samelinear growth rate. If, however, a constraint is imposed on the minimum distance dmin between any two nuclei in P, i.e.dist(pi,pj) P dmin"i – j, this would generate a Voronoi honeycomb with greater cell regularity [1].
A regular hexagonal lattice is a special case of a Voronoi honeycomb if each nuclei in the set P is always surrounded by siximmediate neighbours, all separated by an equal distance of
d0 ¼
ffiffiffiffiffiffiffiffiffiffiffi2A
mffiffiffi3p
sð2Þ
and at equal angles of 60� from one another. In other words, the m nuclei are arranged in a regular hexagonal configurationseparated by equidistant d0 within the planar area A. Following Zhu et al. [15], a non-dimensional constant
K � dmin
d0ð3Þ
defined on the interval (0,1], hereinafter referred to as a cell-regularity parameter, is introduced as a scalar measure to de-scribe, an otherwise, randomly generated 2D Voronoi lattice. The two limiting cases of K ? 0+ and K = 1 correspond to whenthere is no minimum imposed distance between any two nuclei in the set P, resulting in a completely random C-Voronoihoneycomb, and one where there is a maximum imposed distance, resulting in a regular hexagonal honeycomb, respectively.
Fig. 1 shows Voronoi lattices for a range of K, generated using the assignment model described above. It is also worthnoting that all the cells in a 2D Voronoi lattice, regardless of regularity, are always convex which is unlike those generatedby random cell node perturbation of a regular lattice, such as that used by Romijn and Fleck [6]. The introduction of K pro-vides a useful means by which to control the cell-regularity in a random 2D lattice, allowing a systematic investigation intothe effects of cell-regularity on the macroscopic toughness of the lattices. It must, however, be acknowledged that the cellshape in trabecular bones, which is the motivation behind this study, is controlled by other criteria different to the one here[1]. Notwithstanding, the study of 2D Voronoi lattices is a useful first step to elucidate the effects of cell-regularity upon thetoughness of more complicated 3D lattices with convex cells.
2.2. Relative density
The relative density of the Voronoi lattices, assuming uniform cell wall thickness t, is calculated using:
q ¼ tPN
i¼1li
Að4Þ
where li is the length of the ith cell wall in a lattice with N number of cell walls. The wall thickness in Eq. (4) is adjusted sep-arately for each lattice to achieve the desired q value. This is necessary when studying the influence of K since comparisonsmust be made between lattices of the same relative density. Alternatively, it is also possible to achieve the desired q byadjusting the length li of each cell wall proportionally since q / t=l. It will be shown in Section 3.2 that either approachmakes no difference to the pre-exponent D of both regular and irregular lattices, since the analysis will be carried out ina deterministic framework similar to that employed in [5,6]. For convenience, the regular lattice is assumed to have unit cellwall length in this study. Cell randomness has the effect of increasing the average cell wall length in a lattice. Table 1 shows

Fig. 1. Randomly generated Voronoi honeycombs with different cell-regularity. Each lattice comprises of approximately 150 cells. The nucleus of each cellis indicated by a dot.
Table 1Typical average cell wall length in random lattices of various cell-regularity.
K ?0+ 0.25 0.5 0.6 0.7 0.8 1
l 1.0775 1.0754 1.0636 1.0575 1.0484 1.0374 1
I. Christodoulou, P.J. Tan / Engineering Fracture Mechanics 104 (2013) 140–161 143
how the average wall length l increases with decreasing cell regularity. The difference in l is less than 8% between the twolimiting cases of K ? 0+ and K = 1.
2.3. In-plane elastic properties
2.3.1. Regular lattice (K = 1)The in-plane elastic properties of a regular lattice where K = 1 (Fig. 1d) are given by [1]:
E� ¼ 32q3Es; G� ¼ 3
8q3Es; m� ¼ 1 ð5Þ
where the superscript ⁄ and subscript s denotes the honeycomb and cell wall material properties, respectively. A regular lat-tice is isotropic with identical stiffness (E�1 ¼ E�2) and Poisson’s ratio (m�12 ¼ m�21) in the x1 or x2 directions. Just like an isotropicfully dense material, their Poisson’s ratio and elastic moduli are also related through G⁄ = E⁄/2(1 + m⁄). Since the scaling lawsin Eq. (5) were derived using the simple beam bending theory, they are valid only for relatively low values of q. At highervalues, say q P 0:15, the aspect ratio of the cell walls no longer justifies omission of the shear and axial wall stresses; in suchcases, Eq. (5) should be replaced with the theoretical estimates presented in Silva et al. [10]. The typical error caused byneglecting shear and axial wall stresses is approximately 10% for a regular lattice with q � 0:15; this error increases with q.
2.3.2. Irregular lattices (K – 1)For irregular lattices where K – 1 (Fig. 1a–c), Eq. (5) is no longer applicable since q does not scale with the geometry of
the random cell aggregate in the manner proposed by Gibson and Ashby [1]. Notwithstanding, it would be obvious later thattheir in-plane elastic properties remain strongly dependent upon q. Finite element calculations were first performed toestablish how the elastic properties of the lattices vary under the competing influences of K and q. The results will be usedas inputs to calculate the plane-strain fracture toughness of the lattices under combined mode I and mode II loadings, to bediscussed in Section 3.

144 I. Christodoulou, P.J. Tan / Engineering Fracture Mechanics 104 (2013) 140–161
2.3.3. Finite element modelTo investigate the effects of the random cell topology, a sufficiently large sample of Voronoi tessellations were created for
each cell-regularity to be investigated – see Section 2.3.4. A square finite element (FE) mesh of each tessellation is generatedusing the software ABAQUS/standard�. Periodic boundary conditions (BCs) were imposed on the lattice boundaries accord-ing to
Table 2The averelative
Mea% De
upi � uq
i ¼ �ij xqj � xp
j
� �; xp �xq ¼ 0 ð6Þ
where i, j = 1, 2 denote degrees of freedom and p, q refer to the nodes on opposing sides of the lattice. This is necessary sincethe use of mixed BCs is known to under-estimate the elastic moduli of the lattices [15,16]. Convergence studies were per-formed where it was found that the use of four Timoshenko beam elements (B21) per cell wall in a lattice comprising of50 � 50 cells gives sufficiently accurate results. All numerical simulations were performed in the context of small strainsand rotations.
2.3.4. Numerical predictionsElastic properties for the lattices were obtained under plane-stress loading conditions where r13 = r23 = r33 = 0. The elas-
tic moduli were normalised with q3Es to give E� and G�. Table 2 shows the average elastic properties and the percentage var-iation, from their respective mean values, for the different loading directions. The data shown were obtained from a sampleof twenty tessellations with constant cell-regularity K = 0.5 and relative density q ¼ 0:1. Numerical checks have been per-formed to verify that a sample size of, at least, twenty tessellations is needed at each cell-regularity to give representativeresults. The differences between the average properties in the x1 and the x2 direction are generally insignificant. Likewise, thepercentage variations of the average elastic moduli and Poisson’s ratio are, similarly, insignificant; <2% and <0.5%, respec-tively, for all combinations of q�K considered in this study. These results are not surprising since the cells in a Voronoilattice have no preferred orientation. Therefore, the E�1 and E�2 values of each lattice are combined into a single data set of40 samples with only its mean value plotted in Fig. 2a: the same applies to m�12 � m�21 which are plotted in Fig. 2c.
Fig. 2a and b shows the variation of the elastic moduli with q and K. The theoretical estimates by Silva et al. [10] arenearly identical to the present FE results for regular lattices. At the lower values of q, cell-irregularities lead to an increasein E� and G� by up to 20% as K ? 0+. This trend is reversed for relative densities q > 0:2. The variations of each data pointplotted in Fig. 2a and b are less than one standard deviation and this also agrees well with the results of Silva et al. [10] andZhu et al. [15].
The Poisson’s ratio m⁄ of a lattice decreases with increasing q as shown in Fig. 2c; this trend is similar to the theoreticalestimate in [10] for regular lattices. Cell-irregularity does not appear to have a significant effect on m⁄, leading only to aslightly reduced m⁄ as K ? 0+; this reduction becomes more pronounced at higher values of q. Note that a similar trend isalso reported by Zhu et al. [15]. Fig. 2d shows the variation of I = 2G⁄(1 + m⁄)/E⁄, an isotropy parameter, with q. As expected,I is always unity for a regular lattice regardless of its relative density. For irregular lattices, I is only slightly raised (<5%).Therefore, the assumption of an isotropic 2D lattice for every cell-regularity parameter K is, to a first approximation, valid.
3. Fracture toughness
3.1. Methodology and finite element model
The in-plane stress field of a linear elastic cracked body is given by [17]:
rij ¼ C1gð1Þij ðhÞ1ffiffiffirp þ C2gð2Þij ðhÞ þ C3gð3Þij ðhÞr
1=2 þX1n¼4
CngðnÞij ðhÞrðn�2Þ=2 ð7Þ
where rij is the stress tensor, r � h are polar coordinates centred at the crack tip, gðnÞij ðhÞ are dimensionless functions of h andCn is its corresponding stress amplitude. In the immediate crack-tip region, the singular stress field given by the leading termof Eq. (7) can be decomposed additively into contributions from remote tensile (Mode I) and in-plane shear (Mode II) load-ings as [18]
rij ¼K Iffiffiffiffiffiffiffiffiffi2prp rI
ij þK IIffiffiffiffiffiffiffiffiffi2prp rII
ij ð8Þ
rage elastic moduli and Poisson’s ratio obtained from a sample of twenty Voronoi tessellations. All lattices have identical cell-regularity K = 0.5 and adensity of q ¼ 0:1.
E�1 E�2 G� m�12 m�21
n 1.5866 1.5910 0.4152 0.9689 0.9668viation 1.5674 1.5658 1.3934 0.2081 0.4376

(a) (b)
(c) (d)Fig. 2. In-plane elastic properties and isotropy parameter as a function of relative density q for different cell-regularity parameter K. Theoretical estimatesof E� ;G� and m⁄ for a regular lattice by Silva et al. [10] are included for comparison.
I. Christodoulou, P.J. Tan / Engineering Fracture Mechanics 104 (2013) 140–161 145
where KI and KII are the mode I and mode II stress intensity factors (SIFs), respectively. The displacement components (u1,u2)associated with the asymptotic crack-tip field (in Eq. (8)) for a plane-strain crack in an elastic solid are given by [18]:
ui ¼1
2G�ps
ffiffiffiffiffiffiffir
2p
r½K Iuiðh; m�psÞ
I þ K IIuiðh; m�psÞII�; i ¼ 1;2 ð9Þ
where uiðh; m�psÞI and uiðh; m�psÞ
II are functions of the angle h and the plane-strain Poisson’s ratio m�ps of the lattices. For mixed-mode loading, the relative composition of KI and KII is controlled by means of an elastic mode-mixity parameter M defined by[19]:
M ¼ 2p
tan�1 K II
K I
� �; 0 6 M < 1 ð10Þ
where the limiting values of M = 0 and M ? 1� corresponds to the mode I and mode II fracture toughness, respectively.Fig. 3 shows a schematic of a typical Voronoi lattice (K = 1) with n � n cells that were implemented in ABAQUS/standard
�.
A long plane-strain crack of n/2 cell-length, with its tip located at the nucleation point of the crack-tip cell, is assumed toalign with the negative x1 axis. The displacements associated with the asymptotic crack-tip field given by Eq. (9) were ap-plied to the boundary nodes of the FE mesh. This is also the approach employed in [5,6]. By imposing the K-displacementfield to the lattice boundary, it is tacitly assumed that the lattice is isotropic and homogeneous. Since the elastic propertiesin Fig. 2 were obtained under plane-stress conditions, they need to be modified for use in Eq. (9). Supposing the elastic mod-ulus of the lattices in the prismatic x3 direction is E33 ¼ qEs and its Poisson’s ratio is m31 = m32 = ms, then under plane-strainconditions, with �3 = 0 and r3 = m31r1 + m32r2, the modified elastic moduli and Poisson’s ratio become as follows:

Fig. 3. Schematic of the FE model with a long plane-strain crack aligned along the negative x1 axis. The Cartesian coordinates x1 � x2 and polar coordinatesr � h are centred at the crack-tip as shown.
146 I. Christodoulou, P.J. Tan / Engineering Fracture Mechanics 104 (2013) 140–161
E�ps ¼2E�
2� 3q2m2s; m�ps ¼
2þ 3q2m2s
2� 3q2m2s; G�ps ¼
E�ps
2 1þ m�ps
� � ð11Þ
The same finite element mesh, described earlier in Section 2.3.3, is used here to evaluate the lattice toughness. A crack isgenerated along the negative x1-axis by splitting the beams at x2 = 0 so that no connection exists across the traction-freecrack plane. Numerical checks were carried out which show that it suffices to model each cell wall with four Timoshenkobeams elements (B21) without any loss of accuracy.
A deterministic approach, similar to that employed in [5–7], is adopted here to evaluate the macroscopic fracture tough-ness of the lattices. The cell walls in the lattice are assumed to be elastic-brittle with no dependence on scale, i.e. failure al-ways occurs at the same maximum stress regardless of the dimensions of the cell wall. For such an idealised material, failureoccurs when the local stress at the outermost fibre of any beam element in the lattice reaches the cell wall fracture strengthof rf. Unlike in Huang and Gibson [9], the present study ignores the effects of flaws on the fracture strength of the brittle cellwall. Using this simple deterministic framework, the macroscopic fracture toughness of the Voronoi lattices was found to besensitive to the overall specimen size. Fig. 4 shows how the mode I fracture toughness of a regular lattice (K = 1) varies withthe overall specimen size (of n � n cells). The same also applies to irregular lattices. As a compromise between computationaltime and numerical accuracy, all simulations were performed with lattices of 200 � 200 cells. Similar to Section 2.3.4,numerical checks were carried out which also showed that, at least, twenty tessellations are needed at each value of K inorder to obtain representative values for the toughness. Hereinafter, unless stated otherwise, the lattice toughness at eachK is an average of twenty tessellations.
3.2. Mode I and mode II fracture toughness
In this section, the sensitivity of the lattice toughness to cell-regularity and relative density are evaluated for pure mode Iand II loadings. Fig. 5 shows the deformed FE mesh for Voronoi lattices, of a constant relative density q ¼ 0:1, with different
Fig. 4. Typical variation of the mode I fracture toughness of a regular lattice with overall lattice size of n � n cells.

Fig. 5. Typical lattice deformation under mode I, mixed-mode and mode II loadings. The lattice shown have cell-regularity of K ? 0+, K = 0.7 and K = 1. Alllattices have the same relative density of q ¼ 0:1.
Fig. 6. Fracture toughness of lattices with different cell-regularity against relative density.
I. Christodoulou, P.J. Tan / Engineering Fracture Mechanics 104 (2013) 140–161 147
cell-regularity (K ? 0+,0.7,1) subjected to pure mode I/II and mixed mode (M = 0.5) loadings. Only 50 � 50 cells are shownin each case; these were cropped from larger lattices of 200 � 200 cells.
The average fracture toughness of the lattices were fitted to the scaling law [1,5]
KC
rf
ffiffil
p ¼ Dqd ð12Þ

148 I. Christodoulou, P.J. Tan / Engineering Fracture Mechanics 104 (2013) 140–161
and plotted on a log–log scale in Fig. 6. Note that Eq. (12) uses the average cell wall length l from Table 1. Recall that for theirregular lattices, their toughness is an average of twenty tessellations but their respective error bars are not shown for thesake of clarity. Fig. 6 shows that the predicted lattice toughness fits well the scaling law of Eq. (12) with the fitted coefficientstabulated in Table 3.
Regardless of cell-regularity or the loading mode, the fracture toughness KC has a near quadratic dependence upon q. Thisis to be expected since a Voronoi lattice, whether regular or irregular, has an average nodal connectivity of 3 and, therefore,they deform primarily by cell wall bending, with only a negligible contribution from axial stretch of between 3% and 10% atthe fracture site, see Section 6.2. The effects of cell-regularity upon the lattice toughness is determined by the parameter Dwhich is given in Table 3. It shows that the average mode I toughness is more sensitive to cell regularity than its correspond-ing mode II counterpart.
Fig. 7 plots KC=ðrf q2Þ against l for lattices with the same relative density q ¼ 0:1. The square root dependence ofKC=ðrf q2Þ on the average cell wall length l (see Eq. (12)) is the same for both regular and irregular lattices with identicalq but different l. Therefore, adjusting either their wall thickness uniformly (as is used in this study) or their average walllength proportionally to obtain the required q has no effect upon the pre-exponent D in Eq. (12) so long as the analysis iscarried out in a deterministic framework similar to that in [5,6].
Fig. 8 shows the variation of the average non-dimensional toughness KC=ðrf q2ffiffil
pÞ with cell-regularity for pure mode I
and mode II loadings. Again, each data point is the average of twenty tessellations and the error bar corresponds to theirstandard deviation. The effect of relative density is eliminated by non-dimensionalisation so the two plots for q ¼ 0:05and 0.1 nearly collapse on each other. One observes an almost linear reduction in the average mode I toughness withdecreasing cell regularity, by up to 25% between K = 1 and K ? 0+. Note that a 15% reduction in relative density wouldbe needed to achieve a corresponding reduction in the toughness of a regular hexagonal honeycomb (K = 1). This suggeststhat cell regularity has a significant effect upon the mode I toughness of the lattices. No inference could be made for mode IIloading since the fluctuations in toughness are nearly the same at all K. By contrast, as the cells become more irregular, theaverage in-plane elastic moduli of the lattices increases by up to 20% between K = 1 and K ? 0+; this increase depends on q(see Fig. 2). For the range of q considered, Fig. 8 shows that Voronoi lattices, whether regular or irregular, have a greaterresistance to fracture in mode I compared to mode II. Similarly, the lattice toughness also appears to be more sensitive tovariations in cell-regularity for mode I than mode II loading. Since the former has a consistently higher variability thanthe latter, and the same twenty tessellations were used in the FE simulations for both mode I and mode II loadings at eachK, one can conclude that the mode I toughness must be more sensitive to cell topological variations in the vicinity of thecrack tip. In general, the toughness can vary by up to ±20% from the mean value between tessellations. One reason forthe high variability is because cell fracture can initiate several cells away from the crack tip, depending on the local celltopology, as will be shown in Sections 5 and 6.
Romijn and Fleck [6] reported that for lattices with q ¼ 0:01, there is a 30% reduction in their average KIC value and a 20%increase in their average KIIC value if the vertices of each cell in a regular hexagonal honeycomb were allowed to vary ran-domly by up to a maximum distance of l/2, i.e. half the regular cell edge length. Note, however, that the lattice generatedusing the cell node perturbation technique in [6] would still give a substantively less random cell structure (measured interms of the variation of the cell areas) than a Voronoi lattice of K = 0.5. Yet, the reduction in the average KIC value for aVoronoi lattice is less than 10% between K = 1 and K = 0.5, while KIIC remains largely unaffected. The reason for this discrep-ancy is unclear although one possibility is that the cells in a 2D Voronoi lattice, regardless of regularity, are always convexunlike those generated by the random cell node perturbation technique in [6] where the local Poisson’s ratio may sometimesbe negative.
3.3. Mixed-mode fracture toughness
In this section, the effects of relative density and cell-regularity on the lattice toughness are explored for mixed-modeloading (M – 0 or 1). The decoupling of modes in isotropic elasticity (it was shown in Section 3 that the lattices can be con-sidered isotropic) allows the total energy release rate G for combined mode cracking to be written as:
Table 3Fitted c
Mod
Mod
G ¼ K2I
E�psþ K2
II
E�psþ K2
III
2G�psð13Þ
from which, by setting KIII = 0, an effective SIF can be defined as follows:
oefficients using the scaling law given in Eq. (12).
K 0 0.25 0.5 0.6 0.7 0.8 1
e I d 1.974 1.987 1.988 1.987 1.981 1.987 1.994D 0.691 0.790 0.825 0.795 0.836 0.887 0.927
e II d 2.001 2.010 2.004 2.015 2.010 2.013 2.019D 0.420 0.442 0.461 0.479 0.480 0.480 0.486

Fig. 7. Variation of normalised fracture toughness KC=ðrf q2Þ against average cell wall length l for irregular (K = 0.5) and regular hexagonal (K=1) lattices,subjected to mode I and mode II loadings. For the irregular lattices, each data point is the average of twenty tessellations and the error bar indicatesstandard deviation. Relative density is kept constant at q ¼ 0:1 for all cases.
Fig. 8. Variation of non-dimensional fracture toughness KC=ðrf q2ffiffilpÞ against cell-regularity for lattices with q ¼ 0:05;0:1 subjected to mode I and mode II
loadings. Each data is an average of twenty tessellations and the error bar indicates standard deviation.
I. Christodoulou, P.J. Tan / Engineering Fracture Mechanics 104 (2013) 140–161 149
Keff ¼ffiffiffiffiffiffiffiffiffiffiffiffiffiffiffiffiffiK2
I þ K2II
qð14Þ
At each mode-mixity M, the combination of KI and KII needed for a single cell wall to fracture were used to calculate the crit-ical effective SIF, Keff,C, of the Voronoi lattice. This was repeated for a range of cell-regularity to generate the fracture loci inFig. 9. The loci plotted are for a constant q ¼ 0:1 and each data point, except those at K = 1, is the average of 20 tessellations.It must be noted that the fracture loci are insensitive to relative density for the range of q investigated.
The fracture locus of a regular lattice comprises of two distinct straight segments separated by a kink at M � 0.15 – thesame is reported by Fleck and Qiu [5]. This kink coincides with a shift in the cell wall fracture location as mode-mixitychanges. Although a switch in fracture location, sometimes multiple switches, also occurs for the irregular lattices, the ab-sence of kink(s) in their corresponding loci in Fig. 9 is a consequence of smoothing by averaging twenty tessellations. In gen-eral, the smoothed loci appears as a quarter ellipse that are largely similar for different values of K. To clarify the above, theloci of four separate tessellations at K = 0.5 are plotted in Fig. 10a. Without averaging, the loci remain inner convex enve-lopes, but unlike in Fig. 9, are a series of straight segments separated at multiple kink(s), each corresponding to a shift in thecell wall fracture location at that mode-mixity. Fig. 10b shows the lattice topology for tessellation 1 where fracture initiatesat A if mode-mixity M < 0.14, at B if 0.14 6M 6 0.6 and at C if M > 0.6. Note that the number of kinks and at which mode-mixity it appears vary from one tessellation to another without a set pattern for the irregular lattices: this contrasts with aregular one.

Fig. 9. The normalised fracture loci for regular and irregular Voronoi lattices. All lattices have the same relative density of q ¼ 0:1. Note that each data pointcorresponding to K – 1 is the average of twenty tessellations.
(a)
(b)Fig. 10. (a) Normalised fracture locus of four typical Voronoi tessellations generated for K = 0.5. (b) The three straight segments comprising the locus oftessellation 1 in (a) correspond to the different fractured cell wall location shown as A and B.
150 I. Christodoulou, P.J. Tan / Engineering Fracture Mechanics 104 (2013) 140–161
Fig. 11 shows that, on average, the critical effective SIF (Keff,C), of both regular and irregular lattices, reduces with increas-ing mode-mixity M. The ratio Keff,C/KIC does not vary considerably between the different irregular lattices for different modemixity; however, they are noticeably higher than that of the regular hexagonal lattice. Note that the data in Fig. 11 are the

Fig. 11. The average variations of Keff,C/KIC with mode-mixity for Voronoi lattices with different cell-regularity. All lattices have identical relative density of0.1.
I. Christodoulou, P.J. Tan / Engineering Fracture Mechanics 104 (2013) 140–161 151
average of 20 tessellations. If, however, one considers the individual tessellations without averaging, there are considerablevariations. Fig. 12 shows the results of four typical tessellations of identical cell-regularity K = 0.5 at a constant relative den-sity of 0.1. Tessellations 1 exhibit an initial increase in Keff,C followed by a drop as M increases whilst tessellation 2 shows avery similar trend to that of a regular lattice. Collectively, the data suggests that there is a 70% chance the critical effective SIFof an irregular lattice will be higher than a corresponding regular one at the same relative density for all mode-mixitiesM > 0. Also shown in Fig. 12 are the results for regular 3D tetrakaidecahedral open-cell foam by Thiyagasundaram et al.[20] where it was reported that an open-cell foam reaches a maximum Keff,C at mode mixity M = 0.55 and thereafter it re-duces to approximately 0.7 at M = 1. This is clearly different to any of the 2D Voronoi lattices studied here or reported else-where, such as in [5], and is the subject of a separate investigation.
The regularity of the cells in a Voronoi lattice is controlled by the global parameter K that merely places a constraint onthe minimum cell size in the lattice. However, it has no control over the local cell topology in the vicinity of the crack tip. Thedifferences in the results between lattices of the same K are indicative of the sensitivity of the lattice toughness to random-ness in the local cell topology to which K has no control. Nonetheless, by comparing the average trend to those of individualtessellations, it allows one to make inferences, based on percentage chances, concerning the comparative toughness of thelattices for different loading modes.
4. Effects of T-stress
The previous section considers the lattice behaviour subjected to an asymptotic crack-tip field which neglects the non-singular terms in Eq. (7). By symmetry arguments, the second term in the series expansion of the mode I crack-tip field,
Fig. 12. Typical variations of Keff,C/KIC with mode-mixity for different tessellations of the same cell-regularity K = 0.5. All lattices have identical relativedensity of 0.1.

152 I. Christodoulou, P.J. Tan / Engineering Fracture Mechanics 104 (2013) 140–161
the so-called T-stress, can be shown to vanish under mode II loading and plays a relatively minor role in fully dense elastic-brittle solids. However, Smith et al. [21] have shown that T-stress can play a role in mode II loading and only vanishes undera purely anti-symmetric loading that rarely occurs in practice. Moreover, Fleck and Qiu [5] also showed that it is necessary toinclude T-stress effects in order to explain the predicted fracture strength of regular hexagonal honeycomb at low relativedensities. To consider the T-term, Eq. (8) must be modified to give
rij ¼K Iffiffiffiffiffiffiffiffiffi2prp rI
ijðhÞ þ Td1id1j for mode I ð15Þ
and
rij ¼K IIffiffiffiffiffiffiffiffiffi2prp rII
ijðhÞ for mode II ð16Þ
where dij is the Kronecker delta. The same FE mesh in Section 3 is used here, except that the displacement components asso-ciated with the asymptotic crack-tip field in Eq. (9) is modified to include the following additional terms of
u1 ¼1� m�ps
� �2G�ps
Tr cos h; u2 ¼ �m�ps
2G�psTr sin h ð17Þ
The T-stress is typically normalised with the effective SIF in Eq. (14) to give a stress biaxiality ratio as follows [21,22]:
B ¼ Tffiffiffiffiffiffiffipap
Keffð18Þ
where a is the crack length.Since the displacement field, Eqs. (9) and (17), was imposed on the remote boundary of the FE mesh, one tacitly assumes
that the lattice is a homogeneous solid. Because no contact algorithm is incorporated into the FE model, the two sets of nodesthat define the traction-free cracking plane are not allowed to come into contact, thus limiting the range of B that can beinvestigated. In the present study, contact between the crack planes occurs at B > 0.3 (for mode I) and at B > 0 (for modeII). For mixed-mode loading, the mode-mixity directly influences when contact between the crack planes will occur; forexample, at M = 0.5 crack closure occurs when B P 0.2 as shown in Figs. 13 and 14.
Fig. 13 shows the effect of T-stress upon the normalised effective toughness, Keff ;C=K0eff ;C, where K0
eff ;C is the correspondingcritical SIF at zero T-stress. Again, the data points for K – 1 is the average of twenty realisations. It would appear that theinfluence of T-stress on the normalised effective toughness is most pronounced for mode I loading with negative T-stresses.The normalised effective fracture toughness of a lattice decreases rapidly with increasing negative T-stresses: at B = �1, theknockdown in effective toughness is, on average, nearly 75% for mode I and 50% for mode II loading. The opposite is true forpositive T-stresses, since an additional negative displacement component in the x2 direction reduces the cell deformation inthe vicinity of the crack tip, leading to an enhancement of the normalised effective toughness as seen in Fig. 13. Again, mode Iloading is more sensitive to the presence of positive T-stresses than mode II.
Fig. 13a shows that T-stress has the same effect upon the normalised effective toughness Keff ;C=K0eff ;C for both the regular
and irregular lattices. At M = 0.5, the effective toughness of an irregular lattice is only marginally lower than a correspondingregular one for negative T-stresses. Fig. 13b compares the same for lattices of different relative densities at 0.05 and 0.1. Ingeneral, lattices of a higher relative density are less affected by a finite T-stress which agrees with Fleck and Qiu [5]. How-ever, the knockdown in effective toughness caused by a reduction in relative density is only marginal, and comparativelyinsignificant, compared to the overall knockdown caused by the introduction of T-stresses. Regardless, the quadratic depen-dence of toughness, K0
eff ;C, on relative density still holds.Fig. 14 shows the effect of T-stress on the normalised fracture loci for lattices with K = 0.5 and 1. For negative T, the frac-
ture locus expands as shown because mode I toughness is more sensitive to the inclusion of T-stresses than mixed-mode ormode II. Unlike a regular lattice with zero T-stresses, the kink is now less prominent and the switch in the initial cell wallfracture location occurs at a higher mode mixity (at M = 0.4 and 0.7 for B = �0.5 and �0.1, respectively). At B = �1, the KII/KIC
ratio becomes nearly doubled, from 0.47 to 0.95 and from 0.53 to 1.08, for a regular honeycomb and an irregular lattice(K = 0.5), respectively.
One likely reason for the significant contribution of T-stress to the effective macroscopic toughness of 2D lattices is theirnear-unity Poisson’s ratio m�ps. Referring to Eq. (17), T-stress induces additional boundary displacements which is predomi-nantly confined to the x2 direction, with minimal addition to the x1 direction, if m�ps is close to unity. Consequently, the effectsof T-stress may not be as significant in a 3D lattice since their Poisson’s ratio was reported to be between 0.3 and 0.5 [1], andthis would somewhat suppress the effect of T-stress upon its macroscopic toughness.
5. Fracture location maps
Unlike fully dense solids, the crack path in a Voronoi lattice is, in general, discontinuous where the location of the initialcell wall fracture can, in extreme cases, occur up to six cells away from the crack-tip cell [23]. The crack-tip in the FE model is

Fig. 13. Variation of the normalised toughness Keff ;C=K0eff;C against T-stress for Voronoi lattices at two different (a) cell-regularities and (b) relative densities.
Fig. 14. Fracture loci of Voronoi lattices at increasing negative T-stress. The three straight lines correspond to M = 0.15, 0.4 and 0.7. All the lattices haveidentical relative density of 0.1. Each data point for K = 0.5 is the average of 20 tessellations.
I. Christodoulou, P.J. Tan / Engineering Fracture Mechanics 104 (2013) 140–161 153
154 I. Christodoulou, P.J. Tan / Engineering Fracture Mechanics 104 (2013) 140–161
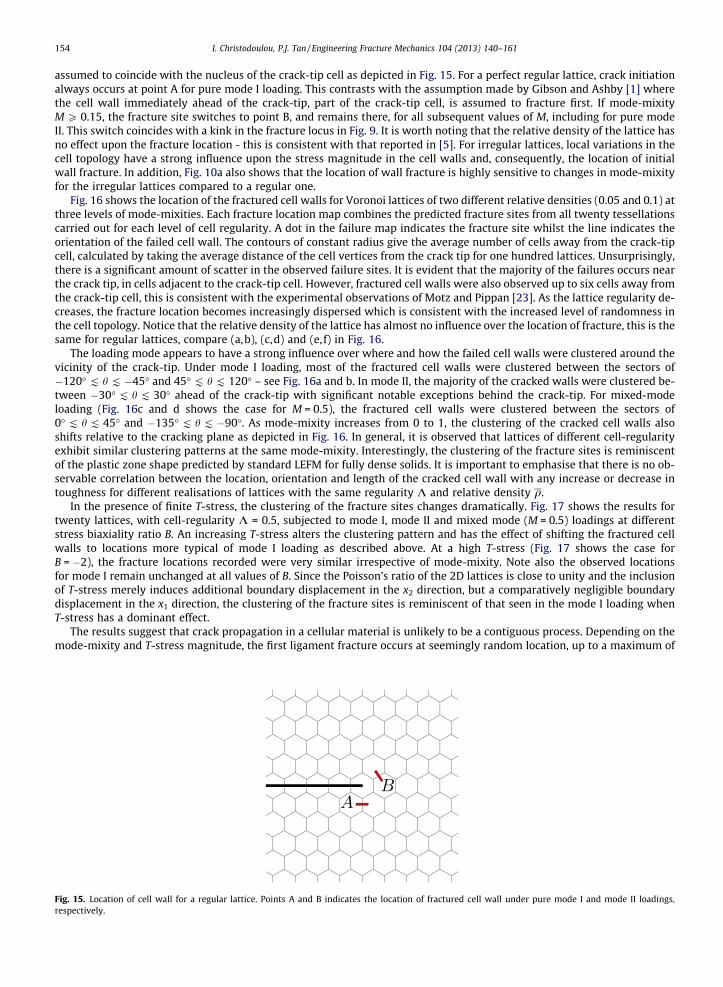
assumed to coincide with the nucleus of the crack-tip cell as depicted in Fig. 15. For a perfect regular lattice, crack initiationalways occurs at point A for pure mode I loading. This contrasts with the assumption made by Gibson and Ashby [1] wherethe cell wall immediately ahead of the crack-tip, part of the crack-tip cell, is assumed to fracture first. If mode-mixityM P 0.15, the fracture site switches to point B, and remains there, for all subsequent values of M, including for pure modeII. This switch coincides with a kink in the fracture locus in Fig. 9. It is worth noting that the relative density of the lattice hasno effect upon the fracture location - this is consistent with that reported in [5]. For irregular lattices, local variations in thecell topology have a strong influence upon the stress magnitude in the cell walls and, consequently, the location of initialwall fracture. In addition, Fig. 10a also shows that the location of wall fracture is highly sensitive to changes in mode-mixityfor the irregular lattices compared to a regular one.
Fig. 16 shows the location of the fractured cell walls for Voronoi lattices of two different relative densities (0.05 and 0.1) atthree levels of mode-mixities. Each fracture location map combines the predicted fracture sites from all twenty tessellationscarried out for each level of cell regularity. A dot in the failure map indicates the fracture site whilst the line indicates theorientation of the failed cell wall. The contours of constant radius give the average number of cells away from the crack-tipcell, calculated by taking the average distance of the cell vertices from the crack tip for one hundred lattices. Unsurprisingly,there is a significant amount of scatter in the observed failure sites. It is evident that the majority of the failures occurs nearthe crack tip, in cells adjacent to the crack-tip cell. However, fractured cell walls were also observed up to six cells away fromthe crack-tip cell, this is consistent with the experimental observations of Motz and Pippan [23]. As the lattice regularity de-creases, the fracture location becomes increasingly dispersed which is consistent with the increased level of randomness inthe cell topology. Notice that the relative density of the lattice has almost no influence over the location of fracture, this is thesame for regular lattices, compare (a,b), (c,d) and (e, f) in Fig. 16.
The loading mode appears to have a strong influence over where and how the failed cell walls were clustered around thevicinity of the crack-tip. Under mode I loading, most of the fractured cell walls were clustered between the sectors of�120� [ h [ �45� and 45� [ h [ 120� – see Fig. 16a and b. In mode II, the majority of the cracked walls were clustered be-tween �30� [ h [ 30� ahead of the crack-tip with significant notable exceptions behind the crack-tip. For mixed-modeloading (Fig. 16c and d shows the case for M = 0.5), the fractured cell walls were clustered between the sectors of0� [ h [ 45� and �135� [ h [ �90�. As mode-mixity increases from 0 to 1, the clustering of the cracked cell walls alsoshifts relative to the cracking plane as depicted in Fig. 16. In general, it is observed that lattices of different cell-regularityexhibit similar clustering patterns at the same mode-mixity. Interestingly, the clustering of the fracture sites is reminiscentof the plastic zone shape predicted by standard LEFM for fully dense solids. It is important to emphasise that there is no ob-servable correlation between the location, orientation and length of the cracked cell wall with any increase or decrease intoughness for different realisations of lattices with the same regularity K and relative density q.
In the presence of finite T-stress, the clustering of the fracture sites changes dramatically. Fig. 17 shows the results fortwenty lattices, with cell-regularity K = 0.5, subjected to mode I, mode II and mixed mode (M = 0.5) loadings at differentstress biaxiality ratio B. An increasing T-stress alters the clustering pattern and has the effect of shifting the fractured cellwalls to locations more typical of mode I loading as described above. At a high T-stress (Fig. 17 shows the case forB = �2), the fracture locations recorded were very similar irrespective of mode-mixity. Note also the observed locationsfor mode I remain unchanged at all values of B. Since the Poisson’s ratio of the 2D lattices is close to unity and the inclusionof T-stress merely induces additional boundary displacement in the x2 direction, but a comparatively negligible boundarydisplacement in the x1 direction, the clustering of the fracture sites is reminiscent of that seen in the mode I loading whenT-stress has a dominant effect.
The results suggest that crack propagation in a cellular material is unlikely to be a contiguous process. Depending on themode-mixity and T-stress magnitude, the first ligament fracture occurs at seemingly random location, up to a maximum of
Fig. 15. Location of cell wall for a regular lattice. Points A and B indicates the location of fractured cell wall under pure mode I and mode II loadings,respectively.

Fig. 16. The location of initial cell wall fracture in the lattices. The mid-point of the fractured cell wall is shown as a dot and the orientation of the cell wallas a line. The circular contours indicate the average distance, non-dimensionalised to give the average number of cells, away from the crack-tip cell.
I. Christodoulou, P.J. Tan / Engineering Fracture Mechanics 104 (2013) 140–161 155

Fig. 17. Failure locations of twenty different irregular honeycombs, with K = 0.5. The lattices are loaded under mode I, mode II and mixed mode loading(M = 0.5) with various values of negative T-stress.
156 I. Christodoulou, P.J. Tan / Engineering Fracture Mechanics 104 (2013) 140–161
I. Christodoulou, P.J. Tan / Engineering Fracture Mechanics 104 (2013) 140–161 157
5–6 cells away from the crack-tip for all the cases studied here. It is, as yet unknown, how fracture of a ligament leads to thestress redistribution in other intact ligaments within the fracture process zone and how the fractured ligaments eventuallylink up to form a continuous crack path. This is part of an ongoing investigation which will be reported elsewhere.
6. Strain maps and energy partition
6.1. Strain maps
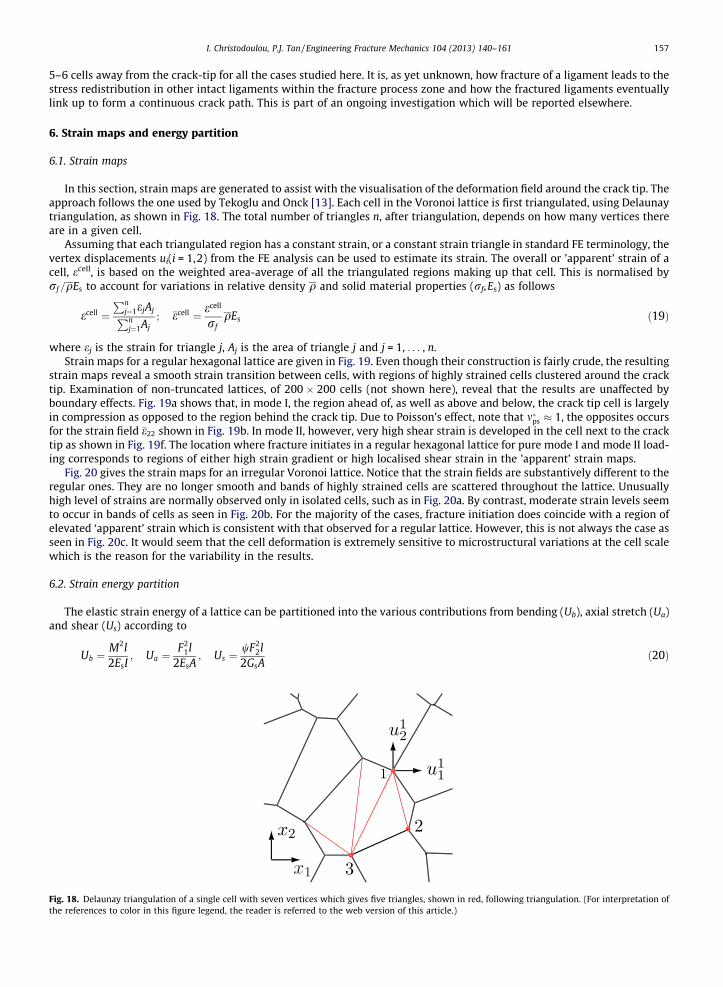
In this section, strain maps are generated to assist with the visualisation of the deformation field around the crack tip. Theapproach follows the one used by Tekoglu and Onck [13]. Each cell in the Voronoi lattice is first triangulated, using Delaunaytriangulation, as shown in Fig. 18. The total number of triangles n, after triangulation, depends on how many vertices thereare in a given cell.
Assuming that each triangulated region has a constant strain, or a constant strain triangle in standard FE terminology, thevertex displacements ui(i = 1,2) from the FE analysis can be used to estimate its strain. The overall or ’apparent’ strain of acell, ecell, is based on the weighted area-average of all the triangulated regions making up that cell. This is normalised byrf =qEs to account for variations in relative density q and solid material properties (rf,Es) as follows
Fig. 18.the refe
ecell ¼Pn
j¼1ejAjPnj¼1Aj
; �ecell ¼ ecell
rfqEs ð19Þ
where ej is the strain for triangle j, Aj is the area of triangle j and j = 1, . . . , n.Strain maps for a regular hexagonal lattice are given in Fig. 19. Even though their construction is fairly crude, the resulting
strain maps reveal a smooth strain transition between cells, with regions of highly strained cells clustered around the cracktip. Examination of non-truncated lattices, of 200 � 200 cells (not shown here), reveal that the results are unaffected byboundary effects. Fig. 19a shows that, in mode I, the region ahead of, as well as above and below, the crack tip cell is largelyin compression as opposed to the region behind the crack tip. Due to Poisson’s effect, note that m�ps � 1, the opposites occursfor the strain field �e22 shown in Fig. 19b. In mode II, however, very high shear strain is developed in the cell next to the cracktip as shown in Fig. 19f. The location where fracture initiates in a regular hexagonal lattice for pure mode I and mode II load-ing corresponds to regions of either high strain gradient or high localised shear strain in the ’apparent’ strain maps.
Fig. 20 gives the strain maps for an irregular Voronoi lattice. Notice that the strain fields are substantively different to theregular ones. They are no longer smooth and bands of highly strained cells are scattered throughout the lattice. Unusuallyhigh level of strains are normally observed only in isolated cells, such as in Fig. 20a. By contrast, moderate strain levels seemto occur in bands of cells as seen in Fig. 20b. For the majority of the cases, fracture initiation does coincide with a region ofelevated ‘apparent’ strain which is consistent with that observed for a regular lattice. However, this is not always the case asseen in Fig. 20c. It would seem that the cell deformation is extremely sensitive to microstructural variations at the cell scalewhich is the reason for the variability in the results.
6.2. Strain energy partition
The elastic strain energy of a lattice can be partitioned into the various contributions from bending (Ub), axial stretch (Ua)and shear (Us) according to
Ub ¼M2l2EsI
; Ua ¼F2
1l2EsA
; Us ¼wF2
2l2GsA
ð20Þ
Delaunay triangulation of a single cell with seven vertices which gives five triangles, shown in red, following triangulation. (For interpretation ofrences to color in this figure legend, the reader is referred to the web version of this article.)

Fig. 19. Strain maps for regular hexagonal honeycomb. (a)–(c) are for mode I loading and (d)–(f) for mode II. The dot (�) indicates the location of thefractured cell wall.
Fig. 20. Strain maps for three different tessellations of a Voronoi lattice, with cell-regularity K = 0.5, subjected to mode I loading. The dot (�) indicates thelocation of the fractured cell.
158 I. Christodoulou, P.J. Tan / Engineering Fracture Mechanics 104 (2013) 140–161
where M is the bending moment, F1 the axial force, F2 the shear force, l is the length of a beam element, I the second momentof area and w is a constant depending on the cross-sectional geometry of the cell wall. It is estimated that w = 1.15 for a rect-angular cross-section. From Eq. (20), the ratio of the bending strain energy to the total strain energy is estimated as follows:
g ¼ Ub
Ub þ Ua þ Us: ð21Þ
When fracture initiates in any of the cell wall, the bending strain energy ratio g and the normalised maximum stress rmax/rf
are calculated for each element in the FE mesh. Note that there can only be one element in each mesh whereby rmax/rf = 1.The elements are then reordered in increasing g value; this is given by the blue lines shown in Figs. 21–23. Their correspond-ing normalised maximum stress is shown in red and the horizontal axis gives the percentage number of elements with g lessthan the corresponding value indicated in the vertical axis. Using these plots, the dominant deformation mode in the frac-tured cell wall can be identified. In the subsequent discussions, the dominant mode of deformation in an element is bendingif g P 0.8.

Fig. 21. Effects of cell regularity on lattices with relative density q ¼ 0:1 subjected to mode I loading.
Fig. 22. Effects of relative density on an irregular (K ? 0+) lattice subjected to mode I loading.
Fig. 23. Effects of mode mixity on a regular lattice with relative density q ¼ 0:1.
I. Christodoulou, P.J. Tan / Engineering Fracture Mechanics 104 (2013) 140–161 159
Fig. 21 shows the effect of cell regularity upon g and rmax/rf for a lattice with relative density q ¼ 0:1, subjected to mode Iloading. For a regular lattice, fracture initiates in cell wall whereby bending is the dominant mode of deformation; this isclearly evident in Fig. 21a. The effects of increasing the relative density of a lattice is shown in Fig. 22. At low relative density,say q ¼ 0:01, most elements deform primarily in bending; Fig. 22a shows that nearly 90% of the elements in the FE meshhave g > 0.8. Unsurprisingly, the number of elements where bending is the dominant mode of deformation decreases with

160 I. Christodoulou, P.J. Tan / Engineering Fracture Mechanics 104 (2013) 140–161
increasing relative density q as the cell walls become stockier. At q ¼ 0:2, less than 25% of the elements deform primarily inbending with axial stretch and shear becoming increasingly dominant in the rest of the elements. It would appear that cellwall fracture is predominantly a result of bending deformation, regardless of relative density, as shown in Fig. 22. Note thatthe present study only considers q 6 0:3. Fig. 23 shows the effect of mode-mixity upon g and rmax/rf for a regular lattice. Asmode mixity increases from zero (pure mode I) to one (pure mode II), increasing number of elements experience a switch intheir deformation mode towards bending. However, the results show that mode-mixity, again, does not the alter the dom-inant mode of deformation experience by the cell wall prior to fracture, i.e. it remains predominantly by bending. Figs. 21–23reveal that fracture initiation in a Voronoi lattice is always a bending-dominated process and only occurs in cell walls thatexperience high level of bending deformation regardless of relative density, mode-mixity or cell regularity. This is the reasonwhy the fracture toughness of a Voronoi lattice always scales with q2.
7. Concluding remarks
The fracture toughness and location of fracture initiation were studied for Voronoi lattices with varying degree of cell-regularity. The pure mode I toughness of a lattice decreases as it becomes more irregular with an overall reduction of upto 25% for completely random lattices. There is no indication that pure mode II fracture toughness is affected significantlyby cell irregularities. The macroscopic toughness of the lattices was found to have a quadratic dependence upon relative den-sity for all values of K because of their bending dominated response. By partitioning of the strain energy, it is shown thataxial stretch contributes to less than 10% of the overall deformation of the cracked cell wall regardless of the relative density,cell regularity and mode-mixity. The Voronoi lattices, whether regular or irregular, have a greater resistance to mode I thanmode II loading. The mode I toughness of the lattices are more sensitive to cell topological variations in the vicinity of thecrack tip than mode II. Fracture loci for the lattices are obtained in combined mode I and mode II stress intensity factor space.Although there are considerable variations between the fracture locus of different tessellations with the same K, this studyshows there is a 70% chance the critical effective SIF of an irregular lattice will be greater than a corresponding regular one ofthe same relative density for all mode mixities M > 0. The effects of including T-stress was also investigated where a signif-icant decrease/increase in fracture toughness is observed: for example, at B = �1, the knockdown in the effective toughnessof the lattice is nearly 75% for mode I and 50% for mode II loadings. This trend reverses with positive T-stresses. The presentstudy found that the knockdown/enhancement in toughness caused by changes in relative density or cell-regularity is insig-nificant when compared to the overall knockdown/enhancement due to the inclusion of a T-stress.
Fracture location maps are obtained for lattices with different cell-regularities, mode-mixities, relative densities and T-stresses. Significant scatter in the initial cell wall fracture location is observed: the majority of failed cell walls occur nearthe crack tip, although they are also observed at up to five cells away from the crack-tip cell, suggesting a highly discontin-uous cracking path that is bridged by many un-cracked ligaments. As mode-mixity changes from mode I to mode II, the clus-tering of the fractured cell walls shifts relative to the crack plane and is reminiscent of the evolution of the plastic zone shapein fully dense solids from LEFM. The introduction of a T-stress changes considerably the clustering of the fractured cell walls:mode I remains, in general, unaffected, whilst for mode II and mixed mode loadings at high T-stresses, the clustering is rem-iniscent of that seen in mode I loading. There is no correlation between the calculated fracture toughness for different latticerealisations, with the same K and q, and the location where cell wall cracking first initiates. ‘Apparent’ strain maps show thatthe location of cracking is dictated by the local deformation, typically in a region with either highly localised strain or highstrain gradients.
Acknowledgement
The first author is grateful to the EPSRC (UK) for financial support provided through a 2010/11 doctoral training grantawarded to University College London.
References
[1] Gibson LJ, Ashby MF. Cellular solids: structure and properties. UK: Cambridge University Press; 1997.[2] Currey JD. The mechanical adaptations of bones. Princeton, NJ: Princeton University Press; 1984.[3] Ladd AC, Kinney JH, Haupt DL, Goldstein SA. Finite-element modeling of trabecular bone: comparison with mechanical testing and determination of
tissue modulus. J Orthopaed Res 1998;16:622–8.[4] Heaney R. Is the paradigm shifting? Bone 2003;33(4):457–65.[5] Fleck NA, Qiu X. The damage tolerance of elastic-brittle, two-dimensional isotropic lattices. J Mech Phys Solids 2007;55:562–88.[6] Romijn NER, Fleck NA. The fracture toughness of planar lattices: imperfection sensitivity. J Mech Phys Solids 2007;55:2538–64.[7] Choi S, Sankar BV. A micromechanical method to predict the fracture toughness of cellular materials. Int J Solids Struct 2005;42:1797–817.[8] Maiti SK, Ashby MF, Gibson LJ. Fracture toughness of brittle cellular solids. Scripta Metall Mater 1984;18:213–7.[9] Huang JS, Gibson LJ. Fracture toughness of brittle honeycombs. Acta Metall Mater 1991;39:1617–26.
[10] Silva MJ, Hayes WC, Gibson LJ. The effects of non-periodic microstructure on the elastic properties of two-dimensional cellular solids. Int J Mech Sci1995;37:1161–77.
[11] Silva MJ, Gibson LJ. The effects of non-periodic microstructure and defects on the compressive strength of two-dimensional cellular solids. Int J MechSci 1997;39:549–63.
[12] Gibson LJ. Biomechanics of cellular solids. J Biomech 2005;38:377–99.

I. Christodoulou, P.J. Tan / Engineering Fracture Mechanics 104 (2013) 140–161 161
[13] Tekoglu C, Onck PR. Size effects in two-dimensional voronoi foams: a comparison between generalized continua and discrete models. J Mech PhysSolids 2008;56:3541–64.
[14] de Berg M, van Kreveld M, Overmars M, Schwarzkopf O. Computational geometry: algorithms and applications. 2 ed. Berlin Heidelberg: Springer-Verlag; 2000.
[15] Zhu HX, Hobdell JR, Windle AH. Effects of cell irregularity on the elastic properties of 2D Voronoi honeycombs. J Mech Phys Solids 2001;49:857–70.[16] Chen C, Lu TJ, Fleck NA. Effect of imperfections on the yielding of two-dimensional foams. J Mech Phys Solids 1999;47:2235–72.[17] Williams ML. On the stress distribution at the base of a stationary crack. J Appl Mech 1957;24:109–14.[18] Kanninen MF, Popelar CH. Advanced fracture mechanics. New York: OUP; 1985.[19] Shih CF. Small-scale yielding analysis of mixed mode plane-strain crack problems. ASTM STP 1974;560:187–210.[20] Thiyagasundaram P, Wang J, Sankar BV, Arakere NK. Fracture toughness of foams with tetrakaidecahedral unit cells using finite element based
micromechanics. Engng Fract Mech 2011;78(6):1277–88.[21] Smith DJ, Ayatollahi MR, Pavier MJ. On the consequences of T-stress in elastic brittle fracture. Proc R Soc A 2006;462:2415–37.[22] Leevers PS, Radon JC. Inherent stress biaxiality in various fracture specimen geometries. Int J Fracture 1982;19:311–25.[23] Motz S, Pippan R. Fracture behaviour and fracture toughness of ductile closed-cell metallic foams. Acta Mater 2002;50:2013–33.