Embed Size (px)
Citation preview

Engineering Fracture Mechanics 77 (2010) 3227–3245
Contents lists available at ScienceDirect
Engineering Fracture Mechanics
journal homepage: www.elsevier .com/locate /engfracmech
Fracture toughness of exponential layer-by-layerpolyurethane/poly(acrylic acid) nanocomposite films
E. Kheng a, H.R. Iyer a, P. Podsiadlo c,d, A.K. Kaushik a, N.A. Kotov c, E.M. Arruda a, A.M. Waas a,b,⇑a Department of Mechanical Engineering, University of Michigan, Ann Arbor, MI 48109, USAb Department of Aerospace Engineering, University of Michigan, Ann Arbor, MI 48109, USAc Department of Chemical Engineering, University of Michigan, Ann Arbor, MI 48109, USAd Center for Nanoscale Materials, Argonne National Laboratory, Argonne, IL 60439, USA
a r t i c l e i n f o
Article history:Received 29 January 2010Received in revised form 27 July 2010Accepted 8 August 2010Available online 31 August 2010
Keywords:NanocompositeFracture toughnessThin filmFinite strainFinite elements
0013-7944/$ - see front matter � 2010 Elsevier Ltddoi:10.1016/j.engfracmech.2010.08.006
⇑ Corresponding author at: Department of MechaE-mail address: [email protected] (A.M. Waas).
a b s t r a c t
This paper characterizes the fracture toughness of layer-by-layer (LBL) manufactured thinfilms with elastic polyurethane, a tough polymer, and poly(acrylic acid) as a stiffeningagent. A single-edge-notch tension (SENT) specimen is used to study mode I crack propa-gation as a function of applied loading. Experimental results for the full-field time historiesof the strain maps in the fracturing film have been analyzed to obtain R-curve parametersfor the nanocomposite. In particular, by using the strain maps, details of the traction laware measured. A validated finite strain phenomenological visco-plastic constitutive modelis used to characterize the nanocomposite film while a discrete cohesive zone model(DCZM) is implemented to model the fracture behavior. The LBL manufactured nanocom-posite is found to display a higher fracture toughness than the unstiffened base polymer.
� 2010 Elsevier Ltd. All rights reserved.
1. Introduction
There is growing interest in manufacturing synthetic nanocomposites with nano-scale control, that have the fine hierar-chial structure found in natural nanocomposites, such as seashell nacre, bone, or spider silk [1–3]. Such nanocomposites arefound to display exceptional mechanical properties, e.g. fracture toughness, strength and stiffness, often exceeding the prop-erties of man made synthetics. The layer-by-layer (LBL) manufacturing technique [4] has been used to produce hierarchicallystructured materials with very high strengths and stiffnesses relative to their constituent materials [5–7]. A necessary draw-back of LBL manufacturing is the slow deposition rate, which limits the shape and form of materials prepared with this meth-od to thin films and coatings.
Of concern in this paper is the characterization of fracture toughness of exponential LBL manufactured polymer nanocom-posites composed of a water-soluble polymer and a water-soluble stiffening agent that has a good distribution of the hard-ening agent through the polymer matrix [6,7]. The exponential LBL method has lead to a significant reduction in themanufacturing time of the assembled films. The polymer and the stiffening agent are oppositely charged, resulting in strongionic bonds between the polymer matrix and the hardening agent. In the present study, tough and elastic polyurethane isused as the base matrix polymer, and poly(acrylic acid) is used as the stiffening agent, resulting in a nanocomposite withimproved stiffness and considerable ductility.
When a pre-existing crack in these films is advanced by the application of mechanical loads, severe crack blunting is firstobserved with a large plastic zone surrounding the crack tip that dissipates energy. This plastic zone can activate severalnano-scale mechanisms that leads to a R-curve response [8]. The additional toughening is regarded as a basic material
. All rights reserved.
nical Engineering, University of Michigan, Ann Arbor, MI 48109, USA.

3228 E. Kheng et al. / Engineering Fracture Mechanics 77 (2010) 3227–3245
property that can be captured by a homogenized, non-linear traction-separation law, in conjunction with a suitable finiteelement simulation of specimen geometry and loading. In order to carry out this analysis, it is also necessary to characterizethe constitutive response of the films undergoing finite deformation.
The fracture toughness is measured by carrying out a series of single edge-notch tension mode-I fracture tests on freestanding nanocomposite thin films (plane stress). Numerical simulation of the fracture tests in association with an accuratefinite deformation constitutive model for the film material leads to a method that allows calculation of the fracture energy. Inthe numerical simulation, carried out using the commercial software ABAQUS, a discrete cohesive zone model (DCZM) [10] isimplemented to represent the material ahead of the initial crack. During the quasi-static growth of the crack, an increment ofexternal work input is balanced by the sum of the stored strain energy, the plastic energy dissipated and the energy asso-ciated with fracture. Therefore the latter can be determined by knowing the plastic energy dissipated, the elastic energystored and the external work done to advance the crack.
To accurately obtain the plastic energy dissipated while accounting for loading rate effects, the film’s constitutive behav-ior has to be accurately modeled for both loading and unloading that occurs during the crack growth event. A phenomeno-logical visco-plastic constitutive model, which is an extension of the Arruda–Boyce model [15,13], is used to capture the non-linear large strain visco-plastic behavior with large residual plastic strains after unloading.
The DCZM elements which represent the fracture zone are prescribed through a non-linear traction-separation law whichis iterated to match the numerical predictions to the experimental measurements. A traction-separation law has two defin-ing characteristics – the cohesive strength and the fracture toughness [18]. Since the cohesive strength can be determinedfrom careful examination of the experimental strains, the fracture toughness distribution is the only unknown for which iter-ation is needed. The traction-separation law numerically reproducing the experiment therefore provides the fracture tough-ness distribution in the fracture zone. The fracture toughness distribution that results in the best match of the numericalsimulation to the experiment gives us insight to the toughening mechanisms at work in the fracture zone. R-curve behavioris observed along the fracture zone. A larger fracture toughness and cohesive strength are observed further from the initialcrack, implying that both these quantities are increased as more plastic work is done in the neighboring substrate as thecrack advances.
2. Experiments
2.1. Manufacturing the films and samples
The films are manufactured by alternately dipping glass slides into dilute aqueous dispersions (1 wt.%) of positivelycharged polyurethane and negatively charged poly(acrylic acid) (PU/PAA). To manufacture a single film, this process is re-peated 100 times and produces a thin film that has an average thickness of 40 lm. The films are detached from the glassslide using hydro-fluoric acid and then dried in a heated chamber. Single-film samples are manufactured on standard micro-scope glass slides, resulting in a length of approximately 70 mm and a height of 25 mm. These are cut to the appropriate sizesfor various characterization tests. A free standing film is shown in Fig. 1. The PU/PAA samples discussed in this paper are allfive-film stacks, and are manufactured by pressing five single-film samples together in a heated hydraulic press at 110 �C and15 MPa for 30 min. A pure cationic polyurethane (PU) sample is also made from the polyurethane solution by heating thesolution in a petri dish, thereby removing the water molecules. The pure PU sample is studied for the purpose of comparison.
2.2. Tensile tests of the films
The strain rate-dependent properties of the films are measured by tensile tests using specimens illustrated in Fig. 2. Ten-sile test samples are manufactured to a total length of 25 ± 1 mm, a gauge length of 13 ± 2 mm and a height of 2.5 ± 0.5 mm.
Fig. 1. Photograph of translucent eLBL PU/PAA film after detaching and heating.

Fig. 2. Tensile test specimens.
E. Kheng et al. / Engineering Fracture Mechanics 77 (2010) 3227–3245 3229
The tests were carried out on samples that were between 200 lm and 300 lm thick, under displacement control loading atnominal rates of 0.16 mm/s and 0.016 mm/s. Characteristic engineering stress–engineering strain curves for the samples areshown in Fig. 3. Strains are determined using optical images taken with a high resolution camera of a speckle pattern dis-tributed on the surface of the film using acrylic paint applied with an airbrush, and the tensile force in the specimens is mea-sured with a load cell attached to the mechanical testing machine. Thicknesses of the samples are measured with the aid of ascanning electron microscope. The samples are coated with a 5 nm thick gold layer to prevent charging and damage of thesample in the scanning electron microscope. The tensile test results are used to characterize the film material for the finiteelement model that is used in the present work.
2.3. Single notch fracture tests
The fracture toughness of a thin film in plane stress is measured by matching numerical simulations to physical exper-iments of a single-edge-notch tension mode-I fracture test. This section describes these experimental fracture tests.
The samples are attached to flat sample holders with a thin layer of epoxy and a single notch is made with a surgical razorblade in the film perpendicular to an edge as shown in Fig. 4. The free standing film between the sample holders is5 ± 0.3 mm by 25 ± 2 mm. The initial crack is cut to dimension of 4.5 ± 0.5 mm, leaving an un-fractured height, h0, of20.5 ± 0.5 mm. A fixed coordinate system is used to discuss the experimental results and associated numerical simulationresults. The origin of the coordinate system is located along the expected crack plane, at the midpoint of the height of thespecimen, as indicated in Fig. 4. The fracture tests are carried out on a displacement controlled table-top tensile test setupwith a step-motor drive. The setup is shown in Fig. 5. The displacement rate is set to 0.003 mm/s. Images of the speckle pat-tern are captured once every ten seconds. The displacement between the sample holders is measured with a linear variabledifferential transformer (LVDT) and is confirmed with the data obtained from the speckle pattern. The tensile forces are mea-sured with a 150 N load cell. The resolution of the load cell is 0.0068 N, which corresponds to a resolution in stress of0.0013 MPa. The resolution of the LVDT is 0.00012 mm. The strain resolution of the digital image correlation technique is0.001.
Fig. 3. Characteristic engineering stress–engineering strain curves of 5 film PU/PAA stacks at different stretch rates.

Fig. 4. Dimensions of experimental setup of film samples.
3230 E. Kheng et al. / Engineering Fracture Mechanics 77 (2010) 3227–3245
2.4. Force displacement description of fracture tests
The PU/PAA samples all fractured in a uniform manner, with the crack propagating cleanly through the un-fractured heightof the sample in the middle (the ‘‘ligament”) of the sample. Fig. 6a and Fig. 6b describes the fracture. The data set for the PU/PAA samples show minimal variation – samples 1–3 represent a repeatable data set. These curves are shown in Fig. 7.
The data set for the pure PU samples also shows minimal variation, the two samples tested agree with each other. Thesecurves are shown in Fig. 8a. The PU/PAA samples have a maximum stress of 16 MPa and a maximum normalized displace-ment of 1.45. The PU/PAA samples also have an overall energy density of 80.9 N/mm. This energy density is obtained by nor-malizing the total energy expended by the ligament cross-sectional area. It is noted that the overall energy density includes

Fig. 5. Experimental setup.
E. Kheng et al. / Engineering Fracture Mechanics 77 (2010) 3227–3245 3231
the energy expended in the plastic deformation of the substrate as well as the fracture of the specimen. The PU fracture testsshow that the pure polyurethane has a much lower maximum stress of 4 MPa, but a higher normalized displacement of 4.16.The overall energy density of pure PU is 58.2 N/mm. Fig. 8b is a comparison of the normalized force against normalized dis-placement curves for pure PU and PU/PAA.
2.5. Crack location of fracture tests
The speckle patterns on either side of the crack tip are analyzed by following the deformation history of selected isolatedspeckles on either side of the crackpath. For each unique pair of speckles, the relative change of distance-horizontal displace-ment plots are obtained as in Fig. 9. It is determined that the crack has moved between a pair of speckles when the rate ofrelative change of distance between them increases abruptly, indicating that the material between them has broken at thattime step. In this manner, the instantaneous crack position as a function of time, and hence, as a function of external load isrecorded. A typical crack position graph for the PU/PAA sample is shown in Fig. 10.
2.6. Strain map of fracture tests
In addition to the force–displacement data, the speckle images are analyzed to gather other local information. Thestretches in the 1 direction are analyzed at specific points in the specimen as the crack grows. Partial unloading is observedas the crack moves past specific points. Plots for the PU/PAA samples are included in Figs. 11 and 12.
The Lagrangian strain tensor Eij can be related to several deformation measures as shown in [12]. The E11 componentstrain is related to the principal stretch k1 through:
k1 ¼ffiffiffiffiffiffiffiffiffiffiffiffiffiffiffiffiffiffi1þ 2E11
pð1Þ
where
E11 ¼du1
dX1þ 1
2du1
dX1
� �2
þ du2
dX1
� �2" #
ð2Þ
and,
ui ¼ xi � Xi ð3Þ
Here, ui is the ith displacement component which is related to the undeformed, Xi, and deformed, xi, coordinates of the mate-rial point being analyzed.
2.7. Full-field strain maps and fracture stress calibration
In addition to the stretches computed as described above, Aramis software version 1.6 is used to calculate strain maps ofthe sample during deformation. A sample strain, E11, map is shown in Fig. 13. The Aramis strain maps show that a strain

Fig. 6. Description of fracture. Initial crack propagates through the height of the sample, resulting in fast fracture.
3232 E. Kheng et al. / Engineering Fracture Mechanics 77 (2010) 3227–3245
concentration moves ahead of the crack tip. The onset of the strain concentration signals the activation of the fracture event.Consider a horizontal line drawn across the Aramis plot in Fig. 13a. It is seen that the E11 strain is uniform across this hor-izontal cross section. The same horizontal line is drawn in Fig. 13b and here it is noted that the E11 strain is no longer uni-form. This indicates that the strain at the centerline is higher than near the grips. This strain concentration indicates thatthere is softening in this region, allowing the strain to increase much more at this location for a given state of loading. Thissoftening is associated with the rate dependent plastic energy that is dissipated while the crack is advancing, consequently,

Fig. 7. Normalized fracture curves for 5 film PU/PAA stacks.
E. Kheng et al. / Engineering Fracture Mechanics 77 (2010) 3227–3245 3233
capturing this plastic dissipation accurately is needed in order to extract the fracture toughness of the films. The stress atwhich the fracture event is activated can be identified by examining the true stress–true strain curve from the material char-acterization tests. Since the full-field strains are extracted from the Aramis data, correlating this strain to the true stress–truestrain curve allows determination of the local stress. This process is repeated for different points along the centerline and afracture stress calibration is obtained in the form of an R-curve [9,8]. The experimental fracture stresses as a function of po-sition as well as the R-curve representing the changing resistance to crack advance are shown in Fig. 14. This measured dis-tribution of cohesive strength is important in establishing numerical models for studying fracture of these films.
3. Finite element model
3.1. Description of the PU/PAA constitutive model
The large deformation stress–strain behavior of the polymer nanocomposite shows the following response:
1. Non-linear large strain visco-plastic behavior.2. Strain rate dependence which is low but is present.3. High plastic strains after unloading.
A phenomenological visco-plastic constitutive model was developed that captures the observed macroscopic mechanicalresponse of the material. The kinematics of the constitutive model developed for the PU/PAA polymer nanocomposite isbased on that for thermoplastic polyurethane (TPU), developed by Qi and Boyce [13,14], a schematic representation of whichis shown in Fig. 15. There are two branches that are in parallel – a non-linear spring branch which is based on the eight-chainArruda–Boyce model [15], and the elasto-visco-plastic component, which in turn consists of a linear elastic spring and a vis-co-plastic dashpot. The macroscopic deformation gradient F acting on both these branches is the same and the total Cauchystress T is the sum of the contributions from each branch.
FN ¼ FV ¼ F ð4ÞT ¼ TV þ TN ð5Þ
where the superscript N refers to the non-linear hyperelastic spring and V to the visco-plastic branch in the model.The hyperelastic rubbery spring captures the entropy change due to the orientation and stretching of the molecular net-
work. The eight-chain model developed by Arruda and Boyce [15], is used in computing the stresses as it captures the equi-librium large stretch behavior accurately. Volume changes are neglected in this branch by computing the stresses based onthe deviatoric part of the macroscopic deformation gradient as shown below. The reader is refered to [15] for more details ofthe present model. The expression for the Cauchy stress in this branch has the form:
TN ¼ lr
3J
ffiffiffiffiNp
kchainL�1 kchainffiffiffiffi
Np
� �B0 ð6Þ
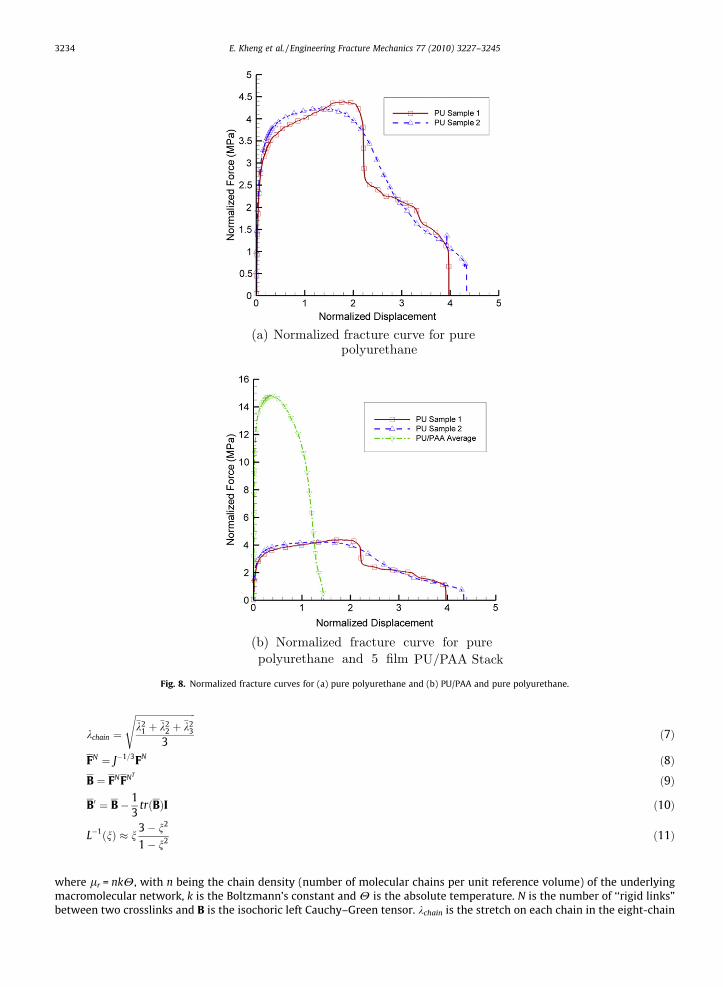
Fig. 8. Normalized fracture curves for (a) pure polyurethane and (b) PU/PAA and pure polyurethane.
3234 E. Kheng et al. / Engineering Fracture Mechanics 77 (2010) 3227–3245
kchain ¼
ffiffiffiffiffiffiffiffiffiffiffiffiffiffiffiffiffiffiffiffiffiffiffiffiffiffi�k2
1 þ �k22 þ �k2
3
3
sð7Þ
FN ¼ J�1=3FN ð8Þ
B ¼ FNFNT ð9Þ
B0 ¼ B� 13
trðBÞI ð10Þ
L�1ðnÞ � n3� n2
1� n2 ð11Þ
where lr = nkH, with n being the chain density (number of molecular chains per unit reference volume) of the underlyingmacromolecular network, k is the Boltzmann’s constant and H is the absolute temperature. N is the number of ‘‘rigid links”between two crosslinks and B is the isochoric left Cauchy–Green tensor. kchain is the stretch on each chain in the eight-chain

Fig. 9. Sample strain of two dots on either side of crack surface.
Fig. 10. Comparison of experimental and numerical crack position curves for 5 film PU/PAA stack.
E. Kheng et al. / Engineering Fracture Mechanics 77 (2010) 3227–3245 3235
network that is computed based on the squares of the principal stretches k1, k2 and k3, which are obtained by the spectraldecomposition of the left Cauchy–Green strain tensor.
The elasto-visco-plastic branch has a multiplicative split of the deformation gradient, which is used in computing the partof the deformation seen by the linear elastic spring. The initial elastic part of the overall non-linear macroscopic response ofthe material is accounted for through the stress contribution from the linear spring.
FV ¼ FVeFVt ð12Þ
where FVe is the deformation gradient of the elastic spring and FVt is the deformation gradient of the visco-plastic dashpot.Furthermore, the decomposition of the velocity gradient LV gives
LV ¼ _FV FV�1¼ _FVeFVe�1
þ FVe _FVtFVt�1FVe�1
ð13Þ
LVt ¼ _FVtFVt�1 ¼ DVt þWVt ð14Þ
where DVt and WVt are the rate of stretching and the spin, respectively.Without loss of generality, we take [16]

Fig. 11. Comparison of experimental and numerical strain curve at Y = 5 mm for 5 film PU/PAA stack.
Fig. 12. Comparison of experimental and numerical strain curve at Y = 7.5 mm for 5 film PU/PAA stack.
3236 E. Kheng et al. / Engineering Fracture Mechanics 77 (2010) 3227–3245
FVe ¼ VVeRVe ð15Þ
TV ¼ 1detFVe Le ln VVe
� �ð16Þ
WVt ¼ 0 ð17Þ
where, Le is the fourth-order tensor modulus of elastic constants; VVe and RVe are the left stretch tensor and the rotation ten-sor, obtained from the polar decomposition of the elastic deformation gradient.
The visco-plastic stretch rate DVt is constitutively prescribed as
DVt ¼_ctffiffiffi2p
svTV 0 ð18Þ
where _ct denotes the visco-plastic shear strain rate and sV is the equivalent shear stress. The constitutive equation for theevolution of visco-plastic shear strain rate is given as
_ct ¼ _c0exp �A � skH
1� sV
s
� �� �� �ð19Þ
in which _c0 is the pre-exponential factor proportional to the attempt frequency and s is the athermal shear strength, whichrepresents the resistance to the visco-plastic shear deformation.

Fig. 13. Aramis strain maps.
Fig. 14. Stress calibration for PU/PAA.
E. Kheng et al. / Engineering Fracture Mechanics 77 (2010) 3227–3245 3237

3238 E. Kheng et al. / Engineering Fracture Mechanics 77 (2010) 3227–3245
sV ¼12
TV 0 : TV 0� �
ð20Þ
The rate and temperature dependency of the material is captured within the evolution equations for the dashpot.The uniaxial tension tests performed on PU/PAA polymer nanocomposite helps in understanding the overall macroscopic
response of the material during loading and unloading. In the use of the constitutive model for the numerical computation offracture toughness, it is essential to fit both the loading and unloading, so as to accurately match the area under the stress–strain curve. On comparing the mechanical behavior of polyurethane with that of PU/PAA nanocomposite, we notice signif-icantly higher residual plastic strains after unloading in the latter. The evolution in the athermal shear strength is essential infitting the unloading response of the polymer nanocomposite [17]
_s ¼ hð1� s=sssÞ _cp with; sð0Þ ¼ s0sð1Þ ¼ sss ð21Þ
where h is a measure of the rate of increase in s.
3.2. Implementation of the constitutive model and identification of material parameters
A fully three-dimensional model based on the described constitutive equations was implemented as a user defined mate-rial (umat) subroutine in the commercial finite element application Abaqus. This subroutine was used in running simulationsat the same strain rates as used in the experimental uniaxial tensile tests. The material parameters were varied to fit the truestress vs. true strains for the polymer nanocomposite. All simulations were run at a constant temperature of 296 K with pre-scribed displacement vs. time function.
Comparison of the results from the uniaxial tension experiments and the simulations show the following key character-istics of the constitutive model. These are compared in Figs. 16–18 for slow through fast rates of strain.
Fig. 15. Constitutive model.
Fig. 16. Experimental and numerical substrate model comparison of PU/PAA at 0.005/s.

Fig. 17. Experimental and numerical substrate model comparison of PU/PAA at 0.05/s.
Fig. 18. Experimental and numerical substrate model comparison of PU/PAA at 0.1/s.
E. Kheng et al. / Engineering Fracture Mechanics 77 (2010) 3227–3245 3239
� The general non-linear response of the material during loading is matched well as we observe the initial elastic responsefollowed by the strain hardening and finally the steep rise in the stresses.� The low strain rate dependency is incorporated by adjusting the parameters associated with the visco-plastic dashpot.� The shape of the unloading curve and the residual plastic strains can be satisfactorily matched with the experimental
results. This allows for a good comparison of the area under the loading–unloading curve in both the experiments andsimulation.
The determination of material parameters was done based on the experimental data. The value of Young’s modulus E wasfound by measuring the initial slope of the stress–strain curve. Poisson’s ratio m was taken to be 0.30. The initial athermalshear yield strength s0 is calculated from the elastic constants (refer to Table 1). The strain rate and temperature dependenceof the initial yield are modeled with the material constants _c0 and A. To obtain these constants, (19) is rearranged to be anequation for a line
lnð _ctÞ ¼ Bþ Csv
S
� �ð22Þ
C ¼ A � SkH
ð23Þ
B ¼ lnð _c0Þ � C ð24Þ

Table 1Material parameters for PU/PAA.
Material property Symbol Value
Young’s modulus E 620 [MPa]Poisson’s ratio t 0.30Pre-exponential factor _c0 105 [s�1]
A 3.5 � 10�18 [mm3]Rate of resistance drop w.r.t. plastic strain h 60 [MPa]
Cr = nkH 9.5 [MPa]Locking stretch
ffiffiffiffiNp ffiffiffiffiffiffiffiffiffiffi
1:80p
Initial athermal shear yield strength s0 0:77 l1�l
Steady state value of athermal yield strength sss 1.80 � s0
3240 E. Kheng et al. / Engineering Fracture Mechanics 77 (2010) 3227–3245
The tensile locking stretchffiffiffiffiNp
can be estimated by computing the limiting strain found from the stress–strain curves e�l . Aninitial approximation for lr can be determined by measuring the initial slope of the strain hardening curve in the experimen-tal data. The parameters, h and sss, are found by trial and error method, to find the best fit for both the loading and unloadingpart of the curve.
The material parameters identified for the PU/PAA nanocomposite are given in Table 1.
3.3. Description of the polyurethane material model
Modeling of the mechanical response of polyurethane is done based on the same phenomelogical approach taken for thePU/PAA polymer nanocomposite. As a first attempt to model the polyurethane films, the constitutive model for thermoplas-tic polyurethanes by Qi and Boyce [14] was used. This model presents a limitation in accurately simulating both the loadingand unloading part of the uniaxial tests. Hence, the constitutive model for the polymer nanocomposite is applied and thematerial parameters identified based on the experimental results from polyurethane films. The comparison of the materialbehavior of polyurethane with respect to the PU/PAA clearly shows a comparatively lower initial elastic stiffness and loweryield stress, which are reflected in the material parameters identified for polyurethane. The material parameters for PU andPU/PAA capture the unloading part of the response after matching the loading part of the response consistently.
Comparison of the results from the uniaxial tension experiments and the simulations show the following key character-istics of the constitutive model. These are compared in Figs. 19 and 20 for slow through fast rates of strain.
The material properties for PU are given in Table 2.
3.4. Description of the DCZM model
The DCZM model is comprised of eight-node user elements, with four nodes residing on either fracture surface. Thesenodes generate binding forces with their corresponding pair on the opposite fracture surface, while the fracture energyand binding forces are computed using the current surface area calculated from the positions of the four nodes. The inter-pretation of the fracture toughness is with respect to the current area of the fracture surface, since the thickness of the frac-
Fig. 19. Experimental and numerical substrate model comparison of polyurethane at 0.005/s.

Fig. 20. Experimental and numerical substrate model comparison of polyurethane at 0.1/s.
Table 2Material parameters for pure PU.
Material property Symbol Value
Young’s modulus E 50 [MPa]Poisson’s ratio t 0.45Pre-exponential factor _c0 0.1 [s�1]
A 2.0 � 10�17 [mm3]Rate of resistance drop w.r.t. plastic strain h 5.5 [MPa]
Cr = nkH 1 [MPa]Locking stretch
ffiffiffiffiNp ffiffiffiffiffiffiffiffiffiffi
9:60p
Initial athermal shear yield strength s0 0:77 l1�l
Steady state value of athermal yield strength sss 2.0 � s0
E. Kheng et al. / Engineering Fracture Mechanics 77 (2010) 3227–3245 3241
ture specimen is not constrained to remain constant. Other details of the DCZM model, which includes finite rotations, aredescribed in [11].
A modified trapezoidal traction-separation law is used for the elements. The modified traction-separation law is basedupon the trapezoidal traction-separation law for ductile materials [18], as shown in Fig. 21. The traction-separation law is
Fig. 21. Traction separation laws used in the simulations.
3242 E. Kheng et al. / Engineering Fracture Mechanics 77 (2010) 3227–3245
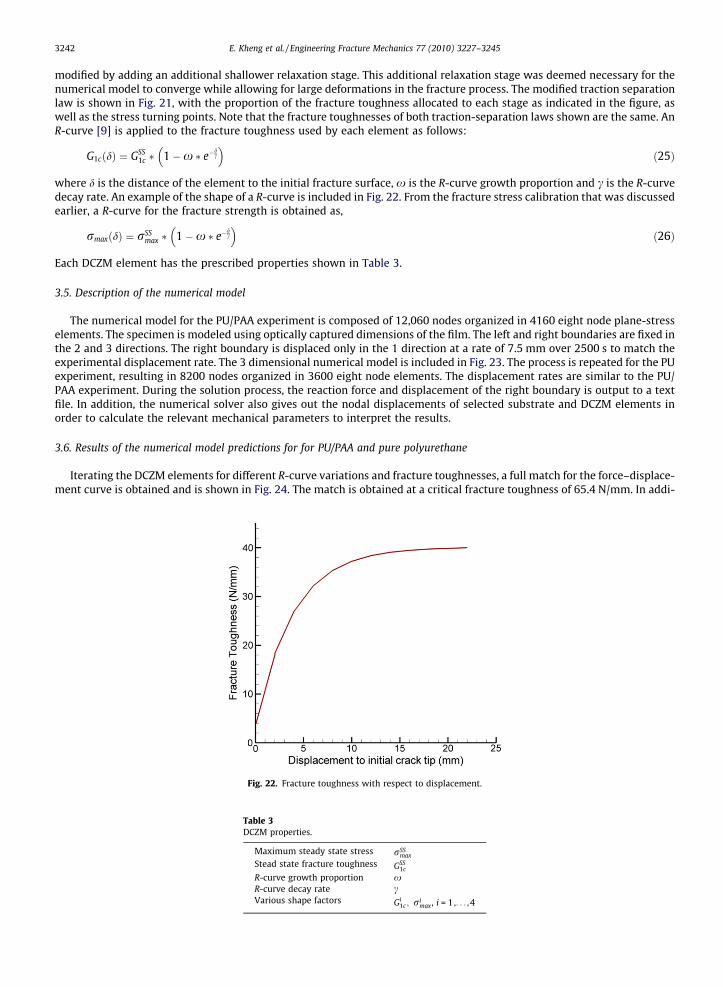
modified by adding an additional shallower relaxation stage. This additional relaxation stage was deemed necessary for thenumerical model to converge while allowing for large deformations in the fracture process. The modified traction separationlaw is shown in Fig. 21, with the proportion of the fracture toughness allocated to each stage as indicated in the figure, aswell as the stress turning points. Note that the fracture toughnesses of both traction-separation laws shown are the same. AnR-curve [9] is applied to the fracture toughness used by each element as follows:
G1cðdÞ ¼ GSS1c � 1�x � e�
dc
� �ð25Þ
where d is the distance of the element to the initial fracture surface, x is the R-curve growth proportion and c is the R-curvedecay rate. An example of the shape of a R-curve is included in Fig. 22. From the fracture stress calibration that was discussedearlier, a R-curve for the fracture strength is obtained as,
rmaxðdÞ ¼ rSSmax � 1�x � e�
dc
� �ð26Þ
Each DCZM element has the prescribed properties shown in Table 3.
3.5. Description of the numerical model
The numerical model for the PU/PAA experiment is composed of 12,060 nodes organized in 4160 eight node plane-stresselements. The specimen is modeled using optically captured dimensions of the film. The left and right boundaries are fixed inthe 2 and 3 directions. The right boundary is displaced only in the 1 direction at a rate of 7.5 mm over 2500 s to match theexperimental displacement rate. The 3 dimensional numerical model is included in Fig. 23. The process is repeated for the PUexperiment, resulting in 8200 nodes organized in 3600 eight node elements. The displacement rates are similar to the PU/PAA experiment. During the solution process, the reaction force and displacement of the right boundary is output to a textfile. In addition, the numerical solver also gives out the nodal displacements of selected substrate and DCZM elements inorder to calculate the relevant mechanical parameters to interpret the results.
3.6. Results of the numerical model predictions for for PU/PAA and pure polyurethane
Iterating the DCZM elements for different R-curve variations and fracture toughnesses, a full match for the force–displace-ment curve is obtained and is shown in Fig. 24. The match is obtained at a critical fracture toughness of 65.4 N/mm. In addi-
Fig. 22. Fracture toughness with respect to displacement.
Table 3DCZM properties.
Maximum steady state stress rSSmax
Stead state fracture toughness GSS1c
R-curve growth proportion xR-curve decay rate cVarious shape factors Gi
1c ; rimax , i = 1,. . . ,4

Fig. 23. 3D Abaqus model of the fracture sample. The left and right boundaries are under full displacement control in three dimensions, the film is allowedto deform in the thickness direction. The DCZM elements are denoted by the crosses (�) in the right hand view.
Fig. 24. Comparison of experimental and numerical force–displacement curves for 5 film PU/PAA stack.
E. Kheng et al. / Engineering Fracture Mechanics 77 (2010) 3227–3245 3243
tion to the force–displacement curve, the crack point location of the experiment is also accurately matched. The crack pointlocation is obtained in a similar fashion as in the experiment. The comparison is included in Fig. 10. The numerical predictionalso show a close match for the initial slope of the strain-time plots at two locations on the substrate in Figs. 11 and 12. Theinitial slope of the numerical strain closely matches the experimental slope. The turning point of the numerical strainmatches the turning point of the experiment.
In a similar manner, a full match for the force–displacement curve for pure polyurethane is obtained and shown in Fig. 25.The match is obtained at a critical fracture toughness of 61 N/mm. It is noted that fracture toughness of pure polyurethaneobtained in this manner maybe slightly overpredicted because the constitutive model that is used in the finite element pre-dictions stores less plastic energy than required.
3.7. SEM In situ experiments
Usually, the addition of nano-particles to a polymer material leads to a decrease in ductility and a corresponding decreasein fracture toughness. In the results reported here, the fracture toughness of stiffened polyurethane has been shown to be

Fig. 25. Comparison of experimental and numerical force–displacement curves for pure polyurethane.
3244 E. Kheng et al. / Engineering Fracture Mechanics 77 (2010) 3227–3245
slightly larger than the non-stiffened polyurethane. Thus, it is worthy to examine the mechanisms responsible for elevatingthe fracture toughness. In order to do this, single-edge-notch tension fracture tests are carried out in situ in a scanning elec-tron microscope. These tests allow observation of the micron-scale and high nano-scale fracture mechanisms present in thecomposite and unstiffened polymer.
It is observed that the layering of the nanocomposite results in large amounts of inter-layer shearing, similar to thedelamination toughening reported in layered systems like Aluminum–Lithium as reported in [19]. The inter-layer shearingresults in the expenditure of a larger amount of energy during the fracture process. Additional energy is expended when mi-cron sized voids grow when engulfed by the elevated stress process zone around the advancing crack. These new results willbe presented elsewhere.
4. Concluding remarks
The fracture toughness of exponential LBL manufactured PU/PAA films has been measured though a combination ofexperiment and finite element based simulation. Due to the large deformations associated with the fracture event, an accu-rate constitutive model, validated through experiments, has been used in conjunction with a new finite deformation basedformulation of the discrete cohesive zone model to extract the fracture toughness. Experimental results for full-field timehistories of the strain maps in the fracturing film have been analyzed to obtain the R-curve parameters for the five stack film.This R-curve behavior implies the presence of toughening mechanisms at work in the fracture process zone. The experimen-tal and numerical results presented in the paper show good agreement for the PU/PAA films as well as for similar fracturetests with pure polyurethane films. For the PU/PAA films, the mode-I fracture toughness was found to be 65 N/mm, while forthe pure PU this value was 61 N/mm. It should be noted that stiffened composites generally have lower fracture toughnesseswith respect to their unstiffened base materials. In view of the enhanced stiffness and strength of the PU/PAA [5], the LBLmanufacturing process has resulted in a material with elevated stiffness and strength, while also elevating the fracturetoughness.
References
[1] Coyne KJ, Qin XX, Waite JH. Extensible collagen in mussel byssus: a natural block copolymer. Science 1997;277(5333):1830–2.[2] Barthelat F, Espinosa HD. An experimental investigation of deformation and fracture of nacre-mother of pearl. Exp Mech 2007;47(3):311–24.[3] Chen Q, Chasiotis I, Chen C, Roy A. Nanoscale and effective mechanical behavior and fracture of silica nanocomposites. Compos Sci Technol
2008;68(15–16):3137–44.[4] Decher G. Fuzzy nanoassemblies: toward layered polymeric multicomposities. Science 1997;277(5330):1232–7.[5] Podsiadlo P, Arruda EM, Kheng E, et al. LBL assembled laminates with hierarchical organization from nano- to microscale: high-toughness
nanomaterials and deformation imaging. ACS Nano 2009;3(6):1564–72.[6] Podsiadlo P, Kaushik AK, Arruda EM, Waas AM, Shim BS, Xu JD, et al. Ultrastrong and stiff layered polymer nanocomposites. Science
2007;318(5847):80–3.[7] Podsiadlo P, Michel M, Lee J, Verploegen E, Kam NWS, Ball V, et al. Exponential growth of LBL films with incorporated inorganic sheets. Nano Lett
2008;8(6):1762–70.[8] Suo Z, Fan B. Delamination R-curve phenomena due to damage. J Mech Phys Solids 1992;40(1):1–16.[9] Gdoutos EE. Crack growth based on energy balance. Fracture mechanics criteria and applications. Norwell (MA): Kluwer Academic Publishers; 1990. p.
112–59 [Chapter 4].[10] Xie D, Waas AM. Discrete cohesive zone model for mixed-mode fracture using finite element analysis. Engng Fract Mech 2006;73(13):1783–96.

E. Kheng et al. / Engineering Fracture Mechanics 77 (2010) 3227–3245 3245
[11] Xie D, Salvi AG, Sun C, et al. Discrete cohesive zone model to simulate static fracture in 2D triaxially braided carbon fiber composites. J Compos Mater2006;40(22):2025–46.
[12] Fung YC. A first course in continuum mechanics. Englewood Cliffs (NJ): Prentice-Hall; 1969.[13] Qi HJ, Boyce MC. Constitutive model for stretch-induced softening of the stress-stretch behavior of elastomeric materials. J Mech Phys Solids
2004;52:2187–205.[14] Qi HJ, Boyce MC. Stress–strain behavior of thermoplastic polyurethane. Mech Mater 2005;31:817–39.[15] Arruda EM, Boyce MC. A three-dimensional constitutive model for the large stretch behavior of rubber elastic materials. J Mech Phys Solids
1993;41:389–412.[16] Boyce MC, Weber GG, Parks DM. On the kinematics of finite strain plasticity. J Mech Phys Solids 1989;37:647–65.[17] Boyce MC, Parks DM, Argon AS. Large inelastic deformation of glassy polymers, part I: rate-dependent constitutive model. Mech Mater 1988;7:15–33.[18] Sun C, Thouless MD, Waas AM, Schroeder JA, Zavattieri PD. Ductile–brittle transitions in the fracture of plastically deforming, adhesively bonded
structures. Part II: numerical studies. Int J Solids Struct 2008;45:4725–38.[19] Rao KTV, Ritchie RO. Mechanisms influencing the cryogenic fracture-toughness behavior of aluminum–lithium alloys. Acta Metall Mater
1990;38(11):2309–25.