Embed Size (px)
Citation preview

Technical Report CERC-93-19December 1993
im AD-A275241US Army Corps AD-A275of Engineers 1111 l1i1 l 0Waterways ExperimentStation
Engineering Design Guidancefor Detached Breakwaters asShoreline Stabilization Structures
by Monica A. Chasten, Julie D. Rosati, John W. McCormickCoastal Engineering Research Center
Robert E. RandallTexas A&M University
OTICELECTEFEB 0 11994
Approved For Public Release; Distribution Is Unlimited
94-03110
Prepared for Headquarters, U.S. Army Corps of Engineers

The contents of this report are not to be used for advertising,publication, or promotional purposes. Citation of trade namesdoes not constitute an official endorsement or approval of the useof such commercial products.
O FRIMNWON RBCYQC iDPAM

Technical Report CERC-93-19December 1993
Engineering Design Guidancefor Detached Breakwaters asShoreline Stabilization Structuresby Monica A. Chasten, Julie D. Rosati, John W. McCormick
Coastal Engineering Research Center
U.S. Army Corps of Engineers -AZcesion ForWaterways Experiment Station N C -3909 Halls Ferry Rvad NTIS CRA&JVicksburg, MS 39180-6199 DTIC TABU :announced [
Dr. Robert E. Randall Justification.......
Texas A&M UniversityOcean Engineering Program Di.-t ibution ICivil Engineering DepartmentCollege Station, TX 77843 Availability Codes
Dist Avail and /orSpecial
0TIC QUALITY INSPECTED 8
Final reportApproved for public release; distribution is unlimited
Prepared for U.S. Army Corps of Engineers
Washington, DC 20314-1000
Under Work Unit 32748

US Army Corpsof EnginesersWaterways Experment N
WtaterasEprmetSainonaoigl-ubianDtWAI•NADAI NTORYl~
Engineering design guidance for detached breakwaters as shoreline sta-
bilization structures / by Monica A. Chasten ... [et al.], Coastal Engineer-ing Research Center ; prepared for U.S. Army Corps of Engineers.
167 P. :ill. ; 28 cm. - (Technical report ; CERC-93-19)Includes bibliographical references.1. Breakwaters -- Design and construction. 2. Shore protection.
3. Coastal engineering. I. Chasten, Monica A. II. United States. Army.Corps of Engineers. II. Coastal Engineedng Research Center (U.S.)
IV. U.S. Army Engineer Waterways Experiment Station. V. Series: Tech-nical report (U.S. Army Engineer Waterways Experiment Station);CERC-93-1 9.TA7 W34 no.CERC-93-19

Contents
Preface........................................... xi
Conversion Factors, Non-SI to SI Units of Measuremt ............ xii
I- Introduction ..................................... 1General Description ................................ 1Breakwater Types .................................. 2Prototype Experience ................................ 3Existing Design Guidance ............................. 6Objectives of Report ................................ 11
2-Functional Design Guidance ........................... 12
Functional Design Objectives ........................... 12Design of Beach Planform ............................ 13Functional Design Concerns and Parameters................ 17Data Requirements for Design .......................... 31Review of Functional Design Procedures .................... 36Review of Empirical Methods .......................... 37
3-Tools for Prediction of Morphologic Response ................ 50
Introduction ...................................... 50Numerical Models .................................. 50Physical Models ................................... 63
4-Structural Design Guidance ............................ 77
Structural Design Objectives ........................... 77Design Wave and Water Level Selection .................... 77Structural Stability ................................... 80Performance Characteristics ............................ 89Detailing Structure Cross Section ........................ 94Other Construction Types ............................. 98
5--Other Design Issues ............................... 102
Environmental Concerns ............................. 102Importance of Beach Fill in Project Design ................. 104
Ui

Otimization of Design and Costs ....................... 105Constructibiity issues .............................. 107Post-Costruction Monitoring .......................... 109
6-Summary and Conclusions ........................... 113
Report Summary ................................. 113Additional Research Needs ........................... 114
References ....................................... 115
Appendix A: Case Design Example of a DetachedBreakwater Project ........................ Al
Appendix B: Notation ................................ BI
Ust of Figures
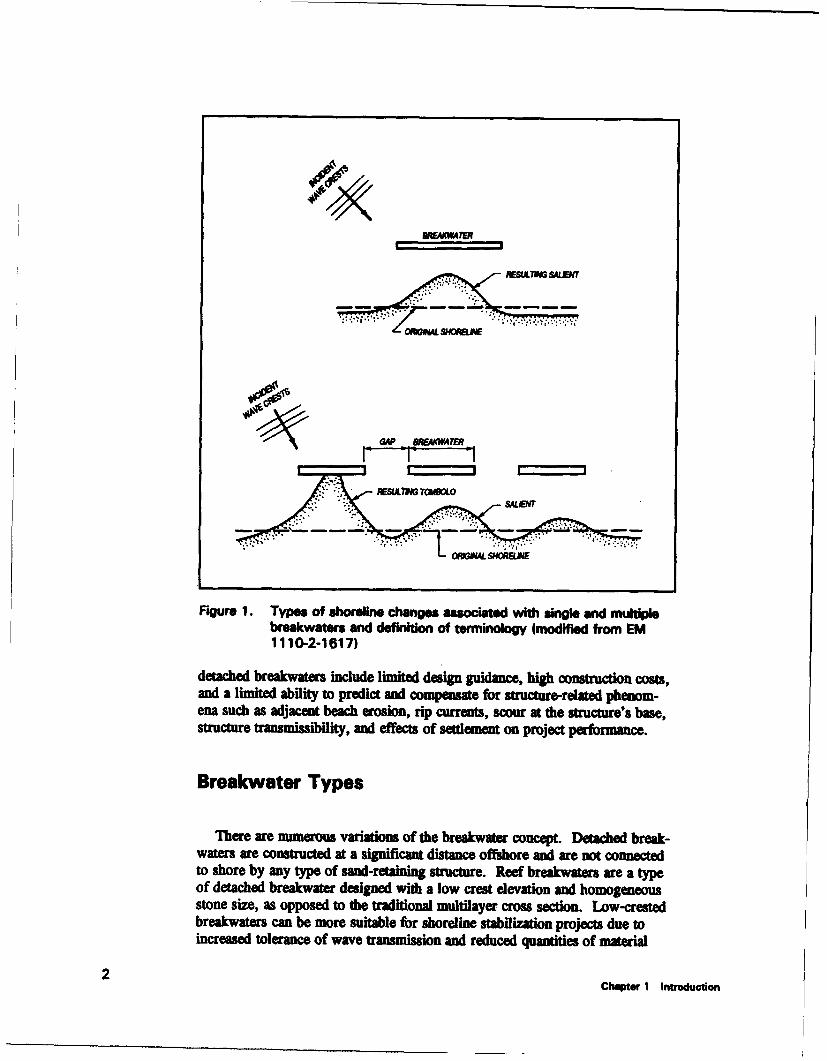
Figure 1. Types of shoreline changes associated with singleand multiple breakwaters and definition ofterminology (modified from EM 1110-2-1617) ........ 2
Figure 2. Segmented detached breakwaters at Presque Isle,Pennsylvania, on Lake Erie, fall 1992 ............. 4
Figure 3. Detached breakwaters in Netanya, Israel, August1985 (from Goldsmith (1990)) .................. 5
Figure 4. Segmented detached breakwaters in Japan ........... 5
Figure 5. Detached breakwater project in Spain .............. 6
Figure 6. Breakwaters constructed for wetland developmentat Eastern Neck, Maryland .................... 9
Figure 7. Detached breakwaters constructed on ChesapeakeBay at Bay Ridge, Maryland ................... 9
Figure 8. Aerial view of Lakeview Park, Lorain, Ohio ......... 13
Figure 9. Detached breakwaters with tombolo formations atCentral Beach Section, Colonial Beach, Virginia ....... 14
Figure 10. Salient that formed after initial construction atthe Redington Shores, Florida, breakwater ........... 14
Figure 11. Limited shoreline response due to detachedbreakwaters at East Harbor State Park, Ohio ......... 15
Iv

Figure 12. Artificial headland and beach fill system atMaumee Bay State Park, Ohio (from Bender (1992)) .... 17
Figure 13. Pot-Nets breakwater project in Millsboro,Delaware (photos courtesy of Andrews Millerand Associates, Inc.) ........................ 18
Figure 14. Marsh grass (Spartina) plantings behind breakwatersat Eastern Neck, Maryland ...................... 19
Figure 15. Definition sketch of terms used in detachedbreakwater design (modified from Rosati (1990)) ....... 20
Figure 16. Definition sketch of artificial headland systemand beach planform (from EM 1110-2-1617) ......... 20
Figure 17. Single detached breakwater at Venice Beach,California ............................... 22
Figure 18. Segmented detached breakwaters near Peveto Beach,Louisiana ................................ 22
Figure 19. A segmented breakwater system(from EM 1110-1-1617) ...................... 23
Figure 20. Shoreline response due to wave crests approachingparallel to the shoreline (from Fulford (1985)) ........ 26
Figure 21. Shoreline response due to wave crests approachingobliquely to the shoreline (from Fulford (1985)) ....... 27
Figure 22. Comparison of diffraction pattern theory (fromDally and Pope (1986)) ........................ 28
Figure 23. Breakwater at Winthrop Beach, Massachusetts,in 1981 (from Dally and Pope (1986)) ............ 32
Figure 24. Evaluation of morphological relationships(modified from Rosati (1990)) .................. 41
Figure 25. Evaluation of Sub and Dalrymple's (1987)relationship for salient length (fromRosati (1990)) ............................ 43
Figure 26. Evaluation of Seiji, Uda, and Tanaka's (1987)limits for gap erosion (from Rosati (1990)) .......... 44
V

Figure 27. Evaluation of Hallermeier's (1983) relationshipfor structure design depth (from Rosati (1990)) ........ 45
Figure 28. Dimensionless plot of United States segmentedbreakwater projects relative to configuration(from Pope and Dean (1986)) ................... 48
Figure 29. Parameters relating to bays in static equilibrium(Silvester, Tsuchiya, and Sbibano 1980) ............ 49
Figure 30. Influence of varying wave height on shorelinechange behind a detached breakwater (Hanson andKraus 1990) ............................. 55
Figure 31. Influence of varying wave period on shorelinechange behind a detached breakwater (Hanson andKraus 1990) ............................. 56
Figure 32. Influence of wave variability on shoreline changebehind a detached breakwater (Hanson and Kraus 1990) .. 56
Figure 33. Shoreline change as a function of transmission(Hanson, Kraus, and Nakashima 1989) ............. 57
Figure 34. Preliminary model calibration, Holly Beach,Louisiana (Hanson, Kraus, and Nakashima 1989) ...... 59
Figure 35. Calibration at Lakeview Park, Lorain, Ohio(Hanson and Kraus 1991) ..................... 61
Figure 36. Verification at Lakeview Park, Lorain, Ohio(Hanson and Kraus 1991) ..................... 61
Figure 37. Layout of the Presque Isle model (multiply by0.3048 to convert feet to meters) (Seabergh 1983) ...... 68
Figure 38. Comparison of shoreline response for the PresqueIsle model and prototype segmented detachedbreakwater (Seabergh 1983) .................... 69
Figure 39. An example detached breakwater plan as installedin the Presque Isle model (Seabergh 1983) ........... 70
Figure 40. Aerial view of Lakeview Park in Lorain, Ohio,showing typical condition of the beach fill eastof the west groin (Bottin 1982) .................. 71
vi
Figure 41. Shoreline in model tests with the Lakeview Parkreconmmended plan of a 30.5-m extension of thewest groin (Bottin 1982) ...................... 72
Figure 42. Oceanside Beach model test results for a singledetached breakwater without groins. Arrows showcurrent direction (Curren and Chatham 1980) ......... 74
Figure 43. Oceanside Beach model test results for detachedsegmented breakwater system with groins.Arrows indicate current direction (Curren andChatham 1980) ............................ 74
Figure 44. Typical wave and current patterns and currentmagnitudes for segmented detached breakwaters atthe 4.6-m contour in the Imperial Beach model(Curren and Chatham 1977) .................... 76
Figure 45. Results of Imperial Beach model study for asingle detached breakwater with low sills at-1.5-m depth contour (Curren and Chatham 1977) ...... 75
Figure 46. Cross section for conventional rubble-moundbreakwater with moderate overtopping (ShoreProtection Manual 1984) ...................... 81
Figure 47. Permeability coefficient P (Van der Meer 1987) ....... 83
Figure 48. Example of a low-crested breakwater at AnneArundel County, Maryland (Fulford and Usab 1992) .... 85
Figure 49. Design graph with reduction factor for thestone diameter of a low-crested structure as afunction of relative crest height and wavesteepness (Van der Meer 1991) .................. 86
Figure 50. Typical reef profile, as built, and afteradjustment to severe wave conditions(Ahrens 1987) ............................ 86
Figure 51. Design graph of a reef type breakwater usingH, (Van der Meer 1991) ...................... 88
Figure 52. Design graph of reef type breakwater using thespectral stability number N*, (Van der Meer1990) .................................. 89
vii
Figure 53. Terminology involved in performance characteristicsof low-crested breakwaters .................... 90
Figure 54. Basic graph for wave transmission versus relativecrest height (van der Meer 1991) ................ 93
Figure 55. Distribution of wave energy in the vicinity ofa reef breakwater (Ahrens 1987) ................. 95
Figure 56. Cross section of reef breakwater at RedingtonShores at Pinnelas County, Florida (Ahrens andCox 1990) ............................... %
Figure 57. Cross section of reef breakwater at Elk NeckState Park, Maryland (Ahrens and Cox 1990) ......... 96
Figure 58. Armor stone characteristics of Dutch widegradation, Dutch narrow gradation, andAhrens (1975) SPM gradation .................. 99
Figure 59. Benefits and cost versus design level(from EM 1110-2-2904) ..................... 105
Figure 60. Breakwater 22 under construction at Presque Isle,Pennsylvania ............................. 107
Figure 61. Land-based construction at Eastern Neck,Chesapeake Bay, Maryland ................... 108
Figure 62. Spacing of profile lines in the lee of adetached breakwater (from EM 1110-2-1617) ........ 111
Figure Al. Location map ............................. A2
Figure A2. Existing shoreline condition ................... A3
Figure A3. Typical breakwater section ................... A8
Figure A4. Breakwater construction procedure ............. A14
Figure AS. Pre-construction shoreline .................... A15
Figure A6. Post-construction shoreline .................. A15
Figure A7. Completed project at south end ................ A16
Figure AS. Completed project at north end ................ A16
va

Figure A9. Pro- and post-construction shorelines ............ A17
Figure AlO. Shoreline coordinate system .................. A18
Figure All. Initial calibration simulation .................. A21
Figure A12. Calibration simulation No. 8 ................. A23
Figure A13. Measured pre- and post-fill shorelines ........... A24
Figure A14. Final calibration simulation ................... A26
Figure A15. Verification simulation ...................... A27
ix

Ust of Tables
Table 1. Summary of U .. Breakwater Projects ............. 7
Table 2. "Exposure Ratios" for Various PrototypeMultiple Breakwater Projects' (Modifiedfrom EM 1110-2-1617) ...................... 25
Table 3. Empirical Relationships for Detached
Breakwater Design ......................... 39
Table 4. Conditions for the Formation of Tombolos .......... 40
Table 5. Conditions for the Formation of Salients ............ 40
Table 6. Conditions for Minimal Shoreline Response .......... 40
Table 7. GENESIS Modeling Parameters for DetachedBreakwater Studies ......................... 62
Table A l. Design Wind Conditions ...................... A3
Table A2. Design Water Levels ........................ A4
Table A3. Design Wave Conditions ..................... A5
Table A4. Beach Response Classifications (fromPope and Dean (1986)) ...................... AIO
Table A5. Breakwater Length/Distance Offshore vsBeach Response .......................... AI0
Table A6. Depth-Limited Wave Heights Opposite Gaps ....... All
Table A7. Wave Transmission Versus Crest Height .......... A13
x

Preface
This report was authorized as a part of the Civil Works Research andDevelopment Program by Headquarters, U.S. Army Corps of Engineers(HQUSACE). The work was conducted under Work Unit 32748, "DetachedBreakwaters for Shoreline Stabilization," under the Coastal StructureEvaluation and Design Program at the Coastal Engineering Research Center(CERC), U.S. Army Engineer Waterways Experiment Station (WES).Messrs. J. H. Lockhart and J. G. Housley were HQUSACE TechnicalMonitors.
This report was prepared by Ms. Monica A. Chasten, CoastalStructures and Evaluation Branch (CSEB), CERC, Ms. Julie D. Rosati,Coastal Processes Branch (CPB), CERC, Mr. John W. McCormick, CSEB,CERC, and Dr. Robert E. Randall, Texas A&M University. Mr. Edward T.Fulford of Andrews Miller and Associates, Inc. prepared Appendix A. Thisreport was technically reviewed by Dr. Yen-hsi Chu, Chief, EngineeringApplications Unit, CSEB, CERC, Mr. Mark Gravens, CPB, CERC,Dr. Nicholas Kraus, formerly of CERC, and Mr. John P. Ahrens, NationalSea Grant College Program, National Oceanic and AtmosphericAdministration. Ms. Kelly Lanier and Ms. Janie Daughtry, CSEB, CERC,assisted with final report preparation. The study was conducted under thegeneral administrative supervision of Dr. Yen-hsi Chu, Ms. Joan Pope, Chief,CSEB, CERC, and Mr. Thomas W. Richardson, Chief, EngineeringDevelopment Division, CERC. Director of CERC during the investigationwas Dr. James R. Houston, and Assistant Director was Mr. Charles C.Calhoun, Jr.
Director of WES during publication of this report was Dr. Robert W.Whalin. Commander was COL Bruce K. Howard, EN.
xA

Conversion Factors, Non-SI toSI Units of Measurement
Non-Sl units of measurement used in this report can be converted toSI units as follows:
Multiply By To Obtain
inches 2.54 contdmeters
feet 0.3048 meters
cubic Verde 0.7645549 cubic meter
degrees (angle) 0.01745329 radeans
pounds (miss) 0.4535924 kilogrsms
knots 0.514444 meters per second
nautical miles 1.852 kilometers
cubic feet 0.02831685 cubic meters
miles 1.609347 kilometers
xA

1 Introduction
With increased use and development of the coastal zone, beach erosion insome areas may become serious enough to warrant the use of protectivecoastal structure. Based on prototype experiece, detached brakwaters canbe a viable method of shoreline stabilization and protection in the UnitedStates. Breakwaters can be designed to retard erosion of an existing beach,promote natural sedimentation to form a new beach, increase the longevity ofa beach fill, and maintain a wide beach for storm damage reduction and recre-ation. The combination of low-crested breakwaters and planted marsh grassesis increasingly being used to establish wetlands and control erosion alongestuarine shorelines.
General Description
Detached breakwaters are generally shore-parallel structures that reduce theamount of wave energy reaching the protected area by dissipating, reflecting,or diffracting incoming waves. The structures dissipate wave energy similar toa natural offshore bar, reef, or nearshore island. Ite reduction of waveaction promotes sediment deposition shoreward of the structure. Littoralmaterial is deposited and sediment retained in the sheltered area behind thebreakwater. Tle sediment will typically appear as a bulge in the beachplanform termed a salient, or a tombolo if the resulting shoreline extends outto the structure (Figure 1).
Breakwaters can be constructed as a single structure or in series. A singlestructure is used to protect a localized project area, whereas a multiple seg-ment system is designed to protect an extended length of shoreline. A seg-mented system consists of two or more structures separated by gaps withspecified design widths.
Unlike shore-perpendicular structures, such as groins, which may impoundsediment, properly designed breakwaters can allow continued movement oflongshore transport through the project area, thus reducing adverse impacts ondowndrift beaches. Effects on adjacent shorelines are further minimized whenbeach fill is included in the project. Some disadvantages associated with
Chapter 1 Introduotion
VENWATER
AESOW"WE
:[:" ";.:SALENT"
Figure 1. Types of shoreline changes associatedl with single and multiplebreakwaters and definition of terminology (modified from EM1110-2-1617)
detached breakwaters include limited design guidance, high construction costs,and a limited ability to predict and compensate for structure-related phenom-ena such as adjacent beach erosion, rip currents, scour at the structure's base,structure transmissibility, and effects of settlement on project performance.
Breakwater Types
"There are numerous variations of the breakwater concept. Detached break-waters are constructed at a significant distance offshore and are not connectedto shore by any type of sand-retaining structure. Reef breakwaters are a typeof detached breakwater designed with a low crest elevation and homogeneousstone size, as opposed to the traditional multilayer cross section. Low-crestedbreakwaters can be more suitable for shoreline stabilization projects due toincreased tolerance of wave transmission and reduced quantities of material
2Chaper I Introduction

necessary for construction. Other types of breakwaters include headlandbreakwaters or artificial headlands, which are constructed at or very near tothe original shoreline. A headland breakwater is designed to promote beachgrowth out to the structure, forming a tombolo or periodic tombolo, and tendsto function as a transmissible groin (Engineer Manual (EM) 1110-2-1617,Pope 1989). Another type of shore-parallel offshore structure is called asubmerged sill or perched beach. A submerged or semi-submerged sillreduces the rate of offshore sand movement from a stretch of beach by actingas a barrier to shore-normal transport. The effect of submerged sills onwaves is relatively small due to their low crest elevation (EM 1110-2-1617).Other types of shore-parallel structures include numerous patented commercialsystems, which have had varying degrees of efficiencies and success rates.This technical report will focus on detached breakwater design guidance forshoreline stabilization purposes and provide a general discussion of recentlyconstructed headland and low-crested breakwater projects. Additional infor-mation and references on other breakwater classifications can be foundin Lesnik (1979), Bishop (1982), Fulford (1985), Pope (1989), andEM 1110-2-1617.
Prototype Experience
Prototype experience with detached breakwaters as shore protection struc-tures in the United States has been limited. Twenty-one detached breakwaterprojects, 225 segments, exist along the continental U.S. and Hawaiian coasts,including 76 segments recently constructed near Peveto and Holly Beach,Louisiana, and another 55 segments completed in 1992 at Presque Isle,Pennsylvania (Figure 2). Comparatively, at least 4,000 detached breakwatersegments exist along Japan's 9,400-km coastline (Rosati and Truitt 1990).Breakwaters have been used extensively for shore protection in Japan andIsrael (Toyoshima 1976, 1982; Goldsmith 1990), in low to moderate waveenergy environments with sediment ranging from fine sand to pebbles. Othercountries with significant experience in breakwater design and use includeSpain, Denmark, and Singapore (Rosati 1990). Figures 3 to 5 show variousexamples of international breakwater projects.
United States experience with segmented detached breakwater projects hasbeen generally limited to littoral sediment-poor shorelines characterized by alocal fetch-dominated wave climate (Pope and Dean 1986). Most projects arelocated on the Great Lakes, Chesapeake Bay, or Gulf of Mexico shorelines.These projects are typically subjected to short-period, steep waves, which tendto approach the shoreline with limited refraction, and generally break at steepangles to the shoreline. The projects also tend to be in areas that are prone tostorm surges and erratic water level fluctuations, particularly in the GreatLakes regions.
In recent years, low-crested breakwaters of varied types have been used inconjunction with marsh grass plantings in an attempt to create and/or stabilize
3Chapter 1 Introduction
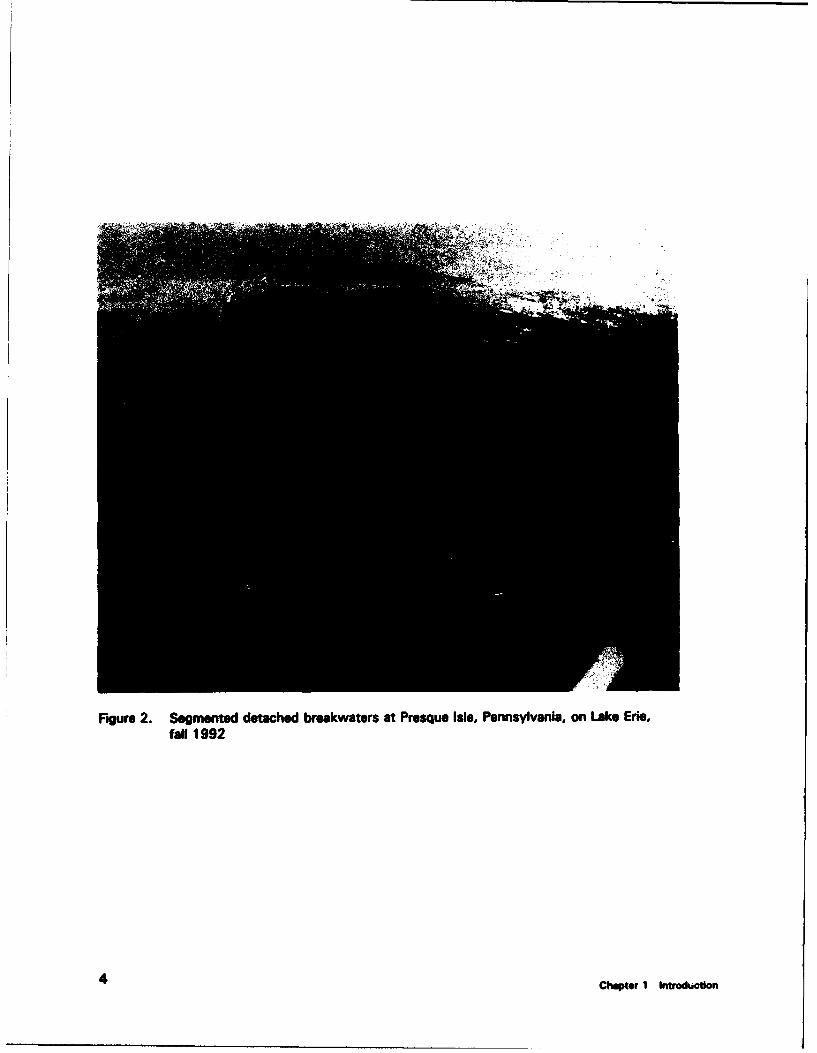
Figure 2. Segmented detached breakwaters at Presque Isle, Pennsylvania, on Lake Erie,
fail 1992
4 Chapter 1 Introdtoon
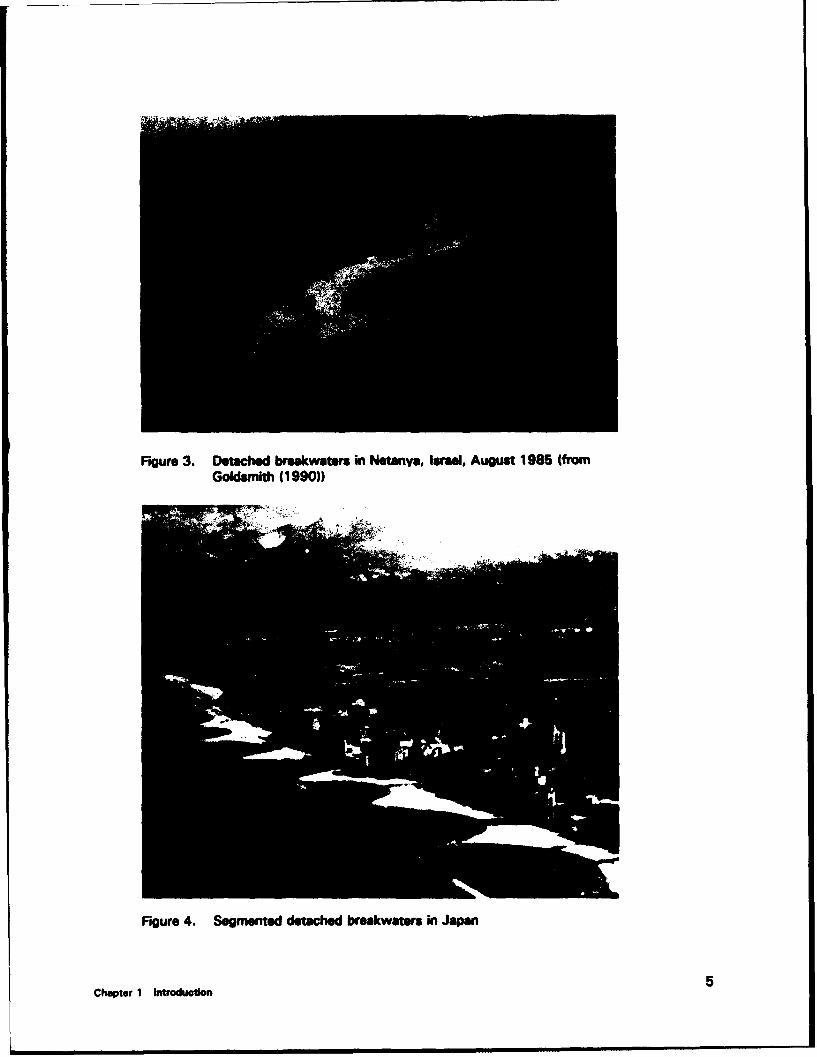
Figure 3. Detached breakwaters in Netanys, Israel. August 1985 (fromGoldsmith (1990))
Figure 4. Segmented detached breakwaters in Japa
Chapter 1 Introductlon

Fqgure 5. Detached breakwater project in Spain
wedand areas (Landin, Webb, and Kmitson 198; Rogers 198; Knutson,Allen, and Webb 1990; EM 1110-2-5026). Recuwent I d/breakwaterprojects inclde Eastumn Neck, Maryland (Figure 6) constructed by the U.S.Fish and Wildlife Service with dredge material provided by the U.S. ArmyEngineer District (USAED), Baltimore; and Aransa, Teua, presently undercoun truction and developed by the USAEDr, Galveston, and die U.S. ArmyEngiee Waterways Expeiment Station (WES) Coastal Engineering ResearchCenter (CRC).
Detailed summaries of the design and perfomanc of single and segmenteddetached breakwater projects in die United Staes have beon provided in anumber of refereces (Daily and Pope 1986,' Pope and Dean 1986, Kraft andHerbich 198). Table 1 provides a oun =ary of a number of detached break-wate projects. Most recently constructed breakwater projet have beenlocated on die Great Lake or Chesapeake Bay (Figue 7) (Hardaway andGumn 1991a and 1991b, Mohr and Ippolito 1991, Bender 199, Coleman199, Fulord and Usab 199). A number of private breakwater projects havebeen constructed, but are not shown in Table 1.
Existing Design Guidance
Intrnaionllyand throughout die United States various schools of thoughthave emerged on the design and construction of breakwaters (Pope 1989).Japanese and U.S. projects tend to vary in style within each country, but oftenuse the segmented detached breakwater concept. In Denmark, Singapore,
6 Ciiq~tr I Introduction
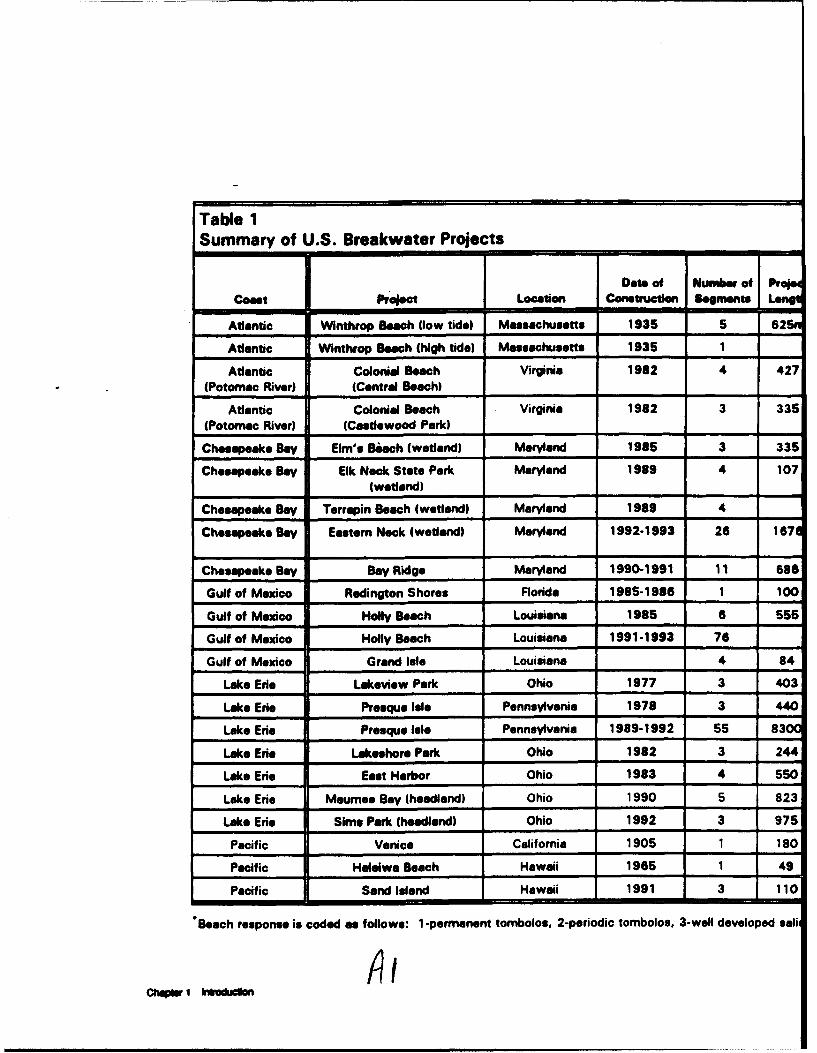
Table 1Summary of U.S. Breakwater Projects
Date of Number of Pr
Coast P a.leot Location Construction Bgment Le
Atlantic Winthrop Beach (low tide) Massachusetts 1935 5 62S4
Atlantic Winthrop Beach (high tide) Massachusetts 1935 1
Atlantic Colonial Beach Virginia 1982 4 427(Potomac River) (Central Beach)
Atlantic Colonial Beach Virginia 1982 3 335(Potomac River) (Catlewood Park)
Chesapeake Bay Elm's Biach (wet.nd) Maryland 1985 3 335
Chesapeake Bay Elk Neck State Park Maryland 1989 4 107______________ (wetland) _ _ _ _ _ _ _ _ _ _ _ _ ____
Chesapeake Bay Terrapin Beach (wetland) Maryland 1989 4
Chesapeake Bay Eastern Neck (wetland) Maryland 1992-1993 26 1874
Chesapeake Bay Bay Ridge Maryland 1990-1991 11 686
Gulf of Mexico Redington Shores Florida 1985-1986 1 100
Gulf of Mexico Holly Beach Louisiana 1985 6 55S
Gulf of Mexico Holly Beach Louisiana 1991-1993 78
Gulf of Mexico Grand Isle Louisiana 4 84
Lake Erie Lakeview Park Ohio 1977 3 403
Lake Erie Presque Isle Pennsylvania 1978 3 440
Lake Erie Presque Isle Pennsylvania 1989-1992 55 8300
Lake Erie Lakeshore Park OhiO 1982 3 244
Lake Erie East Harbor Ohio 1983 4 550
Lake Erie Maumee Bay (headland) Ohio 1990 5 823
Lake Erie Sims Park (headland) Ohio 1992 3 975
Pacific Venice California 1905 1 180
"Pacific Haleiwa Beach Hawaii 1965 1 49
Pacific Sand Island Hawaii 1991 3 110
Beach response is coded as follows: 1 -permanent tombolos. 2-periodic tomnbolos, 3-well developed saNi
Chg I I*@

-- -! - -Distance
met Segmient Gap Offshore Water Fill Beach* Constructed Maintained14h Length Length Pveproiect Depth Plaed Response by by
en 91m 30m Unknown 3.0m(rnw) No 1 State of M.as.
100 30 305 3.0 (mhw) No 3 State of Mass.
7 61 46 64 1.2 yes 2 USACE
5 61.93 26.40 46 1.2 yes 1 USACE
5 47 53 44 0.6-0.9 Yes 1 State of Maryland ________
7 15 15 0.6-0.9 No 2-4 USACE USACE
23 15.31.23 38.1 0.6-0.9 Yes 5 USACE USACE
F6 31 23 0.3-0.6 Yes US Fish and Wildlife US Fish andService, USACE Wildlife Service
6 31 31 42.7 Yes 4 Private Private
0 100 0 104 Yes 1 USACE USACE
5 46,51,50 93.89 78,61 2.5 No 4 Stats of Louisiana State of Louisiana
46,53 91,84 122,183 1.4.1.6 Yes 3 State of Louisiana State of Louisiana
70 21 107 2 No 3 City of Grand isle City of Grand Isle
3 76 49 152 3.7 Yes 4 USACE City oi Lorain
0 38 61,91 60 0.9-1.2 Yes 2 USACE USACE
46 107 76-107 1.5-2.4 (lwd) Yes 3-4 USACE USACE
4 38 61 120 2.1 Yes 5 USACE City of Ashtabula
0 46 90.105,120 170 2.3 No 5 State of Ohio State of Ohio
3 61 76 1.3 Yes 1 USACE State of Ohio
5 38 49 2.5 Yes 1 USACE City of Euclid
0 180 0 370 No 5 Private
0 49 0 90 2.1 (msl) Yes 3 USACE/State of HI USACE
0 21 23 USACE USACE
dients, 4-subdued salients, 5-no sinuosity
7

Figure 6. Breakwaters constructed for wetland development at EasternNeck, Maryland
Figure 7. Detached breakwaters constructed on Chesapeake Bay at BayRidge, Maryland
Spain, and some projects along the U.S. Great Lakes and eastern estuarineshorelines, the trend is towards artificial headland systems. Along the Chesa-peake Bay, the use of low-crested breakwaters has become popular since theycan be more cost-effective and easier to contruct than traditional multilayeredbreakwaters.
Previous U.S. Army Corps of Engineers (USACE) breakwater projectshave been designed based on the results of existing prototype projects,
Chapter 1 Introduction 9

physical and numarical model studies, and empirical relationships. Designguidance used to predict beach response to detached bremkwmaten is presetedin Dally and Pope (1986), Pope and Dean (1986), Rosi (1990), and EM1110-2-1617. Daily and Pope (1986) discuss the application of detachedsingle and segmeited breakwaters for shore protection and beach stabilization.General guidance i presuted for the design of detached breakwaters, prot-type projects are discussed, and several design eanples are provided. Popeand Dean (1986) preset a preliminary design relsionship with zon of pre-dicted shoreline respome based on data from tea field sites; however, theeffects of breakwater transmissibility, wave climate, and sediment propertiesare not included. Rost (1990) presets a summary of empirical relationshipsavailable in the literature, some of which are presetly used for USACE brea-kwater design. Rosati and Truitt (1990) present a summary of the JapaneseMinistry of Construction (JMC) m0hod of breakwater design; however, thismethod has not been frequetly used in the United States. Guidance on Iapa-nese design methods is also provided in Toyoahima (1974). En Manual1110-2-1617, Coastal Groiw and Nearshore Breakwters, contains the mostrecet USACE design guidance for breakwaters. This manual provides guide-lines and design concepts for beach stabilization structures, including detachedbreakwaters, and provides appropriate references for available design proce-dures. Although mnuerous refrences exist for functional design of U.S.detached breakwater projects, the predictive ability for much of this guidanceis limited. Knowledge of coastal processes at a project site, experience fromother prototype projects, and a significant amount of engineering judgementmust be incorporated in the functional design of a breakwater project.
Design guidance on the use of low-crested rubble-ound breakwaters forwetland development purposes is limited and has been mostly based onexperience from a few prototype sites1. Further investigation and evaluationof the use of breakwaters for these purposes is ongoing at WES under theWetlands Research Program.
Numerical and physical models have also been used as tools to evaluatebeach response to detached breakwaters. The shoreline response modelGENESIS ralized Model for Zimulating Shoreline Change) (Hansonand Kraus 1989b, 1990; Gravens, Kraus, and Hanson 1991) has been increas-ingly used to examine beach response to detached breakwates. A limitednumber of detached breakwater projects have been physically modelled atWES. Good agreement has been obtained in reproducing shoreline changeobserved in moveable-bed models by means of numerical simulation models ofshoreline response to structures (Kraus 1983, Hanson and Kraus 1991).
1 Peeroel Commumica=i, 24 Februaqy 1993, Dr. Mary Landin, U.S. Army Enginer Watw-
ways ierimd Station, E~nviromnmal LaboMory, Vickburg, MS.
10 Chepter 1 Introduction

Objectives of Report
A properly designed detached breakwater project can be a viable option forshoreline stabiization and protection at certain coastal sites. Th. objectives ofthis report are to sunmarize and present the most recet functional and struc-tural design guidance available fur detached breakwaters, and provide exam-ples of both prototype breakwater projects and the use of available tools toassist in breakwater design.
Chapter 2 presents functional design guidance including a review ofexisting analytical techniques and design procedures, pro-design site analysesand data requirements, design coi o, and design alternatives.Chapter 3 discusses numerical and physical modeling as tools for prediction ofmorphological response to detached breakwaters, including a summary of theshoreline response numerical simulation model GENESIS. A summary ofmoveable-bed physical modeling and modeled breakwater projects is alsopresented. Chapter 4 summarizes and presents structural design guidanceincluding static and dynamic breakwater stability and methods to determineperformance characteristics such as transmission, reflection, and energy dissi-pation. Other breakwater design issues are discussed in Chapter 5 includingbeach fill requirements, constructability issues, environmental concerns, andproject monitoring. Chapter 6 presents a summary and suggestions for thedirection of future research relative to detached breakwater design. Appen-dix A provides a case example of a breakwater project designed and con-structed at Bay Ridge, Maryland, including GENESIS modeling of the projectperformance. Parameter definitions used throughout the report are given inAppendix B.
Chapter 1 Introductlon

2 Functional Design Guidance
Functional Design Objectives
Prototype experience shows that detached breakwaters can be an importantalternative for shoreline stabilization in the United States. Shorelinestabilization structures such as breakwaters or groins seek to retain or create abeach area through accretion, as opposed to structures such as seawalls orrevetments, which are designed to armor and maintain the shoreline at aspecific location. Additionally, breakwaters can provide protection to aproject area while allowing longshore transport to move through the area todowndrift beaches.
The primary objectives of a breakwater system are to increase thelongevity of a beach fill, provide a wide beach for recreation, and provideprotection to upland areas from waves and flooding (EM 1110-2-1617).Breakwaters can also be used with the objective of creating or stabilizingwetland areas. The breakwater design should seek to minimize negativeimpacts of the structure on downdrift shorelines.
Beach nourishment has become an increasingly popular method of coastalprotection. However, for economic and public perception reasons, it isdesirable to increase the time interval between renourishments, that is, tolengthen the amount of time that the fill material remains on the beach. Thisincrease in fill longevity can be accomplished through the use of shorelinestabilization structures, such as a detached breakwater system. Thecombination of beach nourishment and structures can provide a successfulmeans of creating and maintaining a wide protective and recreational beach.Lakeview Park, Ohio, is an example of a recreational beach maintained by acombination of breakwaters, groins, and beach fill (Bender 1992) (Figure 8).
12 Chapter 2 Functional Design Guidance

Figure 8. Aerial view of Lakeview Park, Lorain, Ohio
Design of Beach Planform
Types of shoreline configuration
A primary consideration in detached breakwater design is the resultingshoreline configuration due to the structure. Three basic types of beachplanforms have been defined for detached breakwaters: tombolo, salient, orlimited. A bulge in the shoreline is termed a salient, and if the shorelineconnects to the breakwater it is termed a tombolo (see Figure 1). A limitedresponse, or minimal beach planform sinuosity, may occur if an adequatesediment supply is not available or the structure is sited too far offshore toinfluence shoreline change. Figures 9 to 11 show U.S. prototype examples ofeach shoreline type.
Selection of functional alternatives
Each planform alternative has different sediment transport patterns andeffects on the project area, and certain advantages and disadvantages exist foreach. The resulting shoreline configuration depends on a number of factorsincluding the longshore transport environment, sand supply, wave climate, andgeometry of the breakwater system.
Chapter 2 Functional Design Guidance 13

Figure 9. Detached breakwaters with tombolo formations at Central BeachSection, Colonial Beach, Virginia
Figure 10. Salient that formed after initial construction at the RedingtonShores, Florida, breakwater
14 Chapter 2 Functional Design Guidance

a. Aerial view showing limited response, but bar formation
b. Limited beach response
Figure 11. Limited shoreline response due to detached breakwaters at EastHarbor State Park, Ohio
Chapter 2 Functional Design Guidance 15

Sailiet formation. Generally, a salient is the preferred response for adetached breakwater system because longshore transport can continue to movethrough the project area to downdrift beaches. Salient formation also allowsthe creation of a low wave energy environment for recreational swimmingshoreward of the structure. Salients are likely to predominate if thebreakwaters are sufficiently far from shore, short with respect to incidentwave length, and/or relatively transmissible (EM 1110-2-1617). Wave actionand longshore currents tend to keep the shoreline from connecting to thestructure. Pope and Dean (1986) distinguish between well-developed salients,which are characterized by a balanced sediment budget and stable shoreline,and subdued salients, which are less sinuous and uniform through time, andmay experience periods of increased loss or gain of sediment.
Tombolo formation. If a breakwater is located close to shore, long withrespect to the incident wavelength, and/or sufficiently impermeable to incidentwaves (low wave transmission), sand will likely accumulate in the structure'slee, forming a tombolo. Although some longshore transport can occuroffshore of the breakwater, a tombolo-detached breakwater system canfunction similar to a T-groin by blocking transport of material shoreward ofthe structure and promoting offshore sediment losses via rip currents throughthe gaps. This interruption of the littoral system may starve downdriftbeaches of their sediment supply, causing erosion. If wave energy in the leeof the structure is variable, periodic tombolos may occur (Pope and Dean1986). During high wave energy, tombolos may be severed from thestructure, resulting in salients. During low wave energy, sediment againaccretes and a tombolo returns. The effect of periodic tombolos is thetemporary storage and release of sediment to the downdrift region. If thelongshore transport regime in the project area is variable in direction or ifadjacent shoreline erosion is not a concern, tombolo formation may beappropriate. Tombolos have the advantages of providing a wide recreationalarea and facilitated maintenance and monitoring of the structure, although theyalso allow for public access out to the structure which may be undesirable andpotentially dangerous.
Artificial headlands. In contrast to detached breakwaters, where tomboloformation is often discouraged, an artificial headland system is designedspecifically to form a tombolo. Artificial headland design seeks to emulatenatural headlands by creating stable beaches landward of the gaps betweenstructures. Also termed log-spiral, crenulate-shaped, or pocket beaches, mostheadland beaches assume a shape related to the predominant wave approachwith a curved section of logarithmic spiral form (Chew, Wong, and Chin1974; Silvester, Tsuchiya, and Shibano 1980). Shoreline configurationsassociated with headland breakwaters are discussed in Silvester (1976) andSilvester and Hsu (1993). Figure 12 shows the headland breakwater andbeach fill system at Maumee Bay State Park, Oregon, Ohio, designed by theUSAED, Buffalo (Bender 1992).
Wetland stabilization and creation. Breakwaters can be used as retentionor protective structures when restoring, enhancing, or creating wetland areas.
16 Chapter 2 Functional Design Guidance

Figure 12. Artificial headland and beach fill system at Maumee Bay StatePark, Ohio (from Bender (1992))
"lTe desired planform behind the breakwater in this type of application ismarsh development, the extent of which tends to be site-specific (Figures 13and 14). The primary objective of the structure is to contain placed dredgematerial and protect existing or created wetland areas from wave, current, ortidal action. The wetland may or may not extend out to the structure.Depending on the habitat, frequent exchange of fresh or saltwater may beimportant. Considerations and guidelines for marsh development are providedin EM 1110-2-5026; Knutson, Allen, and Webb (1990); and U.S. Departmentof Agriculture (1992).
Techniques for controlling shoreline response
After selection of a desired beach planform, the extent of incident wavereduction or modification to encourage the formation of that planform must bedetermined. Various techniques and design tools used to predict and controlshoreline response are reviewed in later sections of this chapter.
Functionai Design Concerns and Parameters
Parameters affecting morphological response and subsequently thefunctional design of detached breakwaters include wave height, length, period,and angle of wave approach; wave variability parameters such as seasonalchanges, water level range, sediment supply and sediment size; and structuralparameters such as structure length, gap distance, depth at structure, and
17Chapter 2 Functional Design Guidance

a. Aerial view showing beach and vegetation development
b. Vegetation established in the lee of a breakwater
Figure 13. Pot-Nets breakwater project in Millsboro, Delaware (photoscourtesy of Andrews Miller and Associates, Inc.)
18 Chepter 2 Functiond Deign Guidance

Figure 14. Marsh grass (Spartina) plantings behind breakwaters at EasternNeck, Maryland
structure transmission. Figure 15 provides a definition sketch of parametersrelated to detached breakwater design. Parameter definitions are provided inAppendix B.
Morphological response characteristics that need to be considered in designare: resultant beach width and planform, magnitude and rate of sedimenttrapping as related to the longshore transport rate and regional impacts,sinuosity of the beach planform, beach profile slope and uniformity, andstability of the beach regardless of seasonal changes in wave climate, waterlevels, and storms (Pope and Dean 1986).
Artificial headland design parameters include the approach direction ofdominant wave energy, length of individual headlands, distance offshore andlocation, gap width, crest elevation and width of headlands, and artificialnourishment (Bishop 1982; USAED, Buffalo 1986; Hardaway and Gunn1991a and 1991b). A definition sketch of an artificial headland breakwatersystem and beach planform is provided (Figure 16).
Considerations for structures used for wetland development includeproperties of the dredged material to be retained or protected, maximumheight of dredged material above firm bottom, required degree of protectionfrom waves and currents, useful life and permanence of the structure,foundation conditions at the site, and availability of the structure material(EM 1110-2-5026). These considerations will determine whether a structureis feasible and cost-effective at a particular wetland site. If an area is exposedto a high wave energy climate and current action or water depths are toogreat, a breakwater may not be cost-effective relative to the amount of marshthat will be developed. Although morphological response due to sediment
19Chapter 2 Functional Demgn Guidance

Lb L
lNITLA d d MqLi
EQINUMIUJM Le<..
SHIORELINE
-Lp1
FRgure 15. Definktion sketch of terms used in detached breakwater desig (modified fromRosati (1990)
HEADLAND SPAINtG b
I (UMNIAr WAVECRESTS
11C ""COAST oil~s
HEALAN .. PAP(
SHAPE-
F~gur 16. efintioz ktho riiilhaln ytmsdbahpafr fo
EML 111X0-2-1617)fH
20AP Chtr UncM n Dsg Giac

transport may not be as significant a concern when using breakwaters forwetlands purposes, many of the design concerns and data requirements, suchas wave and current climate, are the same a those necessary for traditionalbreakwater design. The following sections discuss concerns that must beaddressed and evaluated during functional design of a detached breakwatersystem. The effects of a structure on various coastal processes as well as theeffects of coastal parameters on shoreline response are discussed.
trctt c e tions
Structural configuration is the extent of protection provided by the structureplan and is defined by several design parameters; segment length, gap width,project length, number of segments, cross-sectional design (transmission), anddistance offshore (Pope and Dean 1986). These design parameters should beconsidered relative to the wave climate and potential effects on coastalprocesses as described in the following sections.
Single versus multiple segmented system. Use of single offshorebreakwaters in the United States is not a new concept; however, most havebeen built with the objective of providing safe navigation and not as shoreprotection or stabilization devices. One of the first single rubble-moundbreakwater projects was constructed at Venice, California, in 1905 for theinitial purpose of protecting an amusement pier. A tombolo eventually formedin the lee of the Venice breakwater (Figure 17). Use of segmented systems inthe United States has been limited in general, but has increased substantially inthe past two decades (for example, see Figures 2, 7, 8, and 18). The use ofsegmented systems as shore protection devices has been more extensive inother countries such as Japan, Israel, and Singapore (see Figures 3 and 4) thanin the United States.
The decision to use a single versus a multiple system is essentially basedon the length of shoreline to be protected. If a relatively long length ofshoreline needs to be protected and tombolo development is not desired, amultiple segmented system with gaps should be designed. Construction of asingle long breakwater will result in the formation of a single or doubletombolo configuration. As discussed previously, tombolo formation in acontinuous littoral system may adversely impact downdrift beaches byblocking their sediment supply. A properly designed multiple system willpromote the formation of salients, but will continue to allow a percentage ofthe longshore transport to pass through the project area, thus minimizingerosion along the downdrift shorelines.
The number of breakwaters, their length, and gap width are dependent onthe wave climate and desired beach planform. Several long breakwaters withwide gaps will result in a sinuous shoreline with large amplitude salients and aspatial periodicity equal to the spacing of the structures; that is, there will be a
21Clhpter 2 Funatlmnd Design Guidance

Figure 17. Single detached breakwater at Venice Beach, California
Yq
Figure 18. Segmented detached breakwaters near Peveto Beach, Louisiana
22 Chapter 2 Functional Design Guidance

large salient behind each breakwater (EM 1110-2-1617) (Figure 19a).Numerous more closely spaced segments will also result in a sinuousshoreline, but with more closely spaced, smaller salients (Figure 19b). Ifuniform shoreline advance is desired, a segmented system with small gaps ora single long breakwater with adequate wave overtopping and transmissionshould be considered.
Gap width. Wide gaps in a segment system allow more wave energy toenter the area behind the breakwaters. The ratio of gap width to wave lengthcan significantly affect the distribution of wave height in the lee (Daily andPope 1986). By increasing the gap-to-wave length ratio, the amount of waveenergy penetrating landward of the breakwaters is increased.
Wave diffraction at a gap can be computed using the numerical shorelineresponse model GENESIS (Hanson and Kraus 1989b, 1990; Gravens, Kraus,and Hanson 1991). GENESIS calculates diffraction and refraction for randomwaves and accounts for wave shoaling and breaking. The effect of diffractionon a wave which passes through a gap can also be calculated using diffractiondiagrams found in the Shore Protecton Manual (SPM) (1984); however, thesesimple diagrams are for monochromatic waves and do not account for waveshoaling or breaking. If the design wave breaks before passing thebreakwater, values estimated by the diagrams could be significantly higherthan may be expected.
Daily and Pope (1986) suggest that gaps should be sized according to thedesired equilibrium shoreline position opposite each gap. Unless the gap-to-incident wave length ratio is very small, there will be minimal reduction inwave height at the shoreline directly opposite each gap. Without an adequatesediment supply, the shoreline will probably not accrete and may even erodein these areas. Generally, Dally and Pope recommend that gaps should be atleast two wave lengths wide relative to those waves that cause averagesediment transport.
The "exposure ratio" is defined as the ratio of gap width to the sum ofbreakwater length and gap width, or the fraction of the shoreline directly opento waves through the gaps (EM 1110-2-1617). Exposure ratio values forvarious prototype projects are provided in Table 2 and range from 0.25 to0.66. Projects that are designed to contain a beach fill within fixedboundaries have larger ratios (such as Presque Isle, Pennsylvania).Comparatively, the ratio at Winthrop Beach, Massachusetts, where wide gapswere included to allow for small craft navigation, is 0.25. Comparison ofthese prototype values provides insight to project design at other locations.
Structure orientation. The size and shape of the resulting planform canbe affected by the breakwater's orientation relative to incident wave angle andorientation of the pre-project shoreline. Shoreline configuration will changerelative to the wave diffraction patterns of the incident waves. If incidentwave energy is predominantly oblique to the shoreline, orientation of the
Chapter 2 Funa•tond Deign Guidance 23

OCEAN
OCEAN
a. With a few relatively long, widely spaced segments
OCEAN
OCEAN
b. With more numerous, shorter, closely spaced segments
Figure 19. A segmented breakwater system (from EM 1110-2-1617)
24 Chapter 2 Functional Design Guidance

T"ie 2"Expomsr Rados" for Vadous Prototype Multiple BreakwaterProjefts1 lModfed from EM 1110-2-1617)
PrNat Exposure Ratio Sharellne Respons
Winthrop Beaoh. MA 0.25 Pemamnent toindoloe (lowtdWe); wea-developed salionts(high tie)
Lakeview Park, Lorain, OH 0.36 Subdued salients
Castlewood Park, Colonial Beach, VA 0.31 to 0.38 Permanent tombolos
Centrol Beamh, Colonial Beaoh, VA 0.39 to 0.45 Periodic tombolos
East Harbor, State Park, OH 0.50 Limited
Preeque se, Erie, PA(experimental prototwe) 0.56 to 0.66 Permanent tombolos(hVdrauio modal) 0.60
The "exposure redo" is defined as the ratio of gap width to the sum of the breakwater
length and gap width. It is the fraction of shoreline directly exposed to waves and is equalto the fraction of Incident wove energy reaching the shoreline through the gaps. A"sheltering redo' that is the fraction of incident wave energy intercepted by thebreakwaters and kept from the shoreline can also be defined. It is equal to 1 minus the.exposure rato.*
breakwater parallel to incoming wave crests will protect a greater length ofshoreline and reduce toe scour at the breakwater ends.
Location with respect to breaker zone. If the breakwater is placedsubstantially landward of the breaker zone, tombolo development may occur.However, a significant amount of longshore transport may continue to passseaward of the breakwater, thus alleviating the effects of a tombolo ondowndrift shorelines. A disadvantage of a breakwater within the breaker zonemay be substantial scour at the structure's toe. Generally, detachedbreakwaters designed for shore protection along an open coast are placed in arange of water depths between 1 and 8 m (Dally and Pope 1986).
Strctural mitigation methods for impacts on adjacent shorelines. Endeffects from a breakwater project can be reduced by creating a gradual transi-tion or interface between the protected shoreline and adjacent shorelines(Hardaway, Gunn, and Reynolds 1993). Hardaway, Gunn, and Reynolds(1993) document various methods for structurally transitioning the ends ofbreakwater systems in the Chesapeake Bay. Structural methods used at the 12sites investigated include shorter and lower breakwaters, hooked or inclinedgroins, small T-head groins, and spur-breakwaters. Based on project experi-ence in the Chesapeake Bay, Hardaway, Gunn, and Reynolds (1993) recom-mend hooked or skewed groins where adjacent effects are predicted to be min-imal; T-head groins where the dominant direction of wave approach is shore-normal; and short groins, spur-breakwaters and low breakwaters placed closeto shore when the dominant wave direction is oblique. The use and design of
Chapter 2 Functional Design Guidance 25

these methods will vary with each breakwater project site. If possible,shoreline morphology, such as a natural headland or creek, should be used toterminate the breakwater project and minimize impacts on adjacent shorelines.
Wave climate
Structural effects on wave environment. Breakwaters reduce waveenergy at the shoreline by protecting the shoreline from direct wave attack andtransforming the incoming waves. Wave energy is dissipated on and reflectedfrom the structure, or diffracted around the breakwater's ends causing thewaves to spread laterally. Some wave energy can reach the breakwater's leeby transmission through the structure, regeneration in the lee by overtoppingwaves, or diffraction around the structure's ends. As most detachedbreakwater projects are constructed in shallow water, incident wave energy isoften controlled by local water depth and variability in nearshore bathymetry.Average wave conditions, as opposed to extreme or storm wave conditions,generally control the characteristic condition of the shoreline.
Wave diffraction. Shoreline response to detached breakwaters isprimarily controlled by wave diffraction. The diffraction pattern and waveheights in the breakwater's lee are determined by wave height, length, andangle, cross-sectional design, and for segmented structures, the gap-to-wavelength ratio. The resulting shoreline alignment is generally parallel to thediffracted wave crests.
If incident breaking wave crests are parallel to the initial shoreline (acondition of no longshore transport), the waves diffracted into thebreakwater's shadow zone will transport sediment from the edges of thisregion into the shadow zone (Fulford 1985). This process will continue untilthe beach planform is parallel to the diffracted wave crests and zero longshoretransport again results (Figure 20). For oblique incident waves, the longshoretransport rate in the breakwater's lee will initially decrease, resulting insediment deposition (Figure 21). A bulge in the shoreline will develop andcontinue to grow until a new equilibrium longshore transport rate is restoredor a tombolo results.
Wave height. The magnitude of local diffracted wave heights is generallydetermined by their distance from the breakwater's ends, or by their locationrelative to the gaps in a segmented system (EM 1110-2-1617). Wave heightaffects the pattern of diffracted wave crests, and therefore affects the resultingbeach planform. For shallow water of constant depth, linear wave theorypredicts the circular pattern of diffracted wave crests shown in Figure 22a.However, for very shallow water where wave amplitude affects wave celerityC, the celerity decreases along the diffracted wave crests in relation to thedecrease in wave height. Figure 22b shows the distorted diffraction pattern, aseries of arcs of decreasing radius, which results. The latter situation usuallyresults in tombolo formation if the undiffracted portion of the wave near the
26 Chapter 2 Functional Design Guidance

APPROACHING WAVE
CRESTS
BREAKWATEROJDIFFRACTED WAVES
ADJUSTED INITIAL SHORELINE
Figure 20. Shoreline response due to wave crests approaching parallel tothe shoreline (from Fulford (1985))
APPROACHING WAVE
BREAKWATER
T- DIFFRACTED WAVES
LONGSHORECUSPATE SPIT / TRANSPORT
Figure 21. Shoreline response due to wave crests approaching obliquely tothe shoreline (from Fulford (1985))
breakwater reaches the shore before the waves diffracted around thestructure's ends intersect (Dally and Pope 1986).
Wave overtopping and transmission. Wave energy transmitted landward
of the breakwater due to overtopping and transmission through the structurecan also affect beach planform development and stability. If adequate waveenergy is allowed to pass through or over the structure, tombolo formation
can be prevented and/or salient formation can be inhibited. Tide level, wave
height and period, and structure slope and roughness all have effects on the
amount and form of energy transmitted due to overtopping (Shore Protection
Manual 1984). If overtopping occurs, the beach planform tends to flatten and
spread laterally in a uniform manner; however, waves overtopping thestructure have a shorter period than the incident wave and are highlyirregular. Wave energy passing through the structure is transmitted at thesame period as the incident waves, and is often more predictable and regular
than that produced by overtopping. In design, wave heights due toovertopping are generally determined by the structure's crest elevation, and
wave transmission through a breakwater is determined by the structure'spermeability. A low-crested reef type breakwater is designed to allow
periodic overtopping of the structure by incident waves, thus preventing
27Chapter 2 Functional Design Guidance

CIRCULAR DIFFRACTED WAVE CRESTS
INCIDENTWAVE CRESTS
a. Diffraction at a breakwater assuming linear wave theory
DISTORTED DIFFRACTED WAVE CRESTS
INCIDENTWAVE CRESTS
b. Diffraction at a breakwater including the effects of amplitude and dispersion
Figure 22. Comparison of diffraction pattern theory (from Daily and Pope (1986))
28 Chapter 2 Functional Design Guidance

tombolo formation. Wave transmission is discussed in more detail inChapter 4, Smtrctural Design Guidance.
Wavelength. Generally, the amount of wave energy diffracted into astructure's lee increases with increasing wavelength. Assumingmonochrmatic waves and a flat bottom, wave length will not change thepattern made by the wave crests, but will affect the wave height at eachlocation. An analysis using the diffraction diagrams provided in the ShoreProtection Manual (1984) can simplistically compute the amount of energythat reaches the lee of the breakwater. An example problem using thediffraction analysis is presented in Daily and Pope (1986).
Wave angle. Equilibrium beach planform and degree of salientdevelopment can be significantly affected by incident wave angle relative toboth the shoreline and structure. Design must not only consider predominantwave direction, but also the average annual wave angle distribution. Salientsand tombolos tend to align with the predominant wave direction. Generally,the feature's apex is near the center of the breakwater and is filled more onthe updrift than the downdrift side. If predominant waves are extremelyoblique to the shoreline, the beach planform and feature's apex can be shifteddowndrift and can change with seasonal variations in wave direction. Obliquewaves can also drive a regional longshore current, which may dominate localeffects of the breakwater and limit salient development. Increasing thestructure's length can subdue the effect of the oblique waves.
Wave conditions seaward of breakwater. Waves reflected from theseaward side of the structure can sometimes interact with incident waves andcause a partial standing wave pattern seaward of the breakwater (EM 1110-2-1617). This increased wave action can cause scour on the seaward side of thestructure, potentially creating foundation problems. A structure's reflectivityis largely determined by crest elevation, permeability, and type of constructionmaterial. Rubble-mound structures are the least reflective detachedbreakwater construction type.
Effects of breakwater on nearshore currents
Construction of a breakwater system can affect nearshore currents in twoways: reduction of longshore current in the vicinity of the structure, andcreation of a net seaward flow of water through gaps in a segmented system(EM 1110-2-1617). On an open-coast beach, a longshore current is generatedby waves approaching the shoreline at an angle. The placement of a structureintroduces an interruption to this natural system. The longshore current willgenerally respond by slowing or stopping when it moves into the project area,thus reducing the current's sediment carrying capacity and depositing sand inthe structure's lee. The structure's length and distance from shore are twodesign parameters that must be considered when evaluating the breakwater'seffect on longshore currents and sediment transport. For example, a relatively
29Chapter 2 Functlond Deign Guidame

long breakwater will cause a greater reduction of longshore current in theproject area than a short breakwater.
If the breakwater's crest elevation is sufficiently low and overtoppingoccurs, water level behind the breakwater is increased and flow occurs aroundthe structure. In a multiple segment system, this results in a net seaward flowthrough the gaps, which can cause offshore sediment losses, structural scour,and create a hazard to swimmers. The magnitude of return currents throughthe gaps can be reduced by increasing crest elevation, gap width, and/orstructure permeability. Seelig and Walton (1980) present a method forestimating flow rate through the gaps of offshore segmented breakwaterscaused by wave overtopping. The effects of wave height and period,breakwater freeboard, breakwater length and spacing, distance offshore, waterdepth, and shore attachment are considered relative to flow rate through thegaps. Seelig and Walton (1980) recommend that the gap velocity should notexceed 0.5 ft/sec (0.15 m/sec) for extreme design conditions. Velocitiesgreater than this could cause significant offshore losses of sediment and scouraround the structure's foundation.
Effects of breakwater on longshore transport
The longshore transport rate Q is the rate at which littoral material movesalongshore in the surf zone from currents produced by breaking waves.Detached breakwaters can significantly reduce longshore transport through aproject area. Reduction of wave heights and wave diffraction around thebreakwater's ends primarily determines the reduction in transport capacity. Ifa salient forms, longshore transport can continue to move through the projectarea; however, a tombolo can act as a total barrier of longshore transportcausing a sediment deficiency at downdrift beaches. Some longshore transportmay be redirected seaward of the breakwater, but may also result in anoffshore loss of material. Structure length, distance offshore, crest elevation,and gap width may be modified to vary the resulting transport rate duringdesign of a breakwater system. Once constructed, modifications to thetransport rate are more difficult; however, reduction of crest elevation orincreasing permeability can be undertaken to allow more wave energy topenetrate the structure. This was conducted at the Redington Shores, Florida,detached breakwater project where tombolo formation and subsequentblocking of longshore transport occurred (Chu and Martin 1992).
The effects of a breakwater on the shoreline depend on both net and grosstransport rates. Shoreline response both at the structure and on adjacentshorelines can occur rapidly if transport rates are large, or can take severalyears for low transport rates. If net transport in a project area is nearly zero,but gross transport is not zero, the breakwater's major effects will be limitedto the general vicinity of the structure; however, some effects of the structurecan be experienced on updrift and downdrift beaches over time.
30 Chapter 2 Functional Design Guidance

Effects of breakwater on onshore-offshore transport
Breakwater construction can reduce offshore transport by presenting aphysical barrier to offshore transport and by reducing wave heights and wavesteepness, which tends to promote onshore transport of material in thebreakwater's lee. However, for segmented systems, especially low-crested,impermeable structures, a net seaward return flow of water can occur throughthe gaps, promoting offshore loss of sediment. Reduction of seaward flowthrough the gaps was discussed in the previous section.
Influence of other coastal parameters
Water levels. Water level variations influence the magnitude of waveenergy in the lee of the breakwater, which in turn influences shorelineconfiguration and consequently must be considered in functional design.Dally and Pope (1986) suggest that water level fluctuations of over 1.5 m willtend to hinder permanent tombolo formation, especially if significant waveovertopping of the structure occurs, and may prevent the salient from attaininga smooth equilibrium shape. The Winthrop Beach, Massachusetts, projectexperiences a relatively large tidal range (2.7 m) and has two distinctplanforms during high and low tide conditions (Figure 23). Projectsconstructed on the Great Lakes or Chesapeake Bay will experience lessdramatic water level fluctuations; however, variations in water level maycause significant seasonal or longer period changes in the equilibrium beachplanform.
Sediment characteristics. Sediment particle size and distribution affectlongshore transport and profile shape, and therefore have some influence overthe resulting beach planform. Because a coarse-grained beach equilibriumprofile will be steeper, a structure should be placed in relatively deeper water(Dally and Pope 1986).
Data Requirements for Design
Data requirements for both functional and structural design depend on themethods and evaluation tools used in the specific project design. This sectiondiscusses data requirements necessary for an understanding of sitecharacteristics and coastal processes relative to functional design of detachedbreakwaters.
Water levels
Both the functional and structural design of detached breakwaters requiredata on the range of water levels that can be expected to occur at a projectsite. Prevailing water levels will determine where waves may affect the beach
31Chapter 2 Functional Design Guidance

a. Low tide conditions showing periodic tombolo formations
b. High tide conditions showing salient formations with tombolossubmerged
Figure 23. Breakwater at Winthrop Beach, Massachusetts, in 1981 (fromDaily and Pope (1986))
32 Chapter 2 Functional Design Guidance

profile and where wave forces may act on a structure (EM 1110-2-1617). Theuse of water levels in structural design is described in Chapter 4.
Water level variations are caused by astronomical tides, storm tides, andfor the Great Lakes, long-period hydrologic factors and seiches. Design waterlevels are usually described statistically in terms of the frequency, orprobability that a given water level will be equaled or exceeded, or its returnperiod in years. The design may also include storm surge with a specifiedreturn period, and/or may account for increased water levels due to sea levelrise. Detailed information on the prediction of tides and storm surges isprovided in EM 1110-2-1414, Water Lewis and Wave Heights for CoastalEngineering Design, and EM 1110-2-1412, Storm Surge Analysis and DesignWater Level Determination.
As described in EM 1110-2-1617, water level data for coastal areas areavailable from the National Oceanic and Atmospheric Administration's(NOAA) National Ocean Service (NOS) for areas where NOAA operates tidegauges. Tide tables containing water level information are published annuallyby NOAA. Data on historical water levels of the Great Lakes are availablefrom NOS and from sources such as the USAED, Detroit (for example,USAED, Detroit (1986)), which provides monthly summaries of actual andpredicted lake levels. Other sources of water level data include USACEGeneral Design Memoranda for specific project sites and Federal EmergencyManagement Agency flood insurance studies. Water level statistics for theeast coast are presented in Ebersole (1982), and in Harris (1981) for predictedastronomical tides.
Waves
Wave data are required for both the functional and structural design ofdetached breakwaters. Structural design generally focusses on larger waves inthe wave climate, whereas functional design examines a complete data set andincludes smaller waves that can cause sediment transport. Data requirementsfor structural design are discussed in Chapter 4.
Waves primarily control beach planform development at a breakwaterproject since they contribute to both cross-shore and longshore sedimenttransport. For functional design, time series of wave height, period, anddirection are needed for determination of longshore transport rates in thevicinity of the project. Incident wave heights, periods, and direction are alsoused to determine wave conditions in the lee of the breakwater and to estimatethe resulting beach planform. The average, extremes, and seasonal variabilityof the waves define the energy available for sediment transport. However, theequilibrium beach planform is generally determined by the average range ofconditions rather than extreme events. The prevailing wave direction willgenerally determine shoreline orientation as the shoreline aligns itself parallelwith the wave crests (see Figure 21). If wave direction changes and persists
Chate 2 Furncond 0"1gn Guk•ane 33

over some time (for instance seasonally), the shoreline will begin to shift inresponse to the new approach direction.
The two primary forms of wave data for breakwater design are hindcastdata and wave gauge data. Wave height statistics to determine designconditions will generally be based on hindcast data since a relatively longrecord is needed for data extrapolation. TMe Wave Information Study (WIS)conducted by the USACE has developed hindcast data for all three oceancoasts and the Great Lakes (Jensen 1983; Hubertz et al. 1993; Jensen et al.1992). EM 1110-2-1414 and EM 1110-2-1502 provide extensive lists andcontacts on ways to obtain meteorological and oceanographic data, as well assources of WIS data and information.
Longbhore sand transport rates
Longshore transport of littoral material is the most significant processdetermining beach planform response to breakwaters. Transport rates areneeded to determine what type of planform will develop, sediment budgetcalculations, beach fill requirements, and potential effects of a project ondowndrift beaches.
Longshore transport is typically described in terms of annual net and grosstransport rates (Shore Protection Manual 1984, EM 1110-2-1617, EM 1110-2-1502). To an observer looking seaward, transport can be to the right QR or tothe left QL, with QR being a positive quantity and QL assigned a negativevalue. The annual net transport rate is the net amount of sediment movingpast a point on the beach in a year with direction considered and can becomputed as:
QN - QR + QL (1)
"The annual gross transport rate is the total awount of sediment moving past apoint, regardless of direction, defined as:
QG -IQRI+IQLI (2)
It is possible that QN and QG could have substantially different magnitudes,i.e., a large gross transport may exist for a project area, but net transportcould be close to zero. The net transport rate is often used to examineerosion rates on adjacent beaches at breakwater or other coastal structures.
Estimates of left, right, net, and gross transport rates can be calculatedfrom wave data that include wave heights, periods, and directions. Usually,determination of the net and gross transport rates will be adequate; however, atime series of transport rates can be calculated if a wave time series isavailable. TMe Shore Protection Manual (1984) suggests four ways ofcomputing longshore transport rates at a project site. Method 1 involvesadopting a transport rate from a nearby site; Method 2 entail, calculation of
34 Chapter 2 Functional Design Guidance
volume change over a specific time period at a known feature such as an inletor coastal structure; Method 3 depends on the longshore component of energyflux in the surf zone to compute a potential longshore arasport rate, alsoknown as the CERC formula; and Method 4 provides an empirical estimate ofQ& These methods are discussed in detail in the Shiore Protection Manual(1984), EM 1110-2-1617, and EM 1110-2-1502. Another method commonlyused along the Great Lakes and Pacific coast develops a sediment budgetbased on estimates of inputs including bluff recession and stream sedimentcontributions. The Shoreline Modeling System (Gravens 1992) includesprograms to calculate QL, QR, and QG for a given time series.
It is important to examine longshore transport variability as part offunctional design, since transport rates can fluctuate significantly on amonthly, seasonal, or yearly basis. Beach planform can vary and shiftsubstantially in response to prevailing transport conditions.
Offshore bathymetry
Offshore bathymetry is required to aid in determining the distance offshoreat which the breakwater will be constructed, wave and current forces whichthe structure will be subjected to, and quantities of construction materials.Knowledge of offshore bathymetry is also needed to examine wavetransformations that may affect the local wave environment at the site.Additionally, bathymetry and beach profiles can provide data to determine theclosure depth (the depth beyond which there is no significant sedimenttransport), if they extend to a sufficient depth and have sufficient vertical andhorizontal control to allow comparison of profiles. Depth of closure can alsobe estimated by reference to a maximum seasonal or annual wave height(Hanson and Kraus 1989b, Hallermeier 1983).
Bathymetric surveys of the project vicinity during the planning and designstages should be conducted for detailed site data. Less accurate bathymetryinformation can be acquired from U.S. Geological Survey quadrangletopographic maps and or Naval Hydrographic Office charts; however,bathymetry is continually changing and these sources generally do notmaintain the most up-to-date information.
Shoreline change
Shoreline change data are required primarily to determine short- and long-term erosion and accretion rates at a project site, prior to design of abreakwater system. This information is necessary to determine thebreakwater's location relative to the post-project shoreline and to estimate thevolume of sand that will accumulate behind the breakwater.
Historical and recent shoreline change data include beach profile surveys,aerial photography, and other records documenting changes in the shoreline
Chapter 2 Functional Design Guidance 35

mfigr much as beach nourishment dat. During the planning anddesign stag of a project, beadh profile data and aerial photography should beacpired to provide an improved understanding of the nearshore system.
s.tm.n budge
A sediment budget is a quantitative balance of the sources (gains) and sinks(losme) within a project area (Shore Protection Mamal 1984; EM 1110-2-1502). Sources of sediment include longsbore transport, cross-shoretransport, aolian or wind-blown transport, bluff recession, stream or riversediments, and beach fill material. Losses of material to the system mayinclude longshore transpo, offshore transport, aeolian transport, offshrcanyons, trapping by tidal inlets, blocking by structures, and dredgingoperaioMn. Generally, a sediment budget is developed for pre-projectconditions and then the effects of project construction can be evaluated bymaking various assumptions regarding the project's effects on transport(EM 1110-2-1617).
Geaotehnufl daet
The physical properties of underlying soils should be investigated andcharacterized by the collection of soil borings. In the coastal zone, beachsands are often underlain by organic, compressible soils that may consolidateunder the structure's load and cause unwanted settlement. Additionalinformation on geotechnical data and design can be found in EM 1110-2-1903,EM 1110-2-2906, and Eckert and Callender (1987).
Existing stmutures
An inventory of existing structures in the project vicinity and data on theirdesign and functional performance will assist in the design of a detachedbreakwater system. Depending on their proximity and influence on the studyarea, these structures may need to be incorporated into the design of the newproject.
Review of Functional Design Procedures
Design process
Because of limited prototype experience, detached breakwater design in theUnited States relies on a significant amount of engineering judgement, datafrom a few existing breakwater projects for comparison, and an understandingof basic coastal processes. The design process is an iterative one. An initialbreakwater configuration is assumed based on past experience at existingbreakwater sites and taking into account the site-specific concerns and
36 Chapter 2 Functional Design Guidance

parameters described in the previous sections. This design is evaluatedrelative to the project's objectives, predicted beach response, and potentialeffects on adjacent shorelines; modifications are then made to the initial designand the project is reevaluated. Initial design should start by consideringincident wave energy flux to determine the extent of wave energy reductionnecessary to develop the desired beach planform.
Tools for design evaluation
Design techniques or evaluation tools for detached breakwaters can beclassified into three categories: physical and numerical models, empiricalmethods, and prototype assessment (Rosati 1990). Numerical and physicalmodels, when calibrated and verified at a particular project site, caneffectively simulate coastal response to a particular breakwater design.Modeling, particularly numerical, is recommended prior to the implementationof the breakwater project. The use of numerical and physical modeling astools in functional breakwater design is discussed in Chapter 3, Tools forPrediction of Morphologic Response. Models, however, can be moreexpensive and time-consuming than required for feasibility-level studies.Empirical "desktop* methods provide quick techniques for qualitativelyevaluating beach response to a particular project design (Rosati 1990). Theuse of these simplified, inexpensive methods is desirable in the feasibilitystage of project design; in the design of more extensive laboratory, numericalmodel and field testing; and as a check for detailed evaluation results.
Daily and Pope (1986) suggest a three-phase breakwater design process:first, a desktop study employing various empirical relationships to relateproposed structural and site parameters to shoreline response and identifydesign alternatives; second, a physical or numerical model study to assess andrefine alternatives; and finally, if feasible, a prototype test to verify and adjustthe preliminary design.
Prototype breakwater database
A database of detached breakwater projects in the United States and severalother countries is maintained by CERC. The database contains informationsuch as type of breakwater, dates of construction, project dimensions, andother site data. A brief narrative description of the project's performance isalso included. Because limited design guidance exists, experience fromprototype sites such as those contained in the database may prove valuable forthe design of a new breakwater project.
Chapter 2 Functional Design Guidance 37

Review of Empirical Methods
A desktop study using empirical relationships is recommended as the firststep in the design of a detached breakwater system. Empirical relationshipsare somewhat limited due to their inherent simplicity; however, they can beused as reasonable methods prior to detailed studies to quickly assessprototype response and/or project costs for several design alternatives and as ameans of assessing model results.
Numerous laboratory, numerical, and prototype studies have focussed ondetached breakwaters with the objective of developing and improvingfunctional design guidance. As a result, a number of empirical relationshipsfor the design and prediction of beach response to single or segmenteddetached breakwater systems have been developed. Most investigationspresent information on when tombolos will form and when minimal beachresponse can be expected. Table 3 presents a summary of studies whoseempirical methods have been used to design both U.S. and foreign detachedbreakwater projects. Detailed information on various empirical relationshipsis presented in Rosati (1990) and summarized in CETN 111-43 (CoastalEngineering Research Center 1984) and EM 1110-2-1617. It is recommendedthat Rosati (1990) and/or the original reference be reviewed prior to using anyof these empirical methods for prototype design.
EM 1110-2-1617 presents conditions for the three types of beach responseas predicted by the various relationships described in Table 3. Thisinformation is summarized here, and is presented in terms of a dimensionlessbreakwater length L^ where L, is the breakwater segment length, and y isthe distance from the average shoreline. Tables 4, 5, and 6 present conditionsfor tombolo development, salient development, and limited response,respectively.
Evaluation of empirical methods. Rosati (1990) conducted an evaluation ofempirical design methods that consisted of compiling data from five U.S.breakwater projects, and comparing the prototype response with empiricalpredictions where possible. These projects encompass a range of structuraland site parameters and beach response, from salient formation (LakeviewPark, Lorain, Ohio, and Redington Shores, Florida), to no sinuosity(Lakeshore Park, Ohio), to periodic tombolo formation (Colonial Beach,Central and Castlewood Park Sections, Virginia).
The majority of relationships are of the type that predict a limited, salient,or tombolo response as a function of structural parameters. Rosati (1990)conducted an evaluation of these relationships as presented in Figure 24.
In general, the simplicity of the empirical methods evaluated and prototypedata limitations resulted in widely varying predictions for most designrelationships. However, several of the evaluated relationships proved topredict prototype response, although careful consideration must be given to
38 Chapter 2 Functional Design Guidance

Table 3Enmpilcal Relationships for Detached Breakwater DesignInmmn and Frautachy (1966) Predicts accretion condition; based on beach response at Venice in Santa
Monica. CA
Toyoehima (1972. 1974) Recommends design guidance based on prototype performance of 86breakwater system along the Japane"e coast
Noble (1978) Predicts coastal impact of structures in terms of offshore distance andlength; based on California prototype breakwaters
Walker, Clark. and Pope (1980) Discusses method used to design the Lakeview Park. Lorain, ONsegmented system for salient formation; develops the Diffraction EnergyMethod based on diffraction coefficient isolinea for representative wavesfrom predominant directions
Gouday (1981) Predicts beach response; based on physical modal and field observations
Mr (1982) Predicts accretion condition; based on performance of 12 Israelibreakwaters
Rosen and Vadja (1982) Graphically presents relationships to predict equilibrium salient andtombolo size; based on physical model/prototype data
Hallermeier (1983) Develops relationships for depth limit of sediment transport andprevention of tombolo formation; based on fieldflaboratory data
Node (1984) Evaluates physical perameters controlling development oftombolos/salients; especially due to on-offshore transport; based onlaboratory experiments
Shore Protecton Manel (1984) Presents limits of tombolo formation from structure length and distanceoffshore; based on the pattern of diffracting wave crests in the lee of abreakwater
Daily and Pope (1986) Recommends limits of structure-distance ratio based on twpe of shorelineadvance desired and length of beach to be protected
Harris and Herbich (1986) Presents relationship for average quantity of sand deposited in lee andgap areas; based on laboratory tests
Japanese Ministry of Develops step-by-step iterative procedure, providing specific guidelinesConstruction (1986); alec Rosati towards final design; tends to result, in tombolo formation; besed onand Trultt (1990) Japanese breakwaters
Pope and Dean (1986) Presents bounds of beach response based on prototype performance;response given as a function of segment length-to-gap ratio and effectivedistance offshore-to-depth at structure ratio; provides beach responseindex classification
Saiji, Ude. and Tanaka (1987) Predicts gap erosion; based on performance of 1,800 Japanesebreakwaters
Sonu end Warwer (1987) Presents relationship for tombolo growth at the Santa Monica. CAbreakwater
Suh and Dalrymple (1987) Gives relationship for salient length given structure length end surf zonelocation; based on lab tests and prototype data
Berenguer and Enriquez (1988) Presents various relationships for pocket beaches including gap erosionend maximum stable surface ares (i.e.. beach fill); based on projects alongthe Spanish coast
Ahrens and Cox (1990) Uses Pope and Dean (1986) to develop a relationship for expectedmorphological response as function of segment-to-gap ratio
Chapter 2 Functional Design Guidance 39

Table 4
Conditons for the Formation of Tombolos
coMlnkM Comments Reference
LYy > 2.0 SPM (1984)
L.y > 2.0 Double tombolo Gourley (1981)
L. > 0.67 to 1.0 Tombolo (shallow water) Gourley (1981)
LAy > 2.5 Periodic tombolo Ahrens end Cox (1990)
L./y > 1.5 to 2.0 Tombolo Daily end Pope (1986)
L• > 1.5 Tombolo (multiple breakwaters) Daily and Pope (1986)
L/y > 1.0 Tonmbolo (single breakwater) Suh and Oairymple (1987)
Ly > 2 b/L. Tonmbolo (multiple breakwaters) Suh and Dalrymple (1987)
Table 5
Conditions for the Formation of Salient$
Condition Comment. Referenem
Lsly < 1.0 No tombolo SPM (1984)
Ly < 0.4 to 0.5 Salient Goudey (1981)
LIy - 0.5 to 0.67 Salient Daily end Pop. (1986)
L8Iy < 1.0 No tonbolo (single breakwater) Suh and Dalrmple (1987)
L,/y < 2 bIL* No tombolo (multiple breakwaters) Suh end Dalrwmpl. (1987)
L/y < 1.5 Well-developed salient Ahrene and Cox (1990)
L,/y < 0.8 to 1.5 Subdued alient Ahrens end Cox (1990)
Tabe 6
Conditions for Minimal Shoreline Response
Condition Comment Reference
LA, :s 0.17 to 0.33 No response Inman and Freutechy (1966)
L.y s 0.27 No sinuosity Ahrens and Cox (1990)
LA/y s 0.5 No deposition Nir (1982)
L,/y :s 0.125 Uniform protection Daily and Pope (1986)
L.y :s 0.17 Minimal impact Noble (1978)
40 Chapter 2 Functional Design Guidance

+ I 0
a lo-
0
CL 0
WW
+. N4-.
x .3
aN
0
I.,,
CL,
a Iin.
40
N %
§ ~+ - -0
0E
0V
04
Chapter 2 Functional Design Guidance 41
! ! !

their reliability and limitations throughout the design process. A number ofthe relationships that were evaluated are presented herein. Rosati (1990)presents additional evaluations and provides correlation coefficients for thevarious comparisons. Parameter definitions are provided in Appendix A.
Prediction of shoreline response. The most investigated effect ofdetached breakwaters is the relationship between project accretion, inparticular morphological response, and structural parameters. An evaluationof these relationships showed an apparent trend in the prototype data fordeposition to increase as the structure length-to-distance offshore ratioincreases (Rosati 1990).
Suh and Dalrymple (1987) developed the following relationship for theprediction of salient length X, by combining movable-bed laboratory resultswith prototype data:
L= X(14.) (3)
where X is defined as the breakwater segment distance from the original
shoreline and Lg is the gap distance between adjacent breakwater segments.
Tombolos usually formed for single prototype breakwaters when
LS>t1.0 (4)
For multiple offshore breakwaters, tombolos formed when
L9X ' 0.5 (5)
For evaluation, Equation 3 was applied to all segmented projects. Therelationship tends to overpredict the seaward excursion of the spit forthemajority of prototype data evaluated, but appears to accurately predictresponse for pocket-beach type structures with periodic tombolo formations(Figure 25).
Prediction of gap erosion. Seiji, Uda, and Tanaka (1987) give tWefollowing gap erosion relationships, where gap erosion is defined as the retreatof shoreline to the lee of the gap from the initial (pre-project) shorelineposition:
L9 < 0.8 no erosion opposite gap (6)4
42 Chapter 2 Functional Design Guidance

aO
0 LV1 3 VLV2
60 B e'O-PERFECT-•
AGREEMENT40
CB: Central Beach
2CP CP: Costlewood Porko.LS' [] 2• IIP LS: Lakeshore PorkS20 -- 17 -LS3 Cp3 0V1ok1ewPr
x LS2
0
-20
-20 0 20 40 60
XS. Measured, m
Figure 25. Evaluation of Suh and Dalrymple's (1987) relationship for salient length (fromRosati (1990))
Ls
0.8 < : < 1.3 possible erosion opposite gap (7)x
L9 1.3 certain erosion opposite gap (8)
Y
These relationships were evaluated with prototype data (Figure 26). Thelower boundary for no erosion (LIX < 0.8) was a good predictor of eitheraccretion or very little erosion. Gap erosion occurred for ratios of L8/Xgreater than 0.8.
Structure depth. Hallermeier (1983) recommends the following waterdepth as a guide for positioning detached breakwaters when tombolo formationis deemed undesirable:
ds= 2"9Hz 110/Heds- 1 ) (S depth for salient formation (9)
C r c e Gu- 1)dga
Chapter 2 Functional Design Guidance 43
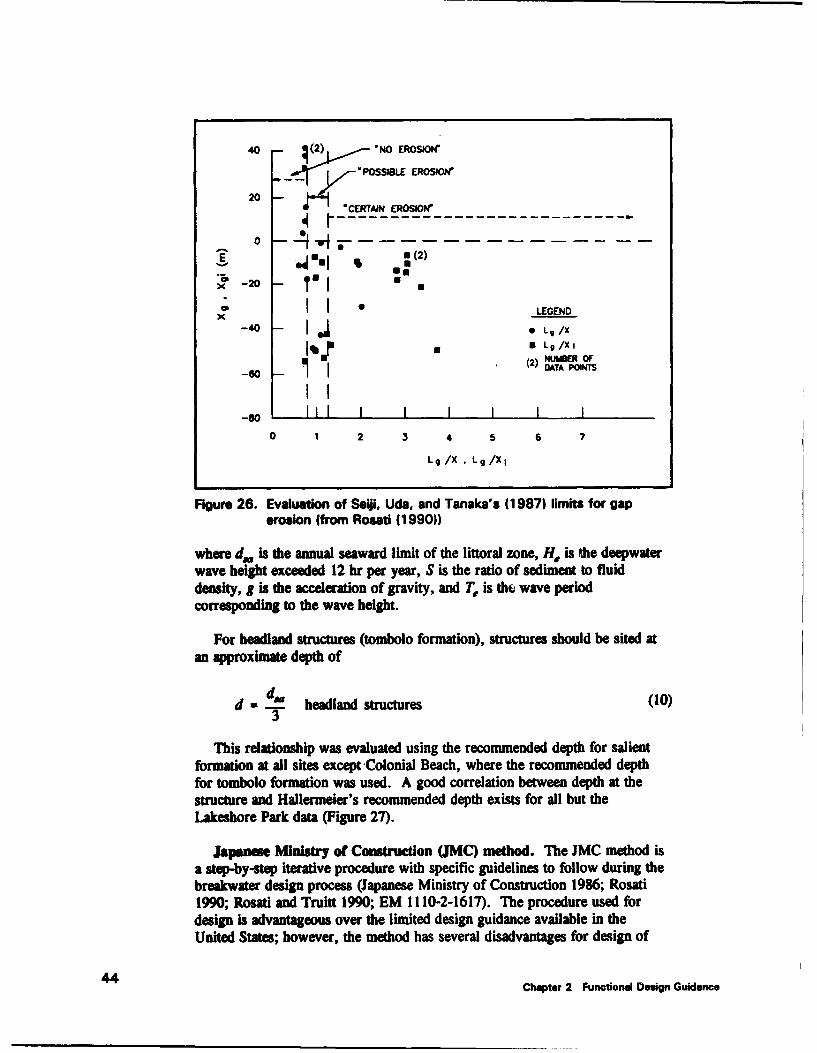
4o (2) * NO EROSI"
POSBEEROSDIW
20 J'4 .CERTAIN EROSIOW
""E 0aN (2)
X -I20
x -20 U- J
• I I LEGENDX~o-40 0 L, /X
I~JU Lq /XiI I (2) NUMBER OF
-60 DATA POIN'TS
-80
0 1 2 3 4 5 6 7
"Lq//X L 9 /Xi
Figure 26. Evaluation of Seii, Uda, and Tanaka's (1987) limits for gaperosion (from Rosati (1990))
where d. is the annual seaward limit of the littoral zone, H, is the deepwaterwave height exceeded 12 hr per year, S is the ratio of sediment to fluid
density, g is the acceleration of gravity, and T, is the wave periodcorresponding to the wave height.
For headland structures (tombolo formation), structures should be sited atan approximate depth of
d - d-a headland structures (10)3
This relationship was evaluated using the recommended depth for salientformation at all sites except Colonial Beach, where the recommended depthfor tombolo formation was used. A good correlation between depth at thestructure and Hallermeier's recommended depth exists for all but theLakeshore Park data (Figure 27).
Japanese Ministry of Construction (JMC) method. The JMC method isa step-by-step iterative procedure with specific guidelines to follow during thebreakwater design process (Japanese Ministry of Construction 1986; Rosati1990; Rosati and Truitt 1990; EM 1110-2-1617). The procedure used fordesign is advantageous over the limited design guidance available in theUnited States; however, the method has several disadvantages for design of
44 Chapter 2 Functional Design Guidance

6
CB: Central BeachCP: Coastlewood PorkLS: Lakeshore ParkLV: Lakeview ParkRS: Redington Shores
4
13 c~~ 3 o~ 0 o oc 1 CS
SI I I I I SI
0.4 0.8 1.2 1.6 2.0 2.4 2.8 3.2 3.6
Depth at Structure. m
Figure 27. Evaluation of Hallermeler's (1983) relationship for structure design depth (fromRosati (1990))
U.S. projects. Fb-qt, 60 percent of the projects designed using the JMCmethod result in t•.bolos (Rosati 1990), generally undesirable for projects,except for headland or pocket beach design. Secondly, the JMC method doesnot account for beach fill in the design, nor does it allow the designer to varystructural transmissibility.
A comparison of the JMC method and the design from the Lakeview Parkproject was conducted by Rosati and Truitt (1990). For the four exampleproblems and site parameters evaluated, use of the JMC design tended toresult in more numerous, shorter length segments with a decreased gap width.Additionally, the JMC structures are designed to be placed closer to shorethan the distance observed in U.S. projects.
Evaluation of methods using Lakeview Park. The Lakeview Parkproject was used to intercompare relationships and further assess their validity(Rosati 1990). The Diffraction Energy Method (Walker, Clark, and Pope1980) was used to design this project, which has been successful in terms ofshoreline protection. A comparison of as-constructed project parameters to
Chpter 2 Functond Design Gukhime 45
those recommended by the JMC method and Toyoshima's median-depthsystem (Toyoshima 1972, 1974) was conducted. Both of these methodsresulted in segment lengths and gap distances smaller than the constructedproject, with structures positioned closer to shore than indicated by theDiffraction Energy Method.
Empirical methods used in U.S. design
This section briefly describes four methods presented in Table 3 that havecommonly been used in the design of more recent U.S. breakwater projects.These methods were not specifically evaluated with prototype data by Rosati(1990), and were therefore excluded from the previous section. Two of themethods, Pope and Dean (1986) and Ahrens and Cox (1990), are applied inthe case example presented in Appendix B.
Daily and Pope (1966). Dally and Pope present several techniques forcontrolling shoreline response to a single or segmented detached breakwaterproject. They recommend the following limits for the structure length-distance offshore ratio (and gap distance for segmented systems) based on thetype of beach planform desired and the length of beach to be protected.
For tombolo development:
8 1.5 to 2 single breakwater (11)X
-=1.5, L < Ls ! L, segmented breakwater (12)
where L is the wavelength at the structure.
For salient formation:
L- 0.5 to 0.67 single and segmented breakwaters (13)
X
For uniform protection over a long distance and an unconnected shoreline, astructure located outside of the surf zone is recommended. Either a permeable(60 percent), partially submerged structure or an impermeable, frequentlysegmented structure will allow ample wave energy into the area. In order toprovide sufficient distance for the diffracted waves to reorient themselves viarefraction before reaching the shoreline, the recommended ratio for asegmented system is:
LS < 0.125 segmented breakwaters (14)
X
46 Chapter 2 Functional Design Guidance
Lengthening the structure or reducing its distance offshore beyond thecondition given in Equations 13 and 14 will increase the extent of the tomboloand assure tombolo development. This, however, may eventually form adouble tombolo planform with trapped water between, which may lead toundesirable water stagnation problems. To further assure tombolodevelopment, the breakwater should be constructed to prevent or minimizewave transmission through the structure. Crest elevation and slope should bedesigned to minimize wave overtopping. Likewise, to prevent tomboloformation and allow only salients to develop, wave energy in the lee should beincreased by increasing wave transmission and overtopping of the structure.Increasing gap width will also increase wave energy behind the structure.
Pope and Dan (1966). Based on prototype data, Pope and Dean (1986)defined a shoreline classification scheme that included five types of beachresponse: permanent tombolos, periodic tombolos, well-developed salients,subdued salients, and no sinuosity. A relationship was developed that givesthe beach response classification scheme as a function of the ratios of segmentlength to gap length L,&L and effective distance offshore to the average waterdepth at the structure X/. Figure 28 shows the relationships between allprototype projects relative to these two dimensionless parameters. Theprojects plotted in Figure 28 show a grouping that may define fields ofpredictable beach planform response for low to moderate wave climates. Itshould be noted that these results are only preliminary and further verificationis required.
Ahrem and Cox (1990). Ahrens and Cox (1990) used the beach responseindex classification scheme of Pope and Dean (1986) to develop a predictiverelationship for beach response based on a ratio of the breakwater segmentlength to breakwater segment distance from the original shoreline. Therelationship defining a beach response index 1, is:
1(72 - o.41 ' (15)
For the five types of beach response defined in Pope and Dean (1986), thefollowing values of 1, were specified:
I, = I (Permanent tombolo formation)
1, = 2 (Periodic tombolos)
Is = 3 (Well-developed salients)
i5 = 4 (Subdued salient)
1, = 5 (No sinuosity)
47Chapter 2 Functionl Design Guidance
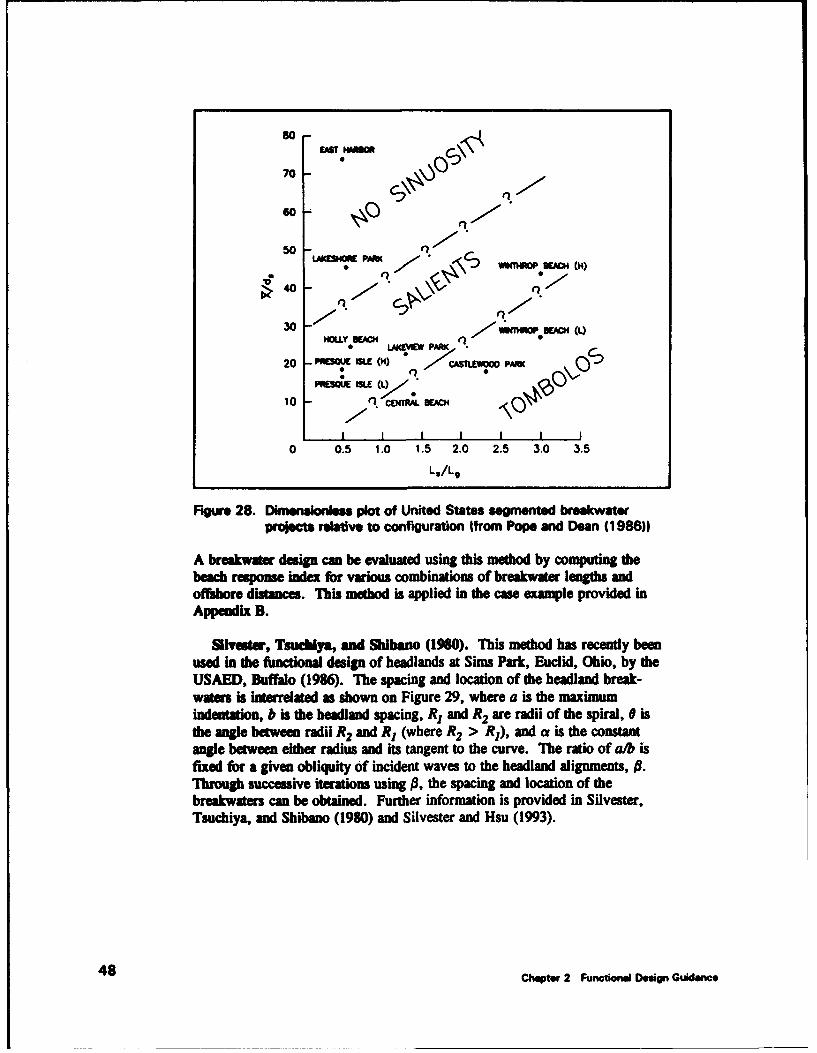
so -MNr
70 .
50
LAKEHORE PIAM wmo CC
40 - / mnOP•1
WIWOP 31*04 (L)NUY0elACM LAIEW PARK
20 PR ISLE (H) d 7 ,1O PAM
10 - CENTRALBEACH
I I I I I I I
0 0.5 1.0 1.5 2.0 2.5 3.0 3.5L,/Lg
Fqgure 28. Dm plot of United States segmented breakwaterrelat• e to configuration Ifrom Pope and Dean (1986))
A breakwater design can be evaluated using this method by computing thebeach response index for various combinations of breakwater lengths andoffshore distances. lhis method is applied in the case example provided inAppendix B.
SieVer, Tsuchlya, and Sldbano (1980). This method has recently beenused in the functional design of headlands at Sims Park, Euclid, Ohio, by theUSAED, Buffalo (1986). The spacing and location of the headland break-waters is interrelated as shown on Figure 29, where a is the maximuminden ton, b is the headland spacing, R, and R2 are radii of the spiral, 0 isthe angle between radii R2 and RI (where R2 > RI), and a is the constantangle between either radius and its tangent to the curve. The ratio of a/b isfixed for a given obliquity of incident waves to the headland alignments, #.Through successive iterations using P, the spacing and location of thebreakwaters can be obtained. Further information is provided in Silvester,Tsuchiya, and Shibano (1980) and Silvester and Hsu (1993).
48 Chapter 2 Functiond Deign Guidance

ba RC .. .2-• R2 eecota
Log Spiral R, ~ t0.6 90
0.4 70
0.2 50
0 300 20 40 60 80
a
Figure 29. Parameters relating to bays in static equilibrium (Silvester, Tsuchiya, andShibano 1980)
Chaper 2 Functionl Doe• Gu Odae 49

3 Tools for Prediction ofMorphologic Response
Introduction
The kmowledge base and engineering experience essential for coastal proj-ect design is developed from information on project evolution, reqsome ofother projects with similar coastal processes, and empirical relationships.From this framework, th, design enginee refines the project goals and limita-tions, and identifies types of solutions that may be feasible at the site.Numnical and/or physical model simulation is recommnded for furtherassessment of these design alternatives. Use of numerical and physical modelsfacilitates unbiased evaluation and optimization of alternatives, as well asproviding a structure that assists in directing data collection and analysis. lhepurpose of this chapter is to discuss numerical and physical modeling asapplied to detached breakwater design, provide general guidelines for conduct-ing these studies, and presem examples of model use with prototype detachedbreakwater projects.
Numerical Models
Overview
Beach change numerical models use sediment transport relationships andconservation of volume to simulate beach response to various driving forces(e.g., waves, ,- "ents, and water levels). TIhere are two types of well-testedbeach change .,aels: short-term (hours to days) storm-induced profileprediction, and long-term (months to decades) shoreline response models(-raus 1990).
Correct application of a storm-induced beach profile change model requires
the assumption that longshore transport is constant for the project reach, and
50 Chapter 3 Tools for Prediction of Morphologic Responee

all beach change occurs in the cross-shore direction. These models areprimarily employed to design and evaluate beach fill projects, in conjunctionwith the shoreline change models. Shoreline response models assume thatlongahore sediment transport is the primary long-term contributor to planformresponse. The underlying postulation is that cross-shore movement ofsediment during storms equilibrates over the long term. Shoreline responsemodels are best applied to sites for which there is a clear trend in beachchange. Thus, shoreline change models are well-suited to predict morphologicresponse of the beach as a function of detached breakwater design. However,for those detached breakwater projects with beach fill that are intended toprovide storm protection, storm-induced profile change models may also beapplied in the design process to provide a worst-case evaluation of beach fillresponse to extreme events. For more information on the Storm-InducedDEAch CHange (SBEACH) model available from CERC, see CERC (1993),Larson and Kraus (1989), and Larson, Kraus, and Byrnes (1990).
One-line or shoreline response models idealize the beach profile with anaverage shape, which moves seaward or landward as the beach accretes orerodes, respectively. The shoreline response model available from CERC,GENESIS (Hanson and Kraus 1989b; Gravens, Kraus, and Hanson 1991) willbe discussed herein because of its wide availability and previous application todetached breakwater projects. GENESIS may be obtained as an executablefile for personal computer (PC) use (Gravens 1992), or applied within theCoastal Modeling System (CMS) documented by Cialone et al. (1992).
By making simplifying assumptions to one-line modeling theory, analyticalor closed-form solutions to the mathematical models may be derived. Larson,Hanson, and Kraus (1987) present more than 25 closed-form solutions forpredicting beach evolution and structure interaction. Included are solutionsfor salient evolution behind a detached breakwater, and the final equilibriumshoreline position. These solutions can provide a simple and economicalmeans of making a rapid qualitative evaluation of shoreline response.
Another class of numerical model that has assisted in detached breakwaterdesign is the multi-contour line model. This type of model can describe theevolution of a number of beach contours to varying waves and currents, bothin the longshore and cross-shore directions. These models have not yet beenwidely applied; they require considerable modeling expertise andcomputational capability. Of note was an application of the "N-Line Model"(Perlin and Dean 1983, Scheffner and Rosati 1987, Scheffner 1988) to providequalitative results for use in functional design of the Redington Shores,Florida, detached breakwater project (USAED, Jacksonville 1984). Three-dimensional models are at the forefront of beach change simulation research,and will eventually allow the most detailed description of nearshore evolution.These models calculate sediment transport rates as a function of waves,currents, and resulting changes in bathymetry at many points defined by ahorizontal grid. Because of their complexity, these models require detailedinput and calibration data sets, powerful computers for application, andextensive verification and sensitivity testing (Kraus 1990).
Chapter 3 Tools for Prediction of Morphologic Response 51

GENESI
Aumpdem. Shoreline change models geerally have five baicusUn~dom: (a) a constant beach profile shape, (b) outant shoreward andseaward limbt of the profile, (c) sediment tranqxot is described as a functionof breaking waves, (d) the detailed structure of nmshore circulation isneglected, and (e) a long-tem trend i shoreline evolution (Hanson and Kras1989b). For wave -ransformaion calculations, GENESIS mmumes that thebeech profile confoms to an equilibrium profile shape,
D.,, ' (16)
in which D is el water depth adA is an empirical scale parmeter thatrelates to the median beach grain size as follows:
A - O.41DO. for D.,<O.4mmA4 -o.23oD• for o.4nam)Do< O.(b,,,'?
A 0.25
A = o.23Do-' for 1.O(,,sZD50<40.(*=
A = 0.46Dý j' for 40.OwxkmDo
Consequently, only one point on the profile is required to determine its shape;this point is typically taken as the mean high water shoreline.
Sediment is assumed to be transported alongshore between two well-defined elevations on the profile, the top of the active berm at the shorewardlimit, and the depth of closure offshore. Longshon sedimm transport inGENESIS is determined with an empirical formula,
R.C,,(a1hWb,s - 81.. Hb1 (1). _ a2coseb,__•.)
in which Hb is the breaking wave height; Co is the wave group speed atbreaking, given by linear wave theory; O, is the angle of breaking waves tothe local shoreline; and x is the longshore coordinate. The non-dimensionalcoefficients a] and a2 are given by
a, , (19a)a" -16(S-lXl-1))
q2 K2 (19b)" (S-lxl-p)tax4
52 Chapter 3 Tools for Prediction of Morphologi Reeponse

where K, and K2 are empirical cofficint, S is tde ratio of the density ofsandi to the density of water, p is the porosity of sand on the bed, and MW isthe average bottom slope from the shoreline to the depth of active loneghoresand transport. The coeficients K and K2 ar tread as model calibrationparameters, with K2 on the order of 0.5 to 1.0 times K1 . Both K, and K2control the magnitude and rue of shoreline change in the model, although theimportance of K2 is apparent in the vicinity of coastal structures, wherediffraction produces a substantial change in breaking wave height over a shortlongshore distance (Gravens, Kraus, and Hanson 1991).
Capabilities. The capabilities and limitations of GENESIS Version 2.0 aredetailed by Gravens, Kraus, and Hanson (1991). GENESIS can simulateshoreline change due to an almost arbitrary number of engineering works,alone or in combination: detached breakwaters, groins Cr-shaped, Y-shaped,and spur), jetties, seawalls, and beach fills. The model simulates sandbypassing around groins and jetties, and has the capability to simulatediffraction and wave transmission at groins, jetties, and detached breakwaters.Offshore waves may be inu with arbitrary height, period, and direction, andmay be described as multiple wave trains (as from independent sources, e.g.,sea and swell). Sand transport is predicted both due to oblique waveincidence and longshore gradients in wave height. The model may be appliedto a project with wide spatial extent (from hundreds of meters to tens ofkilometers).
Limitations. General shoreline change modeling assumptions as presentedpreviously limit GENESIS applicability to situations for which theseassumptions are reasonable representations of the project site and planned use.In addition, GENESIS does not simulate wave reflection from structures. Theshoreline can not touch a detached breakwater; therefore, tombolo evolution atdetached breakwaters or a headland breakwater system can not be modeled.There are minor restrictions on placement, shape, and orientation of thestructures, and the model doe- not directly provide for changing tide level.GENESIS is not applicable to calculating shoreline change for situations inwhich beach change occurs unrelated to Equation 18, such as: in the vicinityof inlets or areas dominated by tidal currents; regions for which wind-drivenbeach transport is significant; storm-induced beach change for which cross-shore transport processes are dominant; and scour at structures (Hanson andKraus 1989b).
Data requirements
Two levels of physical data are typically required prior to conductingshoreline change modeling; background information used to make anassessment of coastal processes at the site on the local and regional levels, andproject-level information with which the model can be calibrated, verified, andapplied to examine future scenarios. The first level includes informationabout regional transport rates, regional geology, water levels (typical rangesand datums), and the frequency and extent of extreme events. Analysis of
Chapter 3 Tools for Prediction of Morphologic Response 53

these data allows the modeling simulations to be evaluated in larger spatial andt-mporal contexts.
The project-level information includes shoreline position data (representingat least three different times for model calibration and verification), offshorewaves, beach profiles and offshore bathymetry, and information on structuresand other engineering activities (both past and planned works). Beach profilesare required to determine the average shape of the beach, and offshorebathymetry is used to transform the offshore wave data to nearshore values.The shoreline position data are required for calibration, verification, andapplication of the model. Calibration requires that shoreline position data beavailable for two different times, together with waves corresponding to thattime period. The model parameters K, and K2, and in some cas withdetached breakwaters, the structure trammission to incoming wave energy,Kp are determined to reproduce known shoreline change. Model verificationrefers to using the second shoreline position with the calibrated parameters topredict a third shoreline. Once again, waves representative of conditions thatoccurred to cause evolution of the shoreline from the second to third positionsshould be used for model simulation. If model verification does notadequately represent the known shoreline change, the modeler must iteratethrough the calibration/ verification process until a reasonable modelagreement with measured shoreline position is obtained. The specificationsand date of engineering activities are required to properly set up the modeland, for planned work, evaluate future scenarios.
Detailed discussions on the development of input data sets for use withGENESIS are given by Hanson and Kraus (1989b) and Gravens (1991).Gravens (1991, 1992) presents application of the Shoreline Modeling System,which consists of a set of analysis programs that may be used separately or inconjunction with GENESIS to streamline data preparation and analysis prior tomodel implementation. Specific issues relating to input data required formodeling of morphologic response to detached breakwaters are presented in asubsequent section of this chapter.
Previous GENESIS detached breakwater appications
Sensitivity testing. Hanson and Kraus (1990) investigated the effects ofvarying site and structure design parameters on beach response for a singledetached breakwater. Simulation results lend a general understanding to howseveral of the controlling design variables affect beach response. Thediscussion presented herein is summarized from Hanson and Kraus (1990).
Tne structure used in the first set of GENESIS simulations was animpermeable 300-m-long breakwater, placed 300 mn offshore in the 3-m, waterdepth. The first case examined the effect of increasing offshore significantwave height from 0.2 m to 1.0 mn for normally incident wave crests, whileholding the wave period constant at 4 sec, for a 100-hr simulation (Fig-ure 30). As offshore wave height increases, the transport potential of the
54 Chapter 3 Toole for Prediction of Morphologic Response
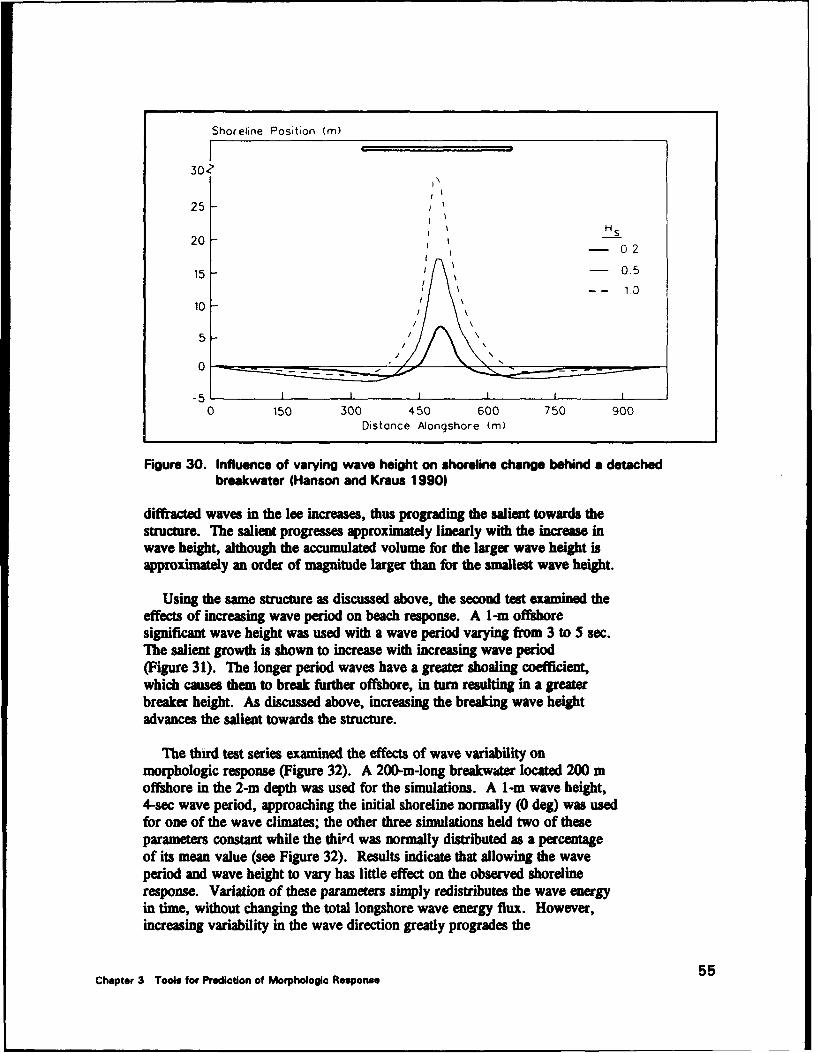
Shoreline Position (m)
30-?
25I Hs
20 - 02
15 I- 0.5/[ \\[ ---- 1.0
10 1
5
0 -/ - -
-5 1 -II
0 150 300 450 600 750 900Distance Alongshore (m)
Figure 30. Influence of varying wave height on shoreline change behind a detachedbreakwater (Hanson and Kraus 1990)
diffracted waves in the lee increases, thus prograding the salient towards thestructure. The salient progresses approximately linearly with the increase inwave height, although the accumulated volume for the larger wave height isapproximately an order of magnitude larger than for the smallest wave height.
Using the same structure as discussed above, the second test examined theeffects of increasing wave period on beach response. A 1-m offshoresignificant wave height was used with a wave period varying from 3 to 5 sec.The salient growth is shown to increase with increasing wave period(Figure 31). The longer period waves have a greater shoaling coefficient,which causes them to break further offshore, in turn resulting in a greaterbreaker height. As discussed above, increasing the breaking wave heightadvances the salient towards the structure.
The third test series examined the effects of wave variability onmorphologic response (Figure 32). A 200-m-long breakwater located 200 moffshore in the 2-m depth was used for the simulations. A 1-m wave height,4-sec wave period, approaching the initial shoreline normally (0 deg) was usedfor one of the wave climates; the other three simulations held two of theseparameters constant while the third was normally distributed as a percentageof its mean value (see Figure 32). Results indicate that allowing the waveperiod and wave height to vary has little effect on the observed shorelineresponse. Variation of these parameters simply redistributes the wave energyin time, without changing the total longshore wave energy flux. However,increasing variability in the wave direction greatly progrades the
Chapter 3 Tools for Prediction of Morphologic Response 55

Shoreline Position (m)
12\
9 T
- 3.0- 4.0
6--5.0
3
0A
0 150 300 450 600 750 900Distance Aiongshore (m)
Figure 31. Influence of varying wave period on shoreline change behind a detachedbreakwater (Hanson and Kraus 1990)
Shoreline Position (m)
20
15
10010 -T • -O"- 0.25 T
,0- 0. 5U UH OH 0.50 H
0
-5 10 100 200 300 400 500 600
Distance Alongshore (m)
Figure 32. Influence of wave variability on shoreline change behind a detached breakwater(Hanson and Kraus 1990)
56 Chapter 3 Tools for Prediction of Morphologic Response

predicted salient. Small deviations in wave direction increase the longshorecomponet of wave energy flux, which results in more sand being movedalongshore. Because of the sheltering provided by the impermeable structure,this transported material tends to collect in the protected region to the lee ofthe structure, advancing the salient seaward.
The final sensitivity test used a 200-m-long breakwater located 250 moffshore to evaluate the effect of va-ying structure transmission on predictedbeach response. Normally incident waves with a 1.5-m significant waveheight and 6-sec wave period were used in the 180-hr simulation. InGENESIS, a structure transmission K7 value of 0 indicates an impermeablestructure, whereas a value of I indicates a structure that is transparent toincoming waves. This sensitivity test used four KT values ranging from 0 to0.8 (Figure 33). As expected, an impermeable structure (KT = 0) results ingreater salient growth, while the more permeable tests show less salientprogradation. For example, KT = 0.2 decreases the maximum shorelineadvance 36 percent from the impermeable structure simulation, and reducesthe accumulated volume by 25 percent.
Hanson, Kraus, and Nakashima (1989) also present example calculationsillustrating GENESIS's breakwater transmission capability. A three-segment
system, each segment with a different transmission coefficient, is used tosimulate beach response as a function of varying wave approach. A secondtest series uses a continuous structure with varying transmission propertiesalongshore, which might occur in nature due to differential settling of thestructure, or uneven loss of armor stone.
Shoreline Position (m)
KT Wave Crests
20 _- 0.0 _O,
- 0.215 - 0.4
10
5
0
-5II I
0 100 200 300 400 500Distance Alongshore (M)
Figure 33. Shoreline change as a function of transmission (Hanson, Kraus, and Nakashima1989)
Chapter 3 Tools for Prediction of Morphologic Response 57

Hauson and Kraus (1990) extended thes sensitivity teos by applyingGENESIS in a generalized manner for the case of a single detachedbrekwaer. They developed a nomograph predicting morphologic response asa function of several dimensionless design parameters (deepwater wave heightover depth at structure, breakwater length over wave length at the structure,and structure transmission), which compared favorably with six prototypedetached breakwater projects. Rosati, Graven, and Chasten (1992) continuedthis work to develop nomographs for single and segmented detached break-waters. However, since these studies were conducted, a limitation withinGENESIS was identified which indicated that the nomographs may tend tooverpredict tombolo formation'. The nomographs presented by Hanson andKraus (1990) and Rosati, Gravem, and Chasten (1992) may be useful inindicating dependencies on controlling dimensionless paramneters. However,they are not recommended for application to project design in their presentform.
Sit-e-pecific examples. Application of GENESIS to two detachedbreakwater projects is summarized from existing literature. Discussion ofthese studies herein is directed towards providing the engineer steps involvedin numerical modeling of detached breakwater systems. For details abouteach application, the referenced publications should be consulted. In addition,Appendix B discusses the application of GENESIS at the Bay Ridge,Maryland, detached breakwater project.
(1) Holly Beach, Louisiana. Hanson, Kraus, and Nakashima (1989)demonstrated use of the breakwater transmission capabilities of GENESISthrough preliminary calibration results with the Holly Beach, Louisiana,detached breakwater project. The project consists of six detached breakwatersegments, each with a different cross-sectional design. The structures areconstructed of various quantities and arrangements of timber piles, used tires,and riprap, which result in varying degrees of wave transmission.
ohe first step in the modeling project was to gather and evaluate allrelevant data sets and previous studies. Ten grid cells are recommendedbehind each detached breakwater, thereby requiring a cell spacing of 4.6 m.From available shoreline change data, it was determined that there werelocations of minimal movement outside the project area. Therefore, the"pinned beach" boundary condition (see Hanson and Kraus (1989%); Gravens,Kraus, and Hanson (1991) for details) was applied at the ends of the projectreach, to allow sand transport in and out of the calculation domain. Based onfield dye studies of structure permeability, the structure transmissioncoefficients were qualitatively known to generally decrease from east to west.The western-most segment was riprap, and showed little wave transmission,whereas the eastern-most segment consisted of tires mounted on one row oftimber piles, and had the greatest observed dye transmission (Nakashima et al.
1 Personal Communication, 1992, Mr. Mark B. Gravens, U.S. Army Engineer Waterways
Experimeht Station, Coastal Engineering Research Center, Vicksburg, MS.
58 Chapter 3 Tools for Prediction of Morphologic Response

1987). Using these results, Hanson, Kraus, and Nakashima (1989) initiallyset the KT values to 0.9, 0.3, 0.5, 0.3, 0.7, and 0.1 for segments from east towest, respectively. Thie parameters K, and K2 were set to 0.5 and 0.1,respectively, after initial testing. Wave data from an offshore gauge wereused to create an 18-month time series corresponding to the available surveydata. Because this time period included effects of Hurricane Bonnie, whichmade landfall close to the gauge, the wave data required extensive censoringto eliminate spurious extremes and give reasonable estimates of waveconditions at the site. The resulting mean wave height and period at thegauge after modification of the data set were 0.53 m and 5 sec, respectively.
During the calibration process, the KT values were modified to 0.4, 0.8,0.2, 0.1, 0.0, and 0.0 for segments from east to west, respectively. Theauthors expected to change these values slightly, since their initial estimateswere based on visual observations of dye movement, whereas structuretransmission pertains to wave heights and directions. The calculated shorelineposition agreed well with the measured position, with locations and widths ofsalients well-reproduced (Figure 34). The shoreline change corresponding tothe gap regions was not predicted so well. The calibrated model was used topredict beach response for a three-year time series. Qualitatively, thisprediction compared reasonably well with survey data.
(2) Lakeview Park, Lorain, Ohio. Hanson and Kraus (1989a, 1991)present simulations of shoreline response to the three-segment detachedbreakwater project at Lakeview Park, Lorain, Ohio. The purpose of thisapplication was to provide field verification of GENESIS for transmissive
Shoreline Position (ft)
N --
300
100 - Measured 01/23/86-- Measured 07/29/87
-Calculated 07/29/87Holly Beach. LA
a I I i I I
0 500 1000 1500 2000 2500 3000
Distance Alongshore (ft)
Figure 34. Preliminary model calibration, Holly Beach, Louisiana (Hanson,
Kraus, and Nakashima 1989)
Chapter 3 Tools for Prediction of Morphologic Response 59

detadced breakwaters. The L-akeview Park project consists of three rubble-mound detached breakwater segments protecting a placed beach fill, containedby groin on both ands.
Apin, the first stp in the numerical modeling application wes to evaluateall relevant studies and data sets available for the project area. Toncalculation cells were set up behind each detached breakwater, for analongahore grid spacing of 7.6 m. A one-year wave time series was used inthe calibration. First, the parameter K, was initially varied until calculatedoverall not transport rates were close to estimated values. Then K2 and theboundary condition at the west groin were varied to obtain the approximatemagnitudes of sand inflow from the west. Then the transmission coeficientswere varied to achieve correct salient sizes, with a best fit obtained for KE -=0.50, 0.22, and 0.30 from west to east. Finally, the location of the easternbreakwater was translated two grid cells to the east to obtain better agreementof the eastern-most salient position. The result provided good agreementbetween calculated and measured shoreline positions (Figure 35), with a meanabsolute difference of 1.2 m. Calculated and measured volumetric changesalso compared well (3,360 cu m predicted versus 3,290 cu m measured).
For the model verification time period, the boundary at the west groin wasobserved from aerial photographs to have retreated approximately 18 m.Therefore, this boundary condition was altered in the model setup, and modelverification proceeded using a 13-month wave time series. Reasonableagremeant was obtained, although semitivity testing indicated that increasingthe wave heights by 10 percent would result in a more accurate prediction, asshown in Figure 36. The mean absolute differen.e, between measured andcalculated shoreline positions was approximately 1.2 m, and the calculated andmeasured volumetric change compared well (-238 cu m calculated, -256 cu mmeasured).
Prior to evaluating alternative structure configurations, model sensitivity tokey parameters should be examined. The authors investigated sensitivity ofthe calibrated model to variations in K1 , K2, Ds, and Kr. Of particular noteis that, when grain size was halved, the predicted shoreline position indicatedan increase in sand volume. This is due to the more gently slopingequilibrium beach profile used in GENESIS, which moves the breaker linefurther offshore. However, GENESIS does not account for cross-shoremovement of material, which would be greater for the smaller diameter fill.Using an average value for K7 for each segment produced acceptable results,although differences in transmission coefficients could be possible due todifferences in breakwater construction, wave transformation across anirregular bottom, and differential settling.
The authors used the verified model to evaluate alternative designs formaintaining the beach fill in place. Simulations with detached breakwatersonly, groins only, and groins extended further seaward were evaluated.Hanson and Kraus conclude that the combination of detached breakwaters andshort groins, as constructed, is superior to simpler designs for preserving
60 Chapter 3 Tools for Prediction of Morphologio Response

Shoreline Position (ft)700
-- Measured 10/24/77 --- Measured 10/09/78600 - Calculated 10/09/75
500W
400/
300
200
100
00 200 400 600 800 1000 1200
Distance Alongshore (ft)
Figure 35. Calibration at Lakeview Park, Lorain, Ohio (Hanson and Kraus1991)
Shoreline Position (ft)700
-- Measured 10/09/78 - Measured 11/17/79600 - Calculated 11/17/79
500/
400
200
100
00 200 400 600 800 1000 1200
Distance Alongshore (ft)
Figure 36. Verification at Lakeview Park, Lorain, Ohio (Hanson and Kraus
1991)
Chapter 3 Tools for Prediction of Morphologic Response 61

placed beach fill material. The model was then applied to a five-yearsimulation. Results were good, showing correct trends of shoreline recessionon the west side, advancement on the east side, salient type, and a pivot pointin the shoreline where the position did not vary over time.
Summuary. Table 7 summarizes the GENESIS modeling parameters forthe detached breakwater projects discussed above and presented inAppendix A. The best modeling parameters to use for shoreline changemodeling studies are those that recreate known shoreline change through thecalibration and verification process. However, calibration and verificationdata sets are not always available, and parameters must be estimated based onprevious studies. Selected input data are briefly reviewed below.
Table 7GENESIS Modeling Parameters for Detached Breakwater Studies
Longehore MedianNunber of Transport Transport Time- Grid GrainBreakwater Tranemeision Peramete: Parmeter Step Spacing Size
Project Nam Saunenta Coefficients K (hour) (an) (ram)
Holly Beach. 6 0.0,0.0, 0.50 0.10 0.25 4.6 0.20Louielana 0.1.0.2.(Hason. 0.8,0.4Kraus. and (we"t toNakeaNma es*t)(19881_ _ _ _ _ ______ ____ _ _ __ __ _ _ _ _ _ _ _
Lakeview 3 0.50. 0.22, 0.42 0.12 0.30 7.6 0.40Park. Lorain. 0.30 (westOio (Harmon to eOt)and Kraus1989b. 1991)
Presque mle, 3 (Bch 10) 0.25 (all) 0.40 0.12 3 7.6 1.0Pennsylvania(USAED, 3 (Bch 1) 0.50 (all) 0.10 0.12 3 7.6 1.0Buffalo,unpublished)
Bay Ridge, 11 0.10 0.50 0.25 1 3.8 0.5
(Appendix B)
(1) Structure transmission. In Version 2.0 of GENESIS, a constant wavetransmission value is assigned to each breakwater segment. In nature,transmission for a given structure varies as a function of the incident wavecharacteristics and water levels. For GENESIS simulations of Lakeview Parkand Holly Beach, the breakwater transmission coefficients were determinedthrough the calibration process to reproduce known shoreline change. ForPresque Isle, breakwater transmission coefficients were ultimately chosenbased on physical model testing results. The availability of transmission datafrom the physical model tests in the Presque Isle study provided anopportunity to compare an average KT with a transmission coefficientcalculation using a standard calculation procedure. This comparison indicated
62 Chapter 3 Tools for Prediction of Morphologic Response

that, in the absence of calibration and verification data with which thetransmission parameter can be determined, the transmission coaffie shouldbe calculated using the largest waves within the period of record to moreaccurately model shoreline change. Relationships for estimating rubble-moundstrumcre transmission are presented in Chapter 4.
(2) Call spacing. Hanson and Kraus (1989b) and the individualsimulations discussed herein recommend using from 8 to 10 longshore cellsper breakwater segment to ensure proper resolution of shoreline change to thelee of the structure.
(3) Median grain size. As discussed previously, GENESIS uses mediangrain size to determine the steepness of the equilibrium profile shape. Ideally,a typical project profile should be used to back-calculate an effective grainsize that produces a similar profile shape (see equilibrium profile templateprovided by Hanson and Kraus (1989b)). In the absence of bathymetric data,a representative median grain size in the surf zone should be specified. Theuser should check to ensure that the structure depth specified in the GENESISinput file approximates the profile depth corresponding to the desired distanceoffshore.
(4) Wave climate. Gravens and Scott (1993) compared different hindcastwave climates to measured wave gauge data for a site in Florida, andevaluated the data set that best reproduced longshore sand transport rates.They recommended that, if available, a two-component wave climate be usedin numerical modeling of longshore sediment transport. A two-componentwave train allows wave input from two wave sources, and more accuratelyrepresents what occurs in nature.
Physical Models
The final design of coastal structures such as a detached breakwater systemis often evaluated using physical hydraulic models. These models can predictthe breakwater's performance in the actual (prototype) coastal location anddetermine desired or necessary modifications to improve breakwaterperformance. Physical model results can also be used to validate results fromthe previously described numerical simulations. Physical model geometricscales for coastal applications typically range from 1:20 to 1:500, and insome cases near full-scale modeling or tracer studies are used to reproducesediment movement observed at the actual site location.
Physical models exactly reproduce prototype conditions when geometric,kinematic and dynamic similarity are attained. However, complete similarityis seldom possible. Therefore, the more critical physical conditions (i.e.,gravity waves, water currents, friction, surface tension, sediment motion, etc.)
Chapter 3 Tool. for Prediction of Morphologic Response 63

are identified, and similarity is attained for the mt dominant or sverecondition. In some cum the geometric scale is distorted becamue modelingome dinimon (i.e., borizoml length) may cam aother dimension (i.e.,depth, sediment diameter) to be extremely small or lre, which s impracticalor results in improper flow conditions. In general, physical hydraulic modelsare classified as undistorted fixed-bed, distorted fixed-bed, or movablebed,which Is usually distorted because the model and sedimet scales are differla.
Fixed-bed models basically mean the bed, or bottom, is not moving.Typically, die bed is constructed to the required depth ontMus uin concretemortar. An undistorted fixed-bed model has die same geometric scale for alllength dimensions (i.e., length, width, depth, characteristic size, etc.), andgeometrically distorted models scale one of the dimensions or characteristicsize at a different geometric scale. For example, the width is scaled 1:100and the depth is scaled 1:10.
In coastal applications the bed is usually sediment, and it cam move as aresult of the hydrodynamic forces exerted by the moving fluid medium.These forces are cased by coasial currents, waves, and water level changes.Complete three-dimensional movable bed models are the best approach tomodel applications where knowledge of sediment movement is desired such asis the case for determining the performance of a detached breakwater system.However, these models do not assure total similitude and the cost, complexity,and time required to conduct experiments result in modified movable bedmodels, which do not satisfy all of the primary similarity requirements.Thierefore, a combination of fixed-bed modeling, tracer studies, and movable-bed modeling has been employed at WES.
T'he WES has numerous large and small physical model facilities forconducting fixed- and movable-bed model tests and sediment tracer studies.The USACE guidance for physical modeling of coastal phenomena isdescribed by Hudson et al. (1979). Authorative references related to physicalmodeling or model similitude such as Langhaar (1951), Keulegan (1966),Yalin (1971), and Schuring (1977) are additional sources of guidance for theconduct of physical modeling in the laboratory. Hughes (1993) addressesfixed- and movable-bed modeling specifically for coastal engineering, with achapter that is completely devoted to movable-bed modeling and incorporatesthe latest knowledge from the engineering and scientific communities. Theopen literature is another source for guidance and examples of physicalmodeling procedures and experiences. Frequently referenced studies ofKamphuis (1975), Noda (1971), and Le Mehaute (1970) describe guidelinesand procedures for movable-bed modeling and tracer studies.
Summary of procedures for physically modeling shoreline response todetached breakwaters
Over the past two decades, physical modeling procedures have beendeveloped and used by WES to evaluate detached segmented breakwaters.
64 Chapter 3 Tools for Prediction of Morphologic Resporme

These procedures ae described by Curren and Ctmham (1977, 1910), Dottin(192), Seabergh (1983), and Daily and Pope (1986). A inmber ofundistorted fixed-bed models, tracer studies, and/or movable-bed models havebeen constructed at WES and used to predict the perfrmance of detachedbreakwaters in minimizing shoreline erosion. Fixed-bed models are used toinvestigate the interaction of existing structures (i.e., groins) with the plannedbreakwaters and their effect on wave-generated currents. Tracer studies arethen used in the fixed-bed model to qualitatively illustrate sediment movementfor existing structures and planned breakwater additions.
In movable-bed models, wave conditions are first generated in themovable-bed model to match or create an existing shoreline condition (basecase). Then, the same wave conditions are generated with the model detachedbreakwater in place, and the shoreline effects are observed and documented.Several plans for the breakwater placement and/or chracteistics are usuallymodeled to determine the optimum design.
Pretotyp data. Well-documented information regarding prototype condi-tions over a sufficient period of time is crucial for this type of modeling.Wave characteristics, water level, bathymetry, shoreline history, sedimentcharacteristics, currents, and sediment budget are necessary. Curren andChatham (1980) indicate that the essential data are littoral transportcomputation, sediment size distribution analysis, and the simultaneousmeasurement of incident wave characteristics, bottom bathymeuy, and littoraland offshore-onshore sediment transport over a period of erosion andaccretion. Movable-bed modeling requires the most field data and a minimumof two years of prototype data are recommended by Dally and Pope (1986).Since data requirements are project specific, it is important that the client andmodeler communicate to determine whether the necessary data are available orneed to be collected prior to the modeling effort.
Fixed-bed model. Froude similitude is normally used for fixed-bedmodels and the geometric scale is selected as large as possible. Factorsconsidered in scale selection are depth of water required to prevent excessivebottom friction effects, model wave heights, available model area, wavegenerating and instrument capability, efficiency, and cost. The beach andbathymetry are constructed of concrete mortar to reproduce the bathymetrycontours for a known prototype condition documented at some date and time.Existing shore protection structures are also constructed and incorporated inthe model. For example, groins are usually constructed of galvanized metalor stone and placed in the model according to prototype maps and surveydata. The detached breakwaters are constructed of stone and each stone isscaled so wave reflection and transmission are correctly modeled. Theundistorted fixed-bed model of sufficient size correctly reproduces waverefraction, shoaling, diffraction, breaking, and nearshore circulation cells (rip,feeder, and eddy currents). The important parameters to be modeled are waveheight, period and direction, water levels, and wave-generated currentsalongshore and adjacent to structures. Dye injected into the water has beenused to measure and document current patterns and magnitudes. Waves are
65Chapter 3 Tools for Prediction of Morphologic Response

produced by a wave genertor, which can be reoriented to obtain directionaityof the waves. Mo m atic waves have been used in previous sudie ofCurrmn and Chatham (1977, 1980), Bottin (1982), and Seabergh (1983), butcapabilities currently exist for generating irregular waves for future studies.Results of fixed-bed modeling can assist in the determinaion of breakwaterlocation to minimize rip current occurrence, scour around structures, offshoresediment transport, and hazards to swimmers. These results are also used toevaluate wave attenuation characteristics for various wave conditions, waterlevels, and breakwater lengths.
Tram. smudes. Sediment tacer studies are conducted by placinglightweight sediment as a thin veneer over the fixed-bed bottom contours andobserving the location of sediment accumulation and direction of transport.This technique was successfully used by Bottin and Chatham (1975).Selection of the tracer material is based on criteria of Noda (1971), whichrelates model to prototype ratios of sediment size, specific gravity, andhorizontal and vertical model scales. Noda's method assumes a distorted scaleexists in a movable-bed model. Because an undistorted model is used forfixed-bed modeling to acuaely model wave refraction and diffraction, arange of tracer sediment sizes is determined by using the vertical scale ratiofirst and then the horizontal scale ratio to evaluate sediment size scale ratiosfor the same specific gravity. In the Presque Isle, Pennsylvania, study(Seabergh 1983), the prototype sediments varied from natural sands withmedian diameters ranging from 0. 11 to 0.25 mm to coarser sands used forbeach fill with a median diameter of 1.8 mm. Using the Noda method forcrushed coal specific gravity of 1.35, the model sediments were required to be2.05 to 2.69 times the prototype size. Tnerefore, the crushed coal particlediameter ranged from 0.22 mm (2.05 x 0.11) to 4.84 mm (2.69 x 1.8), and0.5-mm crushed coal was used in the tracer study. Results may be used toevaluate the effeM of breakwater distance offshore on longshore sedimenttransport and to duplicate qualitative tombolo development.
Movable-bed modeling. A movable-bed model section is constructed andinset in an area of the fixed-bed model. Wave conditions, water levels, andsediment size are adjusted to produce the documented prototype phenomena(base case) and then the same hydrodynamic conditions are used with thedifferent improvement plans installed in the model, one at a time, todemonstrate effects on the shoreline. The sediment size for the model isdetermined by the same technique as described for the tracer tests, onlydifferent scaling criteria may be selected. In the Presque Isle study, a 0.9-mmcrushed coal was used to model the beach fill sediment. The model sedimentis continually fed along the shoreline interface where sediment is removed as aresult of wave effects. These tests take considerable time to allow thesediment to redistribute itself and to show effects of the in-place detachedbreakwater structures on improving the stability of the shore material. Themodel results give only qualitative information on the sediment transport.Results may be used to evaluate bathymetry response to a detached breakwaterand beach fill readjustment due to the breakwater.
66 Chapter 3 Toole for Predition of Morphologic Response

Summary of physically modeled detached breakwater projectsconducted at the USAE Waterways Experiment Station
Four physical model studies of detached segmented breakwater systems,namely Presque Isle, Pennsylvania, Lakeview Park, Ohio, Oceanside Beach,California, and Imperial Beach, California, were conducted in laboratoryfacilities at WES from 1978 to 1983. All modeling was performed in amovable-bed facility and is described in detail by Seabergh (1983), Bottin(1982), and Curren and Chatham (1977, 1980). A summary is presnted byDally and Pope (1986), which is the basis of the project summaries presentedherein.
Preque Ise model study. Presque Isle Peninsula near Erie,Pennsylvania, is a recurved sand spit protecting Erie Harbor, and is also astate park with I I recreational beaches along the approximately 1 1-knshoreline. Historically, the landward connection of the spit has been severedseveral times and beach erosion continued as the spit migrated to the east.Groin field and beachfill projects did not halt the erosion, and consequently,detached segmented breakwaters were considered as a possible stabilizingsolution. A prototype segmented breakwater with three segments wasconstructed in 1978, and field monitoring of the shoreline response wasconducted. These data were used to verify sediment movement in subsequentphysical models.
A 1:50 scale, undistorted physical model as described by Seabergh (1983)was constructed to evaluate the performance of the segmented detachedbreakwaters at Presque Isle using Froude scaling laws. The model reproduced2,865 m of shoreline that included part of an existing groin field and arelatively unstructured section of the shore as shown in Figure 37. Thispermitted study of the interaction of the proposed breakwaters with two beachsediment types, and of particular interest was the positioning of thebreakwaters with respect to the existing groins. A movable-bed section wasconstructed in the model test basin using crushed coal based on sedimentscaling procedures of Noda (1971). Tests were conducted for existingconditions (base plan) and three segmented breakwater plans. These testsincluded (1) measurement of wave-generated current and water circulationpatterns, (2) crushed coal tracer tests, and (3) crushed coal beachfill tests.
A shoreline response similar to that observed in the prototype wasexperimentally duplicated. Figure 38 shows a comparison between the modeland prototype shorelines after an accretionary period and then after the winterseason when higher water levels and severe wave conditions reduced tombolodevelopment. Figure 39 shows one of the proposed breakwater plans installedin the laboratory model. The results indicated that a 107-m spacing between46-m-long segments produced satisfactory conditions within the reach coveringthe groin field. The optimum placement of the breakwaters was offshore ofthe groin ends. With the groin field removed, the segments could be placedcloser to shore with reduced generation of offshore currents, but the tombolostook longer to form.
67Chapter 3 Tools for Prediction of Morphologic Response

.---CAMC&LA-W- CMMNEL
Z.I ,
sz *
1 4.
z
0,-4.'.I/
;, 0
>0
_ _ _ _ 1 '4N,:
68 Chapter 3 Toole for Prediction of Morphologic Response

MODEL (ACCRETION OF SHORELINE)
b. PROTOTYPE (16 NOVEMBER 1979)
g.MODEL (EROSION OF SHORELINE)
c. PROTOTYPE (17 APRIL 1980)
Figure 38. Comparison of shoreline response for the Presque Isle model and prototypesegmented detached breakwater (Seabergh 1983)
69Chapter 3 Tools for Prediction of Morphologic Response

Figure, 39. An example detached breakwater plan as installed in the Presque
Isie model (Seabergh 1983)
70 ~Chapter 3 Toole for Predction of Morphologic Response
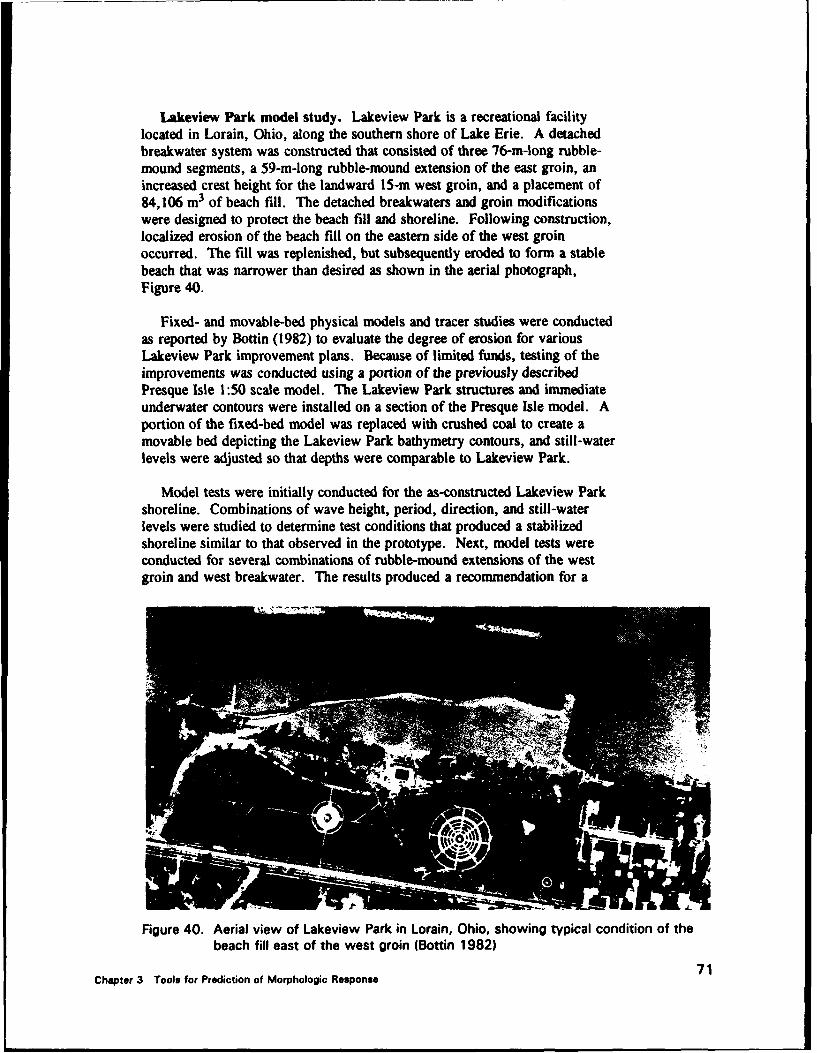
Lakeview Park model study. Lakeview Park is a recreational facilitylocated in Lorain, Ohio, along the southern shore of Lake Erie. A detachedbreakwater system was constructed that consisted of three 76-m-long rubble-mound segments, a 59-m-long rubble-mound extension of the east groin, anincreased crest height for the landward 15-m west groin, and a placement of84,106 m3 of beach fill. The detached breakwaters and groin modificationswere designed to protect the beach fill and shoreline. Following construction,localized erosion of the beach fill on the eastern side of the west groinoccurred. The fill was replenished, but subsequently eroded to form a stablebeach that was narrower than desired as shown in the aerial photograph,Figure 40.
Fixed- and movable-bed physical models and tracer studies were conductedas reported by Bottin (1982) to evaluate the degree of erosion for variousLakeview Park improvement plans. Because of limited funds, testing of theimprovements was conducted using a portion of the previously describedPresque Isle 1:50 scale model. The Lakeview Park structures and immediateunderwater contours were installed on a section of the Presque Isle model. Aportion of the fixed-bed model was replaced with crushed coal to create amovable bed depicting the Lakeview Park bathymetry contours, and still-waterlevels were adjusted so that depths were comparable to Lakeview Park.
Model tests were initially conducted for the as-constructed Lakeview Parkshoreline. Combinations of wave height, period, direction, and still-waterlevels were studied to determine test conditions that produced a stabilizedshoreline similar to that observed in the prototype. Next, model tests wereconducted for several combinations of rubble-mound extensions of the westgroin and west breakwater. The results produced a recommendation for a
51
Figure 40. Aerial view of Lakeview Park in Lorain, Ohio, showing typical condition of thebeach fill east of the west groin (Bottin 1982)
71Chapter 3 Tools for Prediction of Morphologic Response

30.5-m-long extension of the west groin toward the western head of the westbreakwater segment (Figure 41). This resulted in a smaller opening betweenthe groin and breakwater; thus, less wave energy penetrated the opening andresulted in only a minor retreat of the west-end shoreline. The model tests areonly qualitative, but showed the significance of the groin for local erosion.
Oceanside Beach model study. Oceanside Beach is a recreational beachlocated along the Pacific Ocean approximately 129 km southeast of LosAngeles and 48 km northwest of San Diego, California. Persistent erosion ofOceanside Beach and accretion of sand in the Oceanside Harbor and entrancechannel have occurred since construction of the Del Mar Boat Basin in 1943.
As described by Curren and Chatham (1980), an undistorted fixed-bedphysical model with a geometric scale of 1:100 was constructed to investigatethe arrangement and design of proposed structures for preventing erosion ofOceanside Beach. Froude modeling laws and a crushed coal tracer materialwere used in modeling existing conditions and several improvement plans.First, tracer material was placed on the fixed-bed model surface at selectedlocations and fed into the longshore current to determine the mechanisms oflittoral movement. Second, the tracer material was placed in a layerrepresenting beach fill on the model surface to determine areas of accretionand erosion. However, the extent of erosion was limited by the fixed modelsurface. Finally, the fixed-bed contours were removed and remolded usingcrushed coal to obtain a movable-bed model. This type of modeling is themost reliable for determining areas of accretion and erosion, and it was usedfor each beach protection plan.
Figure 41. Shoreline in model tests with the Lakeview Park recommended plan of a 30.5-mextension of the west groin (Bottin 1982)
72 Chapter 3 Tools for Prediction of Morphologic Response

Modeling results for the existing condition produced an onshore movementof the coal tracer for small waves of low steepness with longshore transport atthe shoreline. For high-steepness waves, the coal tracer moved seawardforming a bar at the most seaward breaker zone. This material migrated northor south depending on wave direction. The high-steepness waves re-formedand broke a second time near the shoreline, resulting in a second nearshorezone of longshore transport. The detached breakwater plans tested included asingle 1,494-m-long structure with varying crest elevation and a segmentedbreakwater system consisting of four 203-m-long segments with 203-m gaps.Each plan was tested both with and without groins at the northern andsouthern extremes of the beach. Movable-bed model tests showed that the testplans without groins (Figure 42) generally resulted in erosion of the shore onthe updrift side of the model beach and loss of material from the downdriftside indicating inadequate protection of the beach fill. Tests with groins ateach extreme (Figure 43) showed a reduction of the amount of coal leavingthe beach area and a fairly stable shore.
Imperial Beach model study. Imperial Beach is located on the PacificOcean coastline 5.6 km north of *he Mexican border and 17.7 km south ofSan Diego, California. It is a recreational beach with a 366-m-long fishingpier located in the center and normal to the beach. Two groins, 226 and 122m long, are located 899 and 495 m north of the fishing pier, respectively.The main sediment source for Imperial Beach is the Tijuana River, andconstruction of Morena, Barret, and Rodriquez Dams has trapped the riversediments behind the dams. Lack of river flooding has also been cited for theshortage of sediment reaching the mouth of the Tijuana River. The decreasedamount of sediment available for longshore transport to Imperial Beach hascaused increased beach erosion. Two groins that were constructed between1959 and 1963 were ineffective in stabilizing the beach.
Froude model testing in a 1:75 scale physical model was conducted toevaluate the arrangement and design of alternative structures for theprevention of Imperial Beach erosion. Crushed coal was used as a tracer formodeling the existing condition and proposed new structures under variouswave conditions. The proposed new structures consisted of (1) a singledetached breakwater at the -4.6- and -3.0-m depth contours, (2) segmentedbreakwaters at the -4.6- and -1.5-m contours, (3) a single detached breakwatersegmented by low sill sections at the -3.0- and -1.5-m contours, and (4) vari-ous groin locations.
The model results for existing conditions showed that both north- andsouth-directed longshore currents were interrupted at regular intervals bystrong rip currents that transported significant quantities of sediment offshorewhere it was either lost in deep water, transported alongshore on a bar, ortransported shoreward by low steepness waves. These model rip currentswere similar to observed prototype currents. A five-groin plan resulted instrong rip currents for almost all wave conditions and was ineffective intrapping tracer material. A nine-groin series was effective in trapping tracermaterial, but significant quantities of stone would be required for construction.
73Chapter 3 Toole for Prediction of Morphologic Response

4N4
Figure 42. Oceanside Beach model test results for a single detached breakwater withoutgroins. Arrows show current direction (Curren and Chatham 1980)
Cr46
Figure 43. Oceanside Beach model test results for detached segmented breakwater systemwith groins. Arrows indicate current direction (Curren and Chatham 1980)
74 Chapter 3 Tools for Prediction of Morphologic Response

Testing segmented breakwater plans at the 4.6-m depth contour (Figure 44)showed that shorter segments with shorter gaps produced weaker rip currentsand retained most of the tracer material, but a large volume of stone wasrequired for construction. Submerged structures at the -3.0-m depth revealedthat breaking waves piled water between the breakwater and shoreline, and theseaward return of the water created strong rip currents and the loss of tracermaterial to deep water. Test results with segmented breakwaters located at the-1.5-m contour with gaps indicated there was too much wave transmission inthe structure lee. Low sills were placed in the gaps (Figure 45) and weresuccessful in retaining all but small quantities of tracer, and thus the low sillsbetween breakwater segments appeared to reduce the total wave transmissionand caused the least impact on longshore transport.
Figure 44. Typical wave and current patterns and current magnitudes for segmenteddetached breakwaters at the -4.6-m contour in the Imperial Beach model (Currenand Chatham 1977)
Chapter 3 Tools for Prediction of Morphologic Response 75

Figure 45. Results of Imperial Beach model study for a single detached breakwater withlow sills at -1.5-m depth contour (Curren and Chatham 1977)
76 Chapter 3 Tools for Prediction of Morphologic Response

4 Structural Design Guidance
Structural Design Objectives
Traditional high-crested breakwaters with a multi-layered cross section aretypically used for navigation purposes at entrance channels and harbors; butmay not be appropriate for a structure used to protect and stabilize a beach,shoreline, or wetland. Adequate protection may be more economicallyprovided by a low-crested or submerged structure composed of ahomogeneous pile of stone. The greater tolerance of wave transmission atsuch sites has resulted in low-crested rubble-mound breakwaters being widelyused or considered for use in beach stabilization, shore protection, andwetland development or protection. Recent laboratory tests specifically relatedto low-crested structures have resulted in empirical relationships to determineboth the stability and performance characteristics of low-crested rubble-moundstructures. The focus of this chapter of the report is aimed at the structuralaspects of rubble-mound breakwaters.
The main structural design objectives of detached breakwaters are to ensurethat the structure remains stable and provides acceptable performancecharacteristics throughout the project design life. Low-crested breakwaterdesign consists of determining the required crest elevation, crest width,structure slope, and armor requirements to provide the desired stability andfunctional performance under the anticipated design wave and water levelconditions. Structural guidance is provided to aid in the development of abreakwater cross section to meet both the functional and structural needs of agiven project location.
Design Wave and Water Level Selection
In the selection of design water levels and design waves for a project, theconditions critical to structure stability and performance must be considered."Tle conditions represent critical threshold combinations of tide level, surgelevel, wave conditions, etc., which, if surpassed, will endanger the projectand/or make the structure nonfunctional during their occurrence
Chptem 4 Stna•.-a D0.un Gukdn 77

(EM 1110-2-1414). Methods to estimate the probabilifie of exceedence ofsuch critical conditions along with detailed guidance on the detrination andselection of water levels and wave heights for coastal engineering design arepresented in EM 1110-2-1414, Water Lewis and Wave Heights for CoastalEngineering Design. Such critical ccnditions may be tolerable on a morefrequent basis for shore stabilization structures compared to navigationstructures, since such structures are primarily used to prevent erosion, not toprotect people's lives. A decrease in design level may also offer a substantialcost savings over the traditional SPM design approach. These factors need tobe considered when selecting design water levels and wave heights fordetached breakwaters used as shoreline stabilization structures.
Water levels
The entire range of possible water levels is needed for the structural designof beach stabilization structures. High-water levels are used to estimatemaximum depth-limited breaking wave heights and to determine crestelevations. Low-water levels are generally used for toe protection design.Water levels can be affected by astronomical tides, storm surges, seiches,river discharges, natural lake fluctuations, and reservoir storage limits.
Design water levels are typically described statistically in terms offrequency, or probability that a given water level will be equalled orexceeded, or its return period in years. Thus, for example, the water levelthat is exceeded once in 50 years (a 2-percent probability of being exceeded inany 1 year) might be specified as a design water level. Significant deviationsfrom predicted astronomical tide levels will occur during storms because ofmeteorological tides (storm surges) caused by strong onshore winds and lowatmospheric pressure. Consequently, design water levels for a structure mayinclude a storm surge with a specified return period. Detailed information onthe prediction of astronomical tides and storm surge are available in EM 1110-2-1414 and EM 1110-2-1412.
Waves
Wave data required for structural design differ from data needed forfunctional design. Structural design generally focuses on larger waves in thewave climate since these waves represent critical conditions which mayendanger the structure's stability. Structural stability criteria are most oftenstated in terms of extreme conditions which a coastal structure must survivewithout sustaining significant damage. The conditions usually include waveconditions of some infrequent recurrence interval, say 25 or 50 years.
Wave height statistics to determine design conditions will normally bebased on hindcast wave data since a relatively long record is needed forextrapolation and wave gauge records rarely cover a sufficient duration. WIShas developed hindcast data spanning 20 years for all three ocean coasts and
78 Chapter 4 Structural Design Guidance

the Great Lakes. Hindcast data are normally presented for relativelydeepwater conditions. Since detached breakwaters are placed in the nearshoreenvironment, the selected design wave height must be analytically propagatedshoreward to the structure. The deepwater significant wave height andsignificant or peak spectral wave period can be used along with water leveland bathymetric data to perform refraction and shoaling analyses whichdetermine wave conditions at the site. Several numerical models are availableto perform these operations and are presented as part of the CMS (Cialone etal. 1992).
The choice of design wave conditions for structural stability shouldconsider whether the structure is subjected to the attack of nonbreaking,breaking, or broken waves. Wave conditions at a structure site dependcritically on the existing water level. Consequently, a design still-water level(swl) or range of water levels must be established in determining wave forceson a structure. Structures may be subjected to radically different types ofwave action as the water level at the site varies. A given structure might besubjected to nonbreaking, breaking, and broken waves during different stagesof a tidal cycle. Critical design conditions are the wave and water levelcombinations which result in maximum forces or minimum structural stability.
Selection of design wave heights for nearshore structures will often becontrolled by depth-limited waves. The depth-limited breaking wave heightfor the given design water level should be calculated and compared with theunbroken design storm wave height, and the lesser of the two chos'A as thedesign wave. Maximum depth-limited breaking wave heights can be estimatedusing procedures found in Chapter 7 of the Shore Protection Manual (1984).
If breaking in shallow water does not limit wave height, a nonbreakingwave condition exists. For nonbreaking waves, the design height is selectedfrom a statistical wave height distribution. The selected design height dependson whether the structure is defined as rigid, semirigid, orflexible (ShoreProtection Manual 1984). For rigid structures, such as cantilever steel sheet-pile walls, where a large wave within the wave train can cause failure of theentire structure, the design wave height is normally based on H1 (= 1.67 H',the average of highest 1 percent of all waves). For semirigid structures, thedesign wave height can range from Hto (= 1.27 H,, the average of highest 10percent of all waves) to H1. Steel sheet-pile cell structures are semirigid andcan absorb wave pounding; therefore a design wave of H10 may be used. Forflexible structures, such as rubble-mound structures, the design wave heightH1o is typically used. Waves higher than the design wave height impingingon flexible structures seldom create serious damage for short durations ofextreme wave action.
Damage to rubble-mound structures is usually progressive, and an extendedperiod of destructive wave action (waves greater than design conditions) isrequired before a structure ceases to provide protection. It is thereforenecessary in selecting a design wave to consider both the frequency ofoccurrence of damaging waves and economics of initial construction,
Chapter 4 Structural Design Guidance 79

protection, and maintenance. On the Atlantic and Gulf coasts of the UnitedStates, hurricanes may provide the design criteria. The frequency ofoccurrence of the design hurricane at any site may range from once in 20years to once in 100 years. On the North Pacific Coast of the United States,the weather pattern is more uniform and severe storms are likely each year.The use of H, as a design height under these conditions could result insignificant annual damage due to a frequency and duration of waves greaterthan H, in the spectrum. Higher wave heights such as HIo or H.5 may beadvisable to reduce maintenance costs (Shore Proection Manual 1984).
Structural Stability
Structural stability analyses are performed to determine required armorunits or to predict expected level of damage that will occur for a givenstructure exposed to selected design wave and water level conditions.Structural stability can be divided into two types: static and dynamic.Conventional breakwaters have been designed to remain statically stable orallow zero damage to rigid and semirigid structures and less than 5 percentdamage to rubble-mound structures for wave conditions not exceeding designconditions. Recent efforts (Ahrens 1987,1989; Van der Meer 1990, 1991;Sheppard and Hearn 1989) have focused on the design of dynamically stablestructures such as reef breakwaters where initial crest heights are allowed tobe reshaped due to wave attack. The stability of such structures is measuredin teram of reduction in crest height due to wave attack.
The stability of a rubble-mound structure can be influenced by a number ofparameters including wave and water level conditions, armor characteristics(size, shape, placement methods, etc.), crest elevation and width, structureslope, and overall structure permeability. A number of dimensionlessparameters including the stability coefficient, stability number, and spectralstability number have been developed by various researchers (Shore ProectionManual 1984; Ahrens 1984,1987) to incorporate the influence ofenvironmental variables and structural design parameters into a singleparameter. Such parameters are useful in analyzing the influence of eachvariable on the overall sta'aility of the structure.
Stabilities of three different types of rubble-mound breakwaters arepresented to aid in the design of a nearshore breakwater for shorelineprotection. The three types are defined as conventional, statically stable low-crested, and dynamically stable reef breakwaters. Methods are presented foreach structure type to assess the structure's stability and determine stonedimensions and crest elevations required to provide a stable structure.
80 Chapter 4 Structural Oesign Guidance

Conventional breakwaters
Conventional rubble-mound breakwaters (Figure 46) have been designedfor "zero" damage (less than 5 percent structural damage) under design waveconditions. In the case of offshore breakwaters, this usually means specifyingthe crest elevation such that little to no overtopping occurs, since the volumeof water overtopping the crest has been found to be an important parameter indetermining rear slope stability (Sheppard and Hearn 1989). Zero damageand minimal overtopping are two assumptions incorporated into the Hudsonstability formula (Shore Protecdon Manual 1984),
wH 3,, O)W= , S(20)K, (S, - 1 Cote
where W is the weight of the individual armor unit; W, is the unit weight ofthe armor unit; H is the design wave height; KD is the stability coefficient; S,is the specific gravity of the armor unit; and 0 is the angle of structure slopemeasured from horizontal.
/-CREST WIDTH
BREAKWATER CREST C WMAX DESIGN SWL
SWL (MINIMUM)--,, W/10 SWL (MINIMUM)
2r 3r ING W/200 TO W/400
Figure 46. Cross section for conventional rubble-mound breakwater withmoderate overtopping (Shore Protection Manual 1984)
The Hudson formula has been used extensively in the United States forbreakwater design. However, apparent shortcomings of Hudson's formula,including lack of influence of wave period and the fact that it is based onregular wave tests, have been the subject of much discussion in recent years.Additional research aimed at such concerns has been conducted by a fewinvestigators (Van der Meer 1987, Carver and Wright 1992).
Van der Meer (1987) derived two stability equations, one for plunging(breaking) waves and one for surging (nonbreaking) waves. These equationsare as follows:
Chapter 4 Structural Design Guidance 81

Plunging (breaking) waves
MI- 6.2 PO- ~ (~4 (21)
Surging (nonbreaking) waes
___H, = 1.0 P- OL13 S(22)A Dv FNo(
where t. is the surf similarity parameter,tan 0
2w H, (23)
A = relative mass density of stone, = Oaw"- 1 (24)Pa = mass density of armorP, = mass density of waterDDo = nominal diameter of stone, = M (25)W5o= 50 percent value (median) of the mass distribution curveP = permeability coefficient of the structure as defined by Van der
Meer (1987) (Figure 47)S = damage level, = A* /D,50s2 (26)Ae = eroded cross-sectional area in profileN = number of waves (storm duration)iz = surf similarity parameterTz = average wave period
The term on the left side of Equations 21 and 22 is referred to as thestability number N, as defined by Van der Meer.
N, (27)ADsso
Van der Meer's equations clearly include more explicit dependence onimportant parameters of the problem than Hudson's formula. They areformulated in terms of irregular wave parameters. A dependence on waveperiod comes in through the surf similarity parameter, f.. Permeability,which has been shown to impact stability, is also included as well as damagelevel and storm duration. However, there are some important explanationsand qualifications which need to be considered when applying Van der Meer'sequations. Van der Meer's definitions of significant wave height,permeability, and acceptable damage levels must be used when applying theequations. Also, design conditions must fall within the acceptable ranges ofstructure slope, wave steepness, storm duration, and mass density. Both theHudson formula and Van der Meer's equations are suitable in stability analysis
82 Chapter 4 Structural Design Guidance

0 n50 A/D n5 F44.5 D n50 A/D n50 F=2
D n0D AD F/D n50 C=4
(b)
D n50 A/D n50 C=3.2
(c) (d)
Dn50 A = Nominal Diameter Armor
D n50 F = Nominal Diameter Filter
D n50 C - Nominal Diameter Core
Structures on Fig. 5a, 5c, and 5d Have Been TestedThe Value of P for Fig. 5b Has Been Assumed
Figure 47. Permeability coefficient P (Van der Meer 1987)
of breakwater armor layers; however, each has limitations and assumptionswhich need to be considered in design.
Statically stable low-crested breakwaters
Low-crested breakwaters are similar to conventional non-overtoppedstructures, but are more stable due to the fact that a large part of the waveenergy can pass over the breakwater. The increase in stability can bephysically explained by the different wave motion which acts on thestructure's slope. For non-overtopped structures, the majority of runup waterwill return during the down-rush (except for the part that penetrates the core).
Chapter 4 Structural Design Guidance 83
With a lower crest the wave overtops the structure and the rundown will bemuch smaller, which increases stability. An example of a low-crestedbreakwater is shown in Figure 48.
The stability of a low-crested breakwater with the crest above the still-water level is first established as being a non-overtopped structure (Van derMew 1990). Stability formulae such as Hudson's formula or Van der Meer'sformulae can be used to determine the required stone diameter of the non-overtopped breakwater. Required stone diameter for an overtoppedbreakwater can then be determined by multiplying the stone diameter for anon-overtopped breakwater by a reduction factor to account for the increase instability. After analysis of several data sets, Van der Meer (1991) describesthe increase in stability as a function of dimensionless freeboard R• in theform of the following reduction factor:
Reduction factor for Ds&, r = 1/(1.25 - 4.8 R) (28)
for 0 < R• < 0.052
where = dimensionless freeboard, R-H, (se ^1)°'5 (29)C = crest freeboard, level of crest relative to still water
s, "fictitious wave steepness, 2iH/gT•2 (30)•P- = peak wave period
Equation 28 describes the stability of a statically stable low-crested breakwaterwith the crest above still-water level in comparison with a non-overtoppedstructure. Figure 49 shows Equation 28 for various wave steepnesses. Thereduction factor for the required stone diameter can be read off the graph orcomputed using Equation 28. It can be seen in Figure 49 that an averagereduction of 0.8 in diameter is obtained for a structure with the crest height atthe still-water level. The required mass is a factor (0.8)f = 0.51 of thatrequired for a non-overtopped structure.
Dynamically stable roef-type breakwaters
A reef breakwater is a low-crested rubble-mound breakwater without thetraditional multi-layer cross section (Figure 50). This type of breakwater islittle more than a homogeneous pile of stones with individual stone wtightssimilar to those used in the armor and first underlayer of conventionalbreakwaters (Ahrens 1989). Because of their high porosity and low crest, reefbreakwaters are stable to wave attack and, at the same time, if they are highenough, can dissipate wave energy effectively. Since they have no core, theycannot fail catastrophically and therefore a logical strategy is to allow them toadjust and deform to some equilibrium condition (Ahrema 1989). The equilib-rium crest height, along with corresponding transmission, are the main designparameters. Tolerable crest height reductions and maintenance requirementsshould be defined by the designer.
84 Chapter 4 Structural De"gn Guidance

2500 LB. TO 4500 LB.ARMOR STONE 90
6.01 9.0'
BEDMIN. STOICNES (3 OF~Z WOVEN PLASTIC FILITER CLOTH BDIGSOE(-T r
Figure 48. Example of a low-crested breakwater at Anne Arundel County, Maryland(Fulford and Usab 1992)
85Chapter 4 structural Design Guidance

REDUCTION FCTOR - 1/(1.25 - 4.BR)
1.2 sop 0.04_____- sop -0.04. sop - 0.02
-sop 0.01- -- - sop =0.005
a 1.7
I.. g .
.6
-. 5 0 .5 1 1.5 2
RELATIVE CREST HEIGHT Rc/Hs
Rgure 49. Des•ign graph with reduction factor for the stone diameter of a"low-crated atructure as a function of relative crest height andwave steepness (Van der Mew 1991)
CM300 SWL SEASIDE 0- - DAMAGE- --- LANDSIDE
0 Uo20-* INIIA AREA;* ,CL10 ACRTO/1 ~- DAMAGE PROFILEZ/ / /'ý/ ý,"//OC E//PLATFORM
i I I i I I I I I I I I
0 10 20 30 40 50 60 70 80 90 100 110 120
DISTANCE ALONG CHANNEL, CM
Figure 50. Typical reef profile, as built, and after adjustment to severewave conditions (Ahrens 1987)
The analyses on stability of reef breakwaters by Ahrens (1987,1989) andVan der Meew (1990) concentrated on change in crest height due to waveattack. Ahrem defined a number of dimensionless parameters used indescribing behavior of the structure. The main parameter is the crest heightreduction factor h,,/n', which is the ratio of the crest height at the end of thelaboratory test he to the initial crest height he'.
86 Chapter 4 Strutural Design Guidance
Another important parameter defined by Ahrens is the spectral (ormodified) stability number N*_ defined as:
N mLW (31)AD, s
where Hm is the zero-moment wave height of the incident wave spectrum andL is the Airy wavelength calculated using the peak wave period Tp and thelocal water depth h at the toe of the structure.
The reduced crest height of a reef breakwater is estimated by:
h, - VAt/a expV(N*) (32)
where "a" is a coefficient and A, is the structure's cross-sectional area.
Ahrens (1989) gives several equations for the coefficient "am. Van derMeer (1988) tested several structures with crest heights, water depths, bulknumbers, and slope angles different than Ahrens. Van der Meer (1990) re-analyzed the data of Ahrens (1987) and Van der Meer (1988), and derived anew equation for the coefficient 'a.* The resulting equation is similar toAhrens, but valid for a wider range of conditions. The resulting equation forthe coefficient "a" is given by:
"a'= -0.028 + 0.045C' + 0.034 h,'/h - 6x10 9 B.2 (33)
and h, - h' if h, in Equation 32 > h,'.
where
C' = average structure slope "as built" (normal range: 1.5< C'9 3.0)
B = bulk number, At / Dn5o2 (34)
A, =B h' + C' h, 2 (35)
B = crest width (normally taken as 3 median stones wide, 3 D.50)
Crest height reduction of a reef breakwater as shown in Figure 50 can becalculated using Equations 32 and 33. Design curves can also be producedfrom these equations which give the crest height as a function of H, (Fig-ure 51) or even Nhr (Figure 52) for a given water level, structure slope, initialcrest height, and bulk number. Bulk number can be described as theequivalent number of median stones per median stone width in the breakwatercross section. The reefs tested by Ahrens and Van der Meer have relativelyhigh bulk numbers (B. greater than 200) compared to many structures that areactually being built in the United States. Therefore, bulk numbers for a givendesign should be checked against the valid ranges of the above equations toassure accurate results.
87Chapter 4 Strutural D~eign Guidance

EE
E-c
Co ow' 0 9in0
0
C 0 3im ZnU L
0.L Lz-
0VWI U C
00
A go
00
In.4
LLJ m
88jChpe tutra einGiac

REEF BREAKWATER MODEL1.2
1.1 Related Parameters Input
Dn50 = .420 m W50 = 200 kgS1 Bn = 181.4 Pa = 2700 kg/m3
C = = 2.0 P = 1025 kg/m3hc = 4 m
9 h = 5mW At -32m 2
( .8
.5
.4
0 3 6 9 12 15 18
SPECTRAL STABILITY NUMBER Ns,
Figure 52. Design graph of reef type breakwater using the spectral stability number N,(Van der Meer 1990)
Performance Characteristics
Low-crested rubble-mound breakwaters offer an attractive alternative to theprotection of shorelines against direct wave attack. It is important, bothfunctionally and structurally, to assess the effectiveness of a given breakwaterdesign by predicting the amount of wave energy transmitted, reflected, anddissipated by the structure. Such performance characteristics involve anumber of complex processes. Some incident wave energy may be reflectedby the structure, some wave energy may be dissipated by turbulent interactionwith the armor layer, some wave energy may be dissipated internally withinthe core of the permeable structure, and some may be transmitted through orover the structure resulting in wave action in the lee of the structure.Important factors identifiable in the process include incident wave conditionsand the structure's shape, material composition, and degree of emergence orsubmergence. Figure 53 shows some of the key parameters involved indetermining a breakwater's performance characteristics.
89Chapter 4 Structural Design Guidance

H~-~ Kto
RuHi Ht
h ~ Permeable Ktt
Figure 53. Terminology involved in performance characteristics of iow-crested breakwaters
Transmission
Transmission of wave energy beyond rubble structures has been studied bymany researchers covering a wide variety of structures and resulting innumerous methodologies and equations useful in predicting the characteristicsof transmitted waves. The majority of breakwaters used for shorelinestabilization consist of low-crested permeable structures which have waveenergy transmitted both through and over the structure. Three methods orprocedures applicable to such structures are presented below to aid thedesigner in determining a transmission coefficient K, to be used in functionaldesign. Each method was developed for a different range of structural andincident wave conditions. The designer must determine which method is mostapplicable.
The transmission coefficient K, is generally defined as the ratio of thetransmitted wave height to the incident wave height.
H, (36)
H,where
Ht = transmitted wave heightHi = incident wave height
As stated previously, two types of wave transmission occur with low-crested permeable structures: wave regeneration caused by overtopping of thestructure's crest, and wave energy transmitted through the permeablestructure. Seelig (1980) approached the transmission problem by makingindependent estimates of energy transmitted by each condition and combiningthe two components to obtain the total transmitted energy:
Kt - •/(Ky + (Ksý (37)
90 Chapter 4 Structural Deign Guidance

where
K, - total wave tnsmission coefficientK,, = overtopping trsmission coefficientK,, = through transmiuion coefficient
This method was programmed as one of the modules in the AutomatedCoastal Engineering System (ACES) (Leenknecht, Szuwalski, and Sherlock1993) titled -Wave Transmission Through Permeable Structures. Seelig'sapproach provides a method to estimate wave transmission for a wide range ofstructure types and geometry and for a wide range of wave conditions.
Abrems (1987) developed a method to estimate wave transmission based onabout 200 laboratory tests of reef breakwaters. Irregular wave tests wereperformed on both submerged and nonsubmerged reefs. Ahreas' approach isbased on the use of two formulas which are selected depending on the relativefreeboard (Rl/Hx,) value.
For relatively high reefs, R/H, > 1.0, the dominant mode istransmission through the reef. TIe transmission coefficient is largely afunction of one variable which is the product of wave steepness and the bulknumber.
1.01.+H.A (38)
When the dominant modes of transmission result from wave overtopping orwaves propagating over the crest of a submerged reef (R,/Hm < 1.04), arather complex relation involving several variables is required to prelicttransmission coefficients.
K, ; 1.0+(At"f'= _AtjF Re•• " + .0S| -•---,A (391
1.0 ÷.52 +0055
It should be noted that Ahrens does not use the traditional definition of thetransmission coefficient involving the incident wave height at the toe of thestructure. A transmission coefficient, which is the ratio of the transmittedheight to the height which would be measured at the same location in absenceof the reef, is preferred since it eliminates loss of energy due to wavebreaking which would have occurred if the structure were not present (Ahrensand Cox 1990). It is this type of coefficient predicted using Ahrens' equationswhich may cause them to be slightly higher than traditional coefficients.
Van der Meer (1991) developed a new formula for wave transmission atlow-crested structures. After re-analyzing several data sets involving
91Chapter 4 Structurd Design Guidance

transmission at low-crested breakwaters, including Ahrens (1987) and recenttests by Damnen (1991), Van der Mew assumed that a linear relationshipbetween the transmission coefficient K, and the relative crest height R./D,5o isvalid between minimum and maximum values of Kr Figure 54 shows thebasic graph for wave transmission. The linearly increasing curves arepresented by:
Kt, = a R/D,, + b (40)
with:
a = 0.31 Hi I/DW - 0.24 (41)
Equation 41 is applicable to both conventional and reef breakwaters. Thecoefficient "b" for conventional breakwaters is given by:
b = -5.42 sp + 0.0323 H./Dr - 0.0017 (B/D.)' 8 4 + 0.51 (42)
and for reef breakwaters by:
b = -2.6 sop - 0.05 H,/D,5o + 0.85 (43)
Based on the results of all tests analyzed (Van der Meer 1991), thefollowing minimum and maximum K, values were derived. The minimum andmaximum K, values for conventional breakwaters are 0.075 and 0.75,respectively. For reef-ype breakwaters, the minimum and maximum K,values are 0.15 and 0.60, respectively.
The validity of the wave transmission formula (Equation 40) correspondswith the ranges of wave steepness and relative wave height tested. Theformula is valid for:
I < I/D,o < 6 and 0.01 < sop < 0.05
Both upper boundaries are physical bounds. Values of H1/Do > 6 willcause instability of the structure and values of sP > 0.05 will cause wavebreaking on steepness. The lower boundaries are given for too low waveheights relative to rock diameter and for very low wave steepnesses. Theformula may be applicable outside the range, but the reliability is low.
Reflection
Low-crested rubble-mound breakwaters, because of their high porosity,rough texture, and low profile, typically have low reflection coefficients. Thisis an advantage because it reduces the potential for toe scour, navigationproblems, and erosion at nearby shorelines caused by reflected waves. The
92 Chapter 4 Stfuoturd Design Guidance
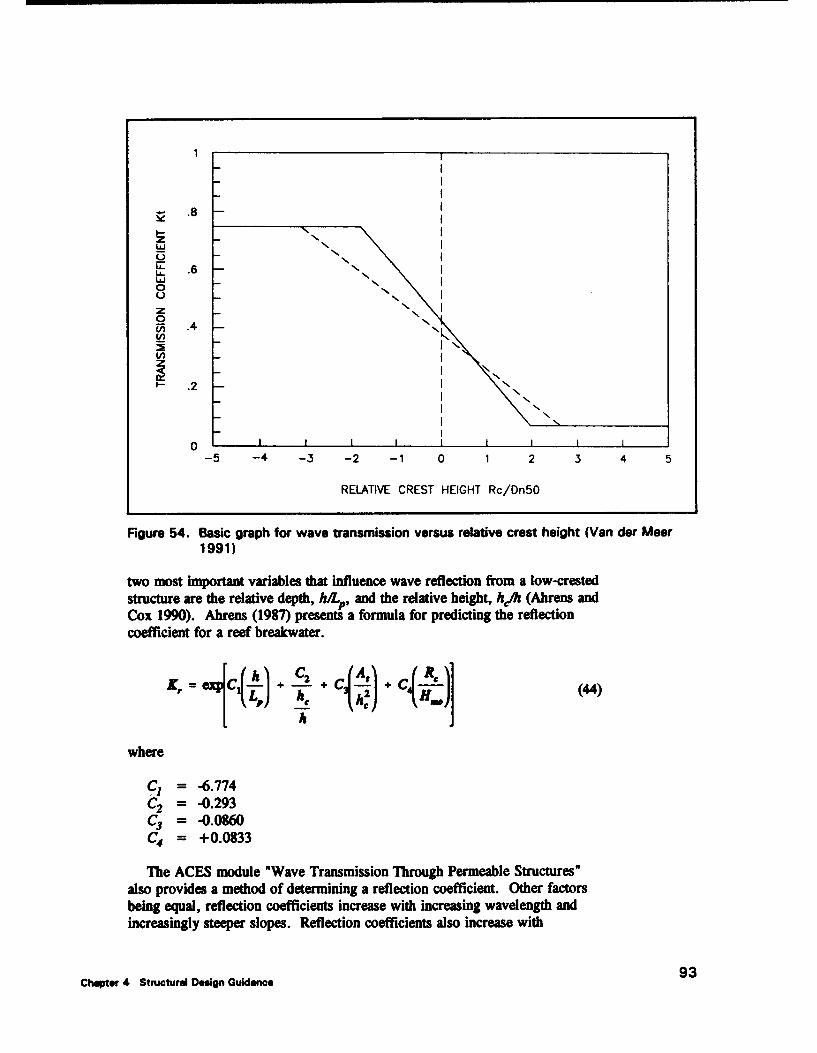
11
.8
L .6 .-.
0
z0FA) .4V)
C,)
S.20 \
-5 -4 -3 -2 -1 0 1 2 3 4 5
RELATIVE CREST HEIGHT Rc/Dn5O
Figure 54. Basic graph for wave transmission versus relative crest height (Van der Moer1991)
two most important variables that influence wave reflection from a low-crestedstructure are the relative depth, UlL., and the relative height, h/h (Ahrens andCox 1990). Ahrens (1987) presents a formula for predicting the reflectioncoefficient for a reef breakwater.
K, = e4 j{I) + h {g C +2s (44)
where
C1, = -6.774C2 = -0.293C3 = -0-08W0
C4 = +0.0833
The ACES module "Wave Transmission Through Permeable Structures"also provides a method of determining a reflection coefficient. Other factorsbeing equal, reflection coefficients increase with increasing wavelength andincreasingly steeper slopes. Reflection coefficients also increase with
rctl Dg G93
Ca Ter e trcuAlE D.mo udle"ance Tasiso hog emaltutrs

increasing relative crest height, h" , and increasing relative freeboard,RA/,., until the crest height reaches the upper limit of wave runup.
Energy duipation
The ability of low and submerged rubble structures to dissipate waveenergy has long been appreciated, but only in recent years has it been possibleto quantify this property. There is not a lot of specific information availableon the wave energy dissipating characteristics of rubble structures, eventhough this is regarded as one of the major advantages over other structuretypes (Ahrens and Cox 1990). The primary reason for this is that energydissipation cannot be directly measured, but must be inferred frommeasurements of wave transmission and wave reflection. The basicconservotion of energy for rubble structures can be written as:
+ + disipation - 1.0 (45)
Ahrens used the prediction equations for transmission and reflectioncoefficients in the energy conservation relation given by Equation 45 todetermine energy dissipation characteristics for given breakwaterconfigurations. Figure 55 was developed by Ahrens (1987) to illustrate thedistribution of wave energy in the vicinity of a reef breakwater. Generally,the greatest energy dissipation was observed for short period waves onstructures with crest heights high enough to be non-overtopped. The lowestenergy dissipation of about 30 percent occurred for reefs with a relative crestheight less than 0.7 (hA < 0.7). For submerged reefs, energy dissipationincreases with increasing steepness H/Li and with increasing relative reefwidth Ar/hL,. Structures with crests near the still-water level will dissipatebetween 35 and 70 percent of incident wave energy, with dissipation beingstrongly dependent on relative reef width. For structures with moderate toheavy overtopping (0 < R,/H, < 1.0), energy dissipation is stronglydependent on relative reef width, but not on wave steepness.
Detailing Structure Cross Section
Coastal structures must be designed to satisfy a number of sometimesconflicting design criteria, including structural stability, functionalperformance, environmental impact, life-cycle costs, and other constraintswhich add challenge to the designer's task (Shore Protection Manual 1984).The requirement to satisfy a number of different design criteria often results inthe designer performing a number of iterative analyses to assure that theselected cross-section provides the desired functional performance andstructural stability at the least cost over the design life of the project.Optimization of rubble-mound breakwaters is discussed in Chapter 5.
94 Chapter 4 Structural Design Guidance
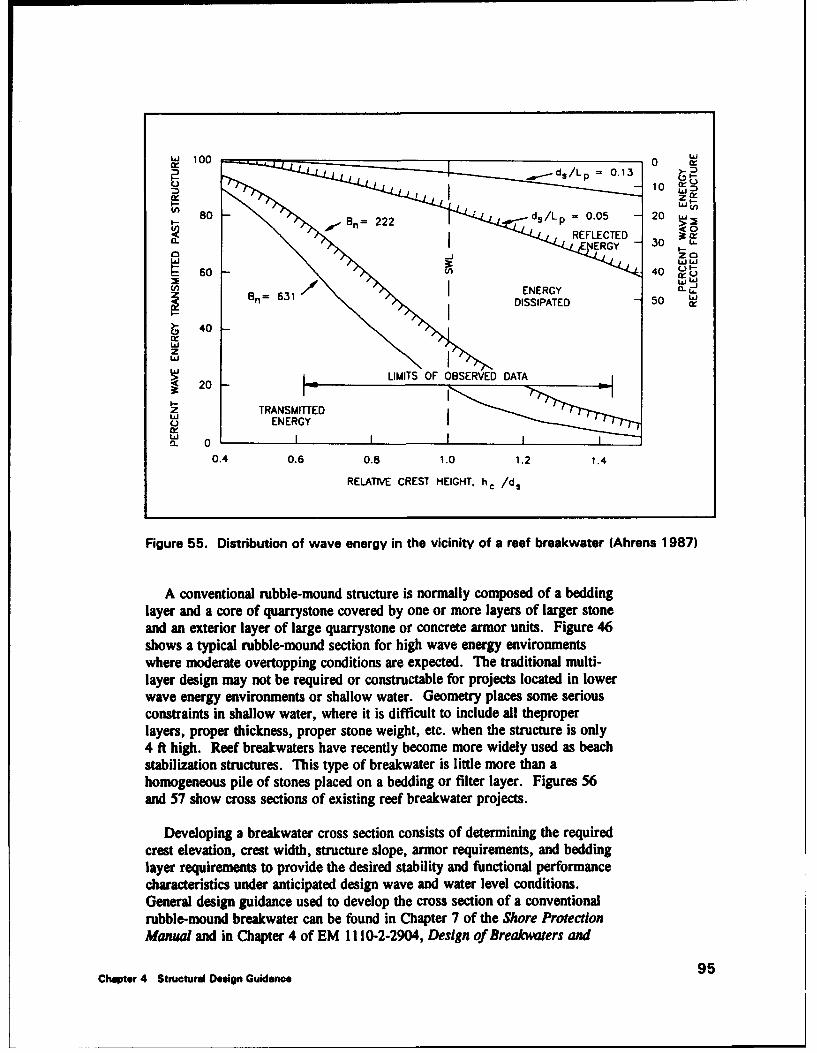
16J 100 0 UiI0O -- ds/Lp= 0.13 D
10
S80 ds/Lp = 0.05 - 20 ,.- -B,= 722 P >0
REFLECTED I W
60 40 n-L-
U_,Bn=631/ IENERGY a.•
SDISSIPATED 50
S40
2 LLIMITS OF OBSERVED DATA( 20
TRANSMITTEDENERGY
IS 0 I0.4 0.6 0.8 1.0 1.2 1.4
RELATIVE CREST HEIGHT. hc /ds
Figure 55. Distribution of wave energy in the vicinity of a reef breakwater (Ahrens 1987)
A conventional rubble-mound structure is normally composed of a beddinglayer and a core of quarrystone covered by one or more layers of larger stoneand an exterior layer of large quarrystone or concrete armor units. Figure 46shows a typical rubble-mound section for high wave energy environmentswhere moderate overtopping conditions are expected. The traditional multi-layer design may not be required or constructable for projects located in lowerwave energy environments or shallow water. Geometry places some seriousconstraints in shallow water, where it is difficult to include all theproperlayers, proper thickness, proper stone weight, etc. when the structure is only4 ft high. Reef breakwaters have recently become more widely used as beachstabilization structures. This type of breakwater is little more than ahomogeneous pile of stones placed on a bedding or filter layer. Figures 56and 57 show cross sections of existing reef breakwater projects.
Developing a breakwater cross section consists of determining the requiredcrest elevation, crest width, structure slope, armor requirements, and beddinglayer requirements to provide the desired stability and functional performancecharacteristics under anticipated design wave and water level conditions.General design guidance used to develop the cross section of a conventionalrubble-mound breakwater can be found in Chapter 7 of the Shore ProtectionManal and in Chapter 4 of EM 1110-2-2904, Design of Breakwaters and
95Chapter 4 Structural Oeelgn Guidance

ARMOR STONE 5'
S1.5
BEDDING STONE0.0 MLW
ELK NECK
Figure 56. Cross section of reef breakwater at Redington Shores at Pinnelas County,Florida (Ahrens and Cox 1990)
3 STONES (1Z)h-1 EL 1.5
1.5 1.51- 2' 1 W 1 i1 7'
EL -4.5 1.5 EL -6.51 fl -- EXISTING BOTTOM I W--.
EL -95 W.25W2 -- '\ 1 EL -9.5
'- FILTER CLOTH
REDINGTON SHORES
Figure 57. Cross section of reef breakwater at Elk Neck State Park, Maryland (Ahrens andCox 1990)
Jetties. The design and construction of low-crested breakwaters, includingreef breakwaters, uses similar procedures to those specified in the abovemanuals, but involves different design guidance for several steps in theprocedure.
Crest height, crest width, and structure slope
Iterative analyses involving the assessment of a range of crest elevations,crest widths, and structure slopes are required to determine the influence ofeach on both stability and functional performance and ultimately develop theoptimum cross section. The crest elevation of a low-crested breakwater is oneof the most critical parameters in the cross sectional design due to theconsiderabie influence of crest elevation on both structural stability andfunctional performance. Small changes in crest elevation can result insignificant changes in stability and wave transmission characteristics. Thecrest width and structure slope also influence stability and performance of thestructure; however, less dramatically than crest elevation. Therefore, theseparameters often follow guidance and ranges used for conventional structures.
96 Chapter 4 Structural Design Guidance

Shore Protection Manual guidance suggests a minimum crest width equalto the combined widths of three armor units. Structure slopes normally rangefrom 1V:1.5H to IV:3H. Selection of crest elevation can be performed usingguidance previously discussed in the "Structural Stability' and "PerformanceCharacteristics' sections. The influence of crest elevation on stability of low-crested breakwaters can be estimated using Figure 49 for statically stable low-crested breakwaters and Equations 32 and 33 for reef breakwaters. A seriesof design curves for reef breakwaters similar to Figures 51 and 52 can bedeveloped to aid in converging on the optimum design. The stability analysiswill yield a relationship between crest elevation and armor unit requirements.The performance characteristics for each cross section can be computed usingmethods previously discussed. Overall analysis of each cross section'sstability, performance characteristics, and costs will result in selection of theoptimum cross section.
Armor gradation
Generally, reef breakwaters have been designed using stone gradationswider than ordinarily used for armor in conventional, multilayeredbreakwaters, as discussed in the Shore Protection Manual (1984). Theadvantages of a wide gradation is that it uses a larger portion of the stoneproduced by a quarry and therefore may be more economical. A widergradation also makes it easier to satisfy the filter criteria that will be discussedin the following section. Gradation is easily represented in terms of medianweight of armor stone W50 determined from stability analyses discussedpreviously. W5o is used to normalize the other percentile weight stones, i.e.,
1 . w, (46)wso
where x indicates the percentile of armor stone less than the given weight.For example, W15 represents the ratio of W15 to W50, where W15 is the stonesize exceeding only 15 percent of all stones in the gradation.
Extensive studies of breakwater and riprap stability conducted in TheNetherlands have produced two well-defined stone gradations (Van der Meerand Pilarczyk 1987), which are referred to as Lhe Dutch wide and the Dutchnarrow gradations. The wide gradation is defined by:
W, = [exp(O.Ol157x - 0.5785)O (47)
and the Dutch narrow gradation is defined by:
W, = [exp(O.OO3192x - 0.1597)J1 (48)
where x is entered as a percent to solve for various values of W. The twoDutch gradations along with the gradation specified in the SPM (Ahrens 1975)
Chapter 4 Structural Design Guidance 97
are presented in Figure 58. The Dutch wide gradation is similar to well-graded riprap and the Dutch narrow gradation is similar to very uniformquarrystone. The two Dutch gradations can be used to provide upper andlower bounds for stone gradations used in low-crested breakwater design.
Boddlng/fltor layer considerations
Usually reef breakwaters are built on a beddingifilter layer. The beddinglayer is designed to prevent excessive settlement of the structure due to armorstone sinking into the underlying sediment. The ratio of median armor stonesize D3o(A) to the median bedding stone size Dj(B) provides a logical way tocharacterize the bedding size. Two methods are available to select the size ofrequired bedding stone. Dutch guidance for revetment filter layers suggeststhat D5o(A)/Do(B) be approximately 4.5 or less (Van der Meer and Pilarczyk1987). Ahrens (1975) suggests that DIs(A)/D9(B) should not be greater than4.0 to ensure that the underlayer is not pulled out through the armor layer bywave action. Considering gradations used by Ahrens, a safe relation formedian stone dimensions would be DSO(A)/D"(B) less than 6.8 (Ahrens andCox 1990).
In low rubble-mound structures without a core, the bedding layer is oftenextended across the entire width of the structure and beyond the toe of thearmor stone as shown in Figure 56. The bedding stone will often be subjectto direct wave attack during low water levels. Bedding stones at the toe of thestructure may not provide the desired stability or toe protection, resulting inadditional stones required along the toe as shown in Figure 55. Stabilityagainst wave attack of exposed bedding stone is discussed in EM 1110-2-2904and detailed guidance on toe protection can be found in the Shore ProtectionManual (1984).
Geotextiles can be used beneath the bedding layer to improve foundationconditions or prevent the loss of sediment through the bedding layer if filtercriteria between the bedding layer and underlying soil are not met. Filtercriteria should be met between both the geotextile and bedding layer and thegeotextile and underlying soil. Geotextiles are discussed in the ShoreProtection Manual and by Moffatt and Nichol, Engineers (1983) and Eckertand Callender (1984), who present detailed requirements for using geotextilefilters beneath quarrystone armor in coastal structures.
Other Construction Types
Most U.S. and foreign nearshore breakwaters built for shore protectionhave been rubble-mound structures. Rubble-mound construction of nearshorebreakwaters is advantageous because of the ability for rubble mounds todissipate wave energy effectively and provide low reflection coefficients. Anextensive amount of research has been conducted for rubble-mound structures,
98 Chapter 4 Structural Design Guidance

2.0 I
1.8 DUTCH WIDEGRADATION
1.6
1.4
DUTCH NARROW59 GRADATION
.... 1.2xa
C3
S 1,0 -Ul.-Jz
O 0.9 - EM GRADATIONzLaJ
0.8
0.7
0.6 0.6 • =''•'•''"EM GRADATIO N
0.5 1 1 1 1 1 10% 50% 100%
PERCENT LESS THAN BY WEIGHT
Figure 58. Armor-stone characteristics of Dutch wide gradation, Dutch narrow gradation,and Ahrens (1975) SPM gradation
which provides the designer with confidence in determining the structuralstability and resulting performance characteristics of a given structure.
There are numerous proprietary beach erosion control or stabilizationsystems that function similarly to breakwaters, but are of unique geometry orconstruction. Most of these systems are precast concrete units, concreteblocks, or flexible structures such as large sand-filled bags placed in variousconfigurations nearshore or in shallow water. Most have undergone limitedlaboratory testing and many have never been field tested. Generally, these
Chapter 4 Structurul Design Guidance 99

alternative products are designed to function similar to a breakwater. Somehave had limited success, and some have not. Some may be applicable in oneregion and are not valid in another region. However, proponents of variousalternative schemes can make unsubstantiated claims of product success. Anengineering assessment of the product relative to a specific site is critical priorto its purchase and use.
Some of the structures were evaluated under the Shoreline Erosion ControlDemonstration Act, and their performance has been summarized by the Chiefof Engineers in his report to Congress (Dunham 1982). All field testsconducted under this program were in sheltered waters and not on the exposedocean coast. Experience with beach stabilization systems on the open coast islimited, with many cases being selectively reported according to their limitedsuccess.
Evaluations of alternative beach stabilization structures should be based ontheir functional performance, economics relative to traditional types ofbreakwater construction, aesthetics, and ability to be removed or modified ifthey do not function as expected or become aesthetically unacceptable (EM1110-2-1617). The economics and aesthetics of alternative systems oftenmake such systems favorable; however, the lack of laboratory or prototypeexperience with many alternative structures means limited data are available tohelp determine the structure's stability and performance characteristics undergiven design conditions.
Stability of alternative structures is typically not as great a concern as theperformance characteristics provided by the structure. Such structures arenormally placed in low to moderate wave energy environments where waveloadings are not very severe and structures can often be overdesigned toprovide greater stability for a relatively low increase in cost. However, theuncertainty of performance characteristics and their resulting effect on theexpected shoreline planform is critical when evaluating alternative structures.Wave transmission characteristics for any structure are critical in determiningresulting shoreline configuration as discussed in Chapter 2. Reflectioncharaterisics must be considered for potential scour and navigation problems.Highly reflective near-vertical-faced structures such as sheet-pile breakwatersshould be avoided, since extensive toe-protection will be required to avoidscour. Also, such structures pose threats to navigation and nearby shorelinesdue to increased wave activity.
Conservation of energy principles can be applied to initially evaluate thesuitability of any structure in terms of functional performance. The basicprinciple states that all incident wave energy can be accounted for by thesummation of energy transmitted, reflected, and dissipated within thestructure. For example, a high non-overtopped steel sheet-pile wall canprevent the majority of incident wave energy from being transmitted. Sinceenergy dissipation of the structure is expected to be minimal, the majority ofincident energy will be reflected and may potentially cause scour. If theobjective is to provide low wave energy transmission and minimal reflective
100 Chapter 4 Structural Deulgn Guidance

conditions that will not interfere with navigation, then the selected structurewill be required to dissipate substantial energy on or within the structure as dolow-crested permeable rubble-mound structures. Such considerations can aidin initial evaluation of alternative structures, but physical model studies maybe required for large-scale projects or to determine the performancecharacteristics of a given structure cross section under selected design waveand water level conditions.
Chapter 4 Stmturd Deagn Guidrnce 101

5 Other Design Issues
Envlronmental Concems
Coastal projects may benefit one or more components of the ecologicalsystem while adversely impacting others. As in most projects, an evaluationof the environmental impact of a project must be conducted. From prototypeexperience, detached breakwaters are generally known to have minimalimpacts on the environment, although each proposed breakwater site is uniqueand must be examined relative to potential negative impacts to the ecologicalsystem. An example ecological analysis and Environmental Impact Statementcan be found in USAED, Buffalo (1980).
Water quality and aquatic habitat concems
Potential water quality degradation due to reduced circulation has been anenvironmental concern associated with detached breakwater projects, and hasbeen a notable problem in some foreign projects. Some water qualityproblems may occur during construction due to increased turbidity and thepresence of construction equipment; however, these effects generally do notpose significant risk to most biological resources in naturally turbid estuarineor coastal waters. If breakwater construction occurs in a clear waterenvironment such as in the vicinity of coral reefs or seagrass beds, precautionsshould be taken to minimize the amount of suspended sediments (EM 1110-2-1204). Long-term effects of the structure may involve indirect impacts onwater quality due to changes in the hydrodynamic regime. If proper waterexchange does not occur over, through, or around the structures, water can betrapped in the lee and become stagnant and po!tuted. Water quality shouldespecially be a concern in areas with poor pre-project water quality or limitedwater level fluctuations. Increased wave transmission and/or waveovertopping, and more numerous gaps with increased widths can improvewater circulation and avert water quality problems.
Over the long term, some aquatic habitat will be lost due to breakwaterconstruction, but rock structures are known to increase the habitat for somemarine species and may actually provide greater diversity and productivitythan pre-project conditions. The trade-off associated with replacing soft
102 chapter 5 Other Design Issues

bottom habitat with hard or rubble-mound bottom habitat has generally beenviewed as a beneficial impact. Structural design should seek to optimize theyield of suitable habitat for biological resources. An investigation ofenvironmental impacts should also consider that some marine species may beaffected as a result of dredging and beach nourishment activities. Detailedinformation on concerns relative to the environmental effects of dredging andmaterial placement can be found in EM 1110-2-5026. Additional informationon water quality considerations can be found in EM 1110-2-1204.
Terrestrial resources
Terrestrial resources include both cultural resources and natural resourcesand wildlife. An archeological investigation should be conducted if theproposed project is near a historical site, such as a lighthouse, which shouldbe protected. Impacts may occur to wildlife populations and their habitatduring breakwater construction. Although these effects will most likely betemporary, project activities should be scheduled so as to minimizedisturbances to the wildlife. As with aquatic habitats, the placement of beachfill must be investigated for effects on natural resources and wildlife.
Recreation
T1he impacts of a breakwater project on recreation depend on typical use ofthe project area. Breakwaters reduce wave energy and cause a widening ofthe beach, which is beneficial for swimming, diving, and other recreationalbeach use activities. Breakwaters do, however, reduce opportunities for bodyor board surfing, which may receive some local opposition. Increasing gapwidths may provide additional area for surfing activities. Detachedbreakwaters can provide a hazard to beach users who may climb on thestructures or swim too close to them. Tombolo formation will invite suchactivities since access to the structure is relatively easy. If navigation andwater access through the project area is a requirement, gaps must be includedin the design. Breakwaters, especially low-crested structures, should bemarked with navigation aids if they pose potential hazards to navigation.
Aesthetcs
If the breakwater project is located in a recreational area, local complaintsof undesirable aesthetics may occur and may need to be considered as part ofthe design. Low-crested breakwaters allow more visibility of the water andmay be an alternative, although wave overtopping of the structure will beincreased. Increased overtopping can be compensated for by decreasingstructural permeability, increasing structure length, and/or reducing gapwidth.
Chapter 5 Other Design Issues 103
EstMaihment of wedhmnds
The use of detached breakwaters to create and/or stabilize wetlands hasbeen discussed previously in this report. This is a relatively new concept,which has only limited prototype applications thus far. Environmentalconcerns in wetland areas encompass a wide range of issues relative to thespecific site. Proper stabilization techniques must be implemented for marshgrass plantings when wetland development is the objective. Detailedinformation on environmental issues and wetland development can be found inEM 1110-2-5026; EM 1110-2-1204; Landin, Webb, and Knutson (1989); andKnutson, Allen, and Webb (1990).
EVo data and project monitoring
Each project is site-specific and environmental investigations should bedesigned to meet the requirements of the project area. Baseline environmentaldata should be collected for a.significant time period to identify potentialimpacts that must be considered during project design. The baseline studyshould identify plant and wildlife species indigenous to the project area,determine the existence and location of endangered species, and identify anyother potentially detrimental environmental impacts. A post-constructionmonitoring program, including water quality monitoring, should be consideredto evaluate and document the project's influence on the environment.Additional guidance can be found in EM 1110-2-1204.
Importance of Beach Fill in Project Design
Detached breakwaters function by redistributing available sand from thelittoral environment; they do not provide or create the sediment necessary tomaintain a wide protective beach. Consequently, unless additional sand isbrought into the system, accretion which occurs in the breakwater's lee willgenerally be balanced by erosion in adjacent areas. It is stronglyrecommended that beach fill be included as an element of all breakwaterprojects to provide an additional source of sediment for planform developmentand mitigate downdrift effects. Beach fill is especially important in sediment-starved areas where material may not be available to adequately form a beachplanform. In these areas, beach response may be only limited (such as in EastHarbor State Park, Ohio; Figure 10) or salients may develop very slowly.Depending on the economics of a specific project, a beach fill combined witha breakwater may be the most cost-effective solution to a shorelinestabilization problem.
104 Chapter 5 Other Design Issues

Optimization of Design and Costs
One of the reasons that detached breakwaters have seen limited use in theUnited States is their relatively high cost of construction. Federal publicworks agencies in the United States have the constraint for projectauthorization that the benefits realized by a proposed plan must exceed all life-cycle costs (Smith 1986). This has been further defined to apply toincremental benefits and costs of each major component of a proposed project;therefore, it is critical that a breakwater be designed to provide the optimumratio between incremental benefits and life-cycle costs. Benefits achievedthrough a public works project are the sum of the incremental decrease in thatlevel of costs directly attributable to the project's functional performance. Forfederal participation in a project to be possible, maximum net benefits mustexceed the project costs. Figure 59 shows this benefit-cost comparison.Generally, the design level associated with the maximum net benefits isselected for project design.
ACTUAL BENEFITS
D-5ofz
Sit ( 6
0
-J
DESIGN LEVEL
Figure 59. Benefits and cost versus design level (from EM 1110-2-2904)
Smith (1986) presents guidance on the optimization of rubble-moundbreakwaters and provides a step-by-step procedure to identify an optimumbreakwater cross section in terms of two criteria: structural integrity andfunctional performance. Functional performance is described as thestructure's effectiveness as a wave barrier, and for detached breakwaters, theability to develop and maintain the desired beach planform. Structural
Chapter 5 Other Design Issues 105

integrity is defined as the structure's ability to survive an extreme stormwithout substantial damage and the rate it sustains damage from storms moreextreme than the design event. Additional guidance on design optimization isprovided in EM 1110-2-2904.
Since a project constructed by the USACE can no longer be justified basedon recreational benefits alone, the benefit-cost ratio for a breakwater projecthas become even more difficult to defend. However, with increased use ofbeach nourishment as a method of shoreline erosion control, use of shorelinestabilization structures such as detached breakwaters can be justified to protectand retain the fill. Detached breakwaters can substantially increase theamount of time for which beach nourishment remains on the beach. If thesavings realized by reducing the time required between renourishmentsexceeds the cost of the structures, their construction can be justified and thebeach fill design optimized. For example, if the renourishment period of abeach fill project is increased from 3 to 6 years, the amortized savingsaccruing from less frequent nourishment is then available to build stabilizationstructures (EM 1110-2-1617). During the plan formulation stage of a beachfill project, alternative plans should be evaluated to determine if the use ofbreakwaters and the reduction of nourishment requirements is more cost-effective than the beach fill project without structures.
With new emphasis on wetlands and environmental concerns in theUSACE, the creation and restoration of wetland areas can also justify the useof detached breakwaters. Although limited prototype applications exist at thistime, ongoing research is being conducted at WES to further develop thisconcept. The use of relatively inexpensive low-crested breakwaters appears tobe a viable method to protect and stabilize a wetland area. This applicationmay also be justified on the basis of beneficial uses of dredged materialrelated to a dredging operation. Dredged material can be placed behind abreakwater and planted with marsh grass to establish wetland areas, creatingproject benefits. The cost of this type of nearshore placement may beconsiderably less than other dredged material disposal options, which will alsoincrease the benefit-cost ratio.
Several structural design alternatives are available to optimize the crosssection, and, subsequently, the costs of a breakwater project. Smith (1986)presents some of the structural parameters which should be considered whendetermining the structural design of the breakwater. Depending on the lengthof shoreline to be protected, construction of multiple segments reducesconstruction costs since less material is required than for a single continuousbreakwater. Low-crested reef-type breakwaters can also be more cost-effective since less material is required to develop the crest elevation.Additionally, low-crested and reef-type breakwaters use a homogeneous stonesize instead of the traditional multilayer construction, and therefore requireless accuracy in stone placement during construction.
106 Chapter 5 Other Design Issues
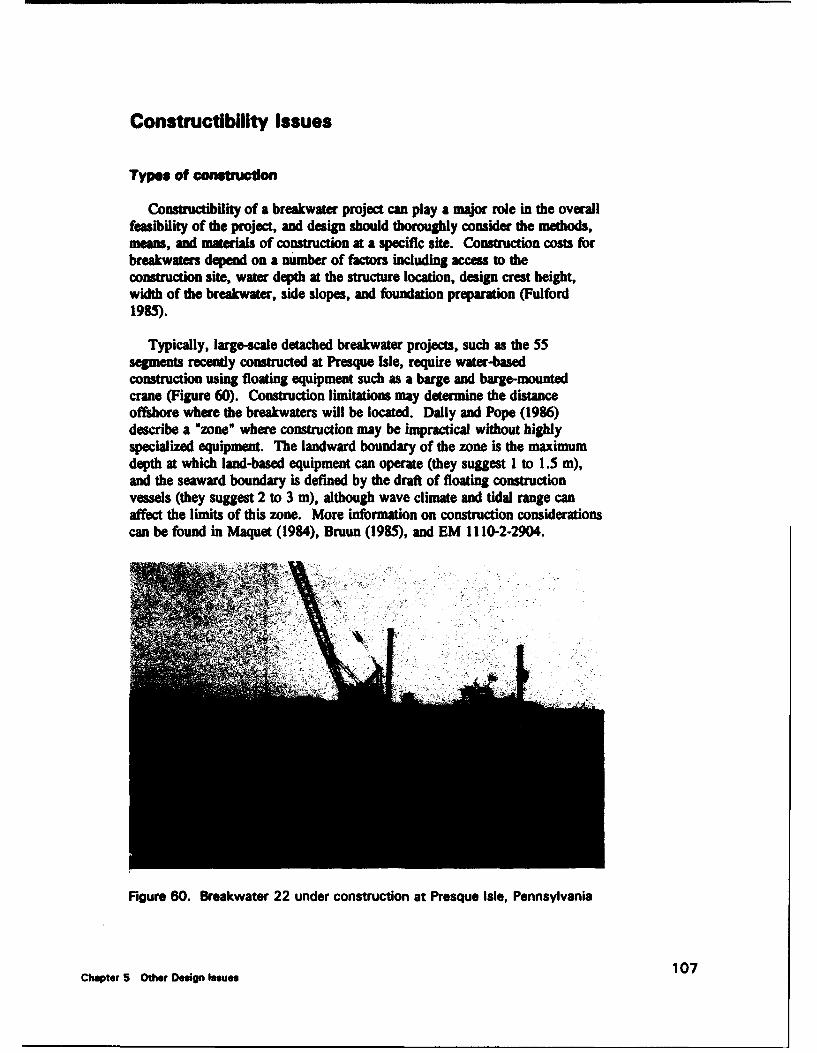
Constructibility Issues
Types of cons9tuction
Constructibility of a breakwater project can play a major role in the overallfeasibility of the project, and design should thoroughly consider the methods,means, and materials of construction at a specific site. Construction costs forbreakwaters depend on a number of factors including access to theconstruction site, water depth at the structure location, design crest height,width of the breakwater, side slopes, and foundation preparation (Fulford1985).
Typically, large-scale detached breakwater projects, such as the 55segments recently constructed at Presque Isle, require water-basedconstruction using floating equipment such as a barge and barge-mountedcrane (Figure 60). Construction limitations may determine the distanceoffshore where the breakwaters will be located. Dally and Pope (1986)describe a Ozone" where construction may be impractical without highlyspecialized equipment. The landward boundary of the zone is the maximumdepth at which land-based equipment can operate (they suggest 1 to 1.5 m),and the seaward boundary is defined by the draft of floating constructionvessels (they suggest 2 to 3 m), although wave climate and tidal range canaffect the limits of this zone. More information on construction considerationscan be found in Maquet (1984), Bruun (1985), and EM 1110-2-2904.
Figure 60. Breakwater 22 under construction at Presque Isle, Pennsylvania
Chapter 5 Other Design Issues 107

Smaller breakwaters, such as low-crested structures with relatively smallstone weights, can be constructed through the us, of land-based equipmentand techniques. This is generally accomplished by placing fill material tocreate a sand access road out to the construction area, trucking in armorstone, and placing stone with machinery such as a backhoe to construct thebreakwaters (Figure 61). After breakwater completion, the access roadsshould be removed and the fill material redistributed within the project area,to prevent tombolo effects. For some areas, such as the Chesapeake Bayregion, land-based operations can be substantially more cost-efficient forbreakwater construction (Coleman 1992).
As a general rule, construction of a segmented project should begin withthe farthest downdrift breakwater and proceed updrift. This will promote amore uniform accretion of the shoreline and reduce construction-inducederosion. However, other construction schemes may prove more efficientdepending on the site and dredging operations. At Presque Isle, PA,Breakwaters 17 to 19 were constructed first to provide a sheltered area for thecontractor, thus reducing equipment travel distance (Mohr and Ippolito 1991).
Figure 61. Land-based construction at Eastern Neck, Chesapeake Bay,Maryland
Construc•ion records
Daily logs of construction activities should be maintained by a Corps ofEngineers inspector, especially denoting any problems or unique constructiontechniques encountered during construction. A photographic history ofconstructi"n should be documented and as-built construction recordsdeveloped.
108 Chapter 5 Other Design Issues

Inspections
Following construction, periodic inspections of the project should beconducted. Inspections should focus on structural deterioration that affects thefunctionality of the breakwater. Repairs should be made in a timely mannerto prevent furthe unravelling of the structure. Inspections should alsoidentify potentially hazardous conditions to public safety that may havedeveloped as a result of the structure.
Operations and maintenance manual for local sponsors
EM 1110-2-1617 provides a description of the requirements and guidancefor post-construction activities for a shore protection project. Specificperformance requirements and guidance for accomplishing the satisfactorymaintenance and operation of shore protection works, including coastalstructures and beach fill projects, are provided in Engineer Regulation 1110-2-2902. This regulation prescribes operations, maintenance, inspection, andrecord-keeping procedures required to obtain the intended purposes of shoreprotection projects.
Post-Construction Monitoring
A post-construction monitoring program to evaluate the functional andstructural performance of a detached breakwater project is recommended anddescribed in EM 1110-2-1617. Project monitoring will assist in both thespecific project's performance and with developing guidance and methodologyfor future projects. A monitoring program will allow the identification ofspecific deficiencies in the performance of a project for which modificationsmay be made to better meet the project's objectives, and establish if a givenstructure has sustained damage that may affect its functional capacity. Thecoastal zone is a complex area; frequent storms can occur and coastalprocesses can fluctuate over time. From the research standpoint, monitoringof prototype projects, whether successful or not, will provide the datadesperately needed to improve design guidance.
A monitoring program should be designed based on the site-specificproject. The program must consider not only data collection, but analysismethods and associated costs once the data are obtained. There are severaltypes of basic data that are often included in a monitoring program (EM 1110-2-1617).
Chapter 5 Other Design Issues 109

Photographic documentation
Photography can provide both qualitative and quantitative information on abreakwater's performance. Controlled, vertical aerial photography canprovide quantitative data on ground elevation, shoreline and berm location,offshore shoals, structure geometry, structural deterioration, and beach usechanges. Typical aerial photographs for coastal project monitoring are takenat a scale of 1:4800 (1 in. = 400 ft), with a 60-percent overlap forstereographic analysis. Larger scale photography is usually used to examinechanges in the elevation of structural components, such as armor units,between successive flights. For structural monitoring, it is important to obtainphotography immediately after construction in order to provide a basecondition for comparison. The frequency of aerial flights depends on theobjectives of the monitoring program. Detailed project monitoring mayrequire quarterly flights, whereas routine inspections may only need annualphotography. A more inexpensive, but strictly qualitative method is to obtainperiodic ground-level photography to document changes over time in aparticular location.
Beach profiles and bathymetric data
Periodic beach profiles can be used to document the accretion, erosion, orstability of the project's shoreline. Beach profile data can assist with bothroutine evaluation of the project and documentation of storm damages ordamages prevented as a result of the project. As with photography, thefrequency of profiles depends on the objectives of the monitoring program.Beach changes can occur rapidly after initial construction and may be requiredmore frequently. It is recommended that at least quarterly profiles beconducted to document beach planform development prior to reachingequilibrium. If bathymetric changes due to project construction or seasonaloffshore profile changes are required, profile lines will have to extendoffshore beyond wading depth. Subaqueous surveys can significantly increasethe cost of the monitoring. Additionally, it is important to ensure that foreach profile line, the beach and bathymetric data meet and are not verticallyoffset; otherwise, significant error can be introduced into the analysis.
Spacing of the beach profile lines also depends on the monitoringobjectives. General shoreline trends can be documented with distantly spacedprofiles, whereas volumetric analysis of erosion and/or accretion requiresmore closely spaced lines. EM 1110-2-1617 recommends at least three profilelines in the lee of a detached breakwater depending on the structure's length,distance offshore, and other parameters (Figure 62).
110 Chapter 5 Other Design Issues

a
S1 a al
.- S.3
d% At S FA
I IRAfE
J 6ft:
211
Chapter SAEM Othe Designissue

Wave condictom
Waves and longshore currents are the driving forces behind beachplanform development. Some detailed research monitoring programs may
want to examine the cause-and-effect relationships between waves, sedimenttransport, and a project's functional performance. Data can be obtained at the
site using a wave gauge system designed to meet the specific objectives of the
study. Generally, wave direction is important when examining fimctionalperformance of a project.
Wave data are sometimes collected to evaluate the structural performanceof a rubble-mound breakwater. Larger wave heights associated with stormsare of primary interest; wave direction is usually of secondary importance.
112 Chapter 5 Other Design Issues

6 Summary and Conclusions
Report Summary
From prototype experiences, detached breakwaters have proven to be aviable method of shoreline stabilization in the United States. Breakwaters canbe designed to retard erosion of an existing beach, promote sedimentation atthe lee of the structure to form a new beach, retain placed beach fill materialand reduce renourishment intervals, and/or maintain a wide beach for damagereduction and recreation. Low-crested breakwaters can also be combined withdredge material disposal and marsh grass plantings to establish wetlands andcontrol erosion along estuarine shorelines. Most recent prototype applicationsof detached breakwaters have been along sediment-starved shorelines with lowto moderate wave energy such as in the Chesapeake Bay, Great Lakes, andsome areas of the Gulf Coast.
This report summarizes and presents design knowledge for both thefunctional and structural design of detached breakwaters for shorelinestabilization. Functional design of breakwaters in the United States relies on asignificant amount of engineering judgement, data from a few existingbreakwater projects for comparison, and an understanding of basic coastalprocesses. Thc eioin process is an iterative one. Design guidance used topredict beach res:onse to breakwaters is also presented in Dally and Pope(1986), Pope and Dean (1986), Rosati (1990), and Engineer Manual 1110-2-1617. Guidance on the use of low-crested rubble-mound breakwaters forwetland development purposes is limited, and has been mostly based onexperience from a few prototype sites. Ongoing research at WES under theWetlands Research Program is further investigating and evaluating the use ofbreakwaters for these purposes.
Functional design techniques and evaluation tools for detached breakwaterscan be classified into three categories: empirical relationships, physical andnumerical models, and prototype assessment. A three-phase design process issuggested using these tools. First, a desktop study should be conductedemploying various empirical relationships to relate proposed structural and siteparameters to shoreline response and identify design alternatives. Second, aphysical or numerical model study can be used to evaluate beach response tothe breakwater project, and to assess and refine alternatives. Finally, if
Chapter 6 Summary and Conclusions 113

feasible, a prototype test can be conducted to verify and adjust the preliminarydesign.
Structural design guidance for detached breakwaters involves assessment ofstucural stability and anticipated perform characteristics for critical andaverage wave and water level conditions. Ite use of low-crested breakwatersfor beach and wetland stabilization projects has increased since they can bemore cost-effective than conventional multilayered navigation breakwaters.Recent guidance to assess structural stability and performance charateristlicsof low-crested breakwaters is presented in this report.
Additional Research Needs
Continued research relative to detached breakwaters should exploreimproved techniques to predict beach response and methods to optimizebreakwater design. Primary reasons for the limited use of detachedbreakwaters in the United States are the lack of functional design guidance andhigh construction costs. Further development of comprehensive criteria isneeded for breakwater design in the feasibility, continuing authority, andreconnaissance phases. Current techniques to predict shoreline response anddowndrift impacts as a function of structural and site parameters can beinsufficient, costly, time-consuming, and not readily available to the designer.Continuing efforts at CERC are completing the development of functionaldesign criteria, in the form of nomographs, based on site and structuralparameters (Rosati, Gravens, and Chasten 1992). Additional research is alsoneeded in predicting wave transmission characteristics of detached breakwatersand the resulting influence of transmitted wave energy on beach planform andwetland development. Continued research addressing breakwaters as beachfill stabilization and wetland development structures would be beneficial.Increased benefits from the use of breakwaters in these manners may helpjustify their costs of construction and encourage breakwater applications inmore areas of the United States.
114 Chapter 6 Summary and Conclusions

References
Ahrens, J. P. (1975). "Large wave tank tests of riprap stability," CERCTM-51, U.S. Army Engineer Waterways Experiment Station, Vicksburg,MS.
-. (1984). "Reef type breakwaters." Proceedings, 19th InternationalCoq1rence on Coastal Engineering, American Society of Civil Engineers,Housto, TX.
__. (1987). "Characteristics of reef breakwaters," Technical Report 87-17, U.S. Army Engineer Waterways Experiment Station, Vicksburg, MS.
__ . (1989). "Stability of reef breakwaters," Journal of Waterway, Port,Coastal and Ocean Engineering, American Society of Civil Engineering,221-234.
Ahrens, J. P., and Cox, J. (1990). "Design and performance of reefbreakwaters," Journal of Coastal Research 61-75.
Bender, T. (1992). "An overview of offshore/headland breakwater projectsconstructed by the Buffalo District." Proceedings, Coastal EngineeringPractice '2. American Society of Civil Engineers, Long Beach, CA.
Berenguer, J., and Enriquez, J. (1988). "Design of pocket beaches: TheSpanish case." Proceedings, 21st International Conference on CoastalEngineering. Malaga, Spain, 1411-25.
Bishop, C. T. (1982). "A review of shore protection by headland control,"No. 352, Environment Canada, Burlington, Ontario.
Bottin, R. R., Jr. (1982). "Lakeview Park beach erosion study, Ohio,"Letter Report, U.S. Army Engineer Waterways Experiment Station,Coastal Engineering Research Center, Vicksburg, MS.
Bottin, R. R., Jr., and Chatham, C. E., Jr. (1975). "Design for waveprotection, flood control, and prevention of shoaling, Cattaraugus CreekHarbor, New York; hydraulic model investigation," Technical Report
Refererwe 115
H-75-18, U.S. Army Engineer Waterways Experimen Station,Vicksburg, MS.
Bruun, P., ed. (1905). Design and constrwuton of moundsjbr breakwatersand coastal proectlon. Elsevier Scientific Publishing Co., Amsterdam.
Carver, R. D., and Wright, B. J. (1992). *Use of site specific data forgeneral breakwater design,- Technical Report CERC-92-2, U.S. ArmyEngineer Waterways Experiment Station, Vicksburg, MS.
Chew, S. Y., Wong, P. P., and Chin, K. K. (1974). 'Beach developmentbetwee. headland breakwaters. P oceedings, 14th InternationalConfrence on Coastd Engineering. Copenhagen, Denmark.
Chu, Y., and Martin, T. (1992). -Beach response to the Redington Shores,Florida breakwater,' Miscellaneous Paper CERC 92-8, U.S. ArmyEngineer Waterways Experiment Station, Vicksburg, MS.
Cialone, M. A., Mark, D. J., Chou, L. W., Leenknecht, D. A., Davis, J. E.,Lillycrop, L. S., and Jensen, R. E. (1992). 'Coastal Modeling System(CMS) user's manual,' Instruction Report CERC-91-1, U.S. ArmyEngineer Waterways Experiment Station, Coastal Engineering ResearchCenter, Vicksburg, MS.
Coastal Engineering Research Center. (1984). 'Empirical methods for thefunctional design of detached breakwaters for shoreline stabilization,-CETN-mi-43, U.S. Army Engineer Waterways Experiment Station,Vicksburg, MS.
Coleman, W. E., Jr. (1992). "Chesapeake Bay field modeling andmonitoring projects.' Proceedings, Coastal Engineering Practice '92.American Society of Civil Engineers, Long Beach, CA.
Curren, C. R., and Chatham, C. E., Jr. (1977). "Imperial Beach,California, design of structures for beach erosion control,' TechnicalReport H-77-15, U.S. Army Engineer Waterways Experiment Station,Vicksburg, MS.
-. (1980). "Oceanside Harbor and Beach, California design ofstructures for harbor improvement and beach erosion control," TechnicalReport H-80-10, U.S. Army Engineer Waterways Experiment Station,Vicksburg, MS.
Daemen, I. F. R. (1991). 'Wave transmission at low-crested breakwaters,"M.S. thesis, Delft University of Technology, Faculty of Civil Engineering,Delft.
Daily, W. R., and Pope, J. (1986). "Detached breakwaters for shoreprotection,' Technical Report CERC-86-1, U.S. Army EngineerWaterways Experiment Station, Vicksburg, MS.
116 gflgwgng

Dunham, J. W. (1982). 'Chief of Engineers' final report to Congress on theShoreline Erosion Control Demonstration Act," U.S. Army Corps ofEngineers, Office of the Chief of Engineers, Washington, D.C.
Ebersole, B. A. (1982). *Atlantic coast water level climates,* WIS Report 7,U.S. Army Engineer Waterways Experiment Station, Vicksburg, MS.
Eckert, J. W., and Callender, G. (1987). "Geotechnical engineering in thecoastal zone," Instruction Report CERC-87-1, U.S. Army EngineerWaterways Experiment Station, Vicksburg, MS.
Fulford, E. T. (1985). "Reef type breakwaters for shoreline stabilization.Proceedings, Coastal Zone '85. American Society of Civil Engineers.
Fulford, E. T., and Usab, K. M. (1992). "Bay Ridge, Ann Arundel County,Maryland, offshore breakwater and beach fill design." Proceedings,Coastal Engineering Practice '92. American Society of Civil Engineers,Long Beach, CA.
Goldsmith, V. (1990). "Engineering performance of detached breakwatersalong the coast of Israel," draft report prepared for the U.S. ArmyEngineer Waterways Experiment Station, Coastal Engineering ResearchCenter, Hunter College, New York.
Gourlay, M. R. (1981). "Beach processes in the vicinity of offshorebreakwaters." Proceedings, Fifth Australian Conference on Coastal andOcean Engineering, Perth, Australia, 129-34.
Gravens, M. B. (1990). "Computer program: GENESIS Version 2.0," CoastalEngineering Technical Note, CETN-H-21, U.S. Army Engineer WaterwaysExperiment Station, Coastal Engineering Research Center, Vicksburg, MS.
_. (1991). "Development of an input data set for shoreline changemodeling." Proceedings, Coastal Sediments '91. American Society of CivilEngineers, 1800-13.
_ . (1992). "User's guide to the shoreline modeling system,"Instruction Report CERC-92-1, U.S. Army Engineer WaterwaysExperiment Station, Coastal Engineering Research Center, Vicksburg, MS.
Gravens, M. B., and Scott, S. (1993). "Analysis of wave data for use insediment transport calculations." Proceedings, 6th Annual BeachPreservation Technology. Florida Shore and Beach PreservationAssociation.
Gravens, M. B., Kraus, N. C., and Hanson, H. (1991). "GENESIS:Generalized model for simulating shoreline change; Report 2, workbookand system user's manual," Technical Report CERC-89-19, U.S. Army
117References

Engineer Waterways Experiment Station, Coastal Engineeing ResearchCenter, Vicksburg, MS.
Hallermeer, R. J. (1983). "Sand transport limits in coastal structuredesign."- Proceedings, Coastal Structures '8. March 9-11, Arlington,Virginia, American Society of Civil Engineers, 703-16.
Hanson, H., and Kraus, N. C. (1989a). *GENESIS - a generalized shorelinechange numerical model," Journal of Coastal Research 5, 1-27.
__. (198b). "GENESIS: Generalized model for simulating shorelinechange, Report 1, technical reference," Technical Report CERC-89-19,U.S. Army Engineer Waterways Experiment Station, Coastal EngineeringResearch Center, Vicksburg, MS.
_. (1990). "Shoreline response to a single transmissive detachedbreakwater." Proceedings, 22nd International Conference on CoastalEngineering. Delft, The Netherlands, 2034-46.
__. (1991). "Numerical simulation of shoreline change at Lorain,Ohio," Journal of Waterway, Port, Coastal, and Ocean Engineering 117,(1 January/February) 1-18.
Hanson, H., Kraus, N. C., and Nakashima, L. D. (1989). "Shorelinechange behind transmissive detached breakwaters." Proceedings, CoastalZone '89. American Society of Civil Engineers, Charleston, SC.
Hardaway, C. S., Jr., and Gunn, J. R. (1991a). "Working breakwaters,"OFW Engineering Magazine, American Society of Civil Engineers.
_. (1991b). "Headland breakwaters in Chesapeake Bay.- Proceedings,Coastal Zone '91. American Society of Civil Engineers, Long Beach, CA,1267-81.
Hardaway, C. S., Jr., Gunn, J. R., and Reynolds, R. N. (1993)."Breakwater design in the Chesapeake Bay: dealing with the end effects."Proceedings, Coastal Zone '93, Coastal Engineering Considerations InCoastal Zone Management. American Society of Civil Engineers, NewOrleans, LA, 27-41.
Harris, D. L. (1981). "Tides and tidal datums in the United States," SpecialReport 7, Coastal Engineering Research Center, Fort Belvoir, VA.
Harris, M. M., and Herbich, J. B. (1986). "Effects of breakwater spacingon sand entrapment," Journal of Hydraulic Research 24 (5), 347-57.
Hubertz, J. M., Brooks, R. M., Brandon, W. A., and Tracy, B. A. (1993)."*Hindcast wave information for the U.S. Atlantic Coast," WIS Report 30,U.S. Army Engineer Waterways Experiment Station, Vicksburg, MS.
118 References

Hudson, R. Y., Herrmann, F. A., Jr., Sager, R. A., Whalin, R. W.,Keulgan, G. 0., Chatham, C. E., Jr., and Hales, L. Z. (1979)."Coastal Hydraulics Models," Special Report No. 5, U.S. Army EngineerWaterways Experiment Station, Vicksburg, MS.
Hughes, S. A. Physical models and laboratory techniques in coastalengineering. In preparation, World Scientific Publishing Co., Singapore.
Inman, L. D., and Frautschy, J. D. (1966). "Littoral processes and thedevelopment of shorelines." Proceedings, Coastal Engineering. SantaBarbara, CA, 511-36.
Japanese Ministry of Construction. (1986). Handbook of offhr breakwaterdesign. River Bureau of the Ministry of Construction, JapaneseGovernment, translated from Japanese for the Coastal EngineeringResearch Center.
Jensen, R. E. (1983). "Atlantic coast hindcast, shallow water, significantwave information," WIS Report 9, U.S. Army Engineer WaterwaysExperiment Station, Vicksburg, MS.
Jensen, R. E., Hubertz, J. M., Thompson, E. F., Reinhard, R. D., Borup,B. J., Brandon, W. %., Payne, J. B., Brooks, R. M., and McAneny, D. S.(1992). "Southeern California hindcast wave information," WIS Report 20,U.S. Army Engineer Waterways Experiment Station, Vicksburg, MS.
Kamphuis, J. W. (1975). "Coastal mobile bed model-does it work?"Proceedings of the Second Annual Symposium on Modeling Techniques.993-1009.
Keulegan, G. H. (1966). "Model laws for coastal and estuarine models."Estuary and coastline hydrodynamics. A.T. Ippen, ed., McGraw-Hill, NewYork.
Knutson, P. L., Allen, H. H., and Webb, J. W. (1990). "Guidelines forvegetative erosion control on wave-impacted coastal dredged materialsites," Technical Report D-90-13, U.S. Army Engineer WaterwaysExperiment Station, Vicksburg, MS.
Kraft, K., and Herbich, J. B. (1989). "Literature review and evaluation ofoffshore detached breakwaters," Texas A&M University, Report No. COE-297, prepared for the U.S. Army Engineer Waterways Experiment Station,Vicksburg, MS.
Kraus, N. C. (1983). "Applications of a shoreline prediction model."Proceedings, Coastal Structures '83. American Society of Civil Engineers,63245.
119Reference.

Krams, N. C. (Editor). (1990). "Shoreline change and storm-induced beacherosion modeling: A collection of seven papers," Miscellaneous PaperCERC-90-2, U.S. Army Engineer Waterways Experiment Station, CoastalEngineering Research Center, Vicksburg, MS.
Landin, M. C., Webb, J. W., and Knutson, P. L. (1989). 'Long-termmonitoring of eleven Corps of Engineers habitat development field sitesbuilt by dredged mterial, 1974-1987,0 Technical Report D-89-1,U.S. Army Engineer Waterways Experiment Station, Vicksburg, MS.
Langhaar, H. L. (1951). Dimensional analysis and theory of models. Wiley,New York.
Larson, M., and Kraus, N. C. (1989). "SBEACH: Numerical model forsimulating storm-induced beach change; Report 1: Empirical foundationand model development,' Technical Report CERC-89-9, U.S. ArmyEngineer Waterways Experiment Station, Coastal Engineering ResearchCenter, Vicksburg, MS.
Larson, M., Hanson, H., and Kraus, N. C. (1987. "Analytical solutions ofthe one-line model of shoreline change,' Technical Report CERC-87-15,U.S. Army Engineer Waterways Experiment Station, Coastal EngineeringResearch Center, Vicksburg, MS.
Larson, M., Kraus, N. C., and Byrnes, M. R. (1990). 'SBEACH:Numerical model for simulating storm-induced beach change; Report 2:Numerical formulation and model tests," Technical Report CERC-89-9,U.S. Army Engineer Waterways Experiment Station, Coastal EngineeringResearch Center, Vicksburg, MS.
Leenknecht, D. A., Szuwalski, A., and Sherlock, A. R. (1993). "AutomatedCoastal Engineering System: User's Guide," Version 1.07, U.S. ArmyEngineer Waterways Experiment Station, Vicksburg, MS.
Le Mehaute, B. (1970). "A comparison of fluvial and coastal similitude."Proceedings, 12th Conference on Coastal Engineering. American Societyof Civil Engineers, Vol. 2, 1077-96.
Lesnik, J. (1979). "An annotated bibliography on detached breakwaters andartificial headlands," Miscellaneous Report CERC-79-1, U.S. ArmyEngineer Waterways Experiment Station, Vicksburg, MS.
Maquet, J. (1984). "Construction methods and planning." Breakwaters -design and construction. Institute of Civil Engineers, London.
Moffatt and Nichol, Engineers. (1983). "Construction materials for coastalstructures," Special Report 10, U.S. Army Engineer WaterwaysExperiment Station, Vicksburg, MS.
120 References

Mohr, M. C., and Ippolito, M. (1991). "Initial shoreline response at thePresque Isle erosion control project." Proceedings, Coastal Sedlnents '91.American Society of Civil Engineers, Seattle, WA.
Nakashima, L. D., Pope, J., Mossa, J., and Dean, J. L. (1987). "Initialresponse of a segmented breakwater system, Holly Beach, Louisiana."Proceedings, Coastal Sediments '87. 1399-1414.
Nir, Y. (1982). "Offshore artificial structures and their influence on theIsrael and Sinai Mediterranean beaches." Proceedings, 18& InternationalConference on Coastal Engineering. American Society of Civil Engineers,1837-56.
Noble, R. M. (1978). "Coastal structures' effects on shorelines."Proceedings, 17th International Conference on Coastal Engineering.Sydney, Australia, American Society of Civil Engineers, 2069-85.
Noda, E. K. (1971). "Coastal moveable-bed scale-model relationship,"TETRET-P-71-191-7, Tetra Tech, Inc., Pasadena, CA.
Noda, H. (1984). "Depositional effects of offshore breakwater due toonshore-offshore sediment movement." Proceedings, 19th InternationalConference on Coastal Engineering. American Society of Civil Engineers,Houston, TX, 2009-25.
Perlin, M., and Dean, R. G. (1983). "A numerical model to simulatesediment transport in the vicinity of coastal structures," MiscellaneousReport MR-83-10, U.S. Army Engineer Waterways Experiment Station,Coastal Engineering Research Center, Vicksburg, MS.
Pope, J. (1989). "Role of breakwaters in beach erosion control."Proceedings, Beach Preservation Technology '89. Tampa, Florida, FloridaShore and Beach Preservation Association, 167-76.
Pope, J., and Dean, J. L. (1986). "Development of design criteria forsegmented breakwaters." Proceedings, 20th International Conference onCoastal Engineering. Taipei, Taiwan, American Society of CivilEngineers, 2144-58.
Rogers, S. M. (1989). "Erosion control: Marsh and low-cost breakwater."Proceedings, Coastal Zone '89. American Society of Civil Engineers,Charleston, SC.
Rosati, J. D. (1990). "Functional design of breakwaters for shore protection:Empirical methods," Technical Report CERC-90-15, U.S. Army EngineerWaterways Experiment Station, Vicksburg, MS.
121Referenceo

Rosati, J. D., and Truitt, C. L. (1990). "An alternative design approach fordetached breakwater projects," Miscellaneous Paper CERC-90-7,U.S. Army Engineer Waterways Experiment Station, Vicksburg, MS.
Rosati, J. D., Gravens, M. B., and Chasten, M. A. (1992). "Developmentof detached breakwater design criteria using a shoreline respor.e model."Proceedings, Coastal Engineering Practice '92. American Society of CivilEngineers, Long Beach, CA.
Rosati, J. D., Wise, R.A., Kraus, N.C., and Larson, M. (1993).
"SBEACH: Numerical model for simulating storm-induced beach change;
Report 3, user's manual," Instruction Report CERC-93-2, U.S. ArmyEngineer Waterways Experiment Station, Coastal Engineering ResearchCenter, Vicksburg, MS.
Rosen, D. S., and Vadja, M. (1982). "Sedimentological influence ofdetached breakwaters." Proceedings, I&h International Conference onCoastal Engineering. American Society of Civil Engineers, 1930-1949.
Scheffner, N. W. (1988). "N-line (bathymetric changes) model," CoastalEngineering Technical Note CETN-II-10, U.S. Army Engineer WaterwaysExperiment Station, Coastal Engineering Research Center, Vicksburg, MS.
Scheffner, N. W., and Rosati, J. D. (1987). "A user's guide to the n-linemodel: A numerical model to simulate sediment transport in the vicinity ofcoastal structures," Instruction Report CERC-87-4, U.S. Army EngineerWaterways Experiment Station, Coastal Engineering Research Center,Vicksburg, MS.
Schuring, D. J. (1977). Scale Models in Engineering; Fundamentals andApplications. Pergamon Press, New York.
Seabergh, W. C. (1983). "Design for prevention of beach at Presque IsleBeaches, Erie, Pennsylvania," Technical Report HL-83-15, U.S. ArmyEngineer Waterways Experiment Station, Vicksburg, MS.
Seelig, N. (1980). "Two-dimensional tests of wave transmission andreflection characteristics of laboratory breakwaters," TechnicalReport 80-1, U.S. Army Corps of Engineers, Fort Belvoir, VA.
Seelig, W. N., and Walton, T. L., Jr. (1980). "Estimation of flow throughoffshore breakwater gaps generated by wave overtopping," CoastalEngineering Technical Aid (CETA) 80-8, Coastal Engineering ResearchCenter, Fort Belvoir, VA.
Seiji, M., Uda, T., and Tanaka, S. (1987). "Statistical study on the effectand stability of detached breakwaters," Coastal Engineering in Japan30(t), 131-41.
122 References

Sheppard, D.M., and Hearn, J.K. (1989). "Performance and stability oflow-crested breakwaters," Coastal and Oceanographic EngineeringDepartment, University of Florida, Gainesville, FL.
Shore Protection Manual. (1984). 4th ed., 2 Vols. U.S. Army EngineerWaterways Experiment Station, Coastal Engineering Research Center,U.S. Government Printing Office, Washington, DC.
Silvester, R. (1976). "Headland defense of coasts." Proceedings, 15thInternad9nal Conference on Coastal Engineering. American Society ofCivil Engineers, Honolulu, HI, 1394-1406.
Silvester, R., and Hsu, J. R. C. (1993). Coastal stabilization, innovativeconcepts. Prentice-Hall, Inc., Englewood Cliffs, NJ.
Silvester, R., Tsuchiya, Y., and Shibano. Y. (1980). "Zeta Bays, pocketbeaches and headland control." Proceedings, 17th International Conferenceon Coastal Engineering. American Society of Civil Engineers, Sydney,Australia.
Smith, 0. P. (1986). "Cost-effective optimization of rubble-moundbreakwater cross sections," Technical Report CERC-86-2, U.S. ArmyEngineer Waterways Experiment Station, Vicksburg, MS.
Sonu, C. J., and Warwar, J. F. (1987). "Evolution of sediment budgets inthe lee of a detached breakwater." Proceedings, Coastal Sediments '87.American Society of Civil Engineers, New Orleans, LA, 1361-68.
Suh, K., and Dalrymple, R. A. (1987). "Offshore breakwaters in laboratoryand field," Journal, Waterway, Port, Coastal, and Ocean Engineering 113(2), 105-21.
Toyoshima, 0. (1972). Coastal engineering for practicing engineers-beacherosion, Morikita Publishing Co., Tokyo, Japan, 227-317. (Englishtranslation of Chapter 8, "Offshore breakwaters," available through theCoastal Engineering Research Center, U.S. Army Engineer WaterwaysExperiment Station, Vicksburg, MS.)
Toyoshima, 0. (1974). "Design of a detached breakwater system."Proceedings, 14th International Conference on Coastal Engineering.American Society of Civil Engineers, Copenhagen, Denmark, 1419-31.
. (1976). "Changes of sea bed due to detached breakwaters."Proceedings, 15th International Conference on Coastal Engineering.American Society of Civil Engineers, Honolulu, HI, 1572-89.
123References
(1982). "Variation of foreshore due to detached breakwaters."Proceedhugs, 1&h International Conference on Coast Engineering.American Society of Civil Engineers, 1873-92.
U.S. Army Corps of Engineers (1958). 'Bearing capacity of soils," EngineerManual 1110-2-1903, Washington, DC.
(1986). -Design of breakwaters and jetties," Engineer Manual 1110-2-2904, Washington, DC.
(1986). "Storm surge analysis and design water level determination,"Engineer Manual 1110-2-1412, Washington, DC.
(1987). "Beneficial uses of dredged material," Engineer Manual1110-2-5026, Washington, DC.
(1989). "Environmental engineering for coastal protection,"Engineer Manual 1110-2-1204, Washington, DC.
(1989). "Water levels and wave heights for coastal engineeringdesign," Engineer Manual 1110-2-1414, Washington, DC.
(1989). "Prescribed procedures for the maintenance and operation ofshore protection works, ER 1110-2-2902, Washington, DC.
(1991). *Design of pile structures and foundations," EngineerManual 1110-2-2906, Washington, DC.
(1992). "Coastal groins and nearshore breakwaters," EngineerManual 1110-2-1617, Washington, DC.
(1992). "Coastal littoral transport," Engineer Manual 1110-2-1502,Washington, DC.
U.S. Army Engineer District, Buffalo. (1980). "Presque Isle Peninsula,Erie, Pennsylvania," Final Phase I, General Design Memorandumincluding Environmental Impact Statement, Main Report and Appendices,Volumes I and IH, Buffalo, NY.
U.S. Army Engineer District, Buffalo (1986). "Sim Park, Euclid, Ohio,Detailed Project Report on Shoreline Erosion/Beach Restoration on LakeErie," Buffalo, NY.
U.S. Army Engineer District, Detroit. (1986). "Monthly bulletin of lakelevels for the Great Lakes," Detroit, MI.
U.S. Army Engineer District, Jacksonville. (1984). "Pinellas County,Florida beach erosion control project, Sand Key segment," Jacksonville, FL.
124 References

U.S. Department of Agriculture (1992). "Wetland restoration, enhancement,or creation." Chapter 13, National engineering field handbook. SoilConservation Service, U.S. Department of Agriculture, Washington, DC.
Van der Mew, J. W. (1987). "Stability of breakwater armour layers - designformulae." Coastal Engineering 11, 219-39.
-. (1988). "Rock slopes and gravel beaches under wave attack,"Ph.D. Thesis, Delft University of Technology, Delft, The Netherlands.(Also Delft Hydraulics Publication No. 396.)
_. (1990). "Low-crested and reef breakwaters," Delft HydraulicsReport H 986, Deift, The Netherlands.
__. (1991). "Stability and transmission at low-crested structures." DelftHydraulics Publication No. 453, Deift, The Netherlands.
Van der Meer, J. W., and Pilarczyk, K. W. (1987). "Stability of breakwaterarmor layers, deterministic and probabilistic designs," Delift HydraulicsPublication No. 378, Delft, The Netherlands.
Walker, J. R., Clark, D., and Pope, J. (1980). OA detached breakwatersystem for shore protection." Proceedings, 17th International Cobferenceon Coastal Engineering. American Society of Civil Engineers, Sydney,Australia, 1968-87.
Yalin, S. (1971). Theory of hydraulic models. MacMillan, London.
References 125
Appendix ACase Design Example of aDetached Breakwater Project
Introduction
This appendix was prepared by Mr. Edward T. Fulford of Andrews Millerand Associates, Inc. The community of Bay Ridge, Anne Arundel County,Maryland, is located on the western shore of the Chesapeake Bay nearAnnapolis as shown in Figure Al. The shoreline is about 2,250 ft in lengthand is composed of a sandy beach fronting a bank ranging in height fromabout 8 to 24 ft. Bay Drive runs parallel to the shoreline in this area and asewer line also parallels the shoreline along the western side of Bay Drive.
As a result of continued erosion of the bank and shoreline at a rate of 2 to3 ft per year, a feasibility study was completed in January 1987 whichrecommended the construction of offshore breakwaters and beach fill as theonly effective alternative to provide erosion control and storm protection forthe area without eliminating the existing recreational use of the beach.Figure A2 shows the eroded condition of the beach prior to projectconstruction.
In September 1990, detailed design of the project was completed andconstruction was initiated in November 1990. The following paragraphsdiscuss the design and construction of the offshore breakwater and beach fillproject and the preliminary post-construction performance of the project.
Coastal Processes
Winds
The wind conditions at Bay Ridge were developed from wind observationsat the Baltimore-Washington International Airport. The length of the wind
AlAppendix A Case Design Example of Detached Breakwater

F•ur Al. Loctio Map
conditionsd
,Fig.e.d. A I.... ....o ,o e ta c
reor.uedi this.-.,.-. anaysi w..a..s 30. years. Osre iddt eeajse
by aprpit covrin to! " vrarcnitosad neevto.o 0m
codiions A. Lcto
The approach used to estimate the return intervals fobr winds was to dividethe wind observations into the 16 principal compass directions. Theprobability of observing a particular wind condition is the product of theprobability of observing a particular wind speed and the probability ofobserving a particular wind direction. In order to determine values that
A2 Appendix A Case Design Example of Detached Breakwater

Figure A2. Existing shoreline condition
properly correspond to this product, all observations were categorizedaccording to speed and direction, forming a probability matrix. The matrix,when contoured, exhibited various combinations of wind speed and directionthat correspond to each probability of occurrence. The matrix was adjusted toaccount for the length of record from the measurement site. For wave andwater level estimates, the combination of wind speed and direction was chosenthat would potentially generate the highest waves and winds. For Bay Ridge,the following design wind conditions were determined:
Table A1
Design Wind Conditions
Event Wind Speed knetm Wind Direction
-year, 32 SSE
10-year 43 SSE
25-year 49 SSE
S0-year 65 SSE
Water levels
The wind speed and directions corresponding to each design return intervalwere uniformly applied to a simple numerical finite difference storm surge
Appendix A Case Design Example of Detached Breakwater A3

mode of the Chesapeake Bay. The model used was a simplified model origi-naily developed by Reid and Bodine (1968) for the Texas coast. The modelcalculated the wind-induced setup of the water level throughout the Bay.
The storm surge model used a time-stepping finite diffwence numericalalgorithm that solved appmpriate differential equations representing a flowsystem. The equations and momentum and continuity expressions containterm that simulate the following processes:
- Coriolis forces- Surface wind stresses- Bottom stresses- Advection- Surface slope currents
Land boundaries in the simple model were treated as vertical walls; however,the model did not have the capability to simulate inland flooding.
Based upon application of the simple storm surge model representation ofthe Chesapeake Bay and Bay Ridge areas, the storm surge levelscorresponding to each design return interval for the project area are shown inTable A2.
WavesTable A2Design Water Levels Wave conditions for the design of shore protection structures
S at Bay Ridge were generated using an array of numerical modelsEvent (ft, nw) and finite difference grid scales.
1-yar 3.6 Large scale, or "offshore," wave conditions in the Chesapeake
1o-YOa 4.5 Bay were calculated using a time-stepping directional spectral
w 5.2 wave model. Directional spectral wave models are generallymore accurate than other methods of determining wave conditions
50-yer 60. on the Chesapeake Bay primarily because the Bay is consideredboth a narrow and shallow water fetch over which the waves aregenerated. Simpler techniques for determining wave conditions
do not account for land boundaries on the sides of narrow fetches and do notaccount for the predominance of shoal areas such as those in the Bay.Significant errors in wave estimates during extreme events can result byignoring these physical constraints on wave generation and propagation. TheChesapeake Bay was initially digitized into a 2.5-nautical mile finite differencegrid, over which winds corresponding to each design event were applied.
The offshore wave conditions generated in the initial wave modelapplication were used as input to a finer scale simulation. The simulation wasperformed using the same directional spectral wave model at a finitedifference grid scale of 500 ft including all important nearshore wavetransformation processes, including wave refraction, shoaling, wave-waveinteractions, bottom friction, etc. The nearshore wave conditions for each
A4 Appendix A Cae Design Exemple of Detached Breakwater

approach direction at the -3-ft mean low water (mlw) contour are presented inTable A3 for each design event. The design water depth at that locationincludes the corresponding storm surge plus a 1-ft astronomical tide.
Table A3
Desugn Wave Conditions
swam We" HOIl to Pehd WeeW Direoaen
1-yeer 5.0 5.6 SSE
10-yew 5.6 6.5 SSE
2I-yew 6.5 7.6 SSE
50-wet 7.2 9.7 SSE
Sod ent trnsport
Leagaore transport. Preliminary analyses of aerial photos and winddistributions indicated that the predominant net longshore littoral drift in theproject area is small and in a northerly direction. To gain a better insight intothis process, several techniques were used.
Eagy flux method. This method is based on the assumption that thelongshore transport rate of littoral material can be computed from thelongshore component of energy flux in the surf zone according to thefollowing equation:
Q = 7500 Pb (Al, Equation 4-50, SPM)
The longshore energy flux in the surf zone is approximated by assumingconservation of energy flux in shoaling waves, using small-amplitude wavetheory, and then evaluating the energy flux relation at the breaker position.This energy flux is then related to sediment transport through an empiricalrelationship. The procedure used in this type of analysis is to first develop thewave climate for an area, consisting of wave heights, periods, and breakingwave angles between the wave crests and the shoreline and the percentoccurrence of these conditions. These wave parameters are then used in theempirical relationship to determine the amount of sediment that could betransported by each wave condition.
For this analysis, each wind speed and direction combination was appliedto the wave model grid, yielding a nearshore wave height/period/directioncombination resulting from that wind. These wave characteristics wereconverted to longshore energy flux potential and transport potential andweighted by their individual probability of occurrence. Summing the relativecontributions of the wave resulting from each wind speed/directioncombination yielded a net longshore sediment transport potential of13,300 cu yd traveling northerly along the Bay Ridge shoreline.
Appendix A Came Design Example of Detached Breakwater A5

Awer 1i qsy mlyuls. Sevn sets of aerial photographs of theproject area shoreline from 1962 to 1985 were analyzed for evidence oflonghore sediment tranmport direction. "te results of the aerial photography"a ys and field observations supported the results of the analyticaldetermination of the longshore transport in the area. Overall, there appears tobe a net longshore transport to the north along the study area shoreline withsome occurrence of southerly transport. The best estimate for the magnitudeof the net traport rate is approximately 5,000 to 10,000 cu yd/yr to thenorth.
Structural Breakwater Design
Desgn wave and water level
"Ile level of structure design was the 25-year storm event. Based on thenumerical modeling analysis, the design wave height H,, wave period T, andstorm surge DSML for this event are:
H. =6.5ftT = 7.6 secDMWL = +5.2ftmlw
Breakwater stone dze and cros section
Selection of the armor stone size to withstand the design wave conditionswas based on the stability formula developed at the U.S. Army EngineerWaterways Experiment Station. This formula is as follows:
W - Wr3 (A2, Equation 7-116, SPM)KJD (Sr
where
W = weight in pounds of an individual armor unit in the primary coverlayer. The stones comprising the primary cover layer range fromabout 0.75 W to 1.25 W, with about 50 percent of the individualstones weighing more than W
w. = unit weight of stone; 165 lb/fI3
H = design wave height at the structure; 6.5 ft
Sr -- specific gravity of the armor unit, relative to the water at thestructure (S, = wJww); 2.58
A6 Appendix A Case Design Example of Detached Breakwater

ww - unit weight of water; 64.0 lb/ft3
9 = angle of the structure slope measured from the horizontal indegrees; cot 0 = 1.5
KD - stability coefficient for rough angular armor units; = 2.0
For the design conditions at the site, W - 3,300 lb. The acceptable rangefor W is 2,500 to 4,500 lb with 50 percent of the individual stones weighingmore than 3,300 lb.
The bedding and core stone directly beneath the primary armor units is3-in. to 8-in. stone.
The crest width of the breakwaters is calculated from the followingequation (SPM, 1984):
B = n kd (W/Wr)1 3 (A3, Equation 7-120, SPM)
where
B = crest width, ftn = number of stones (n = 3 is recommended minimum)kd = layer coefficient; 1.00wr = unit weight of stone; 165 lbl/
Using this equation, the crest width is calculated to be 9.5 ft.
Since the breakwaters will be exposed to breaking waves, a quarrystone toeberm is required to support the primary cover layers. The width of this bermis 6 ft and the thickness of the berm is 3 ft. A typical section of thebreakwater is shown in Figure A3.
Foundation analysis
Vibracores were taken at four offshore locations beneath the area of theproposed offshore breakwaters. A semi-portable coring system was used.Cores ranging in length from 4 to 5 ft were obtained. Analysis of these coresindicated that a surface sand layer overlies the entire area, ranging inthickness from 10 to 20 in. and that no settlement is expected, either initiallyor in the long term.
Functional Breakwater Design
Shore-parallel breakwaters constructed offshore provide protection byreducing the amount of wave energy reaching the leeward water and shore
Appendix A Cme Design Example of Detached Breakwater A7
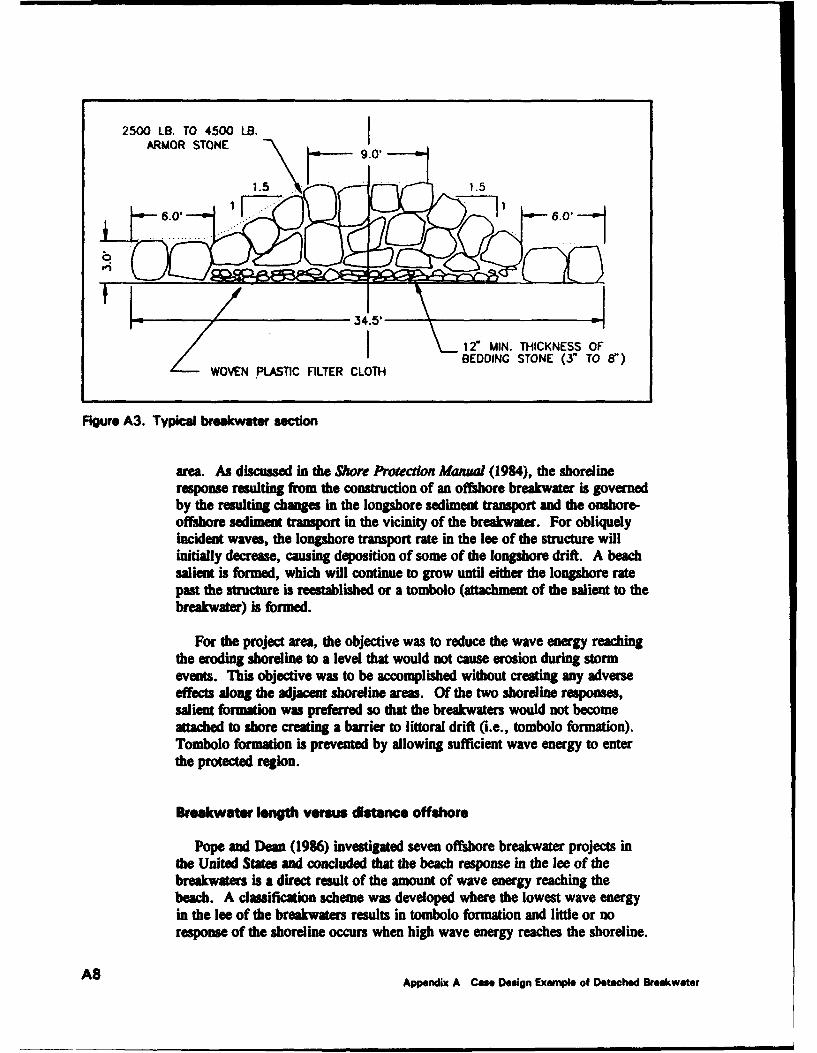
2500 LB. TO 45W0 LB.ARMOR STONE.9 0
S1.5S" 1
IL\ 12" MIN. THICKNESS OF
BEDDING STONE (3" TO 8")
Z WOVEN PL'ASTIC FILTER CLOTH BDIGSOE(-T -
Figure A3. Typical breakwater section
area. As discussed in the Shore Protection Manal (1984), the shorelineresponse resulting from the construction of an offshore breakwater is governedby the resulting changes in the longshore sediment transport and the onshore-offshore sediment transport in the vicinity of the breakwater. For obliquelyincident waves, the longshore transport rate in the lee of the structure willinitially decrease, causing deposition of some of the longshore drift. A beachsalient is formed, which will continue to grow until either the longshore ratepast the structure is reestablished or a tombolo (attachment of the salient to thebreakwater) is formed.
For the project area, the objective was to reduce the wave energy reachingthe eroding shoreline to a level that would not cause erosion during stormevents. This objective was to be accomplished without creating any adverseeffects along the adjacent shoreline areas. Of the two shoreline responses,salient formation was preferred so that the breakwaters would not becomeattached to shore creating a barrier to littoral drift (i.e., tombolo formation).Tombolo formation is prevented by allowing sufficient wave energy to enterthe protected region.
Breakwater length versus distance offshore
Pope and Dean (1986) investigated seven offshore breakwater projects inthe United States and concluded that the beach response in the lee of thebreakwaters is a direct result of the amount of wave energy reaching thebeach. A classification scheme was developed where the lowest wave energyin the lee of the breakwaters results in tombolo formation and little or noresponse of the shoreline occurs when high wave energy reaches the shoreline.
AS Appendix A Case Design Example of Detached Breakwater

The five beach response planforms used in this classification scheme are asfollows:
a. PERMANENT TOMBOLOS - Very little wave energy reaches theshore and the beach is stable with little transport along the shore.
b. PERIODIC TOMBOLOS - One or more of the breakwater segments areperiodically backed by tombolos with a periodic trapping of littoralmaterial followed by a release of a "slug" of sediment to the downdriftshoreline.
c. WELL-DEVELOPED SALIENTS - These planforms occur when some-what higher wave energy reaches the lee of the structures and they arecharacterized by a balanced sediment budget. Longshore movingmaterial enters and leaves the project at approximately the same rate.
d. SUBDUED SALIENTS - In this case, the shoreline response is not aspronounced, and the amplitude of the salient is of lower relief.
e. NO SINUOSITY - High wave energy reaches the beach in this caseresulting in little if any shoreline response.
Ahrens and Cox (1990) developed an empirical expression for a beachresponse index based on the data from the seven offshore breakwater projectspresented in Pope and Dean (1986). This index is based on the ratio of thelength of the breakwater L. to the offshore distance of the breakwater X. Thevalues of this index for the five beach response classifications of Pope andDean (1986) are shown in Table A4.
For the project area, various combinations of breakwater lengths andoffshore distances, along with the corresponding beach response index, wereevaluated as shown in Table AS.
In order to maximize the protection to the project area shoreline andmaintain the longshore transport rate along the shoreline, the desired planformranged from subdued salients to well-developed salients. To achieve thisplanform, the combination of a breakwater length of 100 ft and offshoredistance of 133 ft was selected.
Breakwater segmentation
A primary area of concern for the project area was the magnitude ofdiffracted waves in the lee of the gaps. Waves will enter the breakwater gapsand diffract behind the structures and toward the shoreline. Upon reachingthe shoreline, sufficient beach width and berm height are required to dissipatethis wave energy prior to its reaching the bank toe. If the existing beachwidth and height are not sufficient to dissipate the wave energy, the optionsare to design the breakwaters to further decrease the wave energy propagating
Appendix A Case Degfn Example of Detached Breakwater A9

Table A4
Beach Responsm Classifications (from Pope and Dean (1986l)
SM PA"W"~ Index Classfictio
1.0 Permanent tombolo.
2.0 Pertodic tornbolo.
3.0 Wes-dVelope sients
4.0 Subdued salient.
6.0 No sinuosity
Tabe A5Breakwater Length/Distance Offshore vs Beach Response
Beach -p e(Ahlove and Cox
LA L X L./ 1990)
50 200 75 300 100 400 .25 5.0/no sinuosity50 100 75 150 100 200 .50 4.5/no sinuosity
50 75 75 112 100 150 .67 4.2/subduedIsaents
50 67 75 100 100 133 .75 4.11subduedsalients
50 50 75 75 100 100 1.00 3.7/subduedsalient.
50 40 75 60 100 80 1.25 3.3/well-developedsaliento
50 33 75 50 100 67 1.50 3.01weli-developedsalients
50 29 75 43 100 57 1.75 2.7/well-devlopedsIlIente
50 25 75 38 100 50 2.00 2.5/penodictombolos
through the gaps (e.g., smaller gaps, with the resulting increase in the lengthof breakwater segments) or to add beach fill to the shoreline area. In thelatter application, the function of the breakwater system is to reduce the waveenergy level such that the beach fill will form a stable equilibrium planformand dissipate the remaining wave energy prior to its reaching the toe of thebank.
To evaluate the potential wave transmission characteristics of variousbreakwater gaps, nearshore diffraction diagrams were developed for the lee ofthe breakwaters for each design event. Analysis of the diagrams indicated thatthe 50-yr design wave height of 7.2 ft would be reduced to about 3 ft at adistance of about 45 ft from the toe of the bank for breakwater gap widths of100 ft, the minimum gap width considered practical for the area. Assuming a
A10 Appendix A Case Design Example of Detached Breakwater

breaking wave parameter k equal to 0.78, this wave would break in a depthof water of about 3.8 ft. With the existing beach berm at +2.5 ft mlw andthe design storm tide at +6.0 ft miw, these waves would break directly on thebank toe and cause significant erosion.
In lieu of reducing the diffracted design wave height by narrowing thebreakwater gap width, beach fill placement was selected to provide the desiredprotection for the bank area. The beach fill plan consisted of raising theheight of the existing berm to +6.0 ft mlw for a width of 30ft from the toeof the existing bank and then sloping IH on 8V to the existing bottom.
With the storm berm in place at a height of +6.0 ft mlw, wave heightsnear the toe of the bank would be depth-limited to less than 1 ft during the50-yr storm analyzed for functional performance (at the sponsor's request).Following its placement, the beach fill would be expected to evolve to a stableplanform with salients forming behind each breakwater and embaymentsopposite each gap. As a result of this process, the mean high water line(mhwl) behind the breakwaters would advance bayward and the mhwl oppositethe gaps would recede shoreward. Analysis of the diffracted wave patterns inthe area and the performance of numerous other offshore breakwaterconfigurations indicate that recession of the mhwl opposite the gaps would beon the order of 15-20 ft.
During the evolution of the shoreline, the slope of the beach fill would beexpected to evolve to a more natural and milder slope. Analysis of the profilesin the area indicates that this slope should be on the order of IV on 10H toIV on 15H.
Opposite the gaps, the recession of the mhwl and the slope changes wereused to determine the wave heights during the 50-yr storm event.Table A6 indicates the depth-limited wave heights during thisevent relative to the bayward distance from the toe of the Table A6bank. These wave heights assume a worst case situation Depth-Umited Wavewhere the entire profile opposite the gap evolves to the milder Heights Oppositeslope and the horizontal berm ( at +6.0 ft mlw) is Gapssubstantially decreased in width. ksyward
Distane From Wave HeightSince the protection of the bank toe depends on the fla# To. Ift) Ift)
performance of the beach berm during design storm events, aprofile response model was used to evaluate this performance.This model, developed by Kriebel and Dean (1985), calculates 10 2.0
beach profile evolution due to storm events, and includes the 20 2.5
effects of both water level rise and waves. The initial profileused in the simulation is the proposed beach fill configuration 3o 3.0with the assumed equilibrium beach slope. A worst casescenario was evaluated with the model for the beach and shoreline areaopposite the gaps by using the storm wave conditions prior to reduction by theoffshore breakwaters. The results of this evaluation indicated that even in the
AllAppendix A Case Design Example of Detached Breakwater
worst case scenario for the 50-yr storm event, the storm berm would remainwith a width of on the order of 5 to 10 ft. The actual erosion of the stormberm would be expected to be significantly less due to the reduction in thestorm wave energy as a result of wave diffraction through the gaps.
Based on the preceding analyses, a gap width of 100 ft was selected for theproject area.
Breakwater crest elevation
In addition to diffracted wave energy through the breakwater gaps, waveenergy transmitted over the top of the structures was considered to maximizethe protection of the shoreline area. This analysis was conducted using awave transmission model developed by Ahrens (1987) capable of predictingthe amount of wave energy transmitted over and through both submerged andnon-submerged reef type breakwaters. Table A7 presents the results of thisanalysis for various combinations of breakwater crest height and slope forvarious return interval storms. During the 50-yr design storm, the waveheights immediately behind the breakwaters are reduced to about 60 percent,54 percent, and 46 percent of the incident height with breakwater crestelevations of +4.0, +5.0, and +6.0 ft mlw, respectively. During the 25-year event, these reductions are 55 percent, 46 percent, and 38 percent,respectively. These transmitted waves then propagate shoreward where theyare further dissipated by the beach salients formed during the evolution of thebeach fill to an equilibrium planform and the storm berm. With the proposedbeach fill in place, a breakwater crest elevation of + 4.0 ft miw was selectedto limit the transmitted design wave heights to about 4.0 ft (the same height asthe diffracted design wave opposite the gaps) which would then be dissipatedby the storm berm.
Beachfill characteristics
Seven beach profile lines were identified for sample collection. Four1-liter samples of surface sediment were taken at locations along each profilespaced equally between the foot of the bluff and a depth of -1.0 ft, miw. Thefour samples were then mixed into a composite sample for sieve analysis.These data indicate that the native beach material ranges from fine to coarsesands with a median grain size of about 0.6 mm. For optimum performance,beachfill sources with similar grain size characteristics should be used.
Summary of Breakwater andBeachfill Design Components
Based on the above analyses and evaluations, the recommended plan toaccomplish the objectives of stabilizing the existing beach and providing
A12 Appendix A Case Design Example of Detached Breakwater

Tabie A7Wave Transmission Versus Crest Height
Iwldent Trnmmhed Wave Heights at VadousWe" Wave Crest Heig" W"
setm DWL Height Pedo-Event (ft) ndw N0 RI fTp +4.0 ndw +5.0 ndw +6.0 miw
50 yr 7 7.2 9.7 5.6 5.3 4.9
50 Fr 7 6.2 9.7 4.9 4.6 4.2
50 7r 7 5 9.7 4.0 3.7 3.4
25 yr 6.2 6.5 7.6 4.8 4.4 4.0
25 yr 6.2 5.6 7.6 4.2 3.8 3.5
25 yr 6.2 4.5 7.6 3.4 3.1 2.8
10yr 5.5 5.6 6.5 3.9 3.5 3.1
10 yr 5.5 4.8 6.5 3.4 3.0 2.7
10 yr 5.5 3.9 6.5 2.8 2.5 2.2
1 yr 4.6 5 4.3 3.1 2.7 2.3
1 yr 4.6 4.3 4.3 2.6 2.3 1.9
1 yr 4.6 3.5 4.3 2.2 1.8 1.5
wave-induced erosion control for the existing banks is the construction of I Ioffshore breakwaters and the placement of beachfill. The recommendedbreakwater segment lengths are 100 ft each, separated by 100-ft-wide gaps(except for a 75-ft-wide gap immediately south of the existing pumpingstation) and located about 140 ft bayward of the existing mean high watershoreline. The recommended design crest elevation is +4.0 ft mlw.
The recommended beachfill includes a storm berm at +6.0 ft mlwextending about 30 ft bayward of the existing toe of the bank and then slopingat 1V:SH until intersecting with the existing bottom.
Project Construction
The construction of the project was initiated in November 1990 andcompleted in July 1991 by Coastal Design and Construction of Gloucester,Virginia. The construction sequence was breakwater construction, initialbeach fill placement, extension of existing storm drains, grading andstabilization of critical bank erosion areas, and final beach fill placement.
The breakwaters were constructed by land-based equipment usingtemporary sand causeways from the existing shoreline out to the breakwater
A13Appendix A Case Design Example of Detached Breakwater

locations. Geotextile fabric was placed on the existing bottom followed byplacement of the bedding stone directly on the filter fabric. Stone wassupplied to each breakwater location via a front-end loader running betweenthe stone stockpile areas at the north and south ends of the project area andeach sand causeway. The front-end loader dumped the stone into a steelcontainment bin placed at the bayward end of each causeway. A backhoe wasthen used to remove the stone from the containment bin and place it in thebreakwater section. This procedure is illustrated in Figure A4.
The first two or three breakwaters at the south end and north end of theproject area were constructed initially to "anchor" the existing beach materialand the intermediate beach fill. Immediately following construction of thebreakwater segments, wave diffraction through the gaps began to form thealients. The pre- and post-construction shorelines are shown in Figures AS
and A6, respectively.
Construction of the project was complete in July 1991 with the finalplacement of beach fill. The completed project shoreline area is shown inFigures A7 and AS.
Post-Construction Monitoring
Monitoring of the project was initiated with a topographic/bathymetricsurvey of the project area prior to construction. Post-placement surveys ofbeach fill acceptance reaches were completed on July 8, 1991. Post-construction beach surveys were completed on September 28, 1991, andNovember 17, 1991. The purpose of these surveys was to monitor the
Figure A4. Breakwater construction procedure
A14 Appendix A Case Design Example of Detached Breakwater

Figure AS. Prosufo shorelin
Figure A6. POst-COflstructbon shoreline
A15
Appendix A Cae' Design1 ExempI'e Of 0* 01ched Breakwatsf

gmt
Figure A7. Completed project at south end
Figure A8. Completed project at north end
evolution of the beach fill as a result of the effects of the offshorebreakwaters. Figure A9 shows the pre- and post-construction shorelinepositions.
Wind data from the Baltimore Washington International Airport wereobtained for the period January 1 to December 30, 1991, along with LittoralEnvironmental Observations (LEO), site photographs, and aerial photography.The wind data were used to hindcast the wave climate at the site.
The response of the shoreline following the breakwater construction andbeach fill placement was initially predicted using an empirical method (Ahrensand Cox 1990). The GENESIS Qr ralized Model for SimulatingShoreline change) numerical shoreline change model (Hanson and Kraus 1989)was used to simulate the evolution of the shoreline under actual conditions that
A16 App•ndix A Case Design Example of Detached Breakwater

FLOOD
EBB
CHESAPEKE SAY
BREAKWATER (TYP.)
~V PUMP STATION \ EBNMN
PRE-CONSTRUCTION MLW LINENOVEMBER 1966
CONSTRUCTION TEMPLATEMLW UNE, JULY 8.1991
POST-CONSTRUCTION MLW UNESEPTEMBER 28. 1991
POST-CONSTRUCTION MLW LINENOVEMBER 17.1991
Figure A9. Pro- and post-construction shorelines
occurred since project construction. Application and results of the GENESISmodeling are presented in the following paragraphs.
GENESIS Shoreline Modeling
Model setup
"Tle shoreline coordinate system established for the modeling is shown inFigure A1O. The alongshore spacing selected was 12.5 ft to maximize thenumber of cells behind each detached breakwater. This spacing resulted in anaverage of nine cells per breakwater. Initial shoreline position data weredeveloped based on the July 8, 1991 post-fill survey of the project area.
Appendix A Case Des* Examrle of Detached Breakwater A17

FLOOD
EBB
CHESAPEAKE BAY
BREAKWATER (TYP.)
YT I• r----1•r-n r-n • -- 22 ~ •
0 191O xPUMP STATION EMBANKMENT
Figure A 10. Shoreline coordinate system
Data for the START file
The initial model configuration is contained in STARTINIT. Values forthe modeling parameters were based on available data from the site and bestengineering assumptions. Values selected and the rationale for their selectionare discussed in the following paragraphs.
Une A.3. Breakwaters are 100 ft in length and the gaps between them are100 ft. The exceptions are a 75-ft gap between Breakwaters No. 6 and No. 7,and Breakwater No. 11, which has a length of 75 ft.
Une A.S. Wave data were developed by hindcasting hourly wind speedsobtained from a nearby anemometer. Accordingly, the initial time intervalselected is DT = I hr. Previous experience indicated that with an alongshorespacing of DX = 12.5 ft., this time interval should result in a reasonablestability parameter.
Line A.12. For the initial simulation, the values of KI and K2 were left atthe default values of 0.50 and 0.25, respectively. A preliminary run withthese values and no offshore breakwaters resulted in a net longshore transportrate of -10,000 cu yd/yr, which compares favorably with the estimatedlongshore transport rate in the area.
Une B.1. For the initial simulation, the values of HCNGF, ZCNGF, andZCNGA were set to give no change.
Une C.1. Sand placed as a part of project construction had a mediangrain size of 0.5 mm. This value was selected for the initial simulation.
A18 Appendix A Case Deuign Examle of Detached Breakwater

Line C-2. The design berm elevation for the project was 6 ft above meanlow water (set at the 50-yr tide elevation).
Une C.3. The depth of closure for the project area is estimated to be 8 ftbased on profile analysis in the area.
Line D.I. There are no non-diffracting groins included in the simulation.
Line E.I. One diffracting groin is included at grid cell 1.
Line F.2. The bottom slope near the groins is 0.1.
Line F.3. The north groin was constructed to have low permeability.
Lines F.4 and F.S. The value of the length of the diffracting groin at gridcell 1 was taken from a survey of the area.
Lines G.6 and G.7. Locations of the breakwaters are taken from the as-built drawings of the project.
line G.9. Transmission coefficients for the breakwaters were initiallyselected to be 0.10 to indicate low wave transmission.
Data for the SUORL files
The shoreline position for the initial simulation was obtained fromshoreline surveys conducted on July 8, 1991.
Data for the DEPrH file
A depth file was not required because an external wave transmission modelwas not used.
Data for WAVES file
Wave measurements for the site for the time interval between measuredshoreline positions were not available. Instead, a 1-year wave hindcast wasconducted for the period January 1, 1991, through December 31, 1991. Thishindcast was conducted using hourly wind data from the Baltimore/Washington International Airport, which is located about 19.5 miles northwestof Bay Ridge. Waves were hindcast up to the breakwater locations using theshallow-water wave equations in the Corps Automated Coastal EngineeringSystem (ACES) Program, Version 1.05.
The result of this hindcast was a time series of offshore wave period,height, and direction data for the period January 1 to December 31, 1991. As
A19Appendix A Case Design Example of Detached Breakwater

a check on the acceptability of the wave data set, longshore sediment transportrates using the data were computed. This computation resulted in a predictednet logsiho transport rate of -10,000 cu yd/yr, which compares favorablywith the -5,000 to -10,000 cu yd/yr net trasport rate calculated during thedesign studies a&d also inferred from an analysis of shoreline changes in aerialphotography of the site. This good comparison supports the use of this wavedata set for the modeling effort.
Calibration and veraifican
For the calibration and verification process for this project, the intent wasto vary the values of various calibration parameters to obtain agreementbetween the measured shoreline of September 28, 1991 (initial beachmonitoring survey) and the calculated shoreline. Once reasonable agreementwas achieved between these two shorelines, the model would be verified bycomparing the measured and calculated shoreline of November 17, 1991.
In the course of calibration, generally only one parameter at a time waschanged in order to evaluate its effect on the calculated shoreline portion. Asa first step, the value of the main parameter K1 was varied to determine thevalue that would result in a calculated overall net longshore transport rateclose to the previously determined values. Second, the parameter YK2 wasvaried to improve the agreemen between the measured and calculatedshoreline positions as well as the approximate magnitude of net inflow of sandfrom the south. Next, the longshore locations of the breakwaters weretranslated several grid cells to the north and south as required to improve theagreemet between the calculated and measured shoreline positions. Next, thetransmission coefficients of the breakwaters were varied to adjust the size ofthe salients behind the breakwaters. Lastly, beach fill was added to simulatethe evolution of the storm berm that resulted in an increase in beach width.
In total, 15 calibration simulations were conducted. Several of the initialruns were conducted without any structures in place along the shoreline todetermine the value of K1 . Evaluation of these runs indicated that K1 = 0.50resulted in a calculated net longshore transport rate of -10,000 cu yd/yr (southto north), which agreed with the previously determined rate of -5,000 to -10,000 cu yd/yr.
With Kt = 0.5 and K2 = 0.25, an initial simulation with all breakwatersin place was conducted. Results of this run, shown in Figure A 1l, indicatethat the bayward limit and shape of most of the salients behind thebreakwaters are in reasonably good agreement with the measured salients.However, the longshore locations of ihe calculated salients are displaced toofar to the north and the depths of the embayments are too great. Thecalculated Calibration Verification Error (CVE) equals 10.44 ft.
A number of additional simulations were made with the lougshore locationsof the breakwaters translated both north and south several cells in an attemptto improve the agreement between the longshore location of the calculated and
A20 Appendix A Case Design Example of Detached Breakwater

m" BIM uOMMOM COMI SIM. Mm 3 06-011-191
.- Caimwlatmi Mwlif
a.- -. 0 Nos4iffractiu Grain3W.- # Sifracttu Grain
0..
31- luta m1
0. -. lh-iftae 3ig 411 Sl O
".-. piufractlog Groin3W ~ Diffact'o Grainu
is 66 -1 86l (cis M!nt li 12 13)
Intalt S.1 reliv-. Calcmlatai Shworl lu
4.- -. Iw-Difracttlag Grailn4.0 Diffracting Grol.'A r Mgmzud Sh.I UND
I1 is uiv 1, 138 13 146 145 11 i liALSNfIU C6DU? (coil "wipacu 12 ft)
Figure A 11. Initial calibration simulation
AppeXNdx A Case Design Example of Detached Breakwater A21
measured salients. The best agreement obtained is shown in Figure A12,which has a calculated CVE equal to 9.01. As shown in Figure A12, there isan appreciable improvement in the agreement between the longshore locationsof the calculated and measured salients. However, the bayward limit of thesalients of the calculated shoreline needs to be increased, while the landwardlimit of the embayments of the calculated shoreline needs to be decreased toimprove agreement with the measured shoreline.
In an attempt to increase the bayward limit of the salients of the calculatedshoreline, the transmission coefficients of the breakwaters were decreasedfrom 0.1 to 0.0, which represents no wave transmission through thebreakwaters. This change had a negligible effect on the location of thesalients. Next, the value of K2 was increased from 0.25 to 0.50 and then to0.75. The effect of these changes was an increase in the calculated CVE from9.01 with 1(2 = 0.25 to calculated CVE's of 9.20 and 9.88 with 1(2 = 0.50and 0.75, respectively. This change also had a negligible effect on thelocation of the salients.
Following unsuccessful attempts at improving the agreement of thebayward limit of the salients and the landward limit of the embayments, thechanges between the measured post-fill (July 8 1991) and the measuredSeptember 28, 1991 shoreline positions were analyzed in more detail. Asshown in Figure A13, following the completion of the beach fill on July 8,1991, the shoreline evolved to the position shown on September 28, 1991 as aresult of the influence of the breakwaters on the wave climate. As noted inFigure A13, an overall bayward movement of the shoreline occurred,including the shoreline opposite the breakwater gaps. Although the baywardmovement of the shoreline leeward of the breakwaters was expected, thebayward movement of the shoreline opposite the gaps was not anticipated.Typically, the shoreline opposite breakwater gaps evolves landward to formembayments in equilibrium with the diffracted wave climate with the sedimenteroded from the embayments forming the salients or tombolos behind thebreakwaters.
In this case, the bayward movement of the shoreline opposite the gaps isattributed to erosion of the storm berm constructed as a part of the beach fill.The beach fill template consisted of a 20-ft-wide berm at +6.0 ft mIw with aIV:8H slope from the bayward edge of the berm to the existing bottom. Sitevisits following the beach fill placement and after some moderate storm eventsrevealed that 1- to 3-ft-high erosion scarps had occurred along the bermopposite the breakwater gaps. The net effect was that the scarping anderosion of the berm in these areas resulted in a movement of beach fill fromthe berm to the offshore area to reduce the slope of the beach. As a result,the mean low water (mlw) shoreline opposite the gaps advanced bayward inall locations.
In retrospect, a straightforward application of GENESIS would not beexpected to result in good agreement between the measured and calculatedshorelines because of the addition of sand to the mlw beach as a result of thescarping. In an attempt to simulate this process, a simulation was made with
A22 Appendix A Case Design Example of Detached Breakwater

ma aim mai adi DO. Mail . *lfl TIPS Of aruas CIm
4- Inir~tia Swrvean
3W-
U*UIU COWnm (=Itspai ealg 12It
Inlitial Sloeivein-. alietti Sherala
Di~ffracting Gramn
56 U 7i a si IN lie 32s 13OaLinU mimomi (ciialalu swl 12 ft)
-acelceiated Shreine
D-eIiffrctinug Grain
Il115iS liU IN 3 3 140 14S 1iU ISS I
MiN WUU (cmii qaeclg - 12 ft)
Figure A 12. Calibration simulation No. 8
Appendix A Cam. Design Exampl, of Dotactwd Breakwater A23

Ini~tia Summ
3w-
2W
Iwa-* aIlfMIcing &six
- 35W 3.-O S.li *
£OIUU miint (cal smileq 12 It)
Initalu. ammJim
2w..
Iml3 ais U mu ma 95 139 15 14m 10151
uannui aumu ml (call "Wn 32 nt)
Figure Al3. Measured pro- and post-fill shorelines
A24 Appendix A Case Design Exempt of Detached Breekweter
a beach fill added between the measured post-fill shoreline on July 8, 1991and the measured shoreline on September 28, 1991. The added berm width,YADD, was selected to be 10 ft, which was the average baywarddisplacement of the shoreline opposite the breakwater gaps between the twomeasured shorelines. The volume of the "artificial* beach fill approximatedthe volume of eroded material in the berm scarp.
Results of this simulation are shown in Figure AM4. In general, theagreement between the measured and calculated shoreline is greatly improvedwith a CVE equal to 7.89.
At this point, the model was considered to be calibrated sufficiently and theverification process was initiated. The intent of this process was to use themodel to reproduce a measured shoreline over a time interval independent ofthe calibration interval. The shoreline selected for verification of the modelwas the measured shoreline of November 17, 1991, since hindcast wave datawere also available through that period. The model parameters used for theverification simulation were the same as for the last calibration simulation.Results of this simulation, shown in Figure A15, indicate good agreementbetween the measured and calculated shoreline positions, with a CVE equal to7.51.
Summary and Discussion
The preceding sections discuss the data preparation, calibration, andverification of the GENESIS model for the Bay Ridge offshore breakwaterproject. A detailed description of many of the intermediate simulations isomitted.
Overall, the agreement between the measured and calculated shorelinesduring the calibration and verification stages is considered to be goodconsidering the limitations of some of the data used. In particular, thewave data set was developed using wind data from an inland anemometernearly 20 miles away from the site and hindcast techniques using the shallow-water wave equations. The use of actual wave data from the site or a moresophisticated wave hindcast would have more than likely resulted in betteragreement between the measured and calculated shoreline positions. Inaddition, the scarping and erosion of the storm berm after initial placement,which resulted in a bayward advancement of the shoreline opposite thebreakwater gaps, further complicated the modeling effort.
In any event, the agreement obtained between the measured and calculatedshoreline positions even with the data limitations, clearly illustrates thecapability and effectiveness of the GENESIS modeling system in simulatingthe influence of waves and coastal structures on the evolution of a sandybeach. The results demonstrate that the modeling system is an extremelyuseful engineering tool for evaluating shore protection projects.
Appendix A Cýe Design Exampl, of Detached Breakwater A25
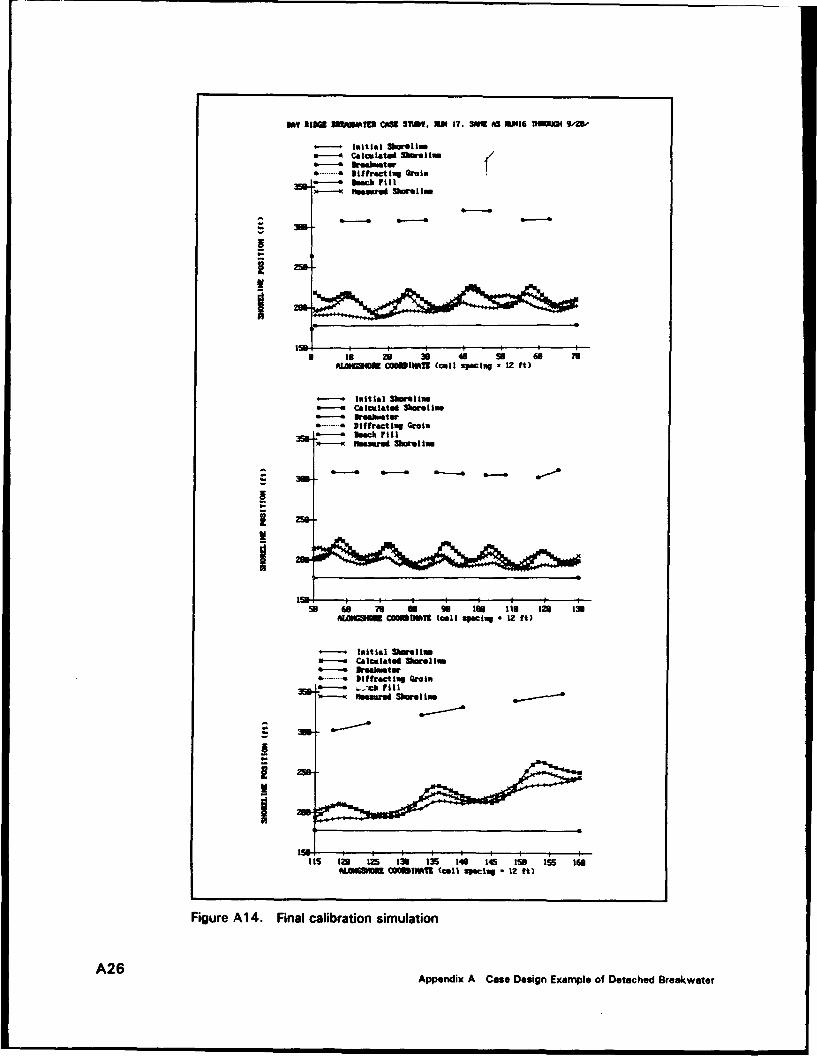
MW MIiu =MOTOI CAM S135. MU 17. SMi AS 6616 MMUM 543-e
Initial sbkalimo-4Calculated 33erlla
*aDiffracting Grain0- beach rill
3Wa-.
a to 29 3 40 so 6o 73Mal=SIu OS INAmf (call Speciles x 12 1t)
In Itial Slaalivei - Calculated Shoreline
**Diffractinug Grain351- beachr Shorl in
4E- 0(Ieau ua
ALOMGUUU C6UIff13 (cull apec lup Z M2ft
in a Caculated Mura11-a baamtem
...... Diffractilng Grain3W -M&~c Fill
u-t Nauwd Shun I in.
its12 125 139I 135 140 165 156 155 166MA=ALUmlm amnI (Cull Specalg 12 ft)
Figure Al14. Final Calibration simulation
A26Appendix A Case Design Example of Detached Breakwater

MV 111901 BFAWAV4 OM SII. SMa 1S. 3A 03* SM M,, M1V flLL
** Inifftia bamlm0*--4 &Vack Fil
I wIr
* is 21 33 41 so a 70uAmeinuu wolmnm (Call qaeclq = 12 it)
-UCalculated 3hoelins&v kuamtow
** Sffroctl4 Grain
r-e back Filrlla
31& -- - -
a&.
so 6i 78' IN lie 129 I13
ALONGHM CQUIVI1 (allcling *12It
Initial 3brullin
a-. acmlatgi w.1
30. ftack FillN-i flare 3borl lam
2w.
115 129 l 125 Ell 14li 1-6 156 155 lieM0099 COMBU~mI (call SWAfaiaf 12 It)
Figure A 15. Verification simulation
Appendix A Case Desugn Examnple of Detached Br'akwater A27

Conclusions
To date, the Bay Ridge offshore breakwater project has performed asexpected with the formation of subdued salients behind each breakwater andthe resulting overall stability of the shoreline. The project has been subjectedto numerous significant storm events and has prevented erosion of the bankarea and roadway along the project shoreline. No adverse effects have beenobserved along adjacent shoreline areas. The project has been well-receivedby the residents of the community as a result of the stability of the shorelineand the enhancement of the recreational beach area.
References
Ahrens, J.P. (1987). "Characteristics of reef breakwaters," Technical ReportCERC-87-17, U.S. Army Engineer Waterways Experiment Station, CoastalEngineering Research Center, Vicksburg, MS.
Ahrens, J. P., and Cox, J. (1990). "Design and performance of reefbreakwaters," Journal of Coastal Research, SI #7, pp 61-75.
Hanson, H., and Kraus, N.C. (1989). "GENESIS: Generalized model forsimulating shoreline change; Report 1, technical reference," Technical ReportCERC-89-19, U.S. Army Engineer Waterways Experiment Station, CoastalEngineering Research Center, Vicksburg, MS.
Kriebel, D.L., and Dean, R.G. (1985). "Beach and dune response to severestorms," Proceedings, 19th International Conference on Coastal Engineering,American Society of Civil Engineers, pp 1584-1599.
Pope, J., and Dean, J.L. (1986). "Development of design criteria forsegmented breakwaters," Proceedings, 20th International Conference onCoastal Engineering, November 9-14, Taipei, Taiwan. American Society ofCivil Engineers, pp 2144-2158.
Reid, R.O., and Bodine, B.R. (1968). "Numerical model for storm surges,Galveston Bay," Journal of the Waterways and Harbors Division, AmericanSociety of Civil Engineers, 94(WW1,5805) 33-57.
Shore Protection Manual. (1984). 4th ed., 2 Vols., U.S. Army EngineerWaterways Experiment Station, Coastal Engineering Research Center, U.S.Government Printing Office, Washington, D.C.
A28 Appendix A Case Design Example of Detached Breakwater

Appendix BNotation
a = Maximum indentation (headland design)
A = Empirical scale parameter that relates to the medianbeach grain size
A,, = Erosion area of cross-sectional profile
At = Area of breakwater cross section
b = Headland spacing
B. = Bulk number, A/rD 2
C' = Effective slope *as built*, A/hC2
C1b = Wave group speed at breaking
d = Depth at structure
dg = Depth at gap between adjacent breakwater segment
d, = Average water depth at the structure
d. = Depth at annual seaward limit of littoral zone
D = Water depth (equilibrium profile)
D5o = Mean grain size of material in project area
D,,50 = Nominal diameter, (Wso/p)1 3
g = Acceleration of gravity (9.81m/seW2)
h = Water depth at toe of structure
Applndix B Notation B

hesh Co= Armor crest level relative to seabed, after and before exposure towaves
H = Design wave height
Hb = Breaking wave height
Hi = Incident wave height
H, = Significant wave height, average of highest one-third of the waves
H, = Average of highest 1 percent of all waves, - 1.67 H,
H5 = Average of highest 5 percent of all waves, - 1.37 H,
HRO = Average of highest 10 percent of all waves, - 1.27 H,
H. = Significant wave height based on spectrum 4A[%
Ht = Transmitted wave height
H, = Deepwater wave height exceeded 12 hr/yr
Hg = Wave height at breakwater gap
I, = Beach response index
,,X2 = Empirical coefficients
KD = Stability coefficient
K, = Reflection coefficient of breakwater
Kt = H/Hi, wave transmission coefficient
K$. = Overtopping transmission coefficient
Ka = Through transmission coefficient
Kr = Through transmission coefficient
KT = Structure transmission value
L = Wavelength at structure
/.8 = Gap distance between adjacent breakwater segments
= Local wave length calculated with
L, = Breakwater segment length
B2 Appendix 8 Notation

N = Number of waves (storm duration)
N, - Stability number, HI/AD~w
N•: -= Spectral stability number, H./AD.50 a S-13
p = Sand porosity
P = Structure permeability coefficient
Pk, = Longshore energy flux factor
Q = Longshore transport rate
QN = Nat longshore transport rate
00 = Gross longshore transport rate
Qjt = Longshore transport moving to the right from an observer lookingseaward
Q4L = Longshore transport moving to the left from an observer lookingseaward
R = Correlation coefficient
RpR2 = Radii of the spiral curve (headland design)
Re = Crest freeboard, level of crest relative to still water
R; = Dimensionless freeboard, R/H, * (soa2r)0 "5
S = Ratio of sediment of fluid density (2.65)
S = Damage level, A/D),, 2
S, = Specific gravity of armor unit (pG/pW)
z = Fictitious wave steepness, 2TrH,/gT 2
T, = Wave period corresponding to H,
TP = Peak ws ---'• -r ;
Tz = Average wave period
w, = Unit weight of armor
W50 = Weight of the 50 percent size in the gradation
Appendix B Notation B3

W. - Weight of die individual armor unit
x = Lonbore coordinate (Chapter 3)
x = Percenile of armor stone less than the given weight(Chapter 4)
X = Breakwater segment distance from original shoreline
XS - Erosion/accretion opposite gap, measured from original shoreline
X, = Salientfombolo length in on-offshore direction measured fromoriginal shoreline
X = Effective distance offshore
y = Distance to structure from average shoreline
a = Constant angle between either radius R1 or R2 and its tangent to thecurve
= Predominant angle of wave approach
tan# = Average bottom slope from the shoreline to the depth ofactive longshore sand transport
A = Relative density, p&pw - 1
p. - Mass density of armor
PW = Mass density of water
jz = Surf similarity parameter
0 = Angle between radii R2 and R1 (headland design) (Chapter 2)
O = Angle of structure slope measured from horizontal (Chapter 4)
9b, = Angle of breaking waves to local shoreline
84 Appendix B Notation

REPORT DOCUMENTATION PAGE j o A~ovc
Pumi~reajgbwm o this CoAection of=nloqMato i siatdt avers"e 1 hour Per 'UO'is incluangl the Done #fo revmaiew ltuOie= sewctwiq existing date sources.= =hngan at.= ,g he datanee.ed"nitn n Feieig to: collection of infonulttion ae comeiirienatd lngti urdnetiate or any other awnec of this
colcinOf rlmaii. ncluding sgtofor redongthis burden. IQ Washington H~edQuarters Seisices. vcIrt.-nfWtormai on perations a"d Reports, 121S j1flenrDaisNgha. Suite I20M. 2rigtn V22024 30adt the office of Mianageaneint and Budget. Paperwork Reduction Project (0704-01041 Washington. DC 10503.
f.- AGENCY USE OLY (Leave blank) 2. RIEPORT DATE 3. REPORT TYPE AND DATES COVERED
4. TTLE ND UBTILE5. FUNDING NUMBERS
SaE Wiateo Srwaystxuries tsain ~sa iwn eer EOTNME
tera 399halstn JulenD Rosadi, Johnsbur. Mc 9l(ormiTcckclepr
I b e t , C oRa d ll e g t t c , T 7 4
7. PERFORMINGMORGNIZTIORNGGEC NAME(S ) AND ADOIESSOES) 10. SPORSORMING MORGNIZTIORN
L S E W te r a y s E x p rim n t ta t o n C o s ta E n in e rin R e e aA
G EP O TN C Y M RE PR T N M E
xashingt Univriy DCm Eninein314rasCiiEgne000CEC931
11. SUPPLEMENTARY NOTES
Available from National Technical Informaition. Service, 5285 Port Royal Road Springfield, VA 22161
12a. DISTRIBUTION / AVAILABILITY STATEMENT 12b. DISTRIBUTION CODE
Approved for public releas; distribution in unlimited.
13. ABSTRACT (Maximum 200 words)
Detachied breakwaters cmn be a viabe method of shorelie stabilization and protectio in the United States.Breakwaters can be designed to retard erosion of an existing beach, proumote natural sedimentation to form a new
beac, increase the longevity of a beach fill, and maintain a wide beach for storm damage reduction and recreation.Te combination of low-crested breakwaters and plante marsh grasses is increasingly being used to establishwetlands and control erosion along estuarine shorelines.
This report summarizes and presents the most recent functional and structural design guidance available fordetached breakwaters and provides examples of both prototype projects and the use of available tools to assist inbreakwater design. Functional design guidance presented includes a review of existing analytical techniques and
N. esign procedures, functional design considerations, and data requirements. The chapter on structural designgidance includes static and dynamic breakwate stability and methods to determine performance characteristics
such as transmission, reflection, and energy dissipation. Also included is a discussion of numerical and physicalmodling as tools for prediction of morphological response to detached breakwaters, and a case example of a
breakwater project designed and constructed at Bay Ridge, Maryland.
14. SUBJECT TERMS 1S. NUMBER OF PAGES167
Beach Stabilization Salient 16. PRICE CODEBreakwaters Tombolo17. SECURITY CLASSIFICATION 1S. SECURITY CLASSIFICATION 19. SECURITY CLASSIFICATION 20. LIMITATION OF ABSTRACT
OREOTOF THIS PAGE j OF ABSTRACTUNCLASSIFIED UNCLASSIFIED I _______
NSN 7540-01-280-5500 Standard Form 298 (Rev 2-89)Preicribed by ANSI Std £19-1B