Embed Size (px)
Citation preview
For updated information, please visit www.ibef.org September 2018
ENGINEERING AND
CAPITAL GOODS

Table of Content
Executive Summary……………….….……..3
Advantage India…………………..…..……..5
Market Overview …………………….……...7
Notable Trends and Strategies Adopted...18
Growth Drivers……………………..............21
Opportunities…….……….......………….…34
Useful Information……….......………….….42
Industry Associations……………....……...40
For updated information, please visit www.ibef.org Engineering and Capital goods 3
EXECUTIVE SUMMARY … (1/2)
Electrical equipment production (US$ billion)
27.3
100
0
50
100
150
2017-18 2022
E R&D (US$ billion)
28
45
0
10
20
30
40
50
FY18* 2020F
Capital goods turnover (US$ billion)
70.00
115.17
0
50
100
150
2017^ 2025F
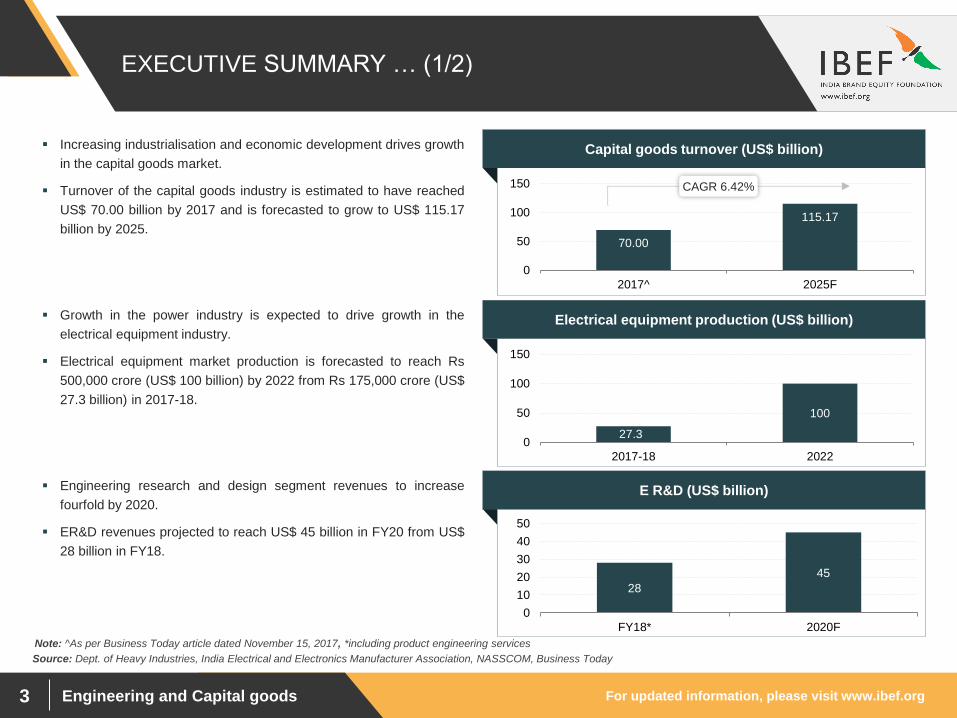
Increasing industrialisation and economic development drives growth
in the capital goods market.
Turnover of the capital goods industry is estimated to have reached
US$ 70.00 billion by 2017 and is forecasted to grow to US$ 115.17
billion by 2025.
Growth in the power industry is expected to drive growth in the
electrical equipment industry.
Electrical equipment market production is forecasted to reach Rs
500,000 crore (US$ 100 billion) by 2022 from Rs 175,000 crore (US$
27.3 billion) in 2017-18.
Engineering research and design segment revenues to increase
fourfold by 2020.
ER&D revenues projected to reach US$ 45 billion in FY20 from US$
28 billion in FY18.
CAGR 6.42%
Source: Dept. of Heavy Industries, India Electrical and Electronics Manufacturer Association, NASSCOM, Business Today
Note: ^As per Business Today article dated November 15, 2017, *including product engineering services
For updated information, please visit www.ibef.org Engineering and Capital goods 4
EXECUTIVE SUMMARY … (2/2)
Production by CPSEs under DHI (US$ billion)
6.0
3
4.8
8
5.1
5
5.3
2
5.7
6
0.00
2.00
4.00
6.00
8.00
FY15 FY16 FY17 FY18A FY19T
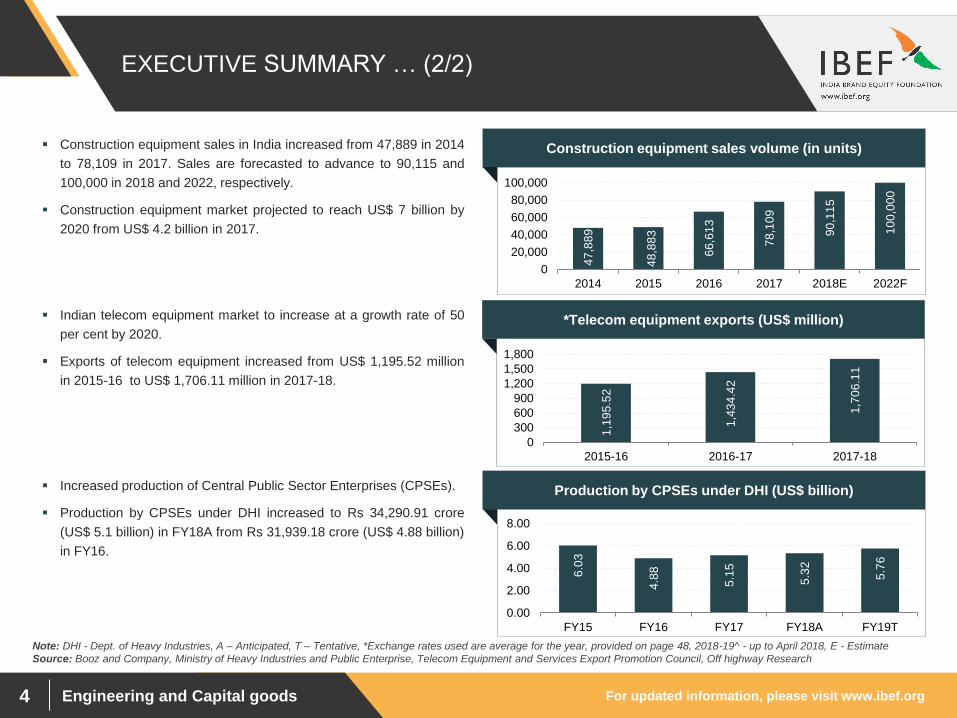
Construction equipment sales in India increased from 47,889 in 2014
to 78,109 in 2017. Sales are forecasted to advance to 90,115 and
100,000 in 2018 and 2022, respectively.
Construction equipment market projected to reach US$ 7 billion by
2020 from US$ 4.2 billion in 2017.
Indian telecom equipment market to increase at a growth rate of 50
per cent by 2020.
Exports of telecom equipment increased from US$ 1,195.52 million
in 2015-16 to US$ 1,706.11 million in 2017-18.
Increased production of Central Public Sector Enterprises (CPSEs).
Production by CPSEs under DHI increased to Rs 34,290.91 crore
(US$ 5.1 billion) in FY18A from Rs 31,939.18 crore (US$ 4.88 billion)
in FY16.
Note: DHI - Dept. of Heavy Industries, A – Anticipated, T – Tentative, *Exchange rates used are average for the year, provided on page 48, 2018-19^ - up to April 2018, E - Estimate
Source: Booz and Company, Ministry of Heavy Industries and Public Enterprise, Telecom Equipment and Services Export Promotion Council, Off highway Research
*Telecom equipment exports (US$ million)
1,1
95
.52
1,4
34
.42
1,7
06
.11
0
300
600
900
1,200
1,500
1,800
2015-16 2016-17 2017-18
Construction equipment sales volume (in units)
47
,88
9
48
,88
3
66
,61
3
78
,10
9
90
,11
5
10
0,0
00
0
20,000
40,000
60,000
80,000
100,000
2014 2015 2016 2017 2018E 2022F
Engineering and Capital goods
ADVANTAGE INDIA
For updated information, please visit www.ibef.org Engineering and Capital goods 6
ADVANTAGE INDIA
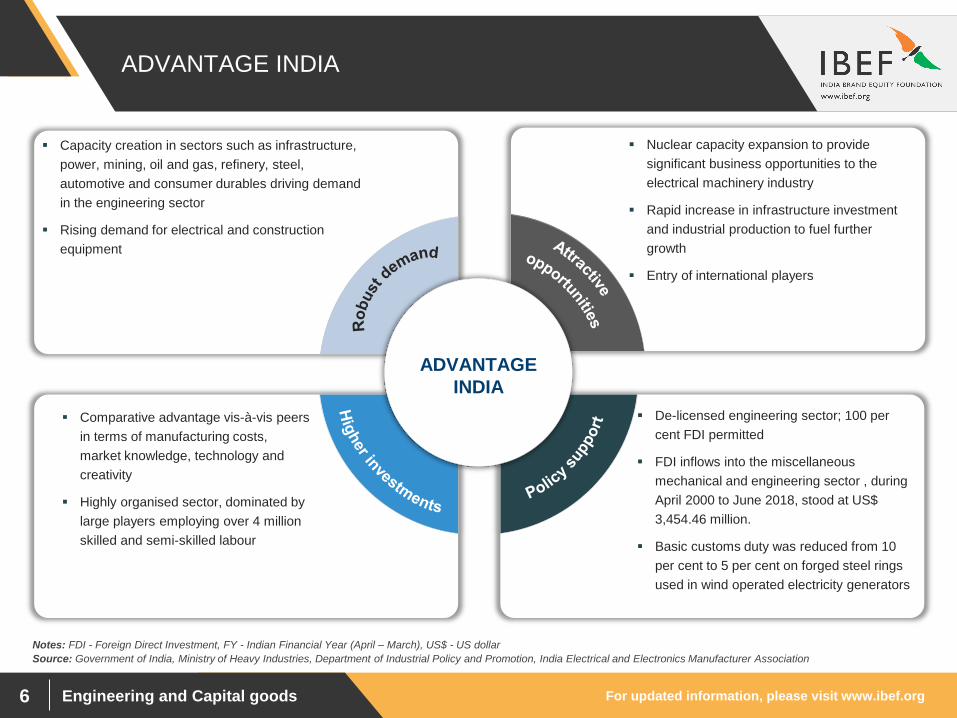
Capacity creation in sectors such as infrastructure,
power, mining, oil and gas, refinery, steel,
automotive and consumer durables driving demand
in the engineering sector
Rising demand for electrical and construction
equipment
Nuclear capacity expansion to provide
significant business opportunities to the
electrical machinery industry
Rapid increase in infrastructure investment
and industrial production to fuel further
growth
Entry of international players
Comparative advantage vis-à-vis peers
in terms of manufacturing costs,
market knowledge, technology and
creativity
Highly organised sector, dominated by
large players employing over 4 million
skilled and semi-skilled labour
De-licensed engineering sector; 100 per
cent FDI permitted
FDI inflows into the miscellaneous
mechanical and engineering sector , during
April 2000 to June 2018, stood at US$
3,454.46 million.
Basic customs duty was reduced from 10
per cent to 5 per cent on forged steel rings
used in wind operated electricity generators
ADVANTAGE
INDIA
Source: Government of India, Ministry of Heavy Industries, Department of Industrial Policy and Promotion, India Electrical and Electronics Manufacturer Association
Notes: FDI - Foreign Direct Investment, FY - Indian Financial Year (April – March), US$ - US dollar

Engineering and Capital goods
MARKET OVERVIEW
For updated information, please visit www.ibef.org Engineering and Capital goods 8
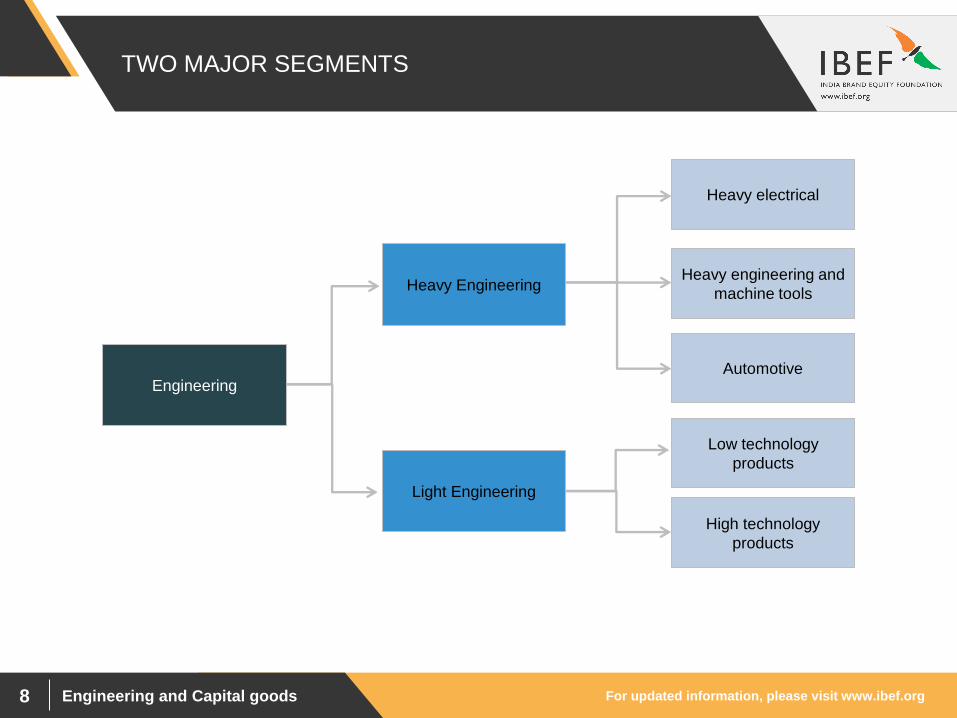
TWO MAJOR SEGMENTS
Engineering
Heavy Engineering
Light Engineering
Heavy electrical
Heavy engineering and
machine tools
Automotive
Low technology
products
High technology
products
For updated information, please visit www.ibef.org Engineering and Capital goods 9
HEAVY ENGINEERING – KEY SEGMENTS ... (1/2)
Source: Indian Machine Tool Manufacturers' Association, Textile Machinery Manufacturing Association, Cabinet Committee on Infrastructure report, ITMACH India
Notes: TPD - Tonnes Per Day, *As per latest data available
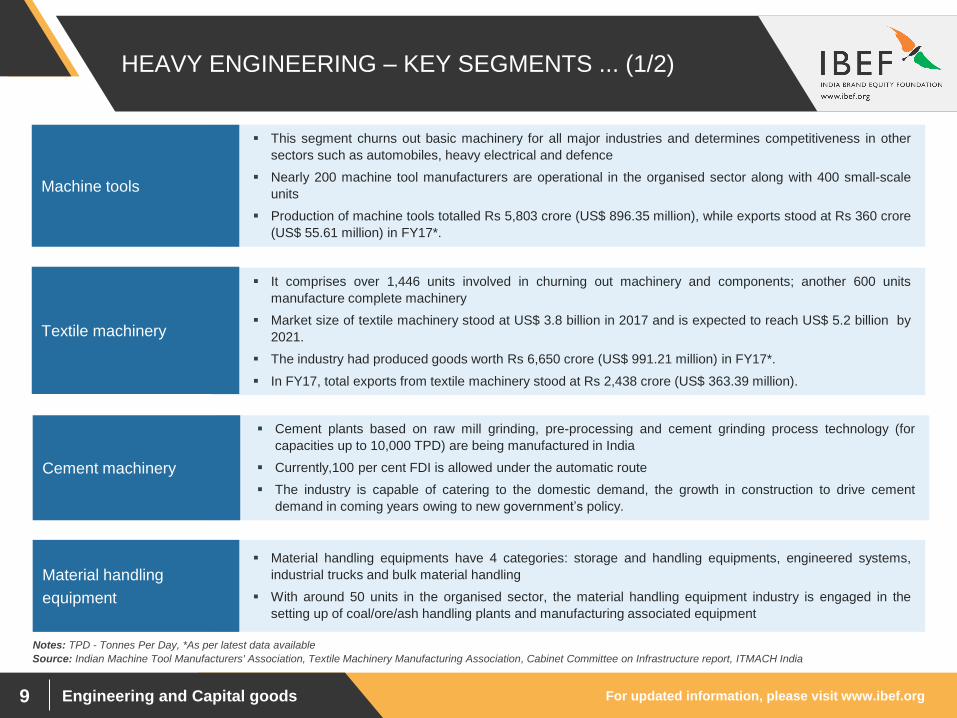
This segment churns out basic machinery for all major industries and determines competitiveness in other
sectors such as automobiles, heavy electrical and defence
Nearly 200 machine tool manufacturers are operational in the organised sector along with 400 small-scale
units
Production of machine tools totalled Rs 5,803 crore (US$ 896.35 million), while exports stood at Rs 360 crore
(US$ 55.61 million) in FY17*.
Machine tools
It comprises over 1,446 units involved in churning out machinery and components; another 600 units
manufacture complete machinery
Market size of textile machinery stood at US$ 3.8 billion in 2017 and is expected to reach US$ 5.2 billion by
2021.
The industry had produced goods worth Rs 6,650 crore (US$ 991.21 million) in FY17*.
In FY17, total exports from textile machinery stood at Rs 2,438 crore (US$ 363.39 million).
Textile machinery
Cement plants based on raw mill grinding, pre-processing and cement grinding process technology (for
capacities up to 10,000 TPD) are being manufactured in India
Currently,100 per cent FDI is allowed under the automatic route
The industry is capable of catering to the domestic demand, the growth in construction to drive cement
demand in coming years owing to new government’s policy.
Cement machinery
Material handling equipments have 4 categories: storage and handling equipments, engineered systems,
industrial trucks and bulk material handling
With around 50 units in the organised sector, the material handling equipment industry is engaged in the
setting up of coal/ore/ash handling plants and manufacturing associated equipment
Material handling
equipment
For updated information, please visit www.ibef.org Engineering and Capital goods 10
HEAVY ENGINEERING – KEY SEGMENTS ... (2/2)
Source: Ministry of Heavy Industries and Public Enterprise Annual Report 2012-13 and 2013-14, PLEX Council, Plastindia Foundation, Aranca Research
Note: Information is as per latest available data, *As per Plastindia Foundation estimates, E - Estimated
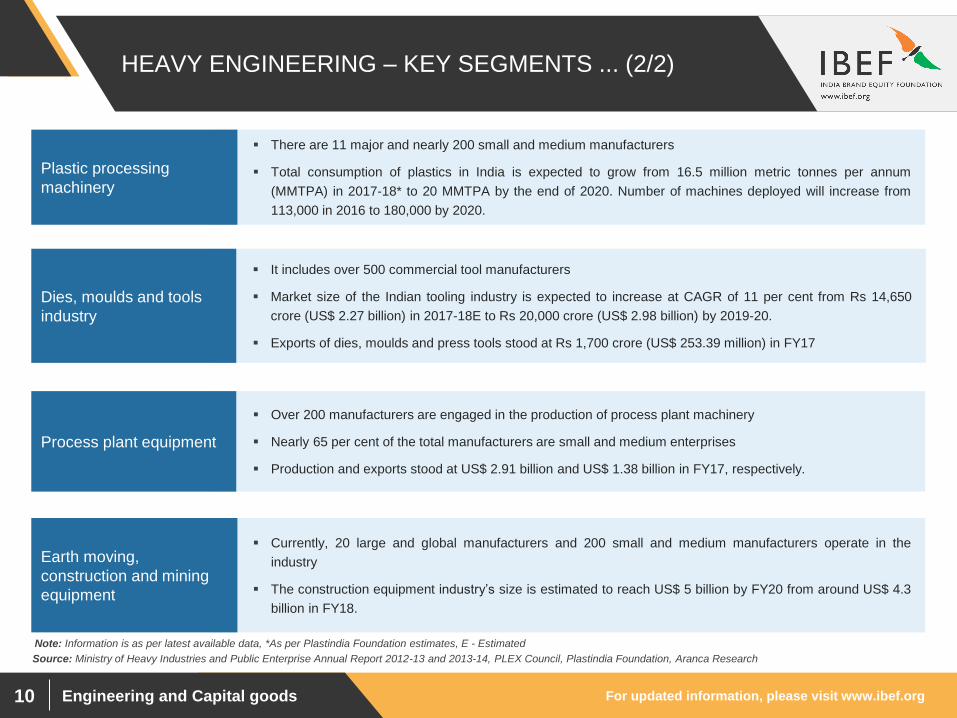
There are 11 major and nearly 200 small and medium manufacturers
Total consumption of plastics in India is expected to grow from 16.5 million metric tonnes per annum
(MMTPA) in 2017-18* to 20 MMTPA by the end of 2020. Number of machines deployed will increase from
113,000 in 2016 to 180,000 by 2020.
Plastic processing
machinery
It includes over 500 commercial tool manufacturers
Market size of the Indian tooling industry is expected to increase at CAGR of 11 per cent from Rs 14,650
crore (US$ 2.27 billion) in 2017-18E to Rs 20,000 crore (US$ 2.98 billion) by 2019-20.
Exports of dies, moulds and press tools stood at Rs 1,700 crore (US$ 253.39 million) in FY17
Dies, moulds and tools
industry
Over 200 manufacturers are engaged in the production of process plant machinery
Nearly 65 per cent of the total manufacturers are small and medium enterprises
Production and exports stood at US$ 2.91 billion and US$ 1.38 billion in FY17, respectively.
Process plant equipment
Currently, 20 large and global manufacturers and 200 small and medium manufacturers operate in the
industry
The construction equipment industry’s size is estimated to reach US$ 5 billion by FY20 from around US$ 4.3
billion in FY18.
Earth moving,
construction and mining
equipment
For updated information, please visit www.ibef.org Engineering and Capital goods 11
LIGHT ENGINEERING – KEY SEGMENTS
Source: Ministry of Heavy Industries and Public Enterprise Annual Report, Association of Indian Forging Industry (AIFI), IVG Research, Aranca Research
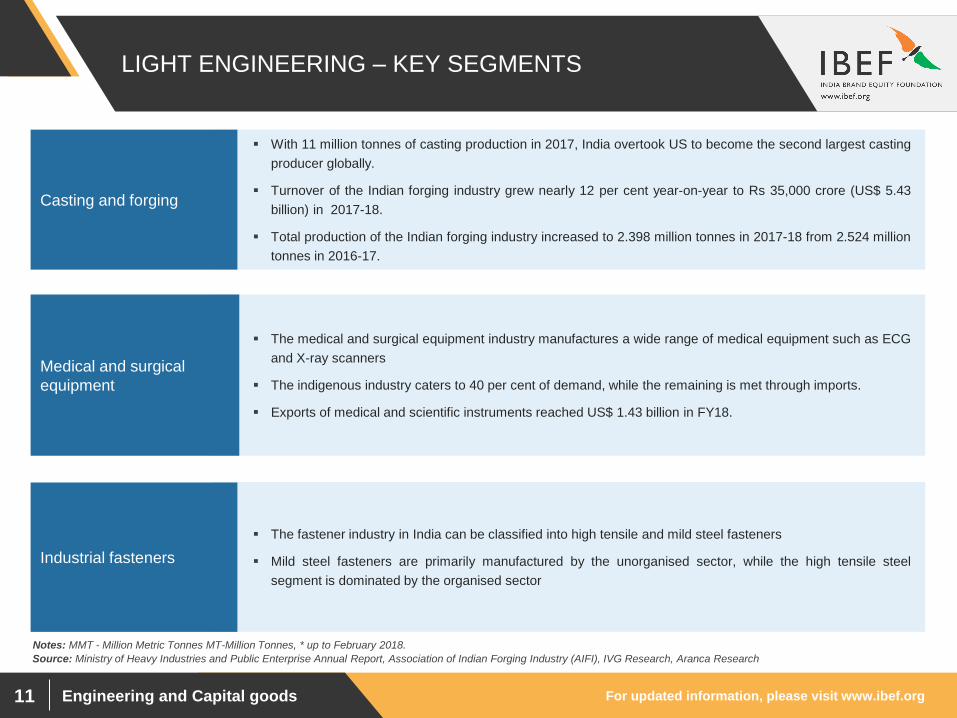
The fastener industry in India can be classified into high tensile and mild steel fasteners
Mild steel fasteners are primarily manufactured by the unorganised sector, while the high tensile steel
segment is dominated by the organised sector
Notes: MMT - Million Metric Tonnes MT-Million Tonnes, * up to February 2018.
With 11 million tonnes of casting production in 2017, India overtook US to become the second largest casting
producer globally.
Turnover of the Indian forging industry grew nearly 12 per cent year-on-year to Rs 35,000 crore (US$ 5.43
billion) in 2017-18.
Total production of the Indian forging industry increased to 2.398 million tonnes in 2017-18 from 2.524 million
tonnes in 2016-17.
Casting and forging
The medical and surgical equipment industry manufactures a wide range of medical equipment such as ECG
and X-ray scanners
The indigenous industry caters to 40 per cent of demand, while the remaining is met through imports.
Exports of medical and scientific instruments reached US$ 1.43 billion in FY18.
Medical and surgical
equipment
Industrial fasteners
For updated information, please visit www.ibef.org Engineering and Capital goods 12
HEAVY ELECTRICAL – KEY SEGMENTS
Source: Ministry of Heavy Industries and Public Enterprise Annual Report, Aranca Research
Notes: MW - Mega Watt, KVA - KiloVolt - Ampere
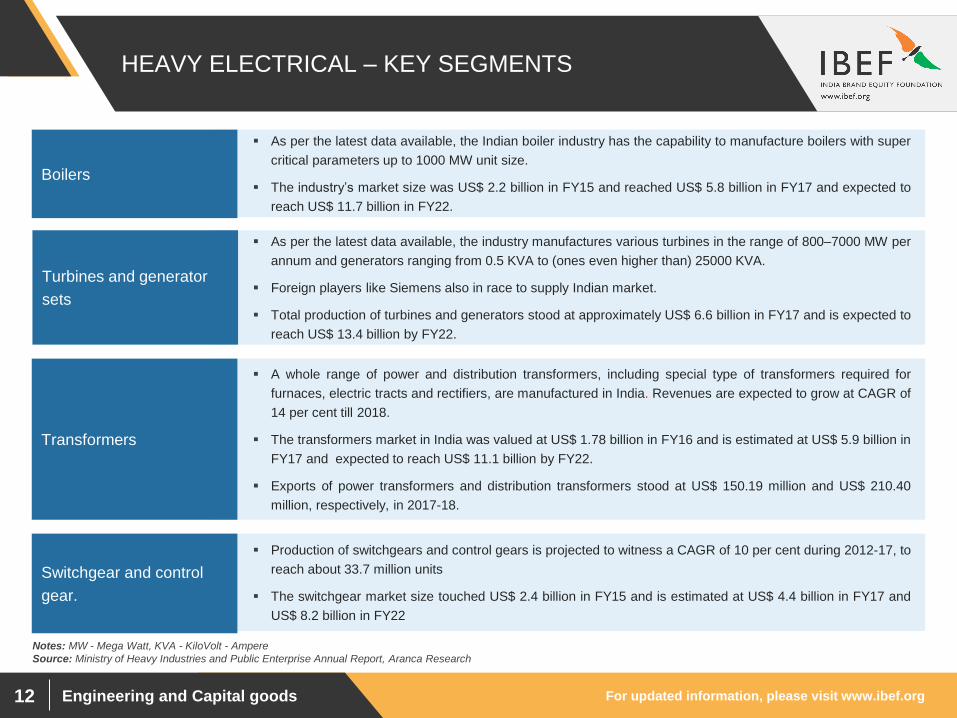
As per the latest data available, the Indian boiler industry has the capability to manufacture boilers with super
critical parameters up to 1000 MW unit size.
The industry’s market size was US$ 2.2 billion in FY15 and reached US$ 5.8 billion in FY17 and expected to
reach US$ 11.7 billion in FY22.
Boilers
As per the latest data available, the industry manufactures various turbines in the range of 800–7000 MW per
annum and generators ranging from 0.5 KVA to (ones even higher than) 25000 KVA.
Foreign players like Siemens also in race to supply Indian market.
Total production of turbines and generators stood at approximately US$ 6.6 billion in FY17 and is expected to
reach US$ 13.4 billion by FY22.
Turbines and generator
sets
A whole range of power and distribution transformers, including special type of transformers required for
furnaces, electric tracts and rectifiers, are manufactured in India. Revenues are expected to grow at CAGR of
14 per cent till 2018.
The transformers market in India was valued at US$ 1.78 billion in FY16 and is estimated at US$ 5.9 billion in
FY17 and expected to reach US$ 11.1 billion by FY22.
Exports of power transformers and distribution transformers stood at US$ 150.19 million and US$ 210.40
million, respectively, in 2017-18.
Transformers
Production of switchgears and control gears is projected to witness a CAGR of 10 per cent during 2012-17, to
reach about 33.7 million units
The switchgear market size touched US$ 2.4 billion in FY15 and is estimated at US$ 4.4 billion in FY17 and
US$ 8.2 billion in FY22
Switchgear and control
gear.
For updated information, please visit www.ibef.org Engineering and Capital goods 13
AUTOMOTIVE – KEY SEGMENTS
Source: Ministry of Heavy Industries and Public Enterprise Annual Report, SIAM, Cabinet Committee on Infrastructure report, ACMA, Aranca Research
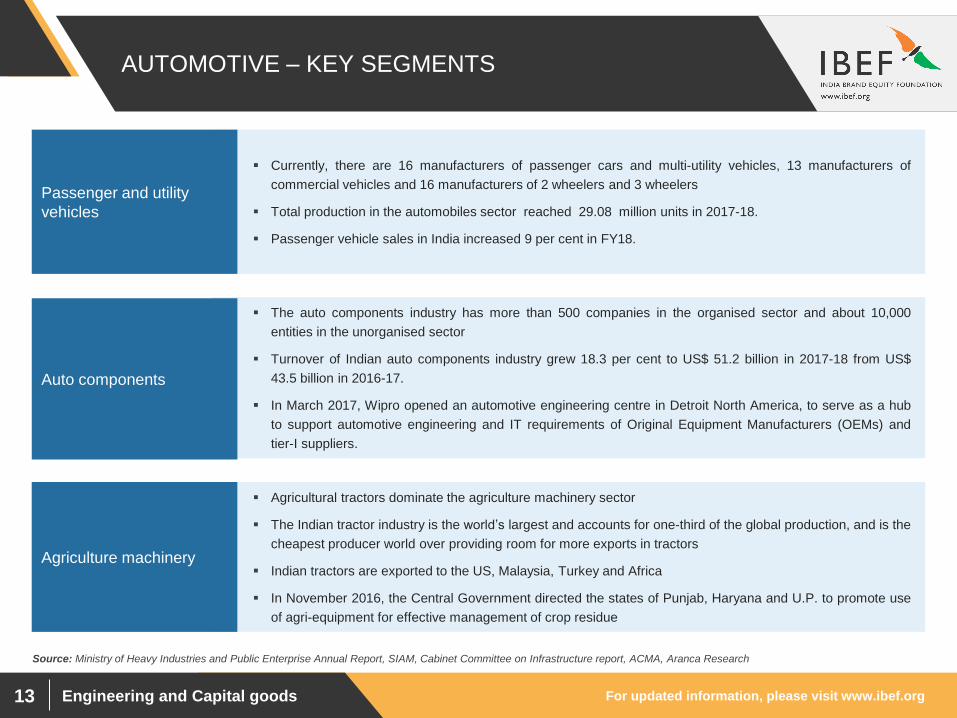
Currently, there are 16 manufacturers of passenger cars and multi-utility vehicles, 13 manufacturers of
commercial vehicles and 16 manufacturers of 2 wheelers and 3 wheelers
Total production in the automobiles sector reached 29.08 million units in 2017-18.
Passenger vehicle sales in India increased 9 per cent in FY18.
Passenger and utility
vehicles
The auto components industry has more than 500 companies in the organised sector and about 10,000
entities in the unorganised sector
Turnover of Indian auto components industry grew 18.3 per cent to US$ 51.2 billion in 2017-18 from US$
43.5 billion in 2016-17.
In March 2017, Wipro opened an automotive engineering centre in Detroit North America, to serve as a hub
to support automotive engineering and IT requirements of Original Equipment Manufacturers (OEMs) and
tier-I suppliers.
Auto components
Agricultural tractors dominate the agriculture machinery sector
The Indian tractor industry is the world’s largest and accounts for one-third of the global production, and is the
cheapest producer world over providing room for more exports in tractors
Indian tractors are exported to the US, Malaysia, Turkey and Africa
In November 2016, the Central Government directed the states of Punjab, Haryana and U.P. to promote use
of agri-equipment for effective management of crop residue
Agriculture machinery
For updated information, please visit www.ibef.org Engineering and Capital goods 14
ROBUST GROWTH IN INDIA’S ENGINEERING
EXPORTS OVER THE YEARS
33
.70
40
.50
32
.60
49
.80
58
.60
56
.80
61
.60
70
.60
58
.80
65
.23
76
.20
33
.56
0.0
10.0
20.0
30.0
40.0
50.0
60.0
70.0
80.0
90.0
FY
08
FY
09
FY
10
FY
11
FY
12
FY
13
FY
14
FY
15
FY
16
FY
17
FY
18
FY
19*
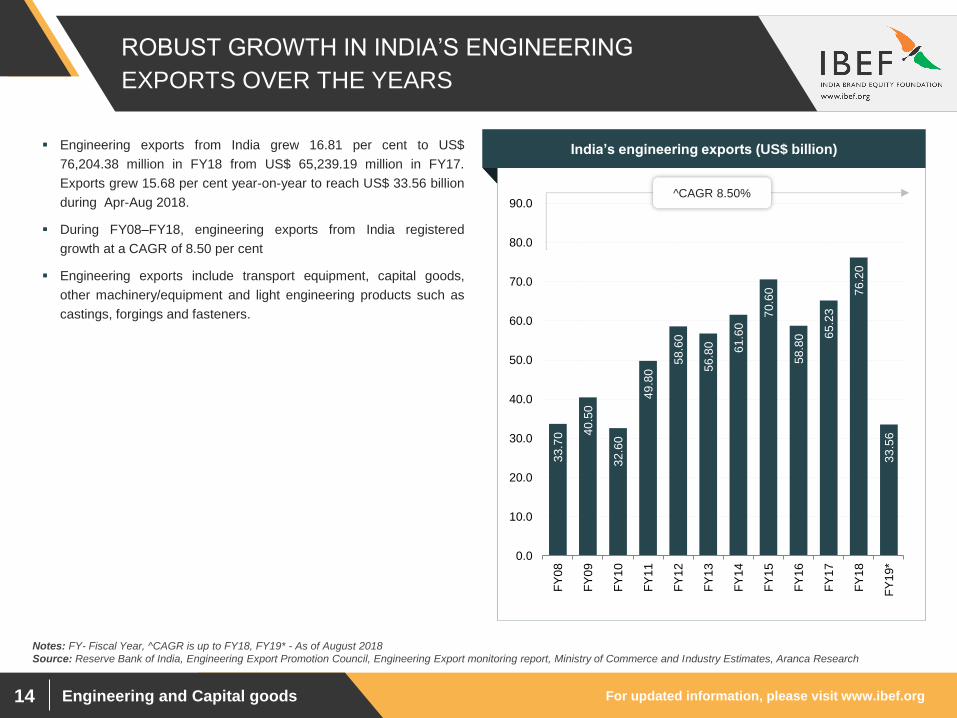
Engineering exports from India grew 16.81 per cent to US$
76,204.38 million in FY18 from US$ 65,239.19 million in FY17.
Exports grew 15.68 per cent year-on-year to reach US$ 33.56 billion
during Apr-Aug 2018.
During FY08–FY18, engineering exports from India registered
growth at a CAGR of 8.50 per cent
Engineering exports include transport equipment, capital goods,
other machinery/equipment and light engineering products such as
castings, forgings and fasteners.
Visakhapatnam port traffic (million tonnes) India’s engineering exports (US$ billion)
^CAGR 8.50%
Notes: FY- Fiscal Year, ^CAGR is up to FY18, FY19* - As of August 2018
Source: Reserve Bank of India, Engineering Export Promotion Council, Engineering Export monitoring report, Ministry of Commerce and Industry Estimates, Aranca Research
For updated information, please visit www.ibef.org Engineering and Capital goods 15
KEY CATEGORIES OF ENGINEERING EXPORTS
23.59%
20.59%
16.56%
13.37%
10.08%
8.79%
4.04% 2.97%
Iron and Steel and Productsmade of Iron and Steel
Automobiles
Industrial Machinery
Non-Ferrous Metals andProducts made of Non-FerrousMetals
Other engineering products
Electrical Machinery
Ships Boats and Floatingproducts and parts
Aircrafts and Spacecraft partsand products
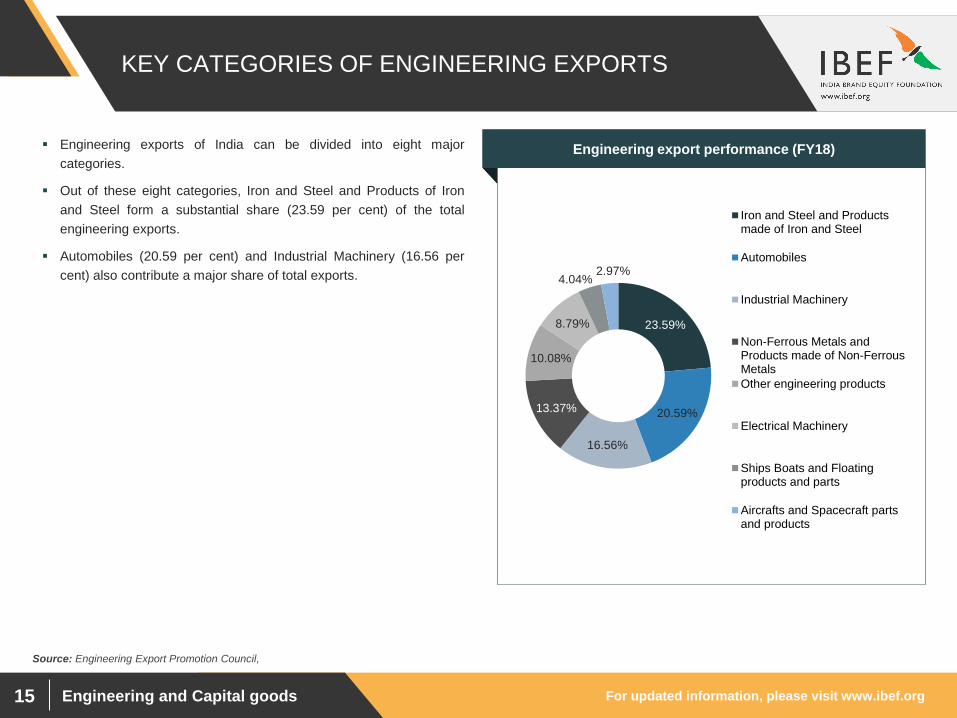
Engineering exports of India can be divided into eight major
categories.
Out of these eight categories, Iron and Steel and Products of Iron
and Steel form a substantial share (23.59 per cent) of the total
engineering exports.
Automobiles (20.59 per cent) and Industrial Machinery (16.56 per
cent) also contribute a major share of total exports.
Visakhapatnam port traffic (million tonnes) Engineering export performance (FY18)
Source: Engineering Export Promotion Council,
For updated information, please visit www.ibef.org Engineering and Capital goods 16
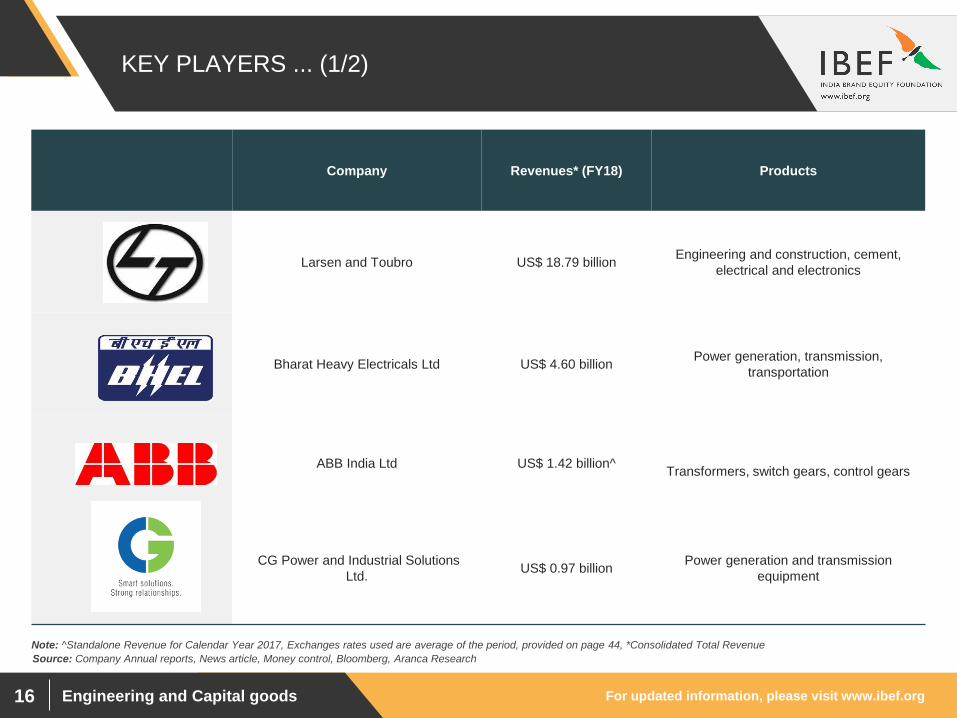
KEY PLAYERS ... (1/2)
Company Revenues* (FY18) Products
Larsen and Toubro US$ 18.79 billion Engineering and construction, cement,
electrical and electronics
Bharat Heavy Electricals Ltd US$ 4.60 billion Power generation, transmission,
transportation
ABB India Ltd US$ 1.42 billion^
Transformers, switch gears, control gears
CG Power and Industrial Solutions
Ltd. US$ 0.97 billion
Power generation and transmission
equipment
Source: Company Annual reports, News article, Money control, Bloomberg, Aranca Research
Note: ^Standalone Revenue for Calendar Year 2017, Exchanges rates used are average of the period, provided on page 44, *Consolidated Total Revenue
For updated information, please visit www.ibef.org Engineering and Capital goods 17
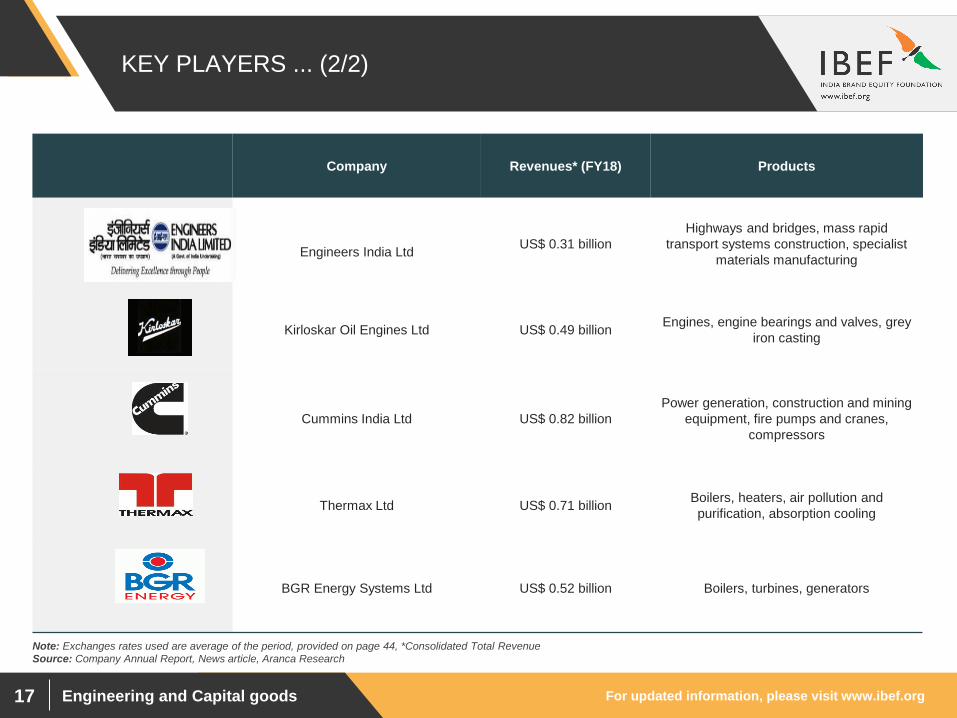
KEY PLAYERS ... (2/2)
Company Revenues* (FY18) Products
Engineers India Ltd US$ 0.31 billion
Highways and bridges, mass rapid
transport systems construction, specialist
materials manufacturing
Kirloskar Oil Engines Ltd US$ 0.49 billion Engines, engine bearings and valves, grey
iron casting
Cummins India Ltd US$ 0.82 billion
Power generation, construction and mining
equipment, fire pumps and cranes,
compressors
Thermax Ltd US$ 0.71 billion Boilers, heaters, air pollution and
purification, absorption cooling
BGR Energy Systems Ltd US$ 0.52 billion Boilers, turbines, generators
Source: Company Annual Report, News article, Aranca Research
Note: Exchanges rates used are average of the period, provided on page 44, *Consolidated Total Revenue
For updated information, please visit www.ibef.org Engineering and Capital goods 18
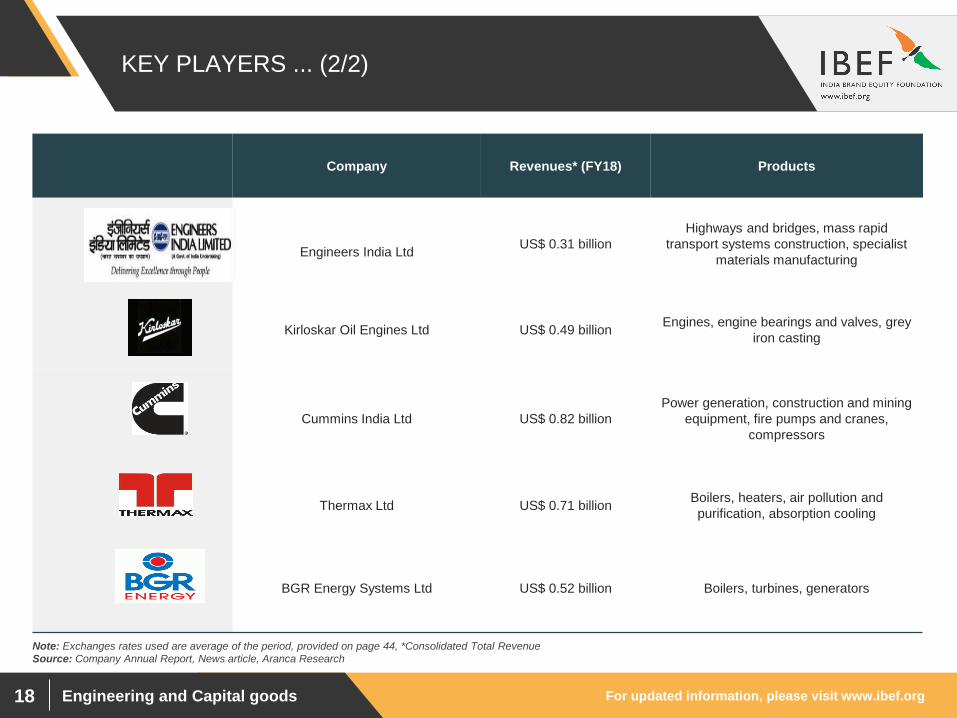
KEY PLAYERS ... (2/2)
Company Revenues* (FY18) Products
Engineers India Ltd US$ 0.31 billion
Highways and bridges, mass rapid
transport systems construction, specialist
materials manufacturing
Kirloskar Oil Engines Ltd US$ 0.49 billion Engines, engine bearings and valves, grey
iron casting
Cummins India Ltd US$ 0.82 billion
Power generation, construction and mining
equipment, fire pumps and cranes,
compressors
Thermax Ltd US$ 0.71 billion Boilers, heaters, air pollution and
purification, absorption cooling
BGR Energy Systems Ltd US$ 0.52 billion Boilers, turbines, generators
Source: Company Annual Report, News article, Aranca Research
Note: Exchanges rates used are average of the period, provided on page 44, *Consolidated Total Revenue
Engineering and Capital goods
NOTABLE TRENDS
STRATEGIES
ADOPTED
For updated information, please visit www.ibef.org Engineering and Capital goods 20
NOTABLE TRENDS IN THE INDUSTRY
Source: Aranca Research
Notes: BHEL - Bharat Heavy Electricals Ltd
Several companies in the engineering sector have diversified, either geographically (mainly to Middle Eastern
countries) or sector-wise
BHEL plans to foray into Ukraine
Simplex Infra has moved to the Middle East
Larsen and Toubro (L&T) has diversified into power equipment manufacturing
Thermax entered the power utility segment
Diversification
Rising competition is driving domestic players to focus on improving their capabilities, become more quality
conscious and upgrade their technology base in line with global requirements
More than 2,500 firms in the engineering sector have ISO 9000 accreditation
Companies are increasingly focusing on R and D and product development
To enhance competitiveness in India’s capital goods industry, the Dept. of Heavy Industry has approved 4
Centres of Excellence in textile machinery, machine tools, welding technology and smart pumps.
Shift to value-added
products
With 100 per cent FDI allowed through the automatic route, major international players such as Cummins,
ABB and Alfa Laval have entered the Indian engineering sector due to growth opportunities
As of May 2018, Larsen & Toubro is going to sell its electrical and automation business to Schneider Electric
for a consideration of Rs 14,000 crore (US$ 2.17 billion).
In September 2017, Force Motors Ltd entered into a joint venture (JV) with Rolls Royce Power Systems AG
to form an Indian company which will manufacture engines for power generation and rail application.
As of September 2017, with an aim to increase its presence in India, Denmark-based heating ventilation and
air-conditioning (HVAC) giant, Danfoss, is planning to take its manufacturing localisation to 50 per cent as
well as double its supplier base in India by 2020.
Entry of international
companies

For updated information, please visit www.ibef.org Engineering and Capital goods 21
STRATEGIES ADOPTED
Source: Aranca Research, KPMG Report on Engineering sector
Bigger companies are currently focusing on process improvement and a smaller set of key strategies
ABB has set up global R&D centre in Bengaluru and is also aiming at making India as production hub for
markets worldwide due to its labour cost advantage
Cummins has also opened R&D centre in Pune, for providing designing and technical abilities worldwide
Leveraging Indian
operations
Companies are understanding the need of operations management following the crisis period
Good set of operational structure in place helps them target future business opportunities with better
precision
There is emphasis on human resource management, automation and higher labour productivity
Operational efficiency
Most Indian companies are increasing their global footprints
Cheap cost of labour in India is giving them an edge over companies in higher wage economies
Besides targeting the developed economies of Europe and US, Indian companies are currently diversifying in
the developing markets of Africa, South America and the Middle East
Geographical expansion
Many companies are collaborating with institutions for developing skilled manpower for the highly technical
engineering sector.
In June 2017, Schneider Electric signed an MoU with Kalinga Institute of Technology (KIIT) and CV Raman
College of Engineering in Odisha for training students to enhance their engineering skills.
Skill Improvement
In April 2017, the government divested 10 per cent stake in the National Aluminium Company (NALCO) for
the cost of US$ 193.37 million. PSU Stake Sale

Engineering and Capital goods
GROWTH DRIVERS

For updated information, please visit www.ibef.org Engineering and Capital goods 23
GROWTH DRIVERS FOR THE INDIAN ENGINEERING
SECTOR
Growth drivers
Demand-side drivers
Investment Policy
De-licensing
Reduction in tariff and
customs
Supportive government
policies leading to
higher investments
Increasing FDI inflows
Higher M&A
Easy credit facilities for
manufacturing
companies
Capacity addition for
power generation
Increase in
infrastructure spending
Rise in exports which
touched US$ 76.20
billion during FY18

For updated information, please visit www.ibef.org Engineering and Capital goods 24
CAPACITY AUGMENTATION BOOSTS DEMAND ... (1/2)
69
0.5
9
73
9.3
5
77
7.0
4
83
0.5
9
86
1.5
9
93
7.2
0
99
8.1
1
1,0
02
.26
1,0
67
.09
1,1
14
.24
1,1
42
.09
1,2
12
.13
43
6.1
4
0
200
400
600
800
1000
1200
1400
During FY07-18, India’s energy requirement grew at a CAGR of 5.24
per cent, with the energy requirement reaching to 1,212.13 billion
units in FY18. Energy requirement during Apr-Jul 2018 stood at
216.29 billion units.
India’s share of global energy demand is expected to rise to 9 per
cent by 2035.
Higher demand for energy has led to increasing capacity additions
for power generation that, in turn, boosted demand for power
generation and transmission equipment
Visakhapatnam port traffic (million tonnes) Energy requirement (BU)
CAGR 5.24%
Notes: BU - Billion Unit CEA - Central Electrical Authority, FY19* - up to July 2018
Source: CEA, Ministry of Power Annual Report, Load Generation Balance Report 2014-15, Aranca Research
For updated information, please visit www.ibef.org Engineering and Capital goods 25
CAPACITY AUGMENTATION BOOSTS DEMAND ... (2/2)
11
.43
14
.23
26
.25
23
.47
25
.21
26
.35
30
.26
21
.67
17
.17
0.00
5.00
10.00
15.00
20.00
25.00
30.00
35.00
FY10 FY11 FY12 FY13 FY14 FY15 FY16 FY17 FY18
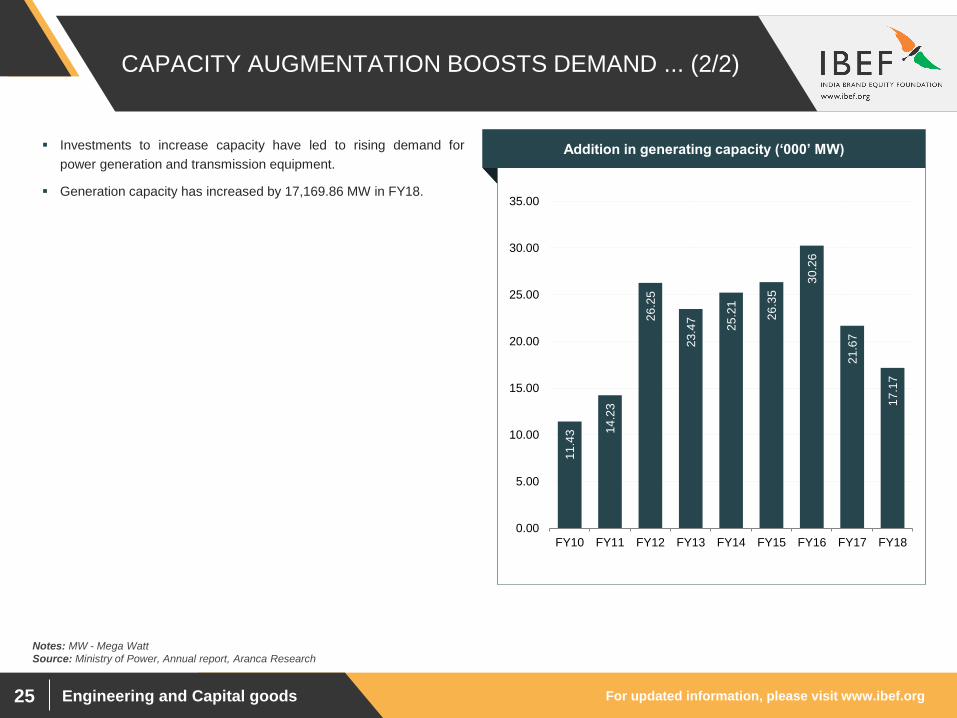
Investments to increase capacity have led to rising demand for
power generation and transmission equipment.
Generation capacity has increased by 17,169.86 MW in FY18.
Visakhapatnam port traffic (million tonnes) Addition in generating capacity (‘000’ MW)
Notes: MW - Mega Watt
Source: Ministry of Power, Annual report, Aranca Research
For updated information, please visit www.ibef.org Engineering and Capital goods 26
INFRASTRUCTURE, ONE OF THE KEY DEMAND
DRIVERS FOR MACHINERY... (1/2)
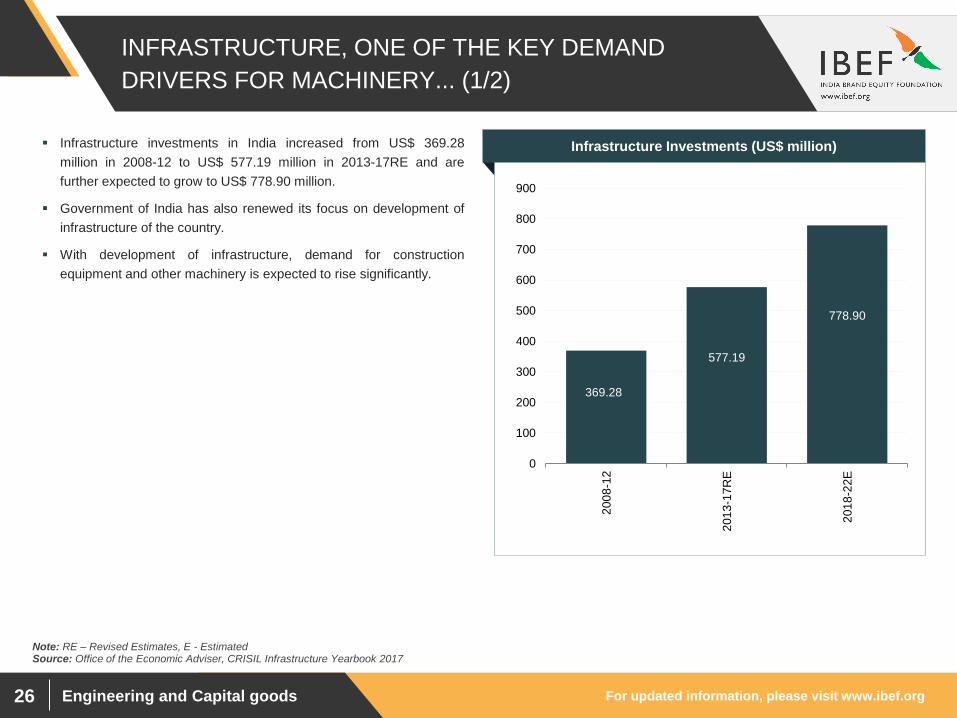
Infrastructure investments in India increased from US$ 369.28
million in 2008-12 to US$ 577.19 million in 2013-17RE and are
further expected to grow to US$ 778.90 million.
Government of India has also renewed its focus on development of
infrastructure of the country.
With development of infrastructure, demand for construction
equipment and other machinery is expected to rise significantly.
Source: Office of the Economic Adviser, CRISIL Infrastructure Yearbook 2017
369.28
577.19
778.90
0
100
200
300
400
500
600
700
800
900
200
8-1
2
201
3-1
7R
E
201
8-2
2E
Infrastructure Investments (US$ million)
Note: RE – Revised Estimates, E - Estimated
For updated information, please visit www.ibef.org Engineering and Capital goods 27
INFRASTRUCTURE, ONE OF THE KEY DEMAND
DRIVERS FOR MACHINERY... (2/2)
Note: 2018-19* - up to June 2018
Source: National Highway Authority of India, Ministry of Road Transport and Highways, Aranca Research
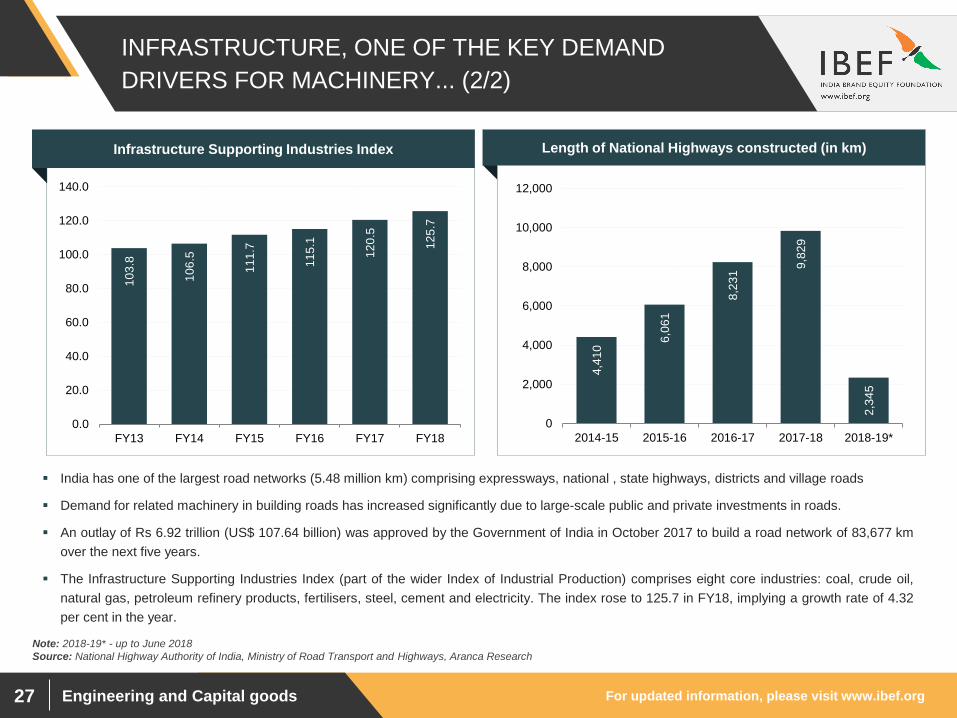
India has one of the largest road networks (5.48 million km) comprising expressways, national , state highways, districts and village roads
Demand for related machinery in building roads has increased significantly due to large-scale public and private investments in roads.
An outlay of Rs 6.92 trillion (US$ 107.64 billion) was approved by the Government of India in October 2017 to build a road network of 83,677 km
over the next five years.
The Infrastructure Supporting Industries Index (part of the wider Index of Industrial Production) comprises eight core industries: coal, crude oil,
natural gas, petroleum refinery products, fertilisers, steel, cement and electricity. The index rose to 125.7 in FY18, implying a growth rate of 4.32
per cent in the year.
Length of National Highways constructed (in km)
4,4
10
6,0
61
8,2
31
9,8
29
2,3
45
0
2,000
4,000
6,000
8,000
10,000
12,000
2014-15 2015-16 2016-17 2017-18 2018-19*
10
3.8
10
6.5
11
1.7
11
5.1
12
0.5
12
5.7
0.0
20.0
40.0
60.0
80.0
100.0
120.0
140.0
FY13 FY14 FY15 FY16 FY17 FY18
Infrastructure Supporting Industries Index
For updated information, please visit www.ibef.org Engineering and Capital goods 28
STRONG POLICY SUPPORT CRUCIAL FOR THE
SECTOR…(1/2)
Source: DHI Annual Report, Ministry of Power Annual Report, Make in India, Aranca Research
Notes: GW - Giga Watt
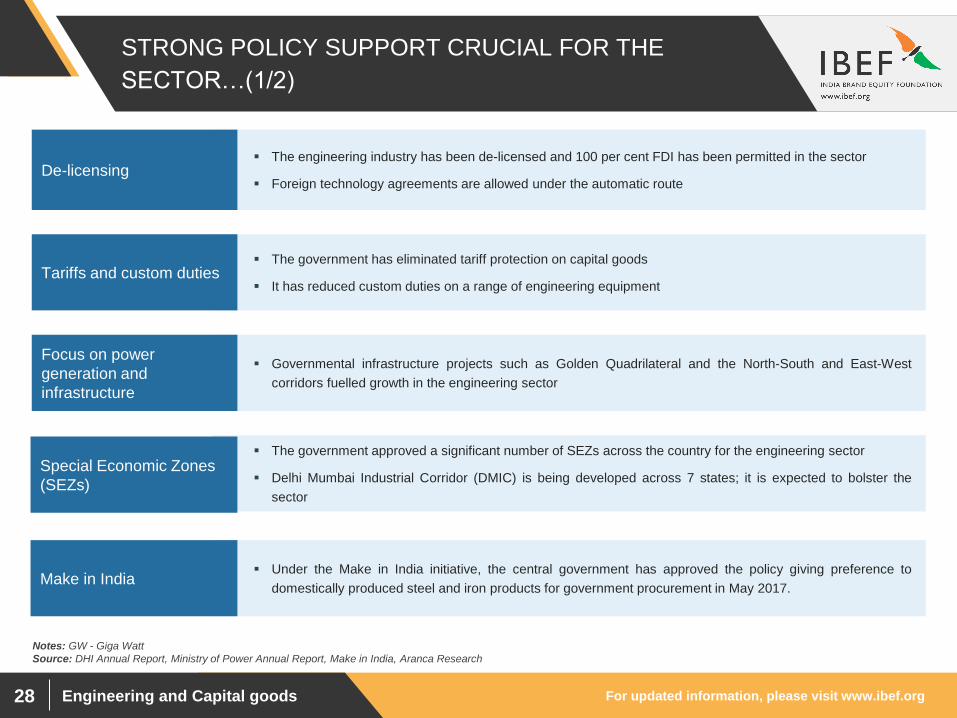
The engineering industry has been de-licensed and 100 per cent FDI has been permitted in the sector
Foreign technology agreements are allowed under the automatic route De-licensing
The government has eliminated tariff protection on capital goods
It has reduced custom duties on a range of engineering equipment Tariffs and custom duties
Governmental infrastructure projects such as Golden Quadrilateral and the North-South and East-West
corridors fuelled growth in the engineering sector
Focus on power
generation and
infrastructure
The government approved a significant number of SEZs across the country for the engineering sector
Delhi Mumbai Industrial Corridor (DMIC) is being developed across 7 states; it is expected to bolster the
sector
Special Economic Zones
(SEZs)
Under the Make in India initiative, the central government has approved the policy giving preference to
domestically produced steel and iron products for government procurement in May 2017. Make in India
For updated information, please visit www.ibef.org Engineering and Capital goods 29
STRONG POLICY SUPPORT CRUCIAL FOR THE
SECTOR…(2/2)
Source: Union Budget FY14, Union Budget 2018-19
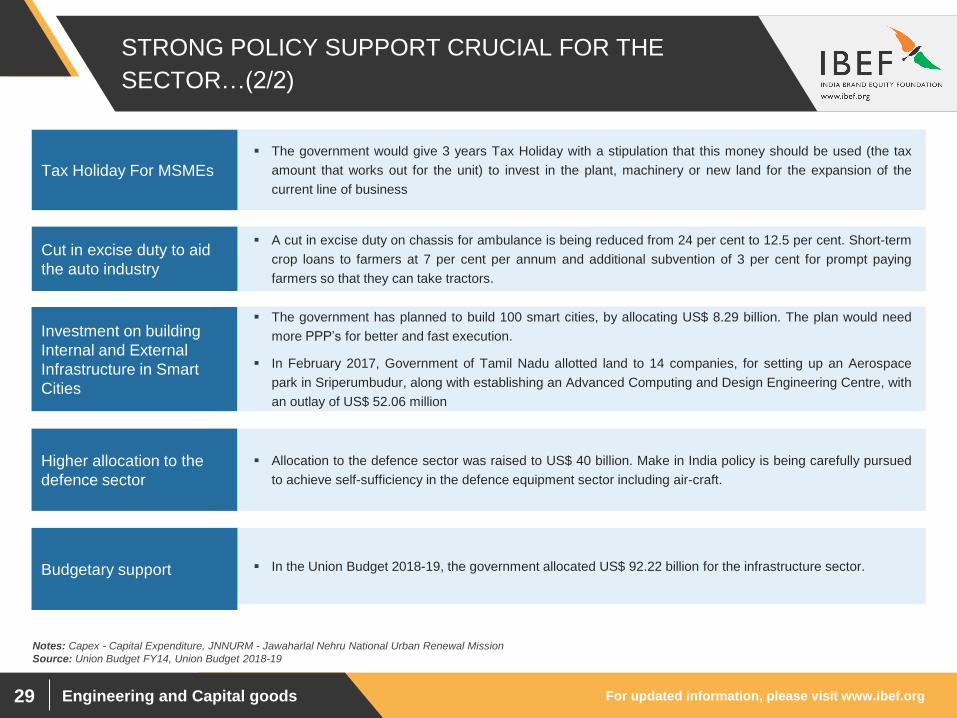
A cut in excise duty on chassis for ambulance is being reduced from 24 per cent to 12.5 per cent. Short-term
crop loans to farmers at 7 per cent per annum and additional subvention of 3 per cent for prompt paying
farmers so that they can take tractors.
The government has planned to build 100 smart cities, by allocating US$ 8.29 billion. The plan would need
more PPP’s for better and fast execution.
In February 2017, Government of Tamil Nadu allotted land to 14 companies, for setting up an Aerospace
park in Sriperumbudur, along with establishing an Advanced Computing and Design Engineering Centre, with
an outlay of US$ 52.06 million
Allocation to the defence sector was raised to US$ 40 billion. Make in India policy is being carefully pursued
to achieve self-sufficiency in the defence equipment sector including air-craft.
In the Union Budget 2018-19, the government allocated US$ 92.22 billion for the infrastructure sector.
Notes: Capex - Capital Expenditure, JNNURM - Jawaharlal Nehru National Urban Renewal Mission
The government would give 3 years Tax Holiday with a stipulation that this money should be used (the tax
amount that works out for the unit) to invest in the plant, machinery or new land for the expansion of the
current line of business
Tax Holiday For MSMEs
Cut in excise duty to aid
the auto industry
Investment on building
Internal and External
Infrastructure in Smart
Cities
Higher allocation to the
defence sector
Budgetary support
For updated information, please visit www.ibef.org Engineering and Capital goods 30
SPECIAL ECONOMIC ZONES (SEZs) TO PROMOTE
EXPORTS ... (1/3)
Source: SEZ India, Aranca Research
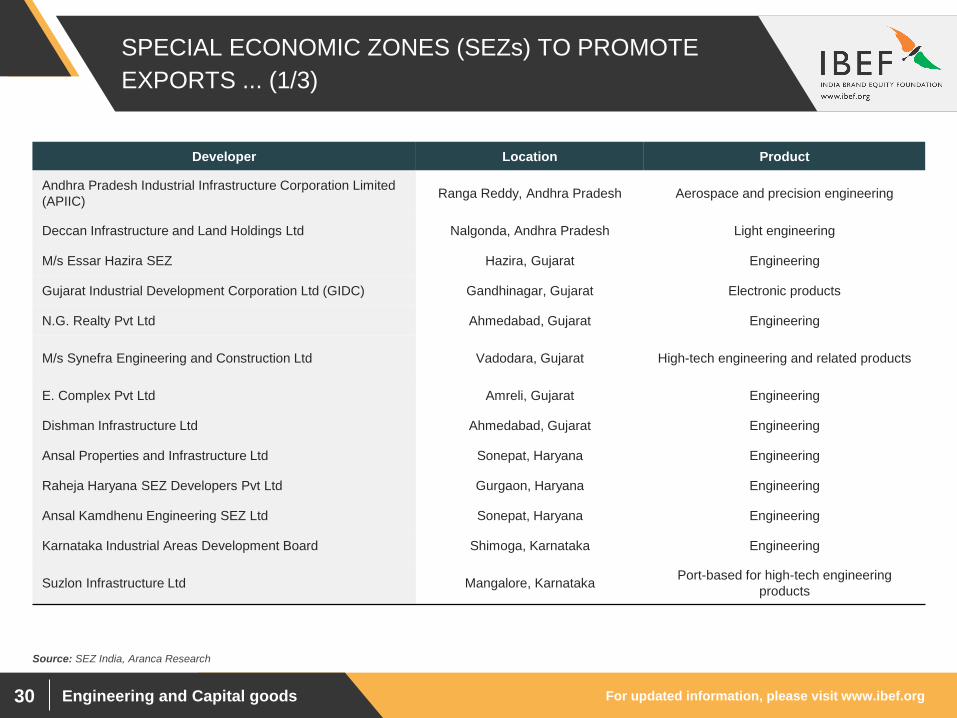
Developer Location Product
Andhra Pradesh Industrial Infrastructure Corporation Limited
(APIIC) Ranga Reddy, Andhra Pradesh Aerospace and precision engineering
Deccan Infrastructure and Land Holdings Ltd Nalgonda, Andhra Pradesh Light engineering
M/s Essar Hazira SEZ Hazira, Gujarat Engineering
Gujarat Industrial Development Corporation Ltd (GIDC) Gandhinagar, Gujarat Electronic products
N.G. Realty Pvt Ltd Ahmedabad, Gujarat Engineering
M/s Synefra Engineering and Construction Ltd Vadodara, Gujarat High-tech engineering and related products
E. Complex Pvt Ltd Amreli, Gujarat Engineering
Dishman Infrastructure Ltd Ahmedabad, Gujarat Engineering
Ansal Properties and Infrastructure Ltd Sonepat, Haryana Engineering
Raheja Haryana SEZ Developers Pvt Ltd Gurgaon, Haryana Engineering
Ansal Kamdhenu Engineering SEZ Ltd Sonepat, Haryana Engineering
Karnataka Industrial Areas Development Board Shimoga, Karnataka Engineering
Suzlon Infrastructure Ltd Mangalore, Karnataka Port-based for high-tech engineering
products
For updated information, please visit www.ibef.org Engineering and Capital goods 31
SPECIAL ECONOMIC ZONES (SEZs) TO PROMOTE
EXPORTS ... (2/3)
Source: SEZ India, Aranca Research
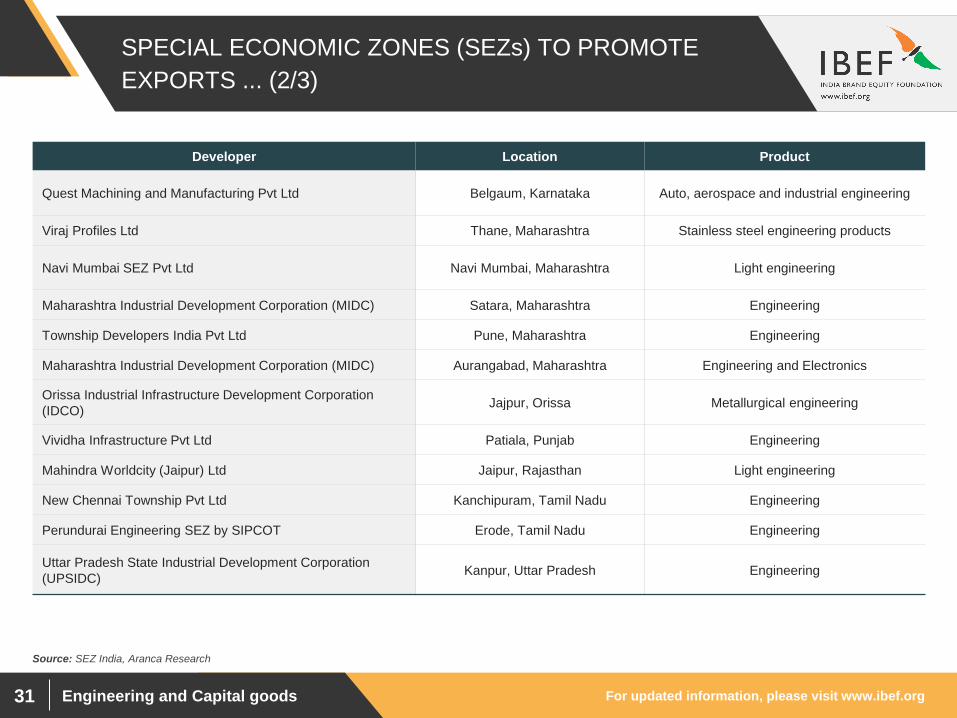
Developer Location Product
Quest Machining and Manufacturing Pvt Ltd Belgaum, Karnataka Auto, aerospace and industrial engineering
Viraj Profiles Ltd Thane, Maharashtra Stainless steel engineering products
Navi Mumbai SEZ Pvt Ltd Navi Mumbai, Maharashtra Light engineering
Maharashtra Industrial Development Corporation (MIDC) Satara, Maharashtra Engineering
Township Developers India Pvt Ltd Pune, Maharashtra Engineering
Maharashtra Industrial Development Corporation (MIDC) Aurangabad, Maharashtra Engineering and Electronics
Orissa Industrial Infrastructure Development Corporation
(IDCO) Jajpur, Orissa Metallurgical engineering
Vividha Infrastructure Pvt Ltd Patiala, Punjab Engineering
Mahindra Worldcity (Jaipur) Ltd Jaipur, Rajasthan Light engineering
New Chennai Township Pvt Ltd Kanchipuram, Tamil Nadu Engineering
Perundurai Engineering SEZ by SIPCOT Erode, Tamil Nadu Engineering
Uttar Pradesh State Industrial Development Corporation
(UPSIDC) Kanpur, Uttar Pradesh Engineering

For updated information, please visit www.ibef.org Engineering and Capital goods 32
SPECIAL ECONOMIC ZONES (SEZs) TO PROMOTE
EXPORTS ... (3/3)
Source: SEZ India, Aranca Research
Developer Location Product
Aspen Infrastructures Ltd. Vadodara, Gujarat High-tech Engineering products and related
Services
Aspen Infrastructures Ltd. Karnataka High-tech Engineering products and related
Services
Quest SEZ Development Private Ltd. Belgaum District, Karnataka Precision Engineering Product
Khed Economic Infrastructure Limited (Bharat Forge Ltd.) Pune, Maharashtra Engineering and Electronics
State Industries Promotion Corporation of Tamil Nadu Vellore, Tamil Nadu Engineering
State Industries Promotion Corporation of Tamil Nadu Erode, Tamil Nadu Engineering
Aspen Infrastructures Ltd. Coimbatore District, Tamil Nadu High-tech Engineering products and related
Services

For updated information, please visit www.ibef.org Engineering and Capital goods 33
INFLOW OF FOREIGN INVESTMENTS; RISE IN M&A
ACTIVITY ... (1/2)
FDI inflows into the miscellaneous mechanical and engineering
sector stood at US$ 3.45 billion during April 2000-June 2018.
The government’s increasing focus on attracting foreign investors in
manufacturing and infrastructure is likely to boost FDI in the sector.
Note: ^Cumulative FDI inflows are from April 2000 – June 2018, Eg: Cumulative FDI inflow for FY18 is from April 2000 to March 2018
Source: Department of Industrial Policy and Promotion, Aranca Research
Cumulative FDI inflows^ in miscellaneous engineering sector
(US$ billion)
0.23
0.35
0.26
0.25
0.55
0.36
0.38
0.15
0.03
1.12
1.47
1.73
1.98
2.53
2.89
3.27 3.42 3.45
0.0
0.5
1.0
1.5
2.0
2.5
3.0
3.5
4.0
FY11 FY12 FY13 FY14 FY15 FY16 FY17 FY18 FY19*
Annual FDI Inflow
Cumulative from April 2000-June 2018
For updated information, please visit www.ibef.org Engineering and Capital goods 34
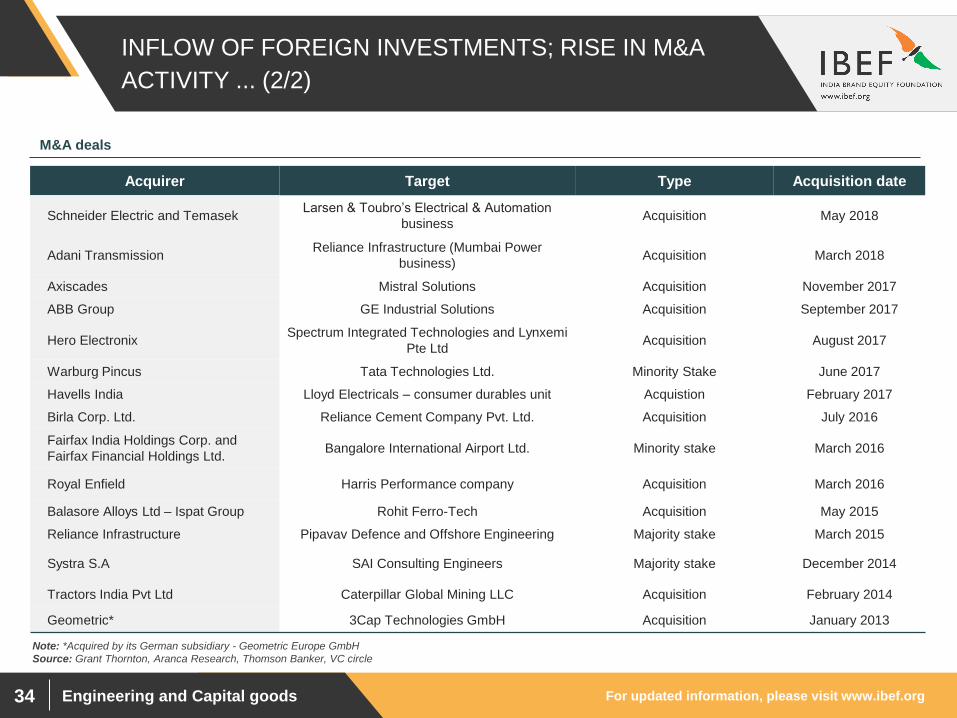
INFLOW OF FOREIGN INVESTMENTS; RISE IN M&A
ACTIVITY ... (2/2)
Acquirer Target Type Acquisition date
Schneider Electric and Temasek Larsen & Toubro’s Electrical & Automation
business Acquisition May 2018
Adani Transmission Reliance Infrastructure (Mumbai Power
business) Acquisition March 2018
Axiscades Mistral Solutions Acquisition November 2017
ABB Group GE Industrial Solutions Acquisition September 2017
Hero Electronix Spectrum Integrated Technologies and Lynxemi
Pte Ltd Acquisition August 2017
Warburg Pincus Tata Technologies Ltd. Minority Stake June 2017
Havells India Lloyd Electricals – consumer durables unit Acquistion February 2017
Birla Corp. Ltd. Reliance Cement Company Pvt. Ltd. Acquisition July 2016
Fairfax India Holdings Corp. and
Fairfax Financial Holdings Ltd. Bangalore International Airport Ltd. Minority stake March 2016
Royal Enfield Harris Performance company Acquisition March 2016
Balasore Alloys Ltd – Ispat Group Rohit Ferro-Tech Acquisition May 2015
Reliance Infrastructure Pipavav Defence and Offshore Engineering Majority stake March 2015
Systra S.A SAI Consulting Engineers Majority stake December 2014
Tractors India Pvt Ltd Caterpillar Global Mining LLC Acquisition February 2014
Geometric* 3Cap Technologies GmbH Acquisition January 2013
M&A deals
Note: *Acquired by its German subsidiary - Geometric Europe GmbH
Source: Grant Thornton, Aranca Research, Thomson Banker, VC circle

Engineering and Capital goods
OPPORTUNITIES

For updated information, please visit www.ibef.org Engineering and Capital goods 36
GROWTH OPPORTUNITIES IN THE ENGINEERING
SECTOR … (1/2)
Source: Aranca Research
India’s nuclear power installed capacity was 6.78 GW in June 2018. Nearly 3,300 MW of nuclear capacity is
expected to be commissioned during 2017-2022.
It represents business opportunity worth US$ 312 million for the manufacturing industry,
Global auto majors are rapidly ramping up the value of components they source from India, steered by the
country’s advanced engineering skills, established production lines, a thriving domestic automobile industry
and competitive costs
Industry sales are expected to increase to US$ 47-49 billion in 2017-18
In auto components sector, 100 per cent FDI is allowed under the automatic route
Notes: GW - Giga Watt, SME - Small and Medium Enterprises, CY – Calendar Year
Allocation to the defence sector was raised to US$ 45.57 billion under Union Budget 2018-19. In addition,
Make in India policy is being carefully pursued to achieve greater self-sufficiency in the area of defence
equipment including air-craft.
Government initiatives, such as allowing private sector participation, have been reinforced by opening up the
sector to 100 per cent FDI (49 percent through automatic route), and its offset policy is expected to enhance
private sector (including SME) participation.
Ministry of Defence has eased its procurement norms, making it easier for Indian companies and start-ups to
offer equipment and other products to the Indian armed forces.
Defence Sector
Civil nuclear sector
Auto components
For updated information, please visit www.ibef.org Engineering and Capital goods 37
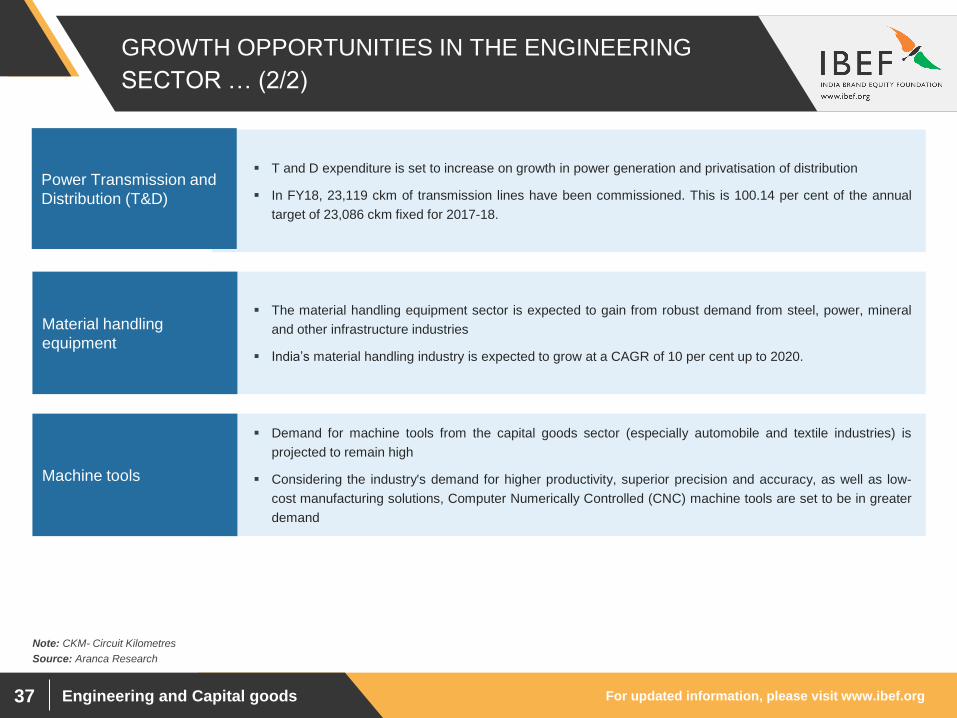
GROWTH OPPORTUNITIES IN THE ENGINEERING
SECTOR … (2/2)
Source: Aranca Research
Note: CKM- Circuit Kilometres
The material handling equipment sector is expected to gain from robust demand from steel, power, mineral
and other infrastructure industries
India’s material handling industry is expected to grow at a CAGR of 10 per cent up to 2020.
Demand for machine tools from the capital goods sector (especially automobile and textile industries) is
projected to remain high
Considering the industry's demand for higher productivity, superior precision and accuracy, as well as low-
cost manufacturing solutions, Computer Numerically Controlled (CNC) machine tools are set to be in greater
demand
T and D expenditure is set to increase on growth in power generation and privatisation of distribution
In FY18, 23,119 ckm of transmission lines have been commissioned. This is 100.14 per cent of the annual
target of 23,086 ckm fixed for 2017-18.
Power Transmission and
Distribution (T&D)
Material handling
equipment
Machine tools
For updated information, please visit www.ibef.org Engineering and Capital goods 38
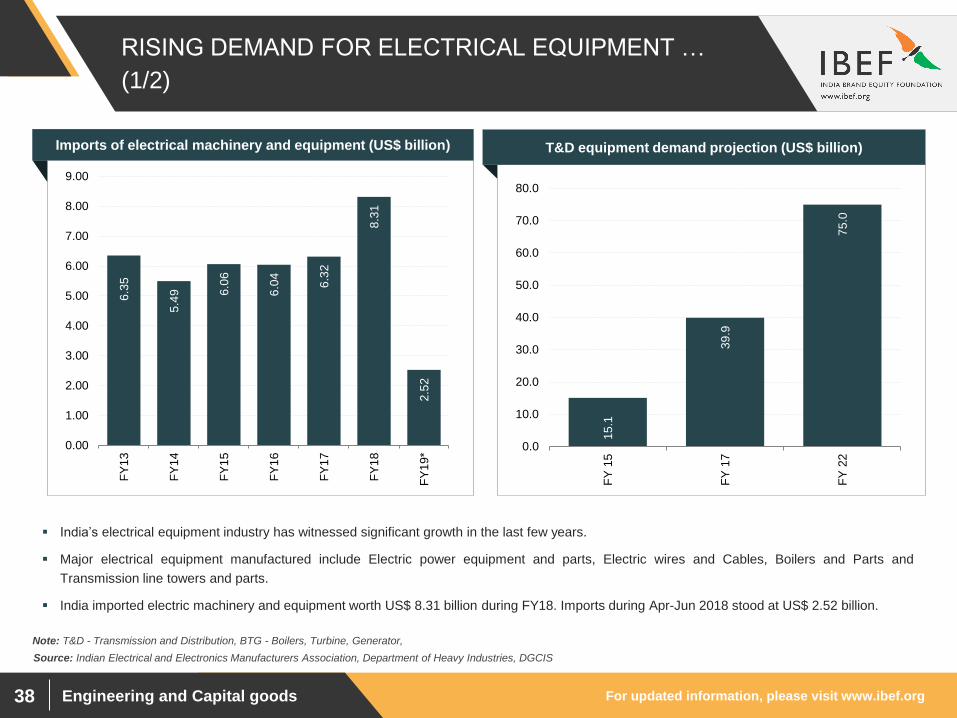
RISING DEMAND FOR ELECTRICAL EQUIPMENT …
(1/2)
Note: T&D - Transmission and Distribution, BTG - Boilers, Turbine, Generator,
India’s electrical equipment industry has witnessed significant growth in the last few years.
Major electrical equipment manufactured include Electric power equipment and parts, Electric wires and Cables, Boilers and Parts and
Transmission line towers and parts.
India imported electric machinery and equipment worth US$ 8.31 billion during FY18. Imports during Apr-Jun 2018 stood at US$ 2.52 billion. 1
5.1
39
.9
75
.0
0.0
10.0
20.0
30.0
40.0
50.0
60.0
70.0
80.0
FY
15
FY
17
FY
22
T&D equipment demand projection (US$ billion)
6.3
5
5.4
9
6.0
6
6.0
4
6.3
2
8.3
1
2.5
2
0.00
1.00
2.00
3.00
4.00
5.00
6.00
7.00
8.00
9.00
FY
13
FY
14
FY
15
FY
16
FY
17
FY
18
FY
19*
Imports of electrical machinery and equipment (US$ billion)
Source: Indian Electrical and Electronics Manufacturers Association, Department of Heavy Industries, DGCIS
For updated information, please visit www.ibef.org Engineering and Capital goods 39
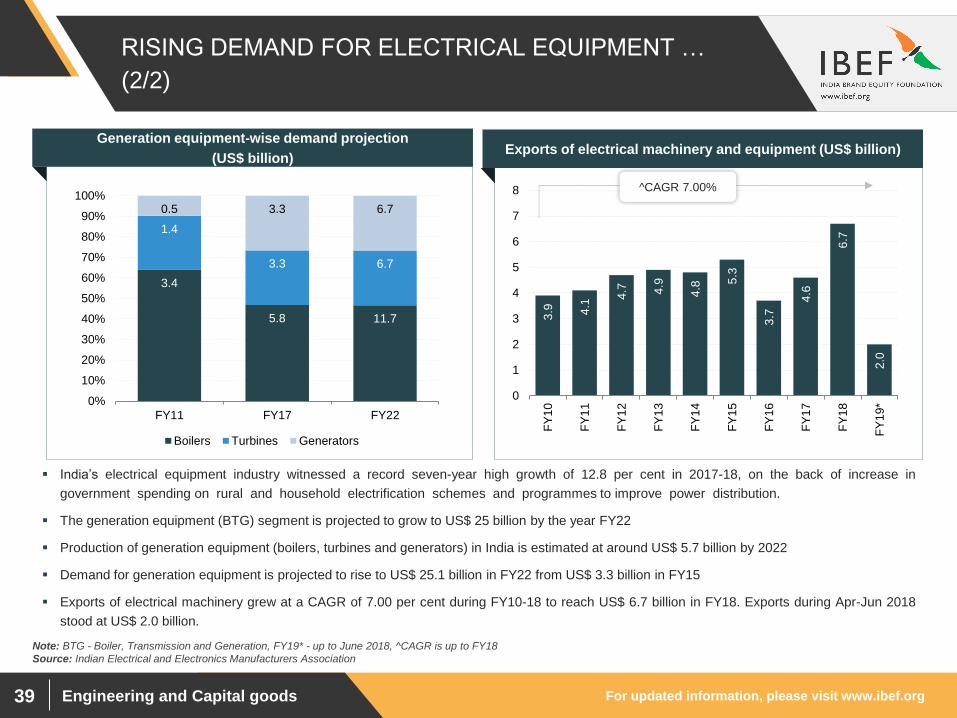
RISING DEMAND FOR ELECTRICAL EQUIPMENT …
(2/2)
3.4
5.8 11.7
1.4
3.3 6.7
0.5 3.3 6.7
0%
10%
20%
30%
40%
50%
60%
70%
80%
90%
100%
FY11 FY17 FY22
Boilers Turbines Generators
India’s electrical equipment industry witnessed a record seven-year high growth of 12.8 per cent in 2017-18, on the back of increase in
government spending on rural and household electrification schemes and programmes to improve power distribution.
The generation equipment (BTG) segment is projected to grow to US$ 25 billion by the year FY22
Production of generation equipment (boilers, turbines and generators) in India is estimated at around US$ 5.7 billion by 2022
Demand for generation equipment is projected to rise to US$ 25.1 billion in FY22 from US$ 3.3 billion in FY15
Exports of electrical machinery grew at a CAGR of 7.00 per cent during FY10-18 to reach US$ 6.7 billion in FY18. Exports during Apr-Jun 2018
stood at US$ 2.0 billion.
Generation equipment-wise demand projection
(US$ billion)
3.9
4.1
4.7
4.9
4.8
5.3
3.7
4.6
6.7
2.0
0
1
2
3
4
5
6
7
8
FY
10
FY
11
FY
12
FY
13
FY
14
FY
15
FY
16
FY
17
FY
18
FY
19*
Exports of electrical machinery and equipment (US$ billion)
^CAGR 7.00%
Note: BTG - Boiler, Transmission and Generation, FY19* - up to June 2018, ^CAGR is up to FY18
Source: Indian Electrical and Electronics Manufacturers Association
For updated information, please visit www.ibef.org Engineering and Capital goods 40
GROWTH POTENTIAL IN THE CONSTRUCTION
EQUIPMENT INDUSTRY
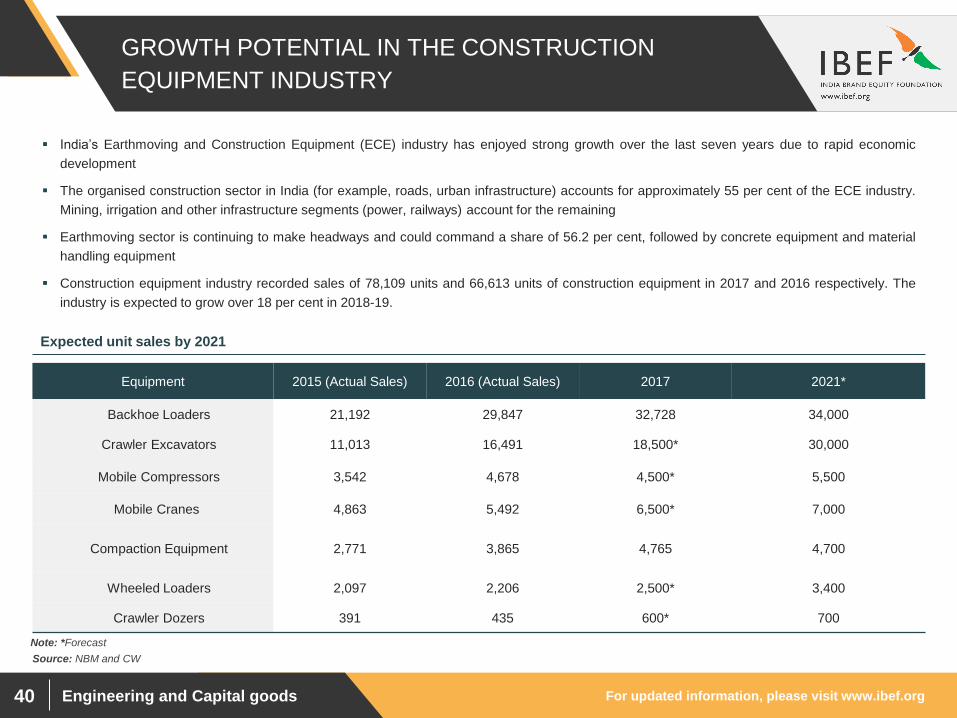
India’s Earthmoving and Construction Equipment (ECE) industry has enjoyed strong growth over the last seven years due to rapid economic
development
The organised construction sector in India (for example, roads, urban infrastructure) accounts for approximately 55 per cent of the ECE industry.
Mining, irrigation and other infrastructure segments (power, railways) account for the remaining
Earthmoving sector is continuing to make headways and could command a share of 56.2 per cent, followed by concrete equipment and material
handling equipment
Construction equipment industry recorded sales of 78,109 units and 66,613 units of construction equipment in 2017 and 2016 respectively. The
industry is expected to grow over 18 per cent in 2018-19.
Equipment 2015 (Actual Sales) 2016 (Actual Sales) 2017 2021*
Backhoe Loaders 21,192 29,847 32,728 34,000
Crawler Excavators 11,013 16,491 18,500* 30,000
Mobile Compressors 3,542 4,678 4,500* 5,500
Mobile Cranes 4,863 5,492 6,500* 7,000
Compaction Equipment 2,771 3,865 4,765 4,700
Wheeled Loaders 2,097 2,206 2,500* 3,400
Crawler Dozers 391 435 600* 700
Expected unit sales by 2021
Source: NBM and CW
Note: *Forecast
Engineering and Capital goods
INDUSTRY
ASSOCIATIONS
For updated information, please visit www.ibef.org Engineering and Capital goods 42
INDUSTRY ASSOCIATIONS
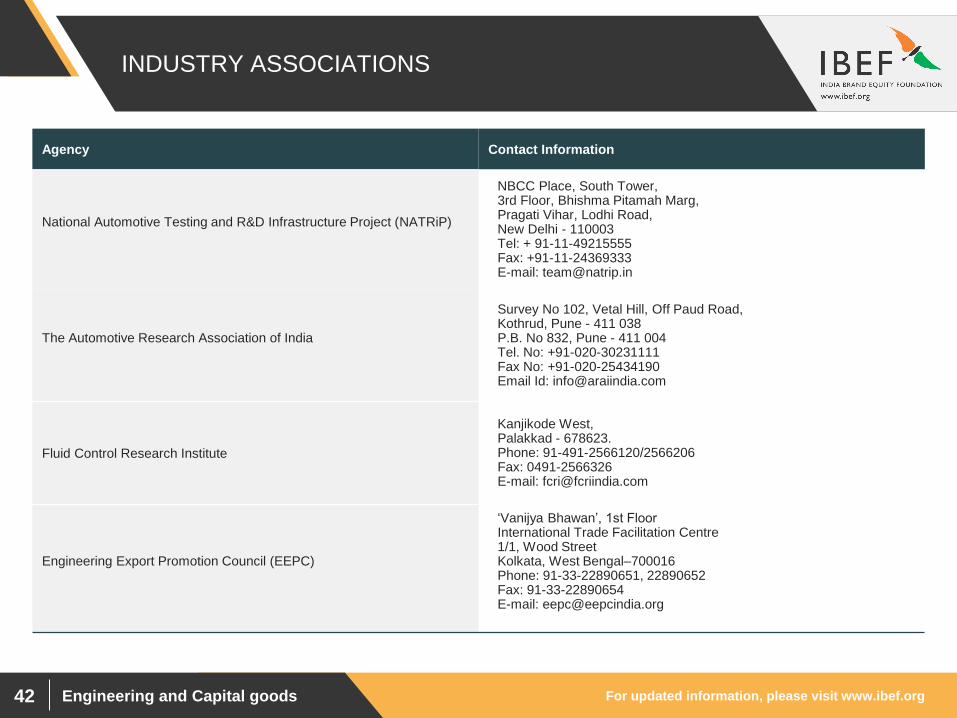
Agency Contact Information
National Automotive Testing and R&D Infrastructure Project (NATRiP)
NBCC Place, South Tower, 3rd Floor, Bhishma Pitamah Marg, Pragati Vihar, Lodhi Road, New Delhi - 110003 Tel: + 91-11-49215555 Fax: +91-11-24369333 E-mail: [email protected]
The Automotive Research Association of India
Survey No 102, Vetal Hill, Off Paud Road, Kothrud, Pune - 411 038 P.B. No 832, Pune - 411 004 Tel. No: +91-020-30231111 Fax No: +91-020-25434190 Email Id: [email protected]
Fluid Control Research Institute
Kanjikode West, Palakkad - 678623. Phone: 91-491-2566120/2566206 Fax: 0491-2566326 E-mail: [email protected]
Engineering Export Promotion Council (EEPC)
‘Vanijya Bhawan’, 1st Floor International Trade Facilitation Centre 1/1, Wood Street Kolkata, West Bengal–700016 Phone: 91-33-22890651, 22890652 Fax: 91-33-22890654 E-mail: [email protected]
Engineering and Capital goods
USEFUL
INFORMATION
For updated information, please visit www.ibef.org Engineering and Capital goods 44
GLOSSARY
BTG: Boilers, Turbines, Generators
BHEL: Bharat Heavy Electricals Limited
MHI: Mitsubishi heavy industries
DHI: Department of Heavy industries
BHEL: Bharat Heavy Electricals Ltd
ICEMA: Indian Construction Equipment Manufacturer’s Association
HAL: Hindustan Aeronautics Limited
IEEMA: Indian Electrical and Electronics Manufacturers Association
EEPC material handling: Engineering Export Promotion Council
TPD: Tonnes Per Day
NHAI: National Highway Authority of India
MORTH: Ministry of Road Transport and Highways
CEA: Central Electrical Authority
HVDC: High Voltage Direct Current
US$ : US Dollar
FY: Indian Financial Year (April to March)
Wherever applicable, numbers have been rounded off to one decimal

For updated information, please visit www.ibef.org Engineering and Capital goods 45
EXCHANGE RATES
Exchange Rates (Fiscal Year) Exchange Rates (Calendar Year)
Year INR INR Equivalent of one US$
2004–05 44.95
2005–06 44.28
2006–07 45.29
2007–08 40.24
2008–09 45.91
2009–10 47.42
2010–11 45.58
2011–12 47.95
2012–13 54.45
2013–14 60.50
2014-15 61.15
2015-16 65.46
2016-17 67.09
2017-18 64.45
Q1 2018-19 67.04
Year INR Equivalent of one US$
2005 44.11
2006 45.33
2007 41.29
2008 43.42
2009 48.35
2010 45.74
2011 46.67
2012 53.49
2013 58.63
2014 61.03
2015 64.15
2016 67.21
2017 65.12
Source: Reserve Bank of India, Average for the year
For updated information, please visit www.ibef.org Engineering and Capital goods 46
DISCLAIMER
India Brand Equity Foundation (IBEF) engaged Aranca to prepare this presentation and the same has been prepared by Aranca in consultation
with IBEF.
All rights reserved. All copyright in this presentation and related works is solely and exclusively owned by IBEF. The same may not be reproduced,
wholly or in part in any material form (including photocopying or storing it in any medium by electronic means and whether or not transiently or
incidentally to some other use of this presentation), modified or in any manner communicated to any third party except with the written approval
of IBEF.
This presentation is for information purposes only. While due care has been taken during the compilation of this presentation to ensure that the
information is accurate to the best of Aranca and IBEF’s knowledge and belief, the content is not to be construed in any manner whatsoever as a
substitute for professional advice.
Aranca and IBEF neither recommend nor endorse any specific products or services that may have been mentioned in this presentation and nor do
they assume any liability or responsibility for the outcome of decisions taken as a result of any reliance placed on this presentation.
Neither Aranca nor IBEF shall be liable for any direct or indirect damages that may arise due to any act or omission on the part of the user due to any
reliance placed or guidance taken from any portion of this presentation.