Embed Size (px)
Citation preview
Pepperdine University Pepperdine University
Pepperdine Digital Commons Pepperdine Digital Commons
Theses and Dissertations
2016
Engagement drivers impacting productivity in highly engaged Engagement drivers impacting productivity in highly engaged
teams at CHG Healthcare Services teams at CHG Healthcare Services
Kevin S. Ricklefs
Follow this and additional works at: https://digitalcommons.pepperdine.edu/etd
Recommended Citation Recommended Citation Ricklefs, Kevin S., "Engagement drivers impacting productivity in highly engaged teams at CHG Healthcare Services" (2016). Theses and Dissertations. 675. https://digitalcommons.pepperdine.edu/etd/675
This Thesis is brought to you for free and open access by Pepperdine Digital Commons. It has been accepted for inclusion in Theses and Dissertations by an authorized administrator of Pepperdine Digital Commons. For more information, please contact [email protected] , [email protected].
CORE Metadata, citation and similar papers at core.ac.uk
Provided by Pepperdine Digital Commons
i
ENGAGEMENT DRIVERS IMPACTING PRODUCTIVITY IN HIGHLY
ENGAGED TEAMS AT CHG HEALTHCARE SERVICES
_____________________________________
A Research Project
Presented to the Faculty of
The George L. Graziadio
School of Business and Management
Pepperdine University
_____________________________________
In Partial Fulfillment
of the Requirements for the Degree
Masters of Science
in
Organization Development
____________________________________
by
Kevin S. Ricklefs
March 2016
© 2016 Kevin S. Ricklefs
ii
This research project, completed by
KEVIN S. RICKLEFS
under the guidance of the Faculty Committee and approved by its members, has been
submitted to and accepted by the faculty of The George L. Graziadio School of Business
and Management in partial fulfillment of the requirements for the degree of
MASTER OF SCIENCE IN ORGANIZATION DEVELOPMENT
Date: July 1, 2016
Faculty Committee
Committee Chair, Alexandra Anna, PhD
Committee Member, Gary L. Mangiofico, PhD
Linda Livingstone, Dean The George L. Graziadio
School of Business and Management
iii
Abstract
In 2012 about 30% of the American workers were engaged at work and 70% of workers
were either not engaged or fully disengaged. There have been numerous studies on
determining employment factors that create engagement and the organizational benefits
received from a highly engaged workforce. It has been shown that companies with
highly engaged employees experience many organizational benefits including higher
employee productivity, lower attrition, better quality, and superior financial results.
However, there has been little research conducted on creating a direct linkage between a
specific engagement driver and a specific organizational benefit. The purpose of this
study is to identify drivers of engagement that positively impact productivity in highly
engaged teams at CHG Healthcare Services. CHG Healthcare Services is a healthcare
staffing company headquartered in Salt Lake City, Utah. In 2014, it was estimated that
93% of its 1750 employee were engaged. Quantitative data was collected through a
written survey from a random sampling of 98 employees from highly engaged sales and
business partner teams. 46 employees completed the survey that asked them to choose
the top factors that most positively impacted their individual and team productivity from
a list of 23 established engagement drivers. In addition, 9 qualitative focus groups were
held with survey participants to gain qualitative understanding into why participant’s felt
the chosen engagement factors impacted productivity. The findings demonstrated that for
employees with over 1 year of experience, 4 engagement drivers made the most
meaningful impact on individual and team productivity. These results were similar across
all demographic groups reviewed. The engagement drivers most impacting employee
productivity were having access to work-life balance, having a positive relationship with
iv
their team and leader, having work that is meaningful, and having the authority and
autonomy of make decisions affecting their work. The research also showed that one
group, first year employees, provided a different set of results. The study demonstrated
that first-year employees value employment factors that help support them during the
time they are establishing effective relationships in a new environment and building
necessary job skills to contribute to the team and company.
v
Table of Contents
Abstract ............................................................................................................................... iii
List of Tables .................................................................................................................... viii
List of Figures ..................................................................................................................... ix
1. The Current Nature of Employee Engagement ............................................................... 1
Statement of Research Problem ............................................................................... 3
Purpose .................................................................................................................... 4
Research Questions ................................................................................................. 4
Significance of the Study ......................................................................................... 5
2. Review of Literature ........................................................................................................ 7
Definition of Employee Engagement ...................................................................... 8
Organizational Benefits of Employee Engagement .............................................. 10
Quality and safety. ..................................................................................... 11
Retention .................................................................................................... 11
Performance. .............................................................................................. 12
Customer satisfaction ................................................................................ 12
Financial results ......................................................................................... 12
Theoretical Frameworks of Employee Engagement ............................................. 13
Herzberg two-factor theory ....................................................................... 14
The needs-satisfying model ....................................................................... 15
The job demands-resources model ............................................................ 16
The affective shift model ........................................................................... 18
Social exchange model .............................................................................. 19
vi
Organizational Drivers of Employee Engagement ................................................ 20
Summary of drivers of employee engagement .......................................... 23
Definition and drivers of high performance and productivity ................... 24
Literature review summary ........................................................................ 26
3. Research Methodology and Procedures ........................................................................ 29
Study Design ......................................................................................................... 29
Sample Determination ........................................................................................... 30
Definition of high engagement .................................................................. 31
Sample A ................................................................................................... 35
Sample B ................................................................................................... 35
Data Collection ...................................................................................................... 35
First-year focus group process ................................................................... 37
Data Analysis ......................................................................................................... 38
4. Results of the Study ....................................................................................................... 39
Study Demographics ............................................................................................. 40
Quantitative Written Survey Results ..................................................................... 40
Questionnaire Demographic Results ..................................................................... 46
Business partner and sales employees ....................................................... 47
Males and females ..................................................................................... 48
Employee age ............................................................................................ 49
Employee tenure ........................................................................................ 49
Year 1 employees ...................................................................................... 50
Results excluding Year 1 employees ......................................................... 52
vii
Quantitative data summary ........................................................................ 54
5. Study Overview ............................................................................................................. 57
Qualitative Understanding of Engagement-Productivity Drivers at CHG ............ 58
I have access to work-life balance ............................................................. 58
I believe that my work is meaningful ........................................................ 60
I have autonomy and authority to make decisions affecting my work ...... 61
I have a positive relationship with my team and leader ............................ 63
Qualitative Understanding of Engagement-Productivity Drivers of Year 1
Employees ............................................................................................................. 64
Discussion on Results ............................................................................................ 67
First-Year Employees ............................................................................................ 70
Significance of Study ............................................................................................ 72
Study Limitations .................................................................................................. 73
Recommendation for Future Studies ..................................................................... 73
Summary ................................................................................................................ 74
References ......................................................................................................................... 75
Appendix A: Focus Group Participant Letter .................................................................... 79
Appendix B: Research Project Information Sheet ............................................................. 80
Appendix C: Focus Group Survey .................................................................................... 82
Appendix D: Focus Group Process and Qualitative Questions ......................................... 84
Appendix E: First Year Employee Focus Group Questions .............................................. 86
viii
List of Tables
1. Most Stated Engagement Drivers .................................................................................. 22
2. Engagement Drivers of CHG Employees, 2015 ............................................................ 23
3. Drivers of High Performance ........................................................................................ 26
4. 2015 Highly Engaged Sales Team at CHG ................................................................... 34
5. 2015 Highly Engaged Business Partner Teams at CHG ............................................... 34
6. Participant Demographic Information ........................................................................... 40
7. All Respondents - Engagement Factor Creating Greatest Impact In Productivity ........ 41
8. Chi-Square Test: Engagement Factor With Greatest Impact ........................................ 43
9. All Respondents: Primary Engagement Factors Creating Positive Impact on Productivity ....................................................................................................................... 44
10. Chi-Square Test: Primary Engagement Factors .......................................................... 45
11. Engagement Factors Driving Productivity for Highly Engaged Employees at CHG . 45
12. Factor Ranking for Sales Employees and Business Partner Employees ..................... 48
13. Factor Ranking for Males and Females ....................................................................... 48
14. Factor Ranking by Employee Age .............................................................................. 49
15. Factor Ranking by Employee Tenure .......................................................................... 50
16. Comparison of Primary Engagement Factors Driving Productivity ........................... 52
17. Chi-Square Test - 5 Primary Factors ........................................................................... 54
18. Engagement – Productivity Drivers of Employees After Year 1 ................................ 55
19. Engagement Factors Most Positively Impacting Productivity .................................... 67
ix
List of Figures
1. CHG Engagement Index. Copyright 2014 DecisionWise, Inc. ....................................... 3
2. Engagement Drivers Compared To Performance Drivers ............................................. 26
3. Fourteen Questions Used in the CHG Engagement Scorecard ..................................... 33
1
Chapter 1
The Current Nature of Employee Engagement
The 2012 Gallup, State of the American Workplace, study stated that currently
only 30% of American workers are fully engaged, while 52% of workers are not engaged
and 18% are actively disengaged (Gallup, Inc., 2013). Gallup defines “engaged”
employees as those who are involved in, enthusiastic about, and committed to their work.
This is not new information. In fact, these statistics have gone relatively unchanged since
2000. It is also not surprising that having 70% of employees not engaged or actively
disengaged at work negatively affects business. The same Gallup study estimated that the
18% of actively disengaged employees cost the United States between $450 and $550
billion each year in lost productivity (Gallup, Inc., 2013).
There have been numerous studies and research conducted that show companies
with highly engaged employees are more productive, provide better customer service,
and experience less turnover and absenteeism. A Towers Perrin 2005 survey of over
35,000 employees showed a positive relationship between the level of employee
engagement and sales performance, customer service and reduced turnover (Wellins,
Berntal, & Phelps, 2005). A 2011 Aon Hewitt study found teams with high engagement
had a 37% net promoter score (NPS) versus a 10% NPS for teams with low engagement,
creating a direct link between engagement and customer service performance (Aon,
2011). NPS is a tool that measures the loyalty between a company and customer. A 2006
Gallup study comparing companies with top and bottom quartile employee engagement
found that lower quartile averaged between 31% and 51% higher turnover and 62% more
workplace accidents than top quartile employees (Harter, Schmidt, Killham, & Asplund,
2
2006). These studies have provided good insight into the positive linkage between
employee engagement and employee driven results such as production, turnover, and
service levels.
Similar linkage can be found between employee engagement and overall business
performance. Kenexa Research Institute conducted two studies focusing on two
important financial areas: annual net income and total shareholder return (TSR). This was
one of the first efforts to study the linkage between high employee engagement and
business results across organizations, industries, organizational size and geographic
locations (Kenexa, 2009). The first study examined 64 organizations and the relationship
between engagement and annual net income. The research results showed that
organizations with workforce engagement ranking in the top 25% achieved twice the
annual net income compared to organizations in the bottom 25%. Similar results were
seen in a second study across 39 organizations examining employee engagement and
TSR. A comparison of 5-year TSR indicate that organizations in the top 25% of
engagement have TSR seven times higher than companies in the lowest 25% of
engagement.
CHG Healthcare Services, Inc. (CHG) has achieved similar employee and
business results. CHG is a healthcare staffing company founded in 1979 with
headquarters located in Salt Lake City, Utah. The company currently has 1750 employees
in seven locations within the United States. Based on a business strategy of creating and
maintaining a culture of employee engagement, CHG has been named on the list of
Fortune Magazines, “Best Places to Work For” in America for six consecutive years.
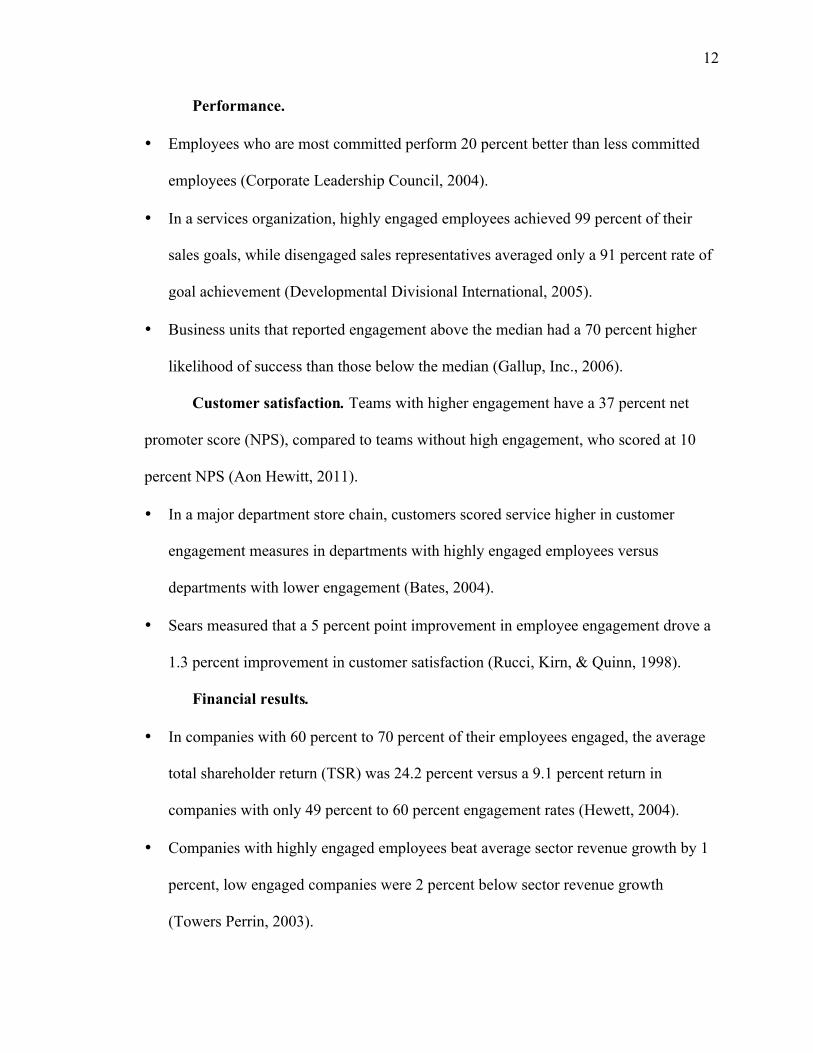
Based on results of the 2014 CHG Employee Satisfaction Survey, administered by
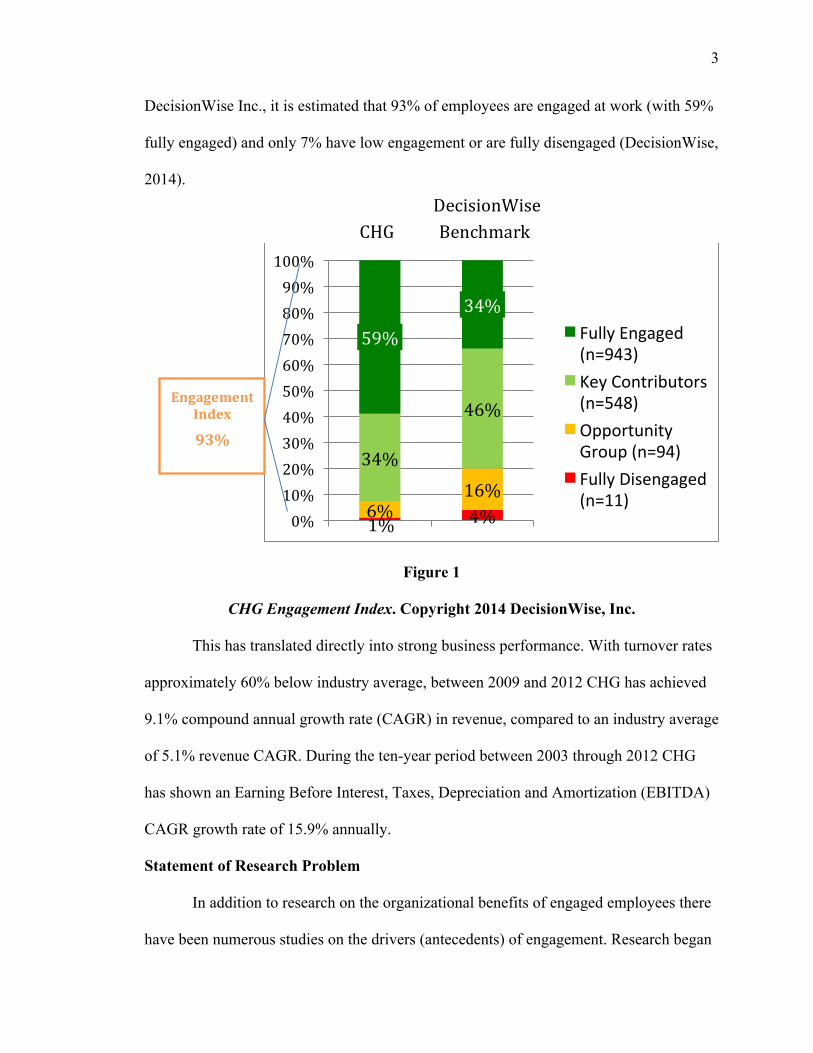
3
DecisionWise Inc., it is estimated that 93% of employees are engaged at work (with 59%
fully engaged) and only 7% have low engagement or are fully disengaged (DecisionWise,
2014).
Figure 1
CHG Engagement Index. Copyright 2014 DecisionWise, Inc.
This has translated directly into strong business performance. With turnover rates
approximately 60% below industry average, between 2009 and 2012 CHG has achieved
9.1% compound annual growth rate (CAGR) in revenue, compared to an industry average
of 5.1% revenue CAGR. During the ten-year period between 2003 through 2012 CHG
has shown an Earning Before Interest, Taxes, Depreciation and Amortization (EBITDA)
CAGR growth rate of 15.9% annually.
Statement of Research Problem
In addition to research on the organizational benefits of engaged employees there
have been numerous studies on the drivers (antecedents) of engagement. Research began
1% 4% 6% 16%
34%
46%
59%
34%
0% 10% 20% 30% 40% 50% 60% 70% 80% 90% 100%
Fully Engaged (n=943) Key Contributors (n=548) Opportunity Group (n=94) Fully Disengaged (n=11)
Engagement Index 93%
DecisionWise CHG Benchmark
4
in the mid 1950’s, when researchers Herzberg, Mausner and Snydermann asked
employees the question, “Describe a time, an incident, when you felt good, and a time, or
incident, when you felt bad” at work (Herzberg, Mausner, & Snyderman, 1959).
Although this research was not about employee engagement as a concept, it resulted in
the Herzberg Two-Factor Theory, which helped describe factors creating satisfaction and
motivation in the workplace (Herzberg, 1965). Since this time, studies and research have
found a linkage to over 20 different employment drivers that help create employee
engagement.
My interest is not to do another study showing the linkage between employee
engagement and beneficial organizational results, nor is it to determine additional drivers
of employee engagement. There has been numerous studies on both these topics.
However, I find no research studying the direct linkage between specific engagement
drivers and specific organizational benefits. My interest lies in gaining better
understanding of a possible direct linkage between the drivers of engagement and one of
the organizational benefits, high productivity.
Purpose
It is the purpose of this study is to identify drivers of engagement that positively
impact productivity in highly engaged teams at CHG.
Research Questions
The study will address the following primary question:
• In highly engaged teams at CHG, what engagement drivers do employees feel most
directly, positively impacts their productivity?
This research will also try to gain understanding on the following secondary questions:
5
• How do employees feel that these engagement factors impact productivity?
Significance of the Study
If a direct connection can be made, I believe that this study will add value to the
field of employee engagement by providing direct linkage between engagement
antecedents (drivers) and one engagement consequence (productivity). A 2013 Harvard
Business Review report showed 71% of executive respondents rank employee
engagement as very important to achieving organizational success. However, only 24%
of the respondents feel that employees within their organizations are highly engaged and
fewer than 50% said they are effective in measuring and tying employee engagement to
performance metrics (Harvard, 2013). This study will be useful in providing insight into
the relationship between engagement and one performance metric, productivity.
As the business world becomes faster and more complex, having a high
performing workforce is essential to sustained growth or even business survival.
Developing highly engaged employees plays a central role in increasing innovation,
productivity and customer service. This is why employee engagement is currently a top
business priority for senior leaders (Harvard, 2013). Leaders play a central role in
creating a culture of engagement. It is estimated that at least 70% of the variance in levels
of engagement for employees is leader controlled (Gallup, Inc., 2015). By understanding
the engagement drivers that positively impact individual productivity, companies can use
this research to design development programs to train managers to create a culture and
helps employees achieve their full potential.
Finally, this study brings value to employees by providing their voice in the
research. All data collected for this research is from employees in non-leadership
6
positions. It provides an understanding on what employees feel are employment factors
that are not only increase their engagement but also positively impact their performance
success.
7
Chapter 2
Review of Literature
The first mention of the term “employee engagement” appears in the Academy of
Management Journal article, “Psychological Conditions of Personal Engagement and
Disengagement at Work” (Kahn, 1990). The paper examined the conditions at work that
contribute to engagement and disengagement. Kahn found that the concepts of
meaningfulness, safety, and availability had a significant impact on employee
engagement. However, Kahn’s conceptualization of personal engagement would be the
only empirical research on engagement until 2001, over a decade later (Shuck & Wollard,
2009). At this point, Maslach, Schaufelli, and Leiter (2001) studied why employees
developed job burnout and described employee engagement as the “positive antithesis to
burnout.” These two research works provided the earliest theoretical frameworks in the
understanding employee engagement (Saks, 2005).
Since 2001 research slowly increased to better understand employee engagement.
In this literature review, I will provide information in several areas of engagement
including the definitions of employee engagement, five theoretical frameworks, drivers of
engagement, and the organizational benefits of having engaged employees. This will
create a base of understanding to begin the research to identify engagement drivers that
positively impact productivity. To gain clarity on high performance, this chapter will also
include what the literature states about the definition and drivers of high team
performance at work.
8
Definition of Employee Engagement
Although the research history in employee engagement is relatively short ,there
have been multiple definitions of engagement, leading to ambiguity and confusion. These
different definitions of employee engagement were created by different protocols and
used to explain different aspects of employee’s experiences (Kumar & Swetha, 2011).
Definitions have primarily come from business, psychology, and human resource
consultant literature and often lack the rigor of academic scrutiny (Macey & Schneider,
2008; Saks, 2005). Without a universal definition of employee engagement, it cannot be
measured or managed, nor can we know if efforts to improve it are working (Ferguson,
2007). In addition, without a clear and agreed upon definition of engagement, it is hard
for OD professionals to provide effective interventions and strategies to clients or
organizations. To understand the extent of definitions available an analysis of literature
found the following descriptions and meanings:
• Kahn (1990) defines employee engagement as “the harnessing of organization
members’ selves to their work roles; in engagement, employees positively express
themselves physically, cognitively, and emotionally during role performances.”
• Schaufelli, Taris, and Leiter (2002) uses “a positive, fulfilling, work related state of
mind that is characterized by vigor, dedication and absorption.”
• Maslach, Schaufelli, and Leiter (2001) studied burnout in work roles and defined
employee engagement as the “opposite or antithesis of burnout.” Engagement is
described by energy, involvement, and efficacy.
• Harter, Schmidt, and Hines (2002) define it as “the individual’s involvement and
satisfaction with, as well as enthusiasm for work.”
9
• Saks (2005) stated that employee engagement is most often defined as “a distinct and
unique construct that consists of cognitive, emotional, and behavioral components
that are associated with individual role performance.”
• Corporate Executive Board (2004) states that engagement is “the extent to which
employees commit to something or someone in their organization, how hard they
work, and how long they stay as a result of that commitment.”
• Gallup, Inc. (2013) defines engaged employee as “those who are involved in,
enthusiastic about, and committed to their work and contribute to their organization in
a positive manner.”
• Hewitt Research (2004) defines employee engagement by “the state in which
individuals are emotionally and intellectually committed to the organization or
group.”
As shown by the literature review, several definitions of employee engagement
are currently being used to measure, define and improve employee engagement. Shuck
and Wollard’s, in “A Historical Perspective of Employee Engagement: An Emerging
Definition” (Shuck & Wollard, 2009), researched ten seminal academic works on the
topic of defining employee engagement and identified the following consistencies in
attributes among the definitions:
1. Being engaged is a personal decision; it concerns the individual employee and not the
organization.
2. Three types of engagement can be identified: a) cognitive engagement, b) emotional
engagement, and c) behavioral engagement. Each of these engagement types are
separate and each type builds on the next. All are necessary for full engagement.
10
3. Employee engagement has no physical properties, but is manifested and often
measured behaviorally. Behavioral manifestation is described differently in the
literature through an employee’s role performance, organizational performance or
discretionary effort but is consistently understood as an “internal decision manifested
outwardly.”
Based on these consistencies, Shuck and Wollard (2009) produced a definition,
stating “employee engagement can be defined in an emergent and working condition as a
positive, cognitive, emotional, and behavioral state directed toward organizational
outcomes.”
In recent years, these three types of engagement: emotional, cognitive and
behavioral have been translated into hearts and spirits (emotional), head (cognitive) and
hands (behavioral). Tracy Maylett and Paul Warner, in their book, Magic, Five Keys to
Unlock the Power of Employee Engagement, took the three consistencies described by
Shuck and Warner (2009) and developed this definition of engagement (Maylett &
Warner, 2014): “Employee engagement is an emotional state where we feel passionate,
energetic, and committed toward our work. In turn, we fully invest our best selves – our
hearts, spirits, minds and hands – in the work we do.” This is the definition used for this
research on measuring employee engagement of teams at CHG Healthcare Services.
Organizational Benefits of Employee Engagement
If, as defined by Maylett and Warner (2014), engaged employee invest their
hearts, spirits, minds, and hands into the work they do, what is the benefit to the
organization? One study stated that increasing employee engagement results in what is
called the Engagement-Profit chain (Kruse, 2012). When employees are engaged they put
11
their additional and discretionary effort into work becoming more productive, providing
better service, having less accidents and staying at their jobs longer. This, in turn,
produces higher quality products and happier customers and ultimately drives higher
sales and profits for the company (Kruse, 2012). The research provides organizational
benefits of employee engagement in the areas of quality, safety, retention, performance,
customer satisfaction, and financial results. Examples of organizational benefits from
engaged employees include:
Quality and safety.
• An unnamed Fortune 100 manufacturing company reduced quality errors from 5,658
parts per millions to 52 parts per million (Development Divisional International,
2005).
• Molson Coors Brewing Company saved $1,721,760 in safety costs during a single
year by strengthening employee engagement (Society of Human Resources, 2006).
• Business units in the bottom quartile of engagement had 62 percent more accidents
compared to business units in the top quartile (Gallup Inc., 2006).
Retention.
• Employees who are most committed are 87 percent less likely to leave the
organization (Corporate Leadership Council, 2004).
• Employees with lower engagement are four times more likely to leave their job than
highly engaged employees (Corporate Leadership Council, 2004).
• 66 percent of highly engaged employees reported that they had no plans to leave their
organizations compared to only 12 percent of disengaged employees (Towers Perrin,
2004).
12
Performance.
• Employees who are most committed perform 20 percent better than less committed
employees (Corporate Leadership Council, 2004).
• In a services organization, highly engaged employees achieved 99 percent of their
sales goals, while disengaged sales representatives averaged only a 91 percent rate of
goal achievement (Developmental Divisional International, 2005).
• Business units that reported engagement above the median had a 70 percent higher
likelihood of success than those below the median (Gallup, Inc., 2006).
Customer satisfaction. Teams with higher engagement have a 37 percent net
promoter score (NPS), compared to teams without high engagement, who scored at 10
percent NPS (Aon Hewitt, 2011).
• In a major department store chain, customers scored service higher in customer
engagement measures in departments with highly engaged employees versus
departments with lower engagement (Bates, 2004).
• Sears measured that a 5 percent point improvement in employee engagement drove a
1.3 percent improvement in customer satisfaction (Rucci, Kirn, & Quinn, 1998).
Financial results.
• In companies with 60 percent to 70 percent of their employees engaged, the average
total shareholder return (TSR) was 24.2 percent versus a 9.1 percent return in
companies with only 49 percent to 60 percent engagement rates (Hewett, 2004).
• Companies with highly engaged employees beat average sector revenue growth by 1
percent, low engaged companies were 2 percent below sector revenue growth
(Towers Perrin, 2003).
13
• Business units in the top-quartile of engagement averaged 12 percent higher
profitability than bottom quartile units (Gallup, Inc., 2006).
• Organizations with highly engaged employees achieve 2 times the annual net income
of organizations who do not have engaged employees. In addition, highly engaged
organizations achieve 7 times greater 5-year shareholder return (TSR) than less
engaged organizations (Kenexa, 2009).
• A 5 percent increase in employee engagement correlates to a .7 percent increase in
operating margins (Hewitt, 2004).
The current research shows positive linkage between levels of employee
engagement and organizational benefits in the area of quality, safety, retention,
performance, customer satisfaction and company financial results. This linkage is an
important piece of the puzzle because it clearly shows the consequences of engagement.
The next important step comes in better understanding how to engage employees. What
are the factors in the organization that help employees become engage? To gain
understanding, five theoretical frameworks used to study employee engagement will be
discussed, followed by what research has found as the factors (drivers) of engagement in
employees.
Theoretical Frameworks of Employee Engagement
As scholars and business consultants worked to define the factors that create
engagement in employees, there was a need for a useful and universal theoretical
framework. Similar to trying to find a single definition of employee engagement, a
unique theoretical framework does not exist. My review found several models, each
14
focusing on a different engagement aspect. In this section, I will provide a basic overview
of five theoretical frameworks used during the study of employee engagement.
Herzberg two-factor theory. Although Fredrick Herzberg did not use the term
employee engagement, his early research in motivation in the workplace was
instrumental in the field. Beginning in the 1950’s and working with Bernard Mausner and
Barbara Snyderman, Herzberg began his work on the question of what do people want
from their jobs. In their 1959 book, The Motivation To Work, they asked workers to,
“describe a time, an incident, when you felt good, and a time, an incident, when you felt
bad” at work. The results showed that when employees describe feeling happy at work,
they most often described factors relate to performance successes and opportunities for
professional growth. According to Herzberg, these factors lead to improved job attitudes
“because they satisfy the individuals need for self-actualization in his work” (Herzberg et
al., 1959). When the feeling of job unhappiness was described, they generally were not
associated with the job tasks but with the conditions that “surround” doing the job such as
policies, procedures, and supervision.
Although the results are related to Maslow’s hierarchy of needs theory, the trio
enhanced this conventional theory by proposing a two-factor model. When the first set of
job factors or characteristics, the motivators, are present, they help create motivation in
employees. These factors are intrinsic conditions of the job itself, including sense of
achievement, recognition, the work itself, responsibility and advancement. However,
Herzberg believed that if these motivators were not present, employees did not become
dissatisfied at work, they only showed a lack of motivation.
15
There is a second set of job factors or characteristics that if not present creates
dissatisfaction or “poor job attitude”. These factors are called hygiene factors and include
extrinsic aspects of the job including company policies and administration, supervision,
salary, interpersonal relationships, and working conditions. When hygiene factors fall
below employee expectations, then job dissatisfaction occurs. However, meeting
employee expectations of these factors does not create higher motivation levels in
employees but only serves to remove employee dissatisfaction from work (Herzberg et
al., 1959).
Herzberg’s two-factor theory stated that to improve overall satisfaction at work,
companies and leaders must focus on improving both sets of characteristics, the
elimination of dissatisfaction through meeting employee expectations of hygiene factors
and improvement in motivation through the increase in motivators.
The needs-satisfying model. The Needs-Satisfying framework, introduced by
William Kahn (1990), states that employees become engaged when three psychological
needs are met at work: meaningfulness, psychological safety and availability.
Meaningfulness is defined as the feeling of being useful, worthwhile, and valuable in
one’s job. This is influenced by three factors with the job: task characteristics, job
characteristics, and interactions with coworkers. Meaningfulness also is positively
influenced by role fit and challenging work. Psychological safety refers to an employee
feeling they can show their true self without the fear of negative consequences. If an
individual senses that there will be negative consequences for expressing their true self,
such as damage to self-image, reputation, or career, they are less likely to feel
psychologically safe, and therefore less likely to be engaged. Safety is influenced by
16
interpersonal relationships, team and group dynamics, norms of the organizations and
management styles. The final factor, availability, is the individual’s belief of having the
physical and mental resources to engage at work. This factor is dependent on personal
capacity that each employee brings to the role. Anything that reduces this capacity (such
as lack of energy or illness) will negatively effect the engagement of the individual.
According to Schaufelli (2013), Kahn’s framework theorizes, “when a job is
challenging and meaningful, the social environment at work is safe, and personal
resources are available, the needs of meaningfulness, safety and availability are satisfied
and thus engagement is likely to occur.” Although Kahn’s theory and definition of
engagement has been commonly used in the literature, there has been little testing or
research completed. In 2004, May, Gilson and Harter tested the theory in a small
qualitative field study of employees working at an insurance company. In the study, they
found that the factors of meaningfulness, safety and availability did have a positive
association with engagement (May, Gilson, & Harter, 2004).
The job demands-resources model. Introduced in the Journal of Managerial
Psychology by Bakker and Demerouti (2007), this model centers on how job demands
and job resources influence job stress. Job demand is defined as the “physical,
psychological, social, or organizational aspects of the job that require sustained physical
and/or psychological efforts or skills” (Bakker & Demerouti, 2007). Because sustained
efforts are needed for job demands, they can produce physical or psychological costs that
can become job stressors when the employee cannot adequately recover from these costs
(Meijman Mulder, 1998). When job demands become stressors it begins a cycle called
the health impairment process (Bakker & Demerouti, 2007). Driven by negative job
17
factors such as too much workload, role conflict and organizational politics, stressors
cause additional energy to be used to achieve success or meet performance levels. If
recovery from this negative process is inadequate or insufficient, employees will
eventually exhaust themselves and burnout leading to lower engagement or
dissatisfaction. Burnout leads to other negative outcomes such as depression,
cardiovascular disease or psychological complaints (Melamed, Shriom, Toker, Berlinger,
& Shapria, 2006).
On the other hand, job resources produce more positive results and refer to the
“physical, psychological, social, or organizational aspects of the job that are either/or:
• Functional in achieving work goals.
• Reduce job demands and the associated physical and psychological costs.
• Stimulate personal growth, learning, and development” (Bakker & Demerouti, 2007).
Examples of job resources include performance feedback, autonomy, social
support, decision-making involvement and career advancement. Another type of
resource, personal resources, defined as aspects of a person that help to control a person’s
environment successfully, also plays an important role in reducing job demands. Job and
personal resources not only help alleviate job demands but can also create a motivational
potential to the employee. As it pertains to employee engagement, this model believes
that work engagement results from the motivating nature of job and personal resources.
Resources energize employees, encourage persistence, and make them focus on their
efforts (Schaufeli, 2013). When this happens, it is called the motivational process
(Bakker & Demerouti, 2007).
18
There is much empirical evidence for the presence of both the motivational and
health impairment process in engagement. Schaufeli, Taris, and Rhenen (2007) reviewed
the results of 16 employee engagement studies in seven countries and found that in every
study both the motivational and health impairment processes were observed. Mounting
empirical evidence suggests that this motivational process is dynamic in driving overall
employee well-being and engagement (Schaufelli, 2007).
The affective shift model. Work engagement is a dynamic process. A person
may move in and out of engagement throughout each workday depending on what tasks
are being performed or what kinds of experiences the person is exposed to (Sonnentag,
Dormann, & Demerouti, 2010). The Affective Shift Model, presented by Bledlow,
Schmitt, Frese, and Kuhnel (2011) states that during each workday, employees receive
both positive and negative experiences, called “affects”. Work engagement levels only
result from moving from a negative affect to a positive affect over time. Engagement will
remain low if an employee remains in a negative affective state without experiencing a
positive affect. If a positive affect is experienced, the result will be a decrease in the
negative motivation and a release of positive motivation. This shift is called the Affective
Shift (Bledlow et al, 2011). The higher the level of the negative affect being experienced
or the higher level of the positive affect that the employee receives, the greater the
affective shift and, in theory, the greater the work engagement. This dynamic interplay
between these positive and negative experiences at work is what produces employee
engagement.
Bledlow et al. (2011) conducted a research study on a group of IT employees for
two weeks and found that moving from a negative experience, which created a negative
19
mood, into an experience of positive affect produced higher work engagement. This
relatively small study of fifty-five employees has been the only research conducted on
this framework.
Social exchange model. The final framework presented is the Social Exchange
Theory (SET), which begins with a basic tenet that “relationships evolve over time into
trusting, loyal, and mutual commitments as long as the parties abide by certain rules of
exchange” (Cropanzano & Mitchell, 2005, p. [page no.?]). For example, an employee
who receives economic (e.g. fair pay, benefits) or socio-emotional (e.g. recognition and
social support) resources will feel obligated to repay these resources by working hard to
successfully complete her tasks. Saks (2006) believes that one of the ways an individual
can repay their company is through the level of engagement provided. Using Kahn’s
(1990) definition of engagement, a person will devote greater amounts of cognitive,
emotional and physical resources based on their response to greater perceived value in
organizational actions (Saks, 2006). Alternatively, if an organization fails to provide
necessary or desired resources, the employee is not likely to feel an obligation or desire to
provide additional effort in her job. In short, the amount of cognitive, emotional, and
physical resources an individual is willing to provide is contingent on the economic and
socio-emotional resources provided by the organization.
With the SET model, Saks went on to test possible antecedents (drivers) of
employee engagement. Until this point, little academic study, other than theoretical
models, had been completed in this area. In fact, most of the information about the
drivers of employee engagement came from practitioner literature and consulting firms.
Using 102 employees working in a variety of positions and companies, Saks measured
20
what drivers would produce more job and organizational engagement. One result from
his research found that the antecedent of perceived organizational support, especially in
the areas of demonstrating care and hearing and addressing employee needs, created a
clear linkage of higher job and organization engagement.
Summary of theoretical frameworks. All these theoretical frameworks provide
meaningful theoretical basis for understanding what causes employee engagement.
Unfortunately, few of the theories have been fully academically researched and tested
and their still seems to be a surprising dearth of research on employee engagement in the
academic literature (Robinson, Perryman, & Hayday, 2004). To gain more insight into
the drivers of employee engagement, we must turn to practitioner research. The next
section presents the organization drivers of employee engagement.
Organizational Drivers of Employee Engagement
Research shows that engaged employees perform better (Robinson et al., 2004).
Therefore a central question for business organizations is what drives employee
engagement? What are the resources and experiences that an organization can provide to
increase engagement level of employees? Although some academic work has been
completed in understanding engagement drivers (Bakker & Demerouti, 2007; Robinson
et al., 2004; Saks, 2006), most studies come from business consultancy firms such as
Aon, Hewitt and Gallup.
Organizations cannot tell employees how to be engaged. What they can do is
provide experiences and conditions to allow engagement to grow (Maylett & Warner,
2014). This idea is similar to Bakker and Demerouti’s (2007) concept of providing
motivational job resources in the Jobs-Demand framework or employees receiving
21
economic and socio-emotional resources in the Social Exchange Model, both discussed
earlier (Cropanzano & Mitchell, 2005). These resources provided by an organization
become the drivers for employee engagement. Desired consequences of increased
employee engagement are the organizational benefits discussed earlier in this chapter
including increased production, more organizational commitment and increased quality
or service.
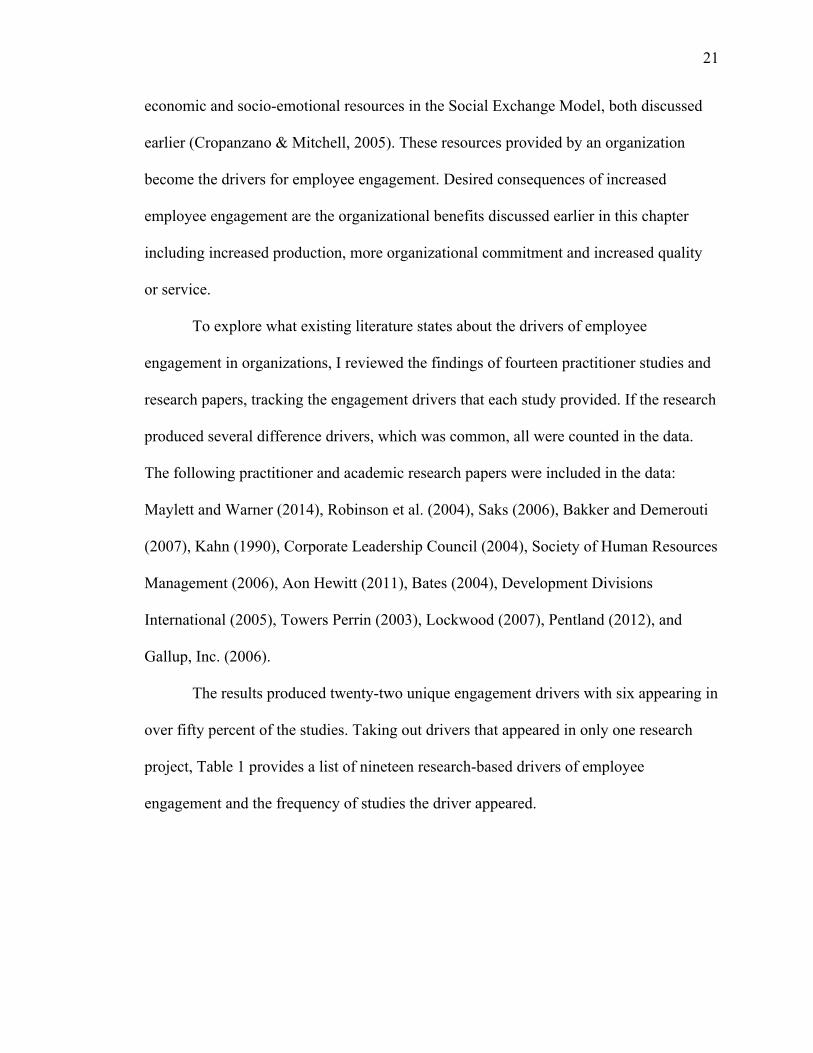
To explore what existing literature states about the drivers of employee
engagement in organizations, I reviewed the findings of fourteen practitioner studies and
research papers, tracking the engagement drivers that each study provided. If the research
produced several difference drivers, which was common, all were counted in the data.
The following practitioner and academic research papers were included in the data:
Maylett and Warner (2014), Robinson et al. (2004), Saks (2006), Bakker and Demerouti
(2007), Kahn (1990), Corporate Leadership Council (2004), Society of Human Resources
Management (2006), Aon Hewitt (2011), Bates (2004), Development Divisions
International (2005), Towers Perrin (2003), Lockwood (2007), Pentland (2012), and
Gallup, Inc. (2006).
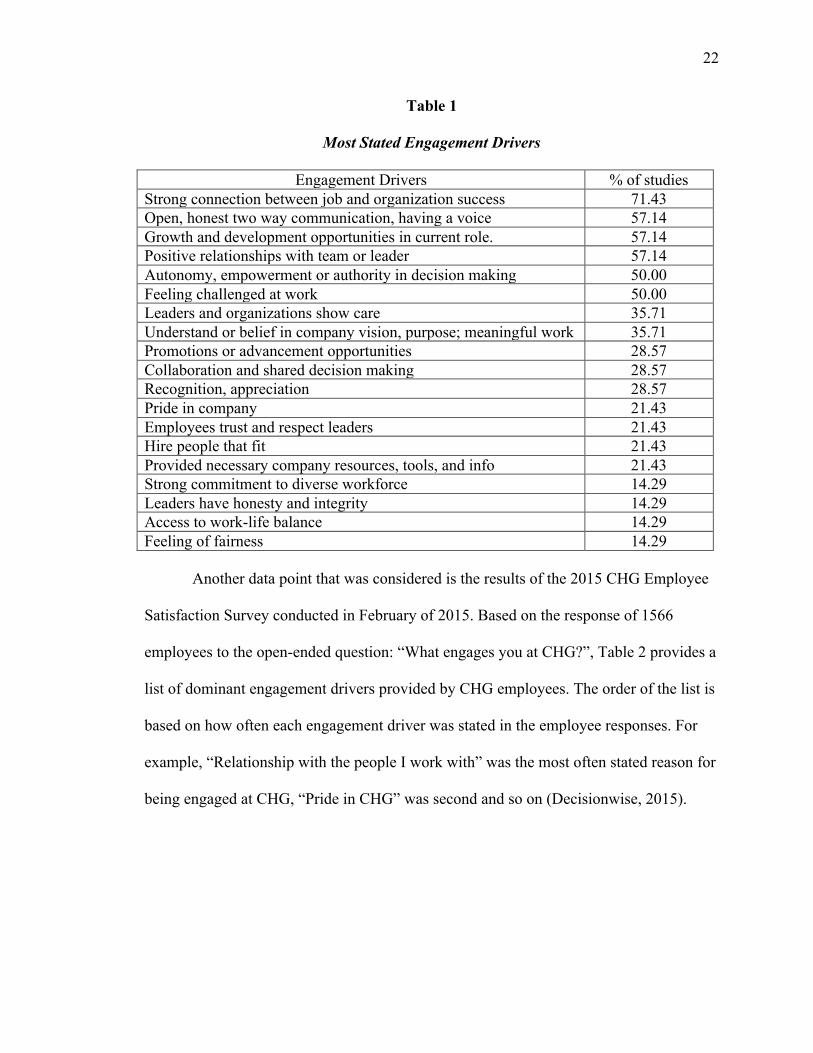
The results produced twenty-two unique engagement drivers with six appearing in
over fifty percent of the studies. Taking out drivers that appeared in only one research
project, Table 1 provides a list of nineteen research-based drivers of employee
engagement and the frequency of studies the driver appeared.
22
Table 1
Most Stated Engagement Drivers
Engagement Drivers % of studies Strong connection between job and organization success 71.43 Open, honest two way communication, having a voice 57.14 Growth and development opportunities in current role. 57.14 Positive relationships with team or leader 57.14 Autonomy, empowerment or authority in decision making 50.00 Feeling challenged at work 50.00 Leaders and organizations show care 35.71 Understand or belief in company vision, purpose; meaningful work 35.71 Promotions or advancement opportunities 28.57 Collaboration and shared decision making 28.57 Recognition, appreciation 28.57 Pride in company 21.43 Employees trust and respect leaders 21.43 Hire people that fit 21.43 Provided necessary company resources, tools, and info 21.43 Strong commitment to diverse workforce 14.29 Leaders have honesty and integrity 14.29 Access to work-life balance 14.29 Feeling of fairness 14.29 Another data point that was considered is the results of the 2015 CHG Employee
Satisfaction Survey conducted in February of 2015. Based on the response of 1566
employees to the open-ended question: “What engages you at CHG?”, Table 2 provides a
list of dominant engagement drivers provided by CHG employees. The order of the list is
based on how often each engagement driver was stated in the employee responses. For
example, “Relationship with the people I work with” was the most often stated reason for
being engaged at CHG, “Pride in CHG” was second and so on (Decisionwise, 2015).
23
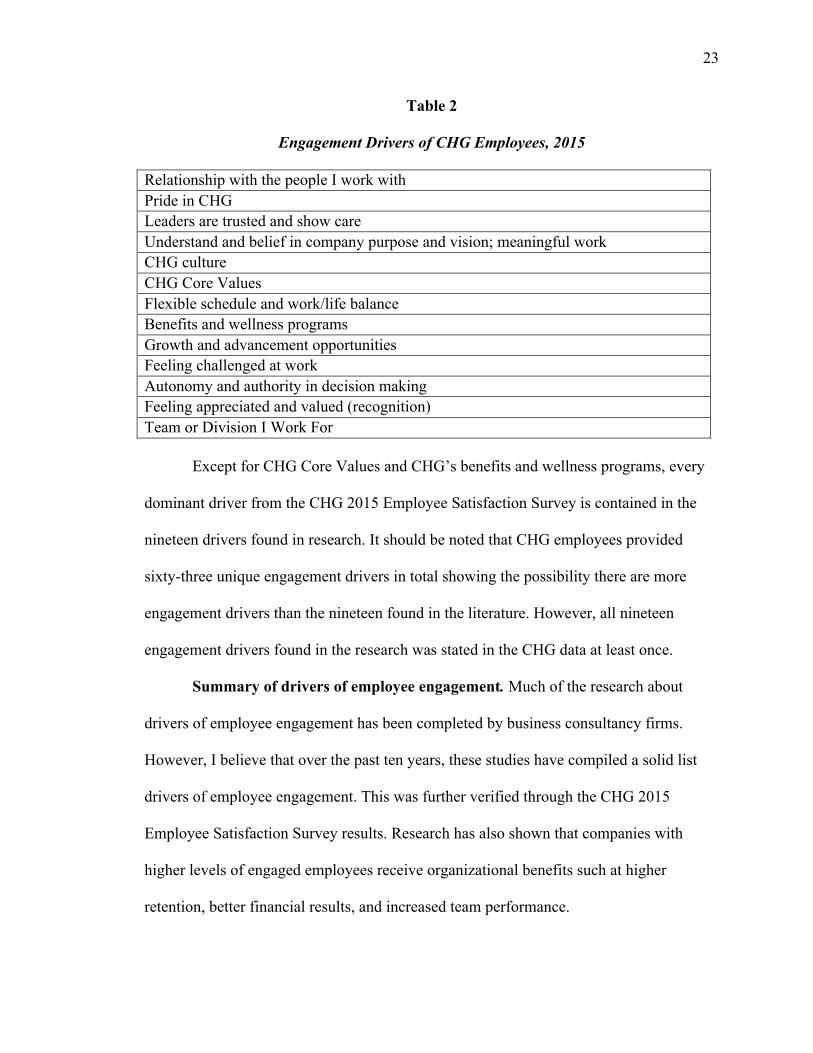
Table 2
Engagement Drivers of CHG Employees, 2015
Relationship with the people I work with Pride in CHG Leaders are trusted and show care Understand and belief in company purpose and vision; meaningful work CHG culture CHG Core Values Flexible schedule and work/life balance Benefits and wellness programs Growth and advancement opportunities Feeling challenged at work Autonomy and authority in decision making Feeling appreciated and valued (recognition) Team or Division I Work For Except for CHG Core Values and CHG’s benefits and wellness programs, every
dominant driver from the CHG 2015 Employee Satisfaction Survey is contained in the
nineteen drivers found in research. It should be noted that CHG employees provided
sixty-three unique engagement drivers in total showing the possibility there are more
engagement drivers than the nineteen found in the literature. However, all nineteen
engagement drivers found in the research was stated in the CHG data at least once.
Summary of drivers of employee engagement. Much of the research about
drivers of employee engagement has been completed by business consultancy firms.
However, I believe that over the past ten years, these studies have compiled a solid list
drivers of employee engagement. This was further verified through the CHG 2015
Employee Satisfaction Survey results. Research has also shown that companies with
higher levels of engaged employees receive organizational benefits such at higher
retention, better financial results, and increased team performance.
24
However, I found no research completed on direct linkages between engagement
drivers and specific organizational benefits. Saks (2006) provided a framework of
indirect linkage by showing that certain resources (drivers) create employee engagement.
Employee engagement then creates certain consequences (positive organizational
benefits). Kruse (2012) added to this idea through his Employee-Profit chain.
This idea of direct linkage between engagement drivers and organizational
benefits deserves further investigation and study. In this research, I will investigate which
engagement factors directly impact one organizational benefit, employee productivity, in
highly engaged employees at CHG. Therefore, to fully gain an understanding of the
literature, it is necessary to also look into any research regarding the drivers of individual
and team productivity.
Definition and drivers of high performance and productivity. According to
research, the average team achieves only 63 percent of the objectives on their strategic
plans (Harvard Business Review, 2005). The literature shows that engagement positively
influences productivity and performance. Employees who are most committed perform
20 percent better than less committed employees (Corporate Leadership Council, 2004).
In a services organization, highly engaged employees achieved 99 percent of their sales
goals, while disengaged sales representatives averaged 91 percent rate (Development
Divisions International, 2005). Business units that reported engagement above the median
had a 70 percent higher likelihood of success than those below the median (Gallup Inc.,
2006). However, the employee engagement literature is quiet on drivers that directly
improve employee and team productivity.
25
For organizational success, it is important to have strong teams to develop and
implement solutions that will meet organizational goals (Sommer, 2010). Katzenbach and
Smith (1993) define a team as, “a small number of people with complimentary skills who
are committed to a common purpose, set of performance goals, and approach, for which
they hold themselves mutually accountable.” A high performing team is one that
produces results thar exceed productivity expectations and performance of other teams
(Shephard & Isaksen, 2009; Sommer, 2010).
So what are the drivers of high performance in teams? Although there is minimal
research on performance drivers, some studies have been completed. It should be noted
that all of the studies found are by business consultancy practitioners. A study of nine
papers found the following list of drivers for high performance teams. The research
studies were used this data include: Limbrey, Meikle & Berggren; Sommer, 2010;
Shephard & Isaksen, 2009; Rialto Consultancy, 2011; Psychology Today, n.d.;
Katzenbach & Smith, 1993; Lencioni, 2002; Pentland, 2012; and Harpst, 2008.
None of the studies attempted to make any connection between high productivity
and employee engagement. The studies focused entirely on the drivers necessary to build
a highly productively and effective team.
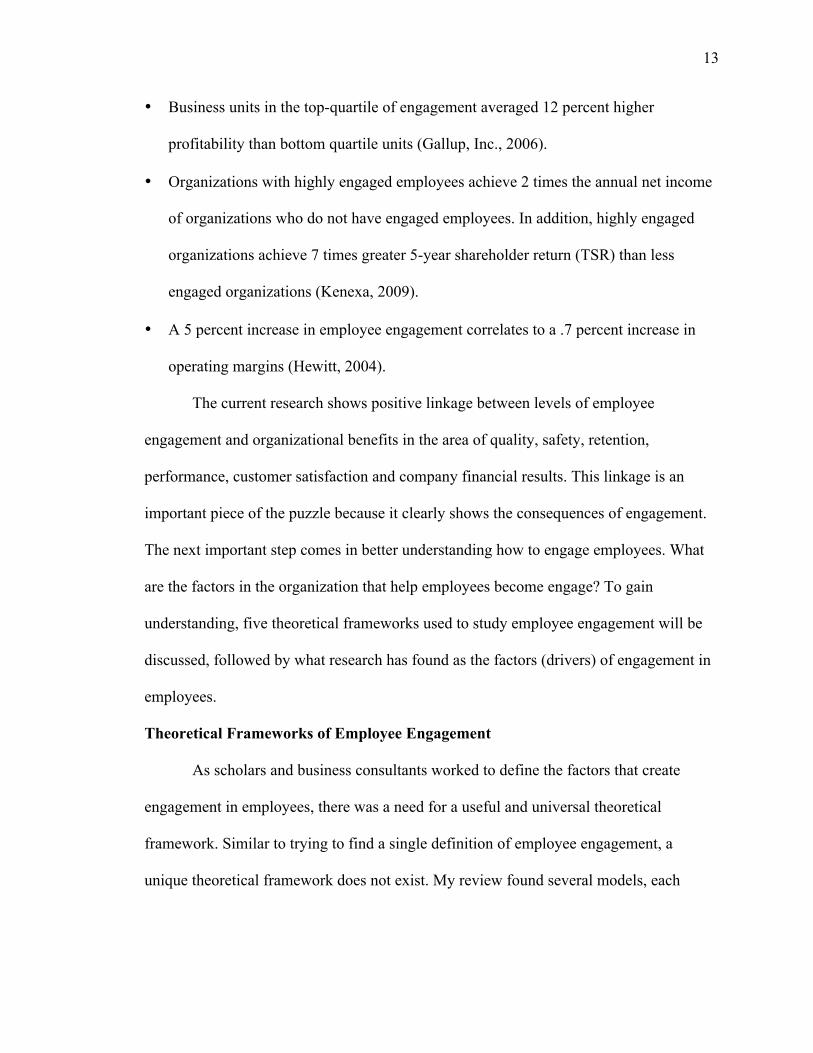
Table 3 shows the thirteen unique factors identified to build a highly productive
team in the research reviewed. Comparing these drivers to the drivers of employee
engagement showed an interesting correlation. Seven of the thirteen drivers (or 53.8%)
reported as leading to high team productivity are also drivers for employee engagement.
A comparison of the drivers of both employee engagement and high performance teams
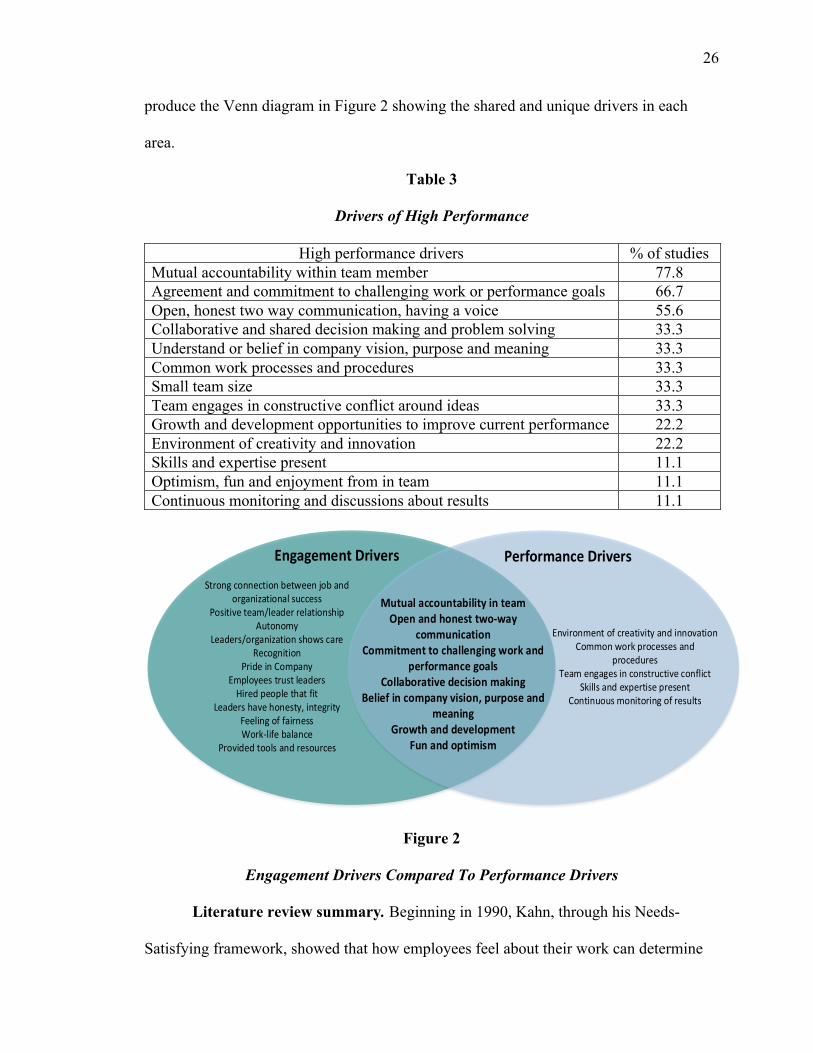
26
produce the Venn diagram in Figure 2 showing the shared and unique drivers in each
area.
Table 3
Drivers of High Performance
High performance drivers % of studies Mutual accountability within team member 77.8 Agreement and commitment to challenging work or performance goals 66.7 Open, honest two way communication, having a voice 55.6 Collaborative and shared decision making and problem solving 33.3 Understand or belief in company vision, purpose and meaning 33.3 Common work processes and procedures 33.3 Small team size 33.3 Team engages in constructive conflict around ideas 33.3 Growth and development opportunities to improve current performance 22.2 Environment of creativity and innovation 22.2 Skills and expertise present 11.1 Optimism, fun and enjoyment from in team 11.1 Continuous monitoring and discussions about results 11.1
Strong connection between job and organizational success
Positive team/leader relationshipAutonomy
Leaders/organization shows careRecognition
Pride in CompanyEmployees trust leadersHired people that fit
Leaders have honesty, integrityFeeling of fairnessWork-‐life balance
Provided tools and resources
Engagement Drivers Performance Drivers
Environment of creativity and innovationCommon work processes and
proceduresTeam engages in constructive conflict
Skills and expertise presentContinuous monitoring of results
Mutual accountability in teamOpen and honest two-‐way
communicationCommitment to challenging work and
performance goalsCollaborative decision making
Belief in company vision, purpose and meaning
Growth and developmentFun and optimism
Figure 2
Engagement Drivers Compared To Performance Drivers
Literature review summary. Beginning in 1990, Kahn, through his Needs-
Satisfying framework, showed that how employees feel about their work can determine
27
their engagement levels, and ultimately the amount of discretionary effort an employee
provides in their job. From this first engagement study, academic and business
researchers have focused on answering questions on both sides of employee engagement.
On one side, what are resources (both organizational and personal) that create
engagement at work. In the business research, this has been categorized as drivers of
engagement. On the other side of employee engagement, what are the consequences that
occur once an employee is engaged (Saks, 2006). Consequences are the organizational
benefits received from having engaged employees. The literature shows benefits in the
area of quality and safety, retention, customer service, financial results and performance.
However, the only linkage in the literature between the drivers and benefits is
indirect. Saks (2006) and Kruse (2012) both show this indirect linkage. The research
demonstrates that if an organization provides all or some of the key engagement drivers
to employees, then engagement will occur. The organizational benefit of this employee
engagement includes higher production and quality, higher retention, lower absenteeism,
better customer service and improved financial results. However, I found an absence in
the research concerning the identification of what engagement drivers create which
benefit. Even after a review of the literature around creating high performing teams, the
nine studies reviewed made no attempt to link productivity drivers to research already
completed on engagement drivers even tough an increase in productivity is a key benefit
of employee engagement.
The purpose of this research is to find linkage between engagement drivers and
team and individual and team productivity performance. The study will address the
following primary question:
28
In highly engaged teams at CHG, what engagement drivers do employees feel
most directly, positively impacts their productivity?
In addition, the research will also try to gain understanding regarding how
employees feel that these engagement factors positively impact productivity. The rest of
the chapters will explore these questions beginning with description of the research
methodology and study procedures.
29
Chapter 3
Research Methodology and Procedures
The purpose of this research is to find linkage between engagement drivers and
team and individual and team productivity by answering the question: “In highly engaged
teams at CHG, what engagement drivers do employees feel most directly, positively
impacts their productivity?” This chapter will describe the study design, sample
determination, data collection methods, and data analysis procedures.
Study Design
This study consists of a mixed-method data design, using a written survey and
face-to-face focus groups. This approach uses both qualitative and quantitative
methodology in a single study. This approach is being used in an effort to achieve
triangulation of the data to improve the validity of the data collected (Maxwell, 2013).
The survey design will provide data related to the engagement drivers that employees
state positively impact high individual and team productivity. Focus groups discussions
will provide qualitative information by gaining deeper understanding through eliciting the
feelings, attitudes, and perceptions from participants on how these drivers create the
positive impact. In addition, group discussions will provide feedback on what role leaders
play in creating these engagement drivers. One advantage of focus groups over individual
interviews is that the study may find some commonalities and disparities through
participant discussions (Franz, 2012). In this study, data will be gathered in four
participant samples. Sample determination and data collection are discussed in the next
sections of this chapter.
30
Sample Determination
Samples will be chosen using a non-probability, purposeful, selection
methodology. The primary criteria in selecting participants for this research was
membership in a highly engaged sales or business partner team at CHG. This approach
was chosen to ensure that only highly engaged individuals are selected to test the possible
engagement drivers of high performance. According to Maxwell, in a purposeful
selection strategy, “particular settings, persons, or activities are selected deliberately to
provide information that is particularly relevant to your question and goals, and that
cannot be gotten as well from other choices” (Maxwell, 2013). Because the dependent
variable in this research is high employee engagement, other non-probability sampling
methods, such as self-selection or convenience, and probability sampling methods, such
as simple and stratified random samples, are not effective.
CHG is a healthcare staffing company placing temporary and permanent
healthcare professionals, including physicians, nurses and allied health providers, in
clients across the country. Clients are mostly hospitals, clinics and large physician
groups. The company currently employs 2000 staff employees with headquarters in Salt
Lake City and offices in seven locations. Contact with healthcare professionals are most
often made by the employee positions of recruiters and provider representatives. For
clients, contact is from client developers and client representatives. These positions
represent the sale functions of the business and collectively comprise the CHG “sales
employees”. Sales employees productivity is based on gross margin generated by
provided providers working at clients. Gross margin is defined as bill rates less traveler
costs (including traveler wages, benefits, housing and travel costs). Sales teams are
31
structures around provider work specialties. Examples of specialty teams include primary
care, emergency medicine or pediatrics. Employees providing corporate support
functions to CHG are called “business partner employees.” Business partner productivity
may be based on different factors depending on function. Primarily these will fit into the
areas of meeting productivity expectations or project timelines with an acceptable level of
quality and customer service. Examples of business partner teams include marketing,
human resources, information technology or quality assurance.
It should be noted that the researcher is an executive leader at CHG and has
access to all 2000 employees within the company and data necessary to determine highly
engaged teams at the company. The study uses a purposeful sampling approach chosen
based on the criteria of highly engaged team. The two sample groups consist of the
following:
Sample A – Employees of sales teams with high engagement in the 2015 CHG
Employee Opinion Survey.
Sample B– Employees of business partner teams with high engagement in the
2015 CHG Employee Opinion Survey
These samples were chosen to test if possible result differences between sales
employees and support function employees (business partners) at CHG. It was felt that
since productivity is defined fundamentally differently between this groups, separating
employees based on this demographic would create more open and honest discussions.
Definition of high engagement. Each year, CHG conducts the CHG Employee
Opinion Survey administered by DecisionWise, Inc., a national employee engagement
survey and consulting company. The survey consists of fifty questions, which are rated
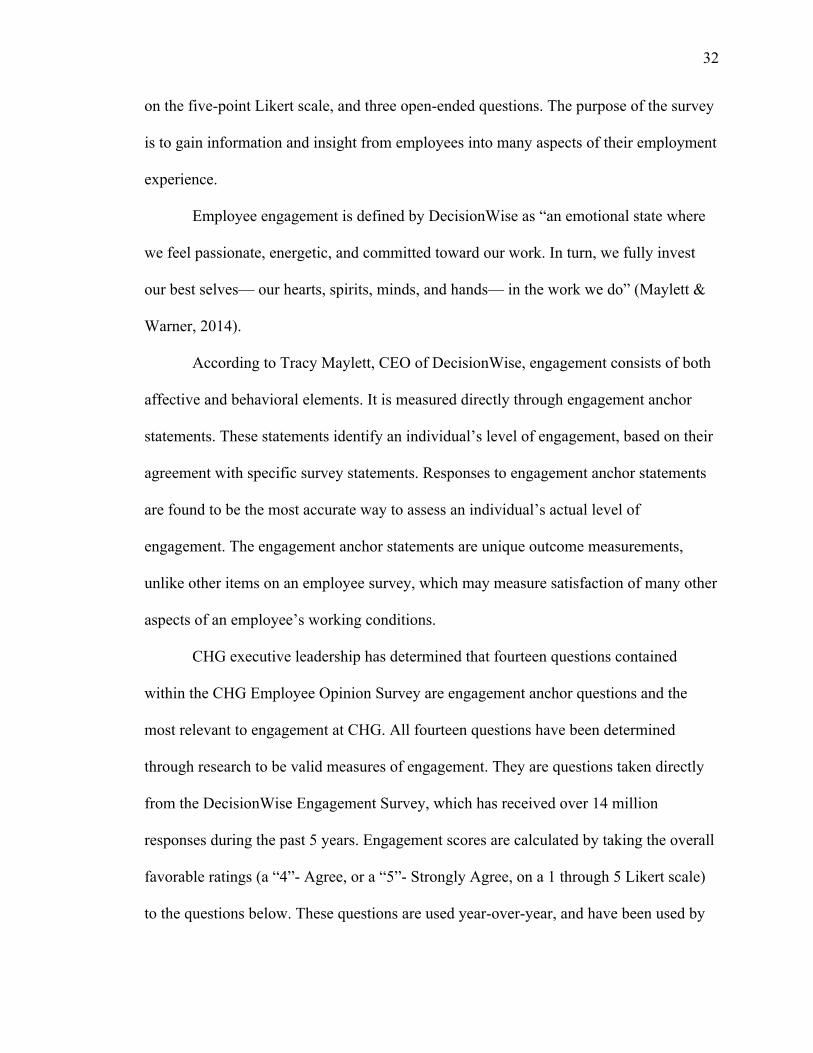
32
on the five-point Likert scale, and three open-ended questions. The purpose of the survey
is to gain information and insight from employees into many aspects of their employment
experience.
Employee engagement is defined by DecisionWise as “an emotional state where
we feel passionate, energetic, and committed toward our work. In turn, we fully invest
our best selves— our hearts, spirits, minds, and hands— in the work we do” (Maylett &
Warner, 2014).
According to Tracy Maylett, CEO of DecisionWise, engagement consists of both
affective and behavioral elements. It is measured directly through engagement anchor
statements. These statements identify an individual’s level of engagement, based on their
agreement with specific survey statements. Responses to engagement anchor statements
are found to be the most accurate way to assess an individual’s actual level of
engagement. The engagement anchor statements are unique outcome measurements,
unlike other items on an employee survey, which may measure satisfaction of many other
aspects of an employee’s working conditions.
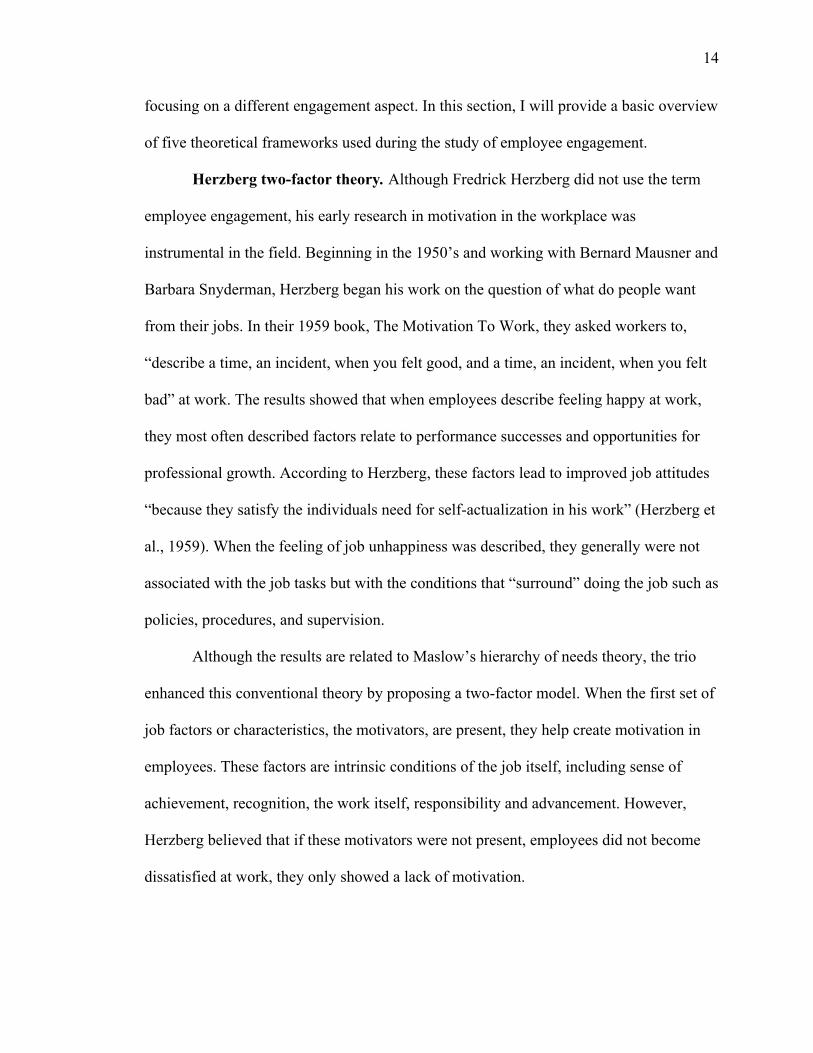
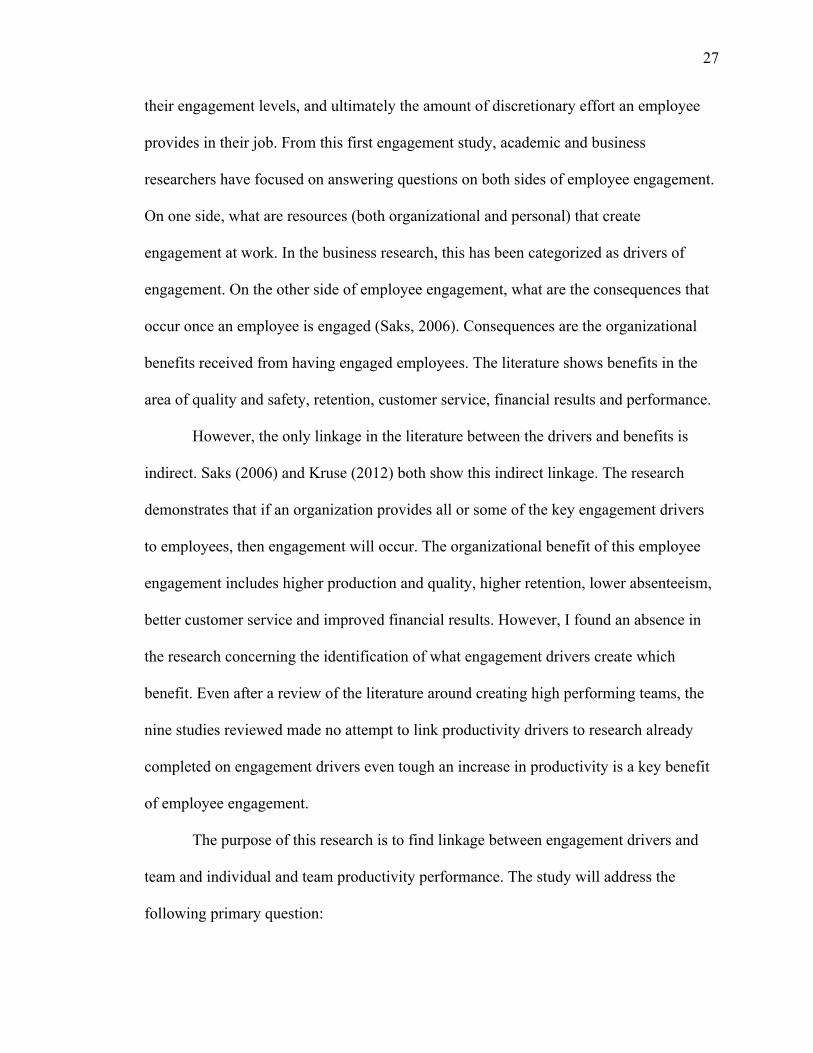
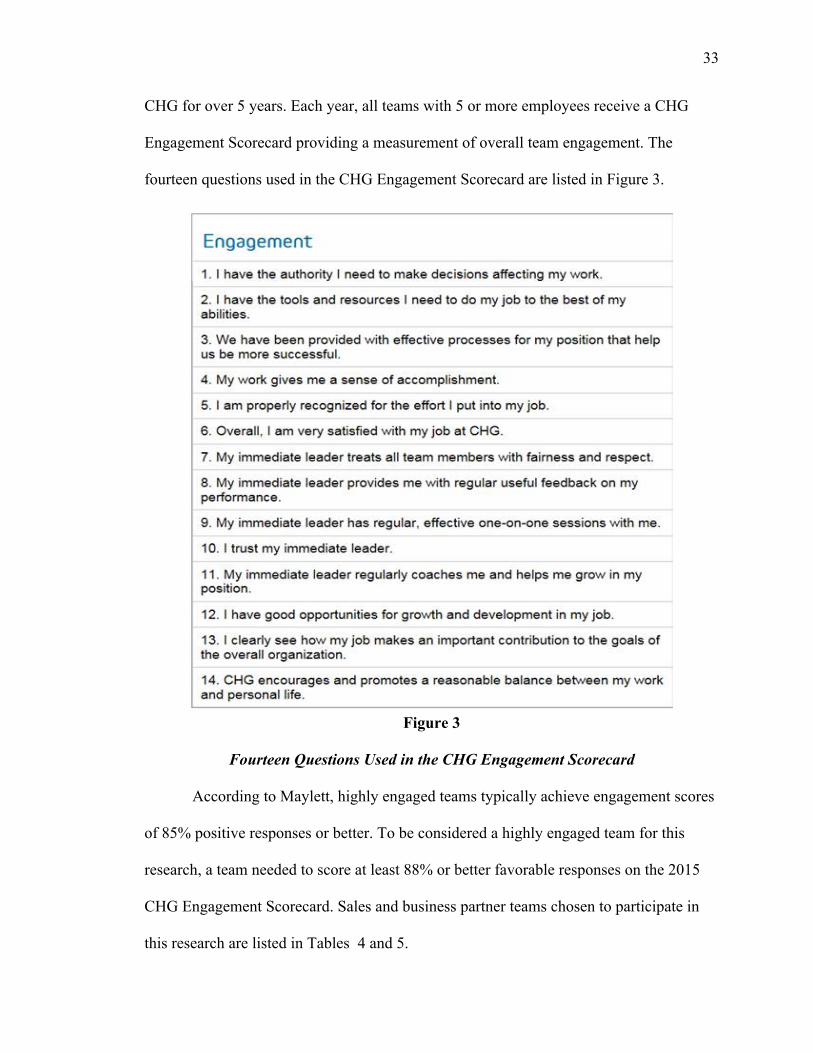
CHG executive leadership has determined that fourteen questions contained
within the CHG Employee Opinion Survey are engagement anchor questions and the
most relevant to engagement at CHG. All fourteen questions have been determined
through research to be valid measures of engagement. They are questions taken directly
from the DecisionWise Engagement Survey, which has received over 14 million
responses during the past 5 years. Engagement scores are calculated by taking the overall
favorable ratings (a “4”- Agree, or a “5”- Strongly Agree, on a 1 through 5 Likert scale)
to the questions below. These questions are used year-over-year, and have been used by
33
CHG for over 5 years. Each year, all teams with 5 or more employees receive a CHG
Engagement Scorecard providing a measurement of overall team engagement. The
fourteen questions used in the CHG Engagement Scorecard are listed in Figure 3.
Figure 3
Fourteen Questions Used in the CHG Engagement Scorecard
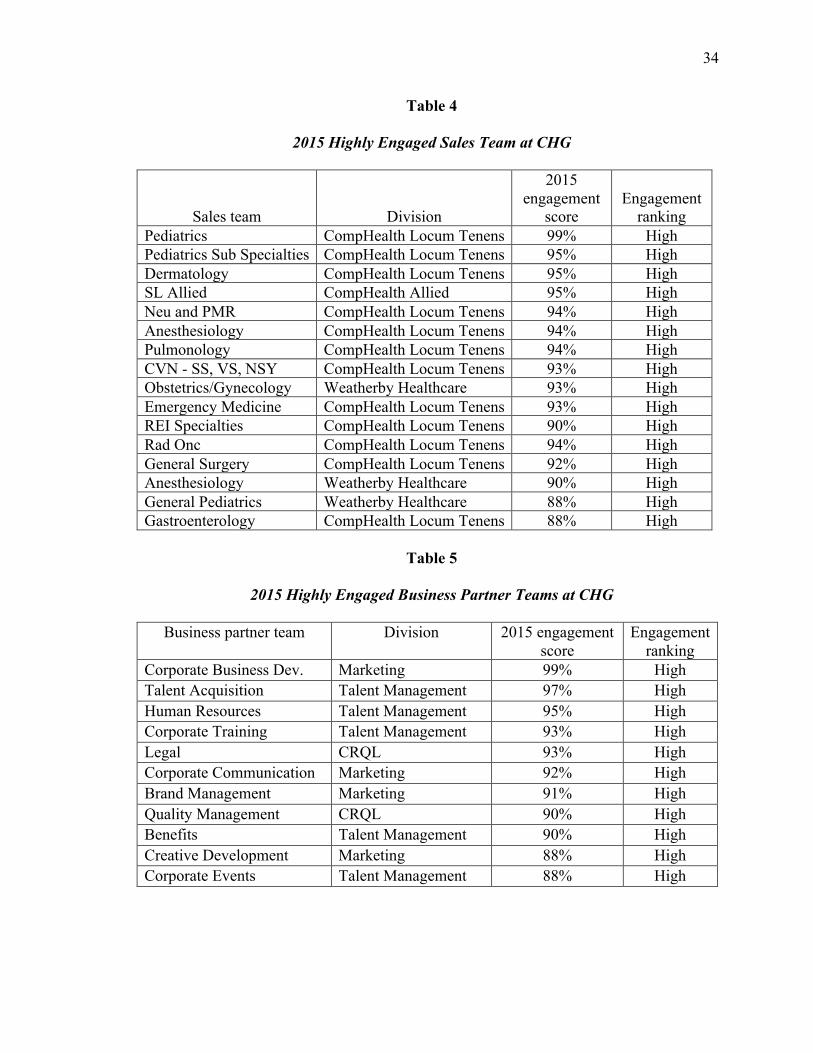
According to Maylett, highly engaged teams typically achieve engagement scores
of 85% positive responses or better. To be considered a highly engaged team for this
research, a team needed to score at least 88% or better favorable responses on the 2015
CHG Engagement Scorecard. Sales and business partner teams chosen to participate in
this research are listed in Tables 4 and 5.
34
Table 4
2015 Highly Engaged Sales Team at CHG
Sales team Division
2015 engagement
score Engagement
ranking Pediatrics CompHealth Locum Tenens 99% High Pediatrics Sub Specialties CompHealth Locum Tenens 95% High Dermatology CompHealth Locum Tenens 95% High SL Allied CompHealth Allied 95% High Neu and PMR CompHealth Locum Tenens 94% High Anesthesiology CompHealth Locum Tenens 94% High Pulmonology CompHealth Locum Tenens 94% High CVN - SS, VS, NSY CompHealth Locum Tenens 93% High Obstetrics/Gynecology Weatherby Healthcare 93% High Emergency Medicine CompHealth Locum Tenens 93% High REI Specialties CompHealth Locum Tenens 90% High Rad Onc CompHealth Locum Tenens 94% High General Surgery CompHealth Locum Tenens 92% High Anesthesiology Weatherby Healthcare 90% High General Pediatrics Weatherby Healthcare 88% High Gastroenterology CompHealth Locum Tenens 88% High
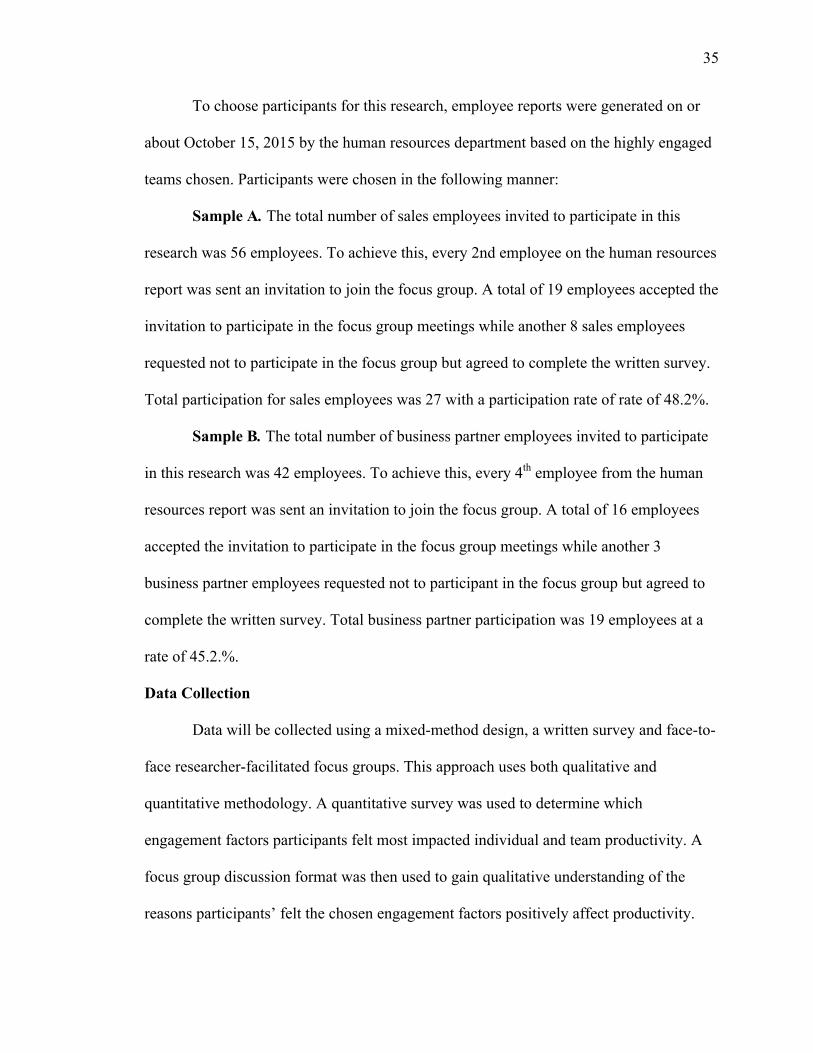
Table 5
2015 Highly Engaged Business Partner Teams at CHG
Business partner team Division 2015 engagement score
Engagement ranking
Corporate Business Dev. Marketing 99% High Talent Acquisition Talent Management 97% High Human Resources Talent Management 95% High Corporate Training Talent Management 93% High Legal CRQL 93% High Corporate Communication Marketing 92% High Brand Management Marketing 91% High Quality Management CRQL 90% High Benefits Talent Management 90% High Creative Development Marketing 88% High Corporate Events Talent Management 88% High
35
To choose participants for this research, employee reports were generated on or
about October 15, 2015 by the human resources department based on the highly engaged
teams chosen. Participants were chosen in the following manner:
Sample A. The total number of sales employees invited to participate in this
research was 56 employees. To achieve this, every 2nd employee on the human resources
report was sent an invitation to join the focus group. A total of 19 employees accepted the
invitation to participate in the focus group meetings while another 8 sales employees
requested not to participate in the focus group but agreed to complete the written survey.
Total participation for sales employees was 27 with a participation rate of rate of 48.2%.
Sample B. The total number of business partner employees invited to participate
in this research was 42 employees. To achieve this, every 4th employee from the human
resources report was sent an invitation to join the focus group. A total of 16 employees
accepted the invitation to participate in the focus group meetings while another 3
business partner employees requested not to participant in the focus group but agreed to
complete the written survey. Total business partner participation was 19 employees at a
rate of 45.2.%.
Data Collection
Data will be collected using a mixed-method design, a written survey and face-to-
face researcher-facilitated focus groups. This approach uses both qualitative and
quantitative methodology. A quantitative survey was used to determine which
engagement factors participants felt most impacted individual and team productivity. A
focus group discussion format was then used to gain qualitative understanding of the
reasons participants’ felt the chosen engagement factors positively affect productivity.

36
Focus group process. The focus groups consisted of a written survey followed
with facilitator-led dialogue. For sales employees 4 focus groups were planned with 14
sales employees invited to each meeting. Actual participation was approximately 5 sales
employees per focus group. Business partner employees had 3 focus groups with 5
participants in each meeting.
A meeting invitation was sent via the CHG internal e-mail system to possible
participants (56 sales employees and 42 business partner employees) including the
wording of the Focus Group Participant Letter (see Appendix A). A reminder e-mail was
sent 2-3 days prior to the meeting for those accepting the meeting invitation. Focus
groups took place in a conference room on the premises of CHG.
At the meeting, participants were provided the Research Project Information
Sheet (see Appendix B) and asked to read and provide any questions about the research.
Those not wishing to participate in the research could then leave the focus group. No
participants chose to leave the research based on this information.
The focus group process began with a written Focus Group Questionnaire (see
Appendix C). Demographic information was asked so results can be analyzed based on
several factors including participant gender, age, team, and tenure at CHG and customer
focus. The survey consisted of participants individually reviewing a list of employment
factors and participants choosing the factors that they felt most positively impact their
individual and team productivity. Instructions from the written survey states:
Listed below are twenty-three statements about your employment experience. Please review each of the statements and choose the top 5 employment experience factors that you feel most positively impacts creating high productivity and performance for you and your team. Indicate these primary factors by placing a “P” in the box next to the factor.
37
Review the remaining factors and place an “S” in the box in the next 5 factors that you feel most positively impacts individual and team productivity and performance. These are your secondary employee experience factors. Finally, review the five factors that you chose as the “primary” factors. Choose the factor that you feel makes the single biggest impact on your productivity and performance. Mark this as a P1.
The 23 employment factors chosen for the written survey were compiled based on
research of engagement drivers and drivers of high performing team.
Once the questionnaire was completed, the facilitator conducted a qualitative
dialogue outlined in the Focus Group Process and Qualitative Question (see Appendix
D). Written surveys were collected at the end of each session. Focus groups were
audiotaped. In addition, written notes were taken by a research assistant. The researcher
shared no personal views or results of other focus groups during any session.
Participants who declined participation in the focus groups were sent an e-mail
asking if they would take the Focus Group Questionnaire and return the results directly to
the researcher via e-mail. The survey was an electronic version of the Focus Group
Questionnaire (see Appendix C) handed out at the focus group. No other reminders were
provided.
First-year focus group process. After reviewing the results of the written survey
and focus group discussions, it was found that participants during the first year of
employment provided meaningfully different results compared to all other demographic
groups. To understand this better, an additional qualitative focus group was conducted
with a group of five employees still within their first year of employment. Participants
were five-business partner employee’s chosen from the corporate training, brand
management, benefits and human resources teams. All these teams scored high
38
engagement in the 2015 engagement survey. The focus group was provided a list of the
top seven first year engagement factors of first year employees and discussion questions
concerning why they felt these engagement factors helped productivity during the first
year (see Appendix E). The focus group was a facilitator led dialogue lasting sixty
minutes in length. The qualitative information from this focus group is provided later in
the research.
Data Analysis
Data will be analyzed using the descriptive statistics from participants. Summary
measures will include frequency distributions of the five primary drivers and the greatest
impact engagement driver within the demographic areas of male/females, tenure bands,
business partner/sales, and age. To test the validity of the data, chi-square analysis will be
conducted. Qualitative data collected in the focus groups will be transcribed and analyzed
to help provide deeper understanding on why chosen engagement factors positively affect
productivity.
39
Chapter 4
Results of the Study
The purpose of this study is to determine which employment factors in creating
engagement do employees in highly engaged teams at CHG think most positively impact
individual and team productivity. Secondarily, it will help provide valuable insight into
how participants feel these factors create this higher level of productivity. Participants
were chosen from highly engaged sales and business partner teams at CHG based on the
results of the 2015 CHG Employee Opinion Survey. The process began with subjects
reviewing a list of twenty-three recognized drivers of engagement and choosing the five
factors they felt most directly and positively impacted their personal and team
productivity. Chosen factors were called the primary engagement-productivity drivers.
From this set of primary engagement-productivity drivers, each person chose the factor
they believe created the single biggest impact to productivity. To expand understanding
of other factors affecting performance, participants were then asked to choose the next
five most important factors impacting productivity (called secondary engagement-
productivity factors). Focus group discussions were conducted to get qualitative data
about how participants felt the primary-engagement factors create high productivity.
This chapter presents the findings of the study and what was determined from the
data collected. The first section of the chapter will review the demographics of the
participants followed by survey results. Results will be discussed beginning with the
outcomes of all respondents, followed by the results based on comparative employee
demographics including type of employee, gender, tenure and age. The second section of
will highlight the qualitative feedback received during the employee focus groups.
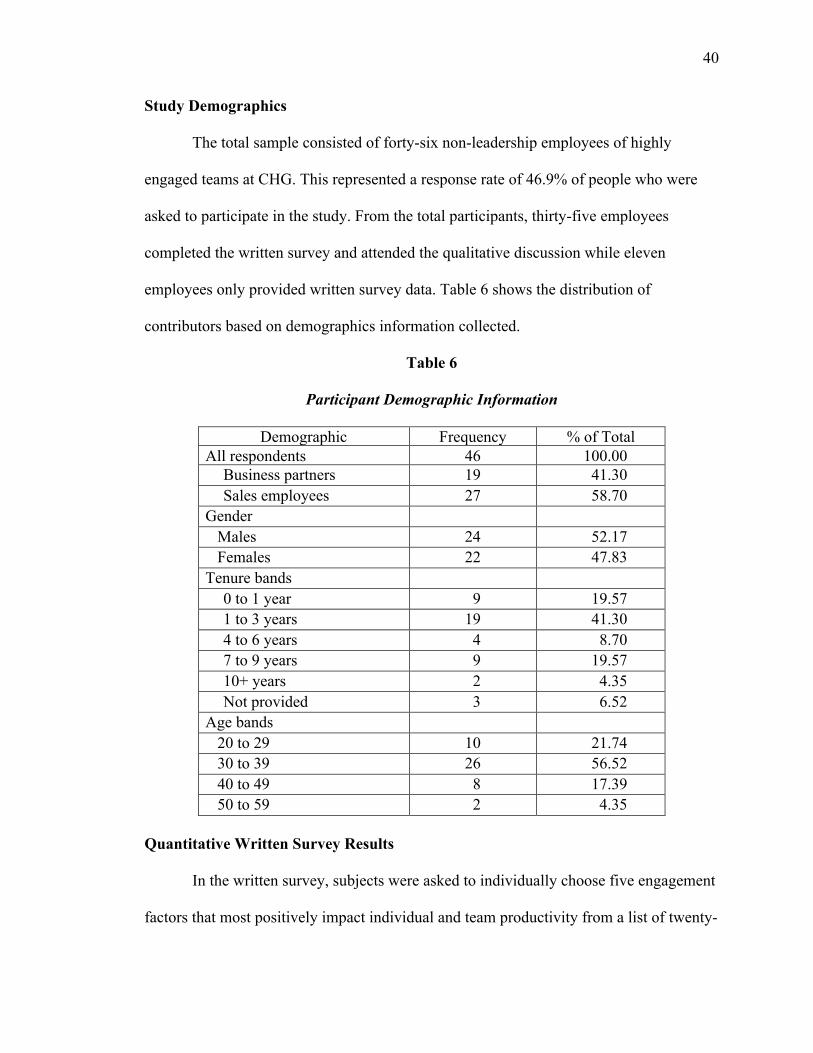
40
Study Demographics
The total sample consisted of forty-six non-leadership employees of highly
engaged teams at CHG. This represented a response rate of 46.9% of people who were
asked to participate in the study. From the total participants, thirty-five employees
completed the written survey and attended the qualitative discussion while eleven
employees only provided written survey data. Table 6 shows the distribution of
contributors based on demographics information collected.
Table 6
Participant Demographic Information
Demographic Frequency % of Total All respondents 46 100.00
Business partners 19 41.30 Sales employees 27 58.70
Gender Males 24 52.17 Females 22 47.83
Tenure bands 0 to 1 year 9 19.57 1 to 3 years 19 41.30 4 to 6 years 4 8.70 7 to 9 years 9 19.57 10+ years 2 4.35 Not provided 3 6.52
Age bands 20 to 29 10 21.74 30 to 39 26 56.52 40 to 49 8 17.39 50 to 59 2 4.35
Quantitative Written Survey Results
In the written survey, subjects were asked to individually choose five engagement
factors that most positively impact individual and team productivity from a list of twenty-
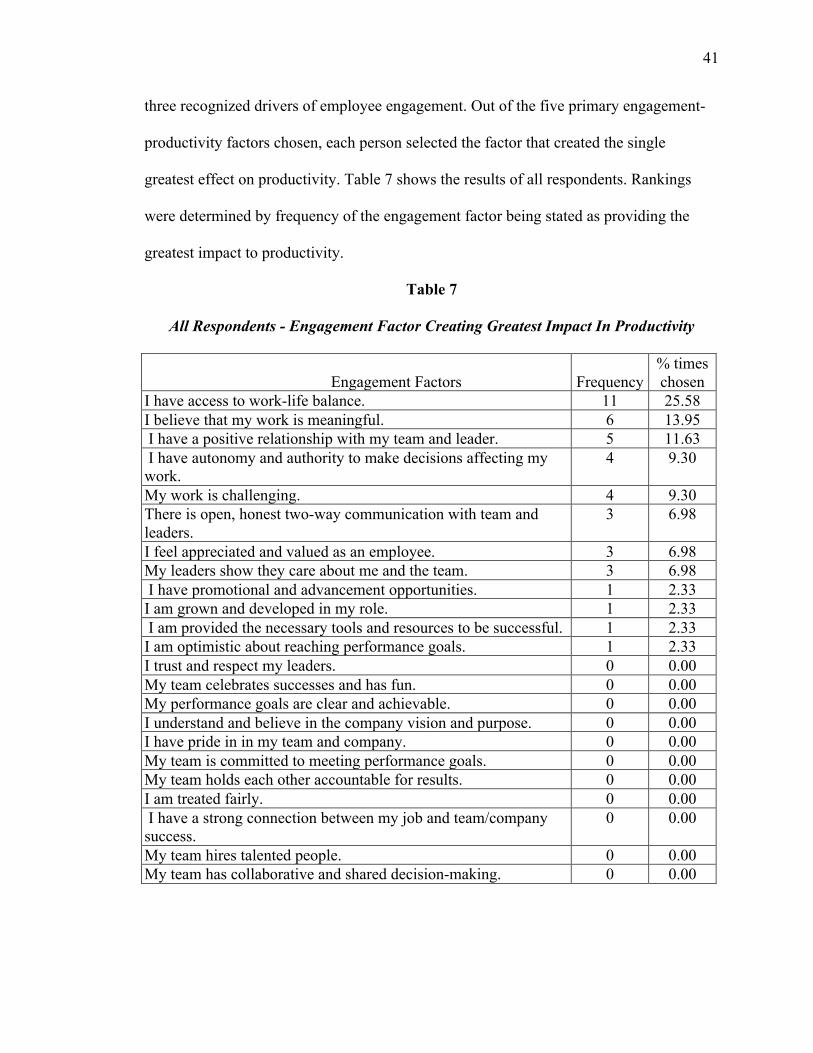
41
three recognized drivers of employee engagement. Out of the five primary engagement-
productivity factors chosen, each person selected the factor that created the single
greatest effect on productivity. Table 7 shows the results of all respondents. Rankings
were determined by frequency of the engagement factor being stated as providing the
greatest impact to productivity.
Table 7
All Respondents - Engagement Factor Creating Greatest Impact In Productivity
Engagement Factors Frequency % times chosen
I have access to work-life balance. 11 25.58 I believe that my work is meaningful. 6 13.95 I have a positive relationship with my team and leader. 5 11.63 I have autonomy and authority to make decisions affecting my work.
4 9.30
My work is challenging. 4 9.30 There is open, honest two-way communication with team and leaders.
3 6.98
I feel appreciated and valued as an employee. 3 6.98 My leaders show they care about me and the team. 3 6.98 I have promotional and advancement opportunities. 1 2.33 I am grown and developed in my role. 1 2.33 I am provided the necessary tools and resources to be successful. 1 2.33 I am optimistic about reaching performance goals. 1 2.33 I trust and respect my leaders. 0 0.00 My team celebrates successes and has fun. 0 0.00 My performance goals are clear and achievable. 0 0.00 I understand and believe in the company vision and purpose. 0 0.00 I have pride in in my team and company. 0 0.00 My team is committed to meeting performance goals. 0 0.00 My team holds each other accountable for results. 0 0.00 I am treated fairly. 0 0.00 I have a strong connection between my job and team/company success.
0 0.00
My team hires talented people. 0 0.00 My team has collaborative and shared decision-making. 0 0.00
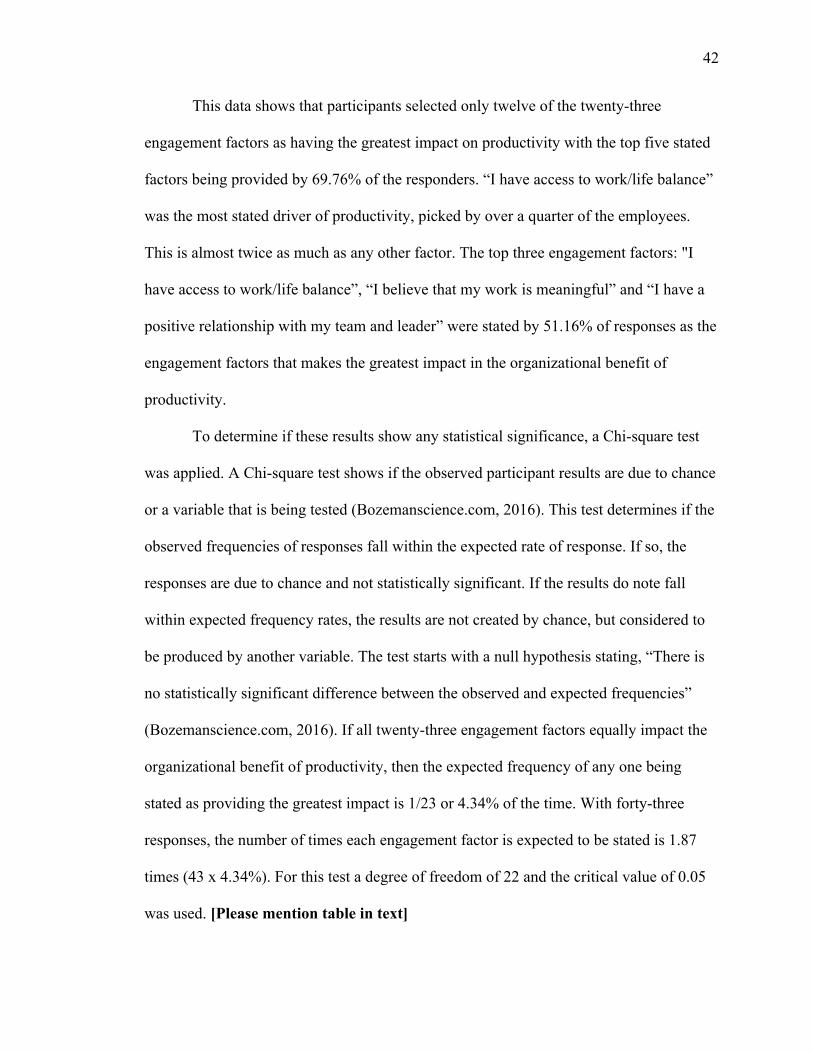
42
This data shows that participants selected only twelve of the twenty-three
engagement factors as having the greatest impact on productivity with the top five stated
factors being provided by 69.76% of the responders. “I have access to work/life balance”
was the most stated driver of productivity, picked by over a quarter of the employees.
This is almost twice as much as any other factor. The top three engagement factors: "I
have access to work/life balance”, “I believe that my work is meaningful” and “I have a
positive relationship with my team and leader” were stated by 51.16% of responses as the
engagement factors that makes the greatest impact in the organizational benefit of
productivity.
To determine if these results show any statistical significance, a Chi-square test
was applied. A Chi-square test shows if the observed participant results are due to chance
or a variable that is being tested (Bozemanscience.com, 2016). This test determines if the
observed frequencies of responses fall within the expected rate of response. If so, the
responses are due to chance and not statistically significant. If the results do note fall
within expected frequency rates, the results are not created by chance, but considered to
be produced by another variable. The test starts with a null hypothesis stating, “There is
no statistically significant difference between the observed and expected frequencies”
(Bozemanscience.com, 2016). If all twenty-three engagement factors equally impact the
organizational benefit of productivity, then the expected frequency of any one being
stated as providing the greatest impact is 1/23 or 4.34% of the time. With forty-three
responses, the number of times each engagement factor is expected to be stated is 1.87
times (43 x 4.34%). For this test a degree of freedom of 22 and the critical value of 0.05
was used. [Please mention table in text]
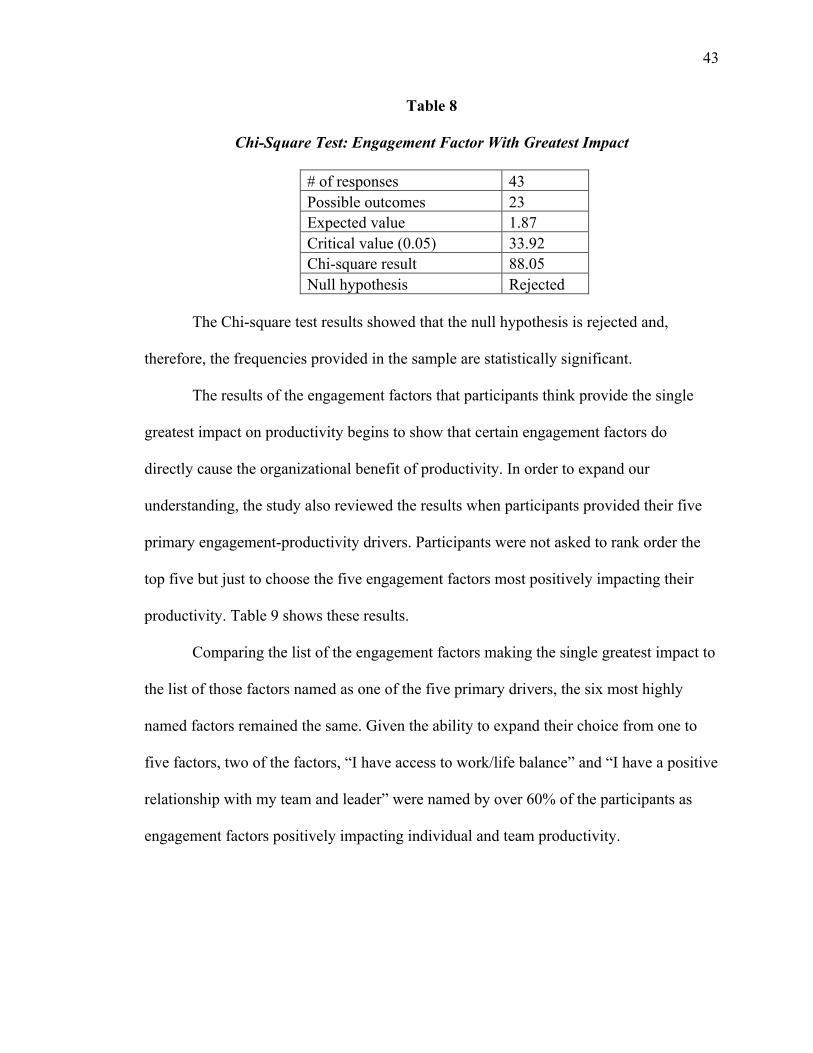
43
Table 8
Chi-Square Test: Engagement Factor With Greatest Impact
# of responses 43 Possible outcomes 23 Expected value 1.87 Critical value (0.05) 33.92 Chi-square result 88.05 Null hypothesis Rejected
The Chi-square test results showed that the null hypothesis is rejected and,
therefore, the frequencies provided in the sample are statistically significant.
The results of the engagement factors that participants think provide the single
greatest impact on productivity begins to show that certain engagement factors do
directly cause the organizational benefit of productivity. In order to expand our
understanding, the study also reviewed the results when participants provided their five
primary engagement-productivity drivers. Participants were not asked to rank order the
top five but just to choose the five engagement factors most positively impacting their
productivity. Table 9 shows these results.
Comparing the list of the engagement factors making the single greatest impact to
the list of those factors named as one of the five primary drivers, the six most highly
named factors remained the same. Given the ability to expand their choice from one to
five factors, two of the factors, “I have access to work/life balance” and “I have a positive
relationship with my team and leader” were named by over 60% of the participants as
engagement factors positively impacting individual and team productivity.
44
Table 9
All Respondents: Primary Engagement Factors Creating Positive Impact on
Productivity
Engagement factors Frequency % times stated
I have access to work-life balance. 28 60.87% I have a positive relationship with my team and leader. 28 60.87% I believe that my work is meaningful. 19 41.30% There is open, honest two-way communication with team and leaders.
17 36.96%
I have autonomy and authority to make decisions affecting my work.
15 32.61%
My work is challenging. 14 30.43% I trust and respect my leaders. 14 30.43% I feel appreciated and valued as an employee. 13 28.26% My leaders show they care about me and the team. 12 26.09% I have promotional and advancement opportunities. 11 23.91% My team celebrates successes and has fun. 9 19.57% I am grown and developed in my role. 8 17.39% My performance goals are clear and achievable. 7 15.22% I am provided the necessary tools and resources to be successful. 6 13.04% I understand and believe in the company vision and purpose. 5 10.87% I have pride in in my team and company. 4 8.70% My team is committed to meeting performance goals. 4 8.70% My team holds each other accountable for results. 3 6.52% I am treated fairly. 3 6.52% I have a strong connection between my job and team/company success.
3 6.52%
My team hires talented people. 3 6.52% I am optimistic about reaching performance goals. 2 4.35% My team has collaborative and shared decision-making. 2 4.35% A Chi-square test was also conducted on these results and the null hypothesis was
again rejected showing that the frequencies of engagement factors driving productivity
are statistically significant (see Table 10).
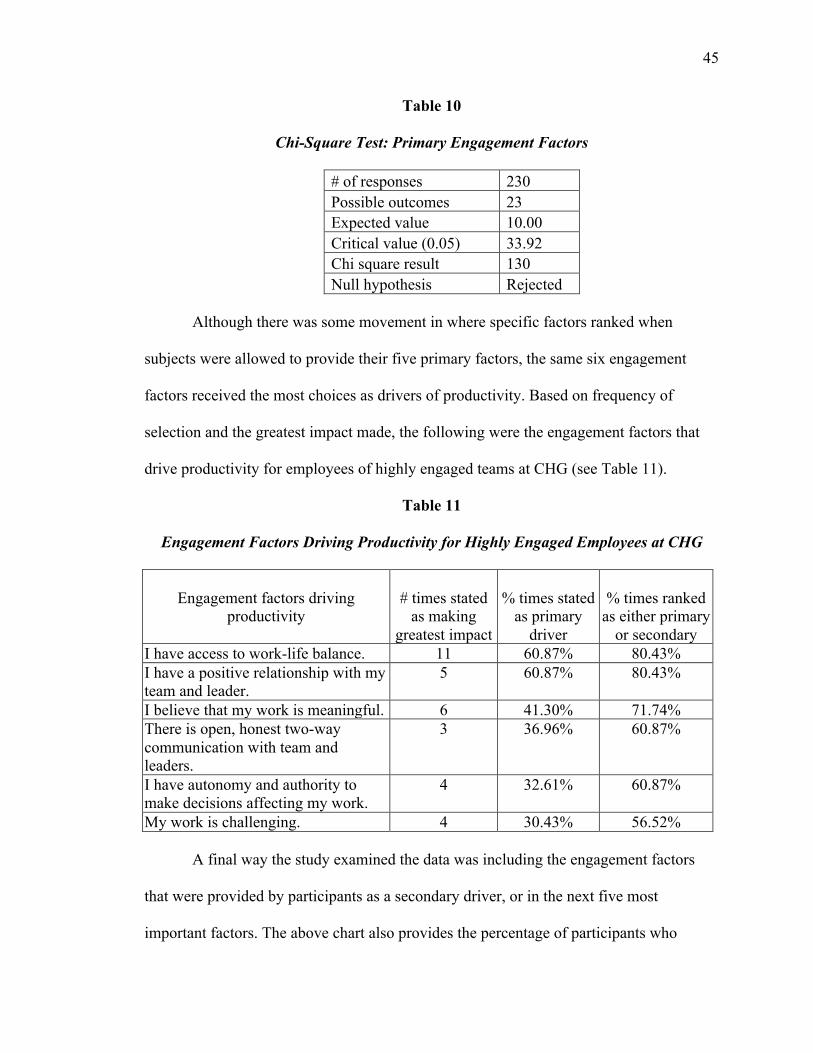
45
Table 10
Chi-Square Test: Primary Engagement Factors
# of responses 230 Possible outcomes 23 Expected value 10.00 Critical value (0.05) 33.92 Chi square result 130 Null hypothesis Rejected
Although there was some movement in where specific factors ranked when
subjects were allowed to provide their five primary factors, the same six engagement
factors received the most choices as drivers of productivity. Based on frequency of
selection and the greatest impact made, the following were the engagement factors that
drive productivity for employees of highly engaged teams at CHG (see Table 11).
Table 11
Engagement Factors Driving Productivity for Highly Engaged Employees at CHG
Engagement factors driving
productivity
# times stated as making
greatest impact
% times stated as primary
driver
% times ranked as either primary
or secondary I have access to work-life balance. 11 60.87% 80.43% I have a positive relationship with my team and leader.
5 60.87% 80.43%
I believe that my work is meaningful. 6 41.30% 71.74% There is open, honest two-way communication with team and leaders.
3 36.96% 60.87%
I have autonomy and authority to make decisions affecting my work.
4 32.61% 60.87%
My work is challenging. 4 30.43% 56.52% A final way the study examined the data was including the engagement factors
that were provided by participants as a secondary driver, or in the next five most
important factors. The above chart also provides the percentage of participants who
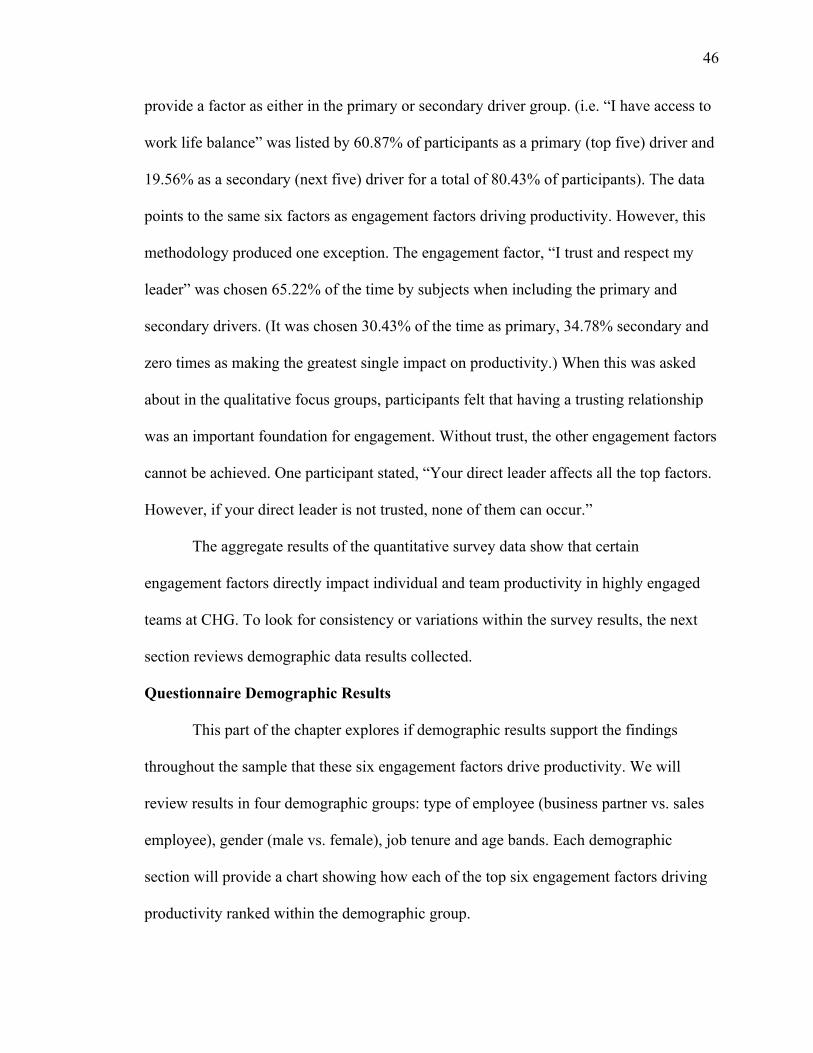
46
provide a factor as either in the primary or secondary driver group. (i.e. “I have access to
work life balance” was listed by 60.87% of participants as a primary (top five) driver and
19.56% as a secondary (next five) driver for a total of 80.43% of participants). The data
points to the same six factors as engagement factors driving productivity. However, this
methodology produced one exception. The engagement factor, “I trust and respect my
leader” was chosen 65.22% of the time by subjects when including the primary and
secondary drivers. (It was chosen 30.43% of the time as primary, 34.78% secondary and
zero times as making the greatest single impact on productivity.) When this was asked
about in the qualitative focus groups, participants felt that having a trusting relationship
was an important foundation for engagement. Without trust, the other engagement factors
cannot be achieved. One participant stated, “Your direct leader affects all the top factors.
However, if your direct leader is not trusted, none of them can occur.”
The aggregate results of the quantitative survey data show that certain
engagement factors directly impact individual and team productivity in highly engaged
teams at CHG. To look for consistency or variations within the survey results, the next
section reviews demographic data results collected.
Questionnaire Demographic Results
This part of the chapter explores if demographic results support the findings
throughout the sample that these six engagement factors drive productivity. We will
review results in four demographic groups: type of employee (business partner vs. sales
employee), gender (male vs. female), job tenure and age bands. Each demographic
section will provide a chart showing how each of the top six engagement factors driving
productivity ranked within the demographic group.
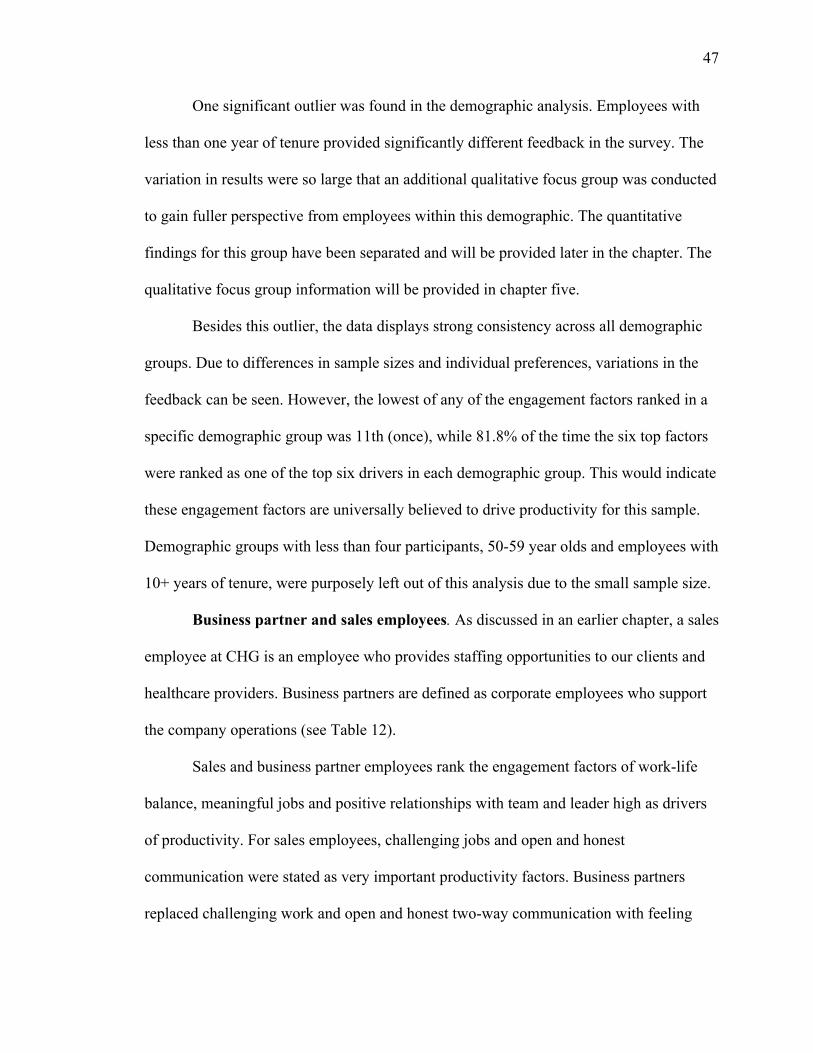
47
One significant outlier was found in the demographic analysis. Employees with
less than one year of tenure provided significantly different feedback in the survey. The
variation in results were so large that an additional qualitative focus group was conducted
to gain fuller perspective from employees within this demographic. The quantitative
findings for this group have been separated and will be provided later in the chapter. The
qualitative focus group information will be provided in chapter five.
Besides this outlier, the data displays strong consistency across all demographic
groups. Due to differences in sample sizes and individual preferences, variations in the
feedback can be seen. However, the lowest of any of the engagement factors ranked in a
specific demographic group was 11th (once), while 81.8% of the time the six top factors
were ranked as one of the top six drivers in each demographic group. This would indicate
these engagement factors are universally believed to drive productivity for this sample.
Demographic groups with less than four participants, 50-59 year olds and employees with
10+ years of tenure, were purposely left out of this analysis due to the small sample size.
Business partner and sales employees. As discussed in an earlier chapter, a sales
employee at CHG is an employee who provides staffing opportunities to our clients and
healthcare providers. Business partners are defined as corporate employees who support
the company operations (see Table 12).
Sales and business partner employees rank the engagement factors of work-life
balance, meaningful jobs and positive relationships with team and leader high as drivers
of productivity. For sales employees, challenging jobs and open and honest
communication were stated as very important productivity factors. Business partners
replaced challenging work and open and honest two-way communication with feeling
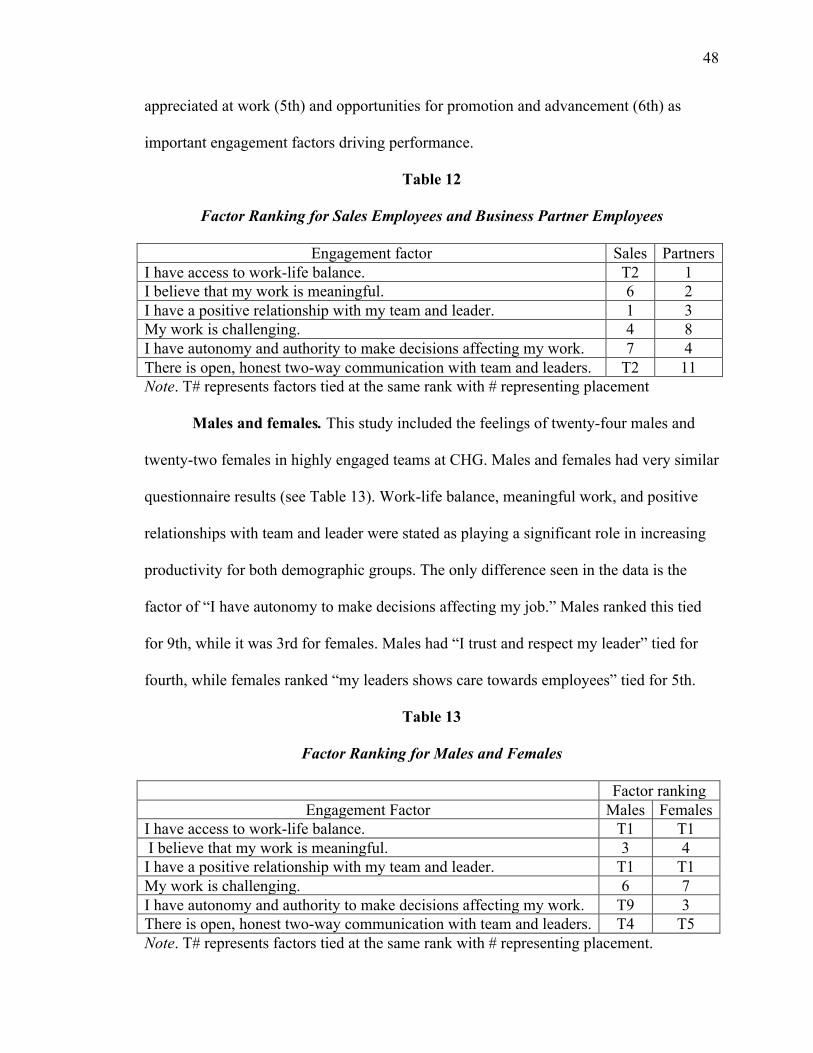
48
appreciated at work (5th) and opportunities for promotion and advancement (6th) as
important engagement factors driving performance.
Table 12
Factor Ranking for Sales Employees and Business Partner Employees
Engagement factor Sales Partners I have access to work-life balance. T2 1 I believe that my work is meaningful. 6 2 I have a positive relationship with my team and leader. 1 3 My work is challenging. 4 8 I have autonomy and authority to make decisions affecting my work. 7 4 There is open, honest two-way communication with team and leaders. T2 11 Note. T# represents factors tied at the same rank with # representing placement
Males and females. This study included the feelings of twenty-four males and
twenty-two females in highly engaged teams at CHG. Males and females had very similar
questionnaire results (see Table 13). Work-life balance, meaningful work, and positive
relationships with team and leader were stated as playing a significant role in increasing
productivity for both demographic groups. The only difference seen in the data is the
factor of “I have autonomy to make decisions affecting my job.” Males ranked this tied
for 9th, while it was 3rd for females. Males had “I trust and respect my leader” tied for
fourth, while females ranked “my leaders shows care towards employees” tied for 5th.
Table 13
Factor Ranking for Males and Females
Factor ranking Engagement Factor Males Females
I have access to work-life balance. T1 T1 I believe that my work is meaningful. 3 4 I have a positive relationship with my team and leader. T1 T1 My work is challenging. 6 7 I have autonomy and authority to make decisions affecting my work. T9 3 There is open, honest two-way communication with team and leaders. T4 T5 Note. T# represents factors tied at the same rank with # representing placement.
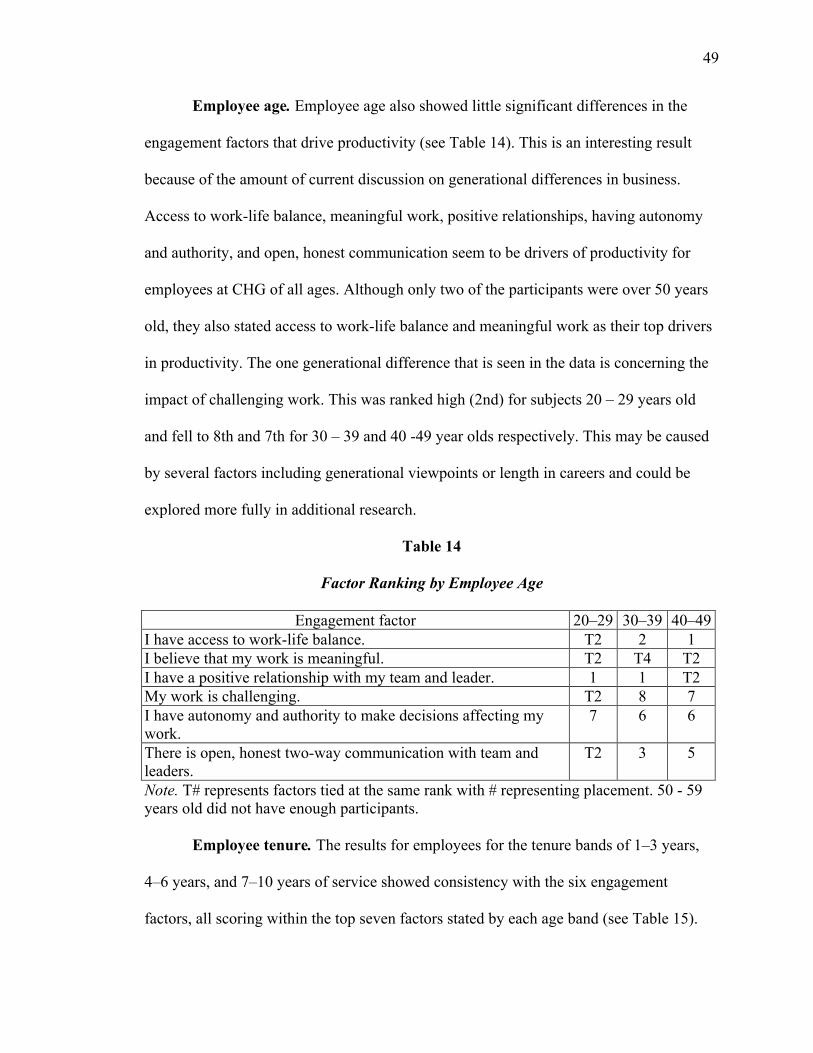
49
Employee age. Employee age also showed little significant differences in the
engagement factors that drive productivity (see Table 14). This is an interesting result
because of the amount of current discussion on generational differences in business.
Access to work-life balance, meaningful work, positive relationships, having autonomy
and authority, and open, honest communication seem to be drivers of productivity for
employees at CHG of all ages. Although only two of the participants were over 50 years
old, they also stated access to work-life balance and meaningful work as their top drivers
in productivity. The one generational difference that is seen in the data is concerning the
impact of challenging work. This was ranked high (2nd) for subjects 20 – 29 years old
and fell to 8th and 7th for 30 – 39 and 40 -49 year olds respectively. This may be caused
by several factors including generational viewpoints or length in careers and could be
explored more fully in additional research.
Table 14
Factor Ranking by Employee Age
Engagement factor 20–29 30–39 40–49 I have access to work-life balance. T2 2 1 I believe that my work is meaningful. T2 T4 T2 I have a positive relationship with my team and leader. 1 1 T2 My work is challenging. T2 8 7 I have autonomy and authority to make decisions affecting my work.
7 6 6
There is open, honest two-way communication with team and leaders.
T2 3 5
Note. T# represents factors tied at the same rank with # representing placement. 50 - 59 years old did not have enough participants.
Employee tenure. The results for employees for the tenure bands of 1–3 years,
4–6 years, and 7–10 years of service showed consistency with the six engagement
factors, all scoring within the top seven factors stated by each age band (see Table 15).
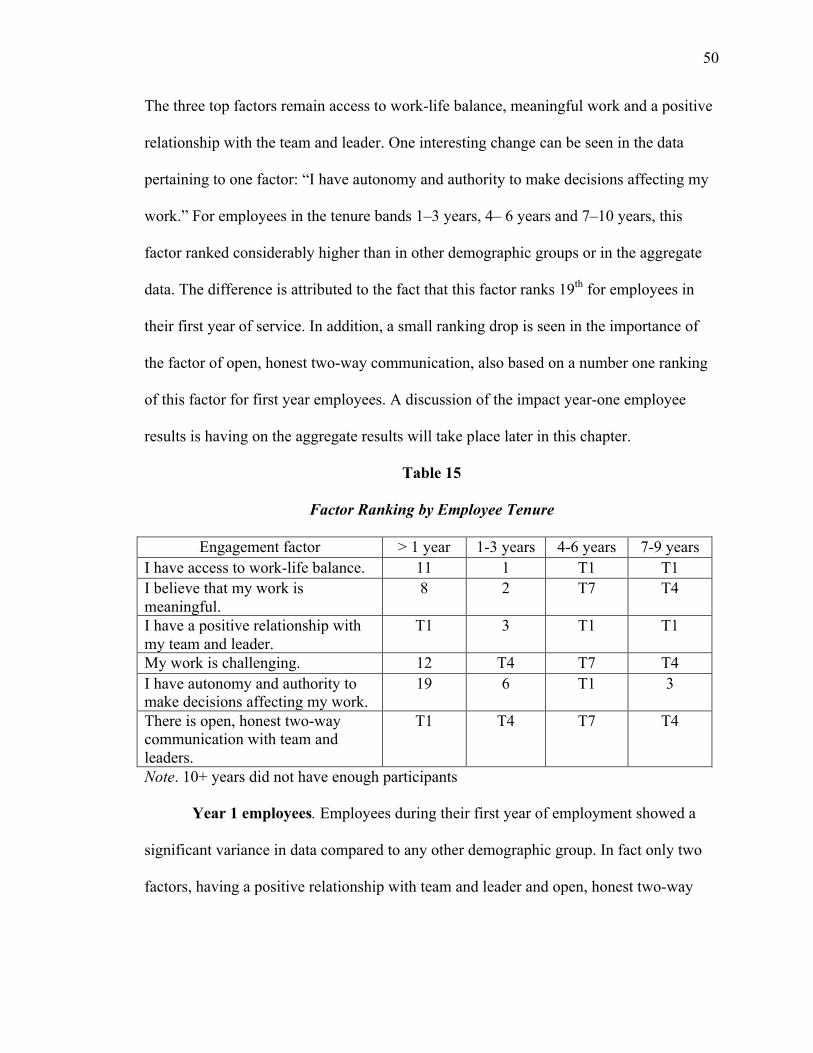
50
The three top factors remain access to work-life balance, meaningful work and a positive
relationship with the team and leader. One interesting change can be seen in the data
pertaining to one factor: “I have autonomy and authority to make decisions affecting my
work.” For employees in the tenure bands 1–3 years, 4– 6 years and 7–10 years, this
factor ranked considerably higher than in other demographic groups or in the aggregate
data. The difference is attributed to the fact that this factor ranks 19th for employees in
their first year of service. In addition, a small ranking drop is seen in the importance of
the factor of open, honest two-way communication, also based on a number one ranking
of this factor for first year employees. A discussion of the impact year-one employee
results is having on the aggregate results will take place later in this chapter.
Table 15
Factor Ranking by Employee Tenure
Engagement factor > 1 year 1-3 years 4-6 years 7-9 years I have access to work-life balance. 11 1 T1 T1 I believe that my work is meaningful.
8 2 T7 T4
I have a positive relationship with my team and leader.
T1 3 T1 T1
My work is challenging. 12 T4 T7 T4 I have autonomy and authority to make decisions affecting my work.
19 6 T1 3
There is open, honest two-way communication with team and leaders.
T1 T4 T7 T4
Note. 10+ years did not have enough participants
Year 1 employees. Employees during their first year of employment showed a
significant variance in data compared to any other demographic group. In fact only two
factors, having a positive relationship with team and leader and open, honest two-way
51
communication with team and leader appeared in their top eight choices of engagement-
productivity drivers.
The significance of the variance in year-one employees led me to bifurcate this
group from all respondents’ results to gain a richer understanding of this phenomenon. A
review of the quantitative survey data reveals that for first year employees the factors that
positively impact productivity are meaningfully different. The top seven factors that this
group stated include:
1. I have a positive relationship with my team and leader.
2. I feel appreciated and valued as an employee.
3. There is open, honest two-way communication with team and leaders.
4. I have promotional and advancement opportunities.
5. I trust and respect my leaders.
6. My leaders show they care about me and the team.
7. I am grown and developed in my role.
The data shows that the engagement drivers that help improve productivity by
employees during their 1st year of employment fall within the areas of building
relationships, creating successful communications and growing and developing in their
new roles. In addition, this is the only demographic group where trust and respect in my
leader was ranked in the top five. Results falling out of the top ten engagement drivers
included work-life balance, a challenging job and having authority and autonomy in
decisions. Meaningful worked dropped to an 8th place ranking. To understand this
phenomenon better, I decided to add an additional focus group including only employees
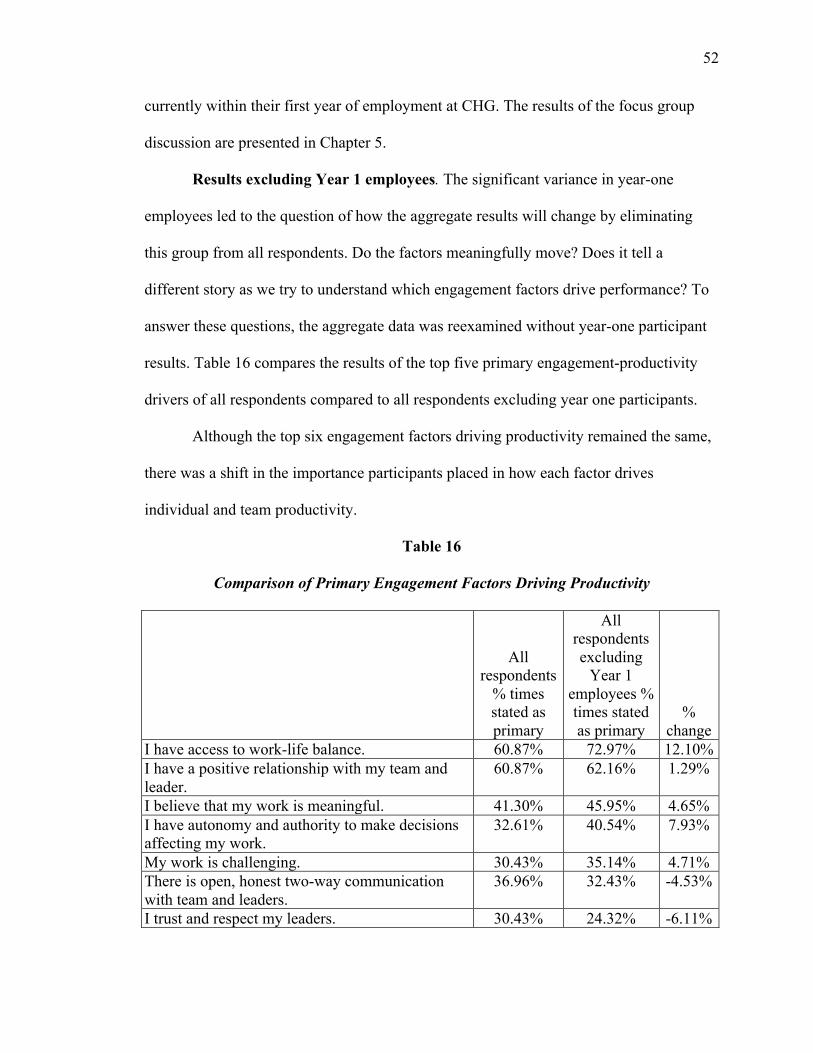
52
currently within their first year of employment at CHG. The results of the focus group
discussion are presented in Chapter 5.
Results excluding Year 1 employees. The significant variance in year-one
employees led to the question of how the aggregate results will change by eliminating
this group from all respondents. Do the factors meaningfully move? Does it tell a
different story as we try to understand which engagement factors drive performance? To
answer these questions, the aggregate data was reexamined without year-one participant
results. Table 16 compares the results of the top five primary engagement-productivity
drivers of all respondents compared to all respondents excluding year one participants.
Although the top six engagement factors driving productivity remained the same,
there was a shift in the importance participants placed in how each factor drives
individual and team productivity.
Table 16
Comparison of Primary Engagement Factors Driving Productivity
All respondents
% times stated as primary
All respondents excluding
Year 1 employees % times stated as primary
% change
I have access to work-life balance. 60.87% 72.97% 12.10% I have a positive relationship with my team and leader.
60.87% 62.16% 1.29%
I believe that my work is meaningful. 41.30% 45.95% 4.65% I have autonomy and authority to make decisions affecting my work.
32.61% 40.54% 7.93%
My work is challenging. 30.43% 35.14% 4.71% There is open, honest two-way communication with team and leaders.
36.96% 32.43% -4.53%
I trust and respect my leaders. 30.43% 24.32% -6.11%
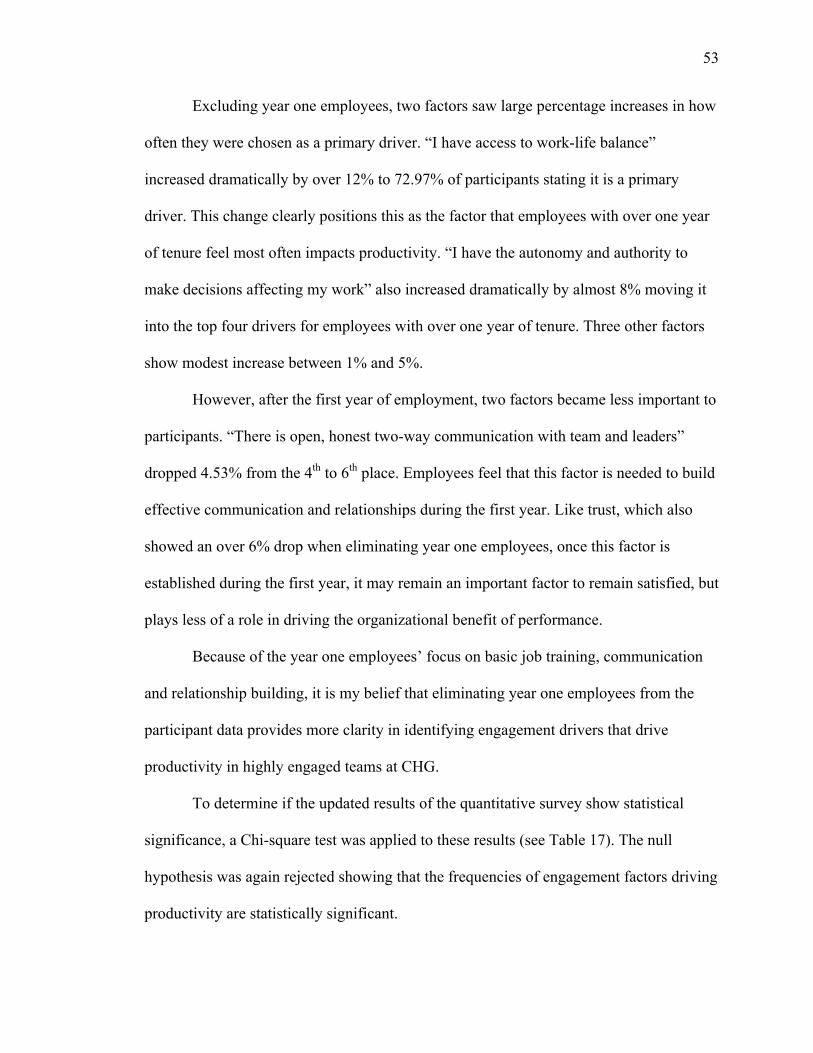
53
Excluding year one employees, two factors saw large percentage increases in how
often they were chosen as a primary driver. “I have access to work-life balance”
increased dramatically by over 12% to 72.97% of participants stating it is a primary
driver. This change clearly positions this as the factor that employees with over one year
of tenure feel most often impacts productivity. “I have the autonomy and authority to
make decisions affecting my work” also increased dramatically by almost 8% moving it
into the top four drivers for employees with over one year of tenure. Three other factors
show modest increase between 1% and 5%.
However, after the first year of employment, two factors became less important to
participants. “There is open, honest two-way communication with team and leaders”
dropped 4.53% from the 4th to 6th place. Employees feel that this factor is needed to build
effective communication and relationships during the first year. Like trust, which also
showed an over 6% drop when eliminating year one employees, once this factor is
established during the first year, it may remain an important factor to remain satisfied, but
plays less of a role in driving the organizational benefit of performance.
Because of the year one employees’ focus on basic job training, communication
and relationship building, it is my belief that eliminating year one employees from the
participant data provides more clarity in identifying engagement drivers that drive
productivity in highly engaged teams at CHG.
To determine if the updated results of the quantitative survey show statistical
significance, a Chi-square test was applied to these results (see Table 17). The null
hypothesis was again rejected showing that the frequencies of engagement factors driving
productivity are statistically significant.
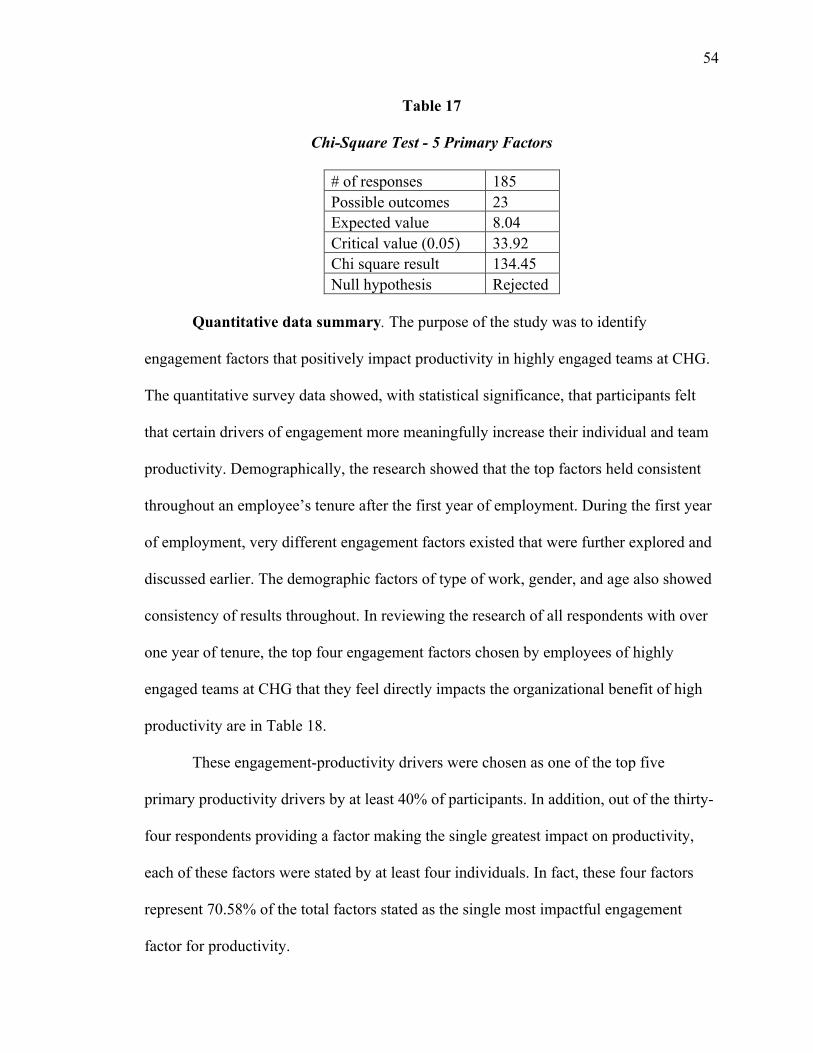
54
Table 17
Chi-Square Test - 5 Primary Factors
# of responses 185 Possible outcomes 23 Expected value 8.04 Critical value (0.05) 33.92 Chi square result 134.45 Null hypothesis Rejected
Quantitative data summary. The purpose of the study was to identify
engagement factors that positively impact productivity in highly engaged teams at CHG.
The quantitative survey data showed, with statistical significance, that participants felt
that certain drivers of engagement more meaningfully increase their individual and team
productivity. Demographically, the research showed that the top factors held consistent
throughout an employee’s tenure after the first year of employment. During the first year
of employment, very different engagement factors existed that were further explored and
discussed earlier. The demographic factors of type of work, gender, and age also showed
consistency of results throughout. In reviewing the research of all respondents with over
one year of tenure, the top four engagement factors chosen by employees of highly
engaged teams at CHG that they feel directly impacts the organizational benefit of high
productivity are in Table 18.
These engagement-productivity drivers were chosen as one of the top five
primary productivity drivers by at least 40% of participants. In addition, out of the thirty-
four respondents providing a factor making the single greatest impact on productivity,
each of these factors were stated by at least four individuals. In fact, these four factors
represent 70.58% of the total factors stated as the single most impactful engagement
factor for productivity.
55
Table 18
Engagement – Productivity Drivers of Employees After Year 1
Engagement factors most positively impacting productivity
# of times stated as
factor making greatest impact
All respondents excluding Year 1 employees % times stated as
primary I have access to work-life balance. 11 72.97% I have a positive relationship with my team and leader. 4 62.16% I believe that my work is meaningful. 5 45.95% I have autonomy and authority to make decisions affecting my work.
4 40.54%
One interesting finding during the quantitative review was that first year
employees productivity was impacted by engagement drivers significantly different than
other demographic groups. They chose engagement factors to meet needs around the
areas of building effective interpersonal relationship, growing job skills and knowledge,
and communication.
1. I have a positive relationship with my team and leader.
2. I feel appreciated and valued as an employee.
3. There is open, honest two-way communication with team and leaders.
4. I have promotional and advancement opportunities.
5. I trust and respect my leaders.
6. My leaders show they care about me and the team.
7. I am grown and developed in my role.
The quantitative survey provides a list of the engagement factors that employees
feel meaningfully contribute to productivity, “the what.” However, it does not provide
information on “how” participants feel that these factors directly impact their individual
and team productivity. Qualitative focus groups were conducted to explore this question
56
and the feedback from these meetings is provided in the next chapter. In addition, it will
draw conclusions from the study results and provide how this study is significant to the
field of employee engagement. It will end with a discussion on the study limitations and
recommendations for future studies.
57
Chapter 5
Study Overview
Employee engagement can be a powerful driver of success for business in
America. Although it is estimated that only about 30% of American workers are fully
engaged at work, there have been numerous studies and research that show companies
with highly engaged employees are more productive, provide better customer service,
and experience less turnover and absenteeism. In addition to these organizational
benefits, companies with highly engaged workforces achieve higher average net income
and total shareholder value compared to other companies.
Research studies show that there exists over twenty different employment factors
that increase employee engagement. However, little research has been directed at
studying the direct linkage between specific engagement drivers and the specific
organizational benefits achieved through engagement. This study was conducted to gain
better understanding of possible direct linkage between the drivers of engagement and
one organizational benefit, higher levels of productivity.
The study research question was, “In highly engaged teams at CHG, what
engagement drivers do employees feel most directly, positively impacts their
productivity?” Secondarily, it wanted to explore if a certain engagement factor did
directly impact productivity, how did participants feel the impact occurred. The next
section explores this secondary question and provides a qualitative understanding of
engagement-productivity drivers chosen by CHG employees.
58
Qualitative Understanding of Engagement-Productivity Drivers at CHG
The quantitative survey results produced four engagement-productivity drivers in
highly engaged teams at CHG:
• I have access to work-life balance.
• I believe that my work is meaningful.
• I have autonomy and authority to make decisions affecting my work.
• I have a positive relationship with my team and leader.
In this section, we will examine how and why participants feel that these engagement-
productivity drivers help create high performance.
I have access to work-life balance. Access to work-life balance was by far the
most stated engagement-productivity driver in the survey, chosen by almost 73% of the
participants as a top five primary driver and named eleven times, or by a third of the
participants, as the driver making the single greatest impact on productivity.
It seems fairly counterintuitive that flexibility or at-home work schedules,
encouragement to take time off, and the blurring of lines between work and personal life
would play a pivotal role in high individual productivity. The focus group found several
key reasons why employees feel that work-life balance is driving higher performance.
The first is about being fully present at work. Participants talked about the complexity of
work, family and social life, and how the access to work-life balance allows them to be
“fully present with whatever you are doing.” Statements such as “it makes me not worry
about things outside of work when I’m here” and “I can leave work stress at work. It has
had a very positive impact on my entire family” illustrate the balance employees are
trying to find. When strong life-balance is achieved, it translates into higher performance
59
at work because of the focused effort it creates in each life area. One participant said it
this way, “I have a life-style outside of work that is important to me and I feel like if I’m
involved in those hobbies, when I am here at work, I’m more fully engaged and capable,
because my mind is fully in tune.” Another employee said, “The great thing about this
job is I can come here and give my all.”
Another positive impact of work-life balance is the lowering of individual stress.
“If you’re well rested, healthy, and given time away from work, it results in higher
productivity,” said a participant. This aligns with the findings of the Jobs Demands-
Resources Model provided by Bakker and Demerouti. When job demands become too
stressful, it can start the health impairment cycle, leading to lower engagement and lower
productivity (Bakker & Demerouti, 2007). Providing access to time-off and flexible work
schedules can provide recovery to excessive job demands. “With access to it (work-life
balance), when you’re getting overwhelmed or you need a break, leaders encourage you
to take time.” Besides job demands, participants mentioned stress in trying to balance
work and family obligations. Through flexible work schedules, working at home and
laptop technology, employees feel that they can better manage both work and family
needs. As said by one person, “I have a child in kindergarten. I put in for a laptop and can
catch up on work at home when their schedule requires one of us to be home. I feel like
my productivity is higher and I can still get my daughter ready and off to school.”
Finally, access to work-life balance drives productivity by building a sense of
ownership through empowerment and encouragement. Describing being empowered to
develop a personal work-life balance, one participant stated, “I would just say not only do
I feel like I have access, but I feel I am encouraged by my leaders. I really like that, it
60
motivates me to work outside of work as well.” When leaders empower and encourage
employees to own their personal work-life balance it creates motivation for employees to
work harder. It clearly aligns with the Social Exchange Model (SET), discussed in an
earlier chapter, which says if an employee receives organizational social-emotional
resources, they will devote greater amounts of cognitive, emotional, and physical
resources to help the organization succeed (Cropanzano & Mitchell, 2005). Many
statements made by participants support this finding including: “it makes me want to do a
better job, because I have the flexibility”, “when you let someone make that decision for
them self, it’s more valuable. They choose to put in extra time,” and “it is encouraged by
my leaders and it’s not a big deal to ask for time off, it motivates me to work even when I
don’t need to because I’m trusted.”
I believe that my work is meaningful. In the needs-satisfying model, William
Kahn (1990) defined meaningful work as causing the employee to feel useful,
worthwhile, and valuable in their role. When discussing how meaningful work positively
impacts productivity, participants believed it drives passion to put in extra effort and that
the feeling a job is useful and worthwhile helps employees get through difficult or
stressful times.
According to the definition of engagement provided by Maylett and Warner
(2014), employee engagement is the emotional state where we feel passionate and
committed toward our work. This leads to fully investing our best selves into the work.
Several people discussed this sentiment during the focus group meetings. Statements like,
“you know if my work is meaningful, that means I have to share it with the people around
me and talk about what I do”, “I put a doctor in a place that helped save someone’s life
61
and to me, I don’t know if there is much more rewarding work than that” and “I think if
it’s really meaningful to you, it impacts your team. It impacts other people. It impacts the
whole company” all demonstrate the passion created when doing meaningful work.
Employees feel that this passion drives providing extra effort towards the job, leading to
higher productivity. This is illustrated by a sales employee who commented, “It doesn’t
feel like something extra, I just feel committed to it on my own accord and I know it just
has a lot of meaning for me.” A business partner shared, “Well, I think it makes you want
to do a better job too. If it’s not meaningful then you don’t care about it and don’t put
forth your best effort.”
The second area employees feel meaningful work positively impacts productivity
is getting employees through difficult times. It seems to act as a recovery mechanism that
CHG employees use when job demands become stressors and thus begins the health
impairment process (Bakker & Demerouti, 2007). “It (meaningful work) is what you rely
on when it doesn’t go well” and “when you’re making 250 calls a week and you keep
hearing no over and over again, it (meaningful work) is a reminder that you can actually
achieve something great by doing this work.” These statements show how meaningful
work motivates employees to continue during difficult times. This sped up recovery
times, returning employees to higher productivity sooner. The power of meaningful work
during these times is captured well by this participant. “I feel like when I might be
struggling with motivation or focus, I remind myself that my work is meaningful and
therefore worth the effort.”
I have autonomy and authority to make decisions affecting my work. The
sense of job ownership is a powerful driver of productivity. This is what the participants

62
of this study clearly indicated. Autonomy and authority of decisions concerning their jobs
drives this sense of ownership. “It gives me more of a feeling of ownership,” said one
subject. Another said, “This is my number one (driver). All the other factors we’ve
identified are tied to this. The ability to take responsibility and ownership of my work is
empowering.” A third participant provided, “I think the other thing is understanding that
autonomy leads to self-accountability.” All these statements show that providing more
control and responsibility in their job decisions create a sense of ownership for
employees. This movement from having a “job” to feeling like an “owner” is seen in the
statement from a sales employee, “I think it is very empowering; the magnitude of what
we do and the freedom they give you to run your business.” When asked how this
positively impacts individual productivity, answers pointed to the consequences provided
in the definition of employee engagement by Maylett and Warner (2014), “In turn, we
fully invest out best selves – our hearts, spirits, minds and hands – in the work we do” (p.
[page no.?]). This was clearly established by subject statements such as, “When I have
ownership, I give more” and “If I have autonomy and authority, I give more.” This
statement about autonomy, “It provides me the authority to make good business decisions
and then I can do the right things to help the team” demonstrates that employees are
willing to bring the best of themselves to work when they are provided this engagement
factor. This is best demonstrated by a sales employees thought, “I think people just thrive
when you give them responsibility that they have never been given before; people really
run with it.”
Another factor to providing employees the authority to make decisions helps
increase productivity is more practical; it speeds up processes by eliminating steps. If
63
employees are empowered and trained to make decisions, less time is spent asking
leaders or going through approval processes. One subject stated when asked how this
engagement factor impacts productivity stated, “For me, it’s just knowing that I can
handle situations that come up. I don’t have to go to my manager and say, ‘How do I
handle this situation?’ I just handle it.” Another said it increases performance because she
could, “make decisions that I need to, that affect my day to day activity in sales and
whatever else comes up. I don’t have to run to my manager and ask permission for every
little thing.”
I have a positive relationship with my team and leader. The focus group
discussions about this engagement-productivity driver provided the most challenge for
participants to describe how it directly impacts productivity. Participants believed it was
an important driver of productivity but struggled to articulate a clear linkage. After
reviewing the notes and transcripts from the meetings the following pattern emerged:
• Positive relationships drive team connection.
• Team connection drives a want to help the team and other members to succeed.
• This want for success drives additional effort needed to achieve this success.
Team connection can take form in several ways. According to some employees, a
positive team relationship makes “you enjoy coming to work. You enjoy being with
everybody.” Others discussed connection as having better alignment. “(With) positive
relationships, you know what the goals are” and you are “just along the same lines with
what these guys are saying.” Another connection point was around the ability to create a
positive emotional state. One employee stated, “If your relationship is positive with both
your team and your leader, you tend to have a good positive and emotional mind frame.”
64
A business partner commented this theme in a negative framework saying, “if there is
negativity, then it’s just not nearly as fun, and I’m not as productive if there is not a
positive vibe going on.”
This positive team connection creates a desire to help other members and the team
to succeed. This seems to provide more support to the Social Exchange Model (SET).
Having positive relationships with the team and leader achieves a socio-economic
resource desired by employees. Employees, in turn, repay this back by helping drive
organizational success, in this case, team member and overall team performance
(Cropanzano & Mitchell, 2005). Several statements pertaining to this were provided
including, “you want them to succeed as much as yourself” and “just helping everyone
else succeed around you as well.” Employees experiencing this engagement factor are
willing to provide the extra effort to help the team achieve success. A sales employee
noted, ”So, you look at what you can do, not only for your individual success but how
you can help the team achieve as a whole.”
Qualitative Understanding of Engagement-Productivity Drivers of Year 1
Employees
To understand the difference in results found in employees at CHG during their
first year, an additional qualitative focus group was conducted. A group of five
employees participated from teams having high engagement in the 2015 engagement
survey. The focus group was provided the list of the top seven first year engagement
factors with discussion questions concerning why they felt these engagement factors
helped productivity during the first year.
65
Employees have different motivational needs as they begin work in a new
position or at a new employer. This could be seen in the survey data and during the
discussions. New employee motivational needs are extrinsic, driven outside the
employee’s control and mostly provided by leaders. Several participants in the focus
group indicated that they were reliant on their leaders to help them gain understanding
about basic job expectations and skills, building necessary relationships, and
understanding where they fit into the team and company. These align with Herzberg’s
hygiene factors of job security, interpersonal relations and status (Herzberg et al., 1959).
The statement provided in the focus group, “The concern I most have when starting a
new job or company is am I going to grow, develop and do the job well,” is an example
of this need of job security and status during the first year of employment. Other
statements including “it is the aim of most employees to get comfortable”, and “during
the first year you are insecure, there are some insecurities when you are just starting out
in your job” and “employees just want to get the job done and see where they fit”, all
illustrate the need for leaders to be supportive, provide clear expectations and job related
growth to positively affect initial productivity.
Participants also felt that during the initial months of a new job, employees have a
stronger fear of failure. The leader and team members need to provide support for new
employees to help them feel that their contributions are appreciated and valued, therefore
decreasing the fear of failure while increasing the sense of job security. It also creates a
culture where new employees are willing to provide ideas and take risks. One female
participant explained, “The company and your leader picked you and you want to show
them that you can do a good job. Having a relationship so they can hold your hand a little
66
bit until you can show them, hey, I have the basic skills, I just need a little help to see
how you guys do it.” A male participant in a different division stated it this way. “What I
need is the support and a network. I am not going to know what is going on so I need the
constant reassurance that it is o.k. from peers and leader. This is the basic need you
have.” This sense of feeling valued during the initial months is vital to move the
employee into a productive member of the team. An employee with seven weeks tenure
shared a conversation with her leader about the effect of valuing new employees
contributions. “She said, ‘this is what I want from you, you are adding value to our team’
and I felt awesome. I think when you feel that way, it helps you take that and build
confidence in tackling other projects as well.”
I would argue that during the initial months of new employment, employee
experiences are not leading to engagement but helping the employee decide whether or
not the job is satisfying. According to Herzberg, hygiene factors do not lead to motivation
(or engagement), but if not eliminated they can lead to job dissatisfaction (Herzberg et
al., 1959). If leaders do not provide the necessary support and coaching to create a sense
of job security, build effective interpersonal relations, and increase understanding of
where the employees fits on the team (status), employees will become dissatisfied and
possibly leave the organization. The productivity discussed by the participants in the
focus group is more about getting to a basic level of performance versus an overall
increase in productivity. However, when these extrinsic hygiene factors are satisfied, new
employees move to find intrinsic factors leading to full employee engagement. One
business partner participant explained this transition in the statement, “The more tenure
and comfort that I get in my job, the more I look for other things, how my work is
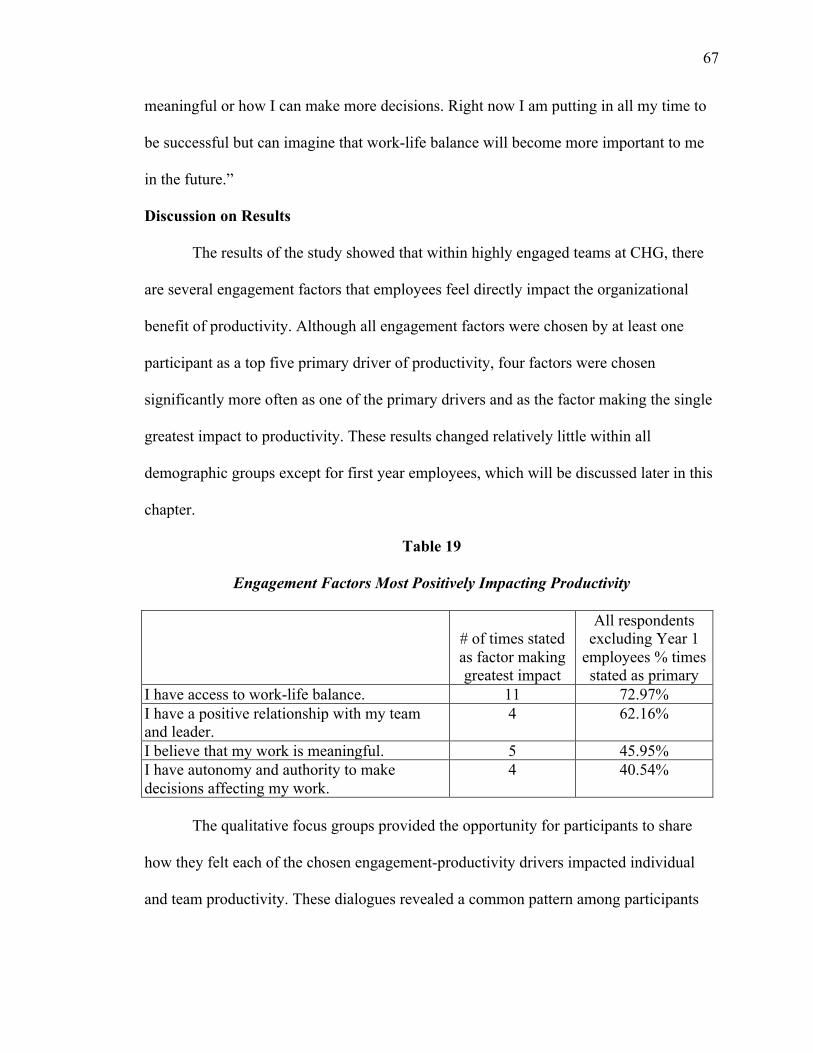
67
meaningful or how I can make more decisions. Right now I am putting in all my time to
be successful but can imagine that work-life balance will become more important to me
in the future.”
Discussion on Results
The results of the study showed that within highly engaged teams at CHG, there
are several engagement factors that employees feel directly impact the organizational
benefit of productivity. Although all engagement factors were chosen by at least one
participant as a top five primary driver of productivity, four factors were chosen
significantly more often as one of the primary drivers and as the factor making the single
greatest impact to productivity. These results changed relatively little within all
demographic groups except for first year employees, which will be discussed later in this
chapter.
Table 19
Engagement Factors Most Positively Impacting Productivity
# of times stated as factor making greatest impact
All respondents excluding Year 1
employees % times stated as primary
I have access to work-life balance. 11 72.97% I have a positive relationship with my team and leader.
4 62.16%
I believe that my work is meaningful. 5 45.95% I have autonomy and authority to make decisions affecting my work.
4 40.54%
The qualitative focus groups provided the opportunity for participants to share
how they felt each of the chosen engagement-productivity drivers impacted individual
and team productivity. These dialogues revealed a common pattern among participants
68
that productivity is increased because these engagement factors increased the desire and
ability for employees to bring the best of themselves to their jobs.
The participants desire to bring their best to work aligns with the definition of
engagement used in this research by Maylett and Warner (2014), when employees are
engaged they, “fully invest our best selves – our hearts, spirits, minds and hands – in the
work we do.” For example, participants shared that having a positive relationship with
the team and leaders led to increased desire through deeper team connections. The focus
group attendees provided many ways that team and leadership connections can be created
through building friendships, aligning around a common goal, having fun and doing team
activities. Once created, positive team connections and relationships create a desire to
help other members and the team to succeed. This is supportive of Cropanzano and
Mitchell’s, Social Exchange Model (SET) because these relationships achieve a socio-
economic resource needed by employees. Employees, in turn, repay this back by the
helping drive organizational success, in this case, team member and overall team
productivity (Cropanzano & Mitchell, 2005).
Meeting a socio-economic resource of employees was also accomplished through
access to work-life balance. Leaders encouraging employees to use necessary time-off
and flexible work schedules, provided recovery from excessive job demands. Employees
stated that because of this encouragement from leaders, when at work they wanted to
devote greater amounts of cognitive, emotional, and physical resources towards their
team’s success.
Finally, meaningful work increased participants desire to bring their best selves to
work by tapping into passion. When employees can connect how their job impacts
69
company success or the betterment of society, it drives them to want to provide extra
effort towards the job, leading to higher productivity. Many participants commented that
providing this additional effort did not feel like work at all but rather it is enjoyable
because it made a difference. In addition, belief that the job is meaningful provided the
catalyst during a stressful or difficult time to provide continued effort to achieve success.
The qualitative data shows that the chosen engagement-productivity factors
increase participant’s desire to perform at a higher level. However, to perform at their
best, employees need to not only have the desire, but they also need to have the tools and
empowerment to perform.
Having authority and autonomy to make decisions that affect their work was a
principal driver of higher performance. Providing a sense control and responsibility over
decision-making allowed employees to feel comfortable quickly making decisions and
solving problems, driving up productivity. To achieve this level of authority and
autonomy, participants spoke about being provided the growth and development tools
necessary, such as training classes, frequent meetings with leaders to discuss decisions
and mentoring from team members. These activities provided the needed support to reach
a higher level of competency. Once this level of competency was attained, leaders
allowed employees to bring their best selves through expanding decision-making
authority, increasing the employee’s sense of ownership to deliver superior results.
Work-life balance also provided a tool for higher productivity by acknowledging
that work is only one piece of the participant’s total life. Although somewhat
counterintuitive, participant feedback showed having access to work-life balance was the
engagement factor with the single greatest impact on productivity. Providing the
70
flexibility of time to handle outside commitments creates the opportunity for employees
to be fully present at work. Employees stated that because they did not have the feeling of
“doing something wrong” when needing to take time away from work, overall, stress was
reduced. This allowed employees to focus better at home and at work. In their jobs this
focus translated into employees showing improved overall performance. Similarly to
autonomy and authority, access to work-life balance also drives a sense of ownership and
control over another aspect of work, time. As stated above, this increased feeling of
ownership drives a desire to provide higher results in exchange for being provided the
additional responsibility.
Finally, participants felt that having positive relationships with the team and
leadership provide many tools necessary for success. Team members and leaders possess
the tools and skills needed for employees to grow and develop to higher levels of
competencies. Strong team relationships unlock these resources that are freely shared
between team members, thus improving both individual and team performance level.
The qualitative data provided a good understanding of why participants felt the
four engagement-productivity drivers directly impacted their productivity. These results
were very consistent throughout the participant demographic groupings except for first
year employees. First year employees provided a significantly different set of results,
which will now be discussed.
First-Year Employees
First year employees provided a significant variance in data compared to any
other demographic groups. This led the researcher to consider this part of the quantitative
71
and qualitative data collected as a separate research study. The quantitative survey results
of first year employees showed the following factors driving productivity:
1. I have a positive relationship with my team and leader.
2. I feel appreciated and valued as an employee.
3. There is open, honest two-way communication with team and leaders.
4. I have promotional and advancement opportunities.
5. I trust and respect my leaders.
6. My leaders show they care about me and the team.
7. I am grown and developed in my role.
During first year onboarding at a new job, employees try to satisfy many of the
hygiene factors described by Frederick Herzberg (Herzberg, 1959). New employee
motivational needs are extrinsic, driven outside the employee’s control and mostly
provided by leaders. First year employees main focus is to understand basic job skills and
expectations, build necessary relationships, and understand where they fit into the team
and company. These align with Herzberg’s hygiene factors of job security, interpersonal
relations and status (Herzberg et al., 1959).
This means that the employment factors chosen by this group may not be creating
engagement at all. According to Herzberg, hygiene factors do not lead to motivation (or
engagement), but if not eliminated they can lead to job dissatisfaction (Herzberg et al.,
1959). The productivity gains experienced by participants that are driven by the seven
factors chosen only helps employee’s meet a basic level of job performance. Meeting this
basic job performance level, helps decrease possible job dissatisfaction but does not drive
overall employee engagement. However, this learning should not be discounted as
72
unimportant. The study participants clearly indicated that these factors decrease the time
needed to reach this basic level of job performance and, at that point, employees look for
factors leading to full employee engagement and higher productivity.
Significance of Study
A 2013 Harvard Business Review report showed 71% of executive respondents
rank employee engagement as very important to achieving organizational success.
However, this researcher could not find a study that tried to find direct linkage between
specific engagement drivers and the specific organizational benefit of higher
productivity. The purpose of this study was to find if certain engagement drivers do
directly impact productivity in highly engaged teams at CHG and if so, how? The study
results show that employees in highly engaged teams at CHG feel that out of the twenty-
three employment factors that previous research show are antecedents of engagement,
four directly impact individual and team productivity.
These results help to expand our knowledge in the area of employee engagement
by providing a new and unique insight into the relationship between engagement and one
organizational benefit, employee productivity. More importantly, it provides some
understanding of how participants feel these factors directly impact productivity. This
information can be used by business executives in the creation of engaging employee
cultures focused on increasing individual and company productivity. The results also
provide supporting data for previous theoretical models including the Social Exchange
Model, Herzberg Two-Factor Model and the Needs Assessment Model, therefore
increasing the overall body of knowledge related to employee engagement in the
workplace.
73
Study Limitations
This study was limited to internal, highly engaged teams within one organization.
In addition, all participants in the study were located in one office location, Salt Lake
City, Utah. Both these factors create a fairly small demographic viewpoint and limit the
ability to determine any external validity of the findings.
Another potential limitation is that since the researcher is an executive leader at
the company, potential research bias, including possible hierarchal influence, could
impact the results. The study tried to overcome these factors through the research design
of individually taken written surveys completed prior to any group discussions occurring.
No written surveys were exchanged between participants during the focus group
discussion and participants provided no personal identification on the survey. Aggregate
quantitative scores were only compiled after completion of focus groups. Focus group
discussions were limited to only how and why participants felt their choices positively
affected productivity and the researcher provided no personal opinions on results during
the focus group sessions.
Recommendation for Future Studies
Additional studies in the future with highly engaged employees at CHG would
help test the validity of the results of this study. Meaningfully increasing the sample size
would increase confidence in the internal results received.
Understanding what are the factors that drive productivity is an important
competitive advantage for business. However, employee culture and focus on employee
engagement can vary dramatically between companies. One area that can be studied in
future research is the role that company culture plays in what engagement factors
74
employees feel drive productivity. Therefore, replicating the research at other
organizations would provide understanding if the engagement factors driving
productivity identified in this study are universal for all engaged employees or specific to
the employees within the CHG employee culture. This research should be completed
across several industries and company sizes.
In the study, first year employee results varied greatly compared to results of all
other participant demographic groups. Additional qualitative data was collected showing
that new employees needs center around the areas of building effective interpersonal
relationship, growing job skills and knowledge, and feeling valued and appreciated for
their contributions. This researcher believes that this participant group is looking to attain
basic hygiene factors during this timeframe. Achievement of these hygiene factors may
increase productivity, but do not create employee engagement. More research around
what employment or engagement factors more effectively orient new employees would
be an excellent area of research.
Finally, the study focused entirely on highly engaged employees. Another study
that could provide interesting comparison data is a duplication of this research
methodology to employees not considered highly engaged or even fully disengaged.
Summary
This chapter presented a summary of the research results including the
significance to the study of employee engagement. Limitations of study and
recommendations for future research were also identified.
75
References
Aon Hewitt. (2011). Manager: Your strongest (or weakest) link in driving employee engagement. New York: Aon Hewitt.
Bakker, A., & Demerouti, E. (2007). The job demands-resources model: State of the art.
Journal of Managerial Psychology, 22 , 309 -328. Bates, S. (2004, 1-February). Getting engaged. HR Magazine . Bledow, R., Schmitt, A., Frest, M., & Kuhnel, J. (2011). The Affective Shift Model of
Work Engagement. Journal of Applied Psychology, 96 , 1246 -1257. Bozemanscience.com. (n.d.). Chi-Square Testing. (Bozemanscience.com, Producer)
Retrieved Janury 24, 2016, from Youtube: http://www.youtube.com Corporate Leadership Council. (2004). Driving performance and retention through
employee engagement. Corporate Executive Board. Corporate Executive Board. Cropanzano, R., & Mitchell, M. (2005). Social exchange theory: An interdisciplinary
review. Journal of Management, 31 , 874 - 900. Decisionwise, Inc. (2015). 2015 CHG Employee Satisfaction Survey. Decisionwise. Development Divisions International. (2005). Employee engagement: The key to
realizing competitive advantage. Pittsburgh: DDI. Ferguson, A. (2007 йил 20-June). Employee engagement: Does it exists, and if so, how
does it relate to performance, other constructs and individual differences? From Life That Works: www.lifethatworks.com
Franz, T. (2012). Group dynamics and team interventions, Understanding and improving
team performance. West Sussex: Wiley-Blackwell Publishing. Gallup, Inc. (2006). Q12 Meta-Analysis. Washington: Gallup Poll. Gallup, Inc. (2013, 1-June). State of the American workplace: Employee engagement
insights of U.S. business leaders. Retrieved 2015 15-April from Gallup: http://employeenengagement.com/wp-content/uploas/2013/06/Gallup-2013-State-of-the- American-Workplace-Report.pdf
Gallup Inc. (2015). State of the american manager: Analytics and advice for leaders.
Washington DC: Gallup. Harpst, G. (2008). Six disciplines execution revolution. Findlay, OH: Six Disciplines
Publishing.
76
Harter, J. K., Schmidt, F. L., & Hayes, Y. (2002). Business-unit-level relationship
between employee satisfaction, employee engagement, and business outcomes: A meta-analysis. Journal of Applied Psychology, 87 , 268 - 279.
Harvard Business Review. (2005). Builidng a high performance team. Harvard Business
Review . Harvard Business Review Analytic Services. (2013). The impact of employee engagement
on performance. New York: HBR Publishing. Herzberg, F. M. (1959). The Motivation of Work. New York: John Wiley and Sons. Herzberg, F. (1965). The new industrial psychology. Industrial and Labor Relations
Review, 18(3) , 364-376. Hewett Associates. (2004). Employee engagement higher at double-digit growth
companies. London: Hewett Associates. Kahn, W. (1990). Pschological conditions of personal engagement and disengagement at
wolk. Academy of Management Journal, 33(4) , 692-724. Katzenbach, J., & Smith, D. (1993,March - April). The discipline of teams. Harvard
Business Review . Kenexa. (2009). The impact of employeee engagement. Kenexa Research Institute. Kruse, K. (2012). Employee engagement 2.0: How to motivate your team for hihg
performance. Richboro: The Kruse Company. Kumar, D., & Swetha, G. (2011). A Prognostic Examination of Employee Engagement
from its Historical Roots. International Journal of Trade, Economics and Finance, Vol. 2, No. 3 , 232-241.
Lencioni, P. (2002). Five dysfunctions of a team. San Francisco: Jossey-Bass. Limbrey, P., Meikle, A., & Berggren, E. Leaders drive productivity:Are you buidinga
high performance environment? Success Factors. Success Factors. Lockwood, N. R. (2007). Leveraging employee engagement for competative advantage.
Alexandria: SHRM Research. Macey, W., & Schneider, B. (2008). The meaning of employee engagement. Industrial
and Organizational Psychology, 1 , 3-30.
77
Maslach, C., Scaufelli, W., & Leiter, M. (2001). Job burnout. Annual Review of Psychology, Vol 52 , 397-422.
Maxwell, J. (2013). Qualitative research design, An interactive approach . Los Angeles:
SAGE Pubications Ltd. May, D., Gilson, R., & Harter, L. (2004). The psychological conditions of
meaningfulness, safety and availbility and the engagement of the human spirit at work. Journal of Occupational and Organizational Psychology, 77 , 11 - 37.
Maylett, T., & Warner, P. (2014). Magic: Five keys to unlock the power of employee
engagement. Austin, TX: Greenleaf Book Group. Meijmanm, T., & Mulder, G. (1998). Psychological aspects of workload, 2nd Ed. In P.
Drenth, H. Thierry, & C. de Wolff, Handbook of Work and Organizational Psychology (pp. 5 - 33). Hove: Erlbaum.
Melamed, A., Shirom, A., Toker, S., & Berlinger, S. S. (2006). Burnout and risk of
cadiovascular disease: Evidence, possible causal paths and promising reserach directions. Psychological Bulletin, 132 , 327 - 353.
Pentland, A. (2012 April). The new science of building great teams. Harvard Business
Journal, , 20. Psychology Today. (n.d.). 10 rules for high performing team. Retrieved 2015 йил 2-
March from Psychology Today: www.psychologytoday.com Rialto Consultancy. (2011). How to create high performing teams. Rialto Consultancy. Robinson, D., Perryman, S., & Hayday, S. (2004). The drivers of employee engagement.
Brighton: Institute of Employment Studies. Rucci, A., Kirn, S., & Quinn, R. (1998, January). The employee-customer profict chain at
Sears. Harvard Business Review, Vol 76 . Saks, A. (2005). Antecedents and consequences of employee engagement. Journal of
Managerial Psychology , 600-619. Schaufeli, W. (2103). What is engagement? In C. Truss, K. D. Alfes, A. Shantx, & E.
Sloane, Employee Engagement in Theory and Practice. London, Routledge: Routledge.
Schaufeli, W., Taris, T., & van Rhenen, W. (2008). Workaholism, burnout, and work
Engagement: Three of a kind orthree different kinds of employee well-being? Applied PsychologyL An International Review, 57 , 173 - 203.
78
Shephard, W., & Isaksen, S. (2009). Leadership for high performing teams:The role of facilitaing CPS. Retrieved 2015, April from www.cpsb.com
Shuck, M., & Wollard, K. (2009). A historical perspective of employee engagement: An
emerging definition. Proceedings of the Eighth Annual College of Education & GSN Research Conference (pp. 133-139). Miami, Florida: M.S. Plakhotnik, S.M. Nielson, & D.M. Pane (Eds).
Society for Human Resource Management. (2006). Effective practice guidelines:
Employee engagement and commitment. SHRM Foundatiion . Sommer, D. (2010). Essentials for building a high performance team. Retrieved 2015
йил April from www.top-consultant.com: www.top-consultant.cpm/articles Sonnentag, S., Dormann, C., & Demerouti, E. (2010). Not all days are created equal: The
concept of the state work engagement. In A. Bakker, & M. Leiter, Work engagement: Recent developments in theory and research (pp. 25 - 38). new York: Osychology Press.
Tower Perrin. (2003). Working today: Understanding what drives employee engagement.
New York: Towers Perrin. Towers Perrin. (2004). European talent survey: Reconnecting with employees: Attracting,
retaining and engaging. Towers Perrin.
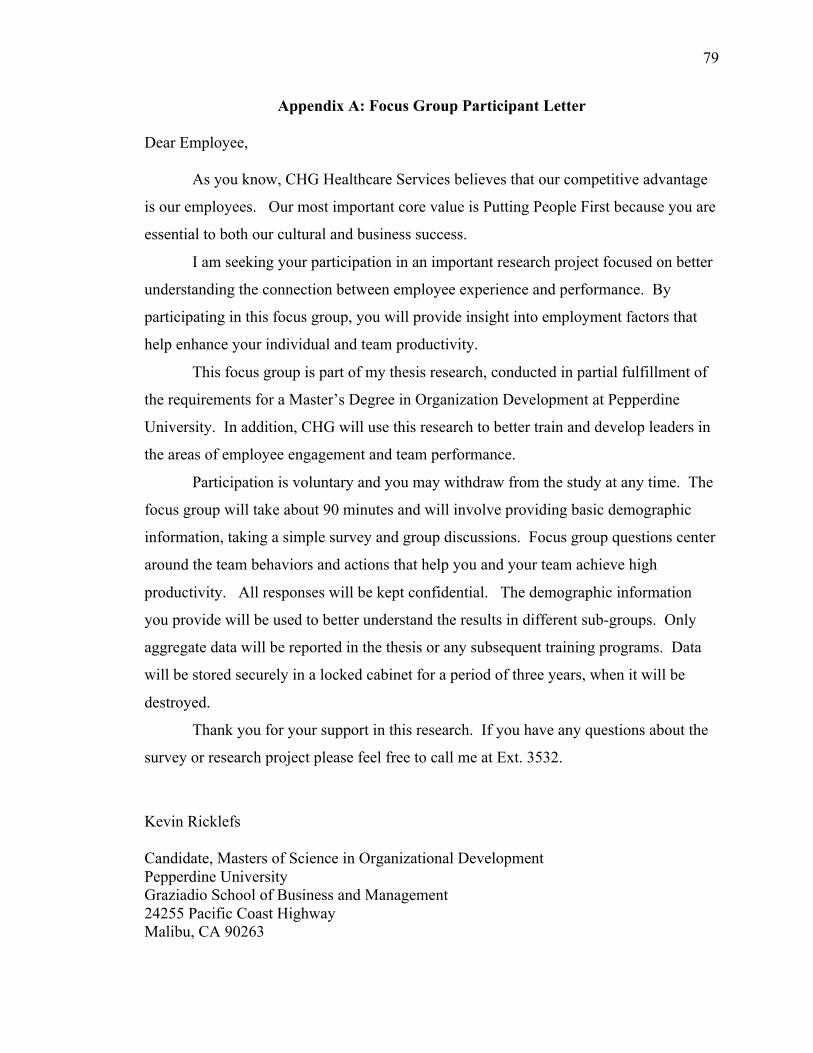
79
Appendix A: Focus Group Participant Letter
Dear Employee,
As you know, CHG Healthcare Services believes that our competitive advantage
is our employees. Our most important core value is Putting People First because you are
essential to both our cultural and business success.
I am seeking your participation in an important research project focused on better
understanding the connection between employee experience and performance. By
participating in this focus group, you will provide insight into employment factors that
help enhance your individual and team productivity.
This focus group is part of my thesis research, conducted in partial fulfillment of
the requirements for a Master’s Degree in Organization Development at Pepperdine
University. In addition, CHG will use this research to better train and develop leaders in
the areas of employee engagement and team performance.
Participation is voluntary and you may withdraw from the study at any time. The
focus group will take about 90 minutes and will involve providing basic demographic
information, taking a simple survey and group discussions. Focus group questions center
around the team behaviors and actions that help you and your team achieve high
productivity. All responses will be kept confidential. The demographic information
you provide will be used to better understand the results in different sub-groups. Only
aggregate data will be reported in the thesis or any subsequent training programs. Data
will be stored securely in a locked cabinet for a period of three years, when it will be
destroyed.
Thank you for your support in this research. If you have any questions about the
survey or research project please feel free to call me at Ext. 3532.
Kevin Ricklefs
Candidate, Masters of Science in Organizational Development Pepperdine University Graziadio School of Business and Management 24255 Pacific Coast Highway Malibu, CA 90263
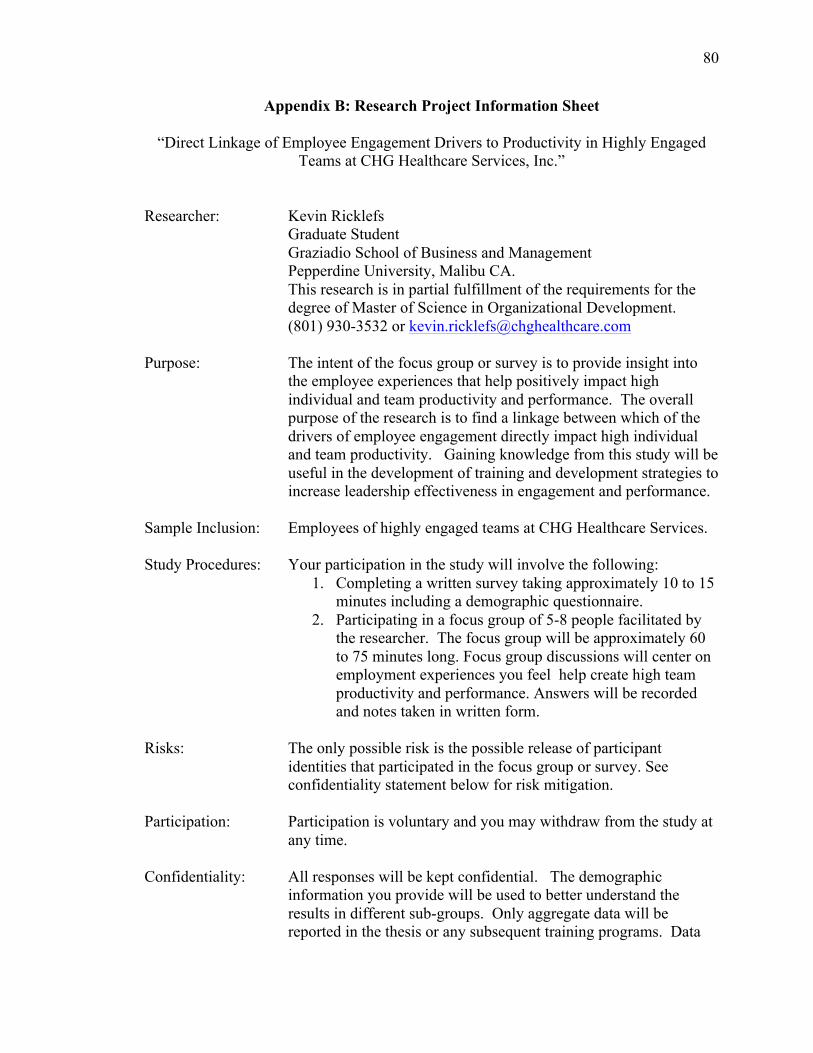
80
Appendix B: Research Project Information Sheet
“Direct Linkage of Employee Engagement Drivers to Productivity in Highly Engaged Teams at CHG Healthcare Services, Inc.”
Researcher: Kevin Ricklefs Graduate Student Graziadio School of Business and Management Pepperdine University, Malibu CA.
This research is in partial fulfillment of the requirements for the degree of Master of Science in Organizational Development. (801) 930-3532 or [email protected]
Purpose: The intent of the focus group or survey is to provide insight into the employee experiences that help positively impact high individual and team productivity and performance. The overall purpose of the research is to find a linkage between which of the drivers of employee engagement directly impact high individual and team productivity. Gaining knowledge from this study will be useful in the development of training and development strategies to increase leadership effectiveness in engagement and performance.
Sample Inclusion: Employees of highly engaged teams at CHG Healthcare Services. Study Procedures: Your participation in the study will involve the following:
1. Completing a written survey taking approximately 10 to 15 minutes including a demographic questionnaire.
2. Participating in a focus group of 5-8 people facilitated by the researcher. The focus group will be approximately 60 to 75 minutes long. Focus group discussions will center on employment experiences you feel help create high team productivity and performance. Answers will be recorded and notes taken in written form.
Risks: The only possible risk is the possible release of participant
identities that participated in the focus group or survey. See confidentiality statement below for risk mitigation.
Participation: Participation is voluntary and you may withdraw from the study at
any time. Confidentiality: All responses will be kept confidential. The demographic
information you provide will be used to better understand the results in different sub-groups. Only aggregate data will be reported in the thesis or any subsequent training programs. Data
81
will be stored securely in a locked cabinet for a period of three years, when it will be destroyed.
Consent: I have read this description of the study and have had the
opportunity to have all my questions answered. I understand the purpose of the study and that participation in the study is strictly voluntary. I can withdraw from the research at any time and for any reason. By participating in this focus group, I am providing my consent to this research.
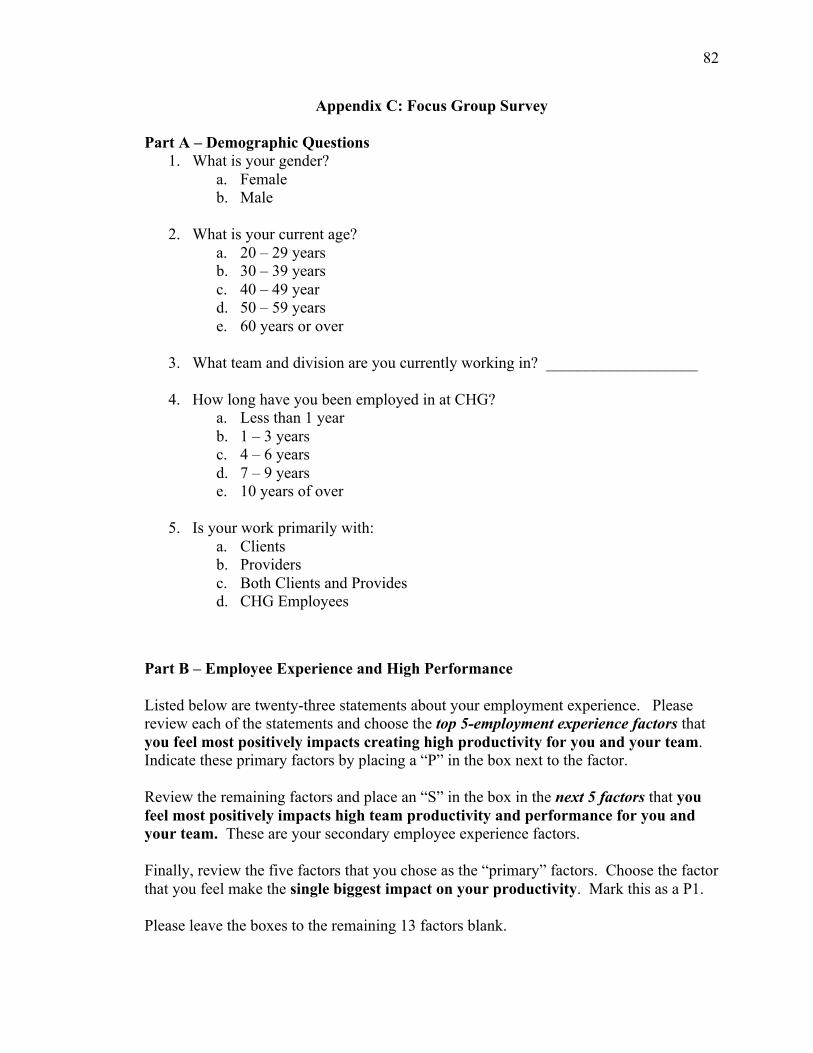
82
Appendix C: Focus Group Survey
Part A – Demographic Questions 1. What is your gender?
a. Female b. Male
2. What is your current age?
a. 20 – 29 years b. 30 – 39 years c. 40 – 49 year d. 50 – 59 years e. 60 years or over
3. What team and division are you currently working in? ___________________
4. How long have you been employed in at CHG?
a. Less than 1 year b. 1 – 3 years c. 4 – 6 years d. 7 – 9 years e. 10 years of over
5. Is your work primarily with:
a. Clients b. Providers c. Both Clients and Provides d. CHG Employees
Part B – Employee Experience and High Performance Listed below are twenty-three statements about your employment experience. Please review each of the statements and choose the top 5-employment experience factors that you feel most positively impacts creating high productivity for you and your team. Indicate these primary factors by placing a “P” in the box next to the factor. Review the remaining factors and place an “S” in the box in the next 5 factors that you feel most positively impacts high team productivity and performance for you and your team. These are your secondary employee experience factors. Finally, review the five factors that you chose as the “primary” factors. Choose the factor that you feel make the single biggest impact on your productivity. Mark this as a P1. Please leave the boxes to the remaining 13 factors blank.
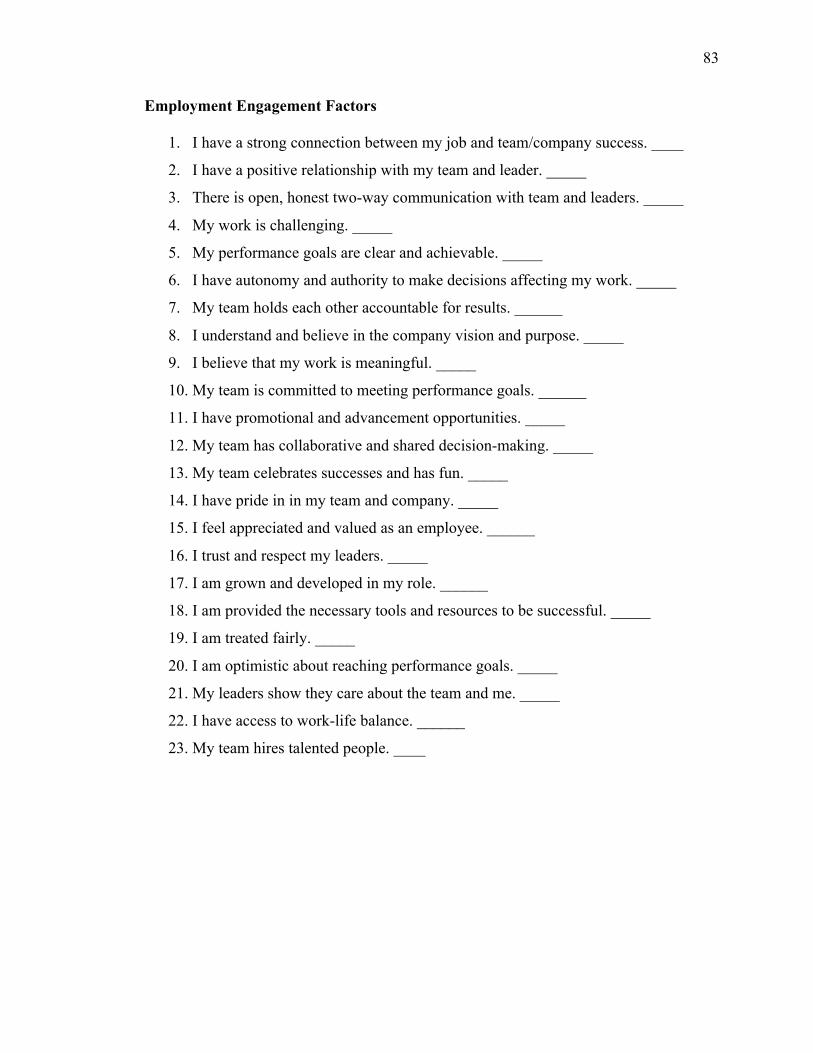
83
Employment Engagement Factors
1. I have a strong connection between my job and team/company success. ____
2. I have a positive relationship with my team and leader. _____
3. There is open, honest two-way communication with team and leaders. _____
4. My work is challenging. _____
5. My performance goals are clear and achievable. _____
6. I have autonomy and authority to make decisions affecting my work. _____
7. My team holds each other accountable for results. ______
8. I understand and believe in the company vision and purpose. _____
9. I believe that my work is meaningful. _____
10. My team is committed to meeting performance goals. ______
11. I have promotional and advancement opportunities. _____
12. My team has collaborative and shared decision-making. _____
13. My team celebrates successes and has fun. _____
14. I have pride in in my team and company. _____
15. I feel appreciated and valued as an employee. ______
16. I trust and respect my leaders. _____
17. I am grown and developed in my role. ______
18. I am provided the necessary tools and resources to be successful. _____
19. I am treated fairly. _____
20. I am optimistic about reaching performance goals. _____
21. My leaders show they care about the team and me. _____
22. I have access to work-life balance. ______
23. My team hires talented people. ____
84
Appendix D: Focus Group Process and Qualitative Questions
Part A: Opening Comments: • Welcome and thank you for participating statement • Explain purpose of the study, focus group agenda and process and confidentiality
of data. • Explain that notes will be taken and answers will be taped. • Restate that the focus group is voluntary and that participants can leave at any
time. Part B: Administer Focus Group Questionnaire
• Have the participants list on a board their primary factors. o For duplicates, keep a count of the number of participants who listed the
factor in their top
Part C: Qualitative Interview Questions Introductory Statement: “Based on the questionnaires you completed, these are the primary employee experience factors that you chose that make the great impact in creating high productivity and performance for you and your team. “ Introductory Questions: “Do you agree with your list of top factors chosen?” “ Are there any surprises on what made the list?” Objectives: The objective to the introductory question is two-fold. Primarily, it is to validate that the group feels the list represents the employment experience factors that are most impactful to individual and team productivity. Secondarily, it provides an easily and comfortable entry into the qualitative interview questioning. Statement: “I now want to ask a series of questions about the primary employee experience factors you chose that have the biggest impact in creating high individual and team productivity and performance.” (The researcher will take one of the primary factors and ask these questions regarding the factor) Key Questions
• “What are the specific reasons that this primary factor was chosen?” • “How does this experience show itself in the behaviors and actions of the team or
individual on the team?” • “What do you see as the linkage between the employee experience, the behavior
of the individual and team and the increase in productivity and performance?” • “How often do you see these behaviors and actions played out in your team?”
85
Follow-up Questions – Each question should begin a group dialogue. During the discussion, several follow-up questions will be used to get deeper, more meaningful information such as:
• “What do you mean by…?” • “Can you provide more information about….?” • “Do you have another example of…..?”
Objectives: These questions explores the factors the focus group feels make the most impact in individual and team performance. Questions will be used to more deeply explore why the participants feel that these are primary drivers, the individual and team actions and behaviors associated with the factor and how often these actions and behaviors are see Secondary Questions:
• “What role does your leader play in these primary employee experience factors?” • If this factor was not present in the team, what impact would it have on your
current individual and team performance?” Objectives: The secondary questions will be used to better understand the cause and effect of the factors and determine what, if any, role the leader plays. Ending Question:
• “Do you feel that there are any other employee experience factors that were not discussed today that substantially impacts high individual and team performance?”
• Which employment factor did you indicate created the biggest impact in your productivity?
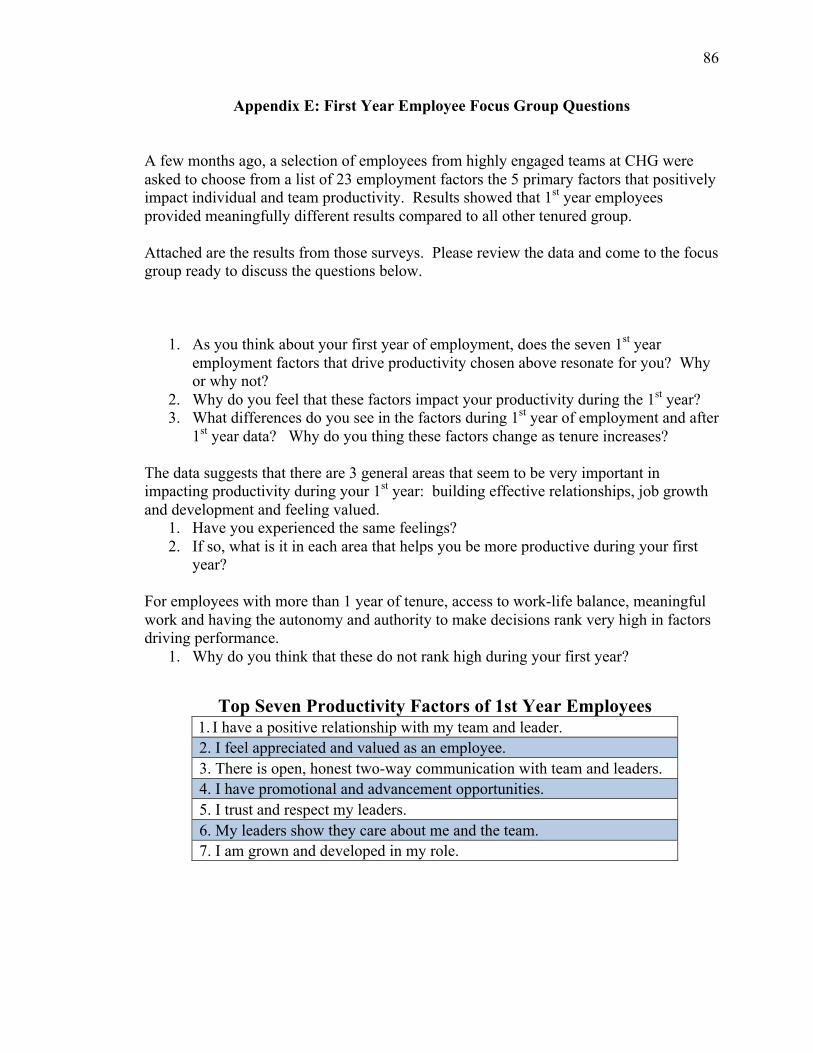
86
Appendix E: First Year Employee Focus Group Questions
A few months ago, a selection of employees from highly engaged teams at CHG were asked to choose from a list of 23 employment factors the 5 primary factors that positively impact individual and team productivity. Results showed that 1st year employees provided meaningfully different results compared to all other tenured group. Attached are the results from those surveys. Please review the data and come to the focus group ready to discuss the questions below.
1. As you think about your first year of employment, does the seven 1st year employment factors that drive productivity chosen above resonate for you? Why or why not?
2. Why do you feel that these factors impact your productivity during the 1st year? 3. What differences do you see in the factors during 1st year of employment and after
1st year data? Why do you thing these factors change as tenure increases? The data suggests that there are 3 general areas that seem to be very important in impacting productivity during your 1st year: building effective relationships, job growth and development and feeling valued.
1. Have you experienced the same feelings? 2. If so, what is it in each area that helps you be more productive during your first
year? For employees with more than 1 year of tenure, access to work-life balance, meaningful work and having the autonomy and authority to make decisions rank very high in factors driving performance.
1. Why do you think that these do not rank high during your first year?
Top Seven Productivity Factors of 1st Year Employees 1. I have a positive relationship with my team and leader. 2. I feel appreciated and valued as an employee. 3. There is open, honest two-way communication with team and leaders. 4. I have promotional and advancement opportunities. 5. I trust and respect my leaders. 6. My leaders show they care about me and the team. 7. I am grown and developed in my role.
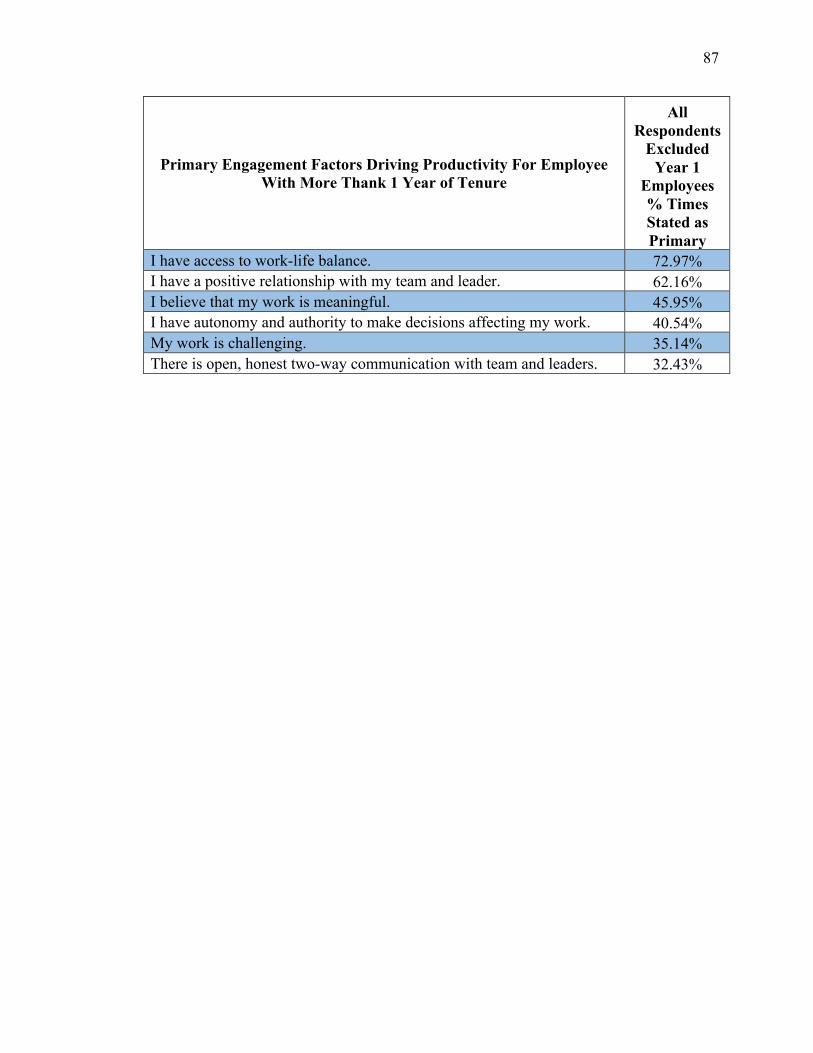
87
Primary Engagement Factors Driving Productivity For Employee With More Thank 1 Year of Tenure
All Respondents
Excluded Year 1
Employees % Times Stated as Primary
I have access to work-life balance. 72.97% I have a positive relationship with my team and leader. 62.16% I believe that my work is meaningful. 45.95% I have autonomy and authority to make decisions affecting my work. 40.54% My work is challenging. 35.14% There is open, honest two-way communication with team and leaders. 32.43%