Embed Size (px)
Citation preview

Energy Use Consequences of Ventilating a Net-Zero Energy House
Lisa Ng William V. Payne II
Engineering Laboratory, National Institute of Standards and Technology 100 Bureau Drive Gaithersburg, MD 20899
Content submitted to and published by: HVAC&R Equipment Performance Group
U.S. Department of Commerce
Penny Pritzker, Secretary of Commerce
National Institute of Standards and Technology Willie E May, Director

DISCLAIMERS Certain commercial entities, equipment, or materials may be identified in this document in order to describe an experimental procedure or concept adequately. Such identification is not intended to imply recommendation or endorsement by the National Institute of Standards and Technology, nor is it intended to imply that the entities, materials, or equipment are necessarily the best available for the purpose. Any link(s) to website(s) in this document have been provided because they may have information of interest to our readers. NIST does not necessarily endorse the views expressed or the facts presented on these sites. Further, NIST does not endorse any commercial products that may be advertised or available on these sites.

1
Energy Use Consequences of Ventilating a Net-Zero Energy House
Lisa C. Nga and W. Vance Payneb a Indoor Air Quality and Ventilation Group, b HVAC&R Equipment Performance Group
Energy and Environment Division, National Institute of Standards and Technology 100 Bureau Drive, MS 8633, Gaithersburg, MD 20899, USA
Phone: +1-301-975-4853; Email: [email protected]
Abstract A Net-Zero Energy Residential Test Facility (NZERTF) has been constructed at the National Institute of Standards and Technology (NIST) in Gaithersburg, Maryland to demonstrate that a home similar in size, aesthetics, and amenities to those in the surrounding communities can achieve net-zero energy use over the course of a year while meeting the average electricity and water use needs of a family of four in the United States. The facility incorporates renewable energy and energy efficient technologies, including an air-to-air heat pump system, a solar photovoltaic system, a solar thermal domestic hot water system, and a heat recovery ventilation system sized to meet American Society of Heating, Refrigeration, and Air-Conditioning Engineers (ASHRAE) Standard 62.2-2010 ventilation requirements. The largest energy end use within the home was space conditioning, which included heat loss through the building envelope, ventilation air supplied by the heat recovery ventilator (HRV), and internal loads. While HRVs are often described as being able to save energy when compared to ventilating without heat recovery, there have been no studies using a full year of measured data that determine the thermal load and energy impacts of HRV-based ventilation on the central heating and cooling system. Over the course of a year, continuous operation of the HRV at the NZERTF resulted in an annual savings of 7 % in heat pump energy use compared with the hypothetical case of ventilating without heat recovery. The heat pump electrical use varied from an increase of 5 % in the cooling months to 36 % savings in the heating months compared with ventilation without heat recovery. The increase in the cooling months occurred when the outdoor temperature was lower than the indoor temperature, during which the availability of an economizer mode would have been beneficial. Nevertheless, the fan energy required to operate the selected HRV at the NZERTF paid for itself in the heat pump energy saved compared with ventilation without heat recovery.
Keywords: air-to-air heat pump; heat recovery ventilator; net-zero energy buildings; ventilation energy use

2
Nomenclature cp heat capacity [kJ kg K-1] P power demand [W] COP coefficient of performance [W W-1] Q thermal cooling or heating energy
[Wh or kWh] E electrical energy [Wh or kWh] RH relative humidity E+ additional electrical energy needed by
heat pump due to ventilation
SHR sensible heat ratio
h enthalpy [kJ kg-1] t time [min or h] �̇�𝑚 mass flow rate [kg s-1] T temperature [°C or K] p total pressure [Pa] W humidity ratio [kg kg-1] pw partial pressure of water vapor Subscripts alat active dehumidification mode latent
energy LR living room
all thermal load on the entire house, including conduction losses, infiltration, ventilation air, internal loads, etc.
nlat normal latent (excludes active dehumidification mode)
avg daily average n normal without active dehumidification, resistive heat, or standby use
calc calculated value nv no ventilation case da dry air oa outdoor air db dry-bulb ODfan heat pump outdoor fan unit dew dewpoint res auxiliary resistive heat exh exhaust air ret return HP heat pump sens sensible HRV heat recovery ventilator sens.nv sensible without ventilation IDfan heat pump indoor fan unit stdby heat pump standby use lat latent tot total lat.nv latent without ventilation 1. Introduction
Buildings consumed 41 % of all energy used in the United States in 2011, with residential buildings and commercial buildings accounting for 22 % and 19 % [1], respectively. In addition to consuming more energy than the transportation or industrial sectors, buildings represent the fastest growing sector of energy usage [1]. Thus, goals for achieving net-zero energy performance have been established in the U. S. and around the world. A net-zero energy building

3
(ZEB) is an energy-efficient building where, on a source energy basis, the actual annual delivered energy is less than or equal to the on-site renewable exported energy [2]. Under the Energy Independence and Security Act of 2007, U. S., federal buildings are mandated to eliminate fossil fuel-generated energy consumption by 2030 [3]. For federal buildings to be built in 2020 and beyond, they must be net-zero by 2030 [4]. The American Institute of Architects set a goal for all new and renovated buildings to be carbon-neutral by 2030 [5]. The American Society of Heating, Refrigeration, and Air-Conditioning Engineers (ASHRAE) issued a visit to develop tools by 2020 that enable the building community to produce market-viable net-zero energy buildings by 2030 [6]. In 2010, the Energy Performance of Buildings Directive stated all buildings in the European Union to be nearly net-zero by 2020 [7]. Melbourne, Australia has set a goal to be a carbon neutral city by 2020 [8]. Thus, buildings have been designed, constructed and monitored throughout the world to demonstrate the feasibility of achieving net-zero energy. Parker [9] presents a history of low energy homes, including annual performance data from a dozen very low energy homes in North America. Musall et al. [10] summarizes the research of the International Energy Agency’s Annex 52 “Towards Net Zero Energy Buildings” and states that “during the last 20 years more than 200 reputable projects with the claim of a net-zero energy budget have been realized all over the world.” Rosta et al. [11] report on the construction and performance of a net-zero energy house in the Desert Southwest region of the United States. Boleyn [12] reports on a residence in Portland, Oregon that is approaching net-zero in a relatively cloudy climate. Sherwin et al. [13] present the performance of four near net-zero energy homes in Florida instrumented to provide data on electrical consumption and generation, indoor conditions, and outdoor weather. Norton et al. [14] report on the design and performance of a three-bedroom Habitat for Humanity net-zero energy home near Denver, Colorado that produced 24 % more energy than it consumed during its first year of operation. Of these six studies, only four mentioned that ventilation was provided to maintain acceptable indoor air quality (IAQ) and none of them mentioned the design ventilation rate. Further, the energy use consequences of ventilation were not discussed in any of these studies.
The studies of net-zero energy buildings cited above report data on energy usage with little or no discussion of IAQ. ASHRAE has a standard containing minimum ventilation rates to achieve acceptable IAQ based on the floor area and number of bedrooms, ASHRAE Standard 62.2 [15]. The Standard does not, however, dictate how the ventilation air has to be delivered. There are many ways to deliver the air, including exhaust-only systems, supply-only systems, systems that are integrated with the central heating and cooling system, and heat recovery and energy recovery ventilators (HRV, ERV). The difference between an HRV and ERV is that HRVs recover only sensible heat and ERVs recover both heat and moisture.
Lstiburek et al. [16] simulated high-performance houses in six U.S. climate zones and with various mechanical ventilation systems, including an HRV/ERV and supply-only ventilation. For all the climates simulated, the use of an HRV/ERV saved on average 3 % (ranging from no

4
savings to 7 %) in space conditioning and ventilation fan energy combined compared with a supply-only ventilation system. Sherman and Walker [17] and Rudd et al. [18] performed simulation studies on similar houses in six U.S. climate zones. Sherman and Walker [17] found that the use of an HRV/ERV saved on average 1 % (ranging from a 4 % energy increase to a 6 % savings) in space conditioning and ventilation fan energy combined compared with a supply-only ventilation system. Rudd et al. [18] found that the use of an HRV/ERV saved on average 7 % (ranging from a 2 % energy increase to an 11 % savings) for a house with a Home Energy Rating System (HERS) index [19] of 50 compared with a central space conditioning system with outdoor air intake. Walker and Sherman [20] performed simulation studies on houses in California climates and modeled an HRV in the “cold climate”. They found that the use of an HRV saved 5 % compared with a supply-only ventilation system. The HRV was modeled to operate on a 50 % duty cycle because the minimum flow rate exceeded the minimum requirements of ASHRAE 62.2. On average, the fan power required to operate the HRV/ERV studied was 7 % of the energy required by the space conditioning system.
Turner and Walker [21] presented simulation results of using a proposed control system to determine the optimal time, based on time-of-use pricing and outdoor temperature, to run an HRV without compromising indoor air quality (IAQ) and occupant health. The control system also monitors the operation of local exhaust fans and does not activate the HRV when the flow rates from local exhaust fans meet the required minimum whole-building ventilation rate. The use of the controller in conjunction with an HRV saved on average 31 % in space conditioning and ventilation fan energy combined when compared with using an HRV without the proposed controller.
Dodoo et al. [22] simulated supply-only ventilation and an HRV in an apartment building in Europe built to conventional building standards and also one built to passive house standards, which had a building envelope that was twice as tight. They found that in the building built to conventional building standards, the use of an HRV saved 21 % in space heating only and ventilation fan energy combined compared with a supply-only ventilation system. In the building built to the passive house standards, the use of an HRV saved 55 % in space heating only and ventilation fan energy combined compared with a supply-only ventilation system.
These studies demonstrate the wide range of savings HRVs and ERVs can have on ventilation-related energy (fan power plus heating and cooling) depending on ventilation rate, building size, building envelope leakage, and climate. However, they all have been based on simulated data. This study used actual energy data collected for one year for an air-to-air heat pump and an HRV in order to determine the impact of ventilation air on the heating and cooling loads of a very low energy house. The purpose of this manuscript is to examine the energy use consequences of different options for ventilating a net-zero home. Similar analysis was performed previous by the authors in Fanney et al. [23], but the analysis in this manuscript provides greater detail.
5
2. Test house
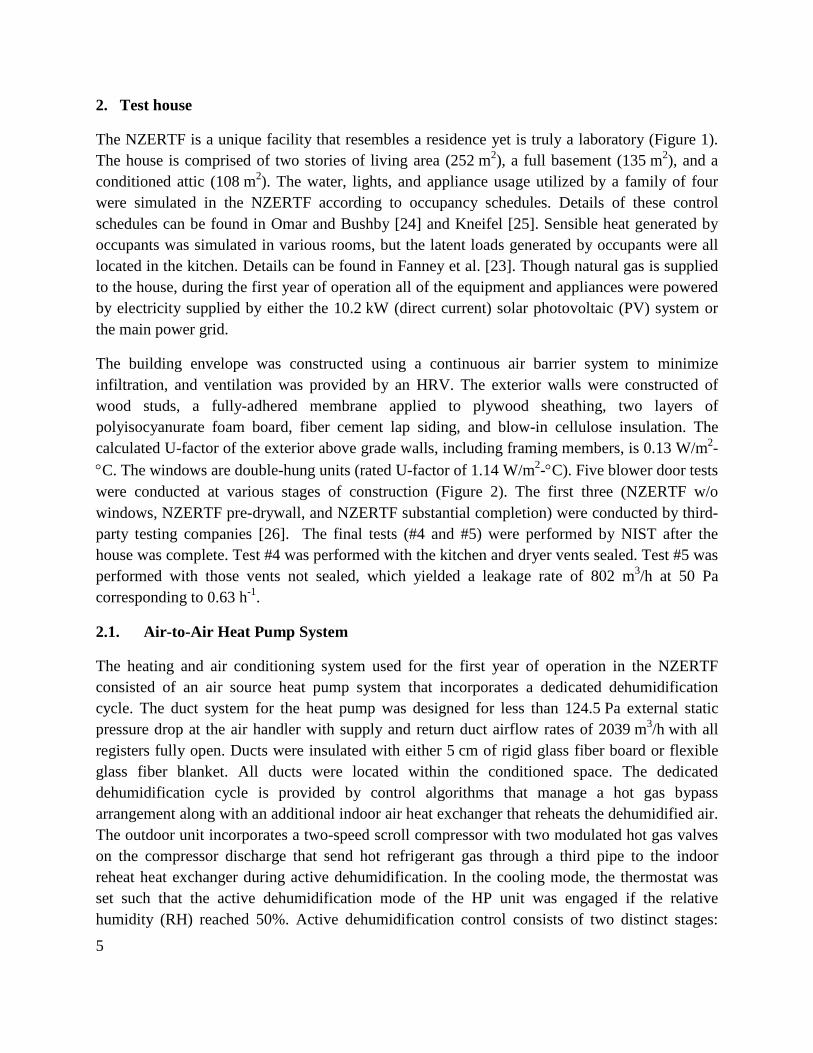
The NZERTF is a unique facility that resembles a residence yet is truly a laboratory (Figure 1). The house is comprised of two stories of living area (252 m2), a full basement (135 m2), and a conditioned attic (108 m2). The water, lights, and appliance usage utilized by a family of four were simulated in the NZERTF according to occupancy schedules. Details of these control schedules can be found in Omar and Bushby [24] and Kneifel [25]. Sensible heat generated by occupants was simulated in various rooms, but the latent loads generated by occupants were all located in the kitchen. Details can be found in Fanney et al. [23]. Though natural gas is supplied to the house, during the first year of operation all of the equipment and appliances were powered by electricity supplied by either the 10.2 kW (direct current) solar photovoltaic (PV) system or the main power grid.
The building envelope was constructed using a continuous air barrier system to minimize infiltration, and ventilation was provided by an HRV. The exterior walls were constructed of wood studs, a fully-adhered membrane applied to plywood sheathing, two layers of polyisocyanurate foam board, fiber cement lap siding, and blow-in cellulose insulation. The calculated U-factor of the exterior above grade walls, including framing members, is 0.13 W/m2-°C. The windows are double-hung units (rated U-factor of 1.14 W/m2-°C). Five blower door tests were conducted at various stages of construction (Figure 2). The first three (NZERTF w/o windows, NZERTF pre-drywall, and NZERTF substantial completion) were conducted by third-party testing companies [26]. The final tests (#4 and #5) were performed by NIST after the house was complete. Test #4 was performed with the kitchen and dryer vents sealed. Test #5 was performed with those vents not sealed, which yielded a leakage rate of 802 m3/h at 50 Pa corresponding to 0.63 h-1.
2.1. Air-to-Air Heat Pump System
The heating and air conditioning system used for the first year of operation in the NZERTF consisted of an air source heat pump system that incorporates a dedicated dehumidification cycle. The duct system for the heat pump was designed for less than 124.5 Pa external static pressure drop at the air handler with supply and return duct airflow rates of 2039 m3/h with all registers fully open. Ducts were insulated with either 5 cm of rigid glass fiber board or flexible glass fiber blanket. All ducts were located within the conditioned space. The dedicated dehumidification cycle is provided by control algorithms that manage a hot gas bypass arrangement along with an additional indoor air heat exchanger that reheats the dehumidified air. The outdoor unit incorporates a two-speed scroll compressor with two modulated hot gas valves on the compressor discharge that send hot refrigerant gas through a third pipe to the indoor reheat heat exchanger during active dehumidification. In the cooling mode, the thermostat was set such that the active dehumidification mode of the HP unit was engaged if the relative humidity (RH) reached 50%. Active dehumidification control consists of two distinct stages:

6
stage 1 lowers the indoor blower speed for approximately 15 min or until the RH setpoint is reached; stage 2 begins after 15 min of stage 1 operation by modulation of the two outdoor unit hot gas bypass valves to control indoor supply air temperatures to a pre-selected “room neutral” temperature. A supply air temperature sensor provides the control signal used to proportionally modulate the flow of hot refrigerant gas to maintain a preset supply temperature during dedicated dehumidification. The indoor air handler unit contains a variable speed indoor fan. At the Air-Conditioning, Heating, and Refrigeration Institute (AHRI) rating conditions [27], the cooling capacity is 7.60 kW and the coefficient of performance (COP) is 3.82 W/W. In the heating mode at AHRI rating conditions, the unit has a heating capacity of 7.80 kW. The unit has a seasonal energy efficiency ratio (SEER) of 4.63 W/W and a heating seasonal performance factor (HSPF Region IV) of 2.65 W/W. The heat pump was operated as a single zone system with a thermostat located in the living room on the first floor. During heating mode or defrost mode, the indoor unit controller may energize up to 10 kW of electric resistance heat. The thermostat set points in the cooling and heating modes were 23.8 °C and 21.1 °C, respectively, without setback. In the cooling mode, the thermostat was set such that the dehumidification mode of the heat pump unit was activated if the relative humidity (RH) reached 50 %. Studies of high performance homes with ventilation showed that they were generally able to condition air below 60 % RH [28]. An RH setpoint of 50 % was thus selected for the NZERTF to provide better thermal comfort. The house was thus maintained below 50 % RH in the cooling months. But in the heating months, the relative humidity in the house was allowed to float since the heat pump did not possess humidification capabilities. The indoor air handler airflow rate as a function of external static pressure drop was determined in-situ by calibration against an orifice plate flow meter device; more details may be found in [23]. Thermocouples and dewpoint temperature sensors were placed in the supply and return ducting near the air handler to calculate the thermodynamic state of the air. Along with the airflow measurement, this allowed calculation of sensible and latent capacity. Two power meters were used on the indoor unit; a low range meter measured instantaneous power of the indoor fan and controls, and a high range meter measured total power to the indoor air handler. This arrangement allowed measurement of indoor unit power demand for low power fan operations and high power electric resistance heating demand with a minimum overall uncertainty. Outdoor unit power demand was also measured by a separate power meter. The instrumentation, data acquisition system, and measurement uncertainty associated with the heat pump system, as well as all other electrical/mechanical subsystems within the NZERTF are described in Davis et al. [29].
Since testing commenced on July 1, 2013 the air-to-air heat pump system has performed without interruption. When operated in the cooling mode, the unit operated at an integrated COP of 3.19, whereas in the heating mode the average COP was 2.06.. The amount of time the unit operated in the dehumidification mode varied from 5 % in October to 23 % in July during which the

7
dehumidification efficiency varied from 1.10 L/kWh to 1.35 L/kWh. No dehumidification was needed between January and April. Electrical energy consumed for cooling, heating, and dedicated dehumidification for the entire year was 1536 kWh, 3783 kWh, and 922 kWh, respectively.
The resistance heat operated more frequently than anticipated in the heating season due to the control logic of the thermostat. The thermostat heating configuration allows the user to prescribe a 1st stage differential temperature, 2nd stage differential temperature, 2nd stage delay time, and 3rd stage heating differential temperature. The differential temperatures are relative to the current set point temperature and the delay time is the maximum amount of time a given stage is allowed to operate before energizing the next higher stage. This type of control logic appears to be effective in the cooling mode, but produced unnecessary usage of electric resistance heat in the heating mode (3rd stage). The 2nd stage delay time was set to the thermostat’s maximum of 40 min. At the end of these 40 min periods, temperatures in the house exhibited an upward trend toward the setpoint. It is most likely that the heat pump in 2nd stage heating would have been able to meet the setpoint if the delay time could have been increased above 40 min. Since it could not, the thermostat energized 3rd stage electric heat more often than necessary.
2.2. Ventilation System
Outdoor air is supplied to the NZERTF through a balanced HRV (Venmar EKO 1.5). The dedicated duct system associated with the HRV was designed for a nominal airflow rate of 256 m3/h. It supplies ventilation air to all bedrooms and the kitchen, and exhausts air from all three bathrooms. The outdoor and return ducts were insulated with either 5 cm of rigid glass fiber board or flexible glass fiber blanket. All ducts were located within the conditioned space. Heat (but not moisture) exchange between the two airstreams reduces the energy needed to condition the outdoor ventilation air. An HRV was selected by the architect in lieu of an energy recovery ventilator in order to avoid reintroducing the moisture from the bathrooms into the house [26].
According to ASHRAE Standard 62.2-2010 [30], the minimum required amount of outdoor for the NZERTF is 137 m3/h. ASHRAE Standard 62.2 states that this flow may be reduced if the infiltration were measured to be greater than 0.01 m3/s per 100 m2. The infiltration was both measured and modeled and found to be less than this value. The actual outdoor airflow rate provided by the HRV has been measured on several occasions using a hot wire anemometer traverse, with an average flow over the year of operation of 171 m3/h. The HRV was set to operate continuously on the lowest fan speed setting, resulting in an airflow of 137 m3/h, which exceeded the ASHRAE Standard 62.2 requirement by approximately 25 %. The HRV could have been operated on an intermittent schedule while still meeting ASHRAE 62.2, but that was not done during this year of operation. The sensible effectiveness of the heat exchanger is determined using dry-bulb temperature measurements and periodic measurements of the HRV

8
airflows [29]. The average measured power consumption of the HRV fan was 60 W and the average sensible effectiveness was 0.72.
2.3. Measurements
Measurements over the first year of NZERTF monitoring were recorded every minute. The measurements applicable to the calculations in this paper include dry-bulb temperature, dewpoint, relative humidity, airflow, and electricity use. The instruments, model numbers, ranges, and total uncertainty of these measurements are listed in Table 1. As noted in the caption of Figure 5, measurements are missing for August 2 through August 6 because of issues with the data collection system. Calculations using these measurements and their associated combined standard uncertainty [31] are presented in Sec. 3.
3. Determining impacts of ventilation on heat pump operation
Over the course of one year (July 2013 through June 2014), the house produced 484 kWh more electrical energy than it consumed through the use of a 10.2 kW PV system. Figure 3 shows the energy consumption by end use, and it is clear that heating, ventilation, and air-conditioning (HVAC) required the largest portion of energy. For the year, HVAC required a total of 6684 kWh of electricity (50 % of the annual energy consumed), of which 513 kWh (4 % of the annual energy consumed) was required to continuously operate the HRV fan.
However, the electricity necessary to operate the HRV fan is not the only energy use associated with its operation. The outside air that it supplies, though pre-heated in the winter and pre-cooled in the summer via the heat exchange core, must still be conditioned by the heat pump. Moisture introduced from the outdoor ventilation air must also be removed by the heat pump since there is no moisture removal in the HRV. Thus, an analysis was performed to quantify the energy usage associated with the heat pump operation due to the thermal loads introduced by the HRV. The use of the HRV is also compared to the hypothetical situation of meeting the ASHRAE 62.2-2010 ventilation requirement by mechanically introducing the same quantity of outdoor air without heat recovery.
3.1. HRV calculation procedure
To determine the energy impacts of operating the HRV at the NZERTF, first the HRV thermal load was calculated using the measurements made every minute for a year. Calculations were done in Matlab and LabView every minute and averaged over each hour. Monthly totals are also presented. Taking the exterior wall as the boundary volume, the sensible (Qsens,HRV), total (Qtot,HRV), and latent (Qlat,HRV) energy supplied by the HRV (or removed in the case of the sensible loads)were calculated using basic laws of thermodynamics.

9
If Qsens.HRV > 0, cooling of the air by the heat pump was required. In contrast, if Qsens.HRV < 0, heating of the air by the heat pump was required. If Qlat.HRV < 0, moisture was removed from the house.
The dry-bulb temperatures Tdb.oa and Tdb.exh were measured inside the HRV ducts. The enthalpy of the outdoor air, hoa, was measured on an exterior wall on the same side of the house as the outdoor unit of the heat pump. The dry-bulb temperature Tdb.exh was measured inside the HRV exhaust duct. In order to calculate hexh, the dewpoint temperature (or relative humidity) would be needed. However, these measurements were not made in the HRV exhaust duct or in the bathrooms from which air is returned from the house to the HRV. Therefore the conditions in the living room were used in estimating Tdew.exh with the following conditions:
Tdew.exh ≈ � 𝑇𝑇db.exh, 𝑇𝑇db.exh < 𝑇𝑇dew.LR𝑇𝑇dew.LR, 𝑇𝑇db.exh > 𝑇𝑇dew.LR
(1)
This means that if Tdb.exh < Tdew.LR, the moisture content in the exhaust air was lower than that in the living room and Tdew.exh ≈ Tdb.exh. On the other hand, if Tdb.exh > Tdew.LR, the moisture content in the exhaust air was higher than that in the living room and Tdew.exh ≈ Tdew.LR. Tdew,LR was calculated using the dry-bulb temperature and relative humidity measured in the living room.
For the hypothetical case that ventilation was supplied without heat recovery, the loads were calculated using dry-bulb and dewpoint measurements at the outdoor unit of the heat pump, and hret was calculated using dry-bulb and dewpoint measurements in the return duct of the heat pump. Ideally, Qlat.HRV should be equal to Qlat.vent since there is no moisture transfer in the HRV. However, they are not equal because Q lat.HRV is calculated using the conditions in either the living room or in the exhaust duct, and Qlat.vent is calculated using the conditions in return duct of the heat pump.
Airflow through the HRV was measured monthly using a hot wire traverse. For the months July 2013 to mid-September 2013, the airflow rate was 147 m3/h, and for the months mid-September 2013 to June 2014, the airflow rate was 171 m3/h. These volumetric flow rates are converted to mass flow rate, �̇�𝑚, by multiplying by the air density. The reason the airflow rate was lower in the first few months of operation was due to frequent clogging of the HRV filters. Humidifiers in the kitchen simulated latent loads, and the water supplied to them naturally contained dissolved solids that were being emitted as particulates into the air along with the water vapor. This particulate laden air was then returned to the HRV, thus clogging the filters. To resolve this clogging problem, water deionization filters were installed in the water feed lines of the humidifiers. Since the water filters were installed, there have been no filter clogging issues in the HRV. Nevertheless, HRV filters were changed monthly as part of regular maintenance. Because the airflow rate was not continuously measured, fluctuations in airflow rate and thus thermal loads were not captured.

10
3.2. Heat pump calculations
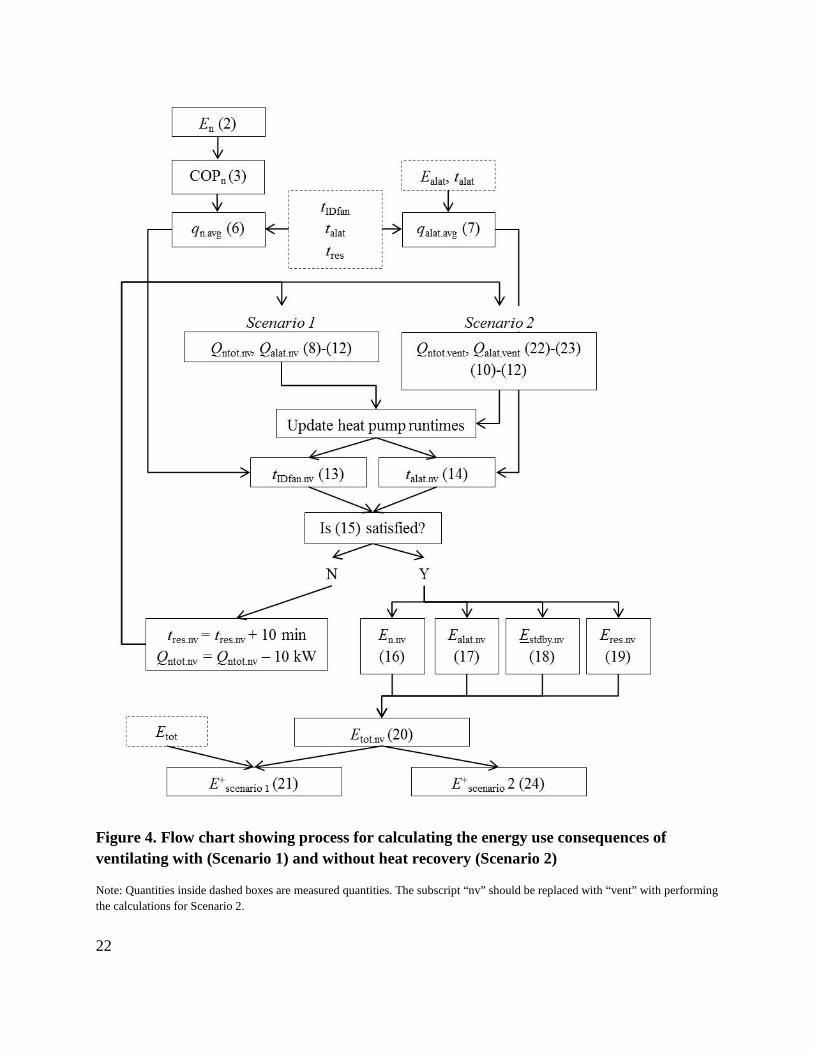
Heat pump energy use comparisons required examination of two different ventilation scenarios: (1) heat pump with HRV (measured), and (2) heat pump with ventilation but without heat recovery (calculated, subscript “vent” below and in Figure 4). Their energy impact of each case is the energy compared with a baseline case of operating the heat pump without ventilation (calculated, subscript “nv” below and in Figure 4). Note that such operation would not be in compliance with ASHRAE Standard 62.2, presumably compromising IAQ conditions in the house. Scenario 1 was the actual operational case studied during the first year of operation; therefore, measured data were available for this case. Scenario 2 and the no ventilation scenario were calculated by making assumptions about the measurements.
Note below that “normal” operation of the heat pump is operation without active dehumidification (subscript “alat”), auxiliary resistive heat (subscript “res”), and standby (subscript “stdby”). According to the measured data, the heat pump indoor and outdoor units consume a maximum of approximately 1200 Wh of energy in standby mode per day, when the system is on but the fan and compressor are not because the setpoint has been met.
It was assumed that the energy use consequences of the HRV operated at the NZERTF for one year would be the measured heat pump energy use (Scenario 1) minus the heat pump energy use if no ventilation were provided. First, the “normal” (subscript “n”) energy usage, and sensible and latent thermal loads for the heat pump without active dehumidification or resistive auxiliary heat usage are calculated. This calculation procedure is represented in a flow diagram (Figure 4)
En = Etot – Ealat – Eres – Estdby (2)
where Ealat, Eres, and Estdby are measured quantities. This then gives the coefficient of performance, COPn, of the heat pump without active dehumidification, resistance heat, and standby energy:
COPn = (Qnsens + Qnlat) / En (3)
where
Qnsens = Qsens.all – Qres (4)
Qnlat = Qlat.all – Qalat (5)
where Qsens.all, Qres, Qlat.all, and Qalat are measured quantities. This is used to calculate the average power consumption of the heat pump in normal mode:
qn.avg = (Qnsens + Qnlat) / (tIDfan –talat – tres) (6)

11
where the times during which the indoor fan, dehumidification, and resistance heating were ON were recorded. The average power consumption of active dehumidification was calculated as:
qalat.avg = Qalat / talat (7)
To determine the heat pump energy use without ventilation, the measured HRV loads were removed from the measured total heat pump loads:
Qsens.nv = Qsens.all – Qsens.HRV (8)
Qlat.nv = Qlat.all – Qlat.HRV which equals 0 if Q lat.HRV > Qlat.all (9)
The assumptions made earlier when calculating the HRV latent load may propagate errors that result in Qlat.HRV > Qlat.all. In these cases, the Q lat.nv will be equal to zero. The total latent load on the heat pump (subscript “all”) without ventilation is calculated using the sensible heat ratio (SHR), which is calculated from the measured data. This assumes that the SHR remains the same, with and without ventilation.
Qlat.nv.all [Wh] = (1 – SHR)/SHR X Qsens.nv (10)
Any latent load not met by the normal operation of the heat pump would be met by active dehumidification:
Qalat.nv = Qlat.nv.all – Qlat.nv which equals 0 if Qnlat.nv > Qlat.nv.all (11)
The total thermal load for the no ventilation case is then:
Qntot.nv [Wh] = Qsens.nv + Qlat.nv (12)
The calculated loads Qntot.nv and Qalat.nv are then used to calculate new runtimes for the heat pump in normal and active dehumidification modes when there is no ventilation. The runtime for normal heat pump operation without ventilation is:
tIDfan.nv = Qntot.nv / qn.avg (13)
The runtime for active dehumidification is:
talat.nv = Qalat.nv / qalat.avg (14)
The standby power for heat pump operation without ventilation is then:
tstdby.nv = 24 – tIDfan.nv – talat.nv (15)
If tsdby.nv is negative, it means that auxiliary resistance heat was needed for time tres.nv. The tres.nv is increased in increments of 10 min, with a fixed capacity of 10 kW. This capacity is then

12
subtracted from Qntot.nv and runtime tIDfan.nv re-calculated. When Equation (15) is satisfied, the total electrical energy required for each operating mode for Scenario 1 can be calculated as:
En.nv = Qntot.nv / COPn (16)
Ealat.nv = Qalat.nv / COPalat (17)
Estdby.nv = tstdby.nv (qIDfan.stdby.avg + qODfan.stdby.avg) (18)
Eres.nv = tres.nv (qres) (19)
Etot,nv = En.nv + Ealat.nv + Estdby.nv + Eres.nv (20)
where qIDfan.stdby.avg and qODfan.stdby.avg are the average power consumption associated with the standby power of the indoor and outdoor fan units, respectively. Thus, the additional energy use of operating an HRV (Scenario 1) at the NZERTF would be:
E+scenario 1 = Etot – Etot.nv (21)
The energy use consequences of ventilation without heat recovery at the NZERTF for one year (Scenario 2) was calculated in a similar manner to Scenario 1 except for the following differences:
Qsens.vent.all = Qsens.nv + Qsens.vent (22)
Qlat.vent = Qlat.nv + Qlat.vent (23)
These equations mean that the sensible/normal latent load on the house with ventilation without heat recovery is the sum of the normal sensible/latent load without ventilation plus the sensible/latent load of ventilation. For the remainder of the calculation, Equations (13) to (20) are followed with the subscript “vent” instead of “nv” (Figure 4). The equivalent of E+ for Scenario 2 is:
E+scenario 2 [Wh] = Etot.vent – Etot.nv (24)
3.3. Combined uncertainty
The expanded uncertainty of a measurand Y is [31]:
Y = y ± U (25)
where y are the variables/measurements used to determine Y and
U = k×uc(y) (26)

13
where k is a coverage factor (= 2) and uc(y) is the combined uncertainty of a measurement. U = 2uc defines an interval having a confidence of approximately 95 %. Davis et al. [29] shows how the combined uncertainty of the measurands defined in this paper were calculated.
The largest sources of uncertainty were for the HRV airflow and how the conditions in the HRV exhaust were calculated. The airflow in the HRV was assumed to be constant in this study because it was not continuously measured. However, even if it had been measured, its uncertainty would be on the order of 20 %. The large uncertainty in the latent loads was due to (1) the location where dewpoint temperature was estimated (e.g., the living room) because dewpoint/RH measurements were lacking in the HRV duct (5 % uncertainty), and (2) the actual measurement of dewpoint/RH even when measured with a total uncertainty of less than 5 % produces uncertainties in latent capacity greater than 20 %.
4. Results and Discussion
Figure 5 shows the thermal energy impact of the HRV and ventilation without heat recovery. Sensible loads are the sum for each month with positive sensible indicating cooling and negative indicating heating the house. A negative latent load occurred when the moisture content of the ventilation air was less than that inside the house. During the months dominated by cooling (July 2013, August 2013, September 2013 and June 2014, shaded in Figure 5), a positive sensible load means the outdoor air being supplied (either with or without heat recovery) cooled the house. Thus, in August 2013 and June 2014, the use of the HRV was more advantageous than ventilation without heat recovery because the HRV sensible load was positive. The sensible load associated with ventilation without heat recovery was negative (i.e., heating the house) in August 2013 and June 2014. In July, the use of the HRV was also more advantageous than ventilation without heat recovery though both ventilation scenarios resulted in the outdoor air adding heat to the house. In September 2013, the cooling provided by the HRV was 54 kWh, but the cooling provided by ventilating without heat recovery could have been 123 kWh (an increase of 56 %). This situation would result from the times of day when the outdoor temperature was actually less than the indoor temperature. Thus, the HRV at the NZERTF could have benefited from an economizer mode, i.e., no heat exchange between the exhaust and outdoor air streams to allow cooling with outdoor air.
The differences in latent load in the cooling months ranged from 0 % (July) to 36 % (September). Theoretically, the latent loads should be equal between the two ventilation cases since there was no moisture transfer in the HRV. However, they are not equal because the latent loads are calculated using dewpoint temperatures measured at two different locations. These differences in sensible and latent loads in the cooling months resulted in an average of 4 % increase in heat pump energy use when using the HRV compared with ventilation without heat recovery.

14
During the months dominated by heating (October 2013 to May 2014), a positive sensible load meant the outdoor air being supplied cooled the house. Thus, smaller sensible loads are better from an energy perspective. Between October and May, there was an average 60 % reduction in sensible loads when using the HRV compared with ventilation without heat recovery (Figure 5). Since the latent load would not impact the heating load of the heat pump, which did not possess humidification capabilities, the latent load was not plotted in Figure 5. The reduction in sensible load when using the HRV resulted in an annual 12 % reduction in heat pump energy use compared with ventilating without heat recovery during the heating months (Figure 6).
The annual heat pump energy required to condition outdoor air supplied by an HRV was 7 % less than that required if outdoor air were supplied without heat recovery. This annual energy impact is similar to the studies mentioned in Sec. 1. There were energy savings in colder climates when using an HRV compared with supply ventilation. In warmer climates, however, the savings were reduced and under some conditions penalties were incurred.
The 7 % annual heat pump savings do not account for the fan power required to operate the HRV continuously for one year, which was 513 kWh. Using data provided by the Home Ventilating Institute (HVI), the power required by a supply fan delivering 171 m3 h-1 was on average 25 W [32]. Figure 7 thus shows that the HRV required more fan energy over a year (an increase of 294 kWh) than the scenario of using the selected supply fan. The annual heat pump energy saved by using an HRV was 280 kWh less than using the selected supply fan (a 1 % difference). Thus, the energy “cost” of operating the HRV essentially paid for itself with the heat pump energy “savings” given the uncertainties reported in Sec. 3.3. The values in Figure 7 were verified using calibrated EnergyPlus and TRNSYS energy models simulated with and without ventilation, with and without heat recovery. These findings are also consistent with the available literature. For instance, Lstiburek et al. [16] simulated high performance homes in six U. S. cities and found that the total heat pump and ventilation fan energy due to ventilation with and without heat recovery differed by 0 % to 7 %. Rudd et al. [18]simulated high performance homes in six U. S. cities and found that the total heat pump and ventilation fan energy due to ventilation with and without heat recovery differed by 2 % to 11 %. The average savings using a recovery ventilator in these two studies was 5 %. If the HRV fan in the NZERTF had a higher efficiency, such as the most efficient HRV listed by the HVI of 7.3 m3 h-1 W-1 [32], the use of an HRV would have saved 5 % annual energy compared with ventilating without heat recovery.
It should be noted that these findings are climate dependent. In this climate, using the HRV results in less energy consumption during the heating months and more energy during the cooling months compared to ventilation without heat recovery. The results of these findings are also dependent on internal loads, leakage through the building envelope, efficiency of the equipment, thermostat settings (temperature with no setback), limit of 50 % RH, and ventilation rate, etc. As discussed in Sec. 2.1, the thermostat had a control logic that unnecessarily energized the electric resistance heat of the heat pump in the heating months. If the heat pump would have

15
been allowed to run longer in 1st or 2nd stage heating, the energy use of the heat pump in heating mode would have been reduced by 20 %. This would affect how much additional heat pump energy is attributed to the outdoor air being supplied by the HRV. It should also be noted that this analysis assumes that 100 % of the thermal loads introduced by either the HRV or ventilation without heat recovery needs to be conditioned by the heat pump even though the indoor relative humidity was also limited to 50 %. This study also did not consider the sensible and latent loads introduced by infiltration alone. Another factor that would affect the results of this study is the use of an ERV instead of an HRV. The ERV has the potential to reduce the latent load introduced into the house, especially in the cooling season. The reduction in latent load may reduce the need for dehumidification by the heat pump, which is when the COP of the heat pump is lower than in normal operation. If any of these conditions were different, the results of this study would change.
The annual heat pump energy required to condition outdoor air supplied by an HRV was 13 % of the total heating and cooling requirements. The energy required to operate the HRV fan was 4 % of the total energy consumed by the house. It could be concluded that the cost of ventilating the NZERTF was low considering the two to tenfold increase in indoor contaminants measured in the house when the HRV was off , which included formaldehyde, d-limonene and hexanal [33].
5. Conclusion
A net-zero energy residential test facility has been constructed on the NIST campus in Gaithersburg, MD. The facility has demonstrated that a residence similar in size, aesthetics, and features to those in the surrounding communities can achieve net-zero energy operation. During the first year of operation the residence generated more electricity using the solar photovoltaic system than it consumed while meeting the electrical, water usage, and comfort needs of a typical four member family. The greatest end use of electricity within the residence was space conditioning. Ventilating the house as operated at the NZERTF using an HRV resulted in 7 % savings in heat pump energy use on average over the year compared with ventilating without heat recovery. The monthly impact on the heat pump energy use ranged from 5 % increase in cooling months to 36 % savings in heating months. However, during this year, the fan power consumption of an HRV paid for itself in the annual savings in heat pump energy compared with ventilation without heat recovery. These findings are consistent with the literature, which were conducted using simulations.
6. Acknowledgements
The authors would like to thank Elizabeth Balke, a graduate student at the University of Wisconsin, and Dr. Josh Kneifel, an economist in the Applied Economics Office at the National Institute of Standards and Technology, for their contributions to this paper with regard to performing energy simulations.

16
7. Disclaimer
Certain commercial entities, equipment, or materials are identified in order to describe an experimental procedure or concept adequately. Such identification is not intended to imply recommendation or endorsement by the National Institute of Standards and Technology (NIST), nor is it intended to imply that the entities, materials, or equipment are necessarily the best available for the purpose.
8. References
1. DOE. Building Energy Data Book. 2011 [cited 2014; Available from: http://buildingsdatabook.eren.doe.gov/.
2. DOE (2015). A Common Definition for Zero Energy Buildings. Washington, D. C.: U. S. Department of Energy.
3. EISA. Energy Independence and Security Act of 2007. 2007: Washington, D. C. 4. Obama, Barack. Executive Order 13514—Federal Leadership in Environmental, Energy,
and Economic Performance. 2009: Washington, D. C. 5. AIA. Architecture 2030: The 2030 Challenge. 2006; Available
from: http://architecture2030.org/2030_challenge/the_2030_challenge. 6. ASHRAE (2008). ASHRAE Vision 2020: Providing tools by 2020 that enable the
building community to produce market-viable NZEBs by 2030. Atlanta: American Society of Heating, Refrigerating, and Air-Conditioning Engineers.
7. EPBD. Energy Performance of Buildings Directive. 2010: Brussels, Belgium. 8. COM (2014). Zero Net Emissions by 2020. Melbourne, Australia: City of Melbourne. 9. Parker, Danny S. Very low energy homes in the United States: Perspectives on
performance from measured data. Energy and Buildings, 2009. 41(5): p. 512-520. 10. Musall, E., T. Weiss, K. Voss, A. Lenoir, M. Donn, S. Cory, and F. Garde. Net Zero
Energy Solar Buildings: An Overview and Analysis on Worldwide Building Projects. in Eurosun 2010. Austria: International Energy Agency Solar Heating & Cooling Task40/ECBCS Annex52.
11. Rosta, S., R. Hurt, R. Boehm, and M. J. Hale. Performance of a Zero-Energy House. Journal of Solar Energy Engineering, 2008. 130(2): p. 021006-021006.
12. Boleyn, D. R. Reaching Toward “Net Zero”: Results from A PVT Powered Residence in the Pacific Northwest, in Solar Conference. 2012, American Solar Energy Society: Denver, CO.
13. Sherwin, J., C. Colon, D. Parker, and E. Martin. Performance of Four Near Zero Energy Homes: Lessons Learned. in Buildings XI: Thermal Performance of Exterior Envelopes of Whole Buildings. 2010. Oak Ridge, TN: ASHRAE.
14. Norton, P., C. Christensen, E. Hancock, G. Barker, and P. Reeves (2008). The NREL/Habitat for Humanity Zero Energy Home: A Cold Climate Case Study for Affordable Zero Energy HomesNational Renewable Energy Laboratory. NREL/TP-550-43188
15. ASHRAE. Standard 62.2-2013: Ventilation and Acceptable Indoor Air Quality in Low-Rise Residential Buildings. 2013, American Society of Heating, Refrigerating and Air-Conditioning Engineers, Inc.: Atlanta.

17
16. Lstiburek, Joseph W., Betsey Petit, Armin Rudd, M. H. Sherman, and I. S. Walker (2007). Whole House Ventilation System Options - Part 1 Simulation Study. Westford, MA: Building Science Corporation. ARTI Report No. 30090-01.
17. Sherman, Max H. and Iain S. Walker (2007). Energy Impact of Residential Ventilation Norms in the United States. Berkeley, CA: Lawrence Berkeley National Laboratory. LBNL-62341.
18. Rudd, Armin, Hugh I. Henderson, Daniel Bergey, and Don B. Shirey (2013). ASHRAE 1449-RP: Energy Efficiency and Cost Assessment of Humidity Control Options for Residential Buildings. Atlanta, GA: Building Science Corporation, CDH Energy Corporation, University of Central Florida/Florida Energy Center. ASHRAE 1449-RP Final Report.
19. RESNET. Home Energy Rating System (HERS) Index. 2014; Available from: http://www.resnet.us/hers-index.
20. Walker, I. S. and M. H. Sherman. Energy Impact of Residential Ventilation Standards in California. ASHRAE Transactions, 2008. 114(2): p. 482-493.
21. Turner, William J. N. and I. S. Walker. Advanced Controls and Sustainable Systems for Residential Ventilation. 2012. p. 101.
22. Dodoo, A., L. Gustavsson, and R. Sathre. Primary energy implications of ventilation heat recovery in residential buildings. Energy and Buildings, 2011. 43(7): p. 1566-1572.
23. Fanney, A. Hunter, Vance Payne, Tania Ullah, Lisa Ng, Matthew Boyd, Farhad Omar, Mark Davis, Harrison Skye, Brian Dougherty, Brian Polidoro, William Healy, Joshua Kneifel, and Betsy Pettit. Net-zero and beyond! Design and performance of NIST's net-zero energy residential test facility. Energy and Buildings, 2015. 101(0): p. 95-109.
24. Omar, F. and S. T. Bushby (2013). Simulating Occupancy in the NIST Net-Zero Energy Residential Test Facility. Gaithersburg, MD: National Institute of Standards and Technology. TN-1817.
25. Kneifel, J. D. (2012). Annual Whole Building Energy Simulation of the NIST Net-Zero Energy Residentail Test Facility. Gaithersburg, MD: National Institute of Standards and Technology. TN-1767.
26. Pettit, Betsy, Cathy Gates, A. Hunter Fanney, and William Healy (2014). Design Challenges of the NIST Net Zero Energy Residential Test Facility. Gaithersburg, MD: National Institute of Standards and Technology. TN-1847.
27. AHRI. Standard 210/240: Standard for performance rating of unitary air-conditioning and air-source heat pump equipment. 2008, Air-Conditioning, Heating, and Refrigeration Institute: Arlington, VA.
28. Rudd, Armin and HI Henderson. Monitored Indoor Moisture and Temperature Conditions in Humid Climate US Residences. ASHRAE Transactions, 2007. 113(1): p. 435-49.
29. Davis, M. W., W. M. Healy, M. Boyd, W. V. Payne, H. Skye, L. C. Ng, and T. Ullah (2014). Monitoring Techniques for the Net-Zero Energy Residential Test Facility. Gaithersburg, MD: National Institute of Standards and Technology. TN-1854.
30. ASHRAE. Standard 62.2-2010: Ventilation and Acceptable Indoor Air Quality in Low-Rise Residential Buildings. 2010, American Society of Heating, Refrigerating and Air-Conditioning Engineers, Inc.: Atlanta.

18
31. Taylor, Barry N. and Chris E. Kuyatt (1994). Guidelines for Evaluating and Expressing the Uncertainty of NIST Measurement Results. Gaithersburg, MD: National Institute of Standards and Technology. Technical Note 1297.
32. HVI. HVI-Certified Products Directory. 2015, Home Ventilating Institute: Phoenix, AZ. 33. Poppendieck, Dustin G., Lisa C. Ng, Andrew K. Persily, and A. T. Hodgson. Long Term
Air Quality Monitoring in a Net-Zero Energy Residence Designed with Low Emitting Interior Products. Building and Environment, 2015. 94(1): p. 33-42.

19
List of Figures
Figure 1. Net-Zero Energy Residential Test Facility

20
Figure 2. Blower door test results at various stages of construction Note: * indicates the tests performed by NIST.

21
Figure 3. Energy consumption by end use
22
Figure 4. Flow chart showing process for calculating the energy use consequences of ventilating with (Scenario 1) and without heat recovery (Scenario 2)
Note: Quantities inside dashed boxes are measured quantities. The subscript “nv” should be replaced with “vent” with performing the calculations for Scenario 2.

23
Figure 5. Additional thermal energy introduced to house compared with no ventilation case 1Missing data for August 2, 2013 through August 6, 2013. Shaded portions of graph are for cooling months. 2Sensible loads are the sum for the month with positive sensible indicating cooling and negative indicating heating the house; some days the HRV or mechanical ventilation reduced the heating or cooling loads, and some days the HRV or mechanical ventilation increased them 3Ideally, Q lat.HRV should be equal to Q lat.vent since there is no moisture transfer in the HRV. However, they are not equal because Q lat.HRV is calculated using the conditions in either the living room or in the exhaust duct, and Q lat.vent is calculated using the conditions in return duct of the heat pump. A negative latent load occurred when moisture was removed from the house. Latent loads are not shown for the heating months since they would not impact the heating load of the heat pump, which did not possess humidification capabilities. 4As discussed in Sec. 3.3, the combined uncertainty of the thermal loads can range from 25 % to 300 % depending on the conditions of air (warm/humid, cool/dry). Sec. 3.3 discussed the assumptions that led to this uncertainty.

24
Figure 6. Monthly energy use impact of ventilation (with and without heat recovery) 1Positive change in heat pump energy use means that for the particular method of supplying ventilation (with or without heat recovery), the heat pump energy use increased compared with the no ventilation case. Negative values mean that the heat pump energy use was reduced compared with the no ventilation case. 2Percentages are the difference in heat pump energy between using an HRV and ventilating without heat recovery. Positive percentages indicate that the HRV required more heat pump energy than ventilation without heat recovery. 3Shaded portions of graph are for cooling months.

25
Figure 7. Heat pump energy use impact of ventilation and ventilation fan energy

26
List of Tables Table 1. Equipment used to conduct measurements for determining energy impact of HRV
Instrument Model Range Total Uncertainty at
the 95 % Confidence Level
Dry bulb temperature sensors
Type-T thermocouple 13 °C to 30 °C ±0.2 °C
Humidity sensors
Michell Instruments
WM32-3-XX-HX
0 %RH to 100 %RH ±3 %RH
Transducer voltage measurement
National Instruments, cDAQ-9205
0 to 10 VDC ±5 mVDC
T-type thermocouples
National Instruments, cDAQ-9214
-10 °C to 55 °C ±0.6 °C
Barometric pressure NA 20 to 30 in Hg ±1 % of reading
Indoor total power meter
Ohio Semitronics W-059E
0 to 300 VAC, 100 Amps, 20 000 W
±100 W
Outdoor unit power meter
Ohio Semitronics W-110X5
0 to 300 VAC, 20 Amps,4000 W ±20 W
Supply air dry-bulb temperature sensor
General Eastern Humi-DP-XR-D
-28.8 °C to 49 °C ±0.5 °C
Supply air dewpoint temperature sensor
General Eastern Humi-DP-XR-D
-28.8 °C to 49 °C ±1.0 °C
Return air dry-bulb temperature sensor
Vaisala HMT330-3
-40 °C to 60 °C ±0.2 °C
Return air dewpoint temperature sensor
Vaisala HMT330-3
-20 °C to 100 °C ±1.5 % of reading
Outdoor air dry-bulb temperature sensor
Vaisala HMT330-3
-40 °C to 60 °C ±0.2 °C
Outdoor air dewpoint temperature sensor
Vaisala HMT330-3
-20 °C to 100 °C ±1.5 % of reading