Embed Size (px)
Citation preview

Part 2The following member country profile is an excerpt from Chapter 4 of the publication Energy Supply Security 2014 and is not intended as a stand-alone publication.
ENERGY SUPPLY SECURITY 2014
CHAPTER 4: Emergency response systems of individual IEA countries
The ability of the International Energy Agency (IEA) to co-ordinate a swift and effective international response to an oil supply disruption stems from the strategic efforts of member countries to maintain a state of preparedness at the national level. Energy security is more than just oil, as the role of natural gas continues to increase in the energy balances of IEA countries. The most recently completed cycle of Emergency Response Reviews (ERRs) reflected this change by assessing, for the first time, the member countries’ exposure to gas disruptions and their ability to respond to such crises. This chapter provides general profiles of the oil and natural gas infrastructure and emergency response mechanisms for 29 IEA member countries.
Each country profile is set out in the following sequence:
Key dataKey oil data, 1990-2018Key natural gas data, 1990-2018Total primary energy source (TPES) trend, 1973-2012
Infrastructure map
Country overview
OILMarket features and key issuesDomestic oil productionOil demandImports/exports and import dependencyOil company operations
Oil supply infrastructureRefiningPorts and pipelinesStorage capacity
Decision-making structure
StocksStockholding structureCrude or productsLocation and availabilityMonitoring and non-complianceStock drawdown and timeframeFinancing and fees
Other measuresDemand restraintFuel switchingOther
GASMarket features and key issuesGas production and reservesGas demandGas import dependencyGas company operations
Gas supply infrastructurePorts and pipelinesStorage
Emergency policyEmergency response measures

CHAPTER 4 Emergency response systems of individual IEA countries The netherlands 315© O
ECD/
IEA
2014
The Netherlands
Key data
Table 4.18.1 Key oil data
1990 2000 2005 2010 2011 2012 2018*
Production (kb/d) 78.7 48.5 46.8 36.0 37.9 51.7 43.0
Demand (kb/d) 734.5 854.5 1 021.4 1 019.8 1 016.4 1 020.8 931.6
Motor gasoline 79.8 93.1 94.8 96.6 98.7 95.6 -
Gas/diesel oil 150.5 177.8 192.1 187.2 186.0 176.6 -
Residual fuel oil 182.1 208.8 275.5 227.7 244.1 219.1 -
Others 322.1 374.8 459.0 508.2 487.6 529.6 -
Net imports (kb/d) 655.8 806.0 974.6 983.8 978.5 969.1 888.6
Import dependency (%) 89.3 94.3 95.4 96.5 96.3 94.9 95
Refining capacity (kb/d) 1 381.0 1 187.8 1 227.5 1 236.4 1 236.4 1 236.4 -
Oil in TPES** (%) 36 36 39 38 38 39 -
* Forecast. ** TPES data for 2012 are estimates.
Table 4.18.2 Key natural gas data
1990 2000 2005 2010 2011 2012* 2018**
Production (mcm/y) 76 249 72 821 78 510 88 510 80 570 80 143 67 487
Demand (mcm/y) 43 022 48 851 49 304 54 849 47 881 45 988 44 563
Transformation 9 925 14 410 16 104 18 660 16 648 0 -
Industry 12 274 12 557 11 453 10 534 10 014 0 -
Residential 10 978 11 119 10 496 12 057 9 809 0 -
Others 9 845 10 765 11 251 13 598 11 410 0 -
Net imports (mcm/y) - 33 227 - 23 970 - 29 206 - 33 661 - 32 689 - 34 155 - 22 925
Import dependency (%) - 77.2 - 49.1 - 59.2 - 61.4 - 68.3 - 74.3 - 51
Natural gas in TPES (%) 47 49 46 47 44 42 -
* 2012 data are estimates. ** Forecast.
Note: This section on the emergency response systems of individual member countries was written by the IEA. All countries provided valuable information and comments. All opinions, errors and omissions are solely the responsibility of the IEA.

EnERgy SuPPly SECuRITy 2014 316 © O
ECD/
IEA
2014
Figure 4.18.1 Total primary energy source (TPES) trend, 1973-2012
0
10 000
20 000
30 000
40 000
50 000
60 000
70 000
80 000
90 000
1973 1975 1977 1979 1981 1983 1985 1987 1989 1991 1993 1995 1997 1999 2001 2003 2005 2007 2009 2011
ktoe
Hydro/renewables/other
Nuclear
Natural gas
Oil
Coal

CHAPTER 4 Emergency response systems of individual IEA countries The netherlands 317© O
ECD/
IEA
2014
Map 4.18.1 Oil infrastructure of the Netherlands
Luxembourg
Belgium
France
Germany
T H E N E T H E R L A N D S
Brussels
Ghent
Zeebrugge
Antwerp
Maastricht
Venlo
The Hague
Schiphol
Eemshaven
Rotterdam
RMR
RRP 400 kb/d
Amsterdam
Vlissingen
CEPS
Km0 40 80
RA
PL
600
kb/d
Crude oil pipeline
Oil products pipeline
Refinery
Oil storage site
Oil rig
Oil field
Salt cavern storage site
Gelsenkirchen
Wilhelmshaven
Epe
Tanker terminal
Schoonebeek
Geertruidenberg
This map is without prejudice to the status of or sovereignty over any territory, to the delimitation of international frontiers and boundaries and to the name of any territory, city or area.
EnERgy SuPPly SECuRITy 2014 318 © O
ECD/
IEA
2014
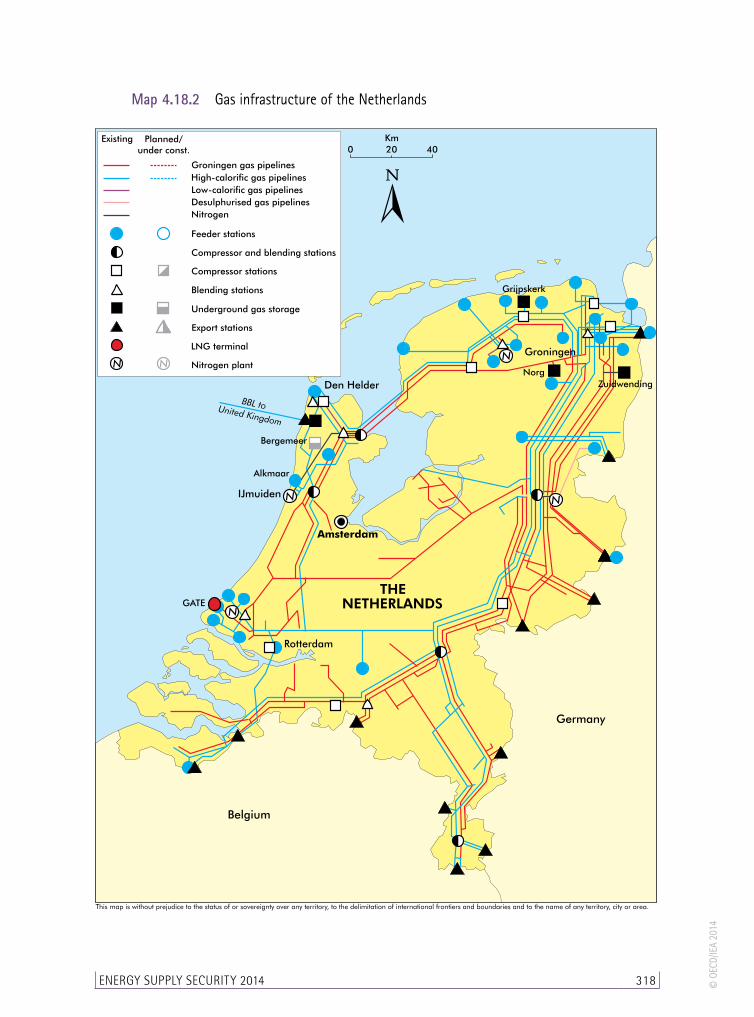
Map 4.18.2 Gas infrastructure of the Netherlands
Existing Planned/under const.
Compressor and blending stations
Nitrogen plant
Underground gas storage
Blending stations
Compressor stations
Feeder stations
Nitrogen
Groningen gas pipelines
High-calorific gas pipelines
Low-calorific gas pipelines
Desulphurised gas pipelines
Export stations
LNG terminal
Alkmaar
Bergemeer
Norg
Grijpskerk
GATE
Zuidwending
This map is without prejudice to the status of or sovereignty over any territory, to the delimitation of international frontiers and boundaries and to the name of any territory, city or area.

CHAPTER 4 Emergency response systems of individual IEA countries The netherlands 319© O
ECD/
IEA
2014
Country overviewOil and natural gas represented respectively 39% and 42% of the Netherlands’s total primary energy supply (TPES) in 2012. While their share in the energy mix is expected to decline slightly over the next decade, demand for both fuels will rise as total energy demand in the country grows. The Netherlands plans to meet its future energy needs with an “all-in” approach, seeing a role for all fuels, including nuclear, and pursuing a goal of increasing renewable energy from the 4% it represented in 2010 to 14% by 2020. In terms of fossil fuels, new coal-fired power plants will come online in the coming years; natural gas will remain the country’s key fuel, serving as the backup source for intermittent renewable power generation.
Oil demand in the Netherlands was roughly 1 million barrels per day (mb/d) in 2012, with an import dependency of roughly 95%. Domestic oil production is in decline in the Netherlands, and despite the extension of output made possible by new upstream techniques, the country will gradually move towards becoming fully import dependent in meeting its oil needs. At the same time, the Netherlands plays a key role as a major oil refining centre in Europe, with an extensive supply network of ports, storage facilities and pipeline connections playing a critical role for oil supplies to the continent. Likewise for natural gas, the country plays a regional role for supply security. However unlike for oil, the Netherlands produces more gas than it consumes domestically, making the country a net exporter. Substantial gas reserves remain and are expected to allow the Netherlands to continue as a net exporter of gas over the coming decade.
The emergency oil response system of the Netherlands is based on a mixed system of mandatory emergency reserve stocks held by both the industry and the Dutch stockholding agency, Centraal Orgaan Voorraadvorming Aardolieproducten (COVA). In times of an International Energy Agency (IEA) collective action, the most likely response by the Netherlands would be a drawdown of the public stocks held by COVA. The agency used to cover some 90% of the Netherland’s total domestic stockholding obligation in the years up to 2012, however this share has decline to 75%, in conjunction with the transposition of the EU directive on emergency oil stockholding by the end of 2012.
The Dutch gas production and infrastructure capacities provide a significant level of security for domestic natural gas supply. However, as domestic production declines (the Netherlands is expected to become a net importer of gas sometime in the period between 2020 and 2025), well-timed investments in storage capacities and LNG installations will be necessary to maintain supply flexibility. The transmission system operator (TSO), Gasunie Transport Services (GTS), along with the distribution system operators (DSOs), must report every two years detailing capacity needs and planned investments in network capacity to ensure security of supply. GTS is also responsible for carrying out emergency measures in a gas crisis, and would be responsible for assuring gas supply to priority customers (households and small businesses) in conditions of extreme cold.
Oil
Market features and key issues
Domestic oil productionDomestic oil production began in the Netherlands following the discovery of oil deposits near Schoonebeek in 1943. Production from other onshore fields in the area of Rotterdam

EnERgy SuPPly SECuRITy 2014 320 © O
ECD/
IEA
2014
as well as from the Dutch sector of the North Sea beginning in 1982, contributed to total production reaching a peak of 90 thousand barrels per day (kb/d) in 1986. In 2012, total indigenous oil production in the Netherlands, including crude oil and natural gas liquids averaged 51.7 kb/d.
Production at Schoonebeek stopped in 1996, having produced only a quarter of the field’s estimated reserves, as the crude stream was considered too viscous for production to be economically viable. Enhanced oil recovery techniques such as steam injection and horizontal drilling have reversed this, and in January 2011 the field was officially reopened for production. Production from the field is expected to average some 14 kb/d over the coming 25 years, with all amounts to be exported by rail to the refinery in Lingen, Germany.
Oil production from fields other than Schoonebeek, both onshore and offshore, is projected to continue to decline. Total indigenous production in the Netherlands is forecast to rise to just over 35 kb/d in 2015 and then decline steadily thereafter. Beyond 2035, only a small amount of natural gas liquids (NGLs) production is expected to continue. Import dependency, which stood at 95% in 2012, will therefore decline slightly in the period to 2015. Following this period, the Netherlands will gradually move towards becoming fully dependent on oil imports to meet domestic demand.
Oil demandOil product demand in the Netherlands averaged just over 1 mb/d in 2012. Total oil use has grown at an annual average rate of 1.5% since 2000. The industry and transformation sectors, which account for over 80% of all oil used in the Netherlands, have been the primary sectors leading oil demand growth. Oil consumption in these sectors has grown by an average of over 5% per year since 2000. Rising oil use has been primarily in the form of naphtha used by the petrochemical industry in these sectors. Demand for naphtha grew at an annual average rate of 9.5% from 2000 to 2012. Over the same period, demand for diesel grew by an average of 1.8% per year. Residual fuel oil was the second largest component of the oil products going to the Dutch market, however the vast majority of this, 98%, goes to international marine bunkers, fuelling international seagoing ships.
Figure 4.18.2 Oil consumption by sector, 1973-2011
0%
10%
20%
30%
40%
50%
60%
70%
80%
90%
100%
1973 1975 1977 1979 1981 1983 1985 1987 1989 1991 1993 1995 1997 1999 2001 2003 2005 2007 2009 2011
Commercial/agriculture/other
Residential
Industry
Transport
Transformation

CHAPTER 4 Emergency response systems of individual IEA countries The netherlands 321© O
ECD/
IEA
2014
Total oil demand is expected to continue to grow in the coming years at an annual average rate of just under 1%. This rate would infer oil demand reaching 1.1 mb/d by 2020. The industry sector, which accounted for some 40% of oil demand in 2011 and which includes the petrochemical industry, will continue to be the driving force behind oil demand growth. The transport sector, which accounted for 42% of 2011 demand, is expected to decline owing to improved fuel economies and alternative fuel uses such as electricity and biofuels.
Figure 4.18.3 Oil demand by product, 1998-2012
0
200
400
600
800
1 000
1 200
1998 2000 2002 2004 2006 2008 2010 2012
kb/d
Other products
Residual fuels
Other gasoil
Diesel
Jet and kerosene
Motor gas
Naphtha
LPG and ethane
Imports/exports and import dependencyWith total refinery output in the country (1.25 mb/d) greater than domestic demand, the Netherlands is a net exporter of refined products. At the same time, large volumes of crude and oil products enter the country, only to be exported to neighbouring countries as regional suppliers take advantage of available port and storage infrastructure. Thus the Netherlands is a key link in European oil supply flows, with the total volumes of oil transiting over four times larger than Dutch oil demand.
In 2012, total imports (not including transit volumes) of crude oil and NGLs were nearly 60 million tonnes (Mt), or an average of 1.27 mb/d. Roughly one-quarter of these imports were from the North Sea, a third from the Russian Federation and another third from OPEC member countries.
Total output of finished products from domestic refining was 57.4 Mt, or an average of 1.23 mb/d in 2012. The Netherlands also imported 1.9 mb/d of oil products in 2012, compared to just over 2 mb/d of product exports. Net exports of gasoline were primarily to North America while net exports of middle distillates were primarily to Germany, Belgium and France. At the same time, the Netherlands is a net importer of fuel oil, naphtha and “other products” for the petrochemical sector (207 kb/d in 2012), mostly from Russia.

EnERgy SuPPly SECuRITy 2014 322 © O
ECD/
IEA
2014
Figure 4.18.4 Crude oil imports by origin, 2012
Russian Federation31%
United Kingdom14%
Saudi Arabia12%
Nigeria12%
Norway11%
Other20%
Oil company operations Dana Petroleum and NAM (jointly owned by Shell and ExxonMobil) are the country’s main domestic crude oil producers. NAM is also the country’s largest natural gas producer.
Five companies operate refineries in the country, with Shell and BP operating the two largest (Pernis and Europoort, respectively), while ExxonMobil and Kuwait Petroleum (KPC) also operate refineries located in the Rotterdam area. Total and Lukoil jointly operate the Zeeland Refinery in Vlissingen.
The Netherlands Petroleum Industry Association (VNPI) represents the ten main companies operating on the Dutch upstream, retail and wholesale oil market. These companies collectively represent 99% of production and 80% of oil products sold on the Dutch market.
VOTOB is an association representing 14 independent tank storage operators in the Netherlands, defined as companies providing logistic services to customers without having ownership of the products in custody. These companies temporarily store liquid products for customers, with tanks ranging in size from 100 to 100 000 m³.
Another industry association on the Dutch oil sector is Nederlandse Organisatie Voor de Energiebranche (NOVE), which represents independent companies trading, selling, transporting and storing liquid fuels and lubricants on land and water. NOVE has 185 members representing 75% of independent fuel traded by volume.
Oil supply infrastructure
RefiningThe Netherlands’ five refineries have a total crude distillation capacity of roughly 1.2 mb/d. One of the refineries (Total/Lukoil) is located in Vlissingen; the other four (ExxonMobil, KPC, BP, and Shell) are in the Rotterdam area.
In 2012, the country’s refined product output totalled 1.2 mb/d and the capacity utilisation rate of Dutch refineries was almost 100%. The composition of production was gas/diesel oil (34%), motor gasoline (13%), residual fuel oil (13%) and naphtha (15%). The remaining capacity was used for LPG and ethane production (4%) and other products (8%). The Dutch refineries have a significant surplus in production of diesel, by a margin of nearly 240 kb/d over local demand (demand stood at 177 kb/d, while 415 kb/d of diesel were produced in 2012).

CHAPTER 4 Emergency response systems of individual IEA countries The netherlands 323© O
ECD/
IEA
2014
The Dutch refinery industry is primarily focused on exports, with most of its product output (63%) directly exported. Furthermore, another 12% of output from the refineries is exported by the petrochemical industry.
Figure 4.18.5 Refinery output vs. demand, 2012
0 50 100 150 200 250 300 350 400 450
Other products
Residual fuels
Gas/diesel oil
Jet and kerosene
Gasolines
Naphtha
LPG and ethane
Output/demand (kb/d)
Demand
Refineryoutput
Ports and pipelinesDutch ports are of international importance and the country is the largest hub in Europe for inland waterway bunkering.
The Rotterdam area is well connected with the hinterland, both by river and by pipeline. It is the world’s third largest marine bunker harbour, after Singapore and Shanghai. The Rotterdam harbour is eager to develop itself as an energy harbour for the future, and is oriented towards developing biobased industries and biofuel production and stockholding plants.
The Zeeland Refinery is located in Vlissingen port which is situated between the ports of Antwerp and Rotterdam; it is therefore of strategic importance to balance supply to both demand centres.
The Amsterdam port is especially oriented towards oil products and has developed into one of the most important gasoline stockholding sites in the world.
The Delfzijl/Eemshaven port area is undergoing extensive development with new tank capacity for strategic stockholding and for biofuels.
There are two major crude oil pipelines in the Netherlands: the Rotterdam-Rhine Pipeline (RRP) to Germany’s Ruhr region has a capacity of 400 kb/d; the Rotterdam-Antwerp Pipeline (RAP) pipeline to Belgium’s Antwerp area has a capacity of 600 kb/d.
Rhine-Main Pipeline (MMP, also referred to as the RMR) is a major product pipeline to Germany, with a capacity of 250 kb/d. In the Rotterdam area and the southwest of the country a huge grid of pipelines connects the terminals, depots and the refineries, including the Zeeland Refinery.

EnERgy SuPPly SECuRITy 2014 324 © O
ECD/
IEA
2014
Storage capacityTotal storage capacity in the Netherlands is estimated at some 189 mb (30 mcm). Most of this storage is in the Rotterdam area, but Amsterdam and Vlissingen also have abundant storage capacity. In addition to the large terminals of the oil companies, several independent tank storage companies have large stockholding capacities in the Netherlands. The largest is the Maasvlakte Olie Terminal (MOT) near Rotterdam. A joint venture of BP, ExxonMobil, Kuwait Petroleum, Shell, Total and Vopak, the MOT is one of the world’s largest oil terminals comprising crude oil in 39 tanks with a total capacity of 28 mb (4.4 mcm).
In the east of the Netherlands, near Hengelo, there are plans for creating three salt caverns for holding up to a total of 2.8 mb of diesel. Each cavern would be 150 000 m³ at a depth of 450 metres. The final licence approvals are still pending.
Because of the relatively large storage capacity in the Netherlands, as well as the relatively large number of bilateral agreements that the administration has concluded, Dutch companies are very active in regional stockholding arrangements.
Decision-making structure
The Minister of Economic Affairs of the Netherlands (MEAN) is responsible for oil and natural gas emergency policy, with flexibility as a vital component. In most crisis situations, the Dutch administration believes that regular market forces should adequately allocate oil instead of activating any sharing system.
The precise mix of emergency measures to be used in the Netherlands in a crisis would be determined according to the nature and expected duration of the crisis and the needs of the markets. However, Dutch oil emergency policy points towards a strong preference for stockdraw in most emergency situations.
The Dutch national emergency strategy organisation (NESO) prepares and advises the Minister of Economic Affairs, Agriculture and Innovation and the Cabinet on matters of oil emergency measures and their implementation. In normal times, the NESO is made up of officials from the Energy Markets Directorate in the Directorate-General for Energy, Telecom and Competition. In emergency situations (as well as for test purposes), the basic NESO organisation is enlarged to include officials from other relevant departments. Contact between the NESO and industry is co-ordinated through the oil industry advisory group. The NESO would also be in contact with other departments, international organisations and the Dutch stockpiling agency COVA.
During a crisis, the NESO would convene a number of “measure groups” to prepare and execute specific measures. These groups would be staffed by representatives from the various ministries and from the oil industry. Industry would be consulted and would have a role in the preparation and implementation of specific measures (e.g. stockdraw and refinery measures), however it would not participate in decision-making within the governmental structure.
Stocks
Stockholding structureThe Netherlands has a mixed system, in which both industry and the government agency COVA are required to hold emergency stocks. Because of their international activities, refining and supplying companies tend to hold unusually high volumes of stocks as part

CHAPTER 4 Emergency response systems of individual IEA countries The netherlands 325© O
ECD/
IEA
2014
of normal operations. In effect, the Netherlands is always holding well in excess of its obligations under both EU and IEA requirements.
Crude or productsThe industry can fulfil its stockholding obligations with either crude oil or products.
To cover its stockholding obligation, COVA entered into ticket contracts with the domestic oil industry for 0.71 Mt of oil products. The remaining stock obligation of COVA (3.8 Mt) consists of crude oil, gas oil and motor gasoline which is fully owned by COVA and pledged to the state of the Netherlands. COVA holds just over half of its overall stock obligation as crude oil.
Location and availabilityBecause of the high cost of storage in the Rotterdam area, around one-third or some 13 mb (1.8 Mt) of COVA crude oil stocks are held in salt caverns near Wilhelmshaven (Germany). The remaining quantities of crude are held in above-ground storage in the Netherlands.
Company stock obligations are held as part of normal operating inventories.
Many traders on the Dutch market have little or no inventory levels, instead operating just-in-time deliveries from refineries or depots directly to customers by truck. In such instances, companies are able to fulfil their stockholding obligation with stockholding ticket contracts. Emergency stocks may also be held abroad, without restriction as to the portion of the obligation, as long as bilateral agreements are in place. The Netherlands has bilateral agreements with 11 countries.
Monitoring and non-complianceCompanies with stockholding obligations (including both national obligations and reserved stock obligations by tickets) are required to submit monthly reports on their relevant stock levels to the MEAN. The reports are checked by the ministry, which may delegate the Tax Inspection Service of the Ministry of Finance to conduct audits of the records and on-site physical checks. Any suspected infringement is reported to the Fiscal Intelligence and Investigation Service and the Economic Investigation Service (FIOD/ECD) of the Ministry of Finance for further investigation.
Stock drawdown and timeframe In an oil crisis, all compulsory stocks are at the disposal of the minister of MEAN, who has the authority to invoke a variety of statutes, depending on the situation. In principle, a decision to authorise a stockdraw could be taken within 24 hours.
In most situations, a stockdraw would first focus on making COVA stocks available through a tendering mechanism. It would be carried out in full co-operation and consultation with international bodies and other countries.
Once their obligation to hold stocks has been lowered, companies with a stockholding obligation are expected to co-operate through voluntary drawdown of their stocks. An order to companies to draw down their inventories would only be considered in a very severe crisis.
EnERgy SuPPly SECuRITy 2014 326 © O
ECD/
IEA
2014
Financing and feesThe operational costs and financial expenses of COVA are covered by a stockholding levy which has been defined at EUR 8.00 per m³ in the 2012 Oil Stockpiling Act and can be amended by an Order of Council.
Other measures
Demand restraintThe Dutch demand restraint programme focuses first on voluntary measures. If these prove to be inadequate, Dutch authorities can proceed to obligatory measures. The NESO would aim to reduce the private and recreational use of petroleum products, while leaving basic economic activities untouched as much as possible.
Decisions to implement demand restraint measures would be taken by the MEAN, or by the Cabinet, based on a proposal by this minister. The minister would be advised by the NESO operational team (within the ministry) and by an interdepartmental policy team for the Cabinet. On average the preparation of a Cabinet decision may take two to three weeks, or shorter if urgency so requires. However, after such a decision is made, there are lead times for implementation. In practice, however, both periods may partly run parallel. Time is necessary for preparing all issues related to the implementation, such as communications, control systems, instructions to relevant parties, etc. The necessary timing will differ according to measure.
The NESO has prepared the following set of demand restraint measures, which could be implemented on short notice:
� communication to the public, including a call for voluntary reduction of oil consumption
� reduction of speed limits
� Sunday driving bans (allied with bans on pleasure boating and flights)
� supply of priority end-users and critical infrastructure sectors
� request for appropriate refinery action and
� bans on filling containers to limit hoarding.
Fuel switchingOil use in the Netherlands is heavily concentrated in sectors which do not provide opportunities for short-term switching, such as transportation and industry (petrochemical) sectors.
OtherShort-term surge production capacity in the Netherlands is considered inconsequential.
Gas
Market features and key issues
Gas production and reserves The Netherlands became a significant producer and exporter of natural gas following the discovery in 1959 of a gas field near the village of Slochteren in the northern province of Groningen. Offshore production in the Dutch sector of the North Sea began

CHAPTER 4 Emergency response systems of individual IEA countries The netherlands 327© O
ECD/
IEA
2014
in the 1970s. By the end of 2010, the Netherlands had produced a cumulative total of nearly 3.2 trillion cubic metres (tcm) of natural gas, while remaining gas resources were estimated at 1.3 tcm. Of these remaining resources, the Groningen field accounted for 980 billion cubic metres (bcm), with 160 bcm to be found in other smaller onshore fields and 164 bcm in offshore formations.
The Netherlands produces two types of natural gas, one with a low-range calorific value below 10.5 kWh/m³ (L-gas), mainly from Groningen, and one with a high calorific value from 10.5 to 12.8 kWh/m³ (H-gas), from smaller fields. H-gas and L-gas must be transported on separate networks.
In 2011 the total production of natural gas in the Netherlands was over 80 bcm. The Groningen field is by far the largest source of Dutch gas production, and accounted for some 54 bcm of the 2011 total. The natural geology of the field allows for a great amount of flexibility in adjusting the field’s output flow in order to respond immediately to actual demand from end-users. This allows the field to play the role of swing producer in order to meet seasonal fluctuations in demand.
Indigenous gas production in the Netherlands is expected to continually decline over the coming decades. Future production levels are linked to a Dutch gas policy provision, which sets a maximum allowance for Groningen total output to ensure that the Groningen field can continue to fulfil its function as a swing producer for the longest time possible. For the period from 2011 to 2020, this cap is set at to 424.7 bcm Groningen-equivalent gas (Geq). This implies an annual production of 44.6 bcm (Geq), however the flexibility role of the Groningen field necessarily implies some uncertainty as to its annual output over this period.
Based on the Dutch government’s outlook for indigenous production and domestic use of natural gas, the Netherlands is expected to shift from being a net exporter to being a net importer of gas in the period between 2020 and 2025.
Gas demandDomestic gas consumption in the Netherlands totalled some 48 bcm in 2011. Over one-third of total gas was consumed by the transformation sector. With some 96% of all households connected to gas supplies, the residential sector accounted for a substantial share, at 22% of the total, while the commercial and industry sectors each accounted for another 20% of gas use.
Natural gas demand is projected to grow steadily over the coming two decades. Growth in demand will be driven primarily by the use of gas for electricity generation and to a lesser extent by the industry sector. Demand in the residential and commercial sectors is expected to decline slightly owing to greater energy efficiency measures such as better insulation.

EnERgy SuPPly SECuRITy 2014 328 © O
ECD/
IEA
2014
Figure 4.18.6 Natural gas consumption by sector, 1973-2011
0
10 000
20 000
30 000
40 000
50 000
60 000
1973 1975 1977 1979 1981 1983 1985 1987 1989 1991 1993 1995 1997 1999 2001 2003 2005 2007 2009 2011
mcm
Commercial/other
Residential
Industry
Transport
Dist. losses
Energy
Transformation
Gas import dependencyThe Netherlands is the largest gas producer within the European Union. At the same time, the Netherlands imports and exports large volumes of gas, with roughly 40% of the total volume of gas used domestically.
In 2011, the Netherlands exported 55.8 bcm of natural gas. The largest portion of these exports, 21.8 bcm, went to Germany while Belgium was the destination of some 10 bcm and Italy of 8.7 bcm. Substantial volumes were also exported to France (7.4 bcm) and the United Kingdom (6.7 bcm). In the same year, the Netherlands imported nearly 26 bcm of gas, primarily from Norway, the United Kingdom and Russia.
Figure 4.18.7 Natural gas imports by source, 2011
Norway63%
United Kingdom17%
Russian Federation11%
Denmark 5%
Germany2% Other 2%
Gas supply infrastructure
Ports and pipelinesGasunie Transport Services B.V. (GTS) has been the operator of the national transmission system since July 2004. GTS is responsible for all national transport infrastructure

CHAPTER 4 Emergency response systems of individual IEA countries The netherlands 329© O
ECD/
IEA
2014
operation and development. The Dutch gas network comprises 12 050 km of pipelines, 50 entry points (mainly from Dutch gas fields), 1 100 delivery stations and 25 interconnection points.
The Dutch network consists of separate networks in order to accommodate the transportation of the two different qualities of gas, H-gas and L-gas. Nearly all residential and commercial consumers use (blended) L-gas, while industry and power generators use mostly H-gas. Some L-gas used by final consumers comes from H-gas, having been converted to L-gas in blending stations. L-gas is also exported through dedicated transmission pipelines to customers in Belgium, France and Germany.
The Dutch transport network is directly connected to four European countries via 25 interconnections. Gas can be both exported and imported via connections with Belgium and Germany. However, gas can only be exported via the connection with the United Kingdom (the Balgzand Bacton Line) and gas can only be imported via the connection with Norway.
StorageAt the end of 2011 there were four underground natural gas storage facilities in the Netherlands with a total capacity of 5.2 bcm of working gas. Additionally, there are ten caverns in Epe, Germany, connected to the Dutch transmission system, providing a further 1.5 bcm of working capacity.
The role of storage capacity will become increasingly important in maintaining supply flexibility as domestic production declines. As noted above, gas production from the Groningen field plays an important role in accommodating seasonal fluctuations in market demand. As production from the field declines, so too will this flexibility. Storage which can accommodate summer/winter variations, such as from converted depleted gas fields, will be increasingly important to compensate for this decrease in production flexibility. Future storage capacity needs will also be augmented by the growing role of natural gas-fired power plants to back up electricity generation from intermittent renewable sources such as solar and wind.
Emergency policy
In the case of a natural gas crisis, measure have been put in place to protect households and other small consumers, while the Netherlands seeks to assure security of gas supplies by establishing itself as a gas junction in the international transport of gas and as a distribution centre for northwestern Europe.
The 2004 Gas Act establishes responsibilities related to gas crises with the (MEAN). As provided for under the act, the minister appoints GTS, as the national gas TSO, to perform certain tasks specified in the act; however the ultimate responsibility remains with the minister. Tasks allotted to GTS include performing the specific tasks established in related EU regulations, such as developing and updating a risk assessment every two years, and creating a preventive action plan and emergency plan. Emergency supply procedures are activated if a licence-holder/supplier cannot supply gas to small consumers (residential customers and small and medium-sized enterprises, defined as customers with a connection transit flow of 40 m³ or less per hour). In such situations, GTS has measures to guarantee temporary supply to these consumers as long as they have failed to find an alternative supplier.
Retail suppliers of small consumers in the Netherlands are responsible for acquiring both the capacity and volumes necessary to supply their customers. GTS is statutorily responsible for the reservation of the necessary additional volumes and capacities
EnERgy SuPPly SECuRITy 2014 330 © O
ECD/
IEA
2014
to meet the increased demand of domestic consumers whenever the effective daily temperature falls to between -9°C and -17°C.
Peak supply standardThe European standard of 1 in 20 years established in its 2010 regulation can be translated for the Netherlands into a temperature of -15.5°C. The existing Dutch standard for infrastructure and security of supply under peak circumstances is more strict, as it is related to a situation occurring when there is an average daily temperature of -17°C, corresponding to a probability of once every 50 years. This supply standard is established under the “Decision on Security of Supply Gas Act”.
The act also contains general clauses in case a supplier does not meet its obligations. In such cases, GTS has a co-ordinating task to make sure that the customers of the non-compliant supplier continue to receive supply. Non-compliance of a supplier does not imply shortage of gas, and therefore can be solved by the market. In this way these customers can choose a new supplier within a reasonable time without an interruption in their gas supply.
At the end of 2011 (2011-12 season) a total capacity of 2.44 mcm/h and a volume of 101 mcm was contracted for the peak supply of gas. This provides an operating time of 41.4 hours at maximum capacity. However, only part of the total consumption is supplied via peak supply (i.e. the additional maximum hourly capacity necessary when the effective daily temperature is -9°C or lower). Depending on how the temperature actually progresses during the course of a day, gas will only be supplied from peak supply for part of the day, notably during the morning peak and the evening peak. Thus the maximum contracted capacity will only be necessary for a limited number of hours in the event of an effective daily temperature of -17 °C. Hence, in practice, it will be possible to ensure peak supply for several days.
GTS uses two facilities to guarantee the production capacity required for peak supply: Gasunie’s LNG installation on the Maasvlakte (the LNG peak shaver), and external capacity purchased on the market by means of an annual tender. The peak shaver is partly allocated for peak supply use as described in the Decree on Gas Security of Supply. GTS uses the other part of this installation for transport support. Hence it may be the case that this installation is in fact being used even though the limit under which peak supply takes place, -9°C, has not yet been reached.