Embed Size (px)
Citation preview

www.developpement-durable.gouv.fr
Ministère de l'Écologie, du Développement durable et de l’Énergie
Crédit photo : Arnaud Bouissou/MEDDE
Energy statistics in France
Speaker: Guillaume Mordant, deputy director for sustainable development statistics, France
Service : Ministry in charge of the energy policy
Date : 2nd of March 2015

2
Content
Energy in France: an overview
The legal basis for data collection
Data collection of energy statistics in France

3 IEA Energy statistics Course – Paris – 2nd of March 2015
Energy in France: an overview

4 IEA Energy statistics Course – Paris – 2nd of March 2015
France needs energy but has no fossil resources
GDP (PPP)
Total primary energy supply
Population
Area
Oil supply
0,00 0,50 1,00 1,50 2,00 2,50 3,00
2,79
1,93
0,94
0,43
0,02
Source: AIE, 2014

5 IEA Energy statistics Course – Paris – 2nd of March 2015
A growing demand for energy
0
50
100
150
200
250
300
19701972
19741976
19781980
19821984
19861988
19901992
19941996
19982000
20022004
20062008
20102012
Primary energy consumption (with climatic correction)Mtoe
Energy transformation
Final energy consumption
Non energetic consumption
Source: SOeS, Energy balance for France, 2013

6 IEA Energy statistics Course – Paris – 2nd of March 2015
France produces half of its energy primary consumption
0
20
40
60
80
100
120
1970
1972
1974
1976
1978
1980
1982
1984
1986
1988
1990
1992
1994
1996
1998
2000
2002
2004
2006
2008
2010
2012
Renewables
Electricity
CoalNatural gas
Energy independancy rate* (%)
Total
Petroleum products
*calculated as the ratio
betw een national production
and the total primary energy
consumption
Source: SOeS, Energy balance for France, 2013
7 IEA Energy statistics Course – Paris – 2nd of March 2015
The new trends since 2002: more or less
dramatic curbs
0
10
20
30
40
50
60
70
80
1970
1972
1974
1976
1978
1980
1982
1984
1986
1988
1990
1992
1994
1996
1998
2000
2002
2004
2006
2008
2010
2012
Residential and services
Mtoe
Trend 1990 - 2002
Trend 2002 - 2013
Manufacturing industry including iron
Trend 1990-2002 Trend 2002 - 2013
Transports
Trend 1990 - 2002
Trend 2002 - 2013
Agriculture Trend 1990 - 2002 Trend 2002 - 2013
Final energy consumption by sector
Source: SOeS, Energy balance for France, 2013

8 IEA Energy statistics Course – Paris – 2nd of March 2015
The French Energy Balance (2013)
Source: SOeS, Energy balance for France, 2013

9 IEA Energy statistics Course – Paris – 2nd of March 2015
CO2 emissions from fuel combustion are somewhat stabilized
0
100
200
300
400
500
600
1970
1972
1974
1976
1978
1980
1982
1984
1986
1988
1990
1992
1994
1996
1998
2000
2002
2004
2006
2008
2010
2012
Transports
Agriculture
Manufacturing (including iron)
Energy sector
Residential and services
MtCO2 CO2 emissions from fuel combustion (including climate corrections)
Source: SOeS, Energy balance for France, 2013

10 IEA Energy statistics Course – Paris – 2nd of March 2015
Data collection: the legal basis

11 IEA Energy statistics Course – Paris – 2nd of March 2015
The French statistical system: a decentralized organization
National Council for Statistical Information (CNIS)
National Institute for Statistics (Insee)
Ministry of
Agriculture
Statistical
Service
Ministry of
Health
Statistical
Service
Ministry of
Employment
Statistical
Service
Ministry of
Education
Statistical
Service
Ministry of
Justice
Statistical
Service
Ministry
of …
Statistical
Service
Ministry of
Ecology,
Sustainable
Development,
and Energy
Service for the
Observation
and Statistics
(SOeS)

12 IEA Energy statistics Course – Paris – 2nd of March 2015
The Ministry of Ecology, Sustainable Development, and Energy
The Service for the Observation and Statistics (SOeS)
Transport
Statistics
Housing
Statistics
Environment
Statistics
Energy
Statistics
Sustainable
Development
Indicators
Dissemination
and
data
management
13 IEA Energy statistics Course – Paris – 2nd of March 2015
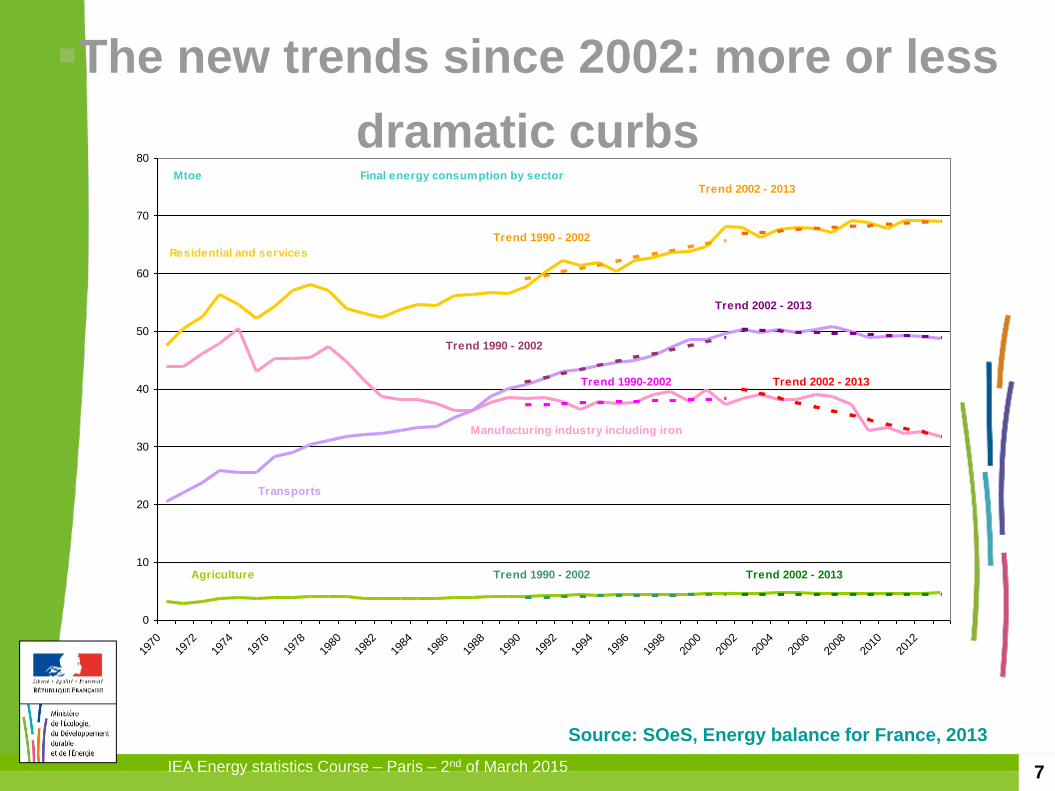
The French legal framework: two types of data collection
Official statistical surveys (loi de 1951)
Accuracy and methodology approved by the National Council for statistical information
List published in the Official Journal of the French Republic
Can be mandatory
Administrative data collection
Based on other legal acts (monitoring of importers, producers, distributors)
Data made available to the statistical system thanks to article 7bis of the 1951
law about statistics.
Or texts within the Energy Code.
Some of those legal acts derive from European Directives (on
renewables, CHP, electricity and gas prices, energy efficiency)
14 IEA Energy statistics Course – Paris – 2nd of March 2015
Data collection of energy statistics in
France

15 IEA Energy statistics Course – Paris – 2nd of March 2015
Energy statistics in France: 17 people
Deputy director + one expert in charge of the development of energy accounts.
The bureau of energy supply statistics
8 people, specialized by type of energy (2 on renewable, 2 on oil, petroleum products and coal, 3 on natural gas and / or electricity) + head of unit
The bureau of energy use statistics
7 people, specialized by sector and / or topic (2 on prices and fiscal studies, 1 on international and local data, 1 on fuel poverty, 1 on manufacturing, transports and climate, 1 on residential, services and agriculture) + head of unit
They both use statistical surveys, administrative data, and analyse and disseminate them.
16 IEA Energy statistics Course – Paris – 2nd of March 2015
Collecting electricity data
Simplified monthly questionnaire to the main producers (3), transport and distribution grids (2)
Two annual « loi de 1951 » statistical surveys (now completely dematerialized)
All the producers (5 000), including autoproducers,
CHP plants, etc. (except photovoltaic in households)
Questions about production, fuel, equipment
All the actors implied in transport and distribution
(170)
Origin of the electricity; quantities provided by region,
and by types of consumers.

17 IEA Energy statistics Course – Paris – 2nd of March 2015
Nuclear power as a response to the oil crisis
0
20
40
60
80
100
120
140
160
1970
1972
1974
1976
1978
1980
1982
1984
1986
1988
1990
1992
1994
1996
1998
2000
2002
2004
2006
2008
2010
2012
Nuclear power
Mtoe
Other renewables and waste
Hydro, w ind and solar power
Primary production in Metropolitan France
Crude oil
Natural gas
Coal
Source: SOeS, Energy balance for France, 2013

18 IEA Energy statistics Course – Paris – 2nd of March 2015
Collecting natural gas data
Simplified monthly questionnaire to the main providers
(10) and to the managers of stocks (2), LNG terminals
(3), transport networks (2) and distribution network (1)
Annual « loi de 1951 » statistical survey to all the actors
(200) – using an internet questionnaire from 2015 on.
Questions about imports (by origin), flows at entry points,
production, stocks, losses, consumption by sector,
consumption by region, prices.

19 IEA Energy statistics Course – Paris – 2nd of March 2015
France benefits from a variety of suppliers
0
100
200
300
400
500
600
19731975
19771979
19811983
19851987
19891991
19931995
19971999
20012003
20052007
20092011
2013
The Netherlands
Norway
Algeria
Russia
Others
TWh (superior calorific power) Net imports of natural gas
Source: SOeS, Energy balance for France, 2013
20
Collecting oil data
Oil companies have to declare monthly (administrative data)
Imports and exports of crude oil and of refined products (specific administrative declarations that can be compared to international trade statistics)
Refineries activity : production, consumption, stocks (only 7 active refineries left in metropolitan France plus 1 in overseas territories)
Sales by product
Annual survey (based on the Energy Code) on all petrochemical plants in France (7), sales by region

21 IEA Energy statistics Course – Paris – 2nd of March 2015
Imports of crude oil are rather balanced
0
20
40
60
80
100
120
140
1971
1974
1977
1980
1983
1986
1989
1992
1995
1998
2001
2004
2007
2010
2013
Middle East
North Africa
Sub-saharian Africa
North Sea
Former USSR
Others
Imports of crude oil
Mt
North Africa
Source: SOeS, Energy balance for France, 2013

22 IEA Energy statistics Course – Paris – 2nd of March 2015
Collecting coal data
Monthly data:
foreign trade statistics for imports and exports
power plants, iron industry, coking (more than 80% of the whole consumption) - it is a “loi de 1951” survey on the consumption in the iron industry and Administrative data collection on power plants.
Annual data:
« loi de 1951 » statistical survey about energy consumption (all energies) in manufacturing industry (covering businesses with at least 20 employees)
“loi de 1951” survey on the consumption in the iron industry.
“loi de 1951”survey on the consumption in the urban heating systems (all energies)
Estimation for households and services (marginal quantities)

23 IEA Energy statistics Course – Paris – 2nd of March 2015
Collecting thermal renewable data
The methodology has to be adapted to each source. New installations can usually be identified through subsidies. The problems are:
To estimate the production of the installations, using the known characteristics (solar thermal systems, heat pumps),
To estimate the rate of retired installations
Mostly administrative data: annual survey for waste by another agency, inventories for geothermal energy, fiscal data for biofuels, study made by a consultant on solar thermal every other year…
Special problem for firewood (half of our renewable sources) : the only (more or less) reliable source is the Housing Survey on 40 000 households collected every 5 (or 7…) years…

24 IEA Energy statistics Course – Paris – 2nd of March 2015
The recent and fragile development of renewable energy
0
5
10
15
20
25
30
1985
1986
1987
1988
1989
1990
1991
1992
1993
1994
1995
1996
1997
1998
1999
2000
2001
2002
2003
2004
2005
2006
2007
2008
2009
2010
2011
2012
2013
Mtoe
Solid biomass
Hydro powerBiofuels
Other renewables
Renewable wasteWind power
Primary production of renewables in metropolitan
France
Source: SOeS, Energy balance for France, 2013

25 IEA Energy statistics Course – Paris – 2nd of March 2015
Collecting data about energy use
« Loi de 1951 » statistical surveys by us:
Survey on prices for final consumers
on energy uses and quality of dwellings in the domestic sector (5 000 households, first ever in 2013)
on the urban heating systems in France (census, 400 systems)
« Loi de 1951 » statistical surveys by other official statistics offices:
National Housing Survey (40 000 households, every 5-7 years)
Family Budget Survey (20 000 households, every 5 years)
Energy use in transports and industry (annual, sample)
Energy use in Agriculture (every… 20 years, sample)
Energy use in the Services industry (first ever in 2012)

26 IEA Energy statistics Course – Paris – 2nd of March 2015
Analysis and data dissemination
International reporting (IEA, Eurostat, JODI) monthly and annually
core dissemination tool: http://www.statistiques.developpement-durable.gouv.fr/
Our best-sellers:
Booklet: Key Figures on Energy in France (downloaded 13 000 times per year)
Booklet: Key Figures on Climate (3 000 per year)
French Energy Balance (5 000 in 2010 for the complete publication + 1000 for the summary)
Dashboard Wind and Photovoltaic Power (2 000 quaterly)
Monthly Report (1 000 monthly)
Non regular publications: Prices of Energy (1 400), CO2 Emissions (650), Opinion Survey (400)…
Pegase Database: 3 000 tables downloaded each month (75 % about prices)

27 IEA Energy statistics Course – Paris – 2nd of March 2015
Producing energy statistics in France: every cloud has its silver lining
Few actors => confidentiality problems, especially at local level
Policies focus on fields where statistics are not much reliable (renewables, local policies, GHG and indirect emissions…)
Many requests, with a lot of very urgent questions (especially from the minister’s staff)
BUT,
Answering requests is tiring, but interesting
Compared to the other areas, the global picture of energy
statistics is really good

www.developpement-durable.gouv.fr
Ministère de l'Écologie, du Développement durable et de l’Énergie
The end