Embed Size (px)
Citation preview
ENERGY STAR®
for Data Centers
Alexandra Sullivan US EPA, ENERGY STAR
February 4, 2010

Agenda
� ENERGY STAR � Buildings Overview � Energy Performance Ratings � Portfolio Manager
� Data Center Initiative � Objective � Development Process � Analytical Findings � Model Recommendations
� Model Release Schedule
2

ENERGY STAR

ENERGY STAR for Buildings Overview � Energy management program that provides proven
solutions to help building owners and managers reducetheir energy consumption � Help businesses protect the environment through superior
energy efficiency � Numerous technical and managerial resources � National rating system for buildings to benchmark and track
energy use � Energy management guidelines � Advice on design for energy efficient buildings � Online case studies and best practice stories � Calculators to track returns on energy efficiency investments � Training opportunities
� Opportunities for national recognition
4

ENERGY STAR for Buildings Overview � Work in markets with a focus on: � Commercial Property (offices, retail, hotels) � Public Sector (government, education) � Healthcare � Small businesses and congregations
� Provide an online tool to rate energy performance on a scale of 1-to-100 � Over 80,000 buildings have rated
� Buildings that earn a 75 or higher can earn theprestigious ENERGY STAR label � Over 8,000 buildings have earned the ENERGY STAR
� Learn more: www.energystar.gov/buildings
5
6
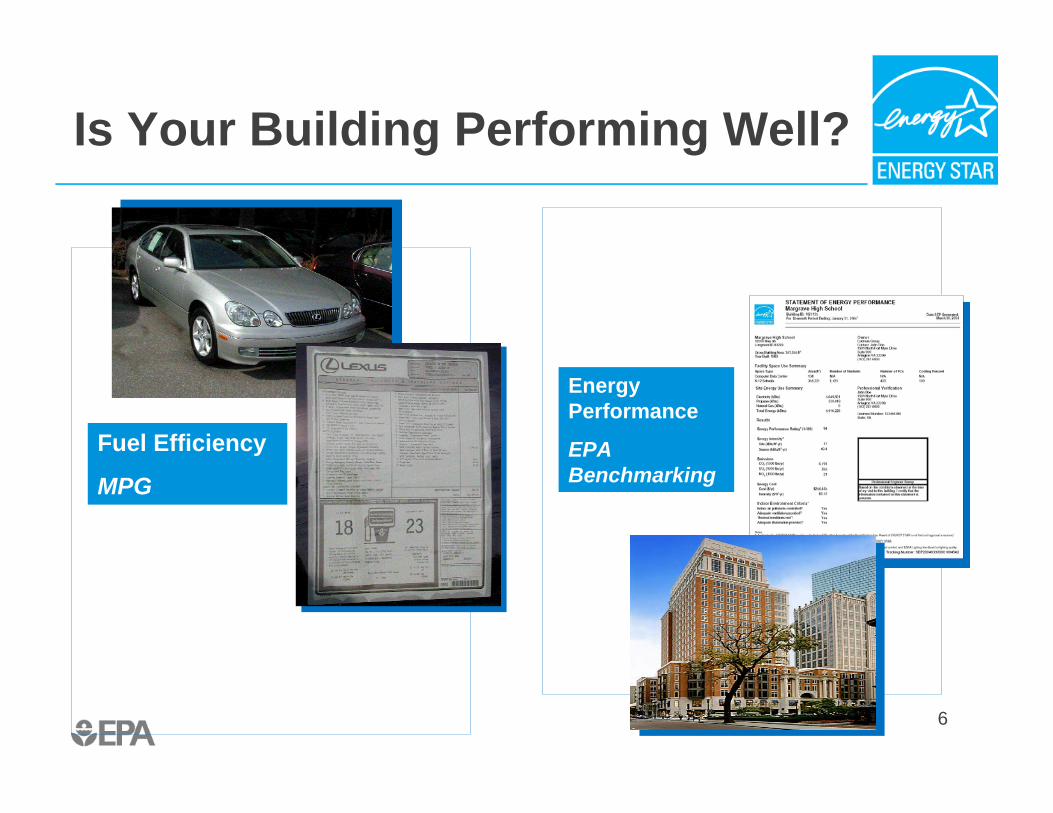
Is Your Building Performing Well?
Fuel Efficiency
MPG
Is 18 MPG high or low foran automobile?
Energy Performance
EPA Benchmarking
Is 80 kBtu/SF/YR high or low for a building?

EPA Rating Objectives
� Help businesses protect the environment through superior energy efficiency � Motivate organizations to develop a
strategic approach to energy management � Convey information about energy
performance in a simple metric that can be understood by all levels of the organization
7

EPA Rating Requirements � Monitor actual as-billed energy data � Create a whole building indicator � Capture the interactions of building systems not
individual equipment efficiency � Track energy use accounting for weather and
operational changes over time � Provide a peer group comparison � Compare a building’s energy performance to its
national peer group � Track how changes at a building level alter the
building’s standing relative to its peer group
8

EPA Rating Technical Foundation � Analyze national survey data � Commercial Building Energy Consumption Survey (CBECS)
� Develop regression models to predict energy use forspecific space types based on physical and operationalcharacteristics
� Create scoring lookup table � Ratings are based on the distribution of energy performance
across commercial buildings � One point on the ENERGY STAR scale represents one
percentile of buildings � Buildings that perform in the 75th percentile or better can
earn the ENERGY STAR label
9
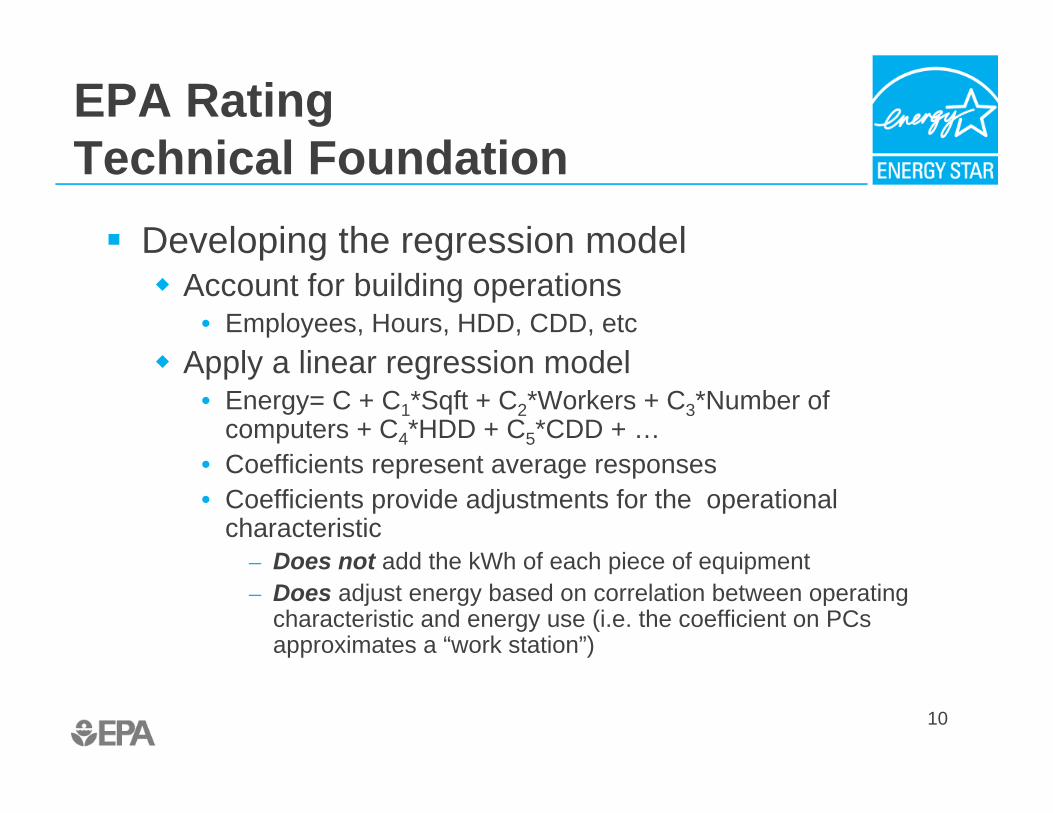
EPA Rating Technical Foundation � Developing the regression model � Account for building operations
• Employees, Hours, HDD, CDD, etc � Apply a linear regression model
• Energy= C + C1*Sqft + C2*Workers + C3*Number of computers + C4*HDD + C5*CDD + …
• Coefficients represent average responses • Coefficients provide adjustments for the operational
characteristic – Does not add the kWh of each piece of equipment – Does adjust energy based on correlation between operating
characteristic and energy use (i.e. the coefficient on PCsapproximates a “work station”)
10

EPA Rating Technical Foundation � The rating does � Evaluate as-billed energy use relative to building operations � Normalize for operational characteristics
• Size, Number of employees, Weekly operating hours, Climate � Depend on a statistically representative sample of the US
commercial building population � The rating does not � Attempt to sum the energy use of each piece of equipment � Normalize for technology choices or market conditions
• Type of lighting, energy price � Explain why a building operates as it does
11
12
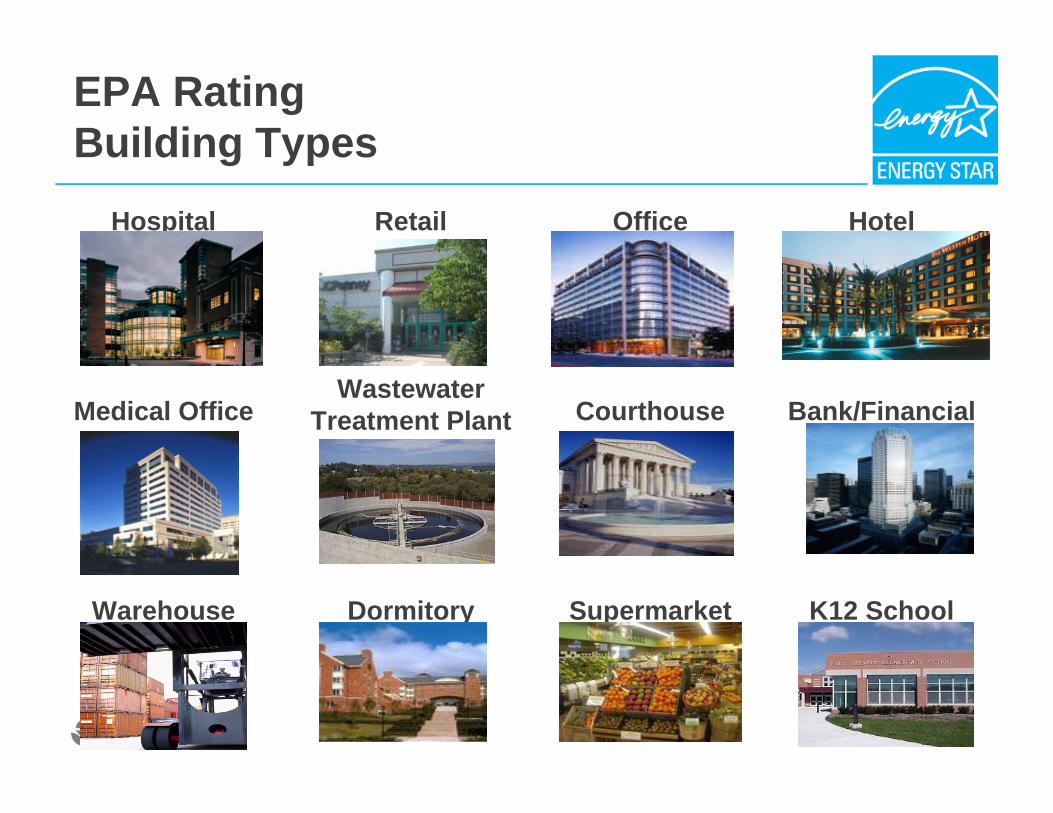
EPA Rating Building Types
Hospital Retail Office Hotel
Wastewater Medical Office Treatment Plant Courthouse Bank/Financial
Warehouse Dormitory Supermarket K12 School
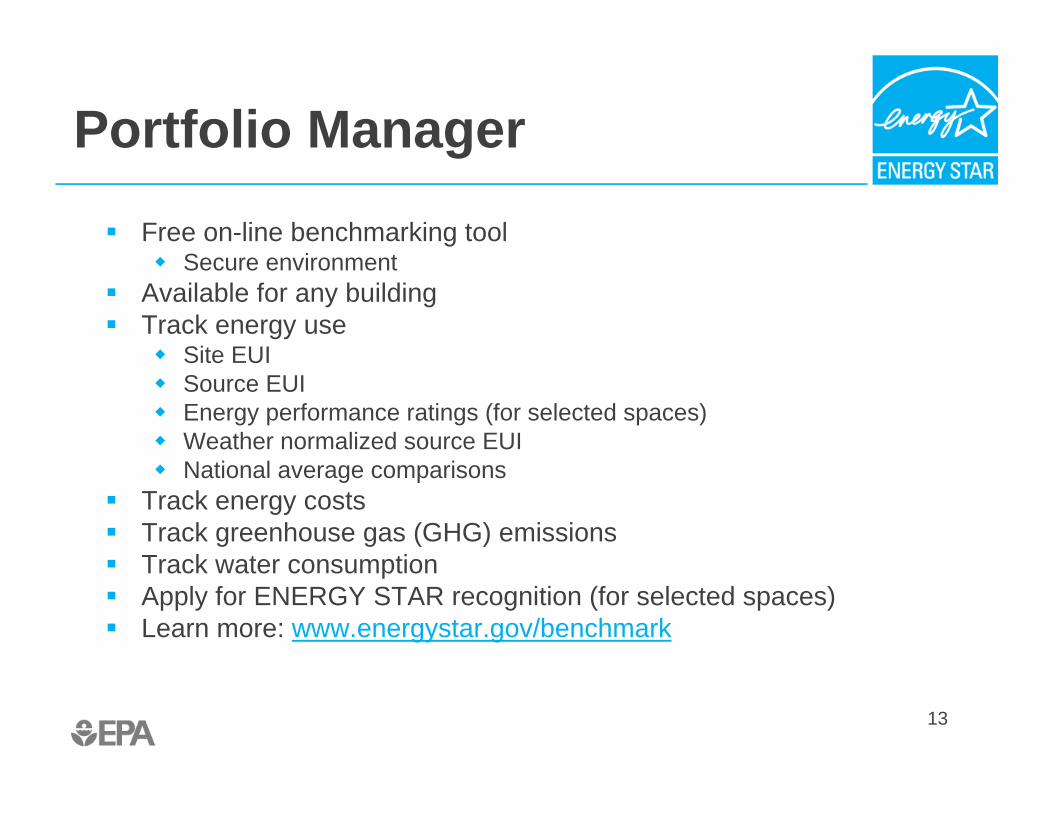
Portfolio Manager
� Free on-line benchmarking tool � Secure environment
� Available for any building � Track energy use � Site EUI � Source EUI � Energy performance ratings (for selected spaces) � Weather normalized source EUI � National average comparisons
� Track energy costs � Track greenhouse gas (GHG) emissions � Track water consumption � Apply for ENERGY STAR recognition (for selected spaces) � Learn more: www.energystar.gov/benchmark
13

Data Center Initiative

Data Center Initiative Objective � Develop a useful rating for industry � Can be available for use as soon as possible � Based on items that are commonly measured and tracked
� Build on existing ENERGY STAR methods and platforms � Apply to stand-alone data centers and data centers
housed within office or other buildings � Assess performance at the building level to explain how
a building performs, not why it performs a certain way � Provide users with information and links to additional
resources to aid in their efforts to determine next steps � Offer the ENERGY STAR label to data centers with a
rating of 75 or higher (performance in the top quartile)
15

Data Center Initiative Objective � Develop regression model to predict PUE � Include factors that are outside of the control of the
owner/operator � Factors for adjustment determined based on data collection and
analysis � Compare actual PUE to predicted PUE � More efficient data centers will have lower PUE than is predicted
� Express data center efficiency as a 1-to-100 ENERGYSTAR rating � Each point on rating scale equals 1 percentile of data centers
� In Portfolio Manager � ANY data center can earn a rating
• Enclosed or free standing • Good performer or poor performer
� Data centers with ratings of 75 or higher can apply for the ENERGY STAR 16
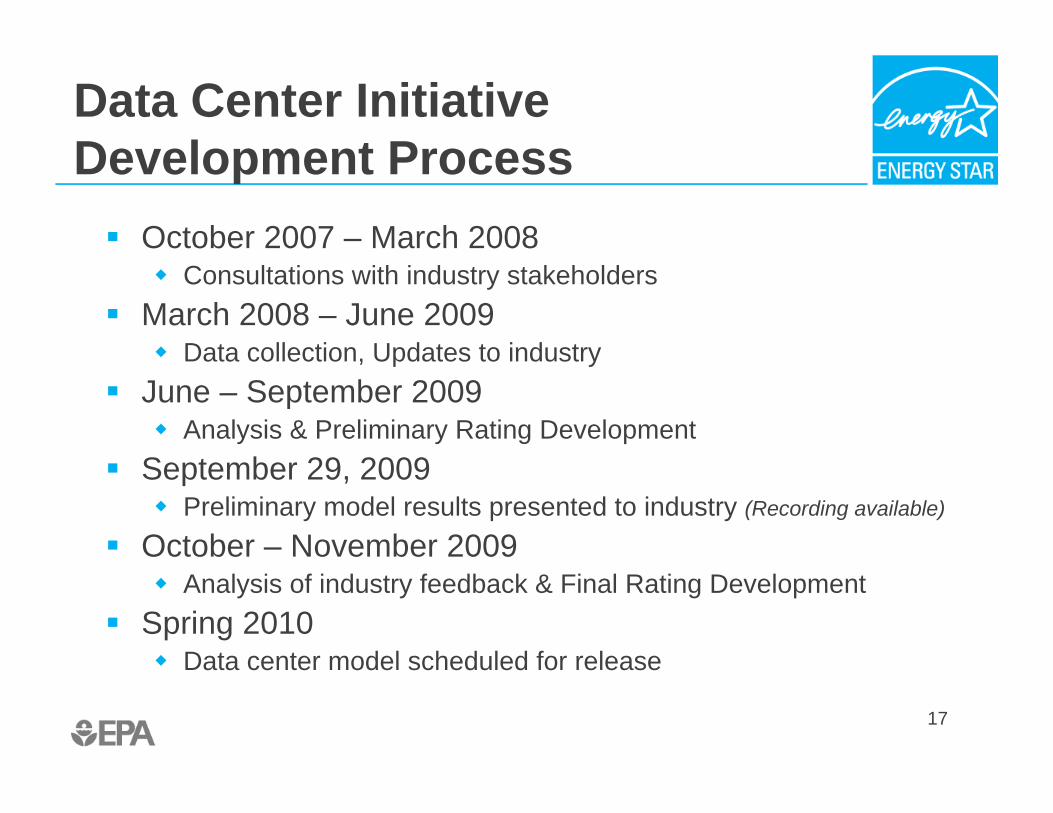
Data Center Initiative Development Process � October 2007 – March 2008 � Consultations with industry stakeholders
� March 2008 – June 2009 � Data collection, Updates to industry
� June – September 2009 � Analysis & Preliminary Rating Development
� September 29, 2009 � Preliminary model results presented to industry (Recording available)
� October – November 2009 � Analysis of industry feedback & Final Rating Development
� Spring 2010 � Data center model scheduled for release
17
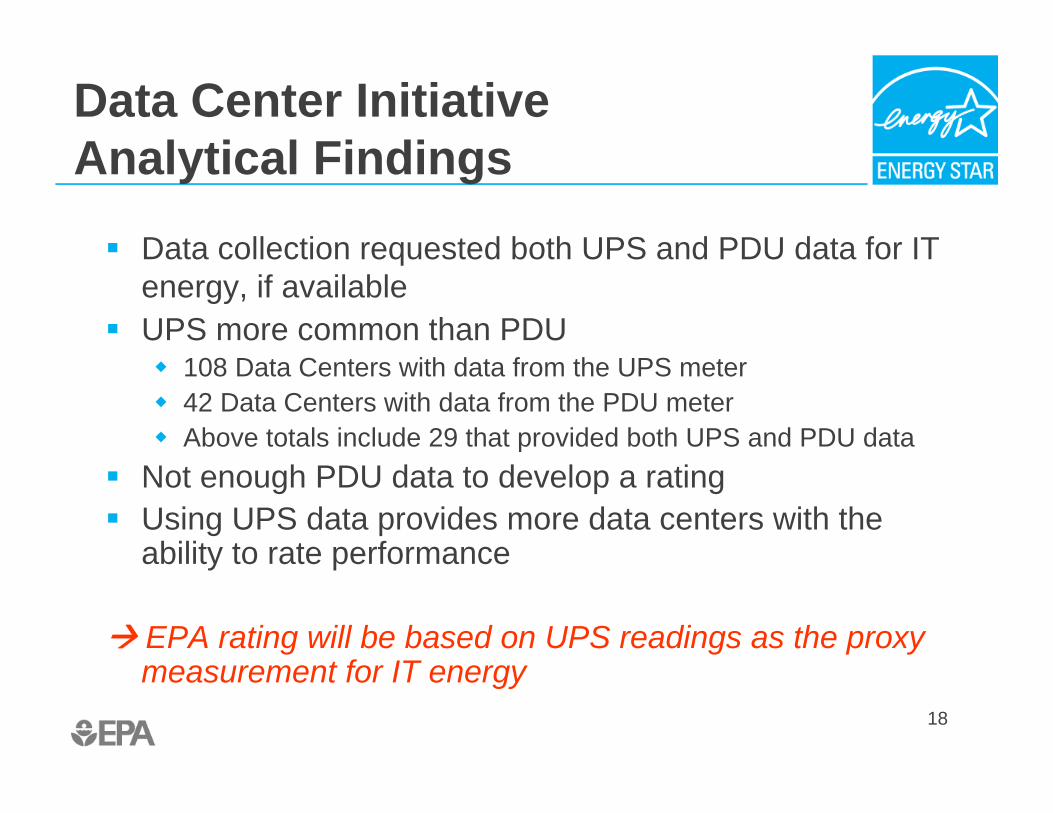
Data Center Initiative Analytical Findings
� Data collection requested both UPS and PDU data for IT energy, if available
� UPS more common than PDU � 108 Data Centers with data from the UPS meter � 42 Data Centers with data from the PDU meter � Above totals include 29 that provided both UPS and PDU data
� Not enough PDU data to develop a rating � Using UPS data provides more data centers with the
ability to rate performance
Æ EPA rating will be based on UPS readings as the proxymeasurement for IT energy
18

Data Center Initiative Analytical Findings � Evaluate data center energy consumption:
Power Usage Effectiveness (PUE) = Total Energy / UPS Energy
� PUE is based on energy, not power � Total Energy includes all fuels (electricity, natural gas, diesel,
etc.) � PUE is based on source energy, not site energy � Source Energy is the total amount of raw fuel required to operate
the building � Results in equitable comparisons for buildings with different fuel
types utilized � For a 100% electric building, the use of source energy will not
change PUE
19

20
0 5
10 15 20 25 30 35
1.01 -
1.25
1.26 -
1.50
1.51 -
1.75
1.76 - 2
.00
2.01 -
2.25
2.26 -
2.50
2.41 -
2.75
2.76 -
3.00
3.01 -
3.25
3.26 -
3.50
3.51 -
3.75
3.76 -
4.00
PUE Ratio
Num
ber o
f Obs
erva
tions
Average PUE = 1.91
PUE Range: 1.25 to 3.75
Distribution of PUE Ratios
Data Center Initiative Analytical Findings � Some surprising results for operating characteristics to
be included/excluded, but these are supported by data � PUE is fairly independent of operating characteristics, as
compared with similar models for commercial buildings � Few operating characteristics expected to be included in
a final model � Relatively low R-squared expected, but still acceptable
Conclusions: � Variability in energy use is more dependent on energy
management practices than operating characteristics � Despite the low R-squared, regression modeling results
in meaningful adjustments for some operatingcharacteristics
21

22
Monthly Energy Consumption Sample Data Center � Sample Data Center shows little variability in monthly
energy consumption � Annual HDD = 4121, annual CDD = 1623
0
100
200
300 400
500
600
700
800
Jan
Feb
Mar Apr May
Jun Jul
Aug
Sep
Oct Nov
Dec
kBtu
/ sq
uare
foot
0
200
400
600
800
1000
1200
Deg
ree
Day
s
kBTU/SF/Month HDD CDD
No peak in energy use for hottest months
23
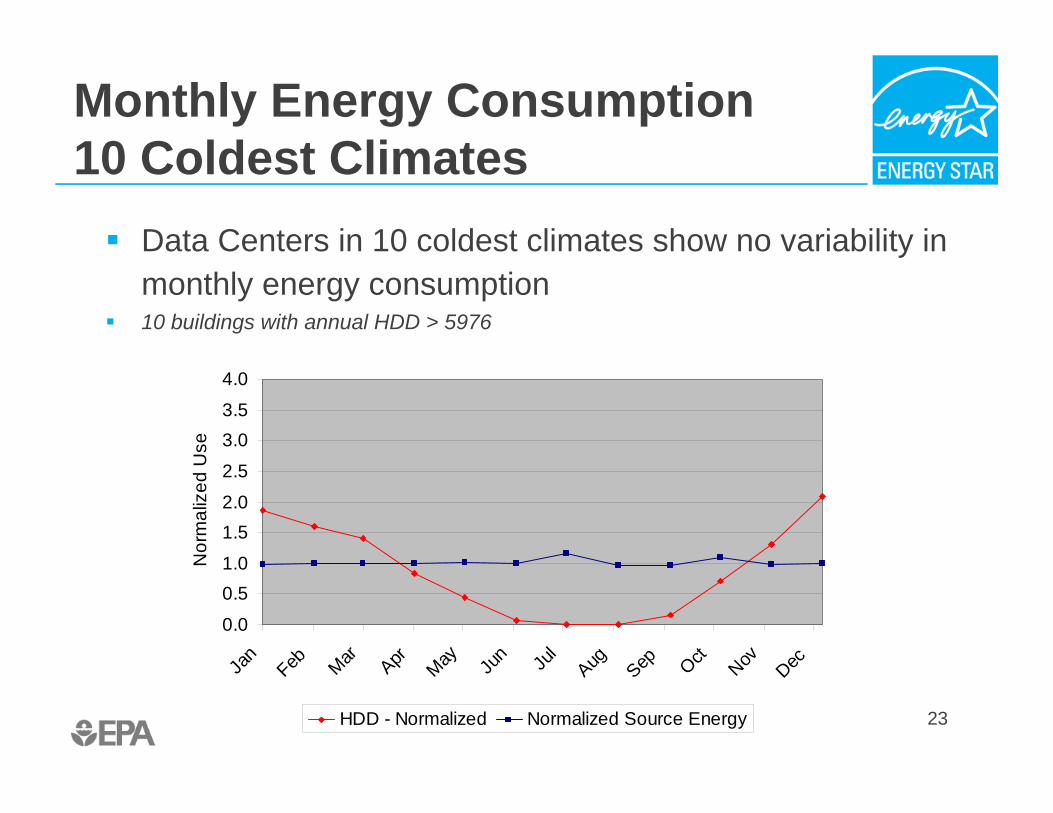
Monthly Energy Consumption 10 Coldest Climates � Data Centers in 10 coldest climates show no variability in
monthly energy consumption � 10 buildings with annual HDD > 5976
0.0
0.5 1.0
1.5 2.0
2.5
3.0 3.5
4.0
Jan
Feb
Mar Apr May
Jun Jul
Aug
Sep
Oct Nov
Dec
Nor
mal
ized
Use
HDD - Normalized Normalized Source Energy
24
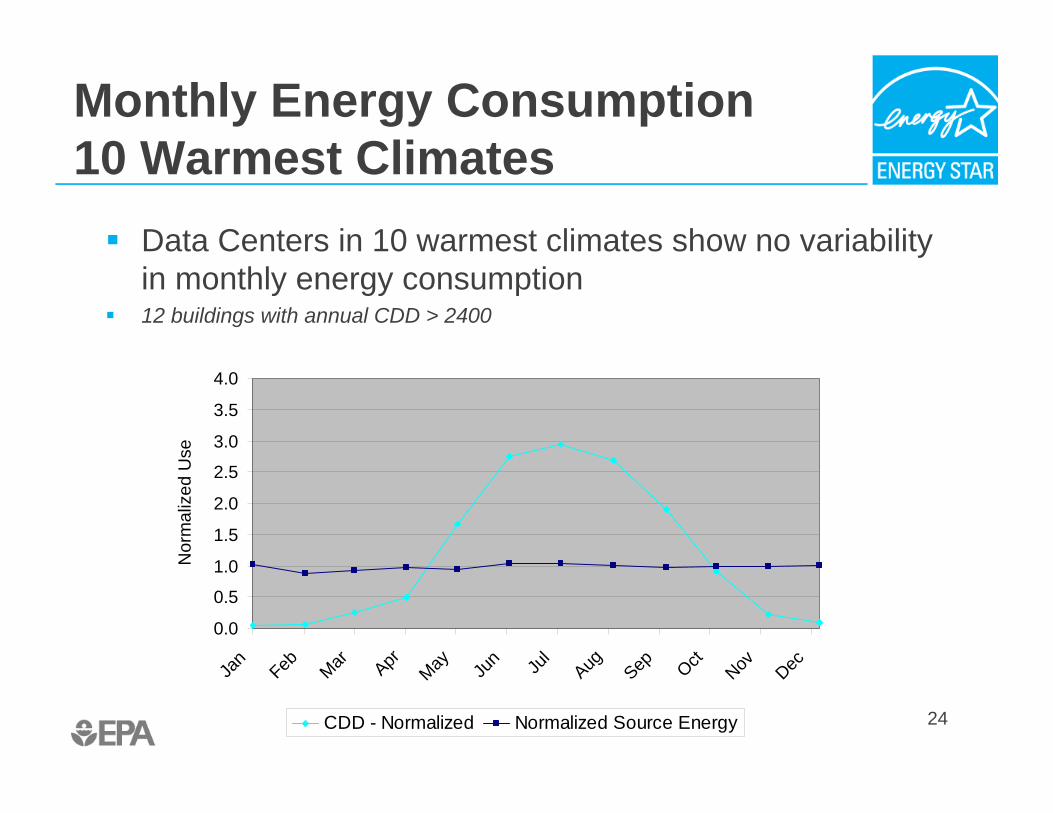
Monthly Energy Consumption 10 Warmest Climates � Data Centers in 10 warmest climates show no variability
in monthly energy consumption � 12 buildings with annual CDD > 2400
0.0
0.5
1.0
1.5
2.0
2.5
3.0
3.5
4.0
Jan
Feb
Mar Apr May
Jun Jul
Aug
Sep
Oct Nov
Dec
Nor
mal
ized
Use
CDD - Normalized Normalized Source Energy
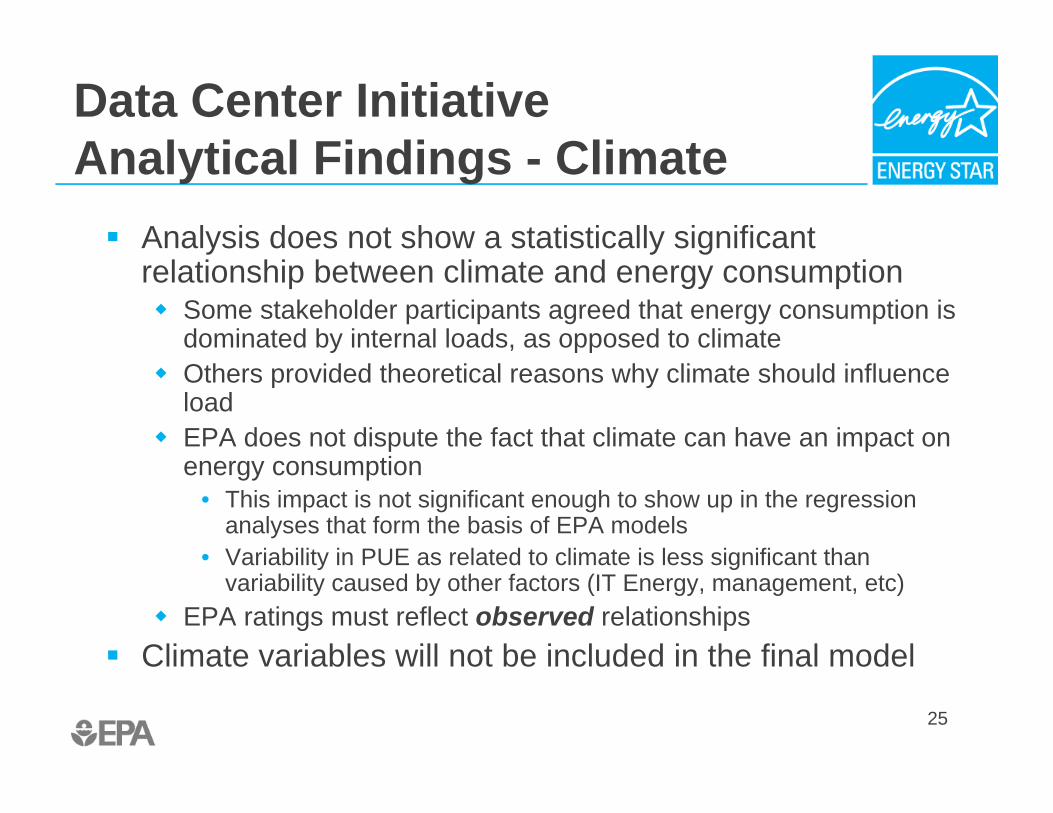
Data Center Initiative Analytical Findings - Climate � Analysis does not show a statistically significant
relationship between climate and energy consumption � Some stakeholder participants agreed that energy consumption is
dominated by internal loads, as opposed to climate � Others provided theoretical reasons why climate should influence
load � EPA does not dispute the fact that climate can have an impact on
energy consumption • This impact is not significant enough to show up in the regression
analyses that form the basis of EPA models • Variability in PUE as related to climate is less significant than
variability caused by other factors (IT Energy, management, etc) � EPA ratings must reflect observed relationships
� Climate variables will not be included in the final model
25
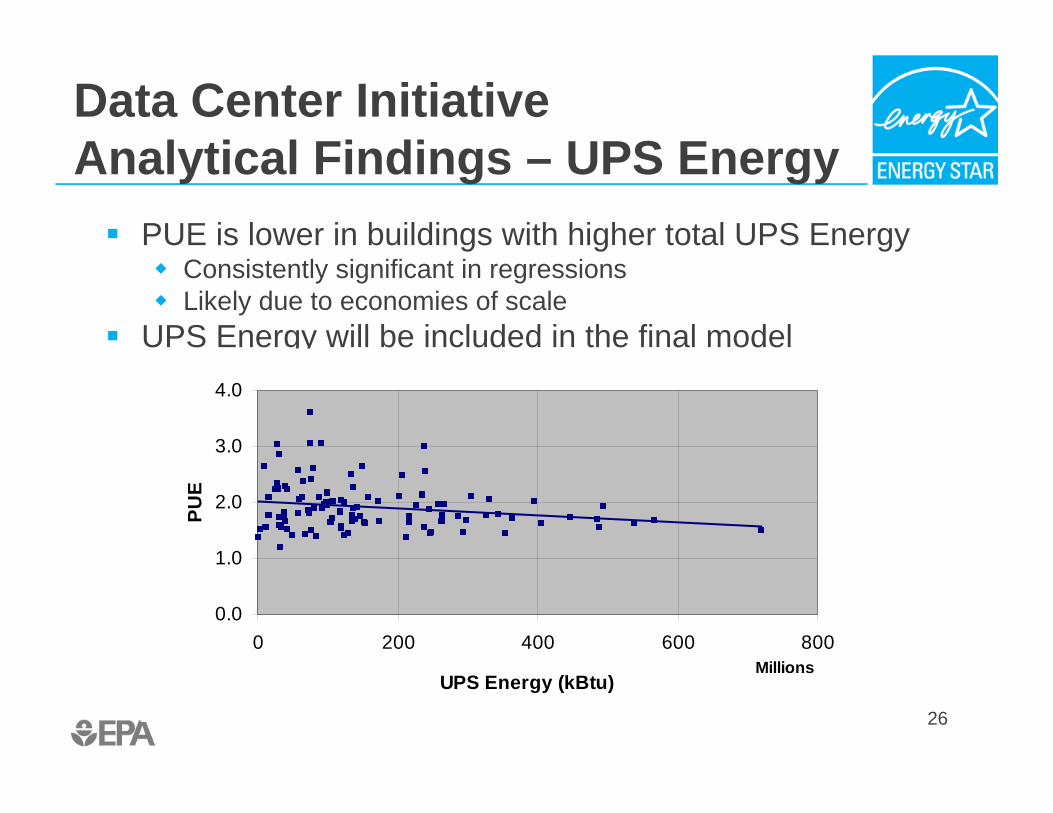
UPS Energy will be included in the final model
26
Data Center Initiative Analytical Findings – UPS Energy � PUE is lower in buildings with higher total UPS Energy � Consistently significant in regressions � Likely due to economies of scale
�
0.0
1.0
2.0
3.0
4.0
0 200 400 600 800 Millions
UPS Energy (kBtu)
PUE

Data Center Initiative Analytical Findings – Tier Level � Tier level did not show strong, statistically significant
correlations with energy consumption � Industry feedback indicated that Tier level should not be
included in a model � Facilities can have multiple Tiers within one data center � Facilities may have unnecessarily high Tier levels thinking
greater redundancy is better, even if it is not required for allcomponents in the data center
� Normalizing for Tier level provides a disincentive for efficientdesign
� Based on industry feedback, Tier will not be included in the final model
� Tier level will not be included in the final model
27

Data Center Initiative Analytical Findings – Type � Data collection included seven types of datacenters � Traditional Enterprise; On-Demand Enterprise; Telecom; High
Performance Computing Center (Scientific); Hosting; Internet; 7 Hybrid � Majority of respondents were traditional enterprise and hosting facilities � No statistically significant correlations were observed between a
particular type and energy consumption � Industry stakeholders recommended that Type was not a good
variable for inclusion in the ENERGY STAR model � Many different categories of data center and even multiple categories
within certain centers � Operators agreed that the data (average PUE values, regression
results) does not support the inclusion of data center type in a model � Type will not be included in the final model
28

Model Selection Process � Multiple factors to evaluate � Regression model statistics (F, p, R2) � Individual variable statistics (t-stats) � Distribution of ratings
• By 10% bin • Average rating • Number and percent above 75 • By Data Center Type
� Residual and rating plots � Physical understanding of results
• Do variables make sense? • Industry feedback
� Magnitude of impacts • How much does each variable affect the model?
� Best model must show a good balance using all criteria
29

Model Recommendation
� Data: 61 Stand Alone Data Centers collected by EPA � Dependent Variable: PUE � Independent Variable: UPS Energy � Overall Model Statistics � R-squared values are low (0.10) for a PUE model because UPS
Energy explains a large percentage of Total Energy � R-squared values for a Total Energy model would be > 0.90 � F-statistic: 7.56 � P-level: .0079
� Individual Variable Statistics � The adjustment for UPS Energy is significant with 99%
confidence � T-statistic is 2.75
30
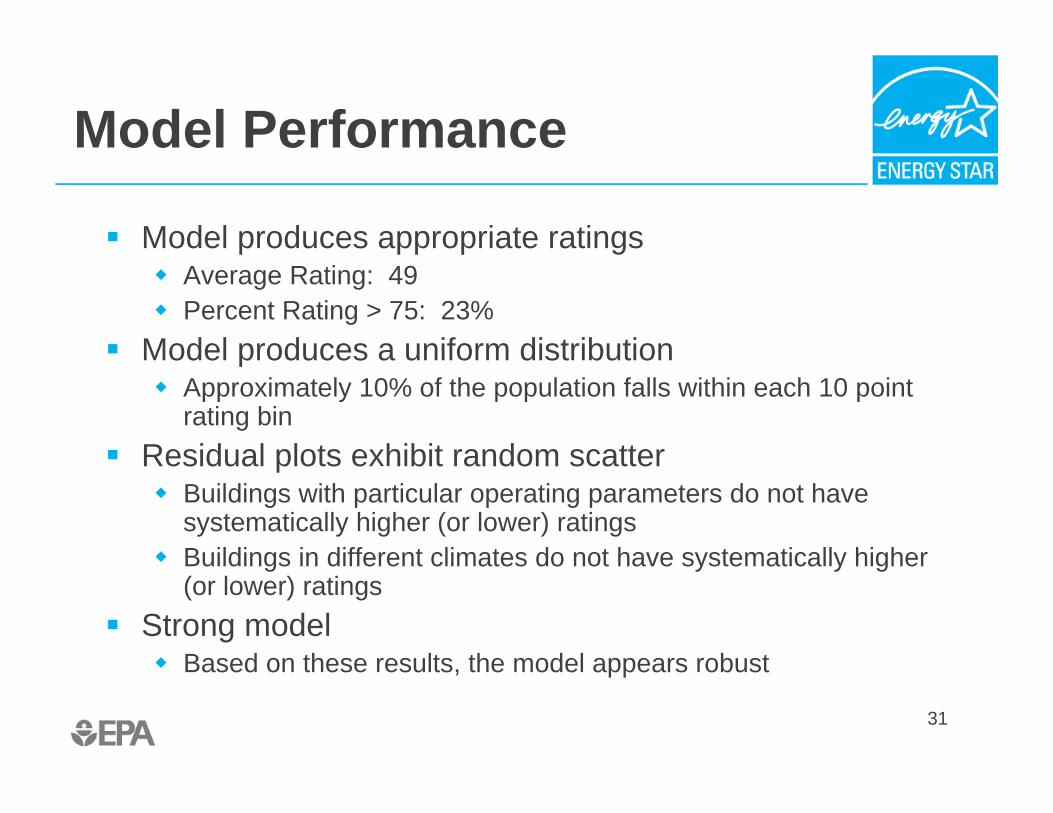
Model Performance
� Model produces appropriate ratings � Average Rating: 49 � Percent Rating > 75: 23%
� Model produces a uniform distribution � Approximately 10% of the population falls within each 10 point
rating bin � Residual plots exhibit random scatter � Buildings with particular operating parameters do not have
systematically higher (or lower) ratings � Buildings in different climates do not have systematically higher
(or lower) ratings � Strong model � Based on these results, the model appears robust
31
32
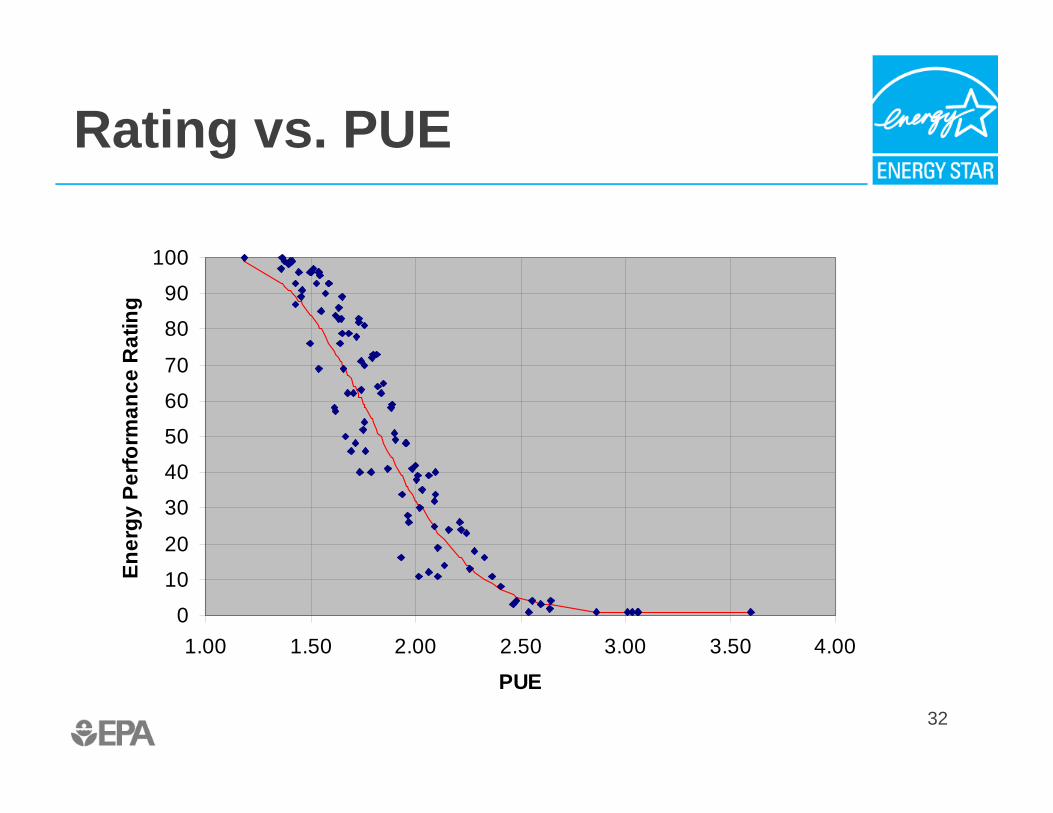
Rating vs. PUE
0
10
20
30
40
50
60
70
80
90
100
1.00 1.50 2.00 2.50 3.00 3.50 4.00
PUE
Ener
gy P
erfo
rman
ce R
atin
g

33
Rating vs. UPS Energy
0 10 20 30 40 50 60 70 80 90
100
0 200 400 600 800 MillionsUPS Energy (kBtu)
Ener
gy P
erfo
rman
ce R
atin
g

34
Rating vs. HDD
0
10
20
30
40
50
60
70
80
90
100
0 1000 2000 3000 4000 5000 6000 7000 8000 9000
Heating Degree Days
Ener
gy P
erfo
rman
ce R
atin
g

35
Rating vs. CDD
0
10
20
30
40
50
60
70
80
90
100
0 1000 2000 3000 4000 5000
Cooling Degree Days
Ener
gy P
erfo
rman
ce R
atin
g

36
Rating vs. Tier
0
10
20
30
40
50
60
70
80
90
100
1 2 3 4
Tier Level
Ener
gy P
erfo
rman
ce R
atin
g
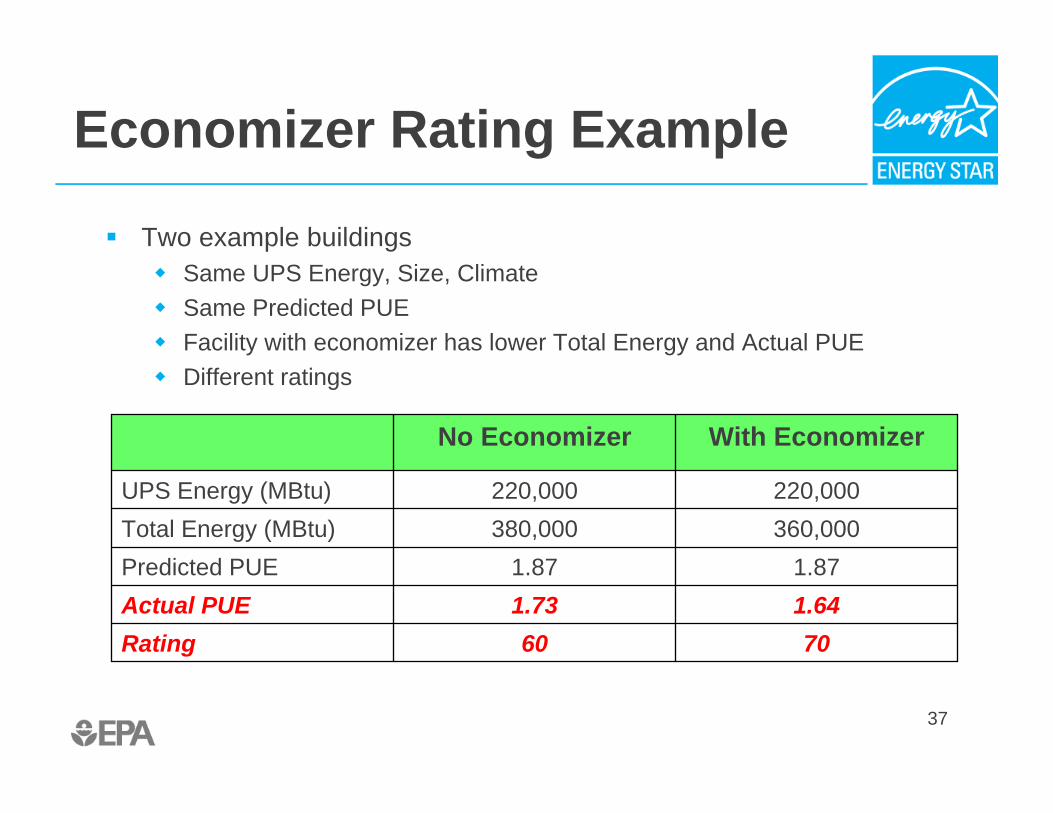
Economizer Rating Example
� Two example buildings � Same UPS Energy, Size, Climate � Same Predicted PUE � Facility with economizer has lower Total Energy and Actual PUE � Different ratings
No Economizer With Economizer
UPS Energy (MBtu) 220,000 220,000 Total Energy (MBtu) 380,000 360,000 Predicted PUE 1.87 1.87 Actual PUE 1.73 1.64 Rating 60 70
37
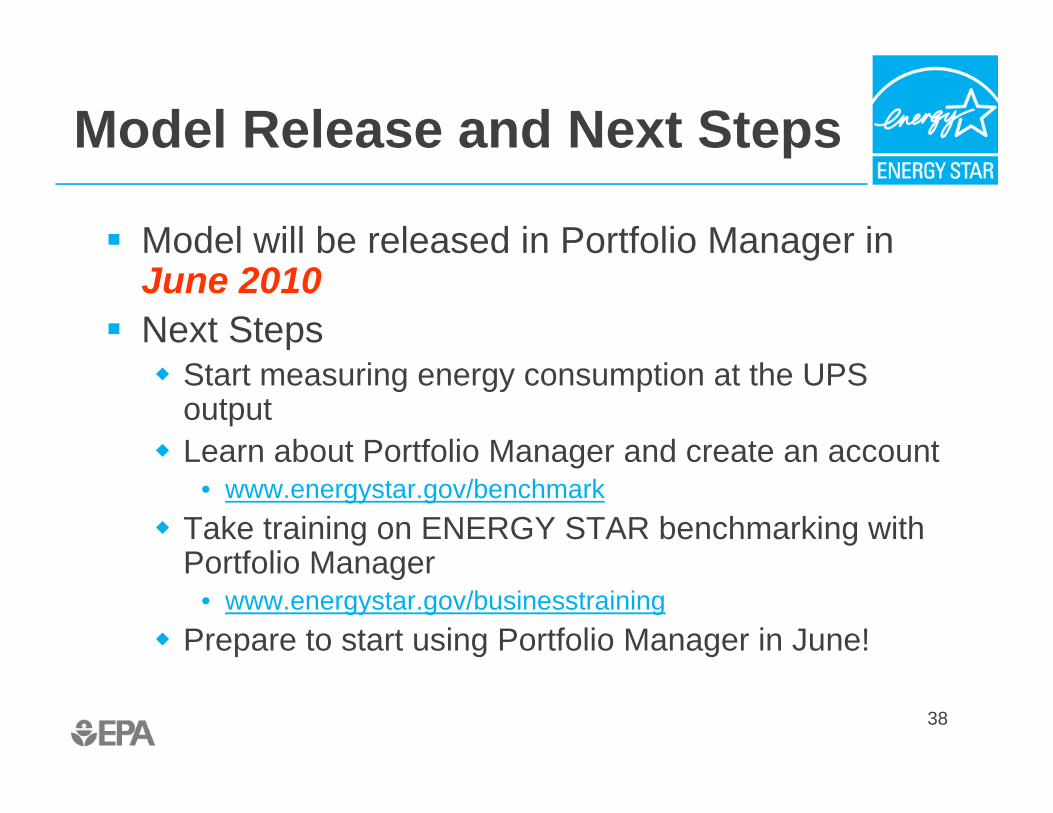
Model Release and Next Steps
� Model will be released in Portfolio Manager inJune 2010 � Next Steps � Start measuring energy consumption at the UPS
output � Learn about Portfolio Manager and create an account
• www.energystar.gov/benchmark � Take training on ENERGY STAR benchmarking with
Portfolio Manager • www.energystar.gov/businesstraining
� Prepare to start using Portfolio Manager in June!
38