Embed Size (px)
Citation preview
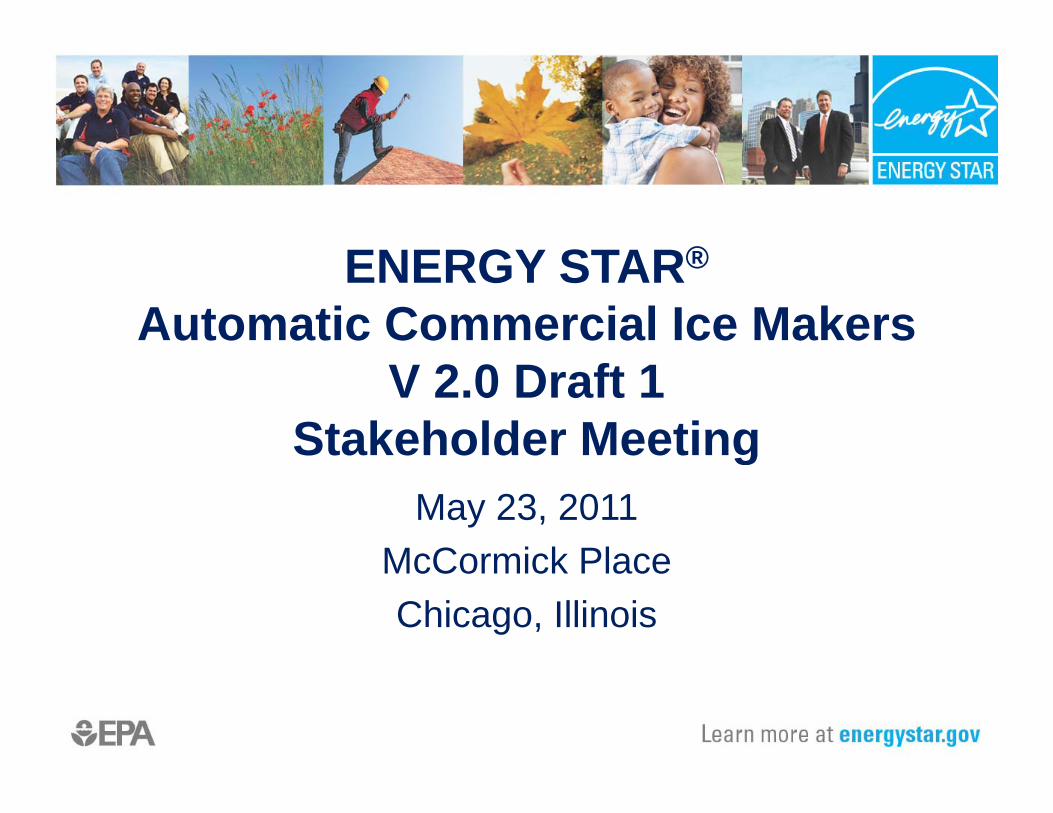
ENERGY STAR®ENERGY STAR®
Automatic Commercial Ice MakersV 2.0 Draft 1
Stakeholder MeetinggMay 23, 2011
McCormick PlaceMcCormick PlaceChicago, Illinois
Purpose of Revisionp
• ENERGY STAR market penetration is 42% for air cooled pcube-type; opportunity for additional energy savings
• Expand the scope to include flake and nuggetExpand the scope to include flake and nugget continuous type ice makers
• Update test standard references (AHRI 810-2007 and• Update test standard references (AHRI 810-2007 and ASHRAE 29-2009)
Ali ith th DOE TP NOPR d l t l t• Align with the DOE TP NOPR and evaluate relevant energy efficiency initiatives for harmonization opportunities.pp
Definition Changesg
• EPA proposes the following definition changes aligning p p g g g gwith AHRI 810-2007, ASHRAE 29-2009, and DOE TP NOPR
“A t ti C i l I M k ” th th– “Automatic Commercial Ice Makers” rather than “Commercial Ice Machines”
– “Batch-Type” rather than “Cube-Type”Batch Type rather than Cube Type– Adding “Continuous-Type”
Product Categoriesg
• EPA proposes three overall product categories: Batch, N t d Fl kNugget, and Flake– Defines the three major ice product types
According to manufacturer input consumer purchase is– According to manufacturer input consumer purchase is highly dependent on the desired ice product and application
Product Categoriesg
• EPA proposes preserving the IMH, RCU, and SCU p p p g , ,categories– Systems cannot be easily interchanged based on
li ti i t ll ti d th f ilit dapplication, installation needs, the facility, and space.
• EPA proposes excluding RCU w/ remote compressor until a• EPA proposes excluding RCU w/ remote compressor until a workable test method is developed to account for total energy use
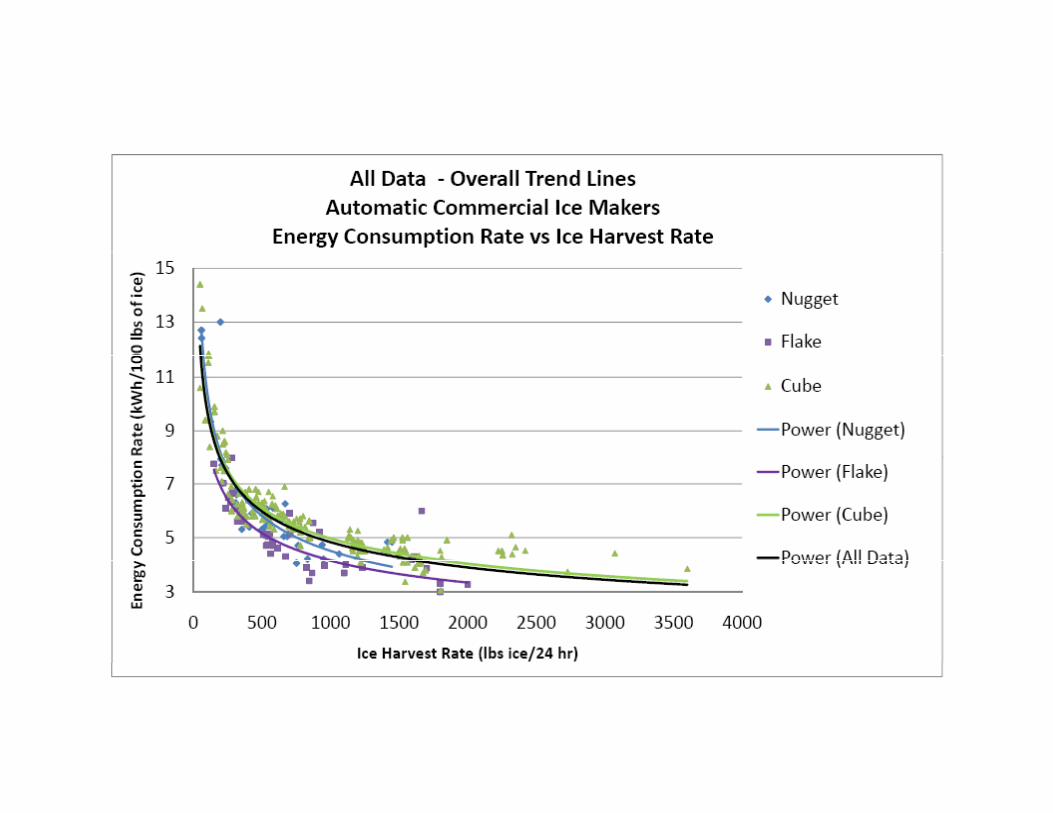
EPA Data Set and Methodologygy
• Data set combines • Non-ENERGY STAR models listed in the AHRI
Certified Product Directory• Models on ENERGY STAR QP list• Models on ENERGY STAR QP list• Flake and nugget models provided by manufacturers
• Utilized a 25% qualification rate goal as well as other ENERGY STAR guiding principles
• Developed power curves for setting energy consumption rate levels and removed harvest bin categories
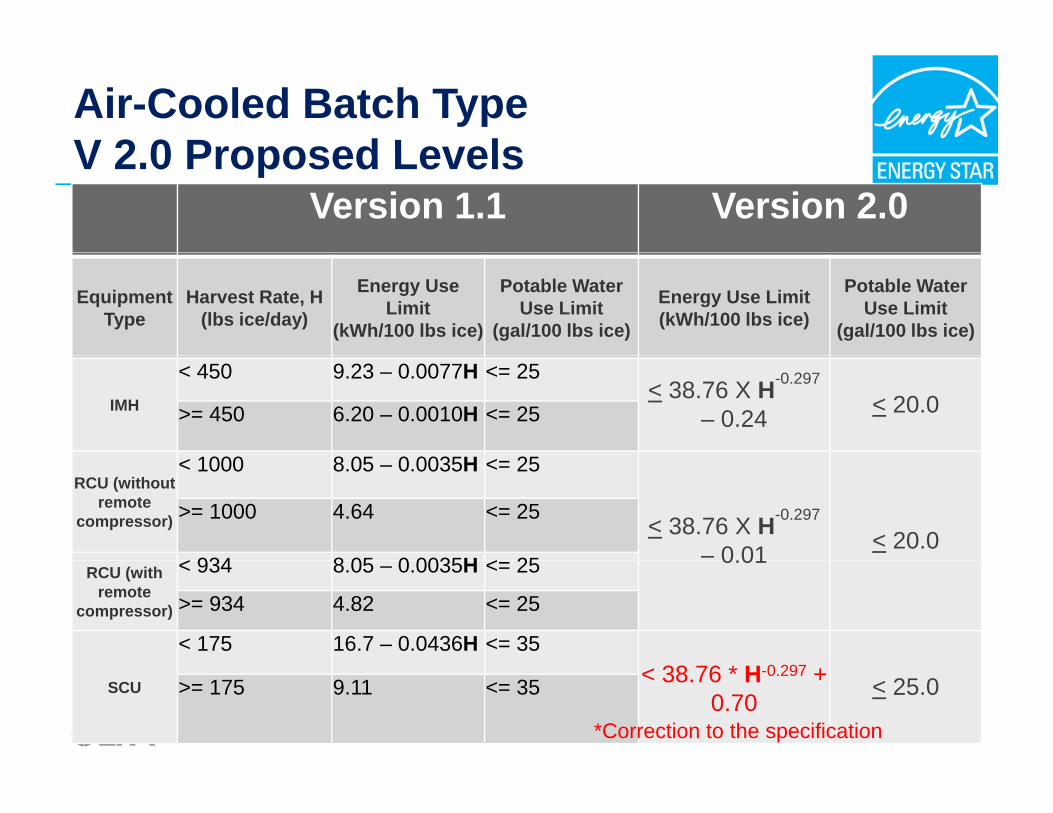
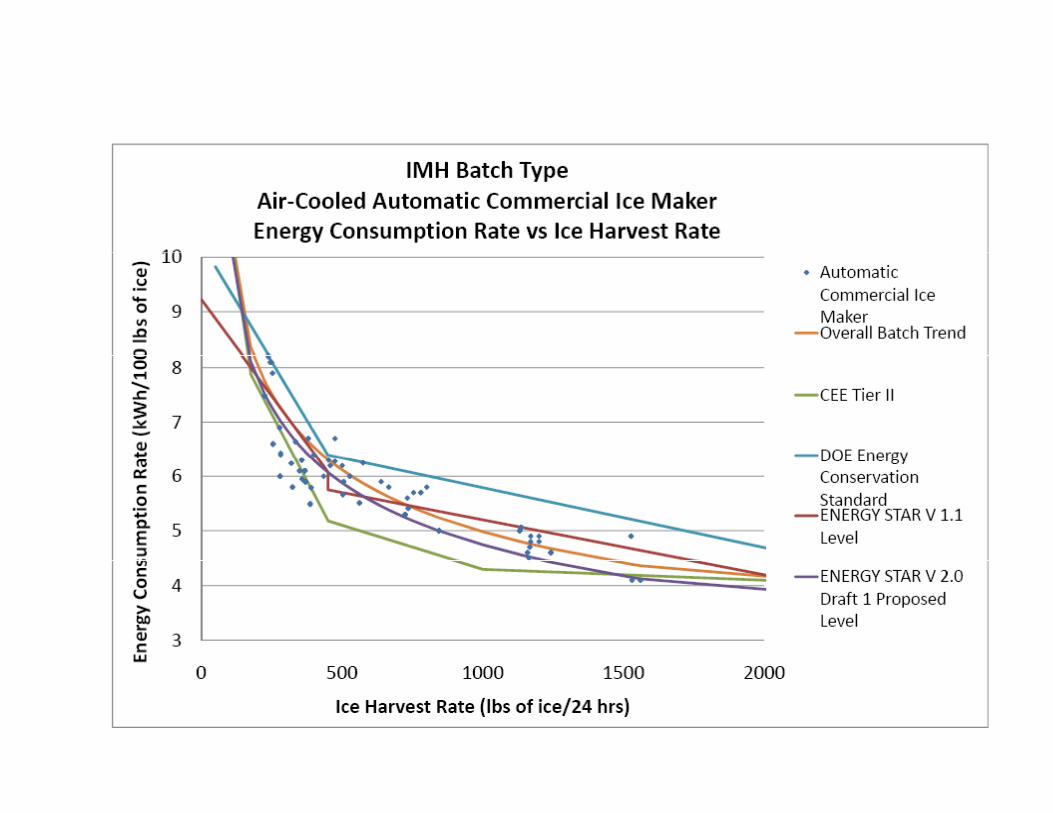
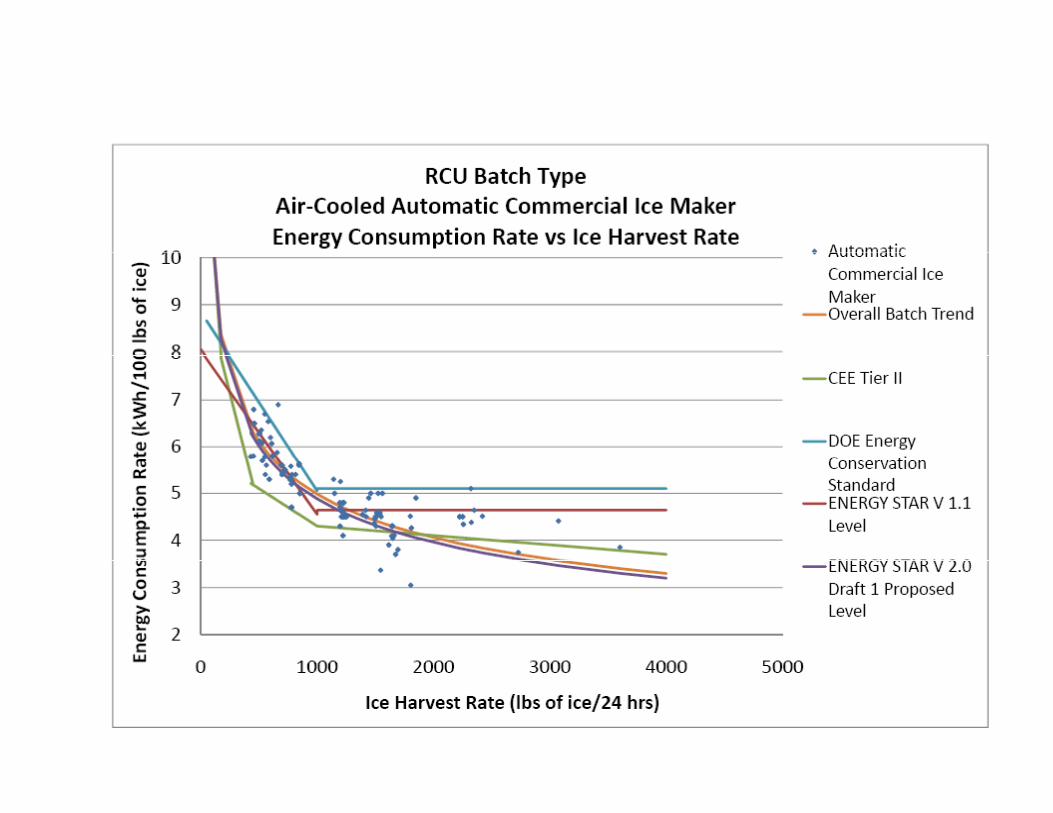
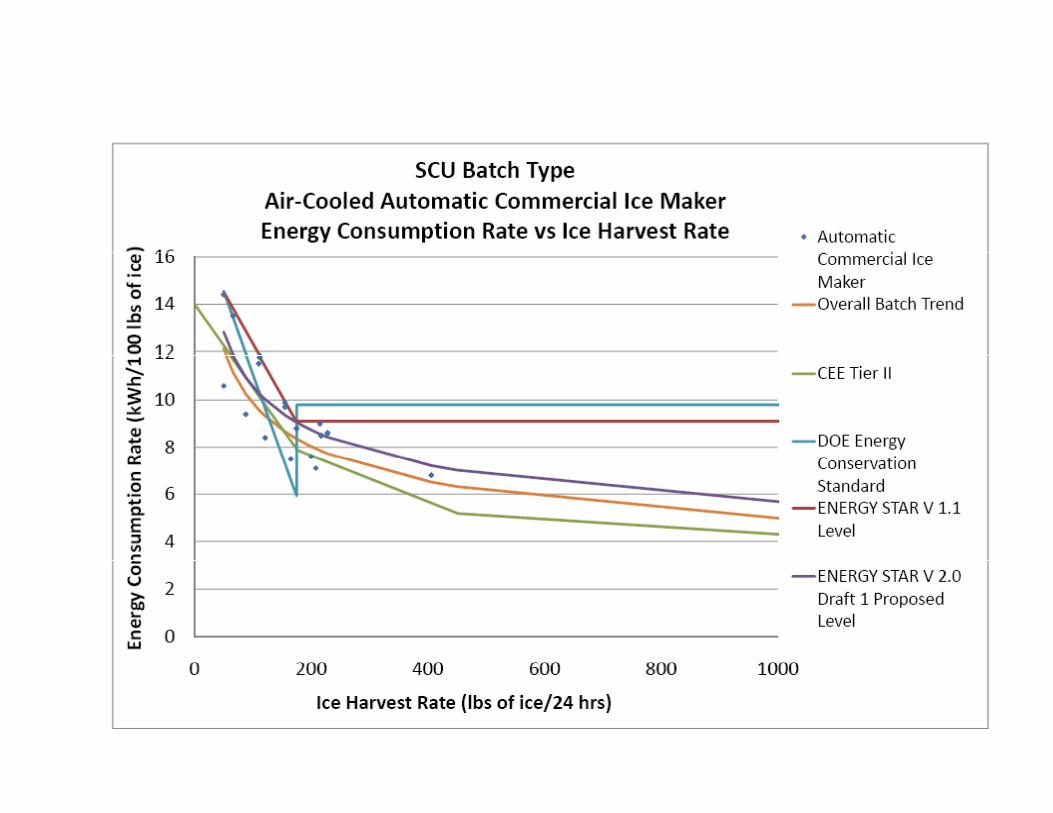
Air-Cooled Batch TypeV 2 0 Proposed LevelsV 2.0 Proposed Levels
Version 1.1 Version 2.0
Equipment Type
Harvest Rate, H (lbs ice/day)
Energy Use Limit
(kWh/100 lbs ice)
Potable Water Use Limit
(gal/100 lbs ice)
Energy Use Limit (kWh/100 lbs ice)
Potable Water Use Limit
(gal/100 lbs ice)
IMH
< 450 9.23 – 0.0077H <= 25< 38.76 X H-0.297
– 0.24 < 20.0>= 450 6.20 – 0.0010H <= 25
1000 8 05 0 0035H 25RCU (without
remote compressor)
< 1000 8.05 – 0.0035H <= 25
< 38.76 X H-0.297
– 0.01 < 20.0>= 1000 4.64 <= 25
< 934 8 05 0 0035H < 25 0.01RCU (with
remote compressor)
< 934 8.05 – 0.0035H <= 25
>= 934 4.82 <= 25
< 175 16.7 – 0.0436H <= 35
SCU < 38.76 * H-0.297 + 0.70
< 25.0>= 175 9.11 <= 35
*Correction to the specification
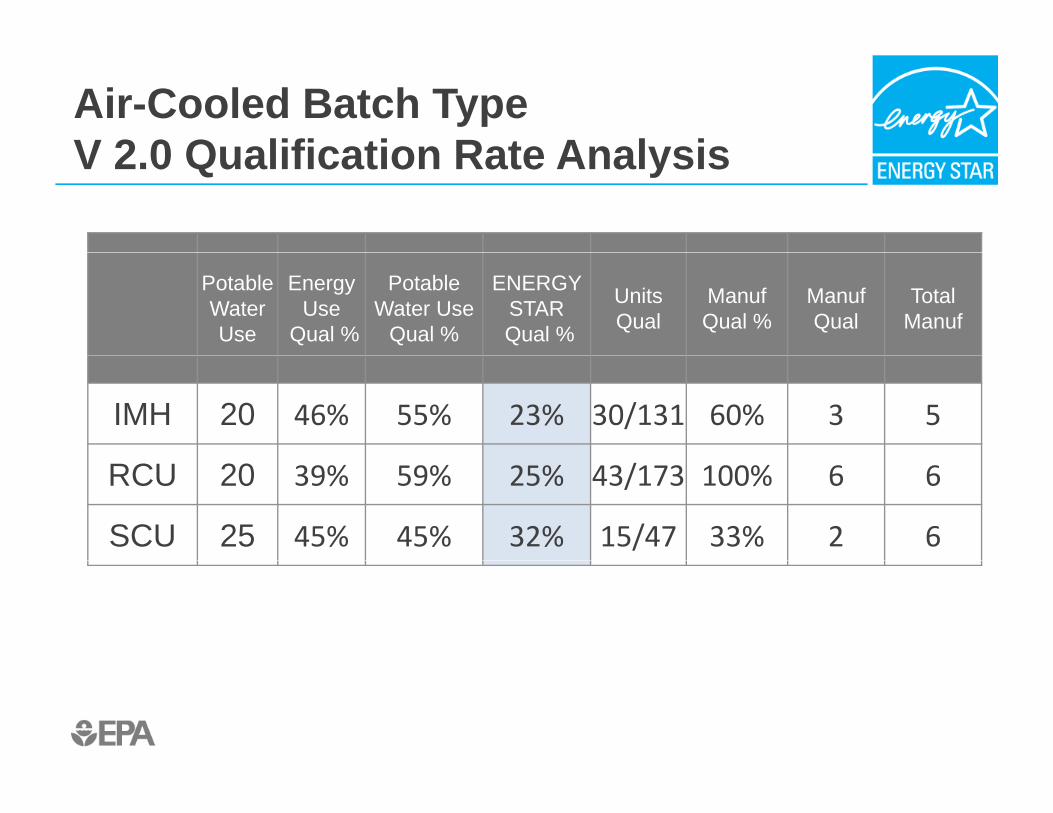
Air-Cooled Batch TypeV 2 0 Qualification Rate AnalysisV 2.0 Qualification Rate Analysis
Potable WaterUse
Energy Use
Qual %
Potable Water Use
Qual %
ENERGY STARQual %
Units Qual
ManufQual %
ManufQual
Total Manuf
IMH 20 46% 55% 23% 30/131 60% 3 5
RCU 20 39% 59% 25% 43/173 100% 6 6
SCU 25 45% 45% 32% 15/47 33% 2 6
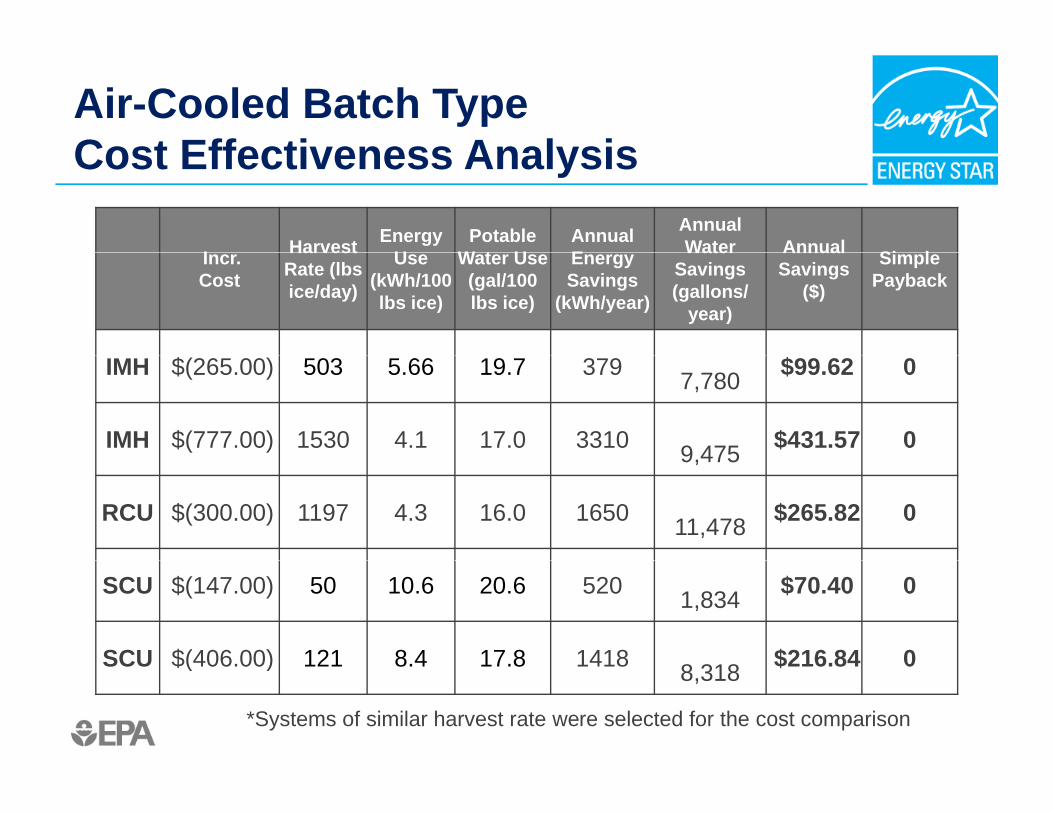
Air-Cooled Batch TypeCost Effectiveness AnalysisCost Effectiveness Analysis
I Harvest Energy U
Potable W t U
Annual E
Annual Water Annual Si lIncr.
Cost
Harvest Rate (lbs ice/day)
Use (kWh/100 lbs ice)
Water Use (gal/100 lbs ice)
Energy Savings
(kWh/year)
Water Savings (gallons/
year)
Annual Savings
($)
Simple Payback
IMH $(265.00) 503 5.66 19.7 379 7,780 $99.62 0
IMH $(777.00) 1530 4.1 17.0 3310 9 475 $431.57 09,475
RCU $(300.00) 1197 4.3 16.0 1650 11,478 $265.82 0
SCU $(147.00) 50 10.6 20.6 520 1,834 $70.40 0
SCU $(406 00) 121 8 4 17 8 1418 $216 84 0SCU $(406.00) 121 8.4 17.8 1418 8,318 $216.84 0
*Systems of similar harvest rate were selected for the cost comparison
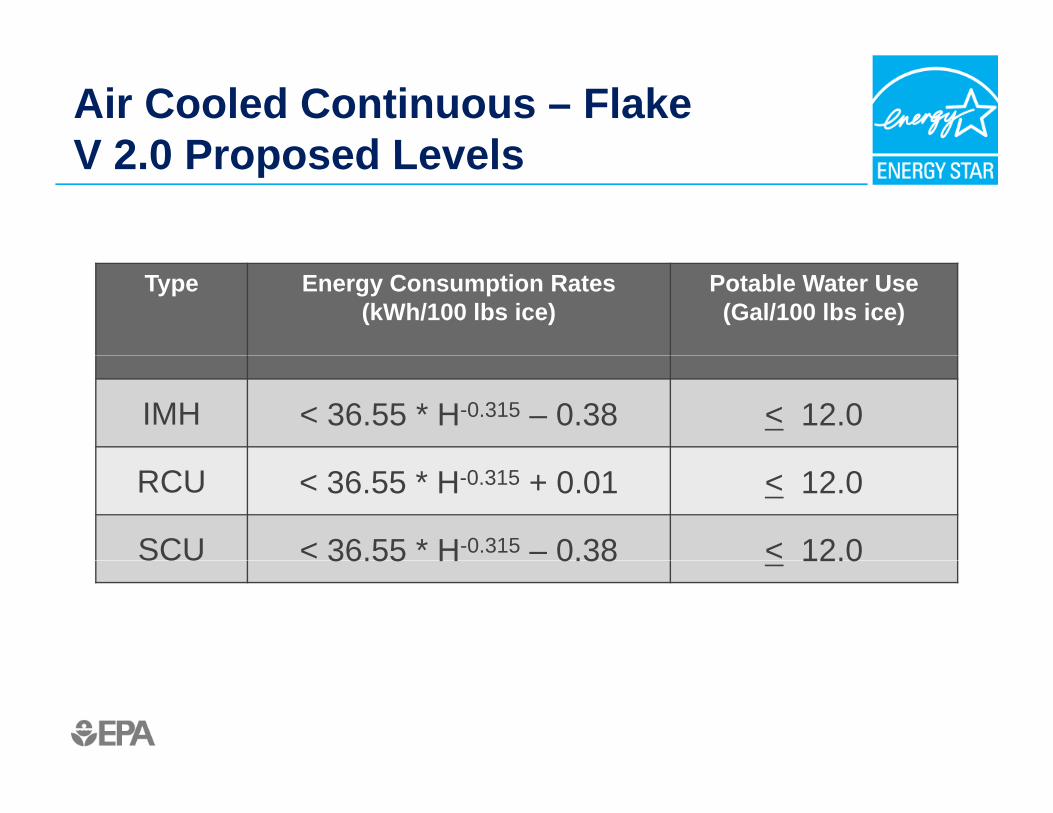
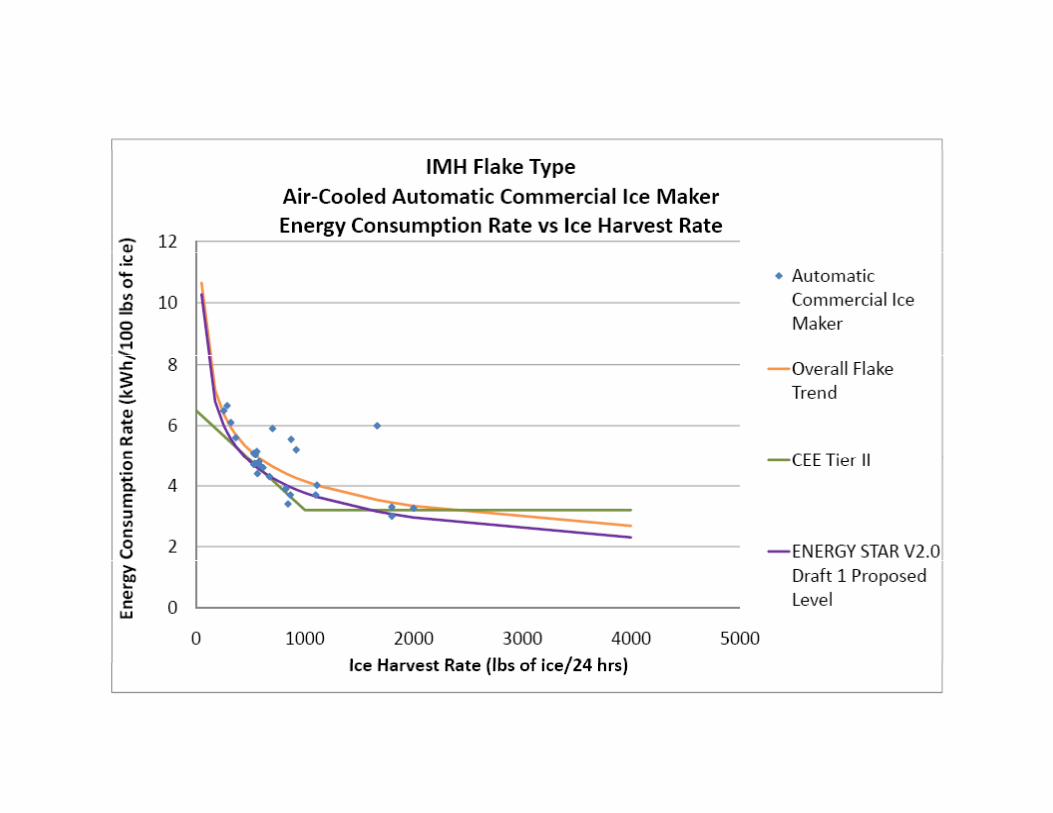
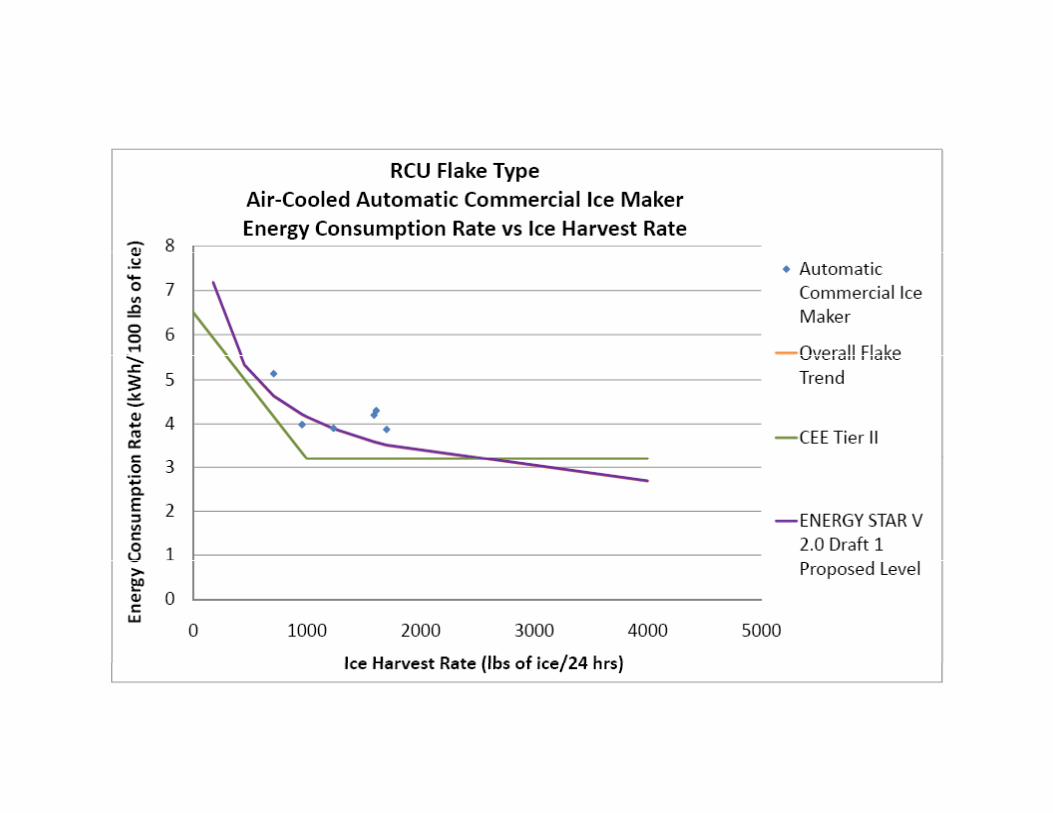
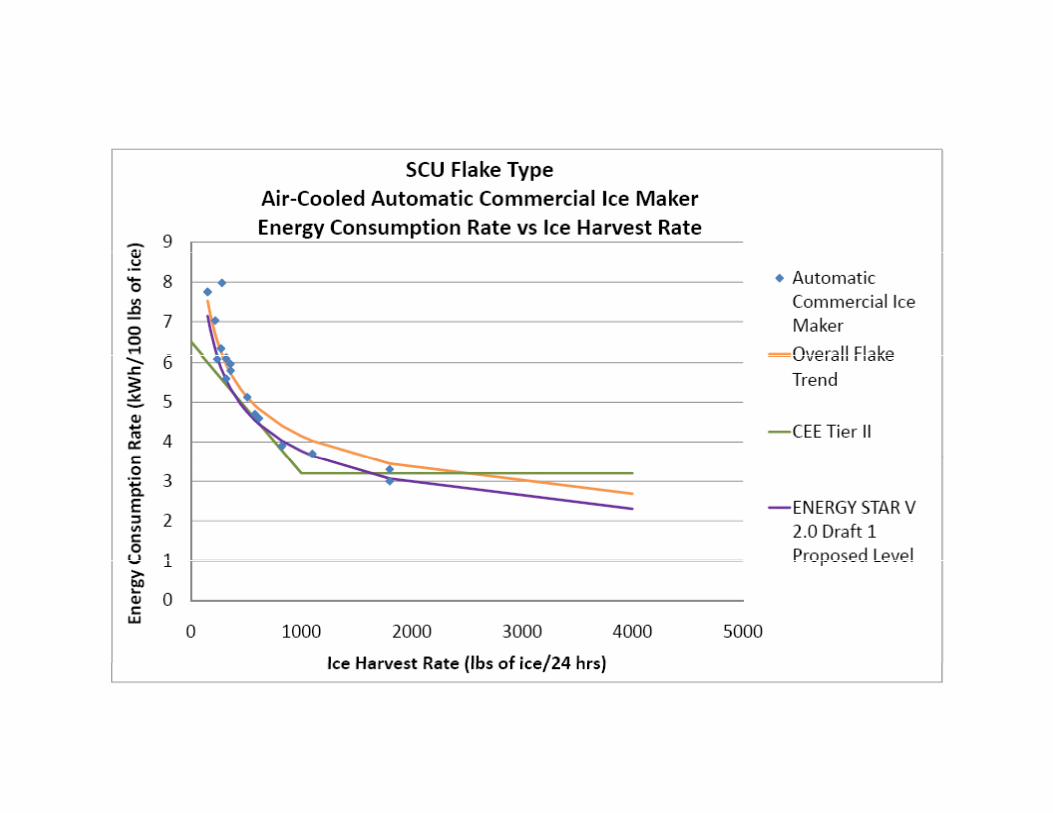
Air Cooled Continuous – FlakeV 2 0 Proposed LevelsV 2.0 Proposed Levels
Type Energy Consumption Rates(kWh/100 lbs ice)
Potable Water Use(Gal/100 lbs ice)
IMH < 36.55 * H-0.315 – 0.38 < 12.0
RCU < 36.55 * H-0.315 + 0.01 < 12.0
SCU < 36.55 * H-0.315 – 0.38 < 12.0SCU 36.55 H 0.38 12.0
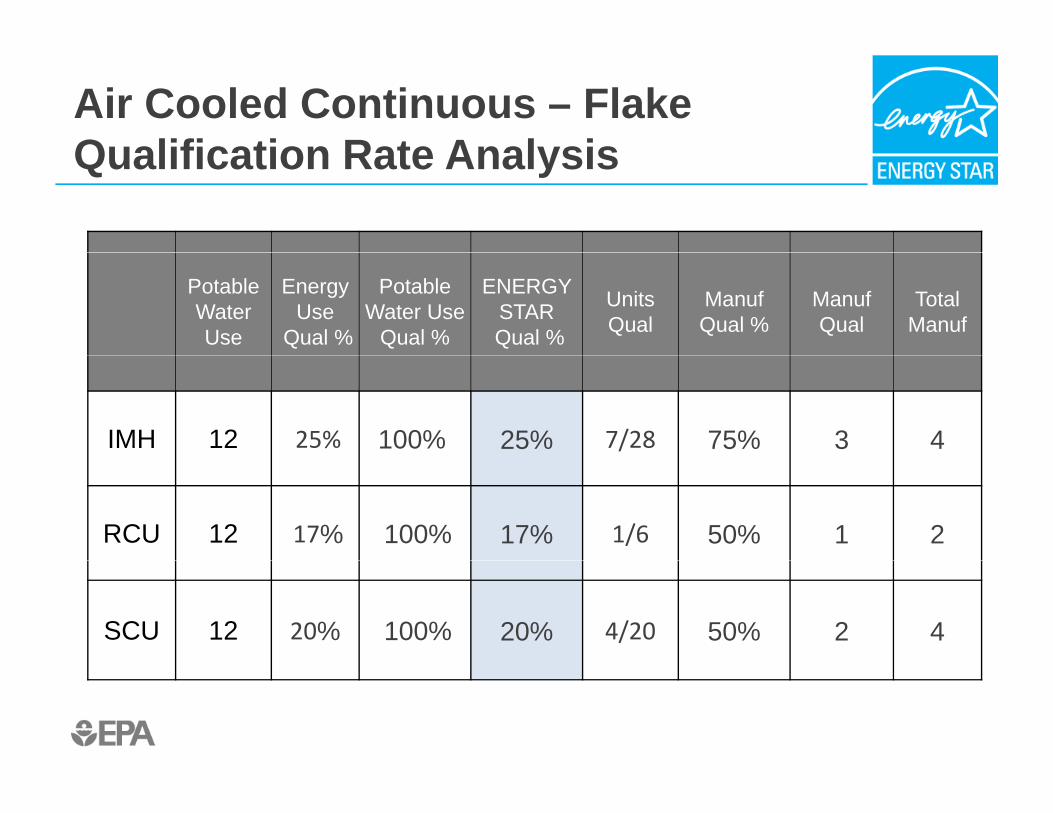
Air Cooled Continuous – FlakeQualification Rate AnalysisQualification Rate Analysis
Potable WaterUse
Energy Use
Qual %
Potable Water Use
Qual %
ENERGY STARQual %
Units Qual
ManufQual %
ManufQual
Total Manuf
IMH 12 25% 100% 25% 7/28 75% 3 4
RCU 12 17% 100% 17% 1/6 50% 1 2
SCU 12 20% 100% 20% 4/20 50% 2 4
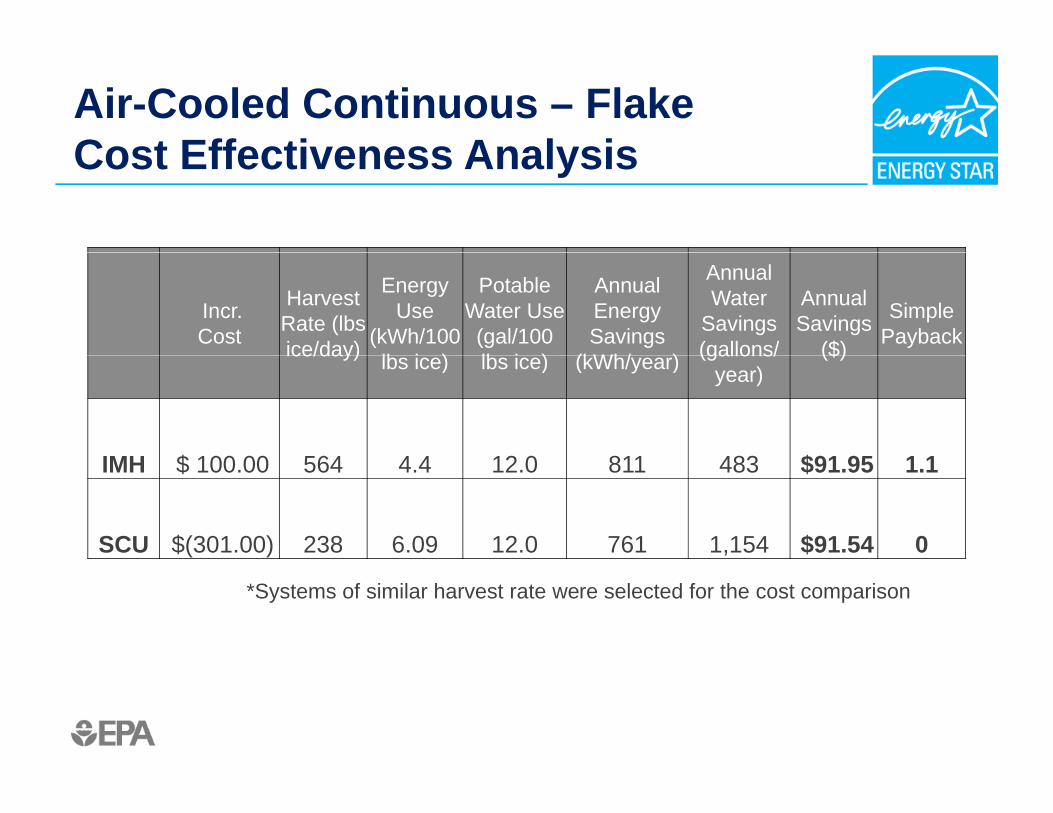
Air-Cooled Continuous – FlakeCost Effectiveness AnalysisCost Effectiveness Analysis
Incr.Cost
Harvest Rate (lbs ice/day)
Energy Use
(kWh/100 lb i )
Potable Water Use (gal/100 lb i )
Annual Energy Savings
(kWh/ )
Annual Water
Savings (gallons/
Annual Savings
($)
Simple Paybackice/day) lbs ice) lbs ice) (kWh/year) (gallons/
year)($)
IMH $ 100 00 564 4 4 12 0 811 483 $91 95 1 1IMH $ 100.00 564 4.4 12.0 811 483 $91.95 1.1
SCU $(301.00) 238 6.09 12.0 761 1,154 $91.54 0
*Systems of similar harvest rate were selected for the cost comparison
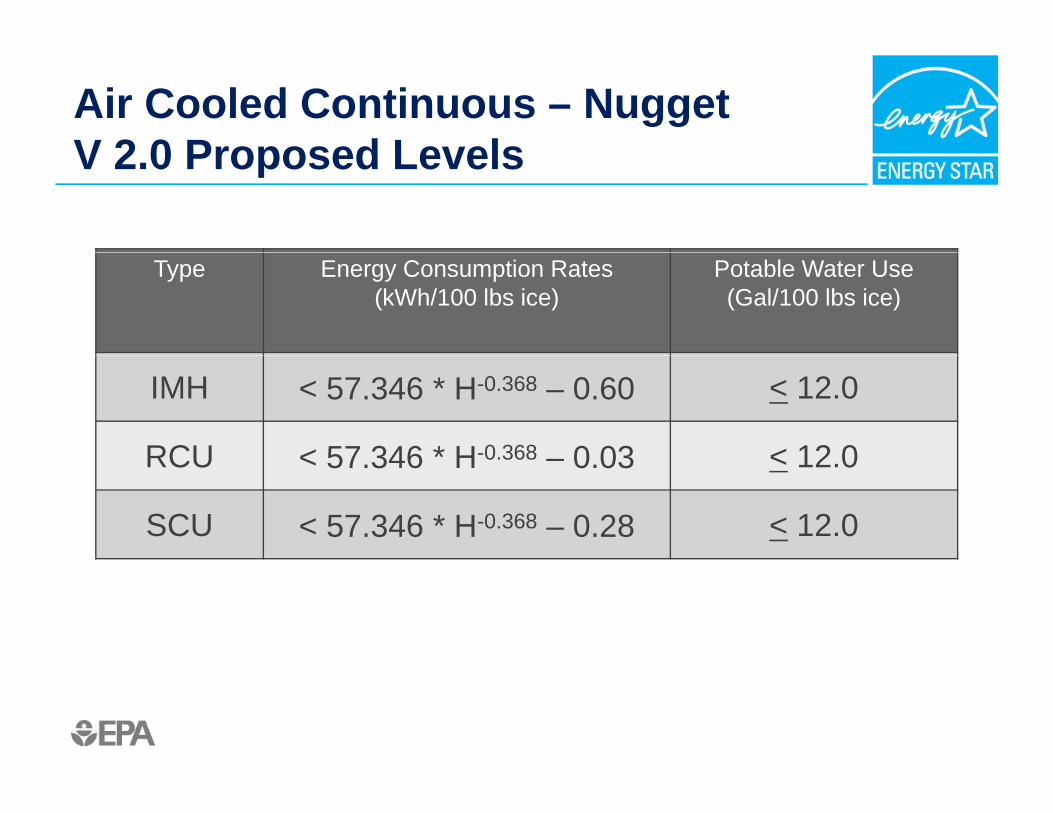
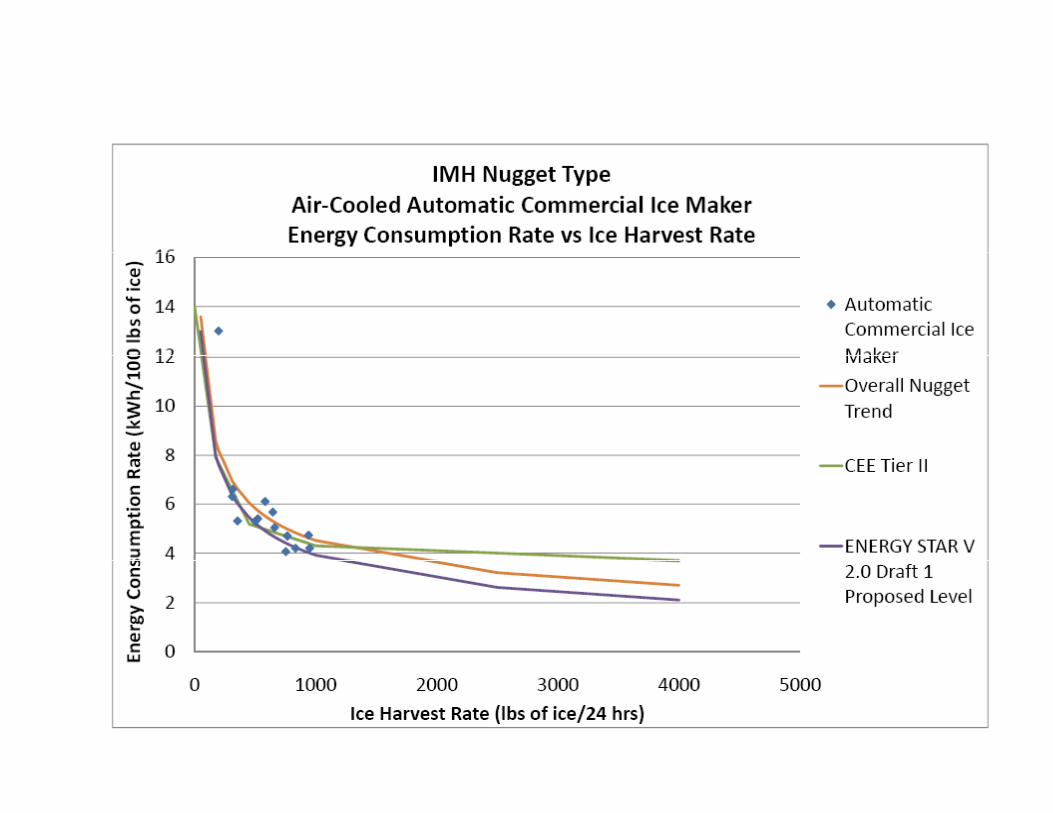
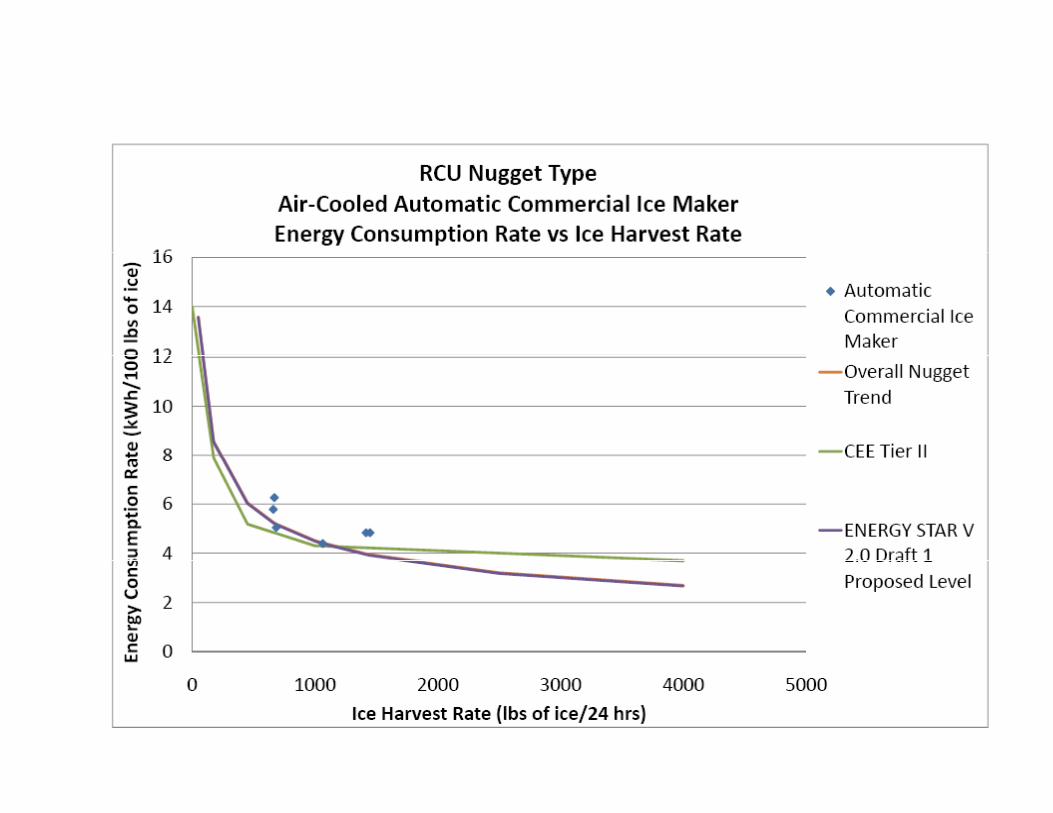
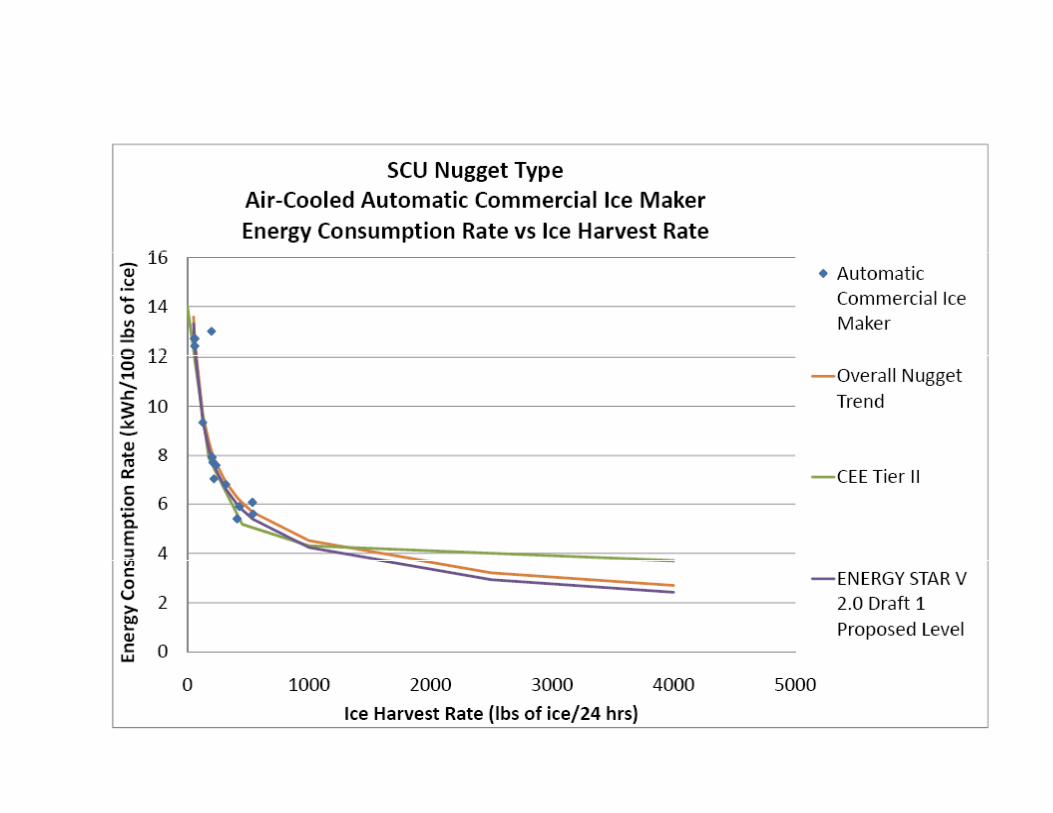
Air Cooled Continuous – NuggetV 2 0 Proposed LevelsV 2.0 Proposed Levels
Type Energy Consumption Rates(kWh/100 lbs ice)
Potable Water Use(Gal/100 lbs ice)
IMH < 57.346 * H-0.368 – 0.60 < 12.0
RCU < 57 346 * H-0.368 0 03 < 12 0RCU < 57.346 H 0.368 – 0.03 < 12.0
SCU < 57.346 * H-0.368 – 0.28 < 12.0
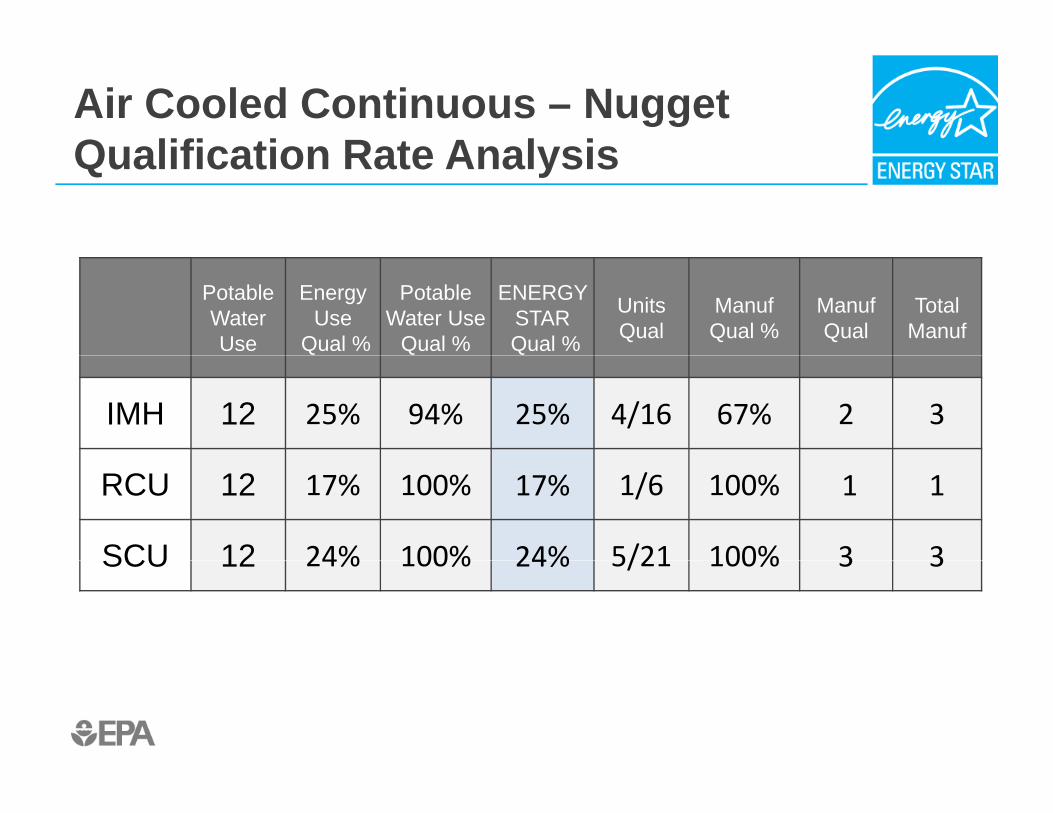
Air Cooled Continuous – NuggetQualification Rate AnalysisQualification Rate Analysis
Potable WaterUse
Energy Use
Qual %
Potable Water Use
Qual %
ENERGY STARQual %
Units Qual
ManufQual %
ManufQual
Total Manuf
IMH 12 25% 94% 25% 4/16 67% 2 3
RCU 12 17% 100% 17% 1/6 100% 1 1
SCU 12 24% 100% 24% 5/21 100% 3 3SCU 12 24% 100% 24% 5/21 100% 3 3
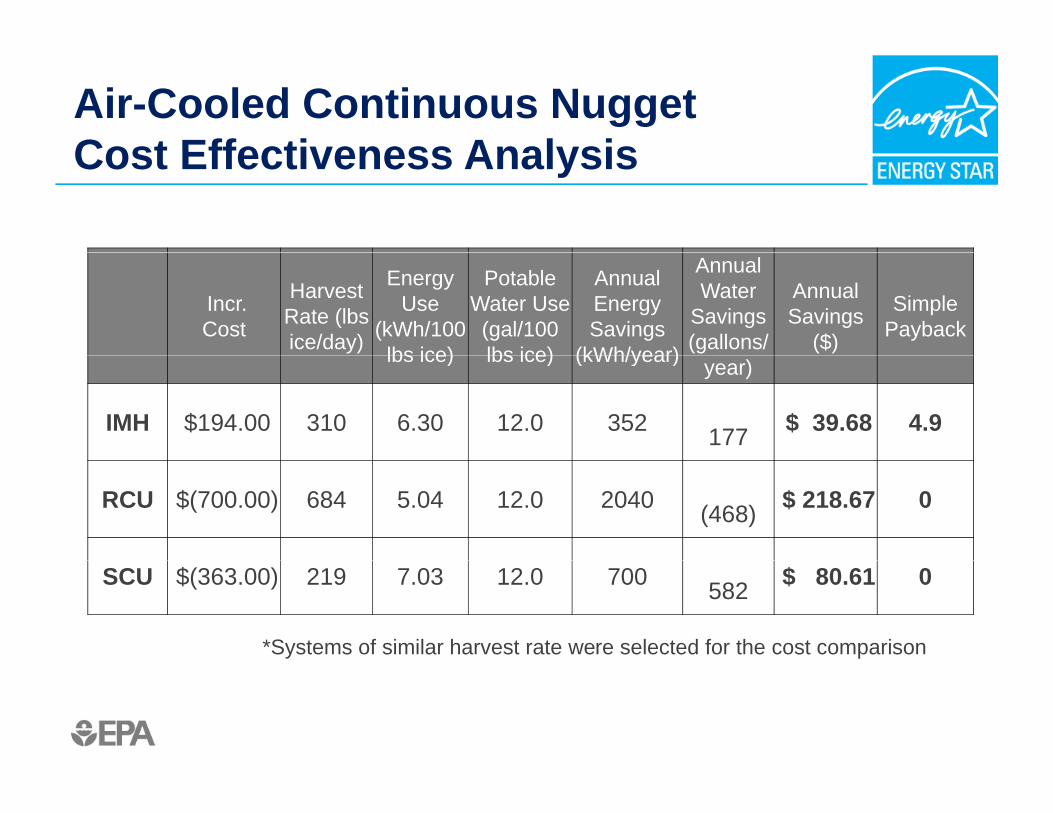
Air-Cooled Continuous NuggetCost Effectiveness AnalysisCost Effectiveness Analysis
Incr.Cost
Harvest Rate (lbs ice/day)
Energy Use
(kWh/100 lbs ice)
Potable Water Use (gal/100 lbs ice)
Annual Energy Savings
(kWh/year)
Annual Water
Savings (gallons/
Annual Savings
($)
Simple Payback
lbs ice) lbs ice) (kWh/year) year)
IMH $194.00 310 6.30 12.0 352 177 $ 39.68 4.9
RCU $(700.00) 684 5.04 12.0 2040 (468) $ 218.67 0
SCU $(363.00) 219 7.03 12.0 700 582 $ 80.61 0
*Systems of similar harvest rate were selected for the cost comparison
Additional V2.0 Discussion Topicsp
• DOE Energy Conservation Standard is under revisiongy– Test procedure should be finalized Winter 2011
Once published ENERGY STAR will reference the final TP
DOE proposed developing a test method to account– DOE proposed developing a test method to account for total energy used for RCU w/ remote rack compressor
EPA proposes excluding a test method is developed
V2.0 Discussion Topicsp
• Ice HardnessIce Hardness– EPA requests comments and data on
Normalizing continuous type ice maker energy and g yp gywater use by ice hardness utilizing the equation proposed by DOE TP NOPREPA received a limited ice hardness data set andEPA received a limited ice hardness data set, and requests more data in order to set levels.
V2.0 Discussion Topicsp
• EPA seeks more information on the effect of purge• EPA seeks more information on the effect of purge settings on potable water use
• AHRI 810-2007 requires testing at the setting q g gspecified by the manufacturer’s instruction
• What is the feasibility of additional testing at the highest purge setting (worst case water use)?highest purge setting (worst case water use)?
V2.0 Discussion Topicsp
• EPA seeks more information on modulatingEPA seeks more information on modulating capacity systems.– What is the market availability of the systems?– What is the feasibility of testing at each harvest rate
and requiring energy requirements be met at each?
Revision Timeline
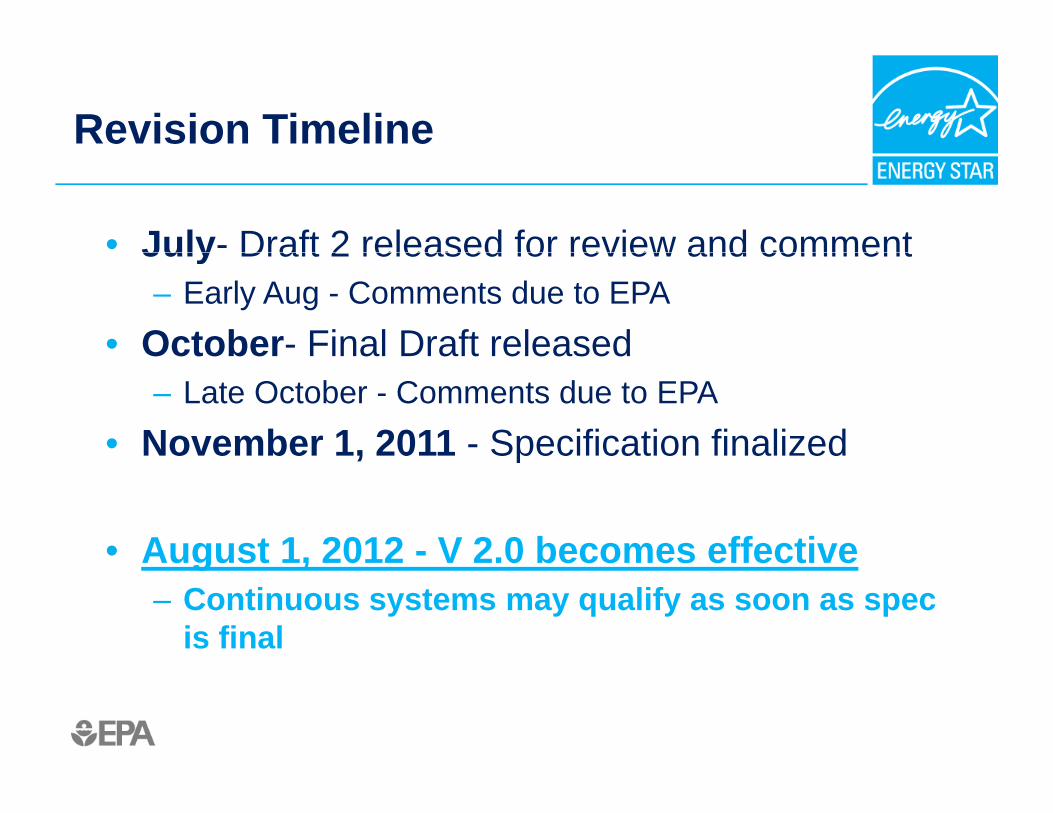
• July- Draft 2 released for review and commentJuly Draft 2 released for review and comment– Early Aug - Comments due to EPA
• October- Final Draft releasedOctober Final Draft released– Late October - Comments due to EPA
• November 1, 2011 - Specification finalized, p
• August 1, 2012 - V 2.0 becomes effectiveAugust 1, 2012 V 2.0 becomes effective – Continuous systems may qualify as soon as spec
is final
ENERGY STAR Contacts
• Christopher Kent, EPAChristopher Kent, [email protected], 202-343-9046
• Erica Porras ICF InternationalErica Porras, ICF [email protected], 703-225-2487
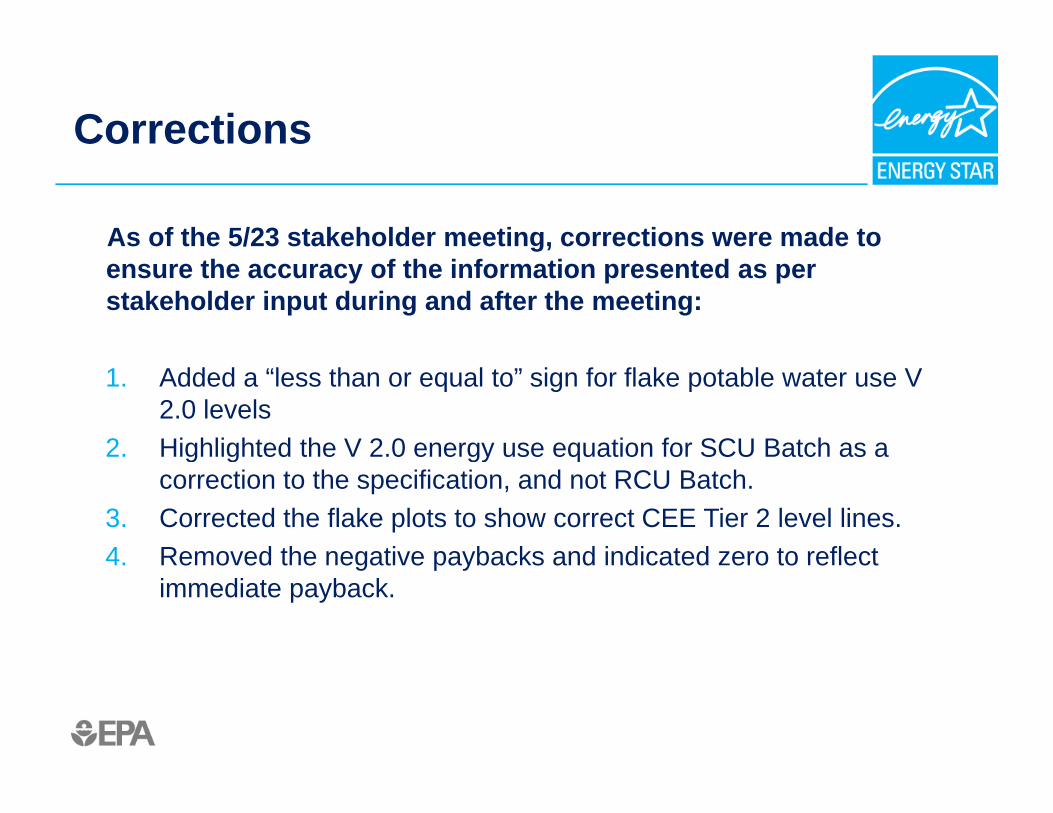
Corrections
As of the 5/23 stakeholder meeting, corrections were made to ensure the accuracy of the information presented as per stakeholder input during and after the meeting:
1. Added a “less than or equal to” sign for flake potable water use V 2.0 levels
2. Highlighted the V 2.0 energy use equation for SCU Batch as a g g gy qcorrection to the specification, and not RCU Batch.
3. Corrected the flake plots to show correct CEE Tier 2 level lines.4 Removed the negative paybacks and indicated zero to reflect4. Removed the negative paybacks and indicated zero to reflect
immediate payback.