Embed Size (px)
Citation preview
ISSN 2052-0018 (print) // ISSN 2053-3667 (online) Geographical Locality Studies 2016 Volume 4, Number 1. pp. 854–897
Energy Resources and Energetic Challenges for the United Kingdom in the Shadow of Brexit
L á s z l ó B o k o r MSc, Geography researcher and teacher, Frugeo Geography Research Initiative
PhD Aspirant, Doctoral School of Earth Sciences at the University of Pécs e-mail: [email protected]
Abstract
The aim of this article originally was to discuss energy-related challenges in the United Kingdom, reflecting especially on a post-Brexit era. The topic, however, quickly evolved into a thorough energetic overview of the British Isles and it involves the entire analysation of the locally available energy resources including both non-renewables and renewables. Whilst the paper is focusing on the availa-bility, utilisation and energetic importance of all of these local resources written in a school textbook style, it also ventures into understanding the reasons behind their decline or growing usage and how and why these have changed over the last few decades researched academically. It also attempts to compare energetic situations, such as electricity generation, to other European countries and focus-es on the importance of global co-operation, and international efforts to tackle, for example, environmental issues including climate change. Key words Energy resources; energetic challenges; international co-operation; United King-dom; Brexit
Geographical Locality Studies 2016 Volume 4, Number 1
855
People hate scientists. There is no use in beating about the bush here. The scien-tist is in danger of becoming the scapegoat for the helplessness which the public
feels. And if an immense revulsion of public feeling does lead to the destruction of the scientific tradition, then the world may again enter a dark age as it did after
the Goths destroyed Rome. It is not impossible that the whole mechanical and intellectual society which we know could be abolished by a great wave of fanati-
cism. BRONOWSKI, J. (1956)
1. Introduction On the 23rd June 2016, the people of Great Britain and Northern Ireland were invited to a referendum on their country’s membership of the European Union. The rhetoric and credibility of the campaign on both ends still remains questionable; the results next morning, however, showed 52% to 48% in favour to leave the Earth’s most successful political, commercial and cultural integration (THE GUARDIAN, 2016a). Despite the non-representative 4% difference, so far it seems that the United Kingdom’s departure has now become a reality which can build up questions on a high number of challenging issues. Energy econom-ics and environmental concerns are just two of the most important among these. During this referendum campaign left and right could follow a large number of social media pages and groups, daily papers, and political debates broadcasted on the television or radio, mostly run by experts or actual scientists; and one could also see hundreds of contributors from the public, including fictional experts, dedicated pro or anti-EU journalists, and fake-news generators, some of them claiming the Unit-ed Kingdom to be fully independent producers on frankly everything including, among many other challenging areas, food production, fish-ing, mining, manufacturing, and approaching this by adapting models similar to Norway’s, Iceland’s or Switzerland’s. In this process, from a geographic point of view, the absence of logic and rationality of infor-mation adaptation, analysation, synthesis and evaluation can be identi-fied which scientific seriousness is one of the major factors that in-spired the author to prepare this paper in his own research field and to

László Bokor
856
discuss facts regarding energy economics focusing on the natural giv-ens of the British Isles. The research activity of the author has now been stretching for a decade and mainly focuses on the geography of energy resources and their connection to locality, sustainability and environmental aware-ness; in the shadow of Brexit, and several other European nationalism-filled irrationalities (for example the proposed ban on wind energy projects in Hungary (277/2016. [IX. 15.] decree of the government—WOLTERS KLUWER [2016]), these terms need to be put into the focus more than ever before. 2. Aims of study In this article, a thorough analysis on the United Kingdom’s energy resources and their availability, utilisation and economics will be pre-sented, and those geographical facts are also highlighted that should be taken into account when discussing these resources’ locality & globali-ty, sustainability and integration among countries. International com-parisons will also be made to see how some of the other European countries (especially Norway, Iceland and Switzerland) are performing in the same area. Two of the author’s own models will also be em-ployed (Need and Co-operation) to help explain certain facts regarding (for example) local and global integration, and international co-operation. The bases of this research set on traditional regional geog-raphy which examines the social and economic spheres on the princi-ples of physical geography; therefore, there will cliché explanatory parts be also presented to develop general understanding. 3. Research methods GAILLE, S. (2016) has published an article on LinkedIn on the impacts of the energy industry that could follow Brexit. The article published on a social media platform is only mildly thought-provoking, but it can still encourage researchers to deepen their own thinking and analyse the problems related to energy sustainability right from their roots. This current paper is mostly a simple but thorough analytical review of
Geographical Locality Studies 2016 Volume 4, Number 1
857
previously researched primer and secondary sources, but the different energy-related contents are now analysed separately and then synthe-sised and evaluated in the aim of forming a complex piece of writing from geographic point of view, and by employing two models. Accord-ing to this, the reader will find: 1. General definitions in both energetics and sustainability which were mostly sourced from specialist books or phrased by the author. 2. Historical overviews of the energy resources and their local uses which were also traced in books, but journal papers and online databases were also searched to collect data. 3. Statistics on how important these resources are or how their utilisation changed over certain periods which were tracked in national statistics websites and other company databases. The data collected are presented in charts and diagrams that were made in Microsoft Excel. 4. Models to help understand the connection among certain fac-tors, for example crude oil–petrol–transportation. These and other images were designed by using CorelDRAW X6 and SmartDraw. 4. Energy resources A few years ago, a paper by the author of this paper was published in this GLS series on what energy is and what energy resources mean (BOKOR, L. 2013). According to the information presented in that arti-cle, it is worth sweeping the dust off some definitions and present them again in a compressed, but updated form here in this work too. Everything that exists in our Universe is composed of either matter or energy. The interaction of these two parts is essential, because ener-gy is what makes matter change through time (physically and/or chemically), which causes the shaping processes of our planet (STRAH-LER, A. H. – STRAHLER, A. N. 2002). Energy is nothing more than stored ‘work or force’, which is re-released under certain conditions (GULYÁS, J. et al. 1995). This appears in different forms, such as thermal, electric, nuclear, and mechanical (BREUER, H. 2002). The forms of energy may

László Bokor
858
be divided into three main groups: kinetic energy, potential energy, and chemical energy (STRAHLER, A. H. – STRAHLER, A. N. 2002). The forms of energy can be traced back to one of the four fundamental interac-tions of physics (fundamental forces/interactive forces): gravitation, electromagnetism, strong nuclear, and weak nuclear (HOLICS, L. 2009). The energy itself is invisible, rather than a factual, objectified mate-rial. This is typically transmitted by the energy source. However, this is already a more evident material that is always a source of energy stored in a characteristic energy bearer. This latter principle can be anything, as everything is abundant in stored energy (so-called suba-tomic energy) that can be handled or seen (EDDINGTON, A. 1935). From the point of view of, and in the earthly dimensions of our geographical approach, the Earth, in this sense, is one of the largest energy bearers. It bears different types of energy sources that can be objectified in ma-terials (for example hard coal), or in the direct or indirect results of physical processes and phenomenon that cannot be detected with a naked eye (for example wind). Its nature and manifestation vary by geographic dimensions, that is to say, most of the energy bearers can conclude in the existence of more energy bearers (Figure 1).
Figure 1 – A Simplified Example of the Spherical Structure of the Energy Resources Edited by BOKOR, L. (2016)

Geographical Locality Studies 2016 Volume 4, Number 1
859
This spherical structure may include the whole lithosphere or a sin-gle mountain range that bears various energy sources. There can—for the modern society’s needs and use—be thermal energy or electric energy transformed from. The principal difference between the energy bearer and the energy source is that the source can be exploited for its electric power and thermal unit, but the energy bearer does not func-tion as a source. The energy carrier is, according to ISO 13600, either a substance (energy form) or a phenomenon (energy system) that can be used to produce mechanical work or heat, or to operate physical or chemical processes (ISO, 2007). The energy carrier is a product and can directly be used in demand of energy, for example batteries, petrol. It may be difficult to distinguish among the bearer, the source, and the carrier; therefore, to make their terms clearly understandable, the approach taken has to be simplified: in this sense, the bearer is, for example, a mountain, where the source (for example black coal) can be found; and the carrier is, for example, the electricity itself that is trans-formed (produced or generated) from the source and is either directly used (for lighting homes) or stored for further use in a particular de-vice (for example a battery). Energy resources can be anywhere on the planet, but the type, qual-ity, and availability of the source specific to one locality of the planet is limited to the area and its natural givens, and which clearly defines what people can do in that region where they live. This is known as potential. On a larger scale, instead of people, one can also refer to cities, regions or countries and see with what they are naturally pro-vided, as this is the core thing to understand how their economies are based on those resources and also, how they can be linked to other activities. This will also make us understand how some of the econo-mies that are lacking in certain resources need a wider international integration (co-operation) to be successful. First of all, let us discuss primary energy sources, and some information of their production and consumption in regards to the United Kingdom. The primary energy resources (or primary energy or PE) are the major types of sources from where energy derives. They can either

László Bokor
860
belong to non-renewables (non-constants) or renewables (constants). The purpose of the energy resources is to provide an input to a system which in a more understandable way means, for example, filling up our car with fuel (1/ transportation) placing wood in a log burner to gen-erate heat and warm interior spaces (2/ heating), or burn black coal in a conventional power station to generate electricity (3/ electricity generation). It is now easy to see that without trees one cannot place wood in the log burner or without coal one cannot generate electricity in a power station. And, after all, one can also see that if one were una-ble to generate electricity, it would not be able to run an extensive industry which would have a significant effect on the economy. But, once again, there are other solutions in an area other than just wood and coal. These resources, their availabilities and conditions in the United Kingdom are presented in this paper. 5. Production and consumption of primary fuels in the United Kingdom Primary fuels mean fuels without energy conversion and transfor-mation processes (for example into heat, electricity or mechanical work). When one talks about primary energy, it normally refers to domestic (indigenous) production, so what a country can produce by itself. The Total Primary Energy Supply (or TPES) includes the balance on imported and exported energy resources (and some other data related to trade and waste of energy too). The TPES is important as it highlights the balanced amount of imported fuels in a country’s energy mix which also links to the country’s dependency on non-domestic resources (DONEV, J. n.a.). According to the UK Energy in Brief 2015 (NATIONAL STATISTICS, 2015), the domestic production of primary fuels changed significantly between 1980 and 2014 (Figure 2). The information that is presented in this chart clearly shows that the United Kingdom’s primary energy production is still dominantly composed of fossil energy resources (especially crude oil and natural gas, the coal’s importance is becoming more and more insignificant) whilst the share of the renewable energy

Geographical Locality Studies 2016 Volume 4, Number 1
861
resources carries on being relatively small2, but their importance is certainly growing and in electricity generation, in some cases, have already outcropped the coal (VAUGHAN, A. 2016). In the total produc-tion, the primary fuels have been in decline since the early 2000s whilst the renewables are increasing (NATIONAL STATISTICS, 2015).
Figure 2 – Domestic production of primary fuels in the United Kingdom
between 1980 and 2014 in Million tonnes of oil equivalent Source: NATIONAL STATISTICS (2015)
Figure 3 shows the correlation between the primary energy pro-duction and consumption. It can clearly be seen that in the period be-tween 1980 and 1990, the Britain’s production was synchronised with the consumption which means that it was used as much as the country actually needed and all the domestic production equalised the domes-tic consumption whilst there was sufficient amount for export too. Between 1990 and 2005, the country was still able to compete with the 2 In Fugure 2, renewables are merged into the last two categories of which primary electricity (more about it in Chapter 6) is consisting of wind, solar and natural flow hydro, plus includes nuclear too.
0.020.040.060.080.0100.0120.0140.0160.0
Primary oil Natural gas Coal Primaryelectricity Bioenergy &waste1980 1990 2000 2010 2013 2014

László Bokor
862
cheaper imported resources which resulted in higher production than the country was required. The peak value, that is shown in the chart around 2000, marks a period when the production was the highest and increased rapidly mainly due to the growth of oil and gas (NATIONAL STATISTICS, 2015). Since the early years of the 21st century, the domestic production has declined dramatically which mainly affected the fossil resources (coal and hydrocarbons) and in the last 5–6 years, it has been importing more than producing domestically (locally). To under-stand the decline in the overall production–consumption relationship, a closer look at the different types of energy resources and an insight in their decline will be required.
Figure 3 – Primary energy production and consumption in the United Kingdom between 1980 and 2014 in Million tonnes of oil equivalent Source: NATIONAL STATISTICS (2015) The task now is to see with what energy resources the United King-dom is provided by nature (this is the primary energy source) which can be converted to be a secondary energy source, which is also known as an energy carrier. One will also see how their roles and importance
100.0120.0140.0160.0180.0200.0220.0240.0260.0280.0300.0
1980 1990 2000 2010 2013 2014Total Production Total Consumption

Geographical Locality Studies 2016 Volume 4, Number 1
863
changed throughout history and will receive explanation on their pre-sent decline or success. The research will concentrate on the major primary energy resources beginning the journey with the non-renewables (coal, crude oil & natural gas, and nuclear), renewables (solar, wind, hydro, tidal, and wave, biomass, and geothermal). These categories may consist smaller sub-sources too. The TPES which defined by IEA (n.a.) is majorly made up of domes-tic production + imports – exports; therefore, when it comes to the total primary energy supply of one certain area, the indigenous pro-duction that is based on the resources found in the area and the ex-port/import balance, has to be addressed; it will also be pointed out how the import/export effect the economy, but will not discuss at an overall level. After the primer sources have been discussed, an over-view of the electricity production will be carried out, because that is deliberately the most important product of energy resources which has a major impact on the whole economy and in generally on the eve-ryday lives of people. 5.1. Non-renewables 5.1.1. Coal One of the most traditionally and widely used energy resources that has been respected and had a high significance throughout the history of mankind, for over thousands of years. One of the major type of ener-gy sources that has also had a definite impact on the development of societies and economies (FREESE, B. 2006). The coal is a type of a sedimentary rock with combustible proper-ties. Its quality and heat content (normally presented in kJ/kg) are defined by the conditions that have formed them and according to this, there are several types of coals from lignite (brown coal) to anthracite (the hardest and most metamorphic coal beside graphite) (WOODCOCK, N. 1994). The coal has organic origin (mostly died vegetation) and takes thousands to millions of years to form. During its formation it conserves the energy and other physical materials; when it burns, it releases a high amount of chemicals and substances which makes this

László Bokor
864
energy resource one of the most CO2 intense and least environmentally friendly (ADB, 2009). Nearly all of the coal reserves of the British Isles occur in carbonif-erous rock (formed about 358.9 to 298.9 million years ago) deposits, with 86–88% average carbon content which makes this type a high quality natural fuel (MCLEAN, A. C. – GRIBBLE, C. D. 1985). According to the statistics of UK COAL (2011), the country is abundant in coal, the reserves are estimated to 3,196 million tonnes of which 2,344 is acces-sible underground and 856 on surface. No surprise then why the UK has had the potential to build an extensive industry and economy based on coal. However, this type of energy resource is primarily used to produce electricity (nationwide) and heat (domestic) which, due mainly to environmental reasons, has been in decline for decades since renewable energy sources enjoy more widespread use due to their more environmentally friendly properties (BIAN, Z. et al. 2010). Until the 1950–60s, coal was the main energy source in the British Isles which fits into an international trend at that time. Ever since its downfall began, it has resulted in closures of coal mines and the do-mestic production decreased rapidly. Currently, there are a small number (26) of surface coal mines operating across the country and extracting coal for energetic purposes—the last deep mine, Kellingley, was closed down in 2015 (BBC NEWS, 2015). The closure of coal mines, therefore, are direct effects of the decreasing economically accessible fossil and the increasing use of renewable resources, and also a change of lifestyle and standards of people in the early 21st century. Locally thinking, the huge coal reserves are important for Britain, but the mines are inevitable due to current international market forc-es. The most easily accessible deposits are used up; therefore, mining and machinery has become expensive and less environmentally friend-ly (WAUGH, D. 2000). Coal mining and consumption have significant effects on directly the local and indirectly the global environment (BI-AN, Z. et al. 2010); therefore, if other, environmentally more friendly and economically exploitable local sources are available, they need to be put in favour to coal. This so called ‘green type’ of using alternative
Geographical Locality Studies 2016 Volume 4, Number 1
865
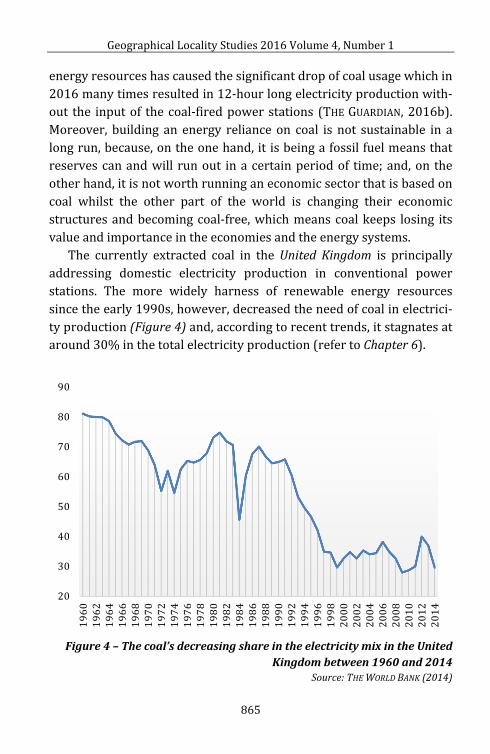
energy resources has caused the significant drop of coal usage which in 2016 many times resulted in 12-hour long electricity production with-out the input of the coal-fired power stations (THE GUARDIAN, 2016b). Moreover, building an energy reliance on coal is not sustainable in a long run, because, on the one hand, it is being a fossil fuel means that reserves can and will run out in a certain period of time; and, on the other hand, it is not worth running an economic sector that is based on coal whilst the other part of the world is changing their economic structures and becoming coal-free, which means coal keeps losing its value and importance in the economies and the energy systems. The currently extracted coal in the United Kingdom is principally addressing domestic electricity production in conventional power stations. The more widely harness of renewable energy resources since the early 1990s, however, decreased the need of coal in electrici-ty production (Figure 4) and, according to recent trends, it stagnates at around 30% in the total electricity production (refer to Chapter 6).
Figure 4 – The coal’s decreasing share in the electricity mix in the United
Kingdom between 1960 and 2014 Source: THE WORLD BANK (2014)
2030405060708090
1960 1962 1964 1966 1968 1970 1972 1974 1976 1978 1980 1982 1984 1986 1988 1990 1992 1994 1996 1998 2000 2002 2004 2006 2008 2010 2012 2014

László Bokor
866
Coal will, however, remain a quasi-important energy resource of the future generation both at nation level in electricity generation and in domestic use to generate heat for homes. Once the power station technology becomes more advanced and environmentally friendly (carbon capture and storage, or one of the newest discovery on how CO2 can be turned into ethanol [YAHOO, 2016]), the coal might have the chance to be once again a significant type of energy resource, but this chance, in line with the more and more efficient and environmentally friendly emerging technologies and other alternatives, is very small. 5.1.2. Hydrocarbons Hydrocarbons refer to a group of compounds of organic origin that mainly consist of hydrogen and carbon. They are naturally occurring and majorly found in crude oil. When geography of energy talks about hydrocarbons, it normally refers to a group including crude oil and natural gas. These two are currently the world’s most primer energy resources. They have had a dominant role since the second half of the 20th century and their importance is still highly significant in the sec-ond decade of the 21st century. Crude oil and natural gas have shaped our society and lifestyle; without them the world would look majorly different as it is now (in both a positive and a negative sense). Crude oil is the leading resource of our society. The most common (and well known) products of it are fuels, for example petrol, diesel, kerosene, which have a central role in transportation as a ‘food for our cars’. However, other petroleum products are widely present in the economy as industrial activities use crude oil and other hydrocarbons to produce a wide range of items that have key roles in our society, for example plastics, lubricants, packages, medicines and plenty more ‘ingredients’ that are used to produce other items. Our modern society relies on crude oil and will carry on being an important energy re-source in the future. This importance will, however, have to decline as burning off fuels (for example carbon dioxide [CO2] and sulphur diox-ide [SO2] emissions) and environmental contamination related to the petrochemical products (for example plastics) have a significant envi-

Geographical Locality Studies 2016 Volume 4, Number 1
867
ronmental impact which has to be more seriously addressed. Also, the extraction of crude oil (mining) is one of the ‘dirtiest’ in regards to all the other energy resources that have been involved in a high number of ecological disasters since the beginning of the 20th century that had local or, due to the Earth’s physical cycles (for example hydrological), even global environmental effects (the most notable oils spills inci-dents are, among many others, the Exxon Valdez in 1989, and the Deepwater Horizon in 2010―USCG, 2011). Natural gas plays a key role as a domestic energy resource in cook-ing and heating homes; and it is also one of the major energy sources of electricity generation in thermal power stations. In Britain, this latter one currently represents 29.1% in the total share (more information at Chapter 6). Natural gas and crude oil have the same origin, but their chemical compositions are different. Whilst the burning of crude oil (and coal) is one of the most carbon dioxide, sulphur dioxide and greenhouse gas producer, the natural gas has more environmentally friendly properties (EIA, 2016) which is why gas-fuelled vehicles (pub-lic buses) are considered to be ‘greener’ than the ones fuelled by petrol or diesel. Crude oil and natural gas are both formed over millions of years buried deep; therefore, they have to be extracted from underground reservoirs. In the case of their availability, an extensive amount of hy-drocarbons is found in the sedimentary rock basement of the North Sea (for example in Dogger Bank). These reservoirs became economi-cally exploitable in the 1970s, after the Middle east oil crises. Let us, however, bear in mind that hydrocarbons are finite resources which means, according to the amount of extraction, sooner or later the res-ervoirs will run dry. This means, setting an entire economy’s reliance on indefinite resources cannot be sustainable on a long run, but Brit-ain’s dependence is and will be highly significant on it (CRITCHLOW, A. 2015). This realisation comes along with the modern environmental awareness that puts the renewable energy resources in favour and also that imported oil and oil products are becoming cheaper. One of the key characteristics of the North Sea crude oil is, compared to the mid-
László Bokor
868
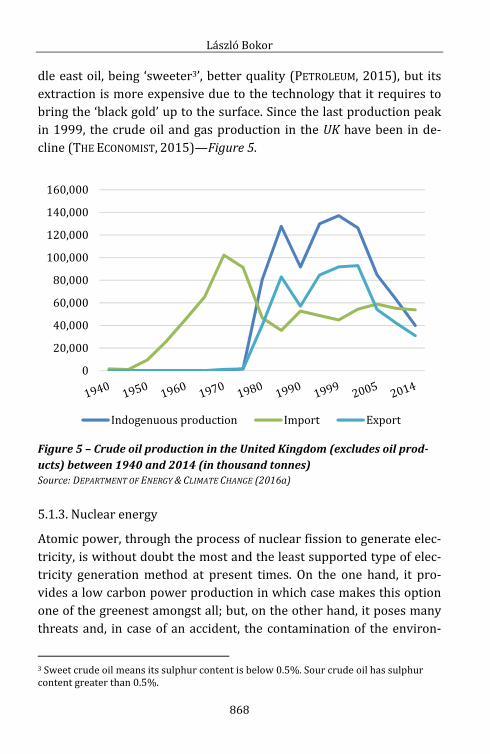
dle east oil, being ‘sweeter3’, better quality (PETROLEUM, 2015), but its extraction is more expensive due to the technology that it requires to bring the ‘black gold’ up to the surface. Since the last production peak in 1999, the crude oil and gas production in the UK have been in de-cline (THE ECONOMIST, 2015)—Figure 5.
Figure 5 – Crude oil production in the United Kingdom (excludes oil prod-ucts) between 1940 and 2014 (in thousand tonnes) Source: DEPARTMENT OF ENERGY & CLIMATE CHANGE (2016a) 5.1.3. Nuclear energy Atomic power, through the process of nuclear fission to generate elec-tricity, is without doubt the most and the least supported type of elec-tricity generation method at present times. On the one hand, it pro-vides a low carbon power production in which case makes this option one of the greenest amongst all; but, on the other hand, it poses many threats and, in case of an accident, the contamination of the environ- 3 Sweet crude oil means its sulphur content is below 0.5%. Sour crude oil has sulphur content greater than 0.5%.
020,00040,00060,00080,000100,000120,000140,000160,000
Indogenuous production Import Export

Geographical Locality Studies 2016 Volume 4, Number 1
869
ment and living systems may be highly significant. A nuclear power station accident is a potential hazard, if we understand that the planet is one integrated organic entity which is connected via several geo-graphical spheres: for example, the atmosphere or the hydrosphere are global systems which means that an accident in Japan can affect the world oceans just as well the global air systems (as it happened in Fukushima in 2011). It is not the aim of this research to decide whether nuclear energy is a good or a bad choice of energy generation method, but it has to be seen that a nuclear power station has affects not only during its oper-ating time, about 30 years, but over millions of years even after the power plant has ceased. The aim now is to highlight facts according to its utilisation in the UK. In the European Union, according to Figure 6, 14 out of 28 countries generate electricity with nuclear power stations which makes the EU moderately dependent on it, approximately one-quarter of its electricity to be precise (WNA, 2016d).
Figure 6 – Number of nuclear reactors in the European Union and their
shares in the electricity generation (2016) Source: WNA (2016d)
7 2 6 4
58
8 4 1 2 4 1 7 9 15
37.5 31.3 32.5 33.7
76.3
14.152.7
3.7 17.355.9
38.020.3 34.3 18.9
0102030405060708090
Number of reactors (pc) Share in electricity generation (%)

László Bokor
870
Within the EU, after France (58 reactors and 76.3% share), the UK has the largest number of operating reactors (15) which in 2015 pro-vided about 21% (WNA, 2016a) of the country’s total generated elec-tricity. Smaller countries by size and population, such as Hungary and Slovakia with 4 reactors each produce a sizeable amount of electricity with nuclear power stations (WNA, 2016b; 2016c) (Figure 6). According to some sources, the United Kingdom’s nuclear power stations are planned to be gradually shut down in the next few decades (ENERGY-UK, n.a.; ALDRED, J. – STARKEY, N. 2013), however, in regards to some other sources, there is no sign the UK would abandon this meth-od of electricity generation as there are new power plants planned (4) and proposed (7) to be in line by 2025 and 2045 – the most recent is the controversial Hinkley Point (MASON, R. 2016). At present, a full clo-sure of the country’s nuclear power stations would raise questions how or from what sources the ‘missing’ amount of electricity would be generated (which is currently 1/5 of the total electricity mix). One of the major difficulties with nuclear energy is the fact that it is not a resource. Nuclear energy is a result of methods when, through nuclear reactions, energy is released from a certain type of energy source. In the case of nuclear power stations, the resource is normally uranium, sometimes plutonium—highly radioactive elements (BGS, 2010). The other difficulty is, therefore, how to supply the power sta-tions with uranium, which is the major energy resource to generate the electricity from? Also, what happens with the exhausted, but highly radioactive parts? Earlier Hungary and Slovakia were mentioned where both countries have a significant dependency on imported ura-nium, mainly from Russia (WNA, 2016b; 2016c). This fact makes both of these countries strongly dependent on imported fuel and also makes their electricity generation majorly reliant on one source in the mix which does not provide these countries with sufficient energy security (KRAEV, K. 2016). Focusing on the United Kingdom, although there are some minor occurrences mainly in different locations across Scotland, in the Pen-nine area, and in Cornwall, uranium is not currently mined (BGS, 2010;

Geographical Locality Studies 2016 Volume 4, Number 1
871
WNA, 2016a). The uranium is imported from a range of countries, but the country’s other nuclear facilities (conversion, enrichment, fuel fabrication, reprocessing and waste treatment) are self-sufficient (WNA, 2016a). The energy mix in the UK still shows a diverse range of resources that are used in electricity generation. In this regards, about 20% share in electricity generation may easily be replaced by other alternatives (mostly renewables), but viewing this from the aspects of politics, it is certainly a challenging energy endeavour. 5.2. Renewables Nowadays, it is very common to discuss the role of renewable energy resources when environmental awareness and energy security come into focus. These terms are certainly inseparable. As seen in the previ-ous chapters, the conventional energy resources, in a way or another, are in a decline in the European Union and so as in the United Kingdom, but a global trend in favour to the ‘green’ energy resources can also be observed. Global climate change, global warming, CO2 issues, SMOG, air pollution, and other similar issues, are examples that are mostly relat-ed to mining and burning of non-renewable energy resources. Coal, crude oil and natural gas are commonly known as fossil fuels. They, however, are of organic origin, but their solid matter takes millions of years to form; the release of their stored energy through emission mean a direct impact on the environment which can reach global scales. Also, since they are finite resources, the modern economy can-not have the time and ‘patience’ to wait millions of years for them to renew; therefore, in contrast to them, renewable energy resources can be powerful alternatives. In fact, one of the major triggering factors of the wider use of renewables and the more and more spreading green philosophy is the unavoidable decline of conventional energy re-sources. Most of the Earth’s physical forces provide access to the energy that they ‘store’: solar (sunshine), atmospheric (wind) and hydrospheric (water) phenomenon (hydro power in general, wave & tidal energy),

László Bokor
872
bioenergy and geothermal have significant energy potential. In the following, only these major resources are discussed. Regarding (a) solar energy, the potential in the British Isles com-pared to the Mediterranean is significantly less. However, solar radia-tion is available even in the polar regions, therefore as being a local source, it is worth investing in the harness of this type of energy re-source. Other countries in the European Union, such as Germany, Den-mark, Sweden and Austria, have developed the solar technology (in-cluding photovoltaic and active solar heating) to high standards which guarantees ef iciency and stability at high degrees―and generation even in cloudy weather. The solar energy’s international success has certainly encouraged its utilisation in the UK too, as from 4,040 GWh in 2014, the electricity generation of solar photovoltaics increased to 7,561 GWh in 2015 which is an 87% change (GOV, 2016). Solar energy is an alternative to fossil resources and its greatest importance could be achieved locally as a domestic generator of electricity and heat which could potentially contribute in lessening the household energy expenses which could even lead to domestic energy independence. Their installation on the rooftops of houses could also help save the impact on other greenfield areas as one of the biggest issues with solar power stations is the large land area they require. The extra electricity generated could be feed into the national grid which would also bring extra money into both the local government’s budget and the house-hold. The utilisation of (b) wind energy is one of the most successful throughout Europe (apart from some areas such as Hungary—GREENFO [2016]). There are countries already in the EU where wind represents the highest share in the electricity production (for example in Denmark where the composition of electricity generation from wind is 74.5% including the production of on and off shore farms which represents 42.1% in the total electricity generation—ENERGINET [2016]). One of the most important factors in efficiently harnessing the energy of wind is the access to the constant wind resources. Geographically talking, the more western a country in Europe is situated, the more and better

Geographical Locality Studies 2016 Volume 4, Number 1
873
quality wind potential it has. This means, the closer it lies to the Atlan-tic Ocean, the easier it can access the western winds that dominates in Europe, especially its western part of it. The British Isles are at the gates of this corridor which means the UK has one of the greatest po-tential of wind energy to harness everywhere on Earth and considered to be the best in Europe. However, whilst in Denmark, wind represents almost half of the electricity production, in the UK’s mix it is approxi-mately 15%. Its appreciation has, however, become rapidly increasing in the recent years and it is now one of the most successfully develop-ing sector. By the end of 2015, 14,291 MW worth of installed capacity of wind turbines had been harnessing wind across the UK on and off-shore generating 17,423 GWh electricity (GOV, 2016)—Figure 7.
Figure 7 – The development of wind energy in the UK
Source: GOV (2016) One of the main issues with wind energy as a variable resource (the same as with solar power) means the electricity generation is timely dependent and also largely defined by its properties in a given time (for example speed). Wind energy is, therefore, only an alternative to
6,467 8,899 11,212 13,037 14,29115,652 19,83528,396 31,966
40,310
05,00010,00015,00020,00025,00030,00035,00040,00045,000
2011 2012 2013 2014 2015Installed capacity (MW) Generation (GWh)

László Bokor
874
fossil resources but an efficient addition to the mix of diverse range of energy resources. As it is going to be presented in the next chapter, (c) hydro power is the renewable energy resource that has been utilised in electricity production for the longest time in history and has major importance in many of the European countries and in their economies. It does not have much impact on the UK’s electricity production as its total share in the mix was 3.2% in the end of 2015 which also includes the shore-line tidal and wave systems (GOV, 2016). The total installed capacity has not changed much in the past decades and it is consistently holds around 1,759 MW that produced 6,289 GWh electricity in 2015. Com-pared to solar and wind, hydroelectric power stations are able to pro-vide electricity in a continuous manner, but they require certain geo-morphologic conditions to operate efficiently. According to BHA (2016), the UK’s hydro potential would allow to double the current capacity, but installation of new plants at new sites onshore raises potential environmental concerns (BOKOR, L. 2012). In this regards, the role of new and emerging technologies that concentrate on harnessing the energy of seas has increased rapidly in the recent years. Electricity generation by wave and tidal streams are more predictable than wind or solar, and according to the UK government’s sources, they could represent up to 20% of the UK’s current electricity demand (GOV, 2013). Overall, geographically the UK’s renewable energy resources (solar, wind and hydro) are excellent alternatives to fossil resources, because the British Isles geographical situation makes this possible. Even though the solar energy potential is much less than in southern Europe, the UK lies in the gateway of the Earth’s most powerful wind resources and hydropower from the seas, which have immense local importance due to an island situation. According to Figure 8, the overall energy generation from renewa-ble sources in the UK is currently based on the increasing utilisation of all locally available solar, wind, and in a small scale, hydro (including wave and tidal) resources. Based on the GOV (2016) statistics, the total

Geographical Locality Studies 2016 Volume 4, Number 1
875
generated electricity in 2015 was 83.6 TWh which is an increase of 29% compared to 64.6 TWh in 2014. The overall share in the country’s electricity generation has increased from 19.1% (2014) to 24.7% (2015). Since the UK government introduced the Renewable Obligation scheme (RO) in 2002 (England & Wales) and 2005 (Northern Ireland), and also the support system through Feed in Tariff (FiT), the electricity generation from renewable sources have increased rapidly (GOV, 2016). The pie charts, however, shows that, despite the British Isles excellent potential of all three major renewable resources, the UK still relies and increases the share of bioenergy (70.7%).
Figure 8 – The mixture of renewable energy sources within the electricity
production in the UK in 2014 (left) and 2015 (right) Source: DEPARTMENT OF ENERGY AND CLIMATE CHANGE, 2016b; GOV (2016)
Bioenergy (biomass) (d) has the highest share in renewable energy fuel use (Figure 8), but that 72.2% (2014) and 70.7 (2015) share do not correspond with one resource only. In fact, when it comes to bio-energy, it is common to refer to plant biomass (24.2%/25.3%), landfill gas (12.3%/9.7%), domestic wood (11.5%/11.4%), transport biofuels (9.2%/6.00%), waste combustion (4.2%/6.2%), industrial wood (3.4%/4.7%), anaerobic digestion (2.8%/3.4%), sewage gas
Bioenergy72.2%Hydro3.7%
Wind20.3%Solar3.0% Geothermal0.8%
Bioenergy70.7%Hydro3.2%
Wind20.8%Solar4.2% Geothermal1.1%

László Bokor
876
(2.5%/2.2%), animal biomass (1.9%/1.6%) and co-firing (0.2%/0.2%). Bioenergy, therefore, refers to a diverse range of, mostly, organic matters. The more variety it comes from, the more diverse options there are to utilise them as bioenergy can be used to produce heat (burn wood), fuel (rapeseed oil for bio-diesel), and generate elec-tricity (burning gas). According to the British Geological Society (BGS, n.a), despite the UK is not volcanically active (like Iceland or Japan), there is still a substan-tial geothermal (e) resource. Shallow geothermal source means access to the top 10–15 m of the ground by heat pumps (aerothermal heat-ing), but this is technically still solar energy as sunshine heats up the top layers of the ground which means constant temperature through-out most of the year. Deep geothermal energy (geothermal gradient in the UK is 26°C/1 km) has been tried at numerous sites (for example Eden Project in Cornwall), but their importance has not been addressed successfully yet, even though, according to the Renewable Energy Asso-ciation, the UK has a high potential of geothermal energy which could provide approximately 20% of the electricity. At the moment, the im-portance of geothermal is only 1.1% in the total primary energy mix (GOV, 2016). 6. Electricity: a wider view So far, the primary energy resources of the United Kingdom, their origin, and the impact they have on the local (domestic) economy have been discussed. It has also been shown that the energy resources are important for the industry and to run the country’s economy. There are many energy resources that are primarily used in certain sectors, for example, crude oil is majorly used to produce petrol and other pet-rochemical products. But the majority of energy resources are used to generate only electricity which, as an energy carrier, is then used to produce other things. For example, currently the entire economy and life fundamentally rely on electricity: in factories everything is based on precise machinery, car manufactory, IT industry would not even exist without it: internet, services, online banks, stock exchange, Face-

Geographical Locality Studies 2016 Volume 4, Number 1
877
book, Twitter, etc.; everything is electronic and digital. Public services, for example, hospitals need a lot of electricity and energy safety. And the diversity of its use make us more dependent on it day after day (televisions, smart phones, electric cigarettes, electric cars, and the world is becoming more ‘electrified’) (LEKSHMI, S. 2010). Electricity has extended the economy and its sectors and nowadays relies on one another: from primary production (crude oil extraction) secondary production (manufacture, assembly) tertiary production (transport, advertising, warehousing, selling). And besides these there are the intellectual (quaternary) and educational levels (quinary) which has gained more and more significance in the past few decades (BIS, 2012). Without electricity, the lives known cannot be imagined anymore. This can also be seen in how the UK’s economic sectors have redistributed in a half century (Figure 9).
Figure 9 – The United Kingdom’s industrial market economies, distribution of labour force (percentage)
Source: GRIFFITHS, A. – WALL, S. (2011)
17.3 6.5 2.436.7 34.5 23.7
46.0 59.0 73.9
1 9 6 0 1 9 8 0 2 0 0 8
Agriculture Industry (manufacturing) Services

László Bokor
878
This is a global trend which also means that the integration among the planet’s continents have got a strong bond which is increasingly recognised in the countries that are situated in a certain region. These are mostly economic integrations as multilateral free trade areas, such as the EFTA in Europe or the NAFTA in North America, but there are already more developed integrations that go much beyond economy, such as the MERCOSUR in South America, or the European Union which is one of these regional integrations and the most successful of them on the planet. In this system electricity also has a key role as produc-tion and consumption are strongly connected among the European countries and the future’s idea is the establishment of a common Euro-pean super grid (JEFFERIES, D. 2014). Moreover, electricity is the clean-est and most environmentally friendly energy carrier which can be produced directly from ‘clean’ energy resources; therefore, one of the most important aims of the human civilisation should be to reduce the fossil resources and to establish energy systems mostly on electricity provided by the Earth’s infinite resources. Its generation, therefore, needs to be continuously secured and they have to be done along with certain environmental requirements which means the electricity gen-eration has to provide us with a sufficient amount whilst keeping the environment clean and healthy. For this latter reason, the electricity has to be transmitted from resources that are widely available in the country. This is when the energy resources for electricity generation is provided locally. Nowadays, however, the resources for electricity production may travel thousands of miles (see the availability of pri-mary energy) which might be tolerable as long as it is based on equal trading deals and conditions, and not results in dependency and the extensive use of fossil resources. This responsible co-operation is shown in the Co-operation Model (BOKOR, L. 2013). This idea (responsi-ble co-operation) makes globalisation a ‘domesticated pet’ of locality which is a useful interaction among other locations with different con-ditions and properties. The interaction by making a global network is the only option that can make a locus work quasi independently with other local hot spots which can also help tackle global problems at

Geographical Locality Studies 2016 Volume 4, Number 1
879
larger scales (Figure 10). The co-operation is stronger and more effi-cient when each individual locus situated near to each other.
Figure 10 – The Co-operation Model
Based on BOKOR, L. (2013) According to BOKOR, L. (2013), the term of ‘producing electricity’ is not fully accurate when one understands that energy itself is stored in a certain material (for example in coal) which only has to be released from that given energy resource by transforming it into a different form. The conversion of energy can be performed in many different ways depending on what one wishes to use that energy for and what type of energy is particularly needed. When it comes to electricity, electrical power is normally generated with a turbine of some type, but the type of energy resource can place electricity generation into two main categories in regards to how naturally it becomes electricity. According to ØVERGAARD, S. (2008): “In the UN manual electricity from nuclear, hydro, wind and geothermal sources is labelled primary. The OECD/IEA/Eurostat manual states that; »Electricity is produced as pri-mary as well as secondary energy. Primary electricity is obtained from natural sources, such as hydro, wind, solar and tide and wave power. Secondary electricity is produced from heat of nuclear fission of nuclear fuels, from the geothermal heat and solar thermal heat and by burning
László Bokor
880
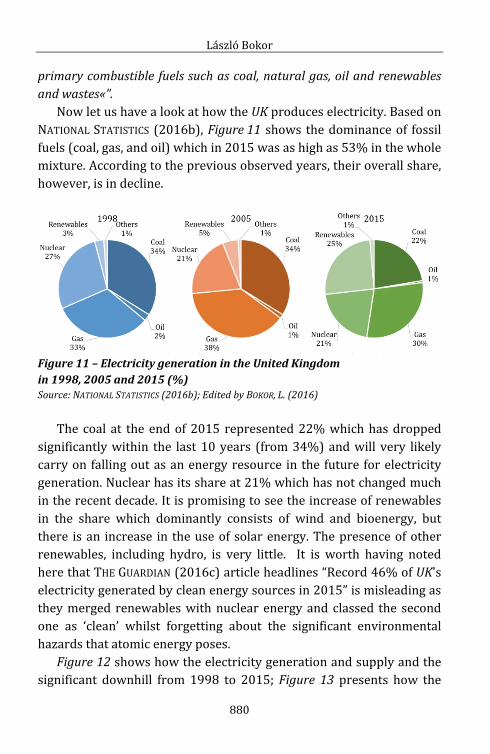
primary combustible fuels such as coal, natural gas, oil and renewables and wastes«”. Now let us have a look at how the UK produces electricity. Based on NATIONAL STATISTICS (2016b), Figure 11 shows the dominance of fossil fuels (coal, gas, and oil) which in 2015 was as high as 53% in the whole mixture. According to the previous observed years, their overall share, however, is in decline.
Figure 11 – Electricity generation in the United Kingdom in 1998, 2005 and 2015 (%) Source: NATIONAL STATISTICS (2016b); Edited by BOKOR, L. (2016) The coal at the end of 2015 represented 22% which has dropped significantly within the last 10 years (from 34%) and will very likely carry on falling out as an energy resource in the future for electricity generation. Nuclear has its share at 21% which has not changed much in the recent decade. It is promising to see the increase of renewables in the share which dominantly consists of wind and bioenergy, but there is an increase in the use of solar energy. The presence of other renewables, including hydro, is very little. It is worth having noted here that THE GUARDIAN (2016c) article headlines “Record 46% of UK's electricity generated by clean energy sources in 2015” is misleading as they merged renewables with nuclear energy and classed the second one as ‘clean’ whilst forgetting about the significant environmental hazards that atomic energy poses.
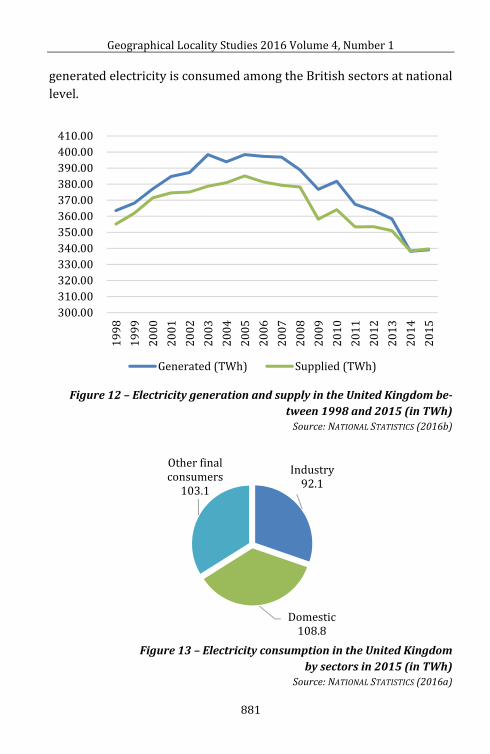
Figure 12 shows how the electricity generation and supply and the significant downhill from 1998 to 2015; Figure 13 presents how the
Geographical Locality Studies 2016 Volume 4, Number 1
881
generated electricity is consumed among the British sectors at national level.
Figure 12 – Electricity generation and supply in the United Kingdom be-
tween 1998 and 2015 (in TWh) Source: NATIONAL STATISTICS (2016b)
Figure 13 – Electricity consumption in the United Kingdom
by sectors in 2015 (in TWh) Source: NATIONAL STATISTICS (2016a)
300.00310.00320.00330.00340.00350.00360.00370.00380.00390.00400.00410.001998 1999 2000 2001 2002 2003 2004 2005 2006 2007 2008 2009 2010 2011 2012 2013 2014 2015Generated (TWh) Supplied (TWh)
Industry92.1
Domestic108.8
Other final consumers103.1
László Bokor
882
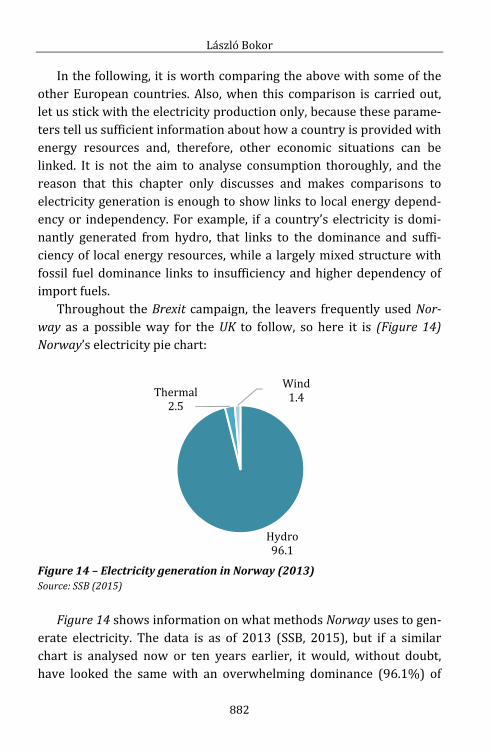
In the following, it is worth comparing the above with some of the other European countries. Also, when this comparison is carried out, let us stick with the electricity production only, because these parame-ters tell us sufficient information about how a country is provided with energy resources and, therefore, other economic situations can be linked. It is not the aim to analyse consumption thoroughly, and the reason that this chapter only discusses and makes comparisons to electricity generation is enough to show links to local energy depend-ency or independency. For example, if a country’s electricity is domi-nantly generated from hydro, that links to the dominance and suffi-ciency of local energy resources, while a largely mixed structure with fossil fuel dominance links to insufficiency and higher dependency of import fuels. Throughout the Brexit campaign, the leavers frequently used Nor-way as a possible way for the UK to follow, so here it is (Figure 14) Norway’s electricity pie chart:
Figure 14 – Electricity generation in Norway (2013) Source: SSB (2015)
Figure 14 shows information on what methods Norway uses to gen-erate electricity. The data is as of 2013 (SSB, 2015), but if a similar chart is analysed now or ten years earlier, it would, without doubt, have looked the same with an overwhelming dominance (96.1%) of
Hydro96.1
Thermal2.5 Wind 1.4

Geographical Locality Studies 2016 Volume 4, Number 1
883
hydroelectric power. And, it is very likely that this mixture will not change any soon in the future. The answer behind the predominant share of hydro power based on at least two, but very important, factors and both are geographic: 1) Norway is situated in the oceanic climate region and 2) it is a largely mountainous country with high peaks, steep hillsides, deep valleys and fjords. The first information tells us that the country receives an immense amount of precipitation every year (above 1,000 mm), the second tells us that the country’s natural givens are fully suitable for harnessing the power of the rivers. Basical-ly, the UK and Norway are very similar in their physical features, but whilst the first one’s mountain municipalities share 25.21%, the sec-ond one’s 91.84% (EUROPEAN COMMISSION, 2004). As of today, Norway has access to over 4,000 river systems, and has over 900 fully opera-tional hydro power plants with the installed capacity around 30,000 MW (produces about 125 TWh electricity) which makes Norway the 6th largest hydroelectricity producer on Earth (GONZALES, D. et al. 2011; WIKIPEDIA, 2016). It is also an important fact that Norway, since the discovery of the North Sea and Barents Sea hydrocarbon fields, the country’s economy has been dominantly set on the trade of crude oil and natural gas. Their domestic use is very little and both are mainly used in transpor-tation (fuels) and household supplies (cooking and heating). According to CIA (2016), whilst the production in 2015 was estimated 1.568 mil-lion barrels per day4, the refined petroleum products consumption was only 225,200 bbl/day (the production in the UK in 2013 was 771,800 bbl/day, the refined petroleum products consumption in 2014 esti-mated to 1.505 million bbl/day). According to INDEXMUNDI (2016), the domestic use has been constant since 1980 whilst the production peak period was in 2000 when, on a daily basis, 3,222 thousand barrels of crude oil was produced, principally for export purposes. That is where Norway’s richness comes from which is the overall result of the natu-rally available energy resources, the size of the country’s consumption basis and excellent trade policies in place (such as fishing). 4 An oil barrel (USA) which is abbreviated bbl.

László Bokor
884
The situation regarding electricity generation and the reliance of energy resources in Iceland is very similar to that of Norway’s (Fig-ure 15).
Figure 15 – Electricity generation in Iceland (2015) Source: OS (2015) The harness of hydroelectric power has been the most traditional since the main island, according to its terrain and climatic conditions (also oceanic), has a vast amount of water to utilise. The share in mix has just recently dropped down to 73.3% which is due to the more diverse and logical use of geothermal energy. Iceland is an active vol-canic island where the energy of Earth can easily and sufficiently be accessed without any modification. All the energy production then is consumed by only a small number of people which is about the same as a middle-size city in the UK. Iceland, according to its natural re-sources, is able to supply its electricity production from 100% domes-tic resources. One would now raise the fact that Iceland does not re-quire international co-operation, but in 2016, exclusion from global happenings would not make Iceland one of the richest (by GDP) and most developed countries on the planet. This country still has to be part of international trade and research networks. The third country one could hear about many times through the Brexit campaign is Switzerland whose energy usage and electricity
Hydro73.3
Geothermal26.6 Wind0.1

Geographical Locality Studies 2016 Volume 4, Number 1
885
generation is significantly different to those in Norway and Iceland (and also in the UK) (Figure 16).
Figure 16 – Electricity generation in Switzerland (2015)
Source: SFOE (2016) The country is, however, situated in the middle of the Alps where a high number of fast and powerful rivers can be utilised for energetic purposes. Switzerland has a very strict environmental regulation in place which does not allow the use of conventional power stations, therefore the rest of the electricity is predominantly produced by nu-clear power stations. Several other European countries and their primary energy use or electricity production could be looked at which would show a different reliance according to their natural givens. It is however a good idea to have a look at Germany, a country with similar size of economy, land area and population to the UK, how and in what ways produces elec-tricity (Figure 17). Having an analytical look at the pie chart, one can see an example of a traditional, strong, continental economy. The coal is still very domi-nant, but the energy share shows a diverse range of energy resources. The best way to be quasi independent or secured on energy resources when a country has a continental situation if a country develops the energy mix as diverse as possible, which means: the more type of en-
Hydro59.90%Nuclear33.50%
Thermal4% Other renewables2.60%

László Bokor
886
ergy sources is being used, the better and safer the country’s electricity production is.
Figure 17 – Electricity generation in Germany (2016) Source: FRAUNHOFER ISE (2016) In Germany, this means a wider and more efficient reliance on local-ly available renewable energy resources including dominantly wind, biomass, solar and hydro energy which currently sums up 36.9% in the overall share. Never underestimate the importance of the total share of renewables, Germany (and the UK too) is still dependent on fossil re-sources and they need a wider integration with other energy suppliers to run their country and economy effectively. As an extra addition, Japan is one of the non-European examples that has a very dependant energy economy which, according to 2013 statistics, includes 32.42% coal, 14.43% oil, 38.68% gas, 0.9% nuclear5, 7.52% hydroelectric, and 6.04% other renewables in its energy mix whilst the country’s production, according to its naturally available fossil resources, are very limited (FEPC-DP, 2016). Also, the country is isolated from mainland grid integration and, despite its rich renewable resources, Japan only uses 2% of these for electricity generation (BER- 5 Note that after the Fukushima accident (2011) caused by a series of earthquake and tsunami, Japan shut down all of its nuclear reactors (54) and only 2 have been approved to restart since 2012 (BERRAHO, D. 2012). Before the great shut down, nuclear energy represented about 30% in Japan’s electricity generation.
Hydro4.4% Biomass8.8%Wind14.4%Solar7.8%Nuclear14.5%Coal42.1%
Oil0.7%Gas7.3%

Geographical Locality Studies 2016 Volume 4, Number 1
887
RAHO, D. 2012). After the Fukushima accident, as a result of nuclear phase-out, the Japanese government has started moving towards the renewables and by 2030, it aims to achieve about 22–24% of its share in the energy mix (FEPC-DP, 2016). 7. Summary and conclusion It is important to rule out the principal differences among these charts, shown in Chapter 6, based only on electricity generation of the United Kingdom, Norway, Iceland, Switzerland, Germany, and additionally of Japan; and even more important to understand the ‘whys’ and ‘hows’ in the overall energy economics. It is understandable that an area without suitable terrain will not be able to provide a country with the possibility to build efficient hydroelectric power stations. But, Europe is a large continent where a significant number of locally accessible renewable resources is available. If the charts are analysed at national levels, the Need Model (BOKOR, L. – NEMES, V. 2014) helps show what this dependence means if the UK is compared, for example, to Norway (Figure 18). The Need model shows how a local entity should rely on its local re-sources to be independent, but if this is not possible, and in most coun-tries’ cases it is not, then a wider co-operation is required between or among those places who have the same or similar energetic conditions. In this case, being part of a larger economic body with a significantly larger land mass is the only rational answer. If this model is set against electricity generation (Figure 18), Norway produces 100% of its de-mand from domestic resources (SSB, 2015) which indicates positive sustainability, energy use and efficiency, whilst the UK’s dependency on imported fuels is predicted to increase in the next decade (in 2015, the import dependency was 38.6%—DEPARTMENT OF ENERGY AND CLI-MATE CHANGE, 2016b) means negative local sustainability. This growing reliance is unavoidable even if the demand is set to shrink (MORISON, R. 2016); therefore, the UK needs international co-operation to provide its economy with the necessary resources. In the event of Brexit, Brit-ain would, however, face higher energy import prices which would

László Bokor
888
potentially drive up domestic energy prices (KAHYA, D. 2016). This is why the UK’s Need Model is negative, but the Co-operation Model indi-cates that this could still be shifted towards positive sustainability. The answer is a wider international integration and not separation. Most of the energetic challenges that affect a certain locus (a country for in-stance) are eventually political negotiations too which means, natural-ly provided and locally available resources and their domestic utilisa-tion is always a subject of current political decisions. These decisions are not always rational and not always focus on those that would make a country’s energy systems independent.
Figure 18 – The Need Model adapted to the UK and Norway according to their electricity generation reliance Based on BOKOR, L. – NEMES, V. (2014), edited by BOKOR, L. (2016)

Geographical Locality Studies 2016 Volume 4, Number 1
889
The energy economics of the Earth (including all the economies) has been increasingly shifting towards the use of renewable energy resources. The answers may be simple: the easily accessible fossil en-ergy resources are in decline, mostly because their extraction is not economically sustainable any longer (because the easily accessible resources have already run out) and due to known environmental concerns and their evident contribution to global climate change. In this progressive system, energy resources (especially wind and solar) will be increasingly favoured and this is the only way for Europe to become more independent on import fuels from outside the continent which is the definite result of the reduction of fossil fuels. The Europe-an Union’s physical geographical properties indicate that the entire continent could move towards and be by 2050 a decarbonised, reliable and efficient, largely renewable energy resources-based power system (PwC, 2011). But one has to see that the members of the European Union have to stick together to create a sustainable energy network and the key part of this is a wider integration and the independent use of the ‘constant’ resources available (shared) among the (currently) 28 member states. 8. Further researches As it was presented in the case of Japan, the energy structure of an economy can change significantly, if an unaccepted event happens. The Fukushima accident has had a major impact on the Japanese, which has spiralled implications globally onto other energy economics. The ener-gy structure of these other local formations may change overnight which has to be frequently analysed and updated. The author of this paper is planning to carry on developing a measuring method (which started a few years ago as a co-operation—BOKOR, L. – NEMES, V. 2014) to emphasise differences, for example between the United Kingdom and Norway, by employing indexed data which will give more under-standing to the Need and Co-operation models.

László Bokor
890
References BIAN, Z. – INYANG, H. I. – DANIELS, J. L. – OTTO, F. – STRUTHERS, S. (2010): Environmen-tal Issues from Coal Mining and their Solutions. – Mining Science and Tech-nology (China); Volume 20, Issue 2, pp. 215–223. BOKOR, L. (2013). The Importance of Energy Resources in the Local Environment. In: BOKOR, L. – CSAPÓ, J. – SZELESI, T. – WILHELM, Z. (eds.) Locality and the Ener-gy Resources. Geographical Locality Studies 2013 Volume 1., Number 1. – Frugeo Geography Research Initiative, Shrewsbury, pp. 14–29. BOKOR, L. (2012): Kell-e nekünk vízerőmű? A drávai példa. – Geographia Pan-nonica Nova 13. – IDResearch Kft./Publikon Kiadó, Pécs, pp. 217–230. BREUER, H. (2002). Atlasz – Fizika. – Athenaeum 2000, Budapest, p. 43. BRONOWSKI, J. (1956): The Real Responsibility of the Scientist. Bulletin of the Atomic Scientists, Volume 11, Number 1. – Taylor & Francis Ltd, London, p. 10. EDDINGTON, A. (1935). New Pathways in Science: Messenger Lectures, 1934. – The University Press, Cambridge, pp. 160–163. FREESE, B. (2006): Coal. A Human History. – Arrow Books, London, 384 p. GONZALEZ, D. – KILINC, A. – WEIDMANN, N. (2011): Renewable Energy Development. Hydropower in Norway. Seminar papers in international finance and eco-nomics. Center for Applied International Finance and Development (CAIFD), Georg Simon Ohm, University of Applied Sciences Nuremberg, pp 12–15. GRIFFITHS, A. – WALL, S. (2011): Chapter 1: Changes in the economic structure. In: Applied Economics, 12/E. – Anglia Ruskin University, Financial Times Press, p. 9. GULYÁS, J. – RÁCZ, M. – TOMCSÁNYI, P. – VARGA, A. (1995). Fizika – Ennyit kell(ene) tudnod. – Akkord és Panem Kiadó közös kiadása, Budapest, pp. 50–52. HOLICS, L. (ed.) (2009). Fizika. – Akadémiai Kiadó, Budapest, pp. 1217–1220. ISO 13600 (1997). Technical energy systems – Basic concepts. – International Organization for Standardization, 24 p. MCLEAN, A. C. – GRIBBLE, C. D. (1985): Geology for Civil Engineers – 2nd edition. Chapter 4.6.2: The Rocks of Britain. – E & FN Spon, Routledge, p. 151. STRAHLER, A. H. – STRAHLER, A. N. (2002). Physical Geography. Science and Systems of the Human Environment. Second Edition. – John Wiley & Sons, Inc., New York, pp. 22–64. WAUGH, D. (2000): Geography. An Integrated Approach. – Nelson, Walton-on-Thames, UK, p. 536.
Geographical Locality Studies 2016 Volume 4, Number 1
891
WOODCOCK, N. (1994): Geology and Environment in Britain and Ireland. Chapter 10.4. Burial and maturation. – University College London Press, London, p. 112.
Electronic sources ADB (2009): Understanding and Responding to Climate Change in Developing Asia. Asian Development Bank [online]. (pdf). Asian Development Bank, Manila, Philippines, p. 29. Available at: <http://beta.adb.org/sites/default/files/understanding-climate-change.pdf> [Accessed 30 July 2016] ALDRED, J. – STARKEY, N. (2013): Nuclear power in the UK – a history. Key events in the history of nuclear power in Britain. The Guardian [online]. 21 October 2013. Available at: <https://www.theguardian.com/environment/2013/oct/21/nuclear-power-in-the-uk-a-history> [Accessed 12 July 2016] ALDRED, J. – STARKEY, N. (2013): Nuclear power in the UK – a history. Key events in the history of nuclear power in Britain. The Guardian [online]. 21 October 2013. Available at: <https://www.theguardian.com/environment/2013/oct/21/nuclear-power-in-the-uk-a-history> [Accessed 12 July 2016] BBC NEWS (2015): Closure of Kellingley pit brings deep coal mining to an end. BBC News [online]. 18 December 2015, York & North Yorkshire. Available at: <http://www.bbc.co.uk/news/uk-england-york-north-yorkshire-35124077> [Accessed 23 July 2016] BERRAHO, D (2012): Options for the Japanese electricity mix by 2050. KTH School of Industrial Engineering and Management [online]. pdf. Master of Science Thesis, 68 p. Available at: <http://kth.diva-portal.org/smash/get/diva2:563370/FULLTEXT01.pdf> [Accessed 22 Oc-tober 2016] BGS (2010): Uranium. British Geological Society [online]. pdf, March 2010, 23 p. Available at: <https://www.bgs.ac.uk/downloads/start.cfm?id=1409> [Accessed 11 June 2016] BGS (n.a.): Geothermal energy — what is it?. British Geological Society [online]. Available at: <http://www.bgs.ac.uk/research/energy/geothermal/> [Ac-cessed 12 June 2016] BHA (2016): Hydro in the UK. British Hydropower Association [online]. Availa-ble at: <http://www.british-hydro.org/hydro_in_the_uk> [Accessed 19 June 2016]

László Bokor
892
BIS (2012): Industrial Strategy: UK Sector Analysis. GOV.uk [online]. pdf. BIS Economics Paper No.18. 40 p. Available at: <https://www.gov.uk/government/uploads/system/uploads/attachment_data/file/34607/12-1140-industrial-strategy-uk-sector-analysis.pdf> [Ac-cessed 22 October 2016] CIA (2016): The World Factbook. Central Intelligence Agency [online]. Availa-ble at: <https://www.cia.gov/library/publications/the-world-factbook/geos/no.html> [Accessed 23 October 2016] CRITCHLOW, A. (2015): Britain can't afford to write off North Sea oil after 40 years. The Telegraph [online]. 04 September 2015. Available at: <http://www.telegraph.co.uk/finance/newsbysector/energy/oilandgas/11844812/Britain-cant-afford-to-write-off-North-Sea-oil-after-40-years.html> [Accessed 21 October 2016] DEPARTMENT OF ENERGY AND CLIMATE CHANGE (2016a): Crude oil and petroleum: production, imports and exports 1890 to 2015. GOV.uk [online]. Excel docu-ment. Available at: <https://www.gov.uk/government/statistical-data-sets/crude-oil-and-petroleum-production-imports-and-exports-1890-to-2011> [Accessed 29 July 2016] DEPARTMENT OF ENERGY AND CLIMATE CHANGE (2016b): UK Energy Statistics, 2015 & Q4 2015. GOV.uk [online]. pdf. Statistical press release, 16 p. Available at: <https://www.gov.uk/government/uploads/system/uploads/attachment_data/file/513244/Press_Notice_March_2016.pdf> [Accessed 31 July 2016] DONEV, J (n.a.): Total primary energy supply. Energy Education [online]. Availa-ble at: <http://energyeducation.ca/encyclopedia/Total_primary_energy_supply> [Accessed 14 July 2016] EIA (2016): Natural Gas Explained. U.S. Energy Information Administration [online]. Last reviewed January 12, 2016. Available at: <http://www.eia.gov/energyexplained/?page=natural_gas_environment> [Accessed 21 October 2016] ENERGINET (2016): Electricity generation. Energinet.dk [online]. Updated on 7 September 2016. Available at: <http://www.energinet.dk/EN/KLIMA-OG-MILJOE/Miljoerapportering/Elproduktion-i-Danmark/Sider/Elproduktion-i-Danmark.aspx> [Accessed 07 September 2016] ENERGY-UK (n.a.): Electricity generation. Energy UK [online]. Available at: <http://www.energy-uk.org.uk/energy-industry/electricity-generation.html> [Accessed 21 October 2016]

Geographical Locality Studies 2016 Volume 4, Number 1
893
EUROPEAN COMMISSION (2004): Electricity generation. Energy UK [online]. pdf. In: Mountain Areas in Europe: Analysis of mountain areas in EU member states, acceding and other European countries. Final report, document 4, p. 24. Available at: <http://ec.europa.eu/regional_policy/sources/docgener/studies/pdf/montagne/mount4.pdf> [Accessed 01 November 2016] FEPC-DP (2016): Electricity review Japan. The Federation of Electric Power Companies of Japan [online]. pdf. Review document July 2016, 15 p. Availa-ble at: <http://fepc-dp.jp/pdf/03_electricity.pdf> [Accessed 22 October 2016] FRAUNHOFER ISE (2016): Electricity generation in Germany in 2016. Energy charts [online]. Available at: <https://www.energy-charts.de/energy_pie.htm> [Accessed 22 October 2016] GAILLE, S. (2016): Brexit’s Impact on the Energy Industry [Gaille Energy Blog Issue 28]. LinkedIn [online]. Available at: <https://www.linkedin.com/pulse/brexits-impact-energy-industry-gaille-blog-issue-28-scott-gaille> [Accessed 1 July 2016] GOV (2013): Wave and tidal energy: part of the UK's energy mix. GOV.uk [online]. Published: 22 January 2013. Available at: <https://www.gov.uk/guidance/wave-and-tidal-energy-part-of-the-uks-energy-mix> [Accessed 04 August 2016] GOV (2016): Chapter 6: Renewable sources of energy. GOV.uk [online]. pdf. Available at: <https://www.gov.uk/government/uploads/system/uploads/attachment_data/file/547977/Chapter_6_web.pdf> [Accessed 22 July 2016] GREENFO (2016): Nem kell Orbánéknak a szélenergia. Greenfo.hu [online]. 2016. szeptember 5. Available at: <http://greenfo.hu/hirek/2016/09/05/nem-kell-orbaneknak-a-szelernergia> [Accessed 05 September 2016] IEA (n.a.): Definitions: TPES. IEA [online]. Available at: <https://www.iea.org/statistics/resources/balancedefinitions/#tpes> [Accessed 14 July 2016] INDEXMUNDI (2016): Norway Crude Oil Production and Consumption by Year. Indexmundi [online]. Available at: <http://www.indexmundi.com/energy/?country=no> [Accessed 10 July 2016]
László Bokor
894
JEFFERIES, D. (2014): Do we need to build a European supergrid to secure our energy supply?. The Guardian [online]. 19 June 2014. Available at: <https://www.theguardian.com/big-energy-debate/european-supergrid-secure-energy-supply> [Accessed 21 October 2016] KAHYA, D. (2016): How Brexit could drive up UK energy bills. EnergyDesk, Greenpeace [online]. Published: June 20, 2016. Available at: <http://energydesk.greenpeace.org/2016/06/20/brexit-what-will-be-the-impact-on-energy-bills/> [Accessed 30 July 2016] KRAEV, K. (2016): Russia’s nuclear energy expansion – a geopolitical foot-print?.New Eastern Europe [online]. Published: 28 June 2016. Available at: <http://www.neweasterneurope.eu/articles-and-commentary/2040-russia-s-nuclear-energy-expansion-a-geopolitical-footprint> [Accessed 21 October 2016] LEKSHMI, S. (2010): Importance of electricity. The Hindu [online]. Available at: <http://www.thehindu.com/features/kids/importance-of-electricity/article216311.ece> [Accessed 23 July 2016 MASON, R. (2016): Hinkley Point: ministers sign go-ahead for nuclear power plant. The Guardian [online]. 29 September 2016. Available at: <https://www.theguardian.com/uk-news/2016/sep/29/hinkley-point-ministers-sign-go-ahead-for-nuclear-power-plant> [Accessed 29 Septem-ber 2016] MORISON, R. (2016): U.K. Reliance on Electricity, Natgas Imports to Increase by 2030. Bloomberg [online]. Available at: <http://www.bloomberg.com/news/articles/2016-07-04/u-k-reliance-on-electricity-natgas-imports-to-increase-by-2030> [Accessed 23 October 2016] NATIONAL STATISTICS (2015): UK Energy in Brief 2015. GOV: Department of Ener-gy & Climate Change [online]. (pdf). National Statistics, Department of En-ergy & Climate Change, 48 p. Available at: <https://www.gov.uk/government/uploads/system/uploads/attachment_data/file/516837/UK_Energy_in_Brief_2015.pdf> [Accessed 15 July 2016] NATIONAL STATISTICS (2016a): UK Energy Statistics, 2015 & Q4 2015. GOV: De-partment of Energy & Climate Change [online]. (pdf). National Statistics, Department of Energy & Climate Change, p 9. Available at: <https://www.gov.uk/government/uploads/system/uploads/attachment_data/file/513244/Press_Notice_March_2016.pdf> [Accessed 17 July 2016]

Geographical Locality Studies 2016 Volume 4, Number 1
895
NATIONAL STATISTICS (2016b): Energy Trends: electricity. GOV [online]. (Excel document). National Statistics, Department for Business, Energy & Indus-trial Strategy. Available at: <https://www.gov.uk/government/statistics/electricity-section-5-energy-trends> [Accessed 02 November 2016] OS (2015): Sweet vs. Sour Crude Oil. Orkustofnun [online]. pdf. 14 p. Available at: <http://os.is/gogn/os-onnur-rit/orkutolur_2015-enska.pdf> [Accessed 12 July 2016] ØVERGAARD, S. (2008): Issue paper: Definition of primary and secondary energy. UN Statistics [online]. (pdf). 7 p. Available at: <http://unstats.un.org/unsd/envaccounting/londongroup/meeting13/LG13_12a.pdf> [Accessed 21 July 2016] PETROLEUM (2015): Sweet vs. Sour Crude Oil. Petroleum.co.uk [online]. Available at: <http://www.petroleum.co.uk/sweet-vs-sour> [Accessed 21 October 2016] PWC (2011): Mowing towards 100% renewable electricity in Europe & North Africa by 2050. PwC [online]. pdf. PwC, Potsdam Institute for Climate Im-pact Research (PIK), International Institute for Applied Systems Analysis (IIASA), 80 p. Available at: <https://www.pwc.at/publikationen/klimawandel-nachhaltigkeit/moving-towards-100-percent-renewable-electricity-in-eu-and-africa-by-2050.pdf> [Accessed 23 October 2016] SFOE (2016): Schweizerische Elektrizitätsstatistik 2015. Swiss Federal Office of Energy SFOE [online]. Available at: <http://www.bfe.admin.ch/php/modules/publikationen/stream.php?extlang=de&name=de_883496391.pdf&endung=Schweizerische%20Elektrizit%E4tsstatistik%202015> [Accessed 28 July 2016] SSB (2015): Electricity, annual figures, 2013. Statistics Norway [online]. Availa-ble at: <http://www.ssb.no/en/energi-og-industri/statistikker/elektrisitetaar/aar/2015-03-25> [Accessed 23 July 2016] THE ECONOMIST (2015): Crude realities. The Economist [online]. Jan 24th 2015. Available at: <http://www.economist.com/news/britain/21640344-tumbling-oil-price-piles-more-pressure-sinking-industry-crude-realities> [Accessed 21 October 2016]

László Bokor
896
THE GUARDIAN (2016a): EU referendum: full results and analysis. The Guardian [online]. Available at: <http://www.theguardian.com/politics/ng-interactive/2016/jun/23/eu-referendum-live- results-and-analysis> [Ac-cessed 24 June 2016] THE GUARDIAN (2016b): UK energy from coal hits zero for first time in over 100 years. The Guardian [online]. Available at: <https://www.theguardian.com/environment/2016/may/13/uk-energy-from-coal-hits-zero-for-first-time-in-over-100-years> [Accessed 15 July 2016] THE GUARDIAN (2016c): Record 46% of UK's electricity generated by clean energy sources in 2015. The Guardian [online]. Available at: <https://www.theguardian.com/environment/2016/jul/28/record-46-of-uks-electricity-generated-by-clean-energy-sources-in-2015> [Accessed 02 November 2016] THE WORLD BANK (2014): Electricity production from coal sources (% of total). The World Bank [online]. IEA Statistics (Excel document). Available at: <http://data.worldbank.org/indicator/EG.ELC.COAL.ZS> [Accessed 15 July 2016] UK COAL (2011): UK Coal Reserves. UK Coal [online]. Available at: <http://www.ukcoal.com/world-coal-statistics.html> [Accessed 23 July 2016] USCG (2011): BP Deepwater Horizon oil spill. United States Coast Guard [online]. (pdf). Final report 2011. p. 34. Available at: <https://www.uscg.mil/foia/docs/dwh/bpdwh.pdf> [Accessed 30 July 2016] VAUGHAN, A. (2016): Solar outstrips coal in past six months of UK electricity gen-eration. The Guardian [online]. 4 October 2016. Available at: <https://www.theguardian.com/environment/2016/oct/04/solar-outstrips-coal-in-past-six-months-of-uk-electricity-generation> [Accessed 01 November 2016] WIKIPEDIA (2016): Electricity sector in Norway. Wikipedia [online]. Available at: <https://en.wikipedia.org/wiki/Electricity_sector_in_Norway> [Accessed 19 October 2016] WNA (2016a): Nuclear Power in the United Kingdom. World Nuclear Associa-tion [online]. Updated: October 2016. Available at: <http://www.world-nuclear.org/information-library/country-profiles/countries-t-z/united-kingdom.aspx> [Accessed 20 October 2016]

Geographical Locality Studies 2016 Volume 4, Number 1
897
WNA (2016b): Nuclear Power in Hungary. World Nuclear Association [online]. Updated: July 2016. Available at: <http://www.world-nuclear.org/information-library/country-profiles/countries-g-n/hungary.aspx> [Accessed 20 October 2016] WNA (2016c): Nuclear Power in Slovakia. World Nuclear Association [online]. Updated: June 2016. Available at: <http://www.world-nuclear.org/information-library/country-profiles/countries-o-s/slovakia.aspx> [Accessed 20 October 2016] WNA (2016d): Nuclear Power in the European Union. World Nuclear Associa-tion [online]. Updated: October 2016. Available at: <http://www.world-nuclear.org/information-library/country-profiles/others/european-union.aspx> [Accessed 21 October 2016] WOLTERS KLUWER (2016): 277/2016. (IX. 15.) Korm. Rendelet a szélerőművekre vonatkozó szabályok módosításáról. Wolters Kluwer [online]. Available at: <http://net.jogtar.hu/jr/gen/hjegy_doc.cgi?docid=A1600277.KOR×hift=fffffff4&txtreferer=00000001.TXT> [Accessed 01 November 2016] YAHOO (2016): Nem kell Orbánéknak a szélenergia. Yahoo news [online]. Octo-ber 19, 2016. Available at: <https://www.yahoo.com/news/scientists-accidentally-found-great-way-161618296.html> [Accessed 21 October 2016]