Embed Size (px)
Citation preview
ENERGY MANAGEMENT IN INDUSTRIES
FACULTY OF ENGINEERING AND SUSTAINABLE DEVELOPMENT
Department of Building, Energy and Environmental Engineering
Energy management in Industries
Analysis of energy saving potential by steam condensate return
Biniam Okbaendrias Kifleyesus
2017
Student thesis, Master degree (one year),15 HE Energy Systems
Master Programme in Energy Systems
Master’s Thesis
Supervisor: Curt Björk, Nawzad Mardan, Mattias Andersson Examiner: Abolfazl Hayati
ENERGY MANAGEMENT IN INDUSTRIES
i
Abstract
When speaking about energy it means speaking about life, activity, economy, growth and
environmental issues. The issue of energy has been the main article all over the world in recent
years, this is due to the importance of energy to life and its impact on the environment. For
example, Paris climate change meeting in 2015 is one of the recent global meeting which directly
related to the energy use by nations. The meeting was mainly focused up on the restriction of
greenhouse gas emission which implies that industries should think about other alternative
energy resources rather than fossil fuel for positive impact on climatic change. This is one of the
cases that led industries into greater competition in the global market. Industries must consider
energy alternatives which is safe for the environment and by using such energy a competitive
product with better quality and quantity should be produced. This challenge has motivated
industries to look and study the energy that they are using currently.
Studies and researches show that one of the main and most abundant energy resources that
most of these industries can get is by improving the energy efficiency or managing the energy
that they currently use. The main aim of this thesis is to provide Arizona chemical plant (Kraton)
at Sandarne on the potential energy saving by managing their energy use. The first wisdom in
energy utilization is managing and using the energy they possess efficiently. In Arizona plant at
Sandarne, the product named “Pitch” (a natural viscoelastic polymer or rosin) is a fuel used as
the primary energy supply for the production of steam by boilers. The steam may be utilized
well but the energy in the condensate (after steam loses its latent heat) is not addressed well
enough. Hence this paper has studied on how significant is the energy lost by the steam
condensate is and how its recovery can be used to save energy and cost.
The plant produces about an average of 11.42 ton of steam each hour in a year. This steam can
be returned or fully recovered (100%) as condensate from the law of conservation of mass since
only energy is lost from the steam. But the plant returns a maximum of about 3ton of
condensate each hour. This amount is relatively low compared to the amount of condensate
recovery possibility. Recovery possibility of condensate return showed that the plant at
Sandarne can return at least 8.5 ton of condensate each hour. In comparison with the current
return estimated 5.5 ton of condensate is being lost simply as waste each hour leading to about
400 SEK minimum cost loss. The calculation of cost is in minimum because the charge from water
supply and condensate effluent disposal charge are not considered. In this paper only recovery
from the easily recoverable steam condensate is being considered (25% of the system) which
resulted in payback time of the proposed investment 1.88 years without considering the above
explained charges.
It is much motivating study considering the generalized approach and over simplified method.
If a deeper investigation is made on the potential, it can be clearly shown that how significant
the potential is in securing and sustaining energy and environmental issues. Ensuring the
security and sustainability of energy which addresses the environmental issue precisely will help
the plant to stay on the race of global market competition.
Keywords: Energy efficiency, Boiler efficiency, Energy management, Condensate recovery,

ENERGY MANAGEMENT IN INDUSTRIES
ii
Acknowledgements
I never thought that I would get this chance thanks to Professor Nawzad Mardan who has helped
me in everything. My supervisors Curt Björk and Mattias Andersson who have assisted me by
providing the data’s and materials I need for this paper.
I thank generally to Kraton plant at Sandarne and all the faculty of engineering and sustainable
development especially the department of building, energy and environment at university of
Gävle.
At last great thanks to my friend Fayad for his support and to my family for their endless support and motivation despite the difficult situation they are facing back home.
ENERGY MANAGEMENT IN INDUSTRIES
iii
Table of Contents
1 Introduction ............................................................................................. 1
1.1 Overview ............................................................................................................ 1
1.2 Sweden Energy ................................................................................................... 2
1.3 Industrial Energy ................................................................................................ 4
1.4 Literature review ................................................................................................ 6
1.5 Objectives and limitations ................................................................................. 7
1.6 Object Description – Arizona Chemical ............................................................. 7
1.6.1 Kraton Corporation at Sandarne ............................................................................... 8
1.6.2 Kraton Energy ............................................................................................................ 8
1.6.3 Kraton condensate return ......................................................................................... 9
1.7 Approach ............................................................................................................ 9
2 Theory .................................................................................................... 10
2.1 Steam Energy ................................................................................................... 10
2.2 Condensate ...................................................................................................... 10
2.2.1 Benefits of condensate ............................................................................................ 10
2.2.2 Recovering condensate ........................................................................................... 11
3 Method .................................................................................................. 13
3.1 Boiler efficiency................................................................................................ 13
3.2 Steam Energy produced ................................................................................... 14
3.3 Condensate energy loss ................................................................................... 15
3.4 Estimated cost lost by the condensate ............................................................ 16
3.4.1 Estimating lost fuel cost .......................................................................................... 16
3.4.2 Estimating lost treating chemicals cost ................................................................... 16
4 Results ................................................................................................... 17
4.1 Energy savings .................................................................................................. 17
4.2 Cost savings ...................................................................................................... 17
4.3 Environmental benefits.................................................................................... 18
4.4 Economic analysis ............................................................................................ 18
4.4.1 Equipment cost ....................................................................................................... 18
4.4.2 Payback time ........................................................................................................... 19
5 Discussion .............................................................................................. 20
6 Conclusion ............................................................................................. 21
6.1 Study result ...................................................................................................... 21
ENERGY MANAGEMENT IN INDUSTRIES
iv
6.2 Outlook ............................................................................................................ 21
7 References ............................................................................................. 22
8 Appendices ............................................................................................ 24
8.1 Appendix I ........................................................................................................ 24
8.2 Appendix II ....................................................................................................... 25
8.3 Appendix III ...................................................................................................... 26
8.4 Appendix IV ...................................................................................................... 27
ENERGY MANAGEMENT IN INDUSTRIES
v
Table of figures
Figure 1-1 Energy growth[1] ......................................................................................................................... 1 Figure 1-2 Sweden industry energy supply share [7][6] ............................................................................... 3 Figure 1-3 Industrial energy end use share [6] ............................................................................................. 3 Figure 1-4Total energy end-use by sectors (1949-2016) in quadrillion Btu [8] ............................................ 4 Figure 1-5 World Energy Intensity ................................................................................................................ 5 Figure 1-6 Energy end-use share by sectors of the total energy end-use in time [1] .................................. 5 Figure 1-7 Kraton plant at sanderne (source google map) ........................................................................... 8 Figure 1-8 Feed water and condensate return at the plant [29] ................................................................. 9 Figure 3-1 Energy balance around a boiler [31] ......................................................................................... 13 Figure 3-2 Proportion of condensate energy to steam energy according to pressure [12] ....................... 15 Figure 8-1 World energy balance (available www.iea.org) ....................................................................... 24 Figure 8-2 Sweden energy balance [6]....................................................................................................... 25 Figure 8-3 Flow chart of steam, condensate and make up water [29]. ...................................................... 26 Figure 8-4 The 20, 10 and 3bar steam flow chart [29]. ............................................................................. 27
ENERGY MANAGEMENT IN INDUSTRIES
vi
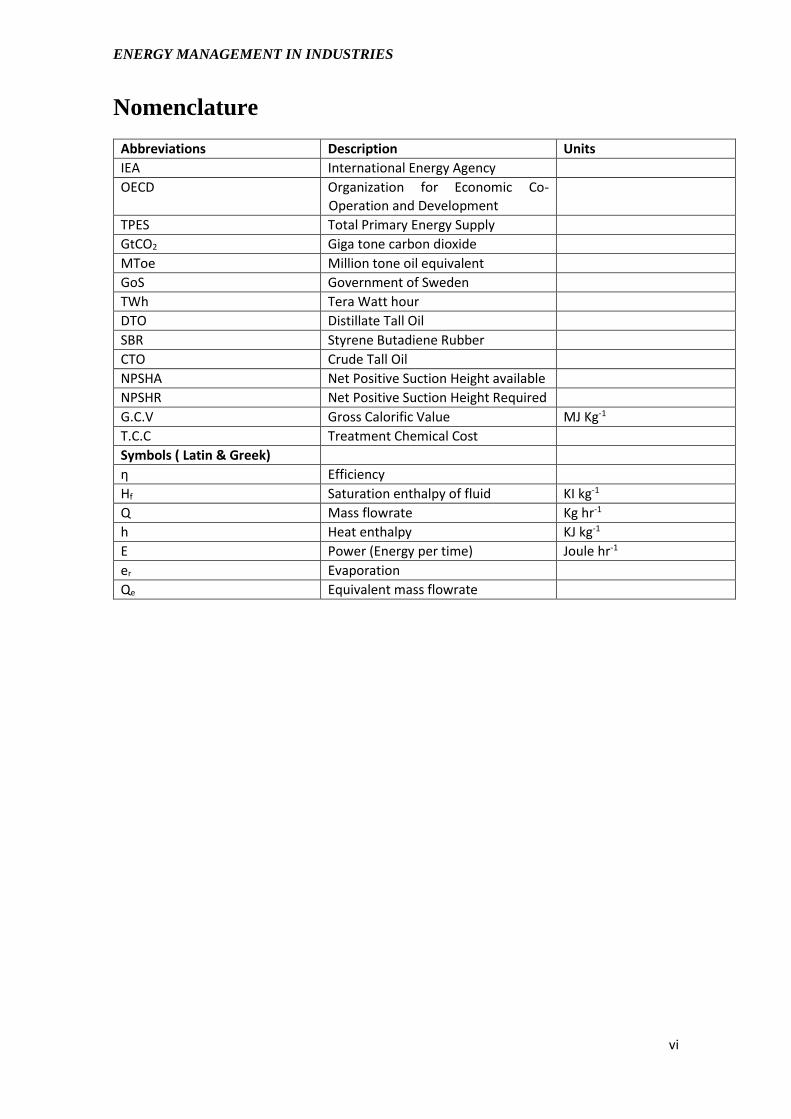
Nomenclature
Abbreviations Description Units
IEA International Energy Agency
OECD Organization for Economic Co-
Operation and Development
TPES Total Primary Energy Supply
GtCO2 Giga tone carbon dioxide
MToe Million tone oil equivalent
GoS Government of Sweden
TWh Tera Watt hour
DTO Distillate Tall Oil
SBR Styrene Butadiene Rubber
CTO Crude Tall Oil
NPSHA Net Positive Suction Height available
NPSHR Net Positive Suction Height Required
G.C.V Gross Calorific Value MJ Kg-1
T.C.C Treatment Chemical Cost
Symbols ( Latin & Greek)
η Efficiency
Hf Saturation enthalpy of fluid KI kg-1
Q Mass flowrate Kg hr-1
h Heat enthalpy KJ kg-1
E Power (Energy per time) Joule hr-1
er Evaporation
Qe Equivalent mass flowrate
1
1 Introduction
1.1 Overview
Energy is becoming among the four basic elements of life. Human being has developed in the
past decades completely dependent of energy. Energy has been and continues to be core thing
in every activity of our life. Almost everything and every activity of our daily activities requires
energy in different forms. Of course, energy has been the basic element of life in the form of
food from the beginning of life, but the energy that we utilise is in another forms. It is like things
that developed in the form of human needs turns out to be his necessities. Wake up in the
morning take warm shower, boil your morning meal, take car to your job, use the elevator, work
with your computer, process or produce product, call your family etc. you need energy. These
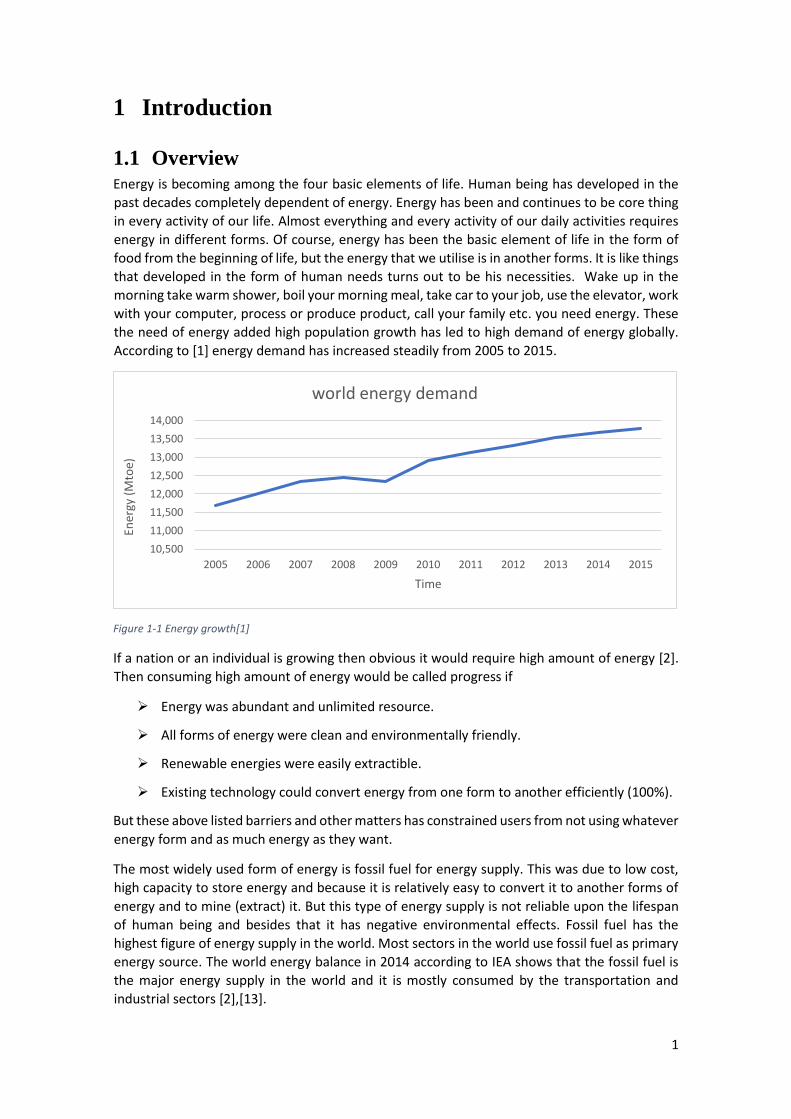
the need of energy added high population growth has led to high demand of energy globally.
According to [1] energy demand has increased steadily from 2005 to 2015.
Figure 1-1 Energy growth[1]
If a nation or an individual is growing then obvious it would require high amount of energy [2].
Then consuming high amount of energy would be called progress if
➢ Energy was abundant and unlimited resource.
➢ All forms of energy were clean and environmentally friendly.
➢ Renewable energies were easily extractible.
➢ Existing technology could convert energy from one form to another efficiently (100%).
But these above listed barriers and other matters has constrained users from not using whatever
energy form and as much energy as they want.
The most widely used form of energy is fossil fuel for energy supply. This was due to low cost,
high capacity to store energy and because it is relatively easy to convert it to another forms of
energy and to mine (extract) it. But this type of energy supply is not reliable upon the lifespan
of human being and besides that it has negative environmental effects. Fossil fuel has the
highest figure of energy supply in the world. Most sectors in the world use fossil fuel as primary
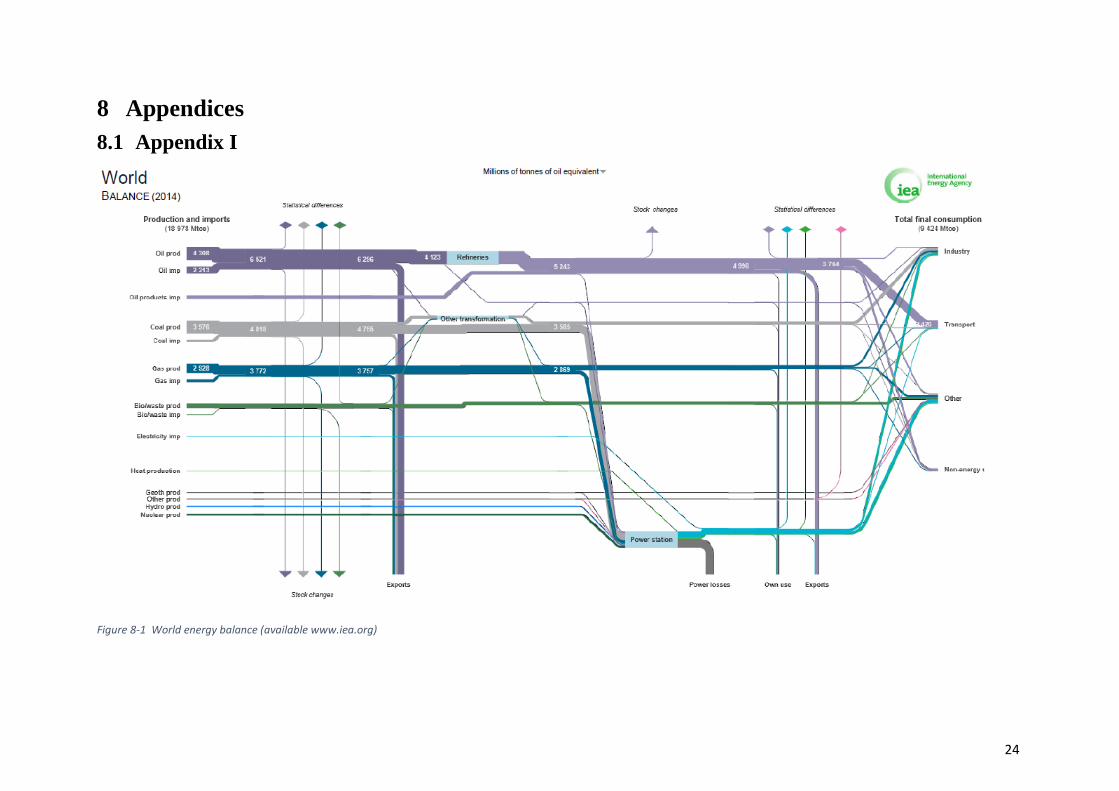
energy source. The world energy balance in 2014 according to IEA shows that the fossil fuel is
the major energy supply in the world and it is mostly consumed by the transportation and
industrial sectors [2],[13].
2005 2006 2007 2008 2009 2010 2011 2012 2013 2014 2015
10,500
11,000
11,500
12,000
12,500
13,000
13,500
14,000
Time
Ener
gy (
Mto
e)
world energy demand
ENERGY MANAGEMENT IN INDUSTRIES
2
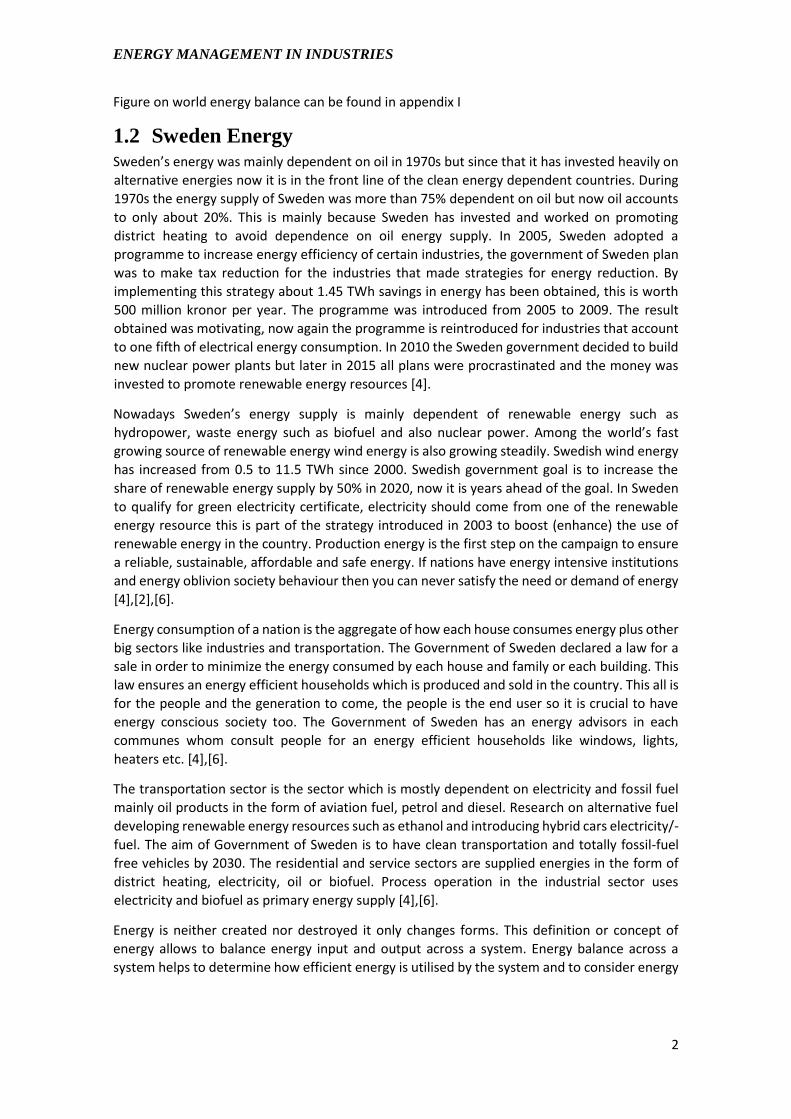
Figure on world energy balance can be found in appendix I
1.2 Sweden Energy Sweden’s energy was mainly dependent on oil in 1970s but since that it has invested heavily on
alternative energies now it is in the front line of the clean energy dependent countries. During
1970s the energy supply of Sweden was more than 75% dependent on oil but now oil accounts
to only about 20%. This is mainly because Sweden has invested and worked on promoting
district heating to avoid dependence on oil energy supply. In 2005, Sweden adopted a
programme to increase energy efficiency of certain industries, the government of Sweden plan
was to make tax reduction for the industries that made strategies for energy reduction. By
implementing this strategy about 1.45 TWh savings in energy has been obtained, this is worth
500 million kronor per year. The programme was introduced from 2005 to 2009. The result
obtained was motivating, now again the programme is reintroduced for industries that account
to one fifth of electrical energy consumption. In 2010 the Sweden government decided to build
new nuclear power plants but later in 2015 all plans were procrastinated and the money was
invested to promote renewable energy resources [4].
Nowadays Sweden’s energy supply is mainly dependent of renewable energy such as
hydropower, waste energy such as biofuel and also nuclear power. Among the world’s fast
growing source of renewable energy wind energy is also growing steadily. Swedish wind energy
has increased from 0.5 to 11.5 TWh since 2000. Swedish government goal is to increase the
share of renewable energy supply by 50% in 2020, now it is years ahead of the goal. In Sweden
to qualify for green electricity certificate, electricity should come from one of the renewable
energy resource this is part of the strategy introduced in 2003 to boost (enhance) the use of
renewable energy in the country. Production energy is the first step on the campaign to ensure
a reliable, sustainable, affordable and safe energy. If nations have energy intensive institutions
and energy oblivion society behaviour then you can never satisfy the need or demand of energy
[4],[2],[6].
Energy consumption of a nation is the aggregate of how each house consumes energy plus other
big sectors like industries and transportation. The Government of Sweden declared a law for a
sale in order to minimize the energy consumed by each house and family or each building. This
law ensures an energy efficient households which is produced and sold in the country. This all is
for the people and the generation to come, the people is the end user so it is crucial to have
energy conscious society too. The Government of Sweden has an energy advisors in each
communes whom consult people for an energy efficient households like windows, lights,
heaters etc. [4],[6].
The transportation sector is the sector which is mostly dependent on electricity and fossil fuel
mainly oil products in the form of aviation fuel, petrol and diesel. Research on alternative fuel
developing renewable energy resources such as ethanol and introducing hybrid cars electricity/-
fuel. The aim of Government of Sweden is to have clean transportation and totally fossil-fuel
free vehicles by 2030. The residential and service sectors are supplied energies in the form of
district heating, electricity, oil or biofuel. Process operation in the industrial sector uses
electricity and biofuel as primary energy supply [4],[6].
Energy is neither created nor destroyed it only changes forms. This definition or concept of
energy allows to balance energy input and output across a system. Energy balance across a
system helps to determine how efficient energy is utilised by the system and to consider energy
ENERGY MANAGEMENT IN INDUSTRIES
3
efficient actions to avoid energy losses. Sweden overall energy supply and energy end-use
balance in 2013 is show in the figure mentioned below.
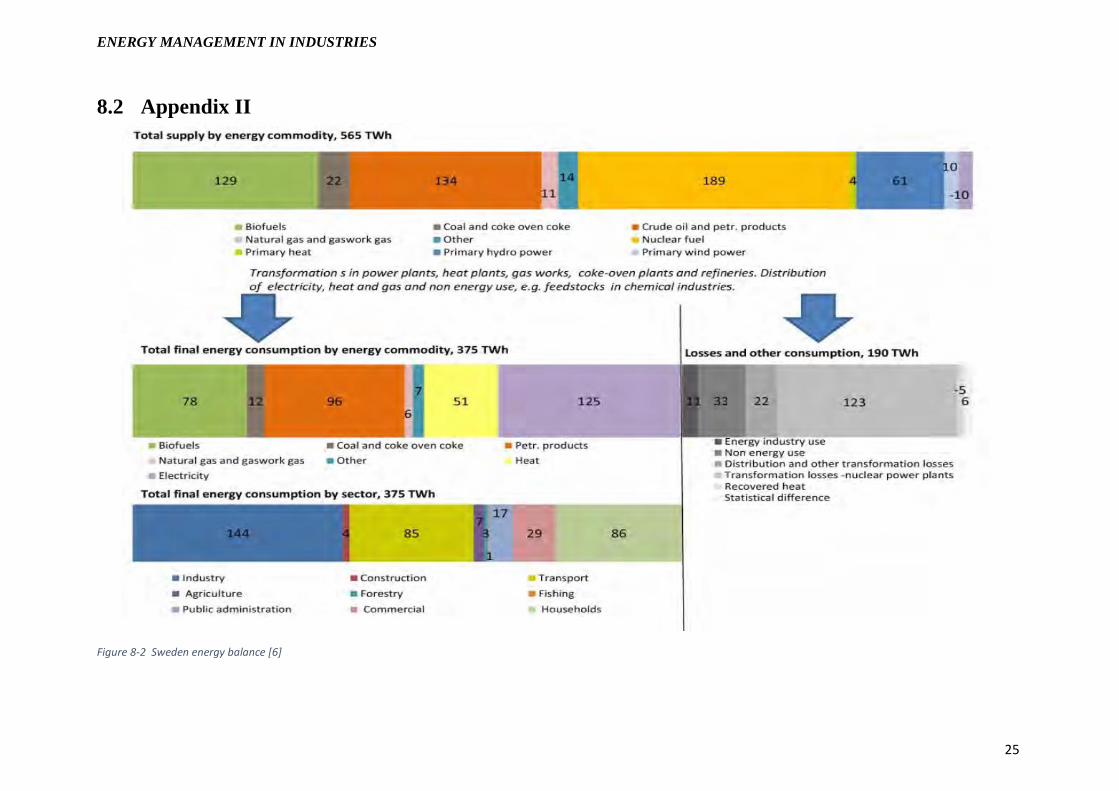
Figure on Sweden energy balance can be found to appendix II
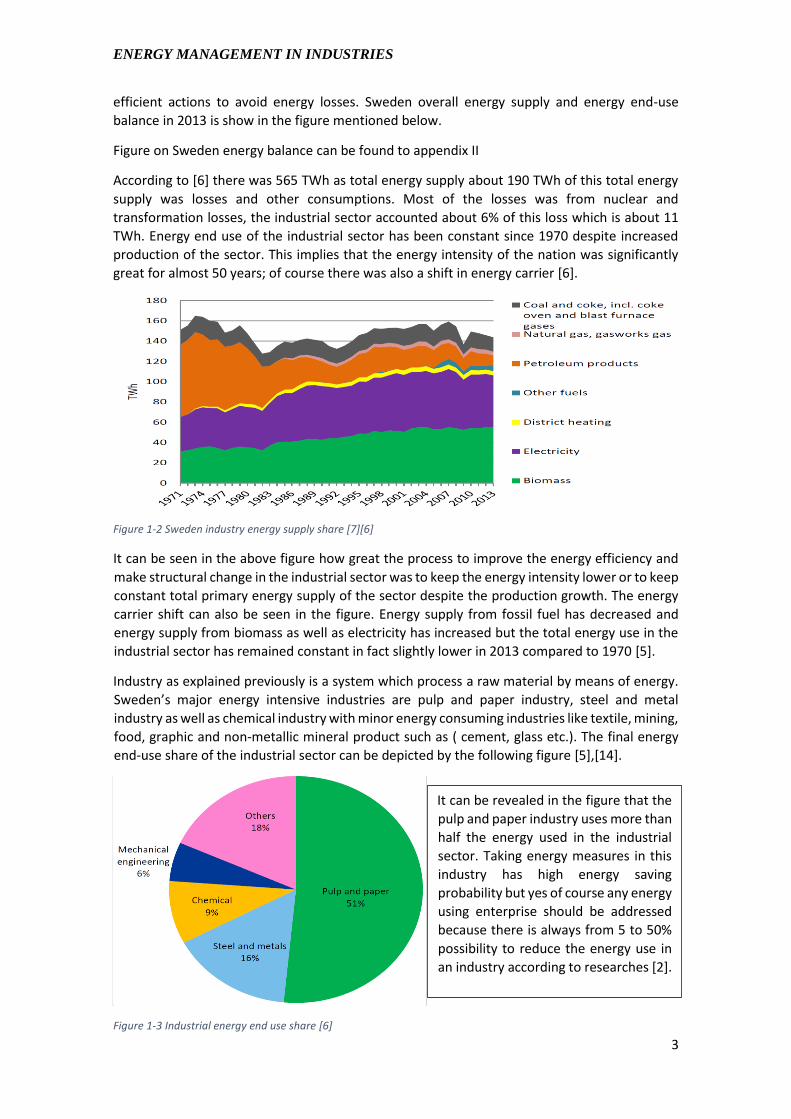
According to [6] there was 565 TWh as total energy supply about 190 TWh of this total energy
supply was losses and other consumptions. Most of the losses was from nuclear and
transformation losses, the industrial sector accounted about 6% of this loss which is about 11
TWh. Energy end use of the industrial sector has been constant since 1970 despite increased
production of the sector. This implies that the energy intensity of the nation was significantly
great for almost 50 years; of course there was also a shift in energy carrier [6].
Figure 1-2 Sweden industry energy supply share [7][6]
It can be seen in the above figure how great the process to improve the energy efficiency and
make structural change in the industrial sector was to keep the energy intensity lower or to keep
constant total primary energy supply of the sector despite the production growth. The energy
carrier shift can also be seen in the figure. Energy supply from fossil fuel has decreased and
energy supply from biomass as well as electricity has increased but the total energy use in the
industrial sector has remained constant in fact slightly lower in 2013 compared to 1970 [5].
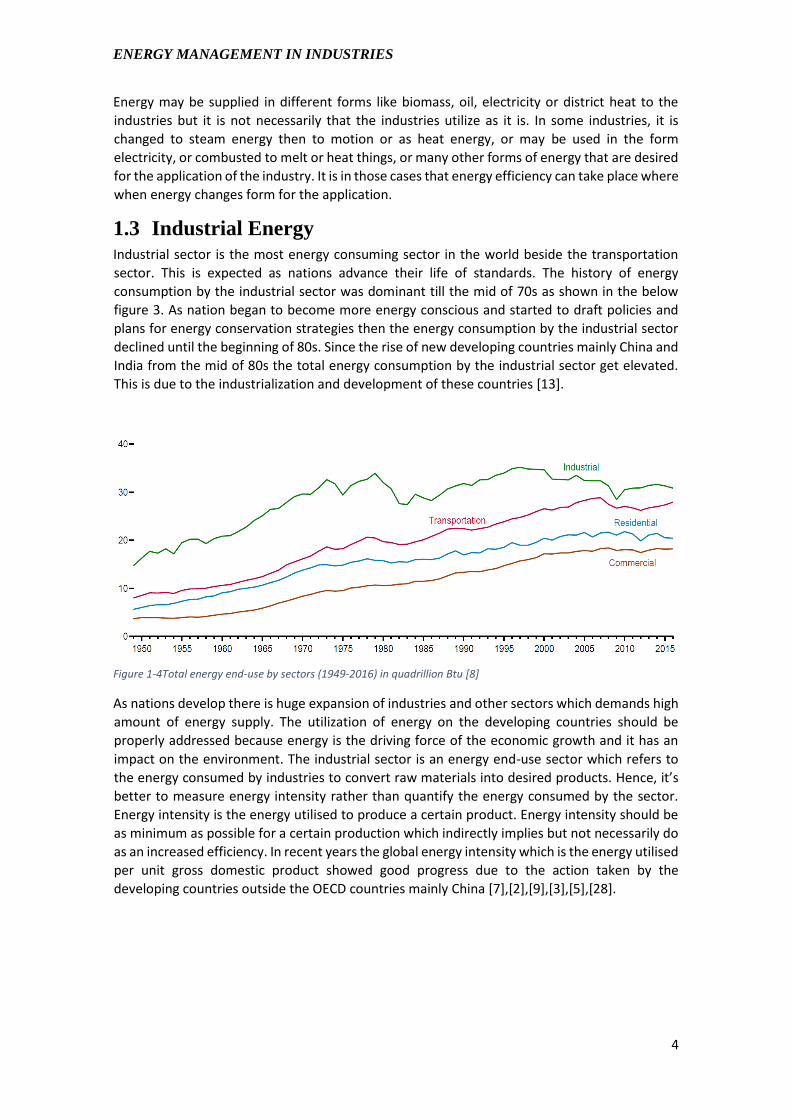
Industry as explained previously is a system which process a raw material by means of energy.
Sweden’s major energy intensive industries are pulp and paper industry, steel and metal
industry as well as chemical industry with minor energy consuming industries like textile, mining,
food, graphic and non-metallic mineral product such as ( cement, glass etc.). The final energy
end-use share of the industrial sector can be depicted by the following figure [5],[14].
Figure 1-3 Industrial energy end use share [6]
It can be revealed in the figure that the
pulp and paper industry uses more than
half the energy used in the industrial
sector. Taking energy measures in this
industry has high energy saving
probability but yes of course any energy
using enterprise should be addressed
because there is always from 5 to 50%
possibility to reduce the energy use in
an industry according to researches [2].
ENERGY MANAGEMENT IN INDUSTRIES
4
Energy may be supplied in different forms like biomass, oil, electricity or district heat to the
industries but it is not necessarily that the industries utilize as it is. In some industries, it is
changed to steam energy then to motion or as heat energy, or may be used in the form
electricity, or combusted to melt or heat things, or many other forms of energy that are desired
for the application of the industry. It is in those cases that energy efficiency can take place where
when energy changes form for the application.
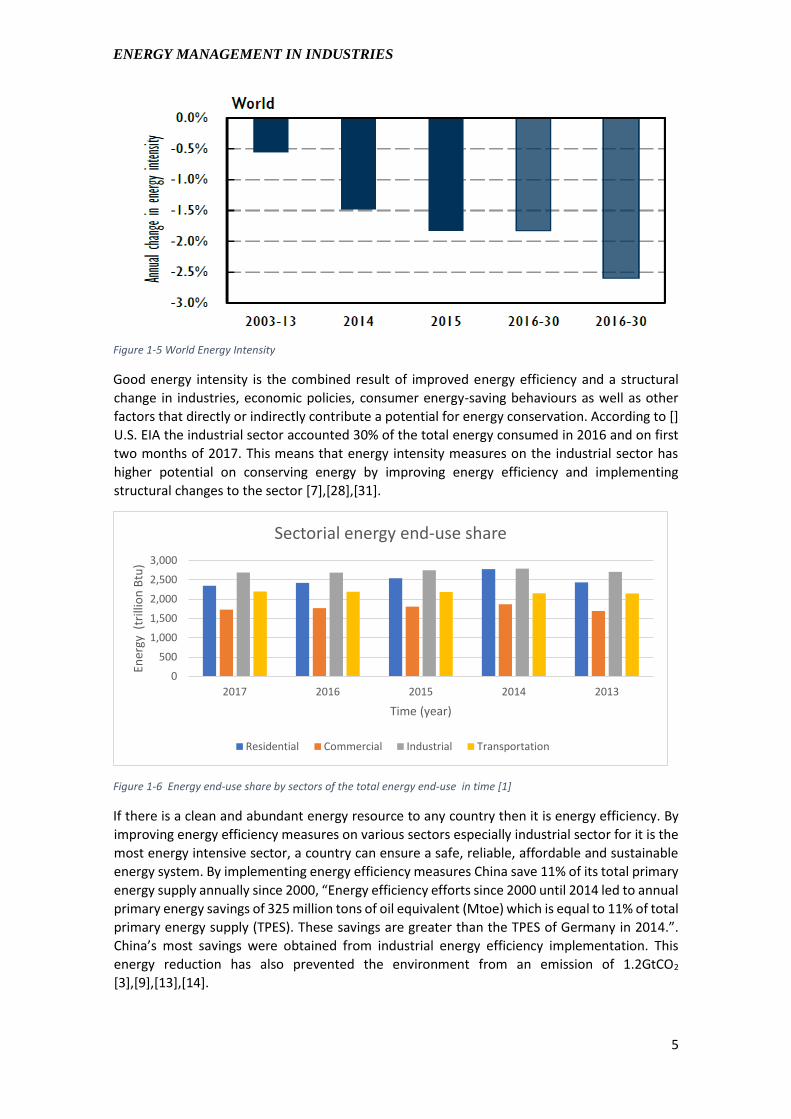
1.3 Industrial Energy
Industrial sector is the most energy consuming sector in the world beside the transportation
sector. This is expected as nations advance their life of standards. The history of energy
consumption by the industrial sector was dominant till the mid of 70s as shown in the below
figure 3. As nation began to become more energy conscious and started to draft policies and
plans for energy conservation strategies then the energy consumption by the industrial sector
declined until the beginning of 80s. Since the rise of new developing countries mainly China and
India from the mid of 80s the total energy consumption by the industrial sector get elevated.
This is due to the industrialization and development of these countries [13].
Figure 1-4Total energy end-use by sectors (1949-2016) in quadrillion Btu [8]
As nations develop there is huge expansion of industries and other sectors which demands high
amount of energy supply. The utilization of energy on the developing countries should be
properly addressed because energy is the driving force of the economic growth and it has an
impact on the environment. The industrial sector is an energy end-use sector which refers to
the energy consumed by industries to convert raw materials into desired products. Hence, it’s
better to measure energy intensity rather than quantify the energy consumed by the sector.
Energy intensity is the energy utilised to produce a certain product. Energy intensity should be
as minimum as possible for a certain production which indirectly implies but not necessarily do
as an increased efficiency. In recent years the global energy intensity which is the energy utilised
per unit gross domestic product showed good progress due to the action taken by the
developing countries outside the OECD countries mainly China [7],[2],[9],[3],[5],[28].
ENERGY MANAGEMENT IN INDUSTRIES
5
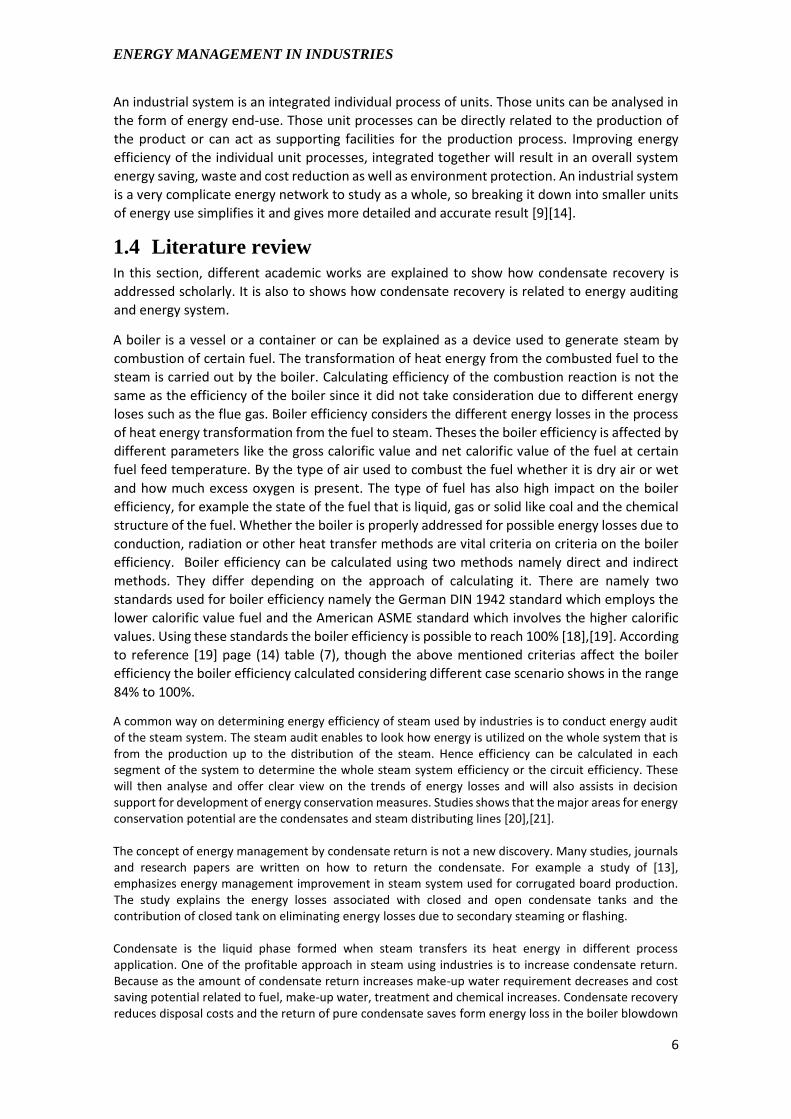
Figure 1-5 World Energy Intensity
Good energy intensity is the combined result of improved energy efficiency and a structural
change in industries, economic policies, consumer energy-saving behaviours as well as other
factors that directly or indirectly contribute a potential for energy conservation. According to []
U.S. EIA the industrial sector accounted 30% of the total energy consumed in 2016 and on first
two months of 2017. This means that energy intensity measures on the industrial sector has
higher potential on conserving energy by improving energy efficiency and implementing
structural changes to the sector [7],[28],[31].
Figure 1-6 Energy end-use share by sectors of the total energy end-use in time [1]
If there is a clean and abundant energy resource to any country then it is energy efficiency. By
improving energy efficiency measures on various sectors especially industrial sector for it is the
most energy intensive sector, a country can ensure a safe, reliable, affordable and sustainable
energy system. By implementing energy efficiency measures China save 11% of its total primary
energy supply annually since 2000, “Energy efficiency efforts since 2000 until 2014 led to annual
primary energy savings of 325 million tons of oil equivalent (Mtoe) which is equal to 11% of total
primary energy supply (TPES). These savings are greater than the TPES of Germany in 2014.”.
China’s most savings were obtained from industrial energy efficiency implementation. This
energy reduction has also prevented the environment from an emission of 1.2GtCO2
[3],[9],[13],[14].
2017 2016 2015 2014 2013
0
500
1,000
1,500
2,000
2,500
3,000
Time (year)
Ener
gy (
trill
ion
Btu
)
Sectorial energy end-use share
Residential Commercial Industrial Transportation
ENERGY MANAGEMENT IN INDUSTRIES
6
An industrial system is an integrated individual process of units. Those units can be analysed in
the form of energy end-use. Those unit processes can be directly related to the production of
the product or can act as supporting facilities for the production process. Improving energy
efficiency of the individual unit processes, integrated together will result in an overall system
energy saving, waste and cost reduction as well as environment protection. An industrial system
is a very complicate energy network to study as a whole, so breaking it down into smaller units
of energy use simplifies it and gives more detailed and accurate result [9][14].
1.4 Literature review
In this section, different academic works are explained to show how condensate recovery is
addressed scholarly. It is also to shows how condensate recovery is related to energy auditing
and energy system.
A boiler is a vessel or a container or can be explained as a device used to generate steam by
combustion of certain fuel. The transformation of heat energy from the combusted fuel to the
steam is carried out by the boiler. Calculating efficiency of the combustion reaction is not the
same as the efficiency of the boiler since it did not take consideration due to different energy
loses such as the flue gas. Boiler efficiency considers the different energy losses in the process
of heat energy transformation from the fuel to steam. Theses the boiler efficiency is affected by
different parameters like the gross calorific value and net calorific value of the fuel at certain
fuel feed temperature. By the type of air used to combust the fuel whether it is dry air or wet
and how much excess oxygen is present. The type of fuel has also high impact on the boiler
efficiency, for example the state of the fuel that is liquid, gas or solid like coal and the chemical
structure of the fuel. Whether the boiler is properly addressed for possible energy losses due to
conduction, radiation or other heat transfer methods are vital criteria on criteria on the boiler
efficiency. Boiler efficiency can be calculated using two methods namely direct and indirect
methods. They differ depending on the approach of calculating it. There are namely two
standards used for boiler efficiency namely the German DIN 1942 standard which employs the
lower calorific value fuel and the American ASME standard which involves the higher calorific
values. Using these standards the boiler efficiency is possible to reach 100% [18],[19]. According
to reference [19] page (14) table (7), though the above mentioned criterias affect the boiler
efficiency the boiler efficiency calculated considering different case scenario shows in the range
84% to 100%.
A common way on determining energy efficiency of steam used by industries is to conduct energy audit of the steam system. The steam audit enables to look how energy is utilized on the whole system that is from the production up to the distribution of the steam. Hence efficiency can be calculated in each segment of the system to determine the whole steam system efficiency or the circuit efficiency. These will then analyse and offer clear view on the trends of energy losses and will also assists in decision support for development of energy conservation measures. Studies shows that the major areas for energy conservation potential are the condensates and steam distributing lines [20],[21]. The concept of energy management by condensate return is not a new discovery. Many studies, journals and research papers are written on how to return the condensate. For example a study of [13], emphasizes energy management improvement in steam system used for corrugated board production. The study explains the energy losses associated with closed and open condensate tanks and the contribution of closed tank on eliminating energy losses due to secondary steaming or flashing. Condensate is the liquid phase formed when steam transfers its heat energy in different process application. One of the profitable approach in steam using industries is to increase condensate return. Because as the amount of condensate return increases make-up water requirement decreases and cost saving potential related to fuel, make-up water, treatment and chemical increases. Condensate recovery reduces disposal costs and the return of pure condensate saves form energy loss in the boiler blowdown
ENERGY MANAGEMENT IN INDUSTRIES
7
which directly then relates to fuel savings. For example a large speciality paper plant reduced its boiler make up water from about 35% to between 10-20% by returning condensate which resulted to more than $300 000 of annual saving. Simple calculations on the energy content of a condensate return shows that condensate holds more than 10% of the energy content of the total steam energy content[16]. Waste-heat management is the great potential for reduction of energy use and greenhouse gas emission by improving energy efficiency and engineering functionality of an industry [17]. This thesis mainly addresses on the waste condensate energy management profitability on the plant. It is highly recommendable and feasible for the plant to invest on the recovery of condensate. Studies from similar plant which involves steam tracing process has saved thousands of dollars by investing on pressure powered condensate pump, balanced thermostatic steam traps, automatic thermostats for freeze protections and liquid expansion regulators to return the condensate [14].
1.5 Objectives and limitations The main objective of this thesis is to provide the company, the potential of conserving energy to save extra costs by doing little investment on the energy that the plant already has, in order for the plant to stay competitive on the rapidly changing world. By doing so the plant will save significant amount of energy and can meet environmental regulations as same time reducing costs related to it. In general, the main goal of the thesis is to: -
➢ Conserve energy and improve efficiency of the plant by doing energy management.
Here to manage means to adress the energy carried out by the condensate and there
fore to recover the energy by returning the condensate.
➢ Make it environmental friendly.
By returning the condensate, the sensible energy stored in it is recoverd, in other word
it means saving energy supplied by the fuel in the combustion process. By doing so the
CO2 supposed to be produced in the combustion process of the fuel to produce energy
which is equivalent to the energy recovered from the condensate is saved.
Enviromental benefits from causes that could happen due to the disposal of the
condensate to the environment.
➢ Cost reduction.
Cost related energy, water treatment chemical, water supply and treatment of effluent
are saved.
Measurement is the key factor for any industry on the realm of improvement and growth of the
industry. As sense organs to human, measurement of different parameters is for an industry.
Lack of measurement on the flash and condensate return’s flow was one of the limitation but it
is avoided by giving credible assumption.
Getting latest energy statistics specially on Sweden energy statistics also was limited so the
information is done based on the information could be obtained from the general internet sites.
1.6 Object Description – Arizona Chemical
Kraton Corporation is a corporation that provides a value-added products and innovations and
it serves a diversified range of end markets with a broad range of highly engineered polymers
and specialty chemicals based upon renewable resources. Kraton corporation origin in the
development of styrene based thermoplastic elastomers is mainly during the world war II
between 1942-1945 when the government of U.S. initiated a program to develop a new styrene
butadiene synthetic rubber (SBR) which is a critical alternative to natural rubber for making tires
for military vehicles for the war. As butadiene supplier to SBR plants Shell Chemical company
bought one of the plants in Torrance and California in 1955 from the government. The
ENERGY MANAGEMENT IN INDUSTRIES
8
corporation what we now call as Kraton is then the evolution of these elastomer plant division
of the Shell Chemical Company. Kraton acquired Arizona chemical in January 2016, this
acquisition will diversify Kraton’s market and technology [23],[29].
1.6.1 Kraton Corporation at Sandarne
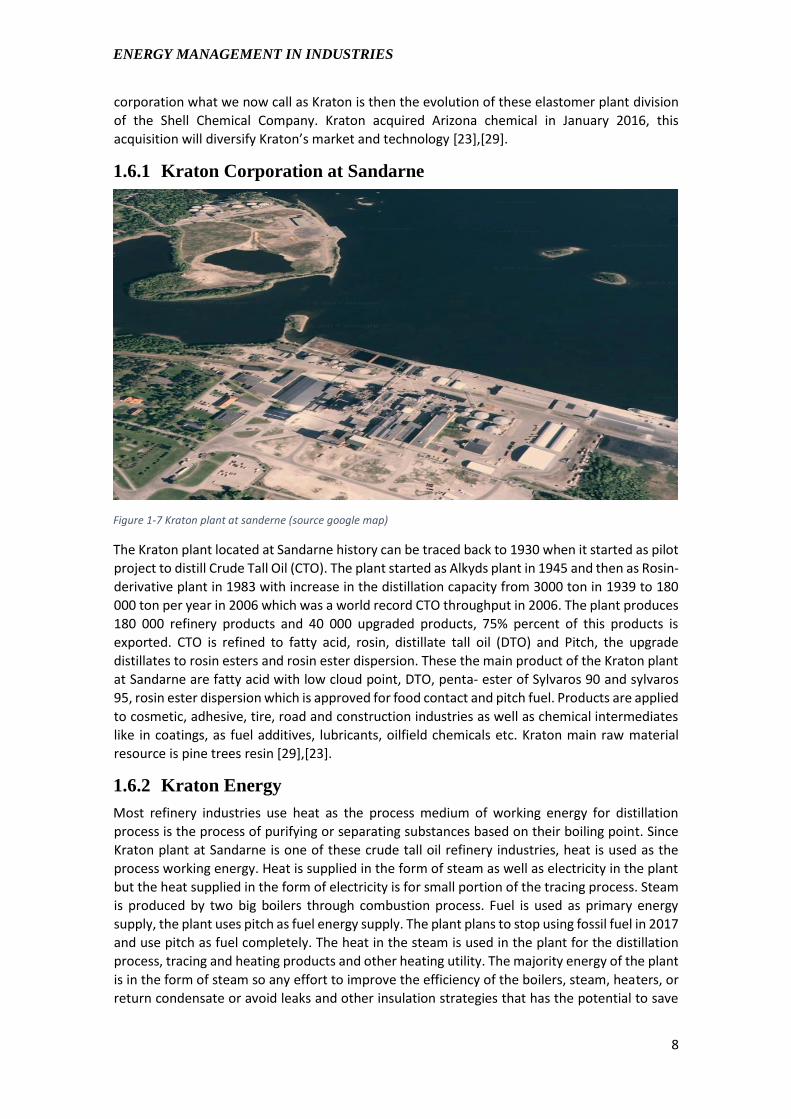
Figure 1-7 Kraton plant at sanderne (source google map)
The Kraton plant located at Sandarne history can be traced back to 1930 when it started as pilot
project to distill Crude Tall Oil (CTO). The plant started as Alkyds plant in 1945 and then as Rosin-
derivative plant in 1983 with increase in the distillation capacity from 3000 ton in 1939 to 180
000 ton per year in 2006 which was a world record CTO throughput in 2006. The plant produces
180 000 refinery products and 40 000 upgraded products, 75% percent of this products is
exported. CTO is refined to fatty acid, rosin, distillate tall oil (DTO) and Pitch, the upgrade
distillates to rosin esters and rosin ester dispersion. These the main product of the Kraton plant
at Sandarne are fatty acid with low cloud point, DTO, penta- ester of Sylvaros 90 and sylvaros
95, rosin ester dispersion which is approved for food contact and pitch fuel. Products are applied
to cosmetic, adhesive, tire, road and construction industries as well as chemical intermediates
like in coatings, as fuel additives, lubricants, oilfield chemicals etc. Kraton main raw material
resource is pine trees resin [29],[23].
1.6.2 Kraton Energy
Most refinery industries use heat as the process medium of working energy for distillation
process is the process of purifying or separating substances based on their boiling point. Since
Kraton plant at Sandarne is one of these crude tall oil refinery industries, heat is used as the
process working energy. Heat is supplied in the form of steam as well as electricity in the plant
but the heat supplied in the form of electricity is for small portion of the tracing process. Steam
is produced by two big boilers through combustion process. Fuel is used as primary energy
supply, the plant uses pitch as fuel energy supply. The plant plans to stop using fossil fuel in 2017
and use pitch as fuel completely. The heat in the steam is used in the plant for the distillation
process, tracing and heating products and other heating utility. The majority energy of the plant
is in the form of steam so any effort to improve the efficiency of the boilers, steam, heaters, or
return condensate or avoid leaks and other insulation strategies that has the potential to save
ENERGY MANAGEMENT IN INDUSTRIES
9
heat energy has a great impact on the plants cost and environmental savings as well as on the
plants growth in competitiveness to ensure quantitative and qualitative product [29].
1.6.3 Kraton condensate return
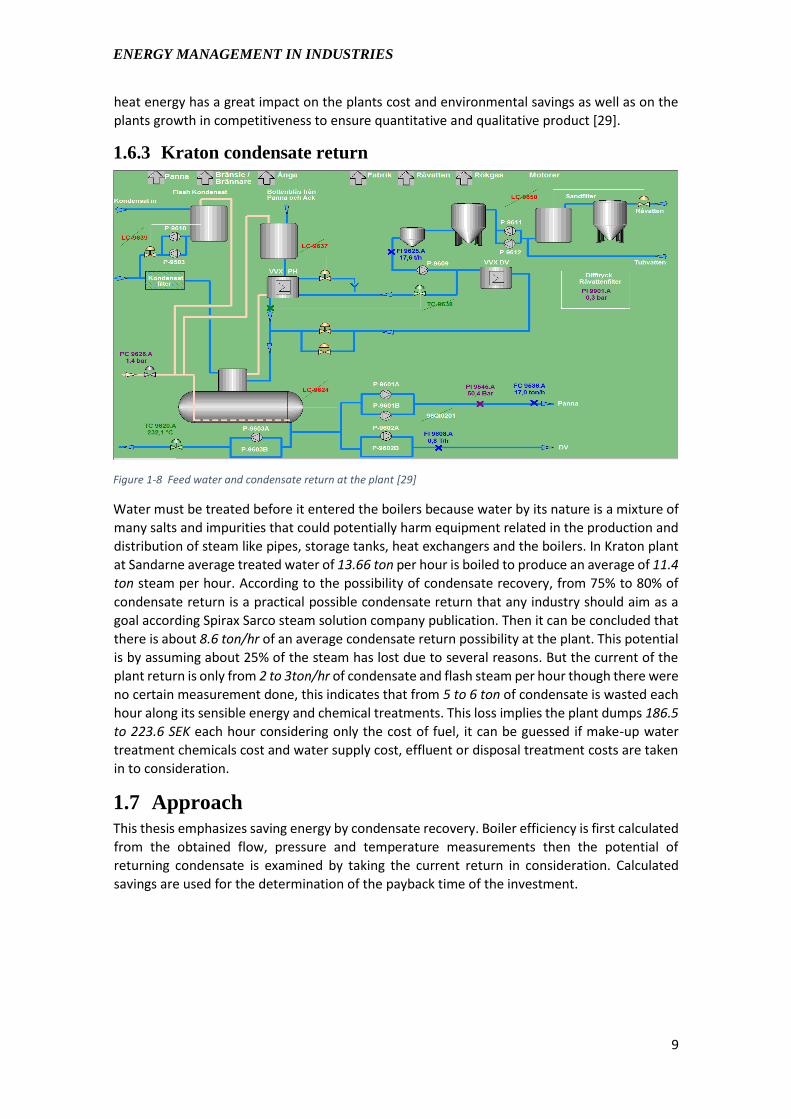
Figure 1-8 Feed water and condensate return at the plant [29]
Water must be treated before it entered the boilers because water by its nature is a mixture of
many salts and impurities that could potentially harm equipment related in the production and
distribution of steam like pipes, storage tanks, heat exchangers and the boilers. In Kraton plant
at Sandarne average treated water of 13.66 ton per hour is boiled to produce an average of 11.4
ton steam per hour. According to the possibility of condensate recovery, from 75% to 80% of
condensate return is a practical possible condensate return that any industry should aim as a
goal according Spirax Sarco steam solution company publication. Then it can be concluded that
there is about 8.6 ton/hr of an average condensate return possibility at the plant. This potential
is by assuming about 25% of the steam has lost due to several reasons. But the current of the
plant return is only from 2 to 3ton/hr of condensate and flash steam per hour though there were
no certain measurement done, this indicates that from 5 to 6 ton of condensate is wasted each
hour along its sensible energy and chemical treatments. This loss implies the plant dumps 186.5
to 223.6 SEK each hour considering only the cost of fuel, it can be guessed if make-up water
treatment chemicals cost and water supply cost, effluent or disposal treatment costs are taken
in to consideration.
1.7 Approach
This thesis emphasizes saving energy by condensate recovery. Boiler efficiency is first calculated
from the obtained flow, pressure and temperature measurements then the potential of
returning condensate is examined by taking the current return in consideration. Calculated
savings are used for the determination of the payback time of the investment.
ENERGY MANAGEMENT IN INDUSTRIES
10
2 Theory
2.1 Steam Energy
Steam is a carrier of heat energy in form of vapour. Treated water is heated by the combustion
of a certain fuel in a boiler to its saturation temperature and form steam. It can also be heated
further above its saturation pressure to form superheated steam. The history of steam as
transformation of energy goes back to the first century but the modern commercially successful
steam engine believed to begin during the late 17 and early 18 century. Steam can be used to
generate electricity, for cleaning and sterilization. It can also be use as utility such as heating,
for heat tracing purpose, for separation processes and many other applications. Superheated
steam is a steam with high latent heat energy. Latent heat is the energy absorbed or released
by a mass of material when it is transforming from one phase to another. Mostly and usually
this latent heat energy is transformed in to other form of energy for the desired application. The
processes is usually done when the steam at higher temperature and pressure undergoes a
lower pressure and/or temperature [14],[15].
2.2 Condensate Condensate is a name given to a liquid when steam loses its latent heat energy. In a heating
process, when steam transfers part of its energy, known as the latent heat, to the process being
heated, condensate is formed with portion of energy known as sensible energy. Condensate is
formed as steam condenses at the instant phase change temperature of the corresponding
working pressure of the process, hence the condensate temperature is the same as the steam
temperature. Since condensate is always at the same temperature as of the working steam for
the same working pressure, the amount of energy stored in the condensate is based on the mass
of the condensate and directly related to the temperature difference between the working
steam and the feed water [10],[11],[12],[16].
Hypothetically speaking all the steam produced can be returned as condensate but since there
are always some losses and leakages about 75% -85% condensate return is reasonable. The
amount of energy stored in condensate can be greater if the working pressure is higher.
Industries have not had much interest in recovering condensate due to low prices of fuel in the
past time. Now with the increase in fuel prices and uncertainty of future prices, industries have
to look how to utilize the energy they already have. This implies that industries, in order to stay
competitive globally, have to address efficient use of energy for greater production and
environmental concerns to avoid extra charges and expenditures or have to search for
renewable energy alternatives which addresses both the environmental issues as well as
uncertainty in fuel prices. Condensate return has not been properly addressed though there are
recovery in small scale but now industries using steam as energy transformation medium have
to change their antennae on managing fully the energy lost in the condensate [11],[12].
2.2.1 Benefits of condensate
Condensate return means energy recovery in another form and everybody know the benefits of
energy. Condensate recovery has many benefits because it is environmentally friendly and cost
effective. If condensate is not recovered then significant amounts of energy (the sensible heat),
chemical treatment products and water are wasted, leading to greater fuel, water and waste
management-related costs
ENERGY MANAGEMENT IN INDUSTRIES
11
Why condensate return?
➢ Serve as heating or pre-heated feed water.
➢ Can serve as heat utility (pre-heat or heat products, hot fluid heat exchange etc.).
➢ As lower pressure steam provider when the condensate flashes.
➢ Hot water applications.
➢ Reduced costs for chemical treatments of the makeup water.
➢ Ecologically advisable and advances a better environment.
There are some efforts to be made to recover condensate but the benefits are trustworthy when
compared to the investment on the condensate return if they are handled with care. These are
like pumping condensate, installing steam traps, insulations of condensate return facilities and
the prevention of corrosions [10],[18].
2.2.2 Recovering condensate
When talking about condensate return it means speaking about conserving matter (mass) given
the matter as water, and mass can be fully conserved. But always it is hard to recover all the
steam as condensate due to dispersed application location, leakages and other losses. It is
required to collect the condensates from the points of application and pump back it to the boiler
[10].
- Pumping condensate
In order to recover and transport condensate usually a positive net pressure differential from
source of the condensate to the destination is required. The systems pressure can be enough to
overcome the back pressure but in most cases the net pressure differential is negative hence
pumps are required to pump the condensate to the desired destination normally collection
tanks.
Using system pressure- If the differential pressure from the source to the destination is positive
then condensate can be transported and recovered by using the inlet pressure to the steam trap
as the driving force. It is the lowest in cost and simple to install and operate. Inlet pressure steam
trap can be installed in to two different ways
➢ Gravity return.
➢ Elevated return.
Gravity return- Is installing the steam trap just above the condensate return piping and hence
condensate is forced by the inlet pressure and gravity drainage mechanism. In this type only the
steam trap equipment and pipes for transporting are required because the pressure differential
is always positive to downward drainage. But in this geographic position is always determinant.
This type of condensate returning system is applicable when the condensate is to be returned
to atmospheric vented storage tanks given the pressure at the steam trap is greater than the
back pressure [10].
Elevated return- It is possible for a steam trap to discharge overhead to an elevated return
provided that the differential pressure remains positive and appropriate site safety standards
are followed. A typical example is the draining of condensate from steam traps installed on main
utility steam lines. As vertical and horizontal distances increase, the system backpressure will
also increase.
ENERGY MANAGEMENT IN INDUSTRIES
12
If the system back pressure is greater than the lowest inlet trap pressure then a pump is required to return the condensate for recovery. The pump is designed in such a way so that it is able to overcome the collective push exerted over the condensate return. The total push or system pressure over the condensate can be calculated as the sum of different pressure components. These components are:-
• A pressure from elevated collection tank.
• A frictional pressure exerted by the piping and distance of condensate destination.
• Pressurized destination ( flash vessel, pressurized tank etc.).
• Boiler pressure if condensate directly to be returned to a boiler.
These components of pressures make the system back pressure or the Total Dynamic head for
the pump design requirements of a condensate return [10].
- Cavitation
For a condensate return a special pumps are required in order to prevent cavitation. Cavitation
is the bubbles of steam formed by the rotation of the impeller. And since condensate is
associated mostly with high temperature fluids the probability of cavitation is high. Cavitation
damages the impeller and make pumps out of use in a short period of time. Cavitation can be
eliminated by increasing the Net Positive Suction Head Available (NPSHA) above the Net Positive
Suction Head Required (NPSHR) value for regular water temperature of the pump (provided that
equipment can handle the back pressure) or by using specialized centrifugal pumps which does
not experience cavitation problems [10].
Most pumps are designed to transport liquids so when it comes to transporting liquids at high
temperature it’s not as efficient as it is for regular temperature liquids. This is because the water
flows nearly at its saturation temperature where water can form steam and becomes difficult
to move or transport this condensate with pump due to the formation of cavity. This vapour or
steam formation is mainly due to the void or low pressure formed by the rotation of the
impeller. Hence there are special pumps like mechanical pumps and other specialized pumps
for pumping condensate so that the effect of cavitation is avoided. Those specialized pumps can
be steam or pressure driven pumps which cannot be affected by cavitation [10].
- Corrosion and other drawbacks
The most common cause of corrosion in the condensate system is due to carbon dioxide. The
two basic approaches for the prevention of corrosion in condensate systems are:
• Minimizing carbon dioxide & oxygen contamination
• Using chemical inhibitors to counteract corrosive conditions
To avoid these drawbacks a conductivity sensor should be installed, so that if high conductivity
is detected in the condensate, it should be drained to avoid damage of the boilers and other
equipment by corrosion. If the draining method is done in such a way so that the condensate
conductivity is measured then the loss of condensate can be avoided by returning it as soon as
it is safe to return it [10].
ENERGY MANAGEMENT IN INDUSTRIES
13
3 Method
3.1 Boiler efficiency
Knowing the efficiency of the key equipment is crucial on the actions of determining if an
industry or any plant is utilizing the energy supply efficiently. Boiler efficiency determines how
efficiently the fuel is utilized by the boiler to produce steam with certain quality and quantity.
In other way it means how much energy is lost or is transformed to the steam produced from
the fuel combustion process because the energy transformation process from the combusted
fuel is the work done by the boiler. Hence it is vital that the efficiency of the boiler is known.
Boiler efficiency can be calculated by two methods namely as direct and indirect methods. The
principle is the same just different approaches is used to calculate the efficiency. Direct method
uses the plain way of calculating efficiency that is the input and output energy approach while
the indirect method uses lost energies like energy loss through flue gases, boiler surface and
other losses during the process to calculate the boiler efficiency. The indirect method calculates
the inefficiency of the boiler by subtracting from 100 then can be determined the efficiency of
the boiler. Both the methods has their own advantages and disadvantages regarding the
accuracy but in generally the disadvantages of the direct method can be avoided by using the
indirect method. According to the bureau of energy efficiency on the energy performance
assessment of boilers [32], an error of 1% in measurement makes a 90% efficient boiler 90±0.9
when it is calculated using direct method and 90±0.1 efficient when it is calculated using the
indirect method [32],[33].
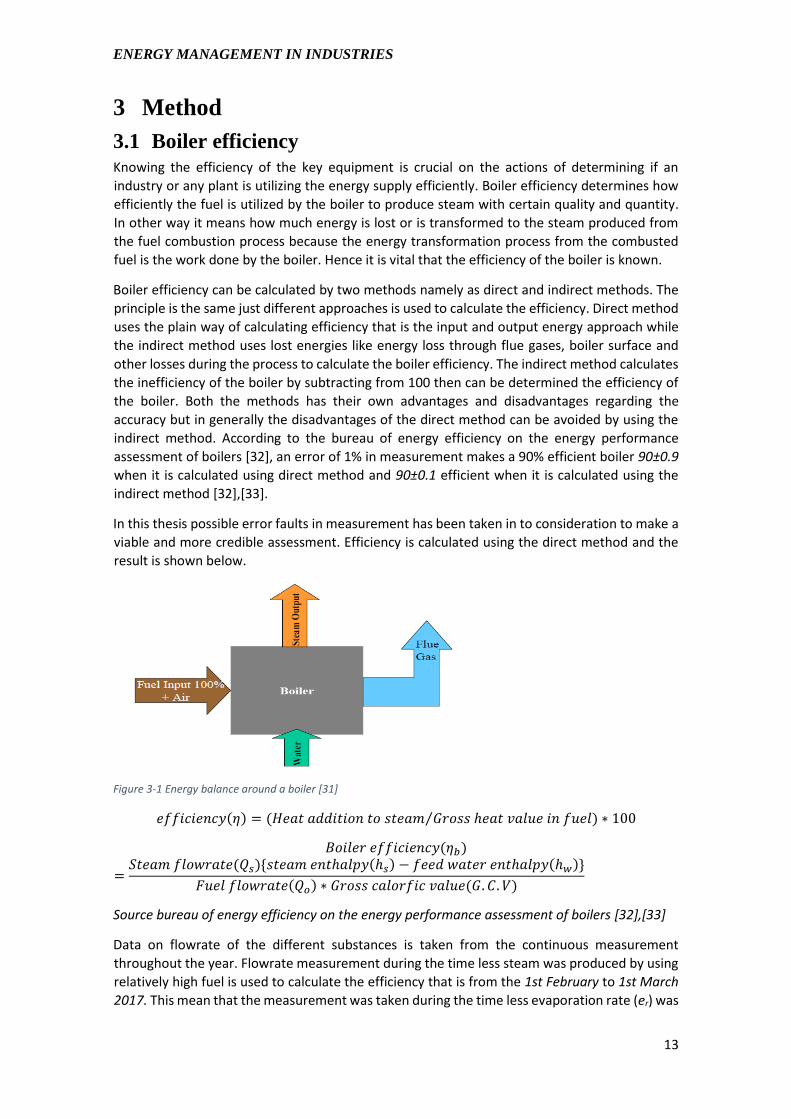
In this thesis possible error faults in measurement has been taken in to consideration to make a
viable and more credible assessment. Efficiency is calculated using the direct method and the
result is shown below.
Figure 3-1 Energy balance around a boiler [31]
𝑒𝑓𝑓𝑖𝑐𝑖𝑒𝑛𝑐𝑦(𝜂) = (𝐻𝑒𝑎𝑡 𝑎𝑑𝑑𝑖𝑡𝑖𝑜𝑛 𝑡𝑜 𝑠𝑡𝑒𝑎𝑚 𝐺𝑟𝑜𝑠𝑠 ℎ𝑒𝑎𝑡 𝑣𝑎𝑙𝑢𝑒 𝑖𝑛 𝑓𝑢𝑒𝑙) ∗ 100⁄
𝐵𝑜𝑖𝑙𝑒𝑟 𝑒𝑓𝑓𝑖𝑐𝑖𝑒𝑛𝑐𝑦(𝜂𝑏)
=𝑆𝑡𝑒𝑎𝑚 𝑓𝑙𝑜𝑤𝑟𝑎𝑡𝑒(𝑄𝑠){𝑠𝑡𝑒𝑎𝑚 𝑒𝑛𝑡ℎ𝑎𝑙𝑝𝑦(ℎ𝑠) − 𝑓𝑒𝑒𝑑 𝑤𝑎𝑡𝑒𝑟 𝑒𝑛𝑡ℎ𝑎𝑙𝑝𝑦(ℎ𝑤)}
𝐹𝑢𝑒𝑙 𝑓𝑙𝑜𝑤𝑟𝑎𝑡𝑒(𝑄𝑜) ∗ 𝐺𝑟𝑜𝑠𝑠 𝑐𝑎𝑙𝑜𝑟𝑓𝑖𝑐 𝑣𝑎𝑙𝑢𝑒(𝐺. 𝐶. 𝑉)
Source bureau of energy efficiency on the energy performance assessment of boilers [32],[33]
Data on flowrate of the different substances is taken from the continuous measurement
throughout the year. Flowrate measurement during the time less steam was produced by using
relatively high fuel is used to calculate the efficiency that is from the 1st February to 1st March
2017. This mean that the measurement was taken during the time less evaporation rate (er) was
ENERGY MANAGEMENT IN INDUSTRIES
14
observed. By doing so, it makes the thesis more credible and accurate when calculating the
efficiency.
𝑒𝑟 =𝑠𝑡𝑒𝑎𝑚 𝑝𝑟𝑜𝑑𝑢𝑐𝑒𝑑 𝑓𝑙𝑜𝑤𝑟𝑎𝑡𝑒
𝑓𝑢𝑒𝑙 𝑓𝑙𝑜𝑤𝑟𝑎𝑡𝑒=
𝑄𝑠
𝑄𝑜
The average efficiency of the boiler obtained from the direct method formula is 𝜂𝑏 = 95.366,
allowing a possibility of 3% in measurement error which may cause ±2.7 error in the boiler
efficiency. Hence the boiler efficiency will be
𝐵𝑜𝑖𝑙𝑒𝑟 𝑒𝑓𝑓𝑖𝑐𝑖𝑒𝑛𝑐𝑦(𝜂𝑏)
=𝑆𝑡𝑒𝑎𝑚 𝑓𝑙𝑜𝑤𝑟𝑎𝑡𝑒(𝑄𝑠){𝑎𝑣𝑒𝑟𝑎𝑔𝑒 𝑠𝑡𝑒𝑎𝑚 𝑒𝑛𝑡ℎ𝑎𝑙𝑝𝑦(ℎ𝑠) − 𝑓𝑒𝑒𝑑 𝑤𝑎𝑡𝑒𝑟 𝑒𝑛𝑡ℎ𝑎𝑙𝑝𝑦(ℎ𝑤)}
𝐹𝑢𝑒𝑙 𝑓𝑙𝑜𝑤𝑟𝑎𝑡𝑒(𝑄𝑜) ∗ 𝐺𝑟𝑜𝑠𝑠 𝑐𝑎𝑙𝑜𝑟𝑓𝑖𝑐 𝑣𝑎𝑙𝑢𝑒(𝐺. 𝐶. 𝑉)
Input data
𝑄𝑠 = 14 𝑡𝑜𝑛 ℎ𝑟⁄ 𝑄𝑜 = 0.98 𝑡𝑜𝑛/ℎ𝑟
ℎ𝑠 = 3010.14 𝑘𝐽/𝑘𝑔 ℎ𝑤 = 517 𝑘𝐽/𝑘𝑔 𝐺. 𝐶. 𝑉 = 37.5 𝑀𝐽/𝑘𝑔
(𝜂𝑏) =(14 𝑡𝑜𝑛 ℎ𝑟⁄ ){3010.14 − 517} 𝑘𝐽 𝑘𝑔⁄
(0.98 𝑡𝑜𝑛 ℎ𝑟⁄ ) ∗ 37.5 𝑀𝐽 𝑘𝑔⁄= .9497
𝜂𝑏 = 95% ± 2.7 = 92.3%
Then it can be said that the boiler is efficient on producing the steam there fore it should be
looked further how the energy on the steam is utilized.
3.2 Steam Energy produced
From the sample measurement taken for calculation, a 30 bar steam with an average mass
flowrate of 14 ton/hour is produced using an average of 16.48 ton/hour of treated, preheated
and compressed of feed water and 0.978 ton/hour of preheated pitch fuel.
𝑓𝑢𝑒𝑙 𝑒𝑛𝑒𝑟𝑔𝑦(𝐸𝑜) = 𝑄𝑜 ∗ 𝐺. 𝐶. 𝑉
𝑆𝑡𝑒𝑎𝑚 𝑒𝑛𝑒𝑟𝑔𝑦 = 𝐸𝑜 ∗ 𝜂𝑏 + 𝑄𝑠 ∗ 𝐻𝑓𝑤@50𝑏𝑎𝑟 = 𝑄𝑠 ∗ 𝐻𝑠@30𝑏𝑎𝑟
𝑊ℎ𝑒𝑟𝑒:
𝐻𝑓@50𝑏𝑎𝑟 is saturated enthalpy of water compressed to 50 bar before it is fed to the boiler
𝐸𝑜 fuel energy
𝐻𝑠@30𝑏𝑎𝑟 latent heat of steam at 30 bar
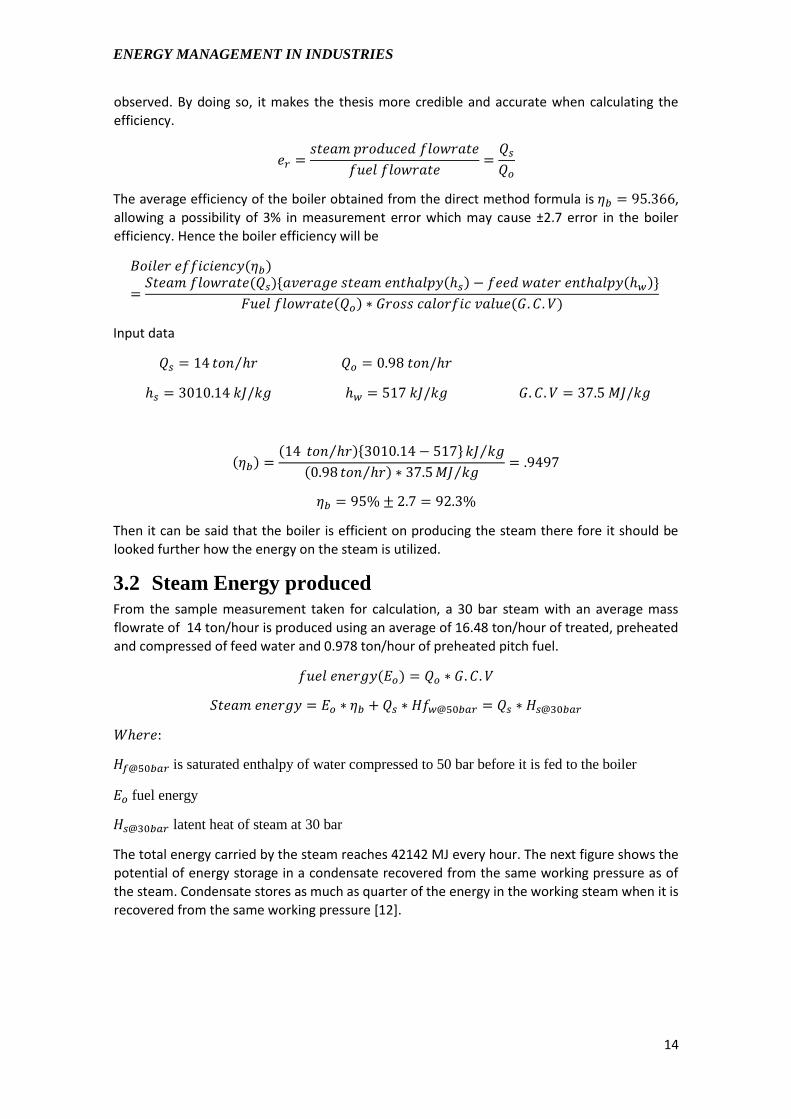
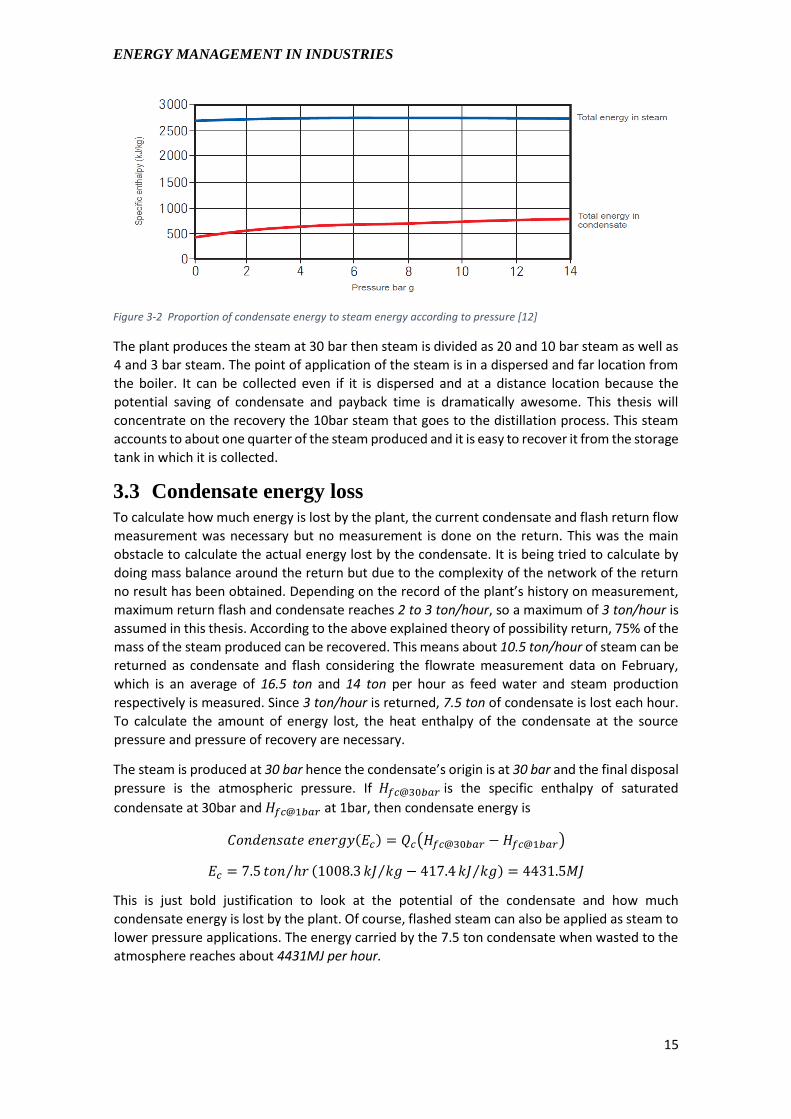
The total energy carried by the steam reaches 42142 MJ every hour. The next figure shows the
potential of energy storage in a condensate recovered from the same working pressure as of
the steam. Condensate stores as much as quarter of the energy in the working steam when it is
recovered from the same working pressure [12].
ENERGY MANAGEMENT IN INDUSTRIES
15
Figure 3-2 Proportion of condensate energy to steam energy according to pressure [12]
The plant produces the steam at 30 bar then steam is divided as 20 and 10 bar steam as well as
4 and 3 bar steam. The point of application of the steam is in a dispersed and far location from
the boiler. It can be collected even if it is dispersed and at a distance location because the
potential saving of condensate and payback time is dramatically awesome. This thesis will
concentrate on the recovery the 10bar steam that goes to the distillation process. This steam
accounts to about one quarter of the steam produced and it is easy to recover it from the storage
tank in which it is collected.
3.3 Condensate energy loss
To calculate how much energy is lost by the plant, the current condensate and flash return flow
measurement was necessary but no measurement is done on the return. This was the main
obstacle to calculate the actual energy lost by the condensate. It is being tried to calculate by
doing mass balance around the return but due to the complexity of the network of the return
no result has been obtained. Depending on the record of the plant’s history on measurement,
maximum return flash and condensate reaches 2 to 3 ton/hour, so a maximum of 3 ton/hour is
assumed in this thesis. According to the above explained theory of possibility return, 75% of the
mass of the steam produced can be recovered. This means about 10.5 ton/hour of steam can be
returned as condensate and flash considering the flowrate measurement data on February,
which is an average of 16.5 ton and 14 ton per hour as feed water and steam production
respectively is measured. Since 3 ton/hour is returned, 7.5 ton of condensate is lost each hour.
To calculate the amount of energy lost, the heat enthalpy of the condensate at the source
pressure and pressure of recovery are necessary.
The steam is produced at 30 bar hence the condensate’s origin is at 30 bar and the final disposal
pressure is the atmospheric pressure. If 𝐻𝑓𝑐@30𝑏𝑎𝑟 is the specific enthalpy of saturated
condensate at 30bar and 𝐻𝑓𝑐@1𝑏𝑎𝑟 at 1bar, then condensate energy is
𝐶𝑜𝑛𝑑𝑒𝑛𝑠𝑎𝑡𝑒 𝑒𝑛𝑒𝑟𝑔𝑦(𝐸𝑐) = 𝑄𝑐(𝐻𝑓𝑐@30𝑏𝑎𝑟 − 𝐻𝑓𝑐@1𝑏𝑎𝑟)
𝐸𝑐 = 7.5 𝑡𝑜𝑛 ℎ𝑟⁄ (1008.3 𝑘𝐽 𝑘𝑔⁄ − 417.4 𝑘𝐽 𝑘𝑔⁄ ) = 4431.5𝑀𝐽
This is just bold justification to look at the potential of the condensate and how much
condensate energy is lost by the plant. Of course, flashed steam can also be applied as steam to
lower pressure applications. The energy carried by the 7.5 ton condensate when wasted to the
atmosphere reaches about 4431MJ per hour.
ENERGY MANAGEMENT IN INDUSTRIES
16
3.4 Estimated cost lost by the condensate When condensate is wasted not only the energy it holds is wasted, also the cost of the chemicals
used to treat the makeup water, water supply charge, effluent disposal treatment charge and
other related costs has to be considered. The Pitch fuel used by the plant costs 228 €/metric
Ton and the water treatment costs 50 SEK per metric ton but there is no data on the charge of
the effluent and water supply so it is left without considering those charges.
3.4.1 Estimating lost fuel cost
Determining equivalent fuel mass flowrate (𝑄𝑒𝑜) to the energy lost by the condensate. To find
how much mass of fuel is consumed.
𝑄𝑒𝑜 =𝐸𝑐
𝐺. 𝐶. 𝑉 ∗ 𝜂𝑏⁄ = 128 𝑘𝑔/ℎ𝑟
𝑆𝐸𝐾𝑓𝑢𝑒𝑙 𝑙𝑜𝑠𝑡 = 𝑆𝐸𝐾𝑓𝑢𝑒𝑙 𝑢𝑛𝑖𝑡 ∗ 𝑄𝑒𝑜
𝑆𝐸𝐾𝑓𝑢𝑒𝑙 𝑙𝑜𝑠𝑡 = (228€ 𝑚𝑇⁄ ) ∗ (9.62𝑆𝐸𝐾 €⁄ ) ∗ (128.43𝑘𝑔/ℎ𝑟) = 280.7 𝑆𝐸𝑘 ℎ𝑟⁄
About 280 SEK cost of fuel spent every hour to produce 4431MJ wasted condensate. Of course
it seems silly estimation but ‘that is what it is’ that is what the plant is losing currently. This
justification is considering that the condensate is to be collected at 30 bar.
3.4.2 Estimating lost treating chemicals cost
The cost lost by the wasted raw water treatment chemicals is directly proportional to the mass
of the condensate being wasted. That is if more condensate is wasted more treatment chemicals
and its related cost are wasted. The cost lost by the wasted condensate can then be estimated
as follow.
𝑆𝐸𝐾𝑇.𝑐.𝑐 𝑙𝑜𝑠𝑡 = 𝑆𝐸𝐾𝑝𝑒𝑟 𝑢𝑛𝑖𝑡 𝑚𝑎𝑠𝑠 𝑡𝑟𝑒𝑎𝑡𝑚𝑒𝑛𝑡 ∗ 𝑄𝑐
𝑆𝐸𝐾𝑇.𝑐.𝑐 𝑙𝑜𝑠𝑡 = 50 𝑆𝐸𝐾 𝑚𝑇⁄ ∗ 7.5 𝑡𝑜𝑛 ℎ𝑟⁄ = 375 𝑆𝐸𝐾 ℎ𝑟⁄
The extra cost due to the drained condensate with the treatment chemicals is estimated 375
SEK each hour.
Summing up the results then yields
𝑆𝐸𝐾𝑠𝑢𝑚 = 𝑆𝐸𝐾𝑇.𝑐.𝑐 𝑙𝑜𝑠𝑡 + 𝑆𝐸𝐾𝑓𝑢𝑒𝑙 𝑙𝑜𝑠𝑡
𝑆𝐸𝐾𝑠𝑢𝑚 = 375 𝑆𝐸𝐾 ℎ𝑟⁄ + 280.7 𝑆𝐸𝑘 ℎ𝑟⁄ = 655.7 𝑆𝐸𝐾 ℎ𝑟⁄
The plant spends 655 SEK each hour unreasonably that it is too oblivion to notice it. It is too
much expenses that the plant spends unnecessarily when the plant could invest on the plant so
that those unnecessary expenses could be avoided. To return all the proposed amount of
condensate may be impractical hence this paper has concentrated on the portion of the
condensate that is easy to return. This condensate accounts to almost quarter of the produced
steam beside it is all collected around certain storage tanks.
The above deduction is valid if the plant reached to recover condensate of 75% of the steam
produced. This saving also includes the condensate that the plant is recovering currently. This it
to show the potential of condensate return.
ENERGY MANAGEMENT IN INDUSTRIES
17
4 Results In this section, the results on the condensate return that is possible and easy to recover will be
discussed. That is the savings that can be obtained by returning the condensate which is
available at 10 bar. The plants operating time is 345 days per year. It is better for the boilers to
run 24/7 rather than to switched it off and turn it on according to the need, this is not only
because steam is required all the time but also it takes time to get started and produce steam
after shut down and consumes much energy to get started.
4.1 Energy savings
When speaking about energy saving from condensate recovery it mainly involves with the
energy capacity of water. At certain pressure and temperature any material has its own stored
energy. The average temperature of Sandarne is 7.5°C, hence water is supplied with stored
energy at atmospheric pressure and 7.5°C temperature. This initial energy of water should be
subtracted from the condensate’s energy when calculating the amount of energy saved by the
condensate. 3 ton condensate is available at 10 bar from the steam at 10 bar for recovery. To
determine the change in energy at different pressure and temperature, it is required the
knowledge of enthalpy which can be defined as the total heat content of a system (material)
given that water is the material referred. In this thesis the temperature is considered as the
saturation temperature of the atmospheric pressure. Hence the water is assumed initially with
heat content at an atmospheric pressure and saturation temperature which is 100°C. This
assumption simply add-up extra flexibility in saving potential for further study.
𝐸𝑐 = 𝑄𝑐(𝐻𝑓𝑐@10𝑏𝑎𝑟 − 𝐻𝑓𝑐@1𝑏𝑎𝑟)
𝐸𝑐 = 3 𝑡𝑜𝑛 ℎ𝑟⁄ (762.5 𝑘𝐽 𝑘𝑔⁄ − 417.4 𝑘𝐽 𝑘𝑔⁄ ) = 1035.3 𝑀𝐽 ℎ𝑟⁄
By recovering the 3 ton condensate at 10 bar from draining, 1035.3MJ/hr energy can be saved.
The current condensate return temperature is 140°C in which the pressure can be approximated
about 3 bar given that the saturation pressure of water at 140°C.
4.2 Cost savings Cost saving is the cumulative result of energy saving which saves the fuel cost, effluent
treatment charge, water supply charge and cost saving related to the cost of treatment
chemicals. Here only the cost related to fuel and raw water treatment chemicals will be
discussed and all the economic analysis will be done based only on these savings.
I. In order to determine the cost saved by saving fuel energy, the fuel energy equivalent
to the saved condensate energy has to be calculated from which the equivalent mass
flowrate of fuel could be obtained and the price of the fuel as of 8𝑡ℎ 𝐽𝑢𝑙𝑦 2017
exchanges rate can be calculated in Swedish krona as follow.
𝐶𝑢𝑟𝑟𝑒𝑛𝑐𝑦 𝑒𝑥𝑐ℎ𝑎𝑛𝑔𝑒 𝑟𝑎𝑡𝑒 𝑎𝑠 𝑜𝑓 8th July 2017 = 9.62 𝑆𝐸𝐾 €⁄
𝐸𝑒𝑜 =𝐸𝑐
𝜂𝑏⁄ = 1121.7 𝑀𝐽 ℎ𝑟⁄
𝑄𝑒𝑜 =𝐸𝑜
𝐺. 𝐶. 𝑉⁄ = 29.9 𝑘𝑔 ℎ𝑟⁄
𝑆𝑎𝑣𝑒𝑑 𝑓𝑢𝑒𝑙 𝑐𝑜𝑠𝑡 (𝐹𝑆𝐸𝐾) = 𝐶𝑜𝑠𝑡 𝑜𝑓 𝑓𝑢𝑒𝑙 ∗ 𝑄𝑜 = 65.6 𝑆𝐸𝐾 ℎ𝑟⁄
𝐴𝑛𝑢𝑎𝑙 𝑓𝑢𝑒𝑙 𝑐𝑜𝑠𝑡 𝑠𝑎𝑣𝑖𝑛𝑔 = 65.6 𝑆𝐸𝐾 ℎ𝑟⁄ ∗ 345 𝑑𝑦𝑠 𝑦𝑟⁄ ∗ 24 ℎ𝑟𝑠 𝑑𝑦⁄
= 543014 𝑆𝐸𝐾 𝑦𝑟⁄
ENERGY MANAGEMENT IN INDUSTRIES
18
𝑊ℎ𝑒𝑟𝑒 𝐸𝑒𝑜 𝑖𝑠 𝑒𝑞𝑢𝑖𝑣𝑎𝑙𝑒𝑛𝑡 𝑓𝑢𝑒𝑙 𝑒𝑛𝑒𝑟𝑔𝑦 𝑡𝑜 𝑐𝑜𝑛𝑑𝑒𝑛𝑠𝑎𝑡𝑒 𝑒𝑛𝑒𝑟𝑔𝑦 𝑙𝑜𝑠𝑡
II. The cost saving from raw water treating chemicals is calculated as follow. The plant purchases chemicals to one metric cube of raw water that is lost by the drained condensate. But if 3ton of condensate returned replace 3ton of the raw water then the treating chemicals supposed to treat 3ton raw water would be saved.
𝑆𝐸𝐾𝑇.𝑐.𝑐 𝑙𝑜𝑠𝑡 = 𝑆𝐸𝐾𝑝𝑒𝑟 𝑢𝑛𝑖𝑡 𝑚𝑎𝑠𝑠 𝑡𝑟𝑒𝑎𝑡𝑚𝑒𝑛𝑡 ∗ 𝑄𝑐
𝑆𝐸𝐾𝑇.𝑐.𝑐 𝑙𝑜𝑠𝑡 = 50 𝑆𝐸𝐾 𝑚𝑇⁄ ∗ 3 𝑡𝑜𝑛 ℎ𝑟⁄ = 150 𝑆𝐸𝐾 ℎ𝑟⁄
𝐴𝑛𝑢𝑎𝑙 𝑇. 𝐶. 𝐶 𝑠𝑎𝑣𝑖𝑛𝑔 = 150 𝑆𝐸𝐾 ℎ𝑟⁄ ∗ 345 𝑑𝑦𝑠 𝑦𝑟⁄ ∗ 24 ℎ𝑟𝑠 𝑑𝑦⁄
= 1242000 𝑆𝐸𝐾 𝑦𝑟⁄
Where
𝑇. 𝐶. 𝐶 is Treatment Chemical Cost
Total annual saving can then be calculated as the sum of saving from fuel cost and treatment
chemicals cost.
𝑇𝑜𝑡𝑎𝑙 𝑎𝑛𝑛𝑢𝑎𝑙 𝑠𝑎𝑣𝑖𝑛𝑔 = 𝐴𝑛𝑢𝑎𝑙 𝑇. 𝐶. 𝐶 𝑠𝑎𝑣𝑖𝑛𝑔 + 𝐴𝑛𝑢𝑎𝑙 𝑓𝑢𝑒𝑙 𝑐𝑜𝑠𝑡 𝑠𝑎𝑣𝑖𝑛𝑔
= 1785014 𝑆𝐸𝐾 𝑦𝑟⁄
The total annual saving from the condensate return without considering the water supply and
disposal (effluent) treatment charges is 1783106.7𝑆𝐸𝐾. This is significant saving every year in
terms of cost saving.
4.3 Environmental benefits
The environmental benefit of condensate recovery is obvious because it
➢ Reduces CO2 emission due to reduced fuel consumption
➢ Reduces effluent disposal
➢ Increases energy efficiency
➢ Meets environmental regulation
4.4 Economic analysis
4.4.1 Equipment cost
To return condensate a little investment on condensate storage tanks, recovery pipes, steam
traps and pumps is needed to have a long term benefit. According to the data provided on the
costs of storage tanks, pipes and pumps can be listed as below.
1. For insulated installed condensate pipes costs 2265Sek/m
2. For large tank farms would cost 1133kSEK
3. For pumps 200kSEK
For the recovery of the proposed condensate 800 meter of pipes at a cost of 1812000SEK with
two pumps at each centralized location at a cost of 400kSEK. The total investment will then
be3345000SEK.

ENERGY MANAGEMENT IN INDUSTRIES
19
4.4.2 Payback time
The payback time is at which the investment made is paid by the annual profit from the condensate return. It can be calculated as follow.
𝑃𝑎𝑦𝑏𝑎𝑐𝑘 𝑡𝑖𝑚𝑒 = 𝐼𝑛𝑣𝑒𝑠𝑡𝑚𝑒𝑛𝑡𝑇𝑜𝑡𝑎𝑙 𝑠𝑎𝑣𝑖𝑛𝑔⁄ = 3345000𝑆𝐸𝐾
1783106.7 𝑆𝐸𝐾 𝑦𝑟⁄⁄
𝑃𝑎𝑦𝑏𝑎𝑐𝑘 𝑡𝑖𝑚𝑒 = 1.87𝑦𝑟
ENERGY MANAGEMENT IN INDUSTRIES
20
5 Discussion It is known that energy is directly related to the power and time, meaning that energy
consumption can be reduced either by looking to the power of the equipment or decreasing
unnecessary time that the equipment runs. But how about in the case if all the energy is not
being utilized efficiently? Such as energy being wasted as useless thing? It is not related either
to the equipment power or time it runs. For example in the case of boilers, the boiler can be
more efficient with the right power and it can also be running in the required time but the energy
it produces may not be utilized as it should. In such cases there should be way so that the energy
produced by the boiler could be efficiently used.
Therefore this thesis has concentrated on the plant’s efficiency as a whole system. That is to
recover the energy being discarded by the plant as waste. The plant produces an average of 11.4
ton steam with 345 days of operational days per year. If the plant somehow reaches to recover
75% of the condensate of the steam then the plant can return 86940 ton of condensate each
year. This is about 63.63% of the total water supply that the plant each year requires. This return
is worth of more than 5million Swedish kronor each year just from the fuel and chemical
treatment costs, assuming that the condensate is to be returned starting from the 30 bar steam
application using steam traps.
This paper has discussed on the savings that can be achieved from the condensate produced by
the 10 bar steam. There is 24840 ton potential of condensate from the 10 bar steam each year.
The condensate from this 10 bar steam is about 28.6% of the total condensate of that the plant
can recover. The result obtained from this study is 1035 MJ in energy saving each hour. The cost
saving related to energy is 65 SEK/hr and 150 SEK/hr related to treatment chemical cost. This
means only 2.8% fuel energy saving and 7% in cost saving. The highest cost saving potential is
obtained from the treatment chemical saving which is 26.3%.
This thesis did not take into consideration the potential cost saving from water supply charge
and effluent disposal treating charge so the payback time will be reduced far if those potentials
taken into . Beside the heat required to keep the tank farms warm is not being considered
despite there should be further study on how to recover it, that is if it should be pumped from
storage tanks or directly pumped to deaerator on the boiler. These things has to be further
assessed in which they would not have much impact on the potential savings or the payback
time. This paper does not guarantee on the accuracy and certainty of the measurements used
for the analysis in fact there are some uncertainties, so it is highly recommended to investigate
and make survey on the plant when implementing this recommendation.
ENERGY MANAGEMENT IN INDUSTRIES
21
6 Conclusion
6.1 Study result
Energy management is a key point on saving energy and increasing energy efficiency. Managing
what you have is the beginning of using energy wisely and this thesis basically emphasizes on
energy management which is the core concept of energy system.
The savings results of the thesis is 1121𝑀𝐽 in energy each hour and 1.8 𝑀𝑖𝑙𝑙𝑖𝑜𝑛 𝑆𝐸𝐾 as total
annual savings. Considering an investment on two pumps, one large tank farm and 800 m
insulated pipes worth of 3.3 𝑀𝑖𝑙𝑙𝑖𝑜𝑛 SEK , the payback time will be 1.9yrs.
Generally most early installed plants does not take into consideration the potential that they
has, it may be because those plants were installed during the good times. Good times when fuel
energy was low in price and people where not more conscious about the effect of fuel on the
environment. But now the rise of fuel price and uncertainty of the future prices industries should
manage their energy efficiently to stay on the race of industries. It is seen in this thesis how
beneficiary is to look in how energy is circulating and is managed in the industry as whole.
6.2 Outlook
The plant uses the 30bar steam for tracing purpose but most of the steam is utilized as 20, 10, 4
and 3 bar steam for different applications beside the boilers does not run in full capacity.
Therefore the plant can run the boilers to full capacity so that the superheated 30bar steam
could be used to generate electricity. Since electricity is a flexible form of energy it can be used
for the tracing purpose and other applications easily. From the generator, a 30 bar condensate
will be flashed to the lower pressure steam in order to provide the required steams.
Despite this thesis is more generalized and over simplified but the result is motivating. If analysis
& assessments like in measurements, steam auditing, steam trap routine and other site study
to check for condensate collection and pinch technology application viability, then the study can
go in to practical action.
ENERGY MANAGEMENT IN INDUSTRIES
22
7 References [1] Enerdata.net. (2017). Research on energy efficiency, CO2 emissions, energy consumption,
forecast. [online] Available at: https://www.enerdata.net/ [Accessed 10 May 2017].
[2] Mardan, P. (2017). Lectures and presentations distributed in Industrial energy system. Available
from: https://lms.hig.se/
[3] International Energy Agency (2017). Energy Efficiency Market Report 2016. [online] Paris:
International Energy Agency. Available at: http://www.oecd.org/about/publishing/corrigenda.htm
[Accessed 31 Jul. 2017].
[4] Sweden.se. (2017). Energy use in Sweden. [online] Available at:
https://sweden.se/society/energy-use-in-sweden/ [Accessed 31 Jul. 2017].
[5] Iea.org. (2017). Energy Efficiency Indicators statistics 2016. [online] Available at:
http://www.iea.org/publications/freepublications/publication/EnergyEfficiencyIndicatorsHighlights_
2016.pdf [Accessed 1 Aug. 2017].
[6] Swedish energy agency (2015). energy in sweden 2015. swedish energy agency.
[7] Suehiro, S. (2007). Energy Intensity of GDP as an Index of Energy conservation.
[8] Eia.gov. (2017). Monthly Energy Review - Energy Information Administration. [online] Available at:
http://www.eia.gov/totalenergy/data/monthly/#consumption. [Accessed 31 Jul. 2017].
[9] Iea.org. (2017). Energy efficiency: Our work. [online] Available at:
http://www.iea.org/topics/energyefficiency/ [Accessed 25 Jun. 2017]
[10] Tlv.com. (2017). Returning Condensate and When to Use Condensate Pumps | TLV - A Steam
Specialist Company (International). [online] Available at: http://www.tlv.com/global/TI/steam-
theory/types-of-condensate-recovery.html [Accessed 20 Apr. 2017].
[11] Spiraxsarco.com. (2017). Pages - Introduction to Condensate Recovery. [online] Available at:
http://www.spiraxsarco.com/resources/pages/steam-engineering-tutorials/condensate-
recovery/introduction-to-condensate-recovery.aspx#close [Accessed 11 Jun. 2017].
[12] Spiraxsarco.com. (n.d.). condensate recovery. [online] Available at:
http://www.spiraxsarco.com/News/Documents/Condensate_Recovery_White_Paper.pdf [Accessed
8 Jun. 2017].
[13] Bujak, J. 2008, "Energy savings and heat efficiency in the paper industry: A case study of a
corrugated board machine", Energy, vol. 33, pp. 1597-1608.
[14] Einstein, D., Worrell, E. & Khrushch, M. 2001, "Steam systems in industry: Energy use and energy
efficiency improvement potentials", Lawrence Berkeley National Laboratory, .
[15] Hills, R.L. 1993, Power from steam: A history of the stationary steam engine, Cambridge
University Press.
[16] Lee, S. 1987, "Steam traps, condensate pumps and regulators perform well, save energy and
minimize costs", Chem.Process.(Chicago), , pp. 98, 101.
[17] Rakib, M.I., Saidur, R., Mohamad, E.N. & Afifi, A.M. 2017, "Waste-heat utilization - The
sustainable technologies to minimize energy consumption in Bangladesh textile sector", Journal of
Cleaner Production, , pp. 1867.
ENERGY MANAGEMENT IN INDUSTRIES
23
[18] Teir, S. and Kulla, A. (2002). Boiler Calcultions. [ebook] Espoo: Energy engineering and
Environmental protection. Available at:
http://www.energy.kth.se/compedu/webcompedu/ManualCopy/Steam_Boiler_Technology/Boiler_c
alculations/boiler_calculations.pdf [Accessed 15 Aug. 2017].
[19] D. Lang, F. (2009). Errors in boiler efficiency standards. In: 2009 ASME Power Conference.
California: Exergetic Systems, Inc.
[20] Renfrow, S. 2008, Return Condensate to the Boiler: Office of Industrial Technologies (OIT) Steam
Energy Tips Fact Sheet, United States, North America.
[21] Siddhartha Bhatt, M. 2000, Energy audit case studies I—steam systems.
[22] Webbook.nist.gov. (2017). NIST Chemistry WebBook. [online] Available at:
http://webbook.nist.gov/chemistry/ [Accessed 17 May 2017].
[23] Kraton.com. (2017). History - Kraton Corporation. [online] Available at:
http://www.kraton.com/about/history.php [Accessed 31 Jul. 2017].
[24] Anon, (2015). Climate Focus The Paris agreement. [online] Available at:
http://www.climatefocus.com/sites/default/files/20151228%20COP%2021%20briefing%20FIN.pdf
[Accessed 26 Jun. 2017].
[25] Anon, (2017). [online] Available at: http://www.em-ea.org/Guide%20Books/book-
4/4.1%20Boiler.pdf [Accessed 31 Jul. 2017].
[26] Anon, (2017). [online] Available at: http://www.em-ea.org/Guide%20Books/book-
4/4.1%20Boiler.pdf [Accessed 31 Jul. 2017].
[27] Iea.org. (2017). Tracking clean energy progress 2017. [online] Available at:
https://www.iea.org/publications/freepublications/publication/TrackingCleanEnergyProgress2017.p
df [Accessed 1 Aug. 2017].
[28] Iea.org. (2017). Industrial Technologies and Systems (IETS TCP). [online] Available at:
https://www.iea.org/tcp/end-use-industry/iets/ [Accessed 1 Aug. 2017].
[29] Andersson, M. (2017). Kraton corporation.
[30] Andersson, M. (2017). [email].
[31] Energy.gov. (2017). Energy Intensity Indicators: Efficiency vs. Intensity | Department of Energy.
[online] Available at: https://energy.gov/eere/analysis/energy-intensity-indicators-efficiency-vs-
intensity [Accessed 1 Aug. 2017].
[32] http://www.em-ea.org. (n.d.). Energy Performance Assessment of Boilers. [online] Available at:
http://www.em-ea.org/Guide%20Books/book-4/4.1%20Boiler.pdf [Accessed 1 Aug. 2017].
[33] Service News. (2008). [ebook] Miura CO., Ltd. Available at:
https://www.miuraz.co.jp/en/marine/pdf/news2.pdf [Accessed 1 Aug. 2017].
24
8 Appendices
8.1 Appendix I
Figure 8-1 World energy balance (available www.iea.org)
ENERGY MANAGEMENT IN INDUSTRIES
25
8.2 Appendix II
Figure 8-2 Sweden energy balance [6]
ENERGY MANAGEMENT IN INDUSTRIES
26
8.3 Appendix III
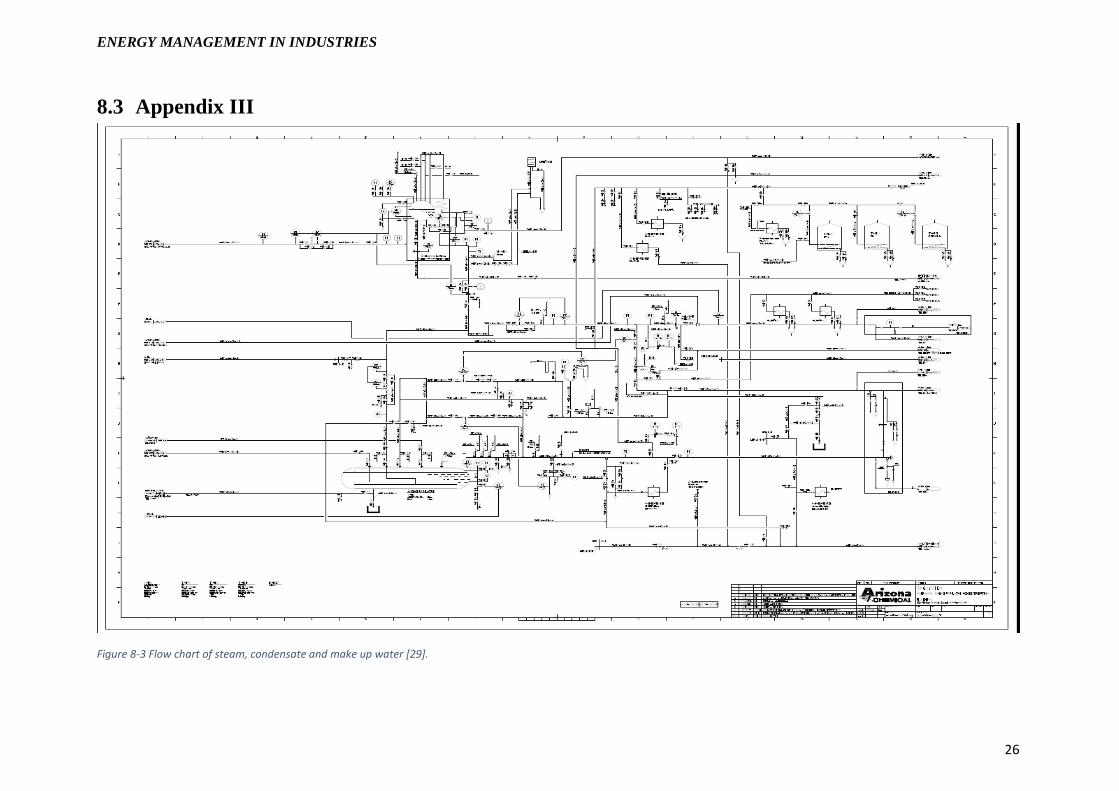
Figure 8-3 Flow chart of steam, condensate and make up water [29].
ENERGY MANAGEMENT IN INDUSTRIES
27
8.4 Appendix IV
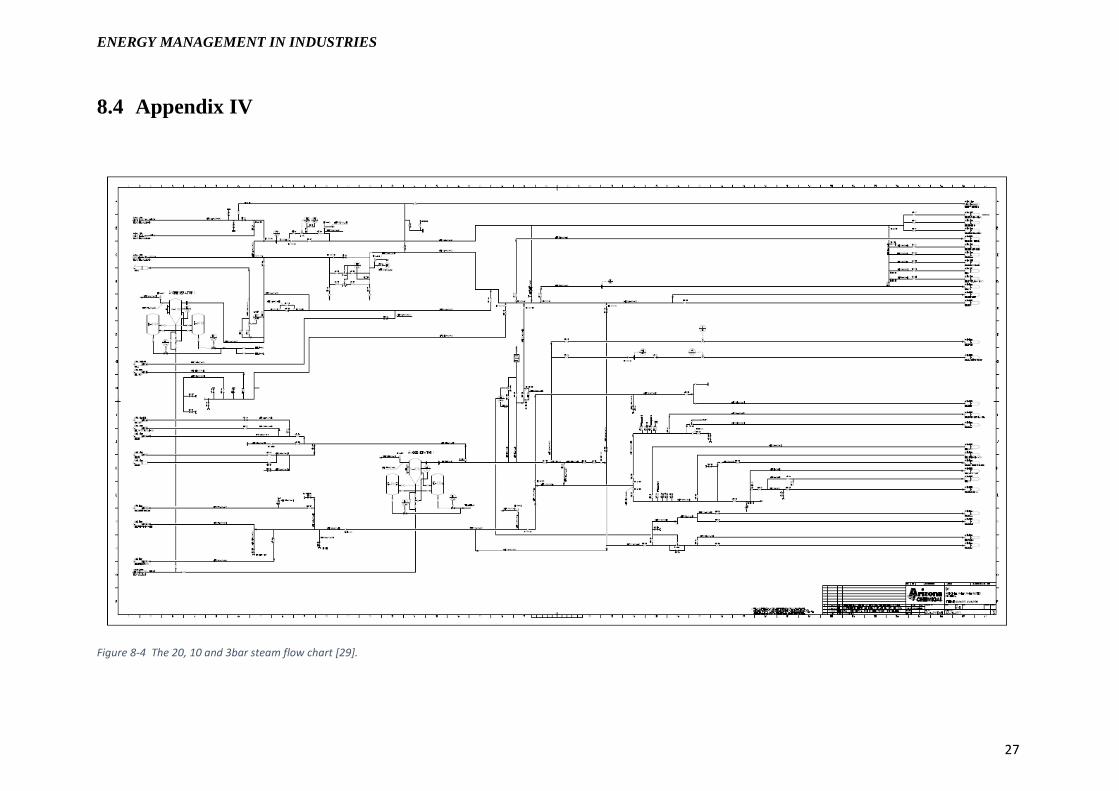
Figure 8-4 The 20, 10 and 3bar steam flow chart [29].