Embed Size (px)
Citation preview
Energy Management inDow Chemical
26 May 2010, BeijingNingke Peng
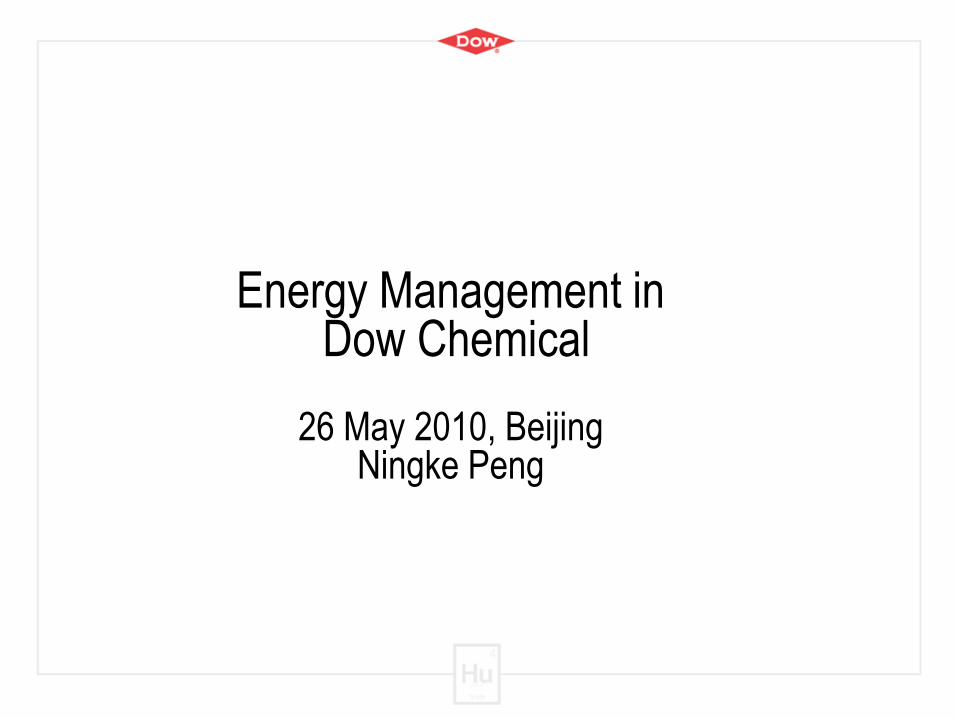
About Dow
A diversified chemical company, harnessing the power of science and technology to
improve living daily
founded in Midland, Michigan in 1897
annual sales of $58 billion
52,000 employees
3,900+ in China and growing daily
supplies more than 5,000 products
serve customers in 160 countries
a company committed to sustainability
24 sites and offices in China
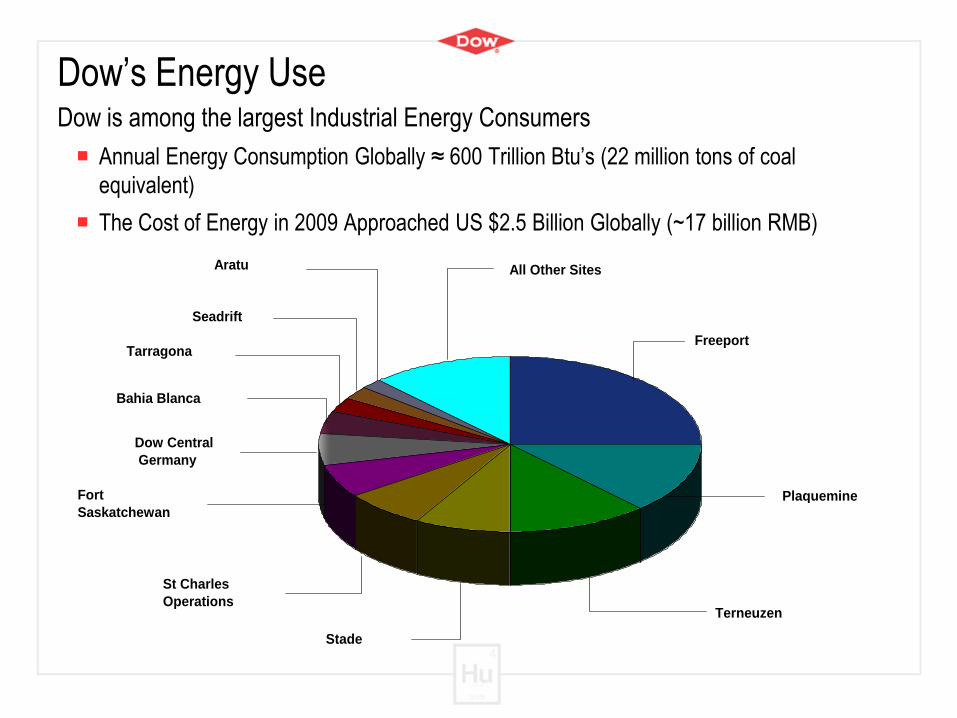
Dow’s Energy UseDow is among the largest Industrial Energy Consumers
Annual Energy Consumption Globally ≈ 600 Trillion Btu’s (22 million tons of coal
equivalent)
The Cost of Energy in 2009 Approached US $2.5 Billion Globally (~17 billion RMB)
Freeport
Plaquemine
Stade
Terneuzen
St Charles
Operations
Fort
Saskatchewan
Dow Central
Germany
Bahia Blanca
All Other Sites
Tarragona
Seadrift
Aratu
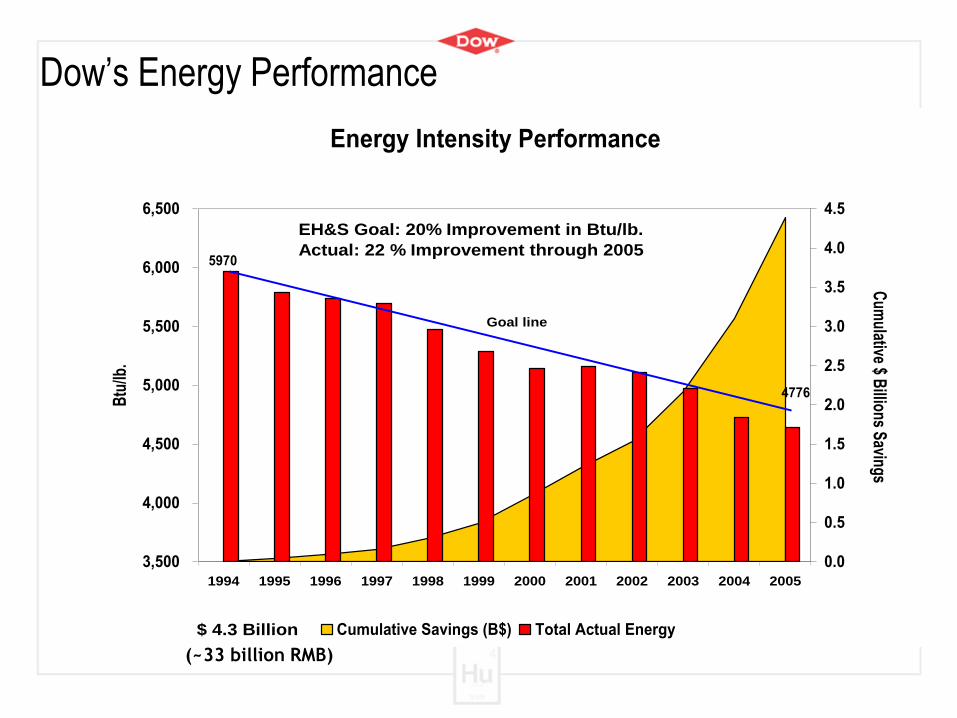
Energy Intensity Performance
3,500
4,000
4,500
5,000
5,500
6,000
6,500
1994 1995 1996 1997 1998 1999 2000 2001 2002 2003 2004 2005
Btu
/lb.
0.0
0.5
1.0
1.5
2.0
2.5
3.0
3.5
4.0
4.5
Cum
ulative $ Billions S
avings
Cumulative Savings (B$) Total Actual Energy
5970
4776
EH&S Goal: 20% Improvement in Btu/lb.
Actual: 22 % Improvement through 2005
Goal line
$ 4.3 Billion
Dow’s Energy Performance
(~33 billion RMB)
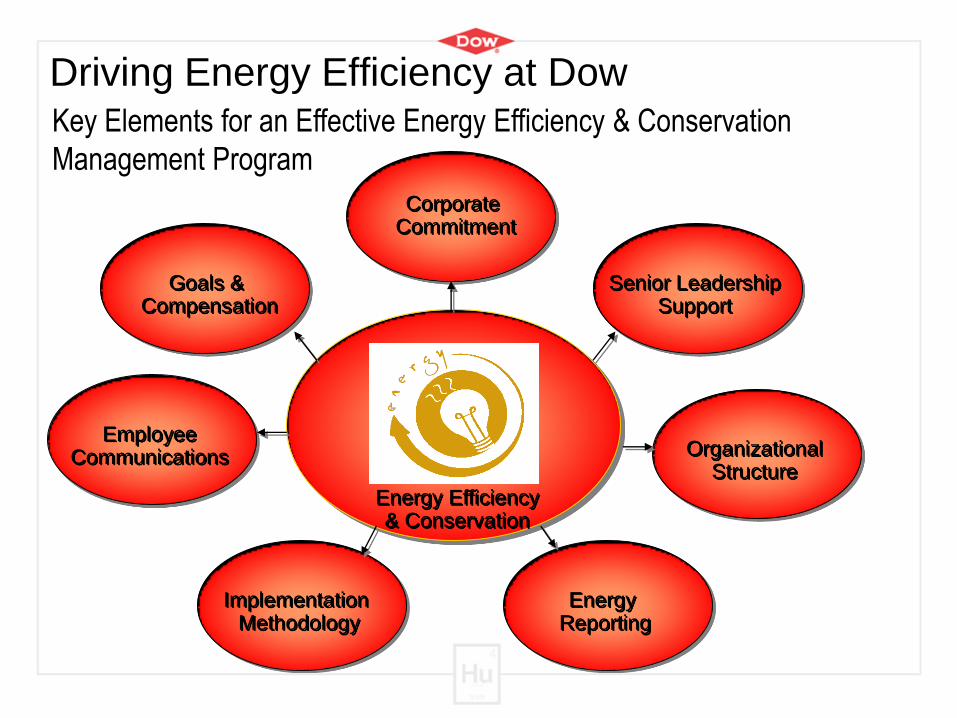
Driving Energy Efficiency at Dow
Energy Efficiency& Conservation
Corporate Commitment
OrganizationalStructure
Energy Reporting
EmployeeCommunications
Implementation Methodology
Goals & Compensation
Senior LeadershipSupport
Key Elements for an Effective Energy Efficiency & Conservation
Management Program
-
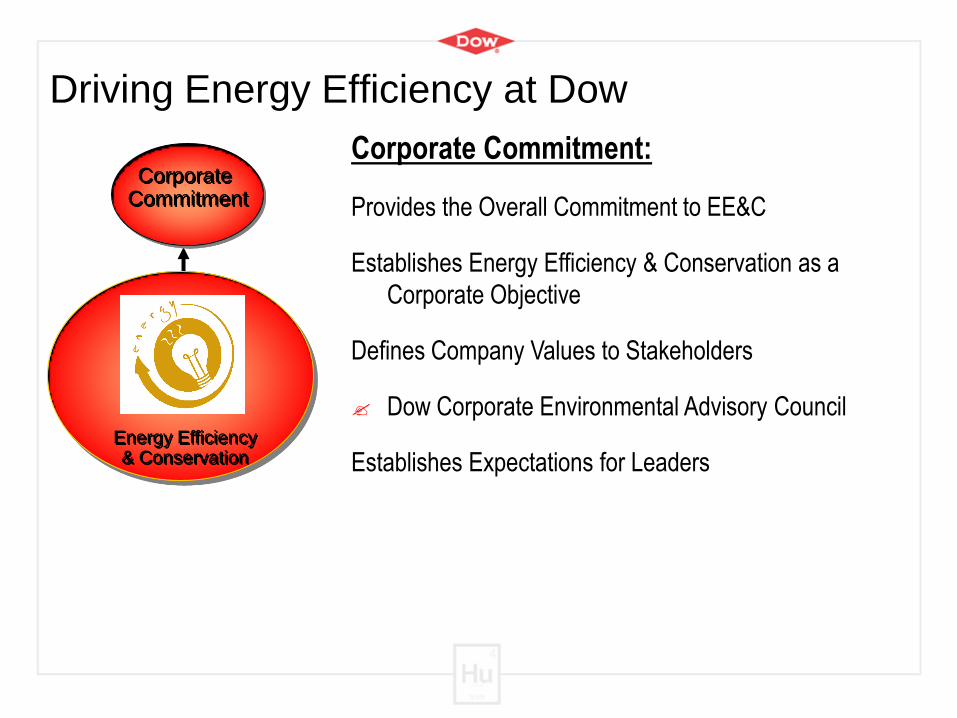
Driving Energy Efficiency at Dow
Corporate Commitment:
Provides the Overall Commitment to EE&C
Establishes Energy Efficiency & Conservation as a
Corporate Objective
Defines Company Values to Stakeholders
Dow Corporate Environmental Advisory Council
Establishes Expectations for LeadersEnergy Efficiency& Conservation
Corporate Commitment
The Dow Public Report
Enhanced Public Reporting
www.dowpublicreport.com
Public Commitment:
In 1995 Dow Committed:
•To Reduce Energy Intensity
•By 20% by the year 2005
•From Base Year 1994
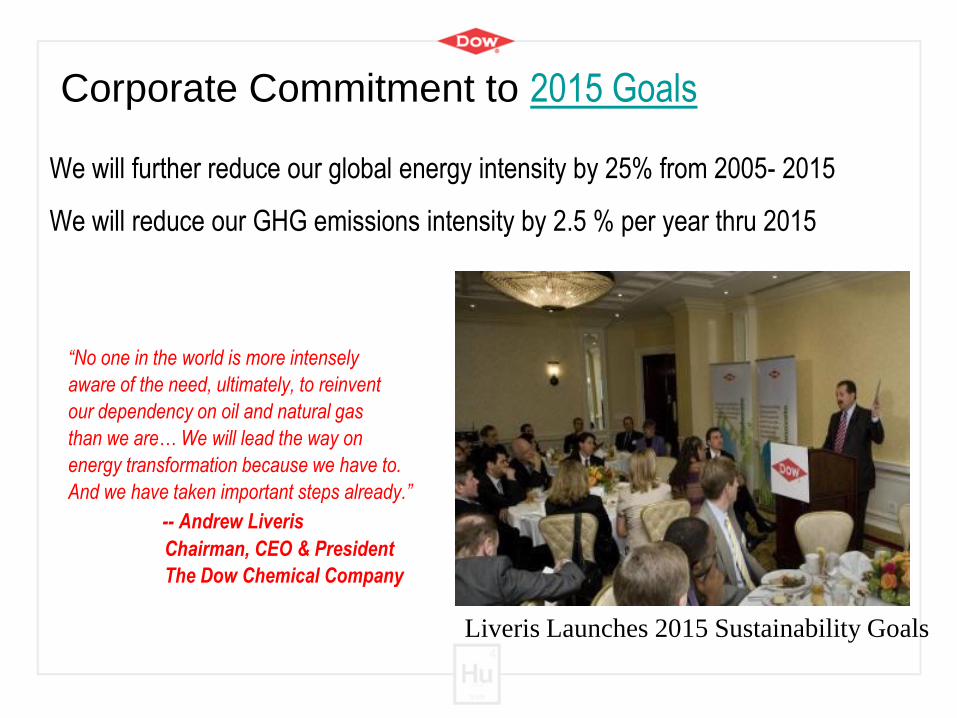
We will further reduce our global energy intensity by 25% from 2005- 2015
We will reduce our GHG emissions intensity by 2.5 % per year thru 2015
“No one in the world is more intensely
aware of the need, ultimately, to reinvent
our dependency on oil and natural gas
than we are… We will lead the way on
energy transformation because we have to.
And we have taken important steps already.”
-- Andrew Liveris
Chairman, CEO & President
The Dow Chemical Company
Corporate Commitment to 2015 Goals
Liveris Launches 2015 Sustainability Goals
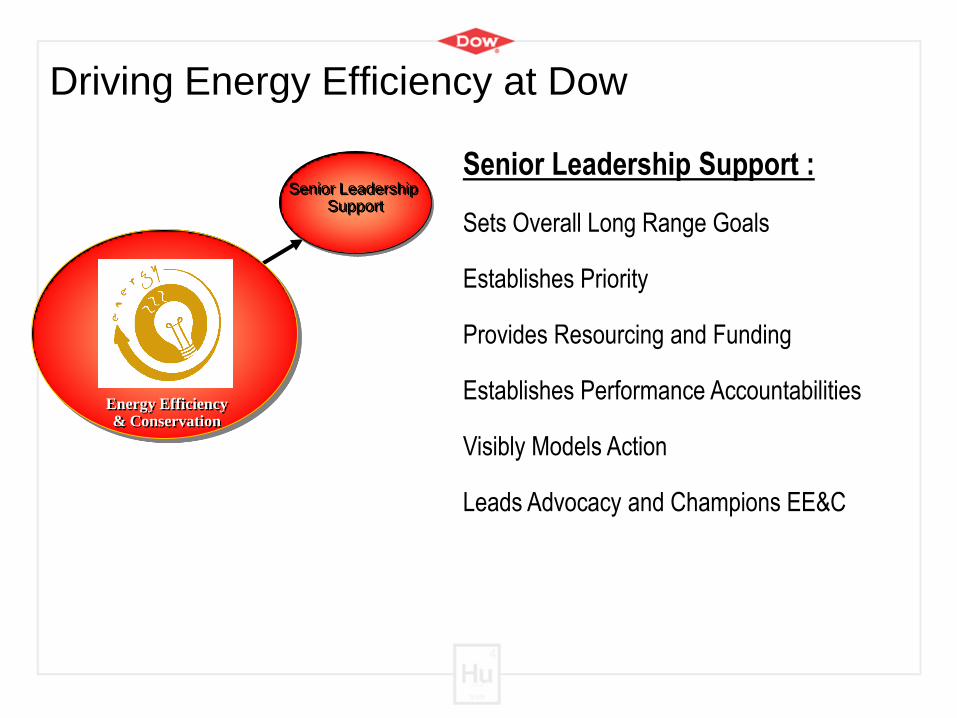
Driving Energy Efficiency at Dow
Senior Leadership Support :
Sets Overall Long Range Goals
Establishes Priority
Provides Resourcing and Funding
Establishes Performance Accountabilities
Visibly Models Action
Leads Advocacy and Champions EE&C
Energy Efficiency& Conservation
Senior LeadershipSupport
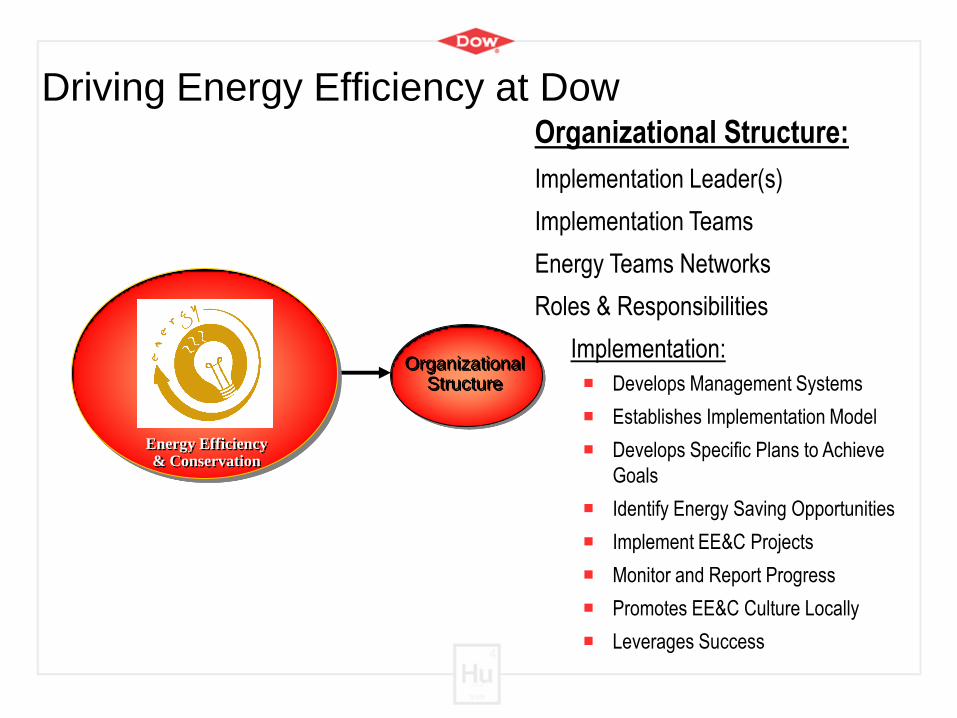
Driving Energy Efficiency at DowOrganizational Structure:
Implementation Leader(s)
Implementation Teams
Energy Teams Networks
Roles & Responsibilities
Implementation:
Develops Management Systems
Establishes Implementation Model
Develops Specific Plans to Achieve
Goals
Identify Energy Saving Opportunities
Implement EE&C Projects
Monitor and Report Progress
Promotes EE&C Culture Locally
Leverages Success
Energy Efficiency& Conservation
OrganizationalStructure
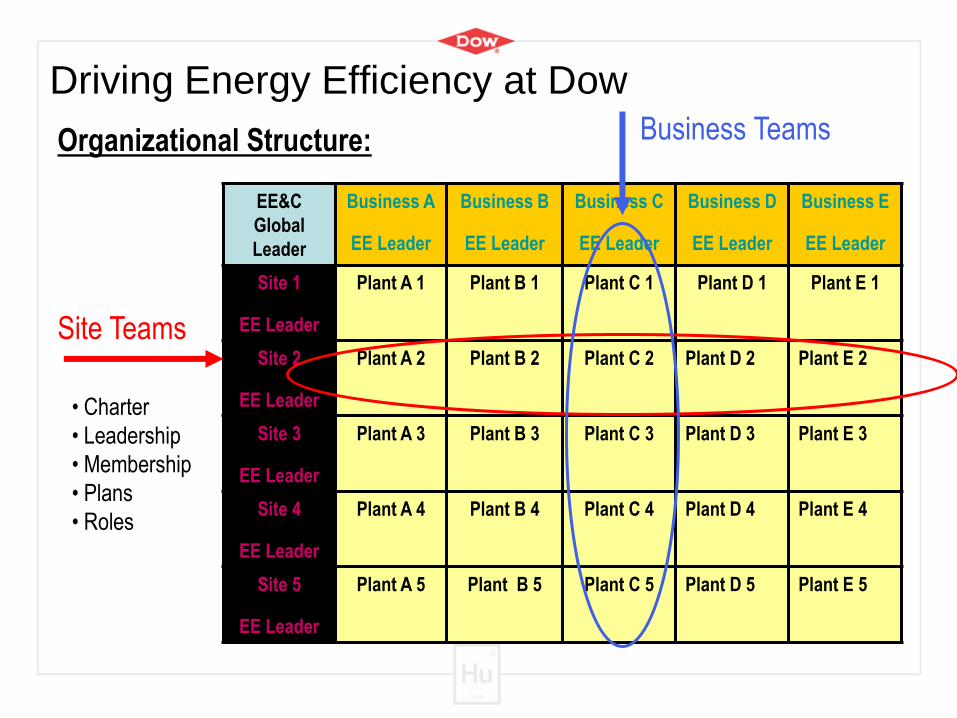
Driving Energy Efficiency at Dow
EE&C
Global
Leader
Business A
EE Leader
Business B
EE Leader
Business C
EE Leader
Business D
EE Leader
Business E
EE Leader
Site 1
EE Leader
Plant A 1 Plant B 1 Plant C 1 Plant D 1 Plant E 1
Site 2
EE Leader
Plant A 2 Plant B 2 Plant C 2 Plant D 2 Plant E 2
Site 3
EE Leader
Plant A 3 Plant B 3 Plant C 3 Plant D 3 Plant E 3
Site 4
EE Leader
Plant A 4 Plant B 4 Plant C 4 Plant D 4 Plant E 4
Site 5
EE Leader
Plant A 5 Plant B 5 Plant C 5 Plant D 5 Plant E 5
Organizational Structure:
Site Teams
Business Teams
• Charter
• Leadership
• Membership
• Plans
• Roles
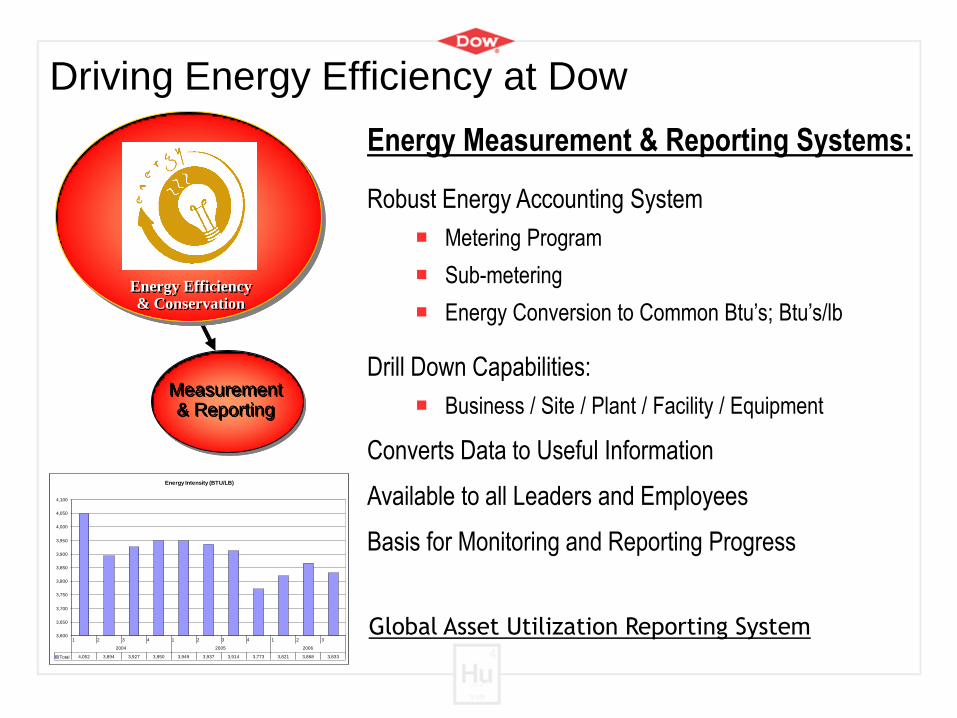
Driving Energy Efficiency at Dow
Energy Measurement & Reporting Systems:
Robust Energy Accounting System
Metering Program
Sub-metering
Energy Conversion to Common Btu’s; Btu’s/lb
Drill Down Capabilities:
Business / Site / Plant / Facility / Equipment
Converts Data to Useful Information
Available to all Leaders and Employees
Basis for Monitoring and Reporting Progress
Energy Efficiency& Conservation
Measurement& Reporting
Energy Intensity (BTU/LB)
3,600
3,650
3,700
3,750
3,800
3,850
3,900
3,950
4,000
4,050
4,100
Total 4,052 3,894 3,927 3,950 3,949 3,937 3,914 3,773 3,821 3,868 3,833
1 2 3 4 1 2 3 4 1 2 3
2004 2005 2006
Global Asset Utilization Reporting System
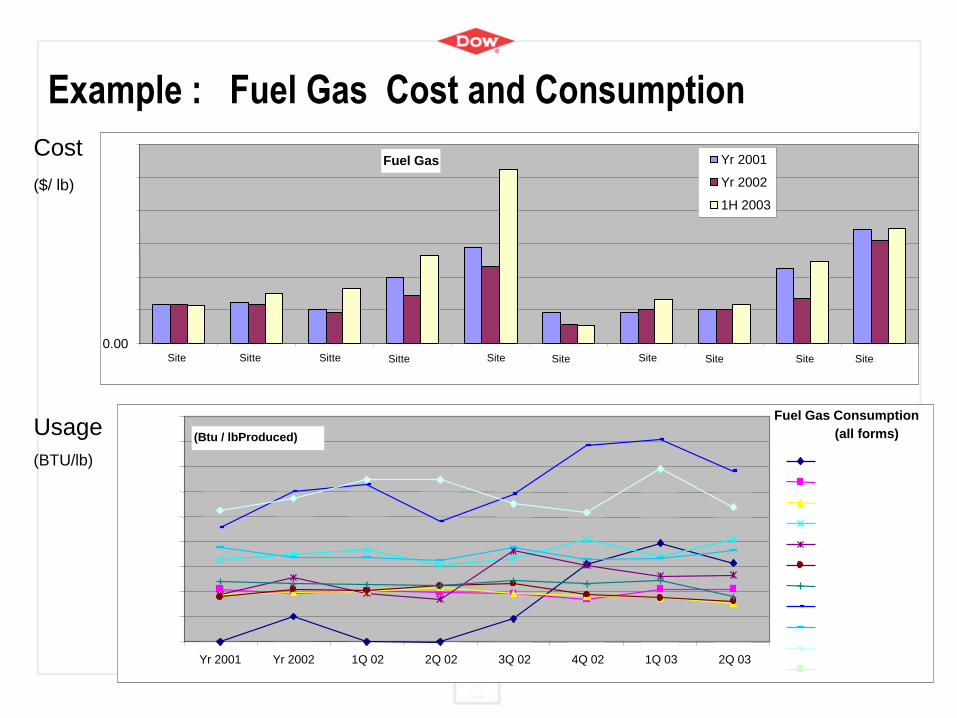
Example : Fuel Gas Cost and Consumption
Cost
($/ lb)
Usage
(BTU/lb)
Best-in-class
Fuel Gas
0.00Site Sitte Site Site Site Site Site Site
Yr 2001
Yr 2002
1H 2003
Fuel Gas Consumption
(all forms)
Yr 2001 Yr 2002 1Q 02 2Q 02 3Q 02 4Q 02 1Q 03 2Q 03
(Btu / lbProduced)
SitteSitte
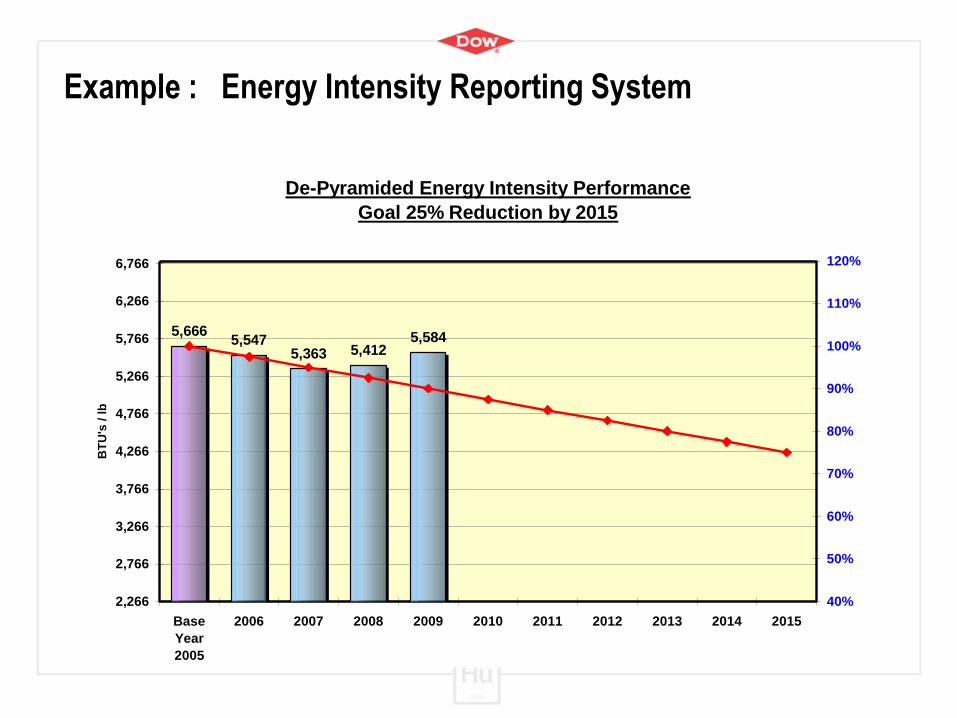
Example : Energy Intensity Reporting System
De-Pyramided Energy Intensity Performance
Goal 25% Reduction by 2015
5,6665,547
5,363 5,4125,584
2,266
2,766
3,266
3,766
4,266
4,766
5,266
5,766
6,266
6,766
Base
Year
2005
2006 2007 2008 2009 2010 2011 2012 2013 2014 2015
BT
U's
/ l
b
40%
50%
60%
70%
80%
90%
100%
110%
120%
% I
mp
rov
em
en
t
Energy Intensity (BTU's/lb) Goal Line 2015
(BTU/LB)
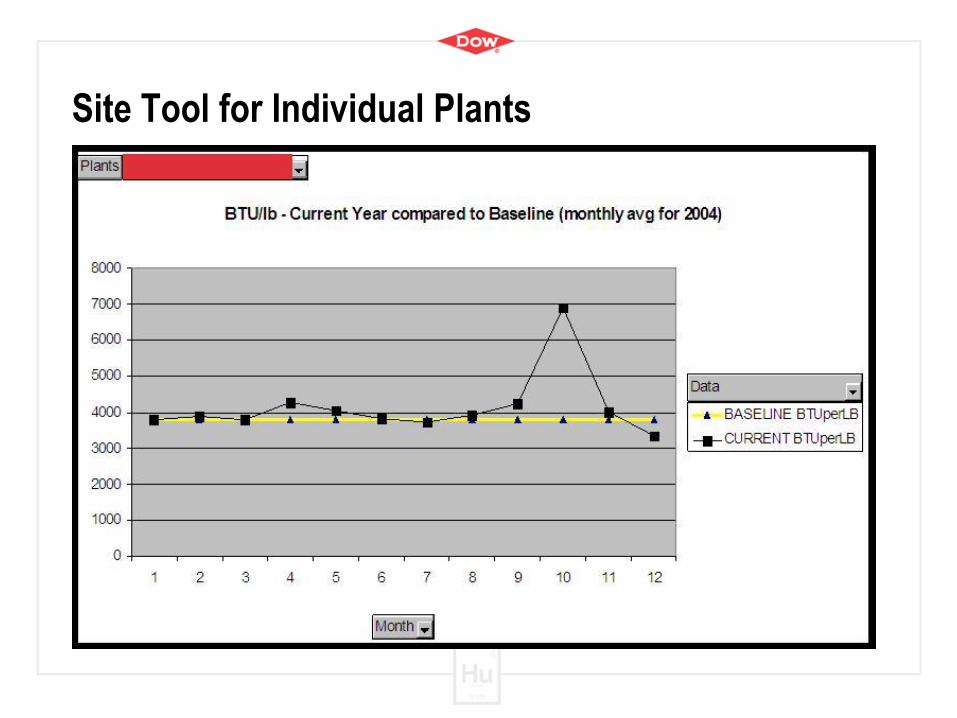
Site Tool for Individual Plants

Driving Energy Efficiency at Dow
Improvement Methodology:
To Identify Defects –
Energy Waste
Inefficiency
Sub-Optimized Systems
Enables Finding Optimum Solutions
Corrects the Defect
Establish a Control Plan to Sustain the Gains
Integrated into Capital Program
Internal and/or Externally Assisted Energy Assessments
Long Range Listing of Opportunities / Projects
Continuous Improvement Mindset
Consider Six Sigma Approach
Energy Efficiency& Conservation
Improvement Methodology
Driving Energy Efficiency at Dow
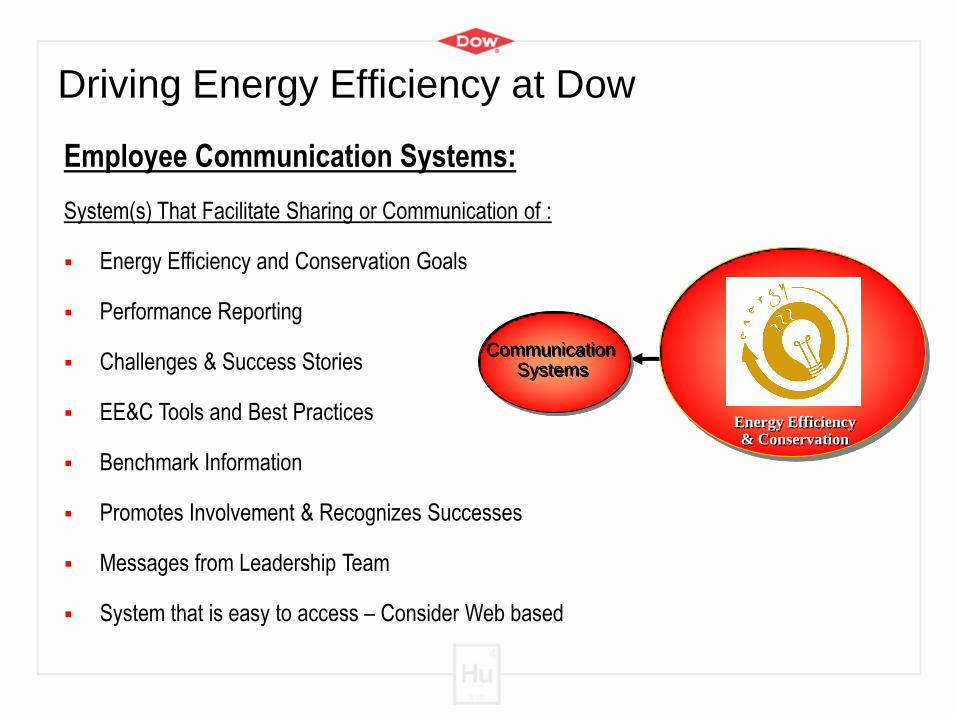
Employee Communication Systems:
System(s) That Facilitate Sharing or Communication of :
Energy Efficiency and Conservation Goals
Performance Reporting
Challenges & Success Stories
EE&C Tools and Best Practices
Benchmark Information
Promotes Involvement & Recognizes Successes
Messages from Leadership Team
System that is easy to access – Consider Web based
Energy Efficiency& Conservation
Communication Systems
Driving Energy Efficiency at Dow
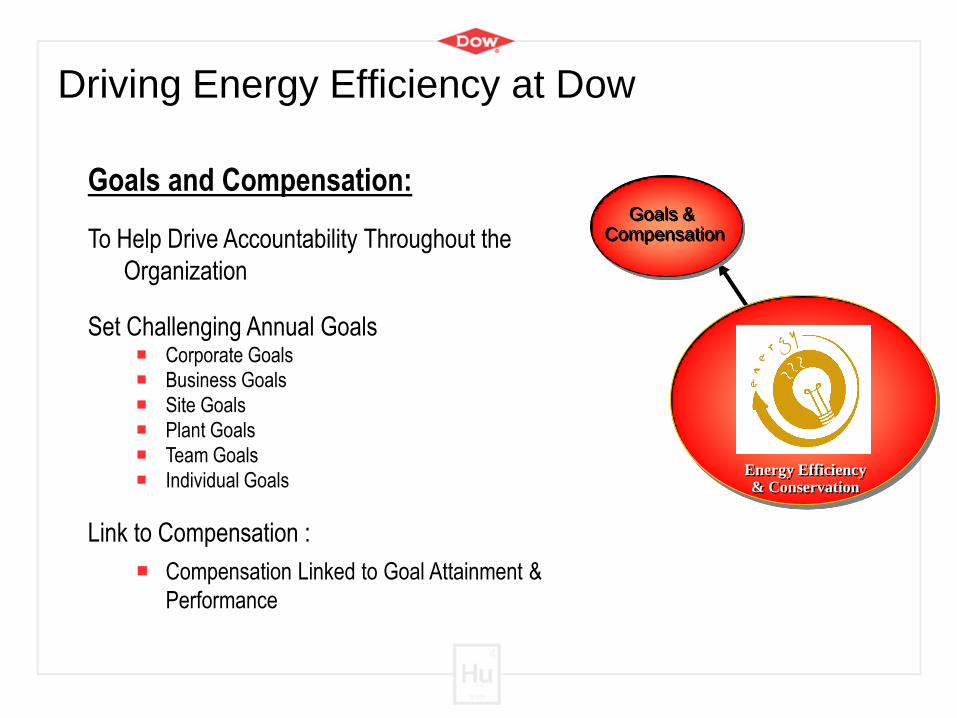
Goals and Compensation:
To Help Drive Accountability Throughout the
Organization
Set Challenging Annual Goals Corporate Goals
Business Goals
Site Goals
Plant Goals
Team Goals
Individual Goals
Link to Compensation :
Compensation Linked to Goal Attainment &
Performance
Energy Efficiency& Conservation
Goals & Compensation
Driving Energy Efficiency at Dow
Energy Efficiency& Conservation
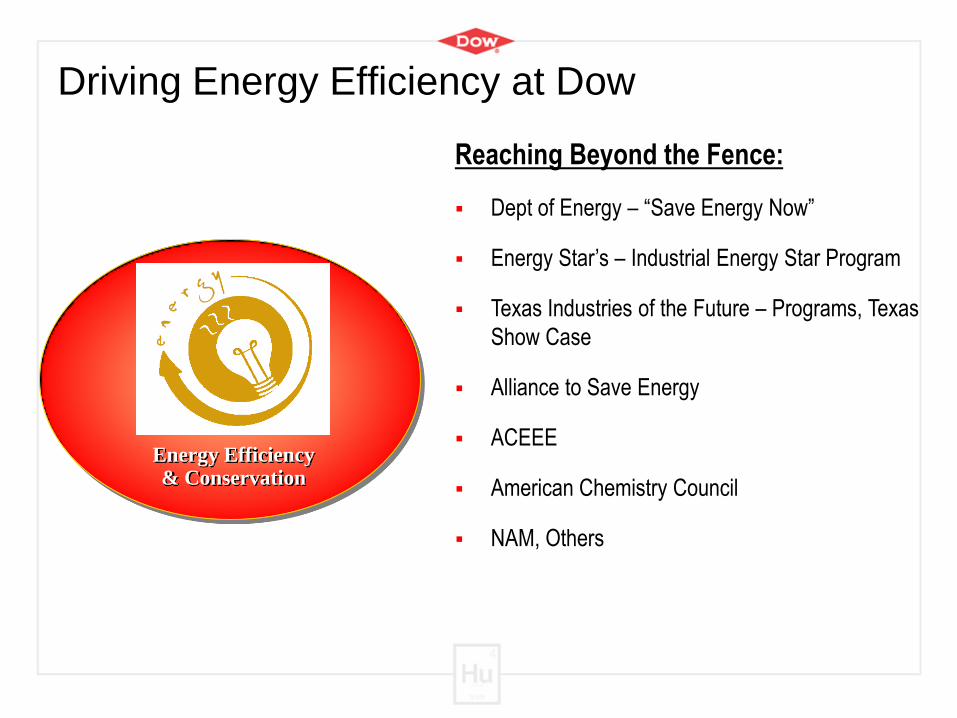
Reaching Beyond the Fence:
Dept of Energy – “Save Energy Now”
Energy Star’s – Industrial Energy Star Program
Texas Industries of the Future – Programs, Texas
Show Case
Alliance to Save Energy
ACEEE
American Chemistry Council
NAM, Others
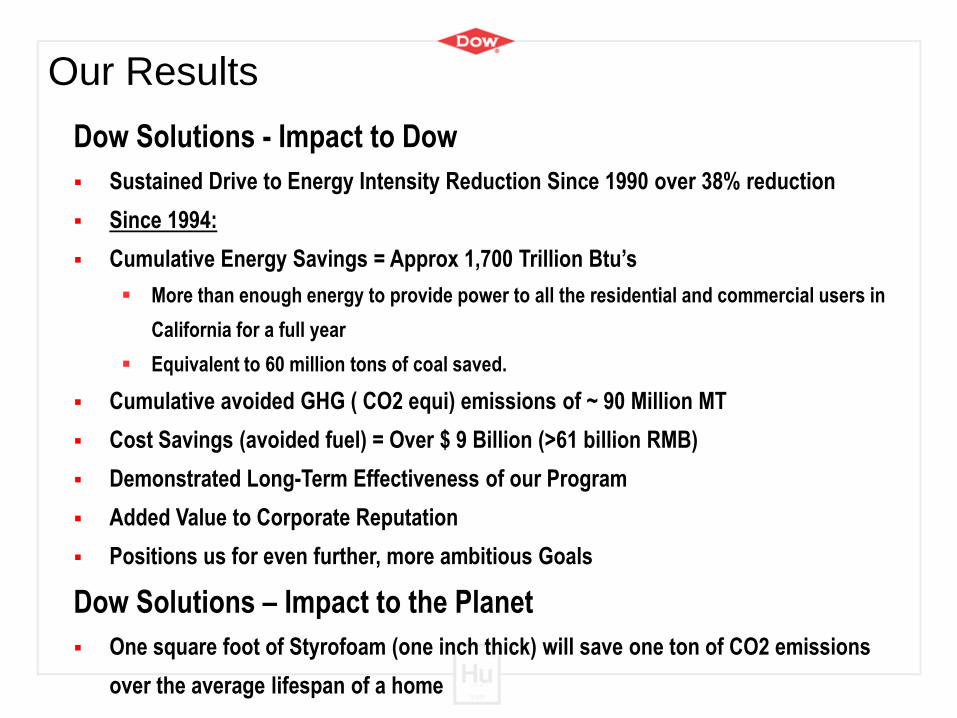
Dow Solutions - Impact to Dow
Sustained Drive to Energy Intensity Reduction Since 1990 over 38% reduction
Since 1994:
Cumulative Energy Savings = Approx 1,700 Trillion Btu’s
More than enough energy to provide power to all the residential and commercial users in
California for a full year
Equivalent to 60 million tons of coal saved.
Cumulative avoided GHG ( CO2 equi) emissions of ~ 90 Million MT
Cost Savings (avoided fuel) = Over $ 9 Billion (>61 billion RMB)
Demonstrated Long-Term Effectiveness of our Program
Added Value to Corporate Reputation
Positions us for even further, more ambitious Goals
Dow Solutions – Impact to the Planet
One square foot of Styrofoam (one inch thick) will save one ton of CO2 emissions
over the average lifespan of a home
Our Results
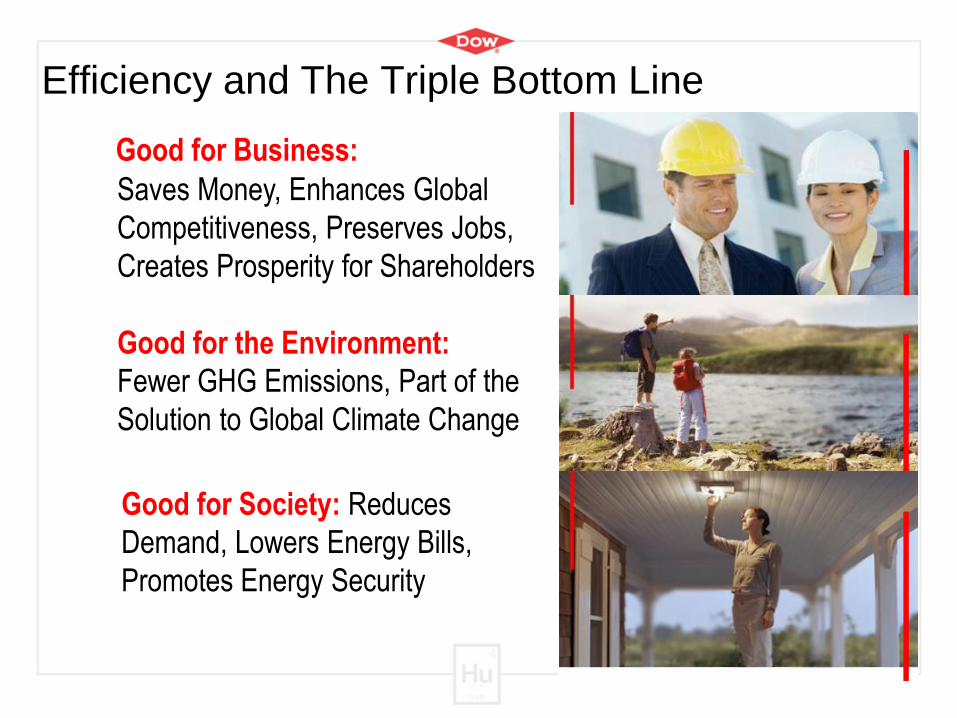
Efficiency and The Triple Bottom Line
Good for Business:
Saves Money, Enhances Global
Competitiveness, Preserves Jobs,
Creates Prosperity for Shareholders
Good for the Environment:
Fewer GHG Emissions, Part of the
Solution to Global Climate Change
Good for Society: Reduces
Demand, Lowers Energy Bills,
Promotes Energy Security
Thank You

Back up Slides
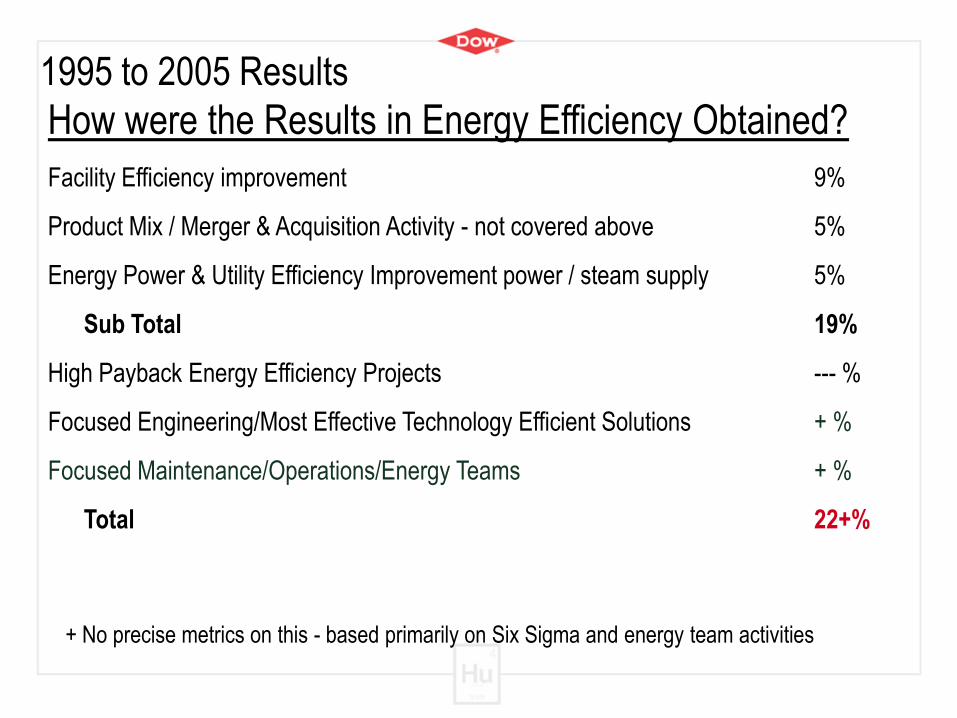
How were the Results in Energy Efficiency Obtained?
Facility Efficiency improvement 9%
Product Mix / Merger & Acquisition Activity - not covered above 5%
Energy Power & Utility Efficiency Improvement power / steam supply 5%
Sub Total 19%
High Payback Energy Efficiency Projects --- %
Focused Engineering/Most Effective Technology Efficient Solutions + %
Focused Maintenance/Operations/Energy Teams + %
Total 22+%
+ No precise metrics on this - based primarily on Six Sigma and energy team activities
1995 to 2005 Results
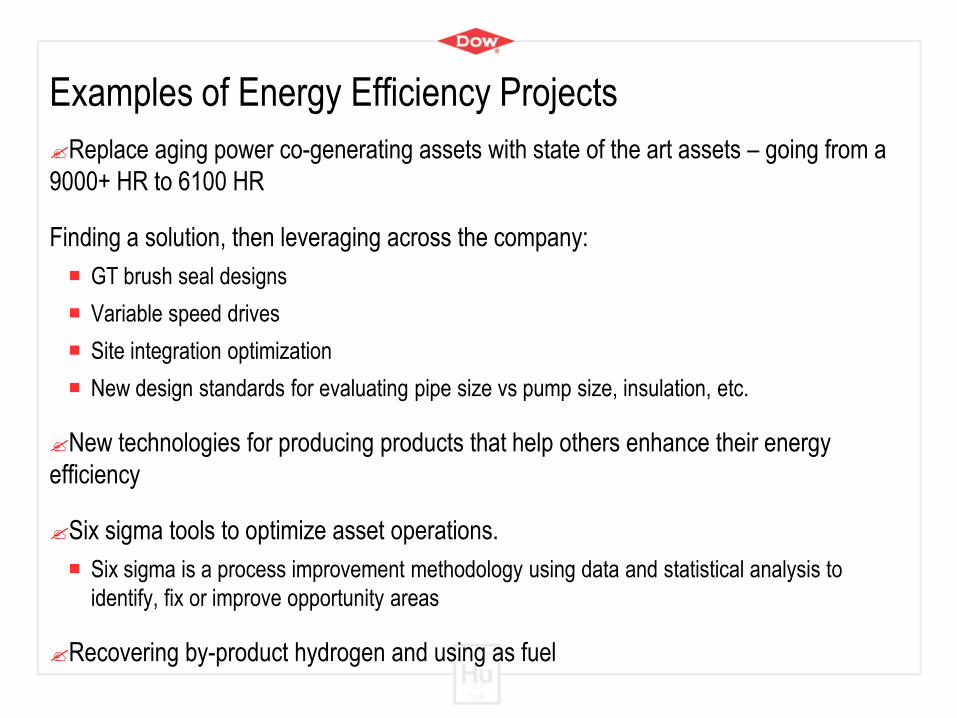
Examples of Energy Efficiency Projects
Replace aging power co-generating assets with state of the art assets – going from a
9000+ HR to 6100 HR
Finding a solution, then leveraging across the company:
GT brush seal designs
Variable speed drives
Site integration optimization
New design standards for evaluating pipe size vs pump size, insulation, etc.
New technologies for producing products that help others enhance their energy
efficiency
Six sigma tools to optimize asset operations.
Six sigma is a process improvement methodology using data and statistical analysis to
identify, fix or improve opportunity areas
Recovering by-product hydrogen and using as fuel