Embed Size (px)
Citation preview
Energy in Ireland 1990 – 2004
Oireachtas Joint Committee on Communications, Marine and Natural Resources
Energy Policy Statistical Support Unit (EPSSU)
• Collect, process and publish energy statistics • Conduct statistical and economic analyses of
energy services and sustainable energy options
• Contribute to the development and promulgation of appropriate sustainability indicators
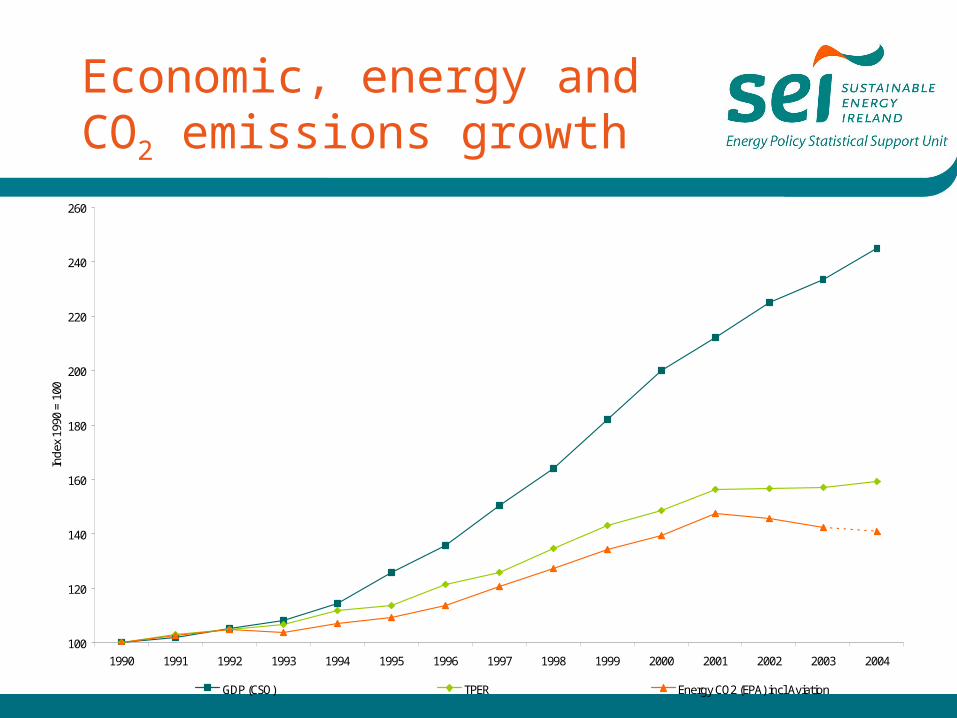
Economic, energy and CO2 emissions growth
100
120
140
160
180
200
220
240
260
1990 1991 1992 1993 1994 1995 1996 1997 1998 1999 2000 2001 2002 2003 2004
Inde
x 19
90 =
100
GDP (CSO) TPER Energy CO2 (EPA) incl Aviation
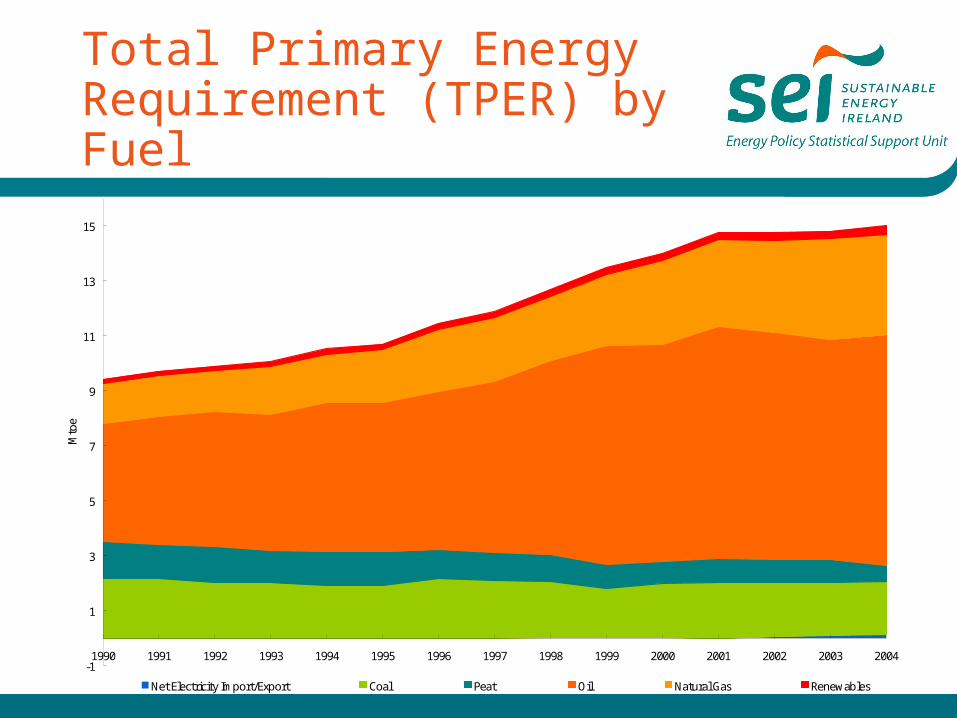
Total Primary Energy Requirement (TPER) by Fuel
-1
1
3
5
7
9
11
13
15
1990 1991 1992 1993 1994 1995 1996 1997 1998 1999 2000 2001 2002 2003 2004
Mto
e
Net Electricity Import/Export Coal Peat Oil Natural Gas Renewables
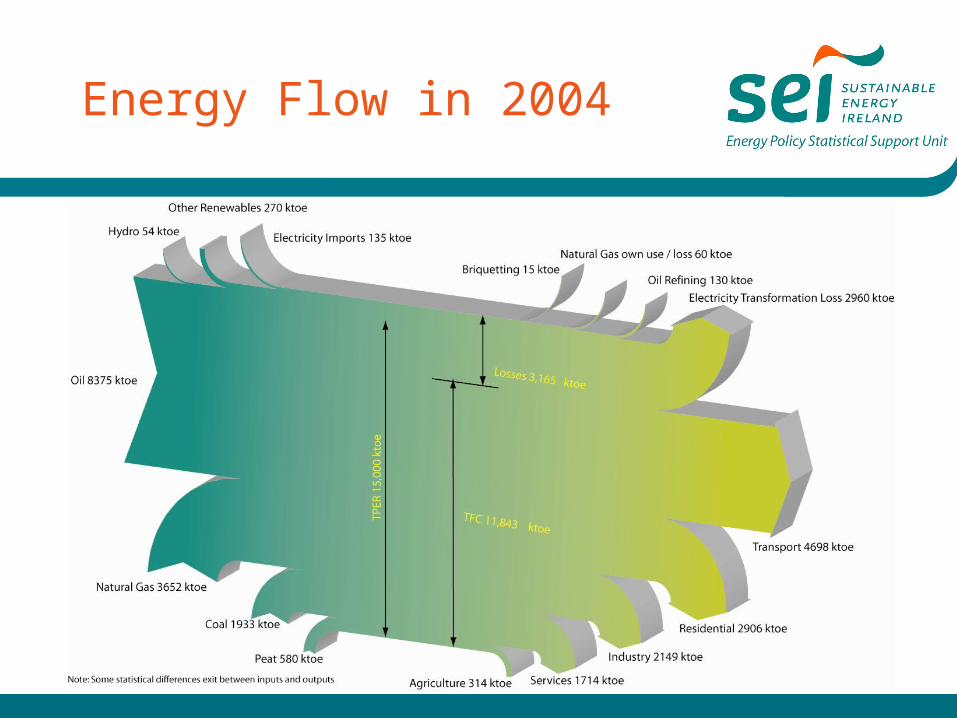
Energy Flow in 2004
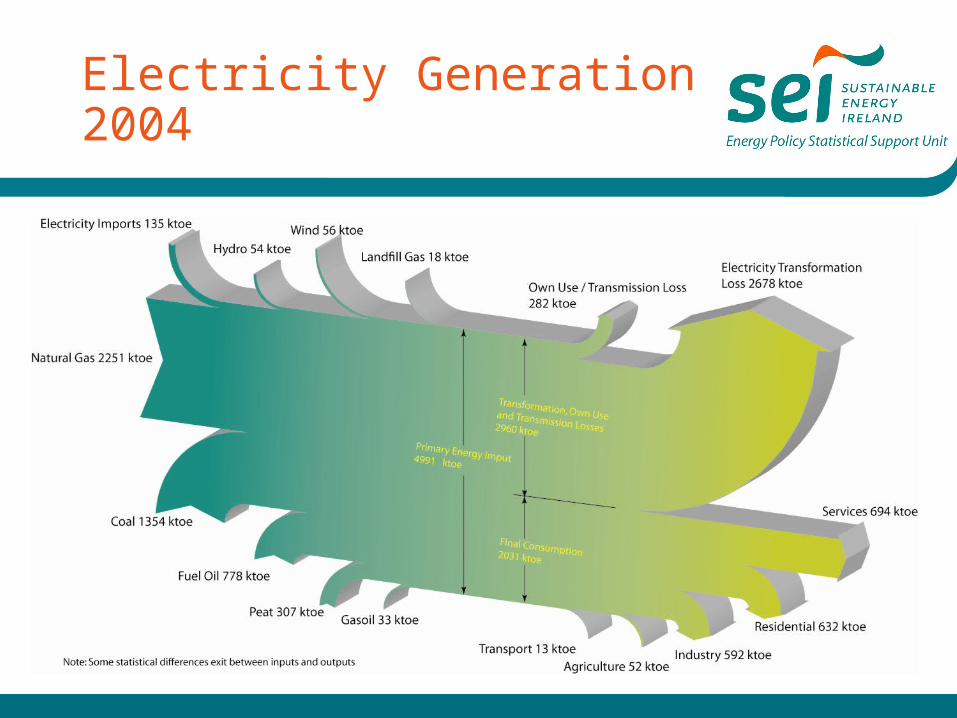
Electricity Generation 2004
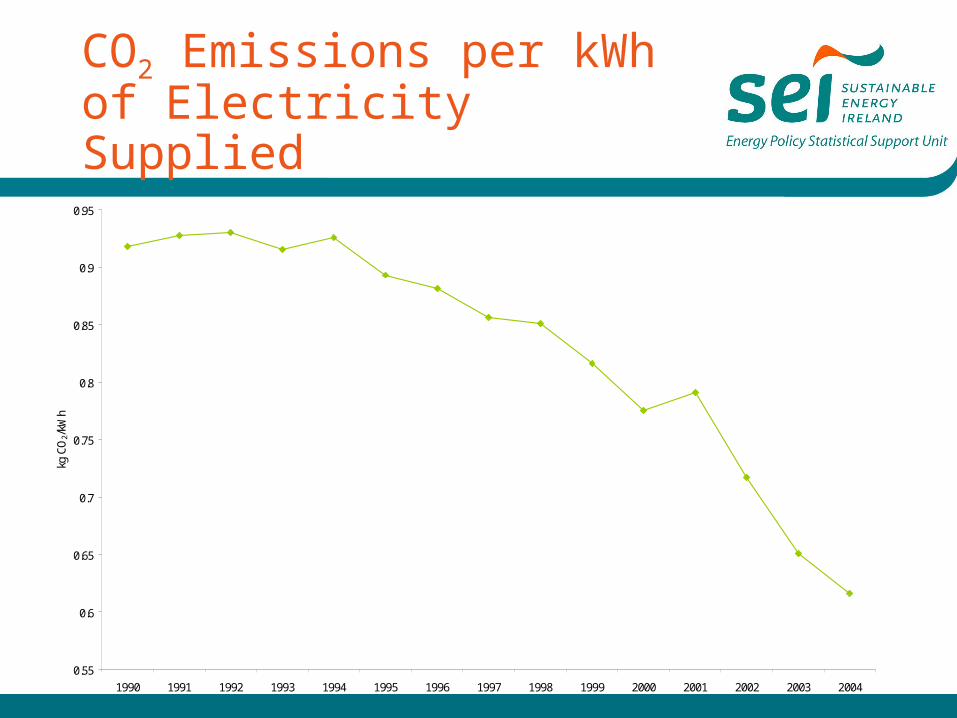
CO2 Emissions per kWh of Electricity Supplied
0.55
0.6
0.65
0.7
0.75
0.8
0.85
0.9
0.95
1990 1991 1992 1993 1994 1995 1996 1997 1998 1999 2000 2001 2002 2003 2004
kg C
O2/
kWh
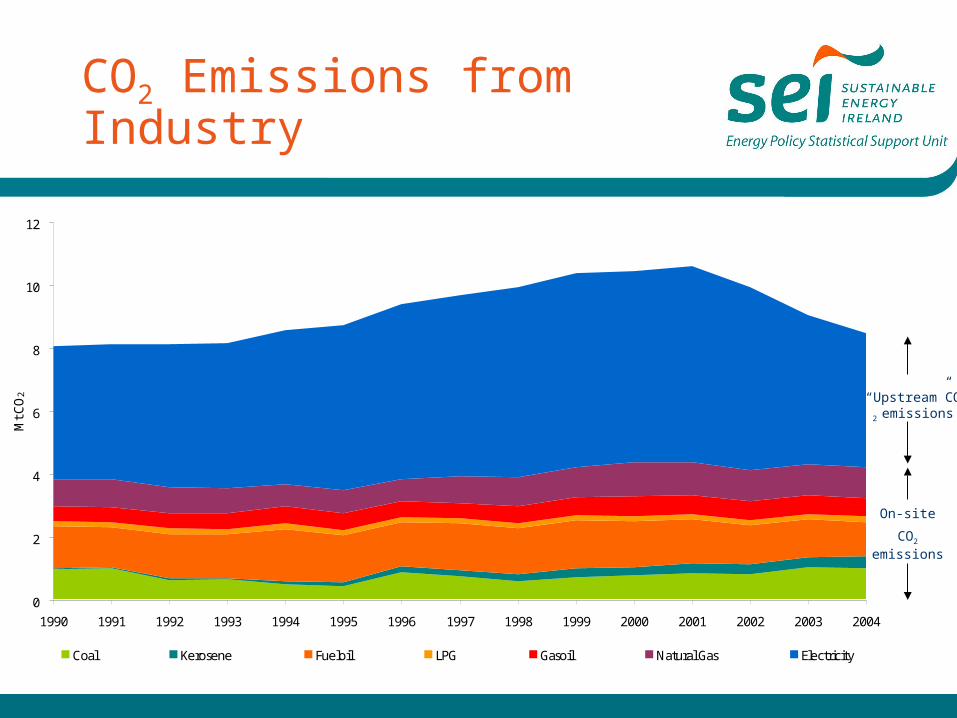
CO2 Emissions from Industry
“Upstream”CO2
emissions
On-site
CO2
emissions
0
2
4
6
8
10
12
1990 1991 1992 1993 1994 1995 1996 1997 1998 1999 2000 2001 2002 2003 2004
Mt C
O2
Coal Kerosene Fueloil LPG Gasoil Natural Gas Electricity
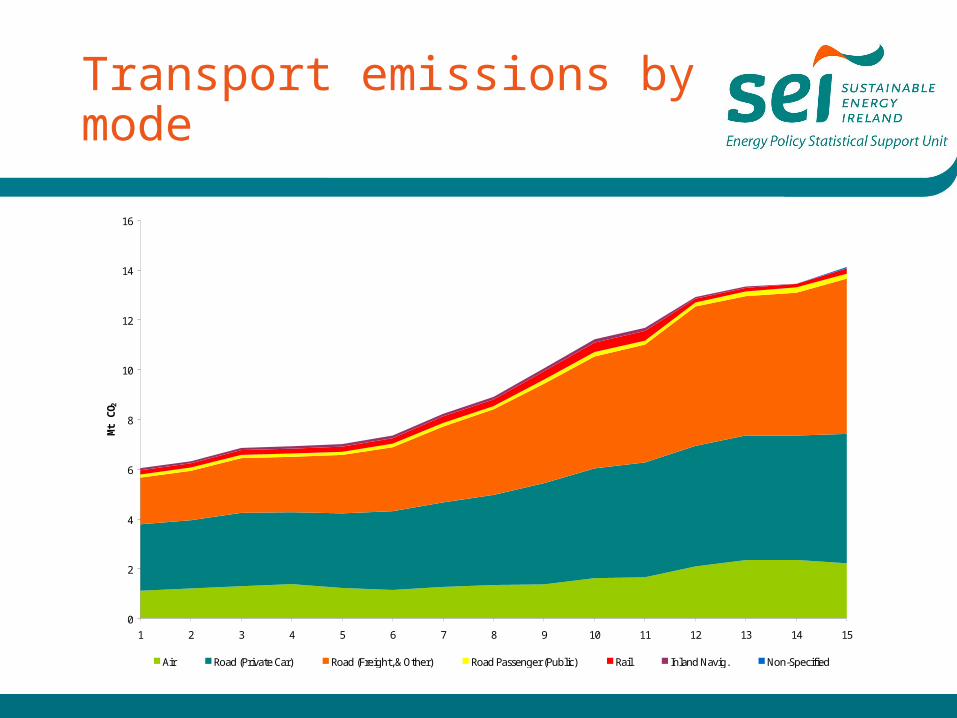
Transport emissions by mode
0
2
4
6
8
10
12
14
16
1 2 3 4 5 6 7 8 9 10 11 12 13 14 15
Mt
CO 2
Air Road (Private Car) Road (Freight, & Other) Road Passenger (Public) Rail Inland Navig. Non-Specified
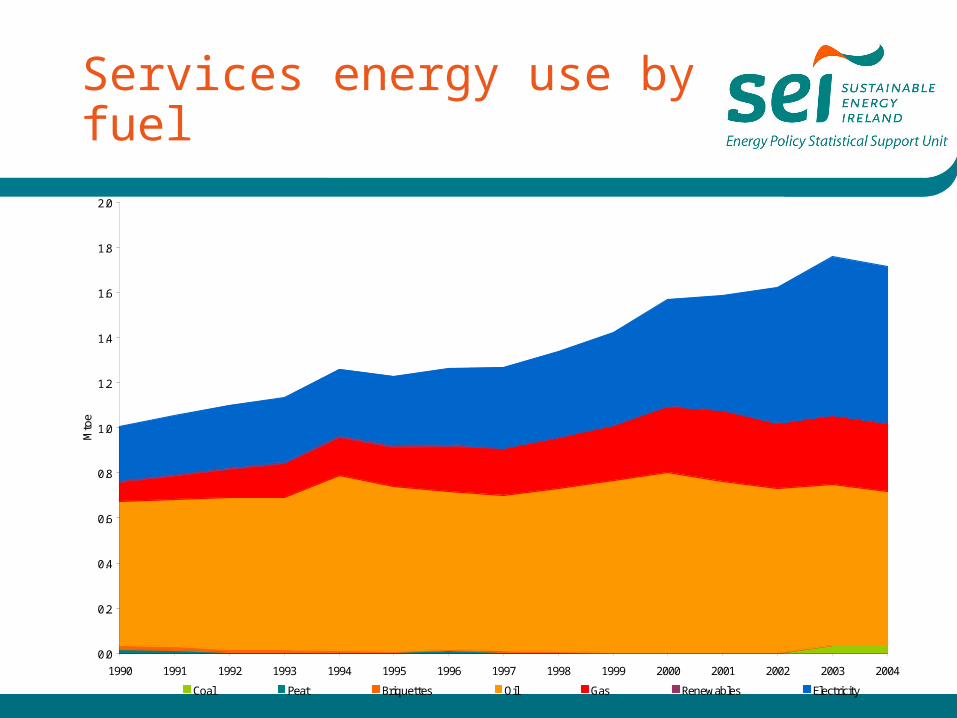
Services energy use by fuel
0.0
0.2
0.4
0.6
0.8
1.0
1.2
1.4
1.6
1.8
2.0
1990 1991 1992 1993 1994 1995 1996 1997 1998 1999 2000 2001 2002 2003 2004
Mto
e
Coal Peat Briquettes Oil Gas Renewables Electricity
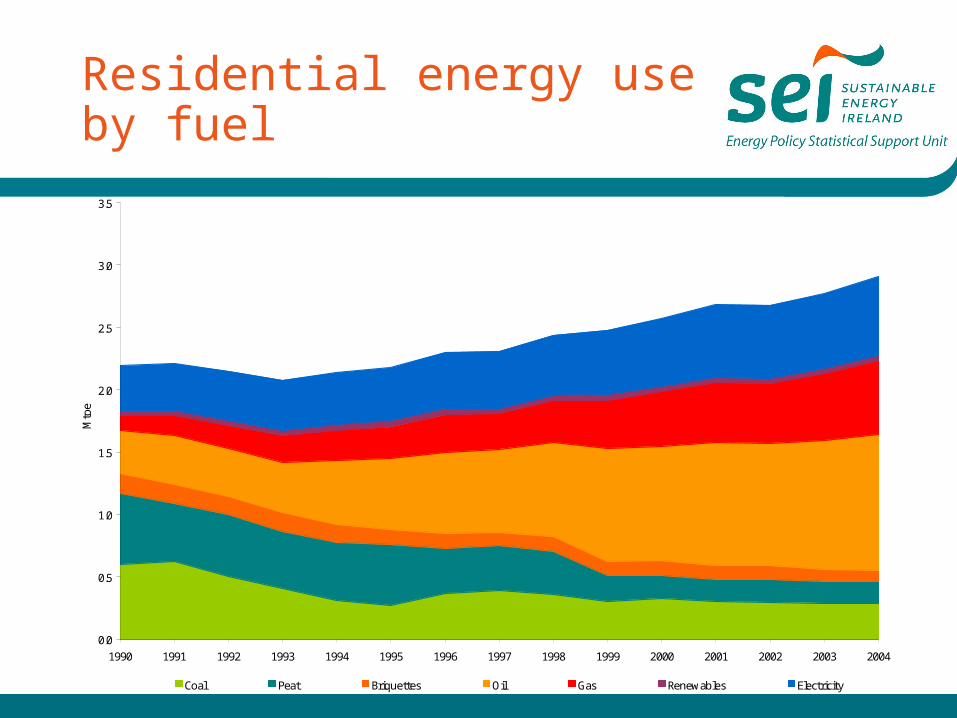
Residential energy use by fuel
0.0
0.5
1.0
1.5
2.0
2.5
3.0
3.5
1990 1991 1992 1993 1994 1995 1996 1997 1998 1999 2000 2001 2002 2003 2004
Mto
e
Coal Peat Briquettes Oil Gas Renewables Electricity
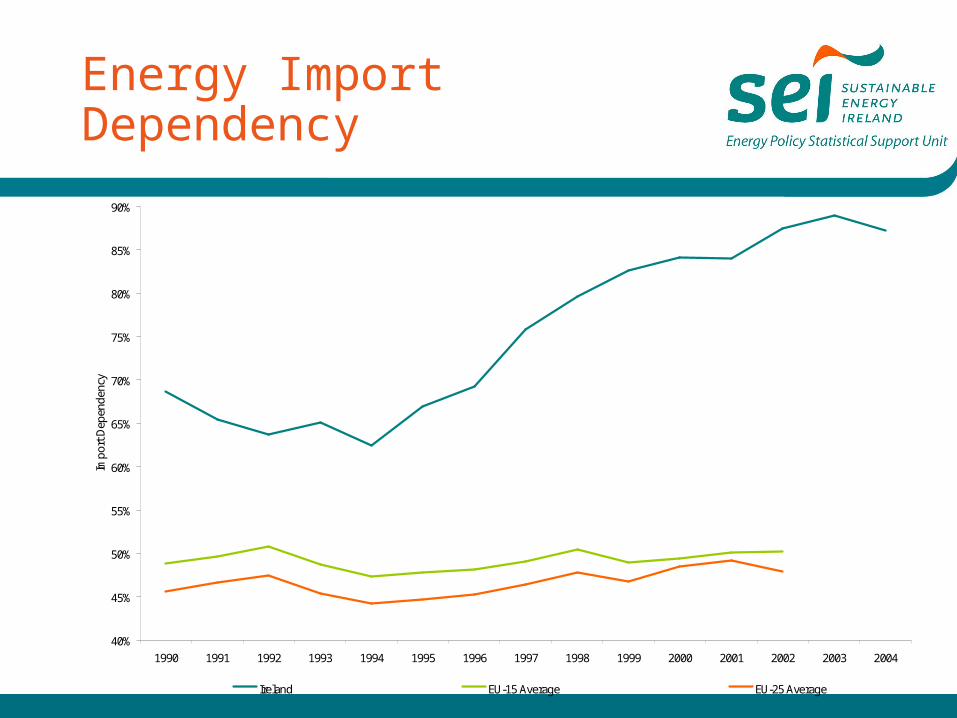
Energy Import Dependency
40%
45%
50%
55%
60%
65%
70%
75%
80%
85%
90%
1990 1991 1992 1993 1994 1995 1996 1997 1998 1999 2000 2001 2002 2003 2004
Impo
rt D
epen
denc
y
Ireland EU-15 Average EU-25 Average
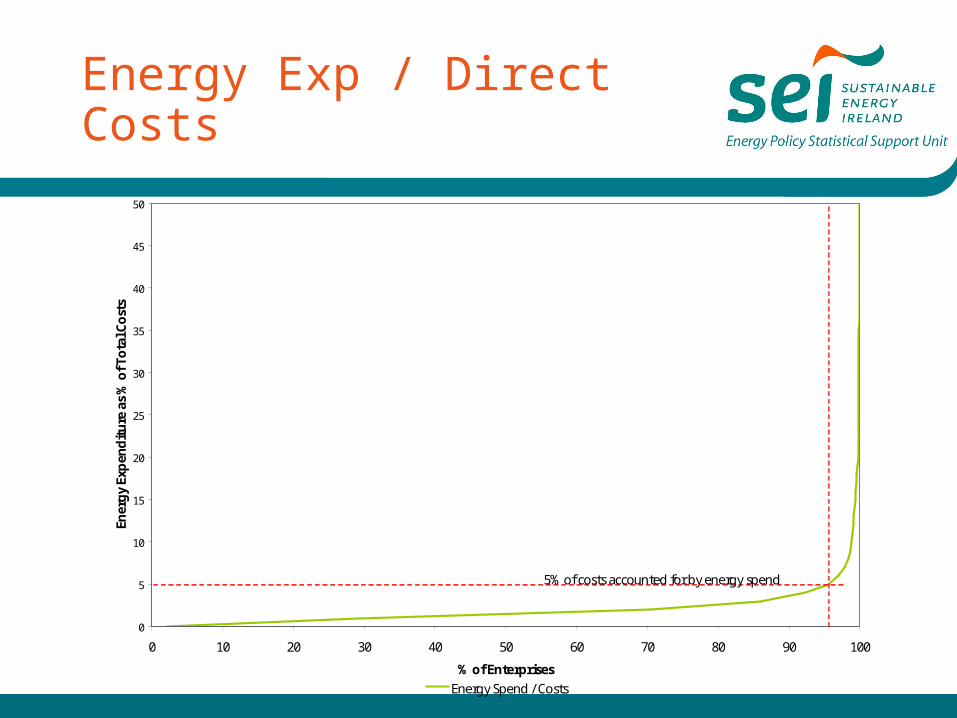
Energy Exp / Direct Costs
0
5
10
15
20
25
30
35
40
45
50
0 10 20 30 40 50 60 70 80 90 100
% of Enterprises
Ener
gy
Expen
ditur
e as
% o
f Tota
l Cost
s
Energy Spend / Costs
5% of costs accounted for by energy spend
Enterprises which have an energy expenditure to total costs ratio of less than 5% account for;(1) 97.2% of industrial gross value added (1)
(2)
(3)
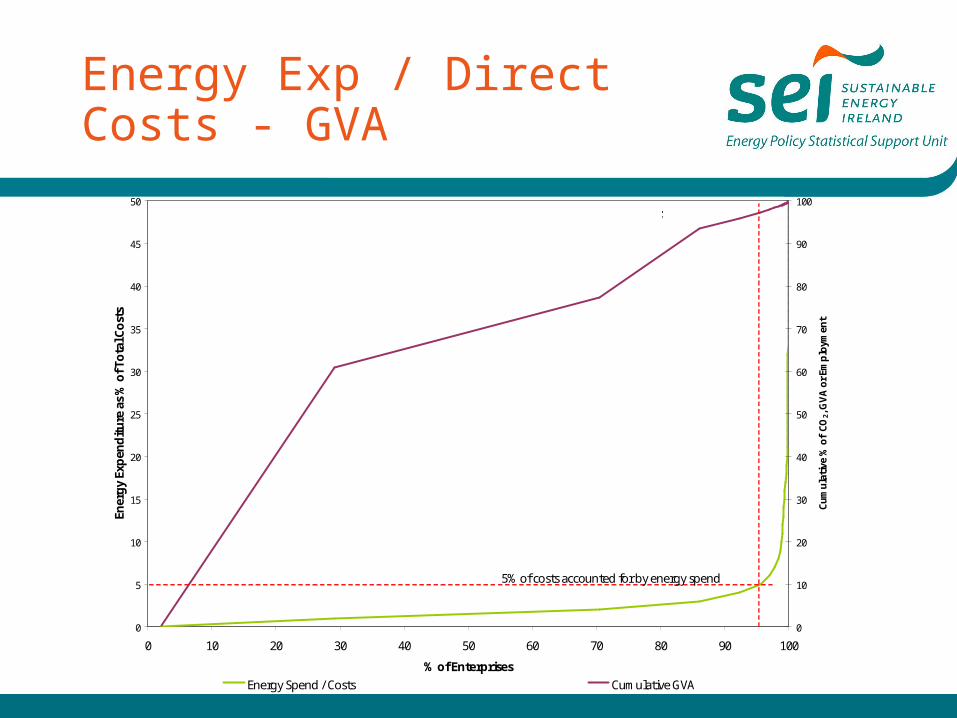
Energy Exp / Direct Costs - GVA
0
5
10
15
20
25
30
35
40
45
50
0 10 20 30 40 50 60 70 80 90 100
% of Enterprises
Ener
gy
Expen
ditur
e as
% o
f Tot
al C
osts
0
10
20
30
40
50
60
70
80
90
100
Cum
ulat
ive
% o
f CO
2, G
VA o
r Em
plo
ymen
t
Energy Spend / Costs Cumulative GVA
5% of costs accounted for by energy spend
Enterprises which have an energy expenditure to total costs ratio of less than 5% account for;(1) 97.2% of industrial gross value added
(3) 95.6% of enterprises
(1)
(2)
(3)
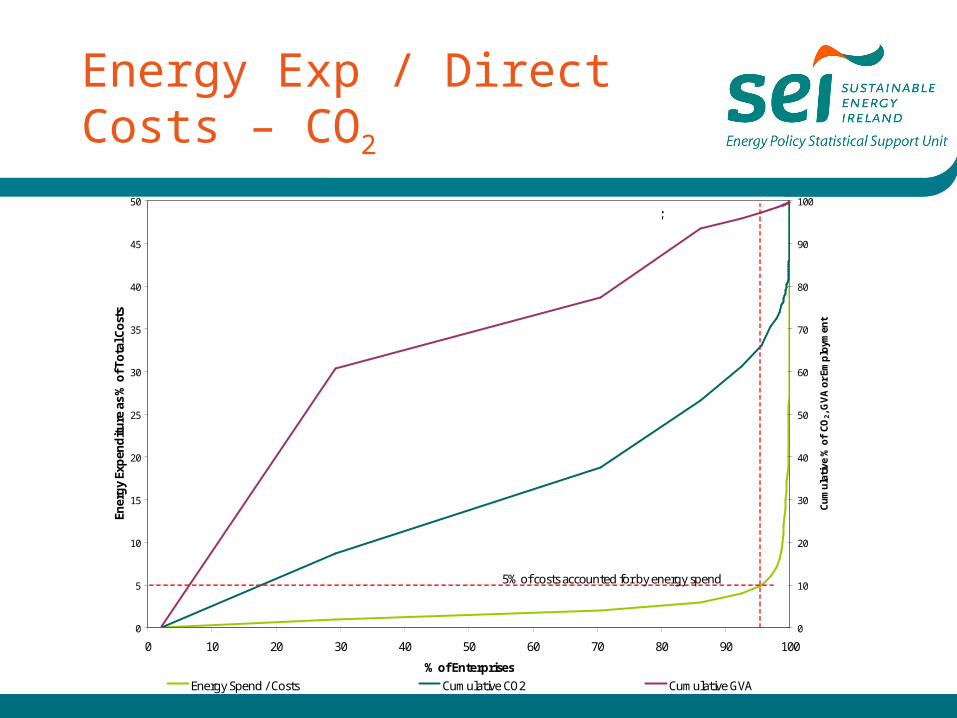
Energy Exp / Direct Costs – CO2
0
5
10
15
20
25
30
35
40
45
50
0 10 20 30 40 50 60 70 80 90 100
% of Enterprises
Ener
gy
Expen
ditur
e as
% o
f Tot
al C
osts
0
10
20
30
40
50
60
70
80
90
100
Cum
ulat
ive
% o
f CO
2, G
VA o
r Em
plo
ymen
t
Energy Spend / Costs Cumulative CO2 Cumulative GVA
5% of costs accounted for by energy spend
Enterprises which have an energy expenditure to total costs ratio of less than 5% account for;(1) 97.2% of industrial gross value added(2) 66.2% of industrial energy-related CO2
(3) 95.6% of enterprises
(1)
(2)
(3)
Sensitivity to price changes w.r.t. costs
• 96% of industrial GVA (€34 billion) in 2001 was produced by enterprises spending less than 4% of their direct costs on energy. These account for 61% of enegy-related CO2 and 96% of industrial employment
• 211 enterprises (4%) have energy costs in excess of 5% of their direct costs (34% of CO2 emissions).
• 10 enterprises with energy bill greater than 20% of costs, account for 15% of energy expenditure, 18% of energy-related emissions, 0.5% of GVA and 0.5% of employment.
• 97% of industrial GVA was generated by enterprises for which fuel costs represented no more than 2% of direct costs. A total 14 firms have a fuel to direct cost ratio of more than 10%. These 14 accounted for 34% of fuel related CO2 emissions.
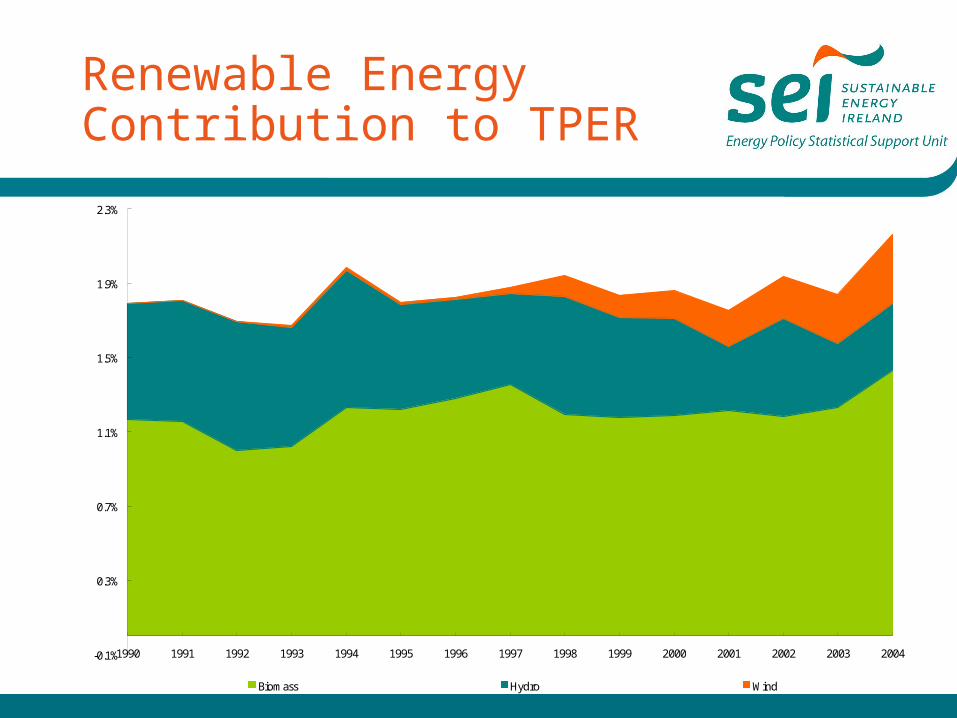
Renewable Energy Contribution to TPER
-0.1%
0.3%
0.7%
1.1%
1.5%
1.9%
2.3%
1990 1991 1992 1993 1994 1995 1996 1997 1998 1999 2000 2001 2002 2003 2004
Biomass Hydro Wind
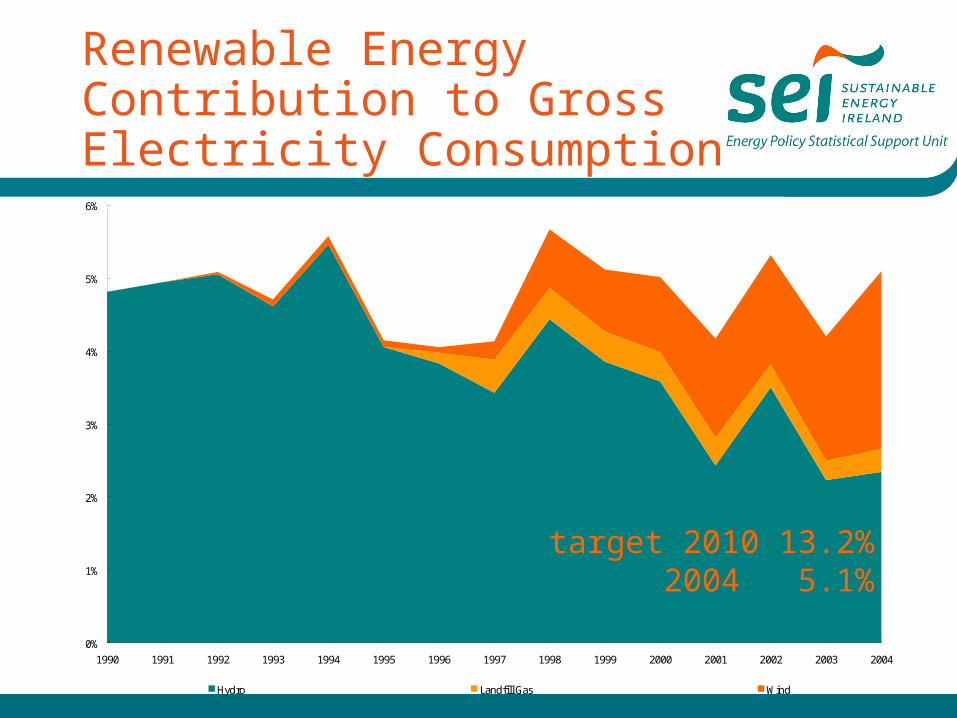
Renewable Energy Contribution to Gross Electricity Consumption
0%
1%
2%
3%
4%
5%
6%
1990 1991 1992 1993 1994 1995 1996 1997 1998 1999 2000 2001 2002 2003 2004
Hydro Landfill Gas Wind
target 2010 13.2%2004 5.1%
Conclusion
• Energy growth decoupling from economic growth – efficiency (transport being the exception)
• CO2 emissions decoupling from energy growth – fuel switching
• Transport and Services the fastest growing sectors
• Import dependency at 87%
• The energy bill of most manufacturing companies represents a very small proportion of their cost base.
Energy in Ireland 1990 – 2004
Oireachtas Joint Committee on Communications, Marine and Natural Resources
Thank you.