Embed Size (px)
Citation preview

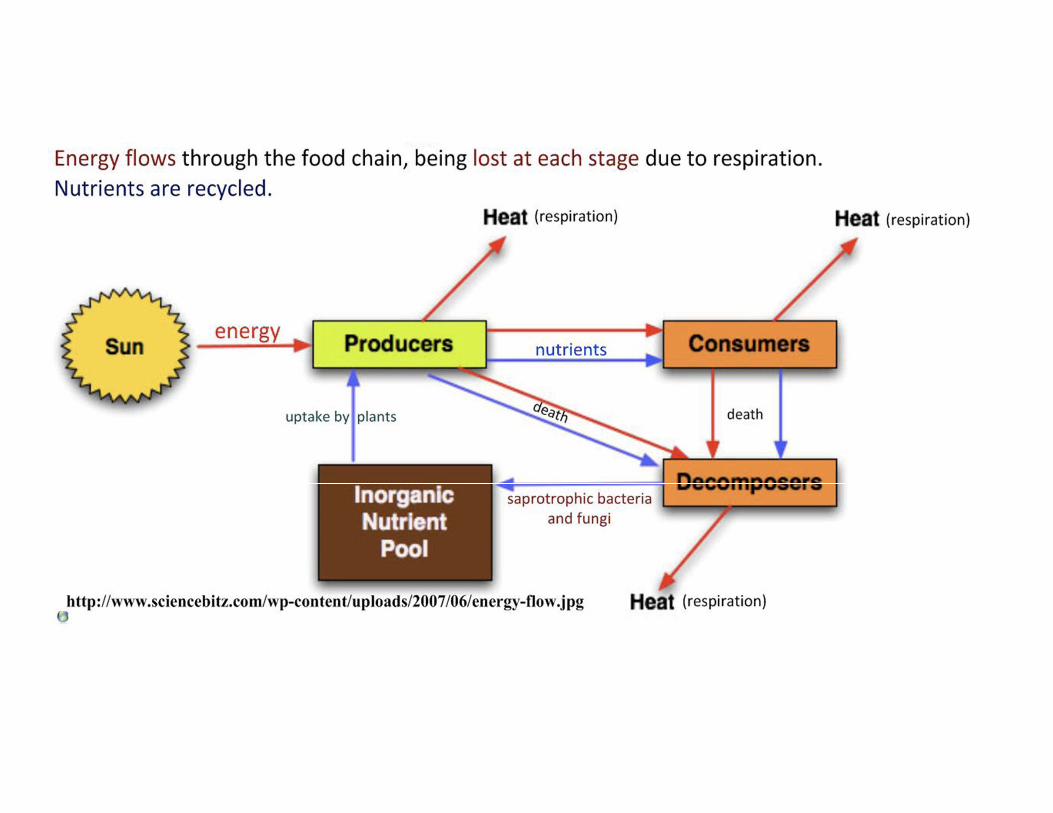
Energy Flow


Food web • Diagram that shows how food chains
are linked together in a complex feeding relationship
• The food web has a number of advantages over a food chains including:– More than one producer supporting a
community – A single producer being a food source
for a number of primary consumers – A consumer may have a number of
different food sources on the same or different trophic levels
– A consumer can be an omnivore, feeding as a primary consumer and as a consumer at higher trophic levels

Matter is recycled• Decomposition: process by which organic
matter is broken down into simpler forms. – Allows for the formation of soil, the recycling of
nutrients stored in the organic materials
• Saprotrophs: secrete digestive enzymes into dead organism, which hydrolyze biological molecules of which the dead organism is composed
• Saprotrophs are essential in the flow of nutrients through ecosystem, which would otherwise accumulate in debris

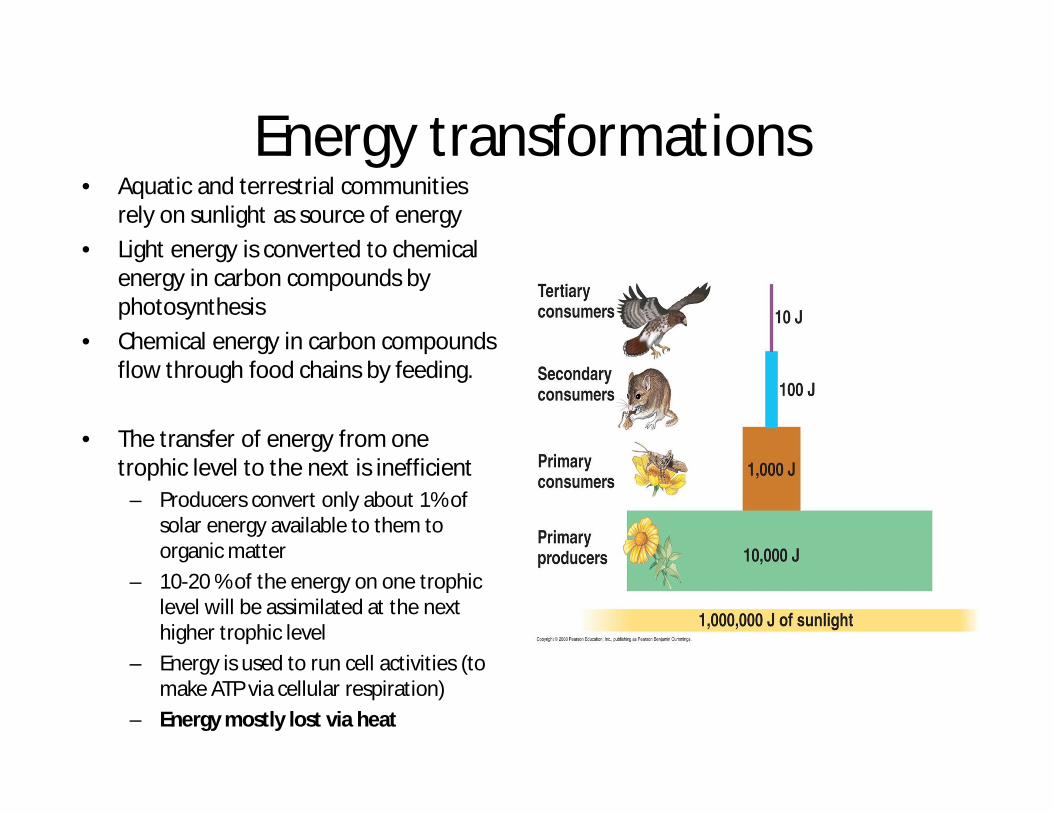
Energy transformations• Aquatic and terrestrial communities
rely on sunlight as source of energy• Light energy is converted to chemical
energy in carbon compounds by photosynthesis
• Chemical energy in carbon compounds flow through food chains by feeding.
• The transfer of energy from one trophic level to the next is inefficient– Producers convert only about 1% of
solar energy available to them to organic matter
– 10-20 % of the energy on one trophic level will be assimilated at the next higher trophic level
– Energy is used to run cell activities (to make ATP via cellular respiration)
– Energy mostly lost via heat
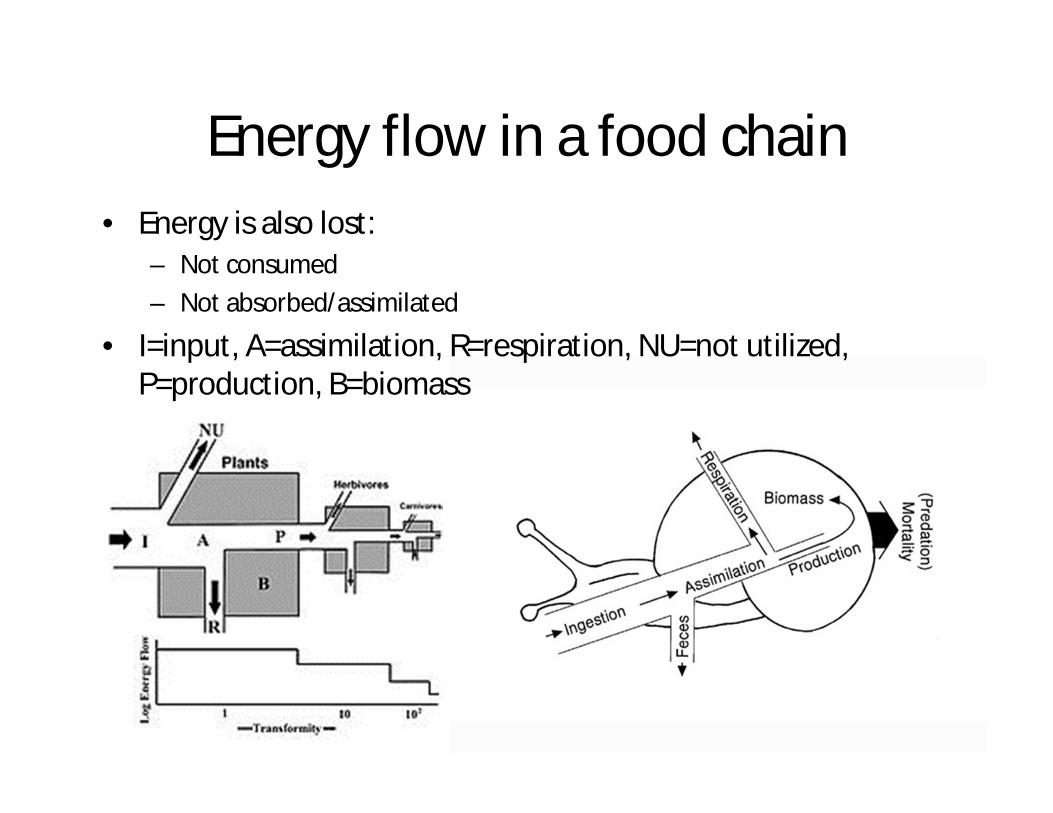
• Energy is also lost: – Not consumed– Not absorbed/assimilated
• I=input, A=assimilation, R=respiration, NU=not utilized, P=production, B=biomass
Energy flow in a food chain

Pyramids of energy• Units = energy/ area/unit time e.g. kJ m-2 yr-1
• Pyramid should be stepped, not triangular• Labels: producer, first consumer, second consumer, etc.

Construct a pyramid of energy, given appropriate information
• Trophic level and energy flow e.g. freshwater spring in Florida, USA.
• Each trophic level is plotted with equal thickness on the vertical scale, but horizontal scale indicates the size of each bar.
• Original data are halved for the purposes of plotting

• flipped and the two sides stuck together as follows
Construct a pyramid of energy, given appropriate information

Today
• Data base question: A simple food web (p. 219 of Ecology notes)
• Finish bottle biology

Energy Flow


Gross production vs. Net production
• Energy is not entirely lost; organisms do trap some of the energy in the form of biomass
• Gross production (GP) = total amount of energy trapped in organic matter produced by plants in an ecosystem
• Net production (NP) = GP –energy lost through respiration – Amount of biomass that is
available to the next trophic level

Biomass • Biomass = total dry mass of
organic matter in organisms of ecosystems – Organic matter = carbon
compounds such as carbohydrates, lipids and proteins
– Most matter usually includes water (not organic) so the matter has to be dried
– Units = energy/area/unit time e.g. g m-2 yr-1

Feed conversion ratio (FCR)• Measure of the efficiency of an
animal’s ability to convert feed mass into increased body mass
• Mass of food eaten / body of mass gain
• 8 kg of food / 1 kg of weight gain = 8
• Low FCR efficient use of food
• High FCR inefficient use of food
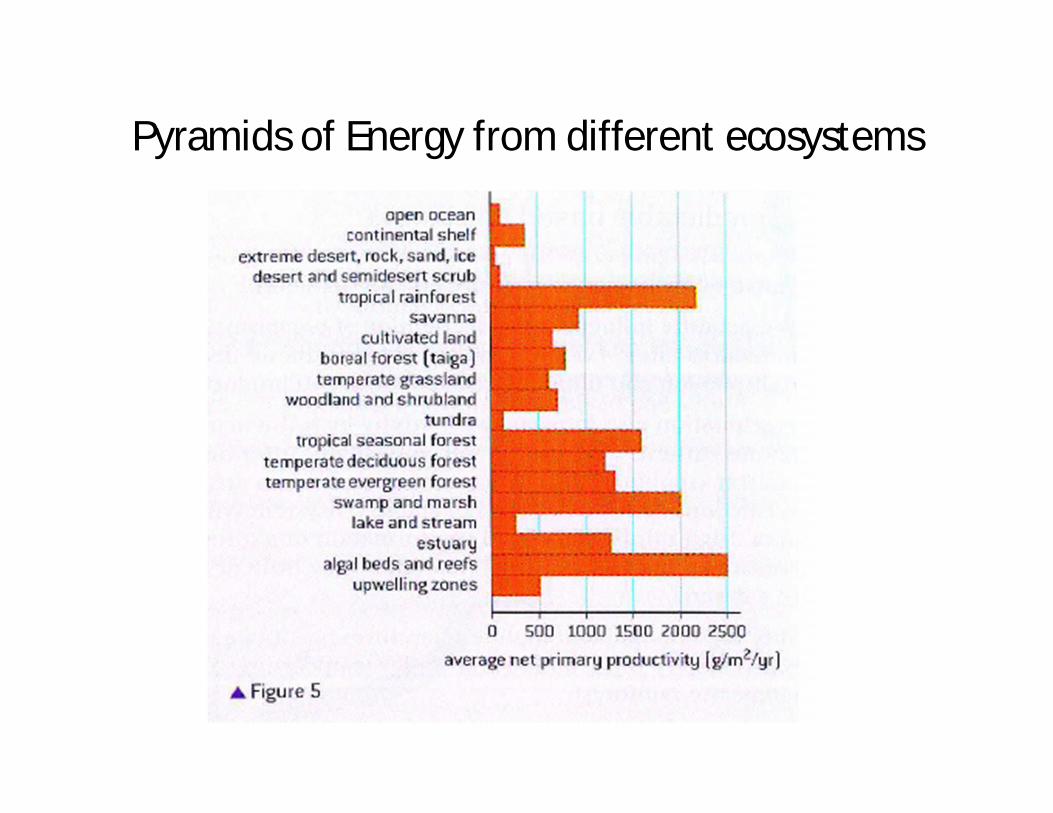
Pyramids of Energy from different ecosystems
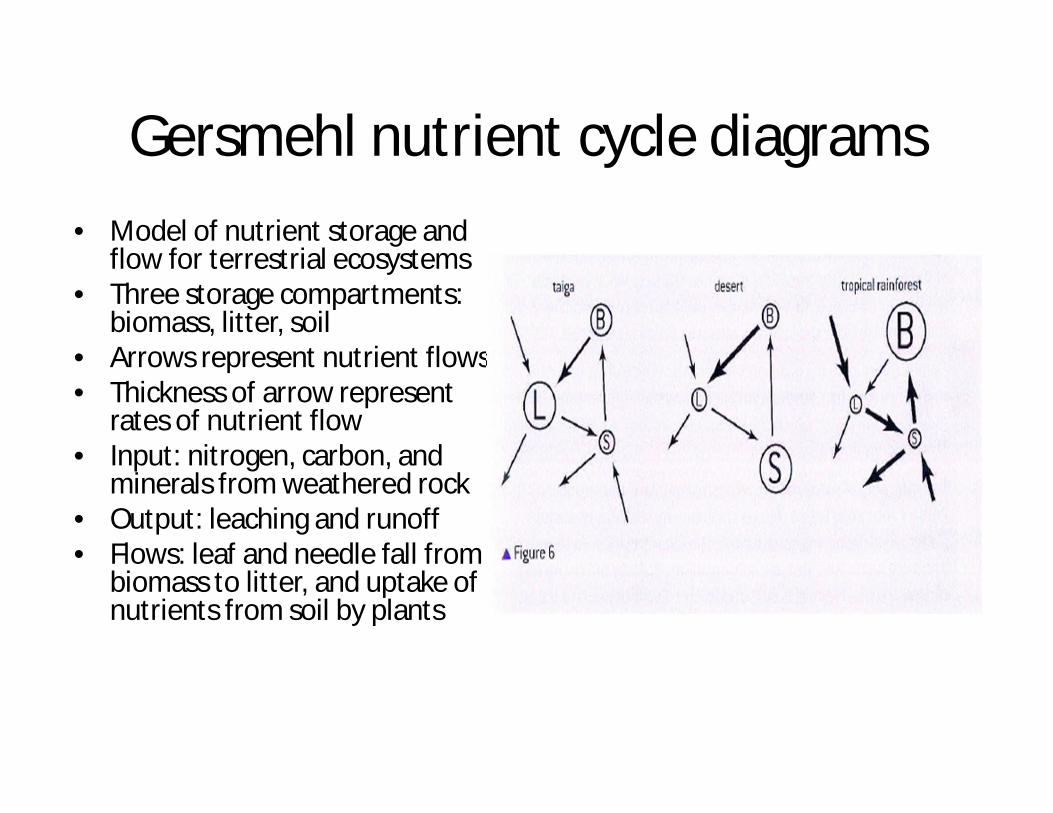
Gersmehl nutrient cycle diagrams• Model of nutrient storage and
flow for terrestrial ecosystems• Three storage compartments:
biomass, litter, soil • Arrows represent nutrient flows• Thickness of arrow represent
rates of nutrient flow• Input: nitrogen, carbon, and
minerals from weathered rock• Output: leaching and runoff• Flows: leaf and needle fall from
biomass to litter, and uptake of nutrients from soil by plants

Example 1: Tropical rainforest• Biomass is the main store of
nutrients and has tall, dense vegetation with many layers
• Precipitation: high rainfall• Litter: very small store because of
high rate of decomposition• Soil: very small store because of
leaching and low soil fertility• Weathering is rapid because of
high heat and humidity• Leaching is high because of high
rainfall• Runoff is high because of large
amount of rain

Example 2: Taiga• Litter is the largest store of
nutrients because of low rate of decomposition
• Run off is high. Ground is frozen when snow is melting
• Biomass is low. • Transfer from biomass to litter
is high because of constant supply of needles from coniferous trees
• Soil stores are small. Low soil fertility
• Weathering of rocks is slow because of cold.
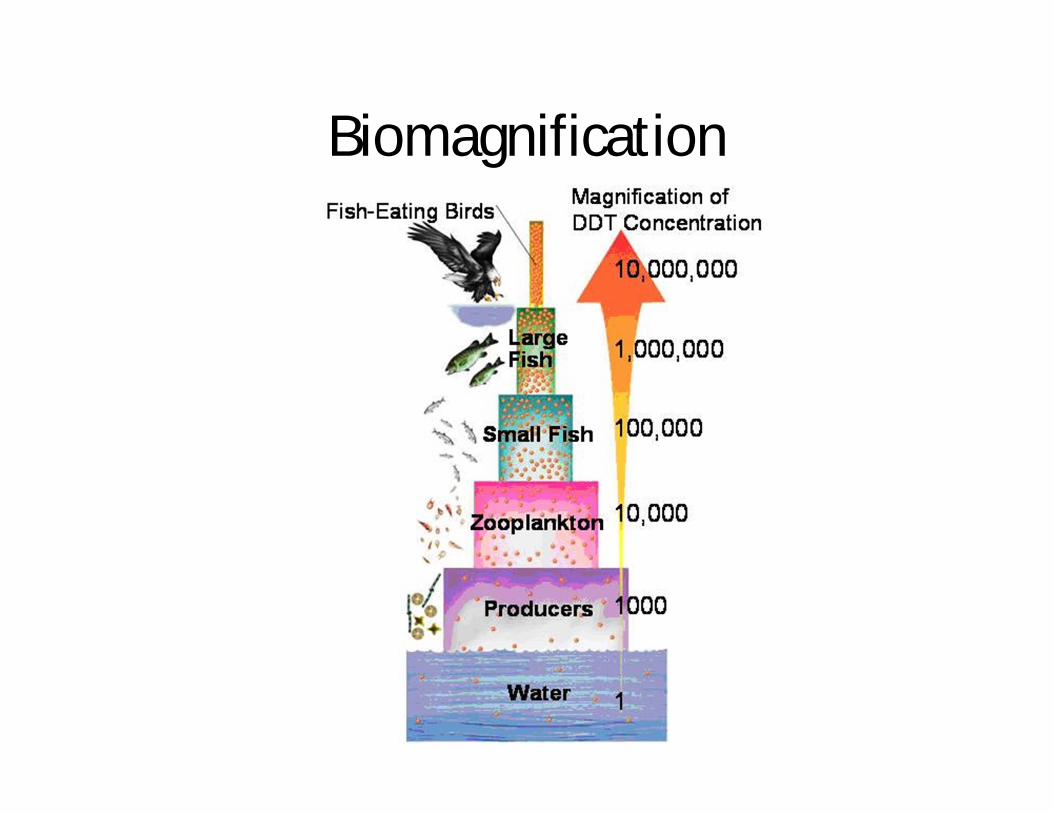
Biomagnification

Biomagnification• Process in which chemical
substances become more concentrated at each trophic level
• As each individual eats contaminated food, it builds up these chemical substances
• When large number of contaminated individuals are eaten, they pass on a high concentration of chemicals to the predator

Minamata Disease (1956)Mercury Poisoning
• Methylmercury in industrial wastewater from ChissoCorporation’s chemical factory (nitrogenous fertilizer)
• Bioaccumulation in fish and shellfish in Minamata Bay
• Neurological disorder: general weakness of muscles, coordination disturbance, narrow visual field, insanity, coma death

DDT Poisoning• DDT is an insecticide used in
20th century• DDT cause thin shelled eggs
of birds and unable to reproduce successfully
• Human effects: reduced fertility, genital birth defect, cancer
• World Health Organization endorses use of DDT because it helps to protect people from malaria
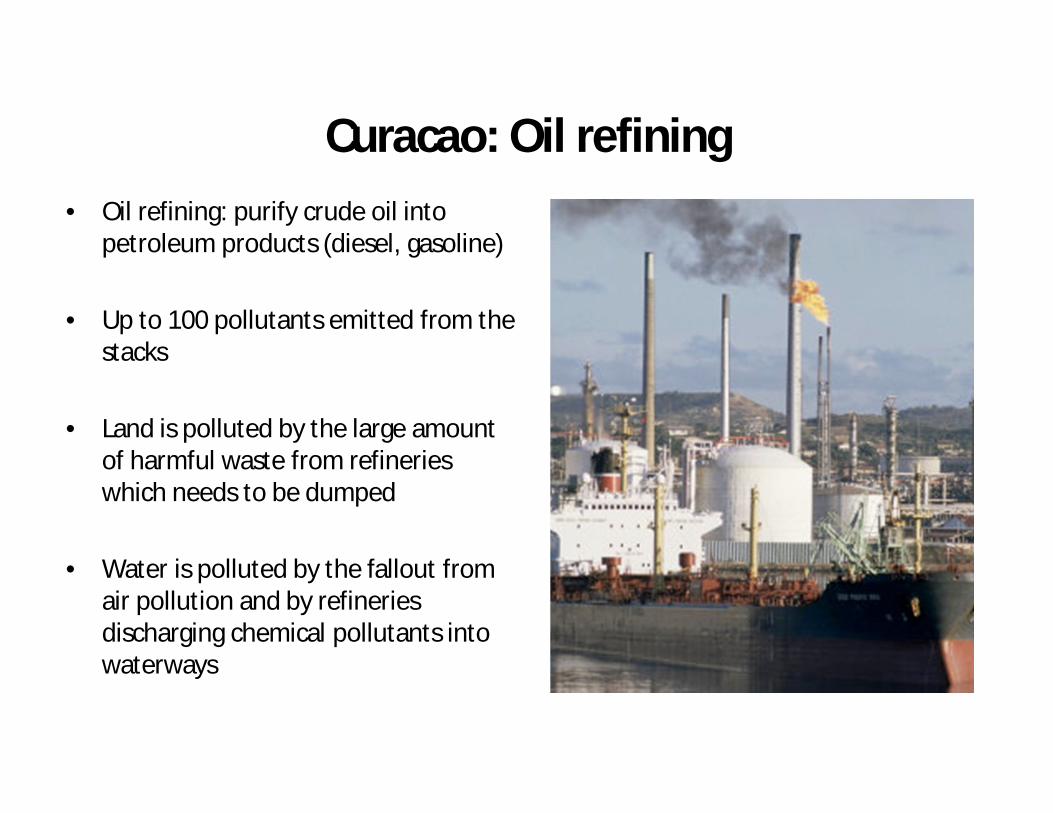
Curacao: Oil refining • Oil refining: purify crude oil into
petroleum products (diesel, gasoline)
• Up to 100 pollutants emitted from the stacks
• Land is polluted by the large amount of harmful waste from refineries which needs to be dumped
• Water is polluted by the fallout from air pollution and by refineries discharging chemical pollutants into waterways

Succession
Primary: Colonization of region where there is no pre-existing community
Secondary: Occurs where an existing community has been cleared by a disturbance that does not involve complete soil loss
Begins with no life Follows a disturbance of the primary succession
No soil Soil is present
New area e.g. volcanic island Old area e.g. following a forest fire
Lichen and mosses are first plants Seeds and roots already present
• Series of changes to an ecosystem• Caused by complex interactions between the community of living
organisms and the abiotic environment

Primary succession

Secondary succession
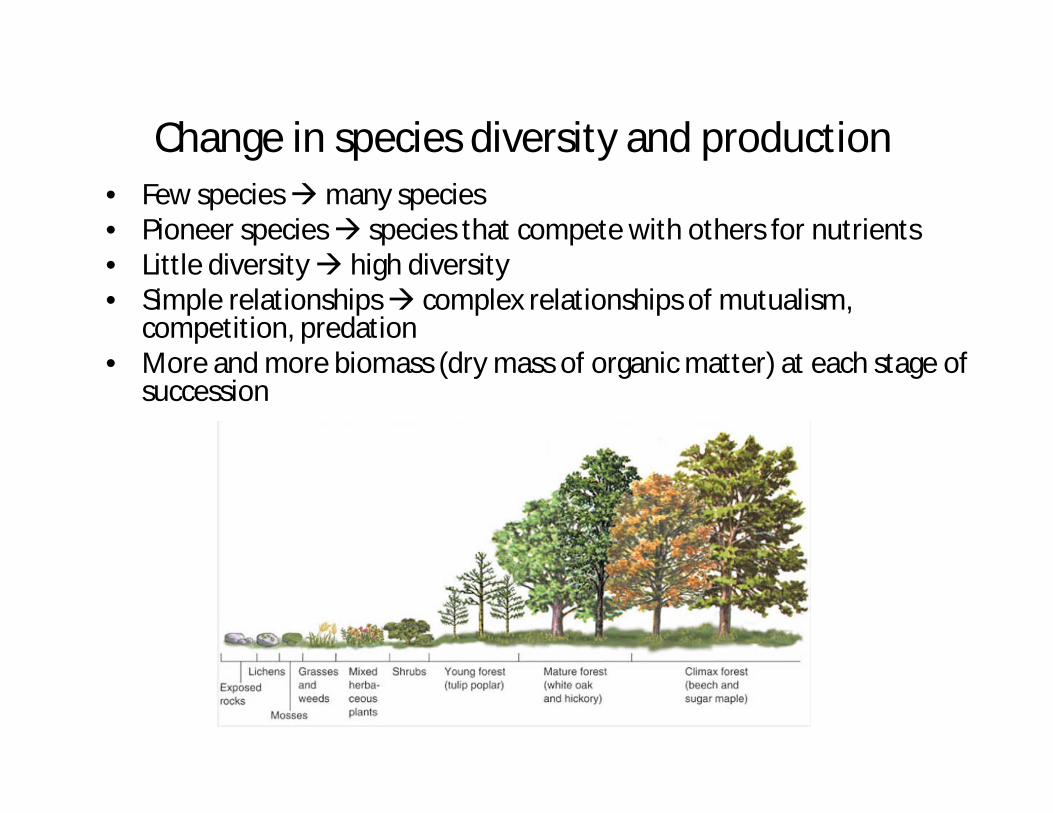
Change in species diversity and production• Few species many species • Pioneer species species that compete with others for nutrients• Little diversity high diversity • Simple relationships complex relationships of mutualism,
competition, predation• More and more biomass (dry mass of organic matter) at each stage of
succession

Interactions with organism and the environment
• Soils become deeper as a result of decay of plants
– Allows well-draining soil
• Organic matter (humus) in soil increases as a result of decay of plants
– Organic matter quickly absorbs and releases water so is a good medium for plant growth
• Mineral recycling increases – bacteria and fungi become more active in soils
that have high organic matter
• Soil erosion reduces – plant roots that stabilize the sand
• Minerals added– Alder plants fix atmospheric nitrogen which
leads to increase of nitrogen in the soil


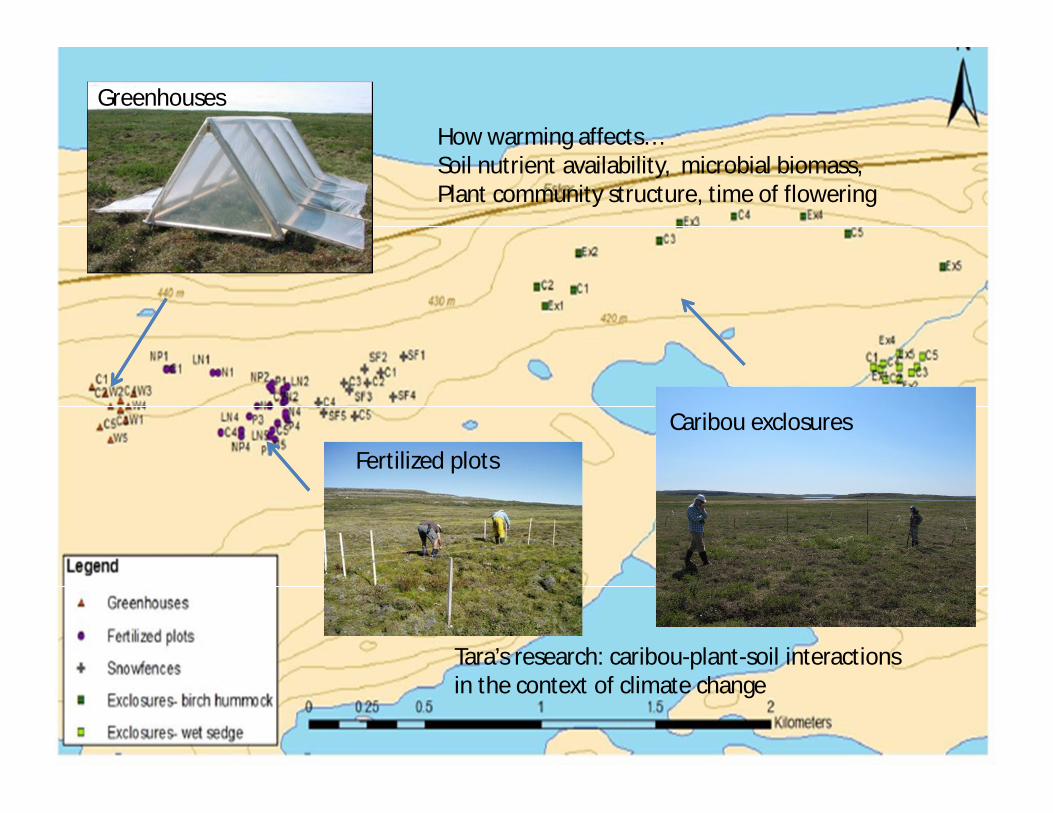
Greenhouses
Fertilized plots
Caribou exclosures
How warming affects… Soil nutrient availability, microbial biomass, Plant community structure, time of flowering
Tara’s research: caribou-plant-soil interactions in the context of climate change


Seed quality of small plants and large plants in a population

Separating seeds from plants
Seeds in coin envelopes

G1.10 Measurement of different biomass of trophic levels in an ecosystem
E.g. An ecologist wants to compare the amount of organisms in each trophic level of an ecosystem
Method: 1. Representative samples of
organisms collected, such as random quadrats
2. Organisms sorted into trophic levels
3. Organisms dried in oven at (60 –80 degree C)
4. Mass organism of each trophic level is measured using electronic balance

TODAY
1. Try energy pyramid modeling!http://glencoe.mcgraw-hill.com/sites/dl/free/0078757134/383926/BL_02.html
2. Energy flow worksheet3. Continue to update your LL4. Next class: Quiz on niches, matter/energy flow