Embed Size (px)
Citation preview

Energy-Efficient Visual Monitoring
Based on the Sensing Relevancies of
Source Nodes for Wireless Image
Sensor Networks
Daniel G. Costa, UEFS/UFRN, Brazil
Luiz Affonso Guedes, UFRN, Brazil
2
Outline
Wireless Image Sensor Networks
Sensing relevancies of source nodes
Energy-efficient visual monitoring
Energy consumption
Experimental results
Conclusions
Future works
IEEE SAS 2012
IEEE SAS 2012 3
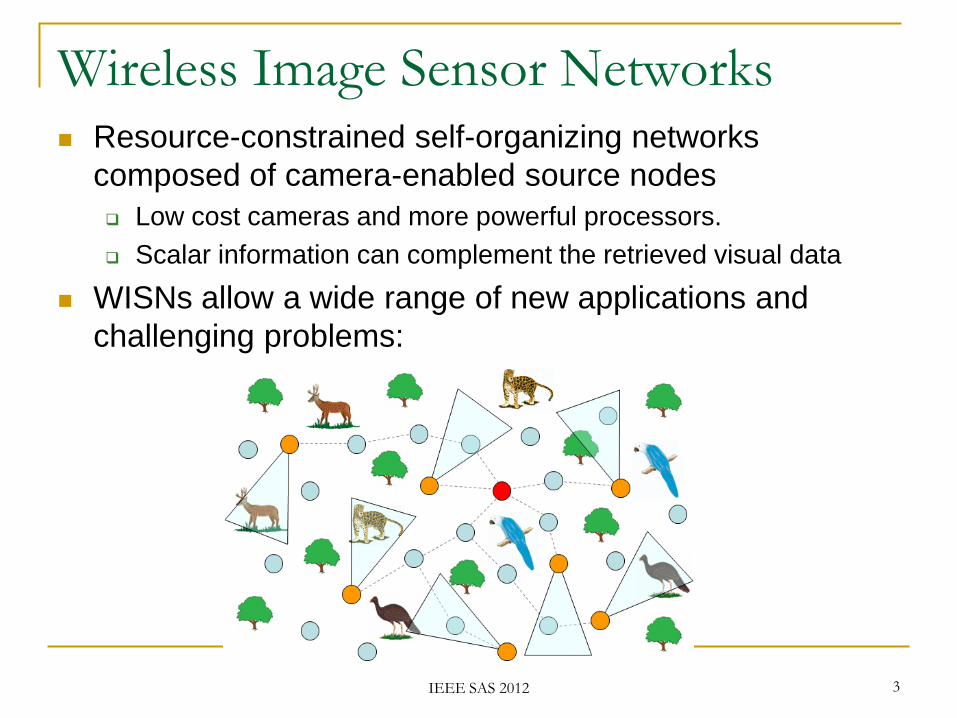
Wireless Image Sensor Networks Resource-constrained self-organizing networks
composed of camera-enabled source nodes
Low cost cameras and more powerful processors.
Scalar information can complement the retrieved visual data
WISNs allow a wide range of new applications and
challenging problems:
4
Wireless Image Sensor Networks
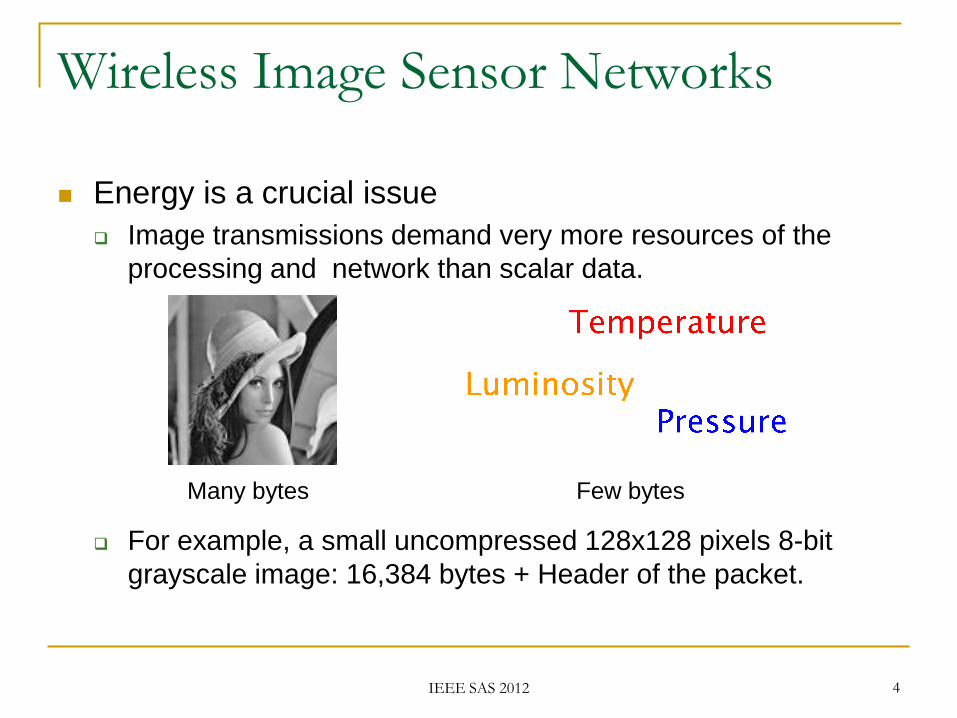
Energy is a crucial issue
Image transmissions demand very more resources of the
processing and network than scalar data.
For example, a small uncompressed 128x128 pixels 8-bit
grayscale image: 16,384 bytes + Header of the packet.
Many bytes Few bytes
IEEE SAS 2012

5
Wireless Image Sensor Networks
Reduction of the amount of information to cross
the network is important to: save energy.
avoid overload.
How can we reduce the traffic on the network?
IEEE SAS 2012
6
Wireless Image Sensor Networks
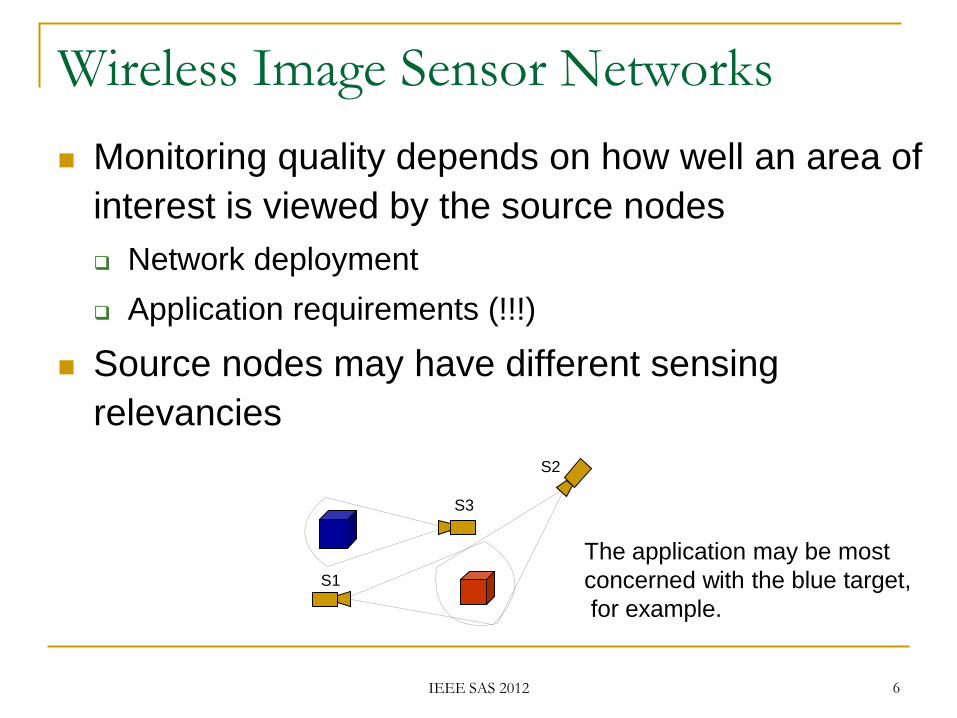
Monitoring quality depends on how well an area of
interest is viewed by the source nodes
Network deployment
Application requirements (!!!)
Source nodes may have different sensing
relevancies
S1
S3
S2
IEEE SAS 2012
The application may be most
concerned with the blue target,
for example.
7
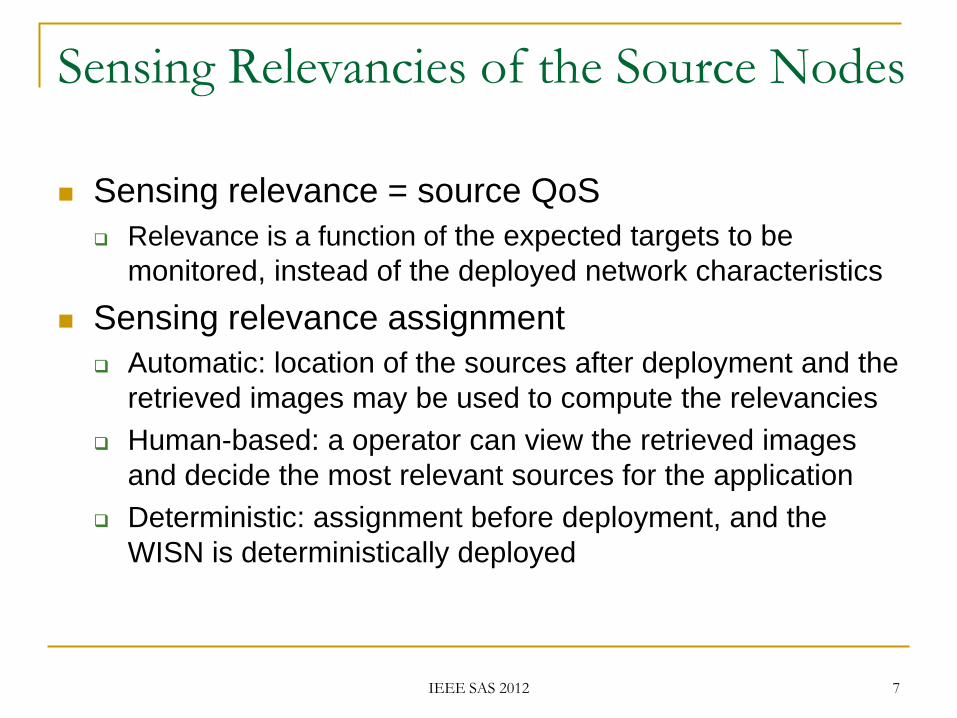
Sensing relevance = source QoS
Relevance is a function of the expected targets to be
monitored, instead of the deployed network characteristics
Sensing relevance assignment
Automatic: location of the sources after deployment and the
retrieved images may be used to compute the relevancies
Human-based: a operator can view the retrieved images
and decide the most relevant sources for the application
Deterministic: assignment before deployment, and the
WISN is deterministically deployed
Sensing Relevancies of the Source Nodes
IEEE SAS 2012
8
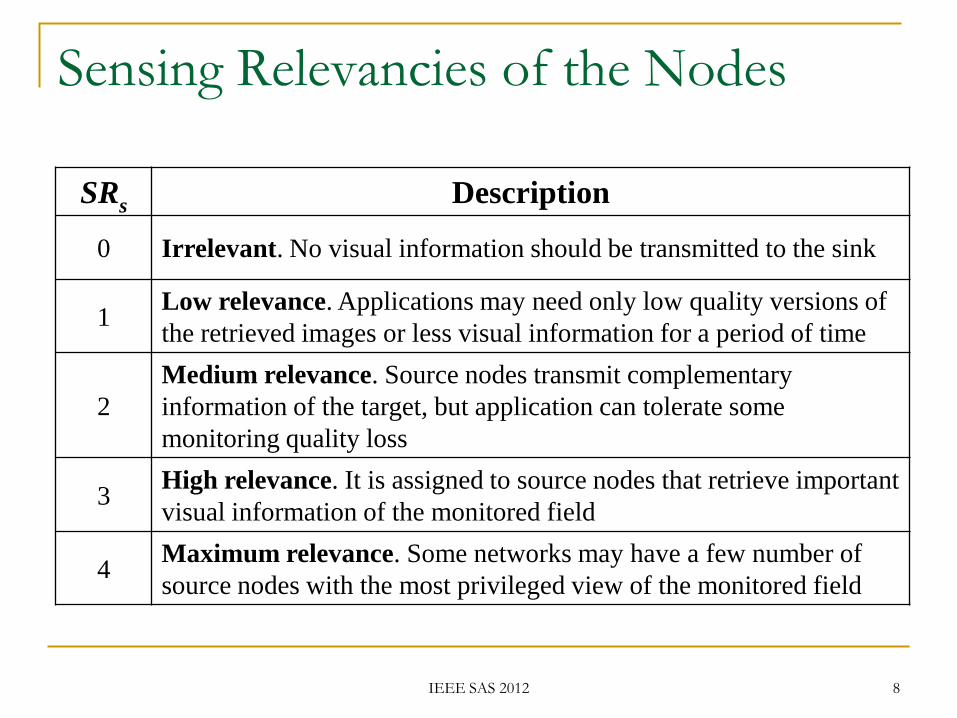
Sensing Relevancies of the Nodes
SRs Description
0 Irrelevant. No visual information should be transmitted to the sink
1 Low relevance. Applications may need only low quality versions of
the retrieved images or less visual information for a period of time
2
Medium relevance. Source nodes transmit complementary
information of the target, but application can tolerate some
monitoring quality loss
3 High relevance. It is assigned to source nodes that retrieve important
visual information of the monitored field
4 Maximum relevance. Some networks may have a few number of
source nodes with the most privileged view of the monitored field
IEEE SAS 2012

9
Sensing Relevancies of the Nodes
How can we use the Sensing Relevance Index?
In this paper, source nodes may transmit images
in different frequencies
Less relevant sources may transmit fewer images in a
period of time
The overall quality is preserved
Energy is saved over the network
IEEE SAS 2012
10
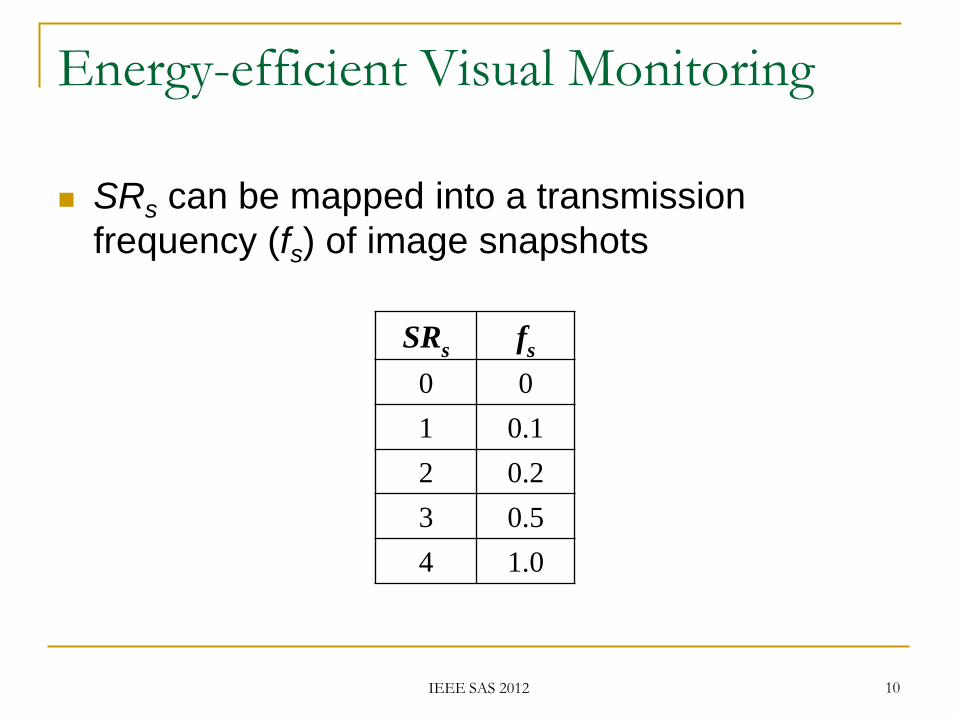
SRs can be mapped into a transmission
frequency (fs) of image snapshots
Energy-efficient Visual Monitoring
SRs fs
0 0
1 0.1
2 0.2
3 0.5
4 1.0
IEEE SAS 2012

11
Energy Consumption Model
In a period of T seconds, a set of T.fs images have to be
transmitted from the source node s.
For packets sizing k bits, a packet overhead of z bits and original
images sizing B bits, we have (based on [12]):
)1(0
1
2
....
.....
p
p
Hpp
H
h
phphp
esph
tesph
ErEtErEtE
ekzk
BfTEr
deekzk
BfTEt
IEEE SAS 2012

12
Energy Consumption
Energy is proportional to fs
More relevant source nodes transmit more packets and
consume more energy
)1(0
1
2
....
.....
p
p
Hpp
H
h
phphp
esph
tesph
ErEtErEtE
ekzk
BfTEr
deekzk
BfTEt
IEEE SAS 2012

13
Energy-efficient Visual Monitoring
Energy saving is achieved when less sensing-
relevant source nodes are identified
They can transmit less images and reduce the overall
energy consumption
High relevant sources are unaffected with our strategy
When compared with traditional transmission
approaches, SR-based monitoring is more energy
efficient
Low impact to the monitoring quality
IEEE SAS 2012
14
Experimental Results The presented energy consumption model is indeed very
simple
It does not consider contention mechanisms and state transitions
However, it is a good indication of the relation between energy
consumption and fs
The proposed solution was validated in the
Castalia/OMNet++ network simulator
T-MAC as the MAC layer protocol (IEEE 802.15.4)
Payload size (k – z) = 720 bits (90 bytes)
Header size 30 bytes
B = 32,768 bits (64 x 64 pixels, 8-bit, grayscale) 46 packets
with 120 bytes each.
T = 120s 120 image snapshots for the highest relevant
sources and 12 image snapshots for the lowest relevant sources.
IEEE SAS 2012
15
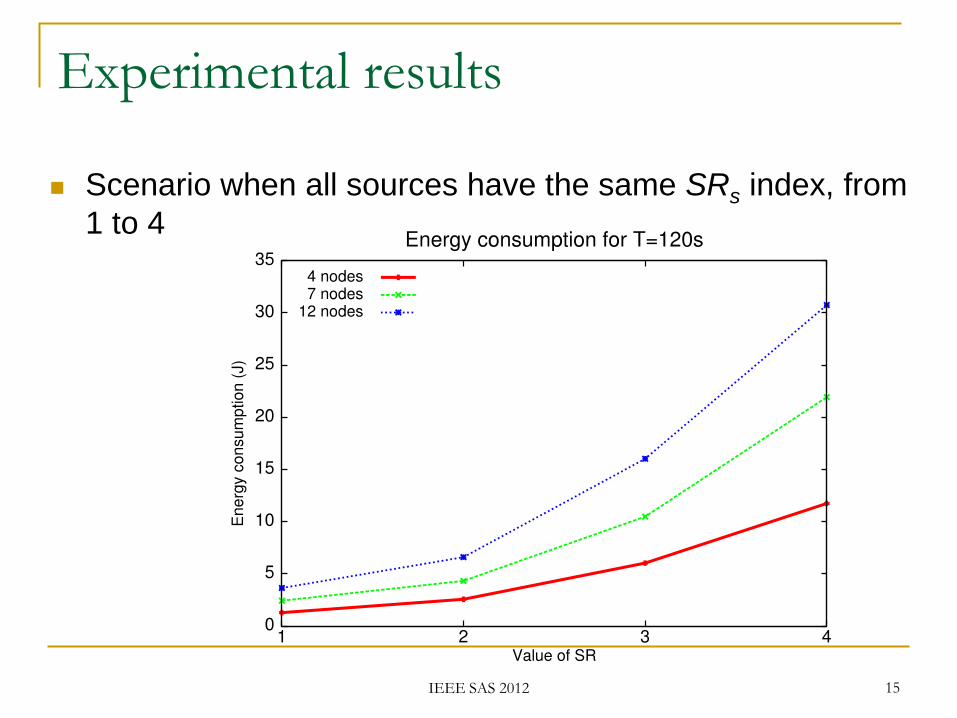
Experimental results
Scenario when all sources have the same SRs index, from
1 to 4
IEEE SAS 2012
16
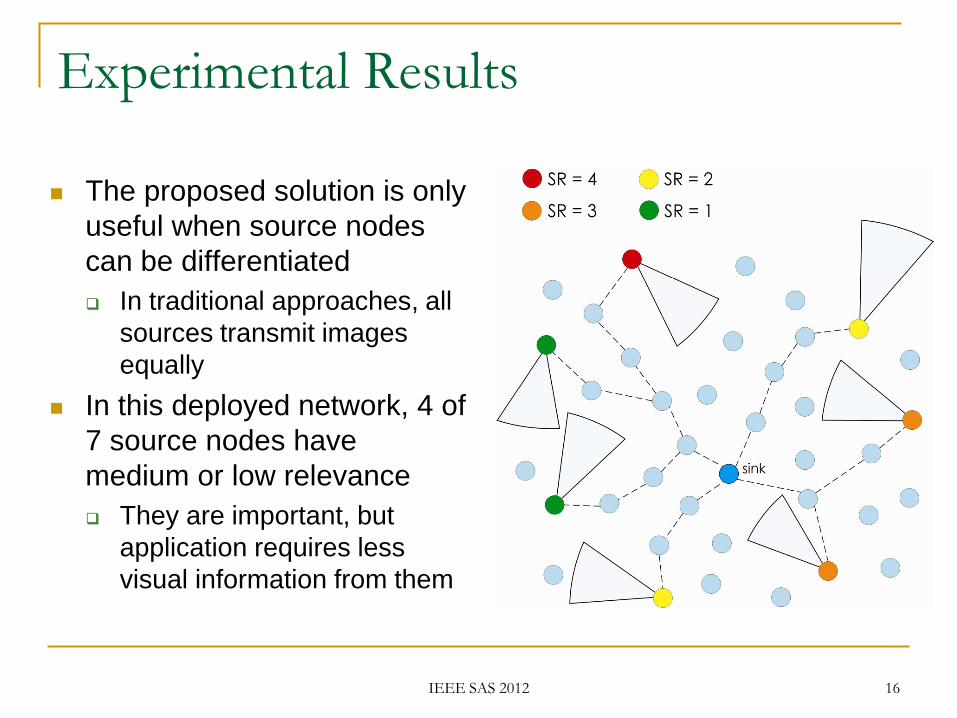
Experimental Results
The proposed solution is only
useful when source nodes
can be differentiated
In traditional approaches, all
sources transmit images
equally
In this deployed network, 4 of
7 source nodes have
medium or low relevance
They are important, but
application requires less
visual information from them
IEEE SAS 2012
17
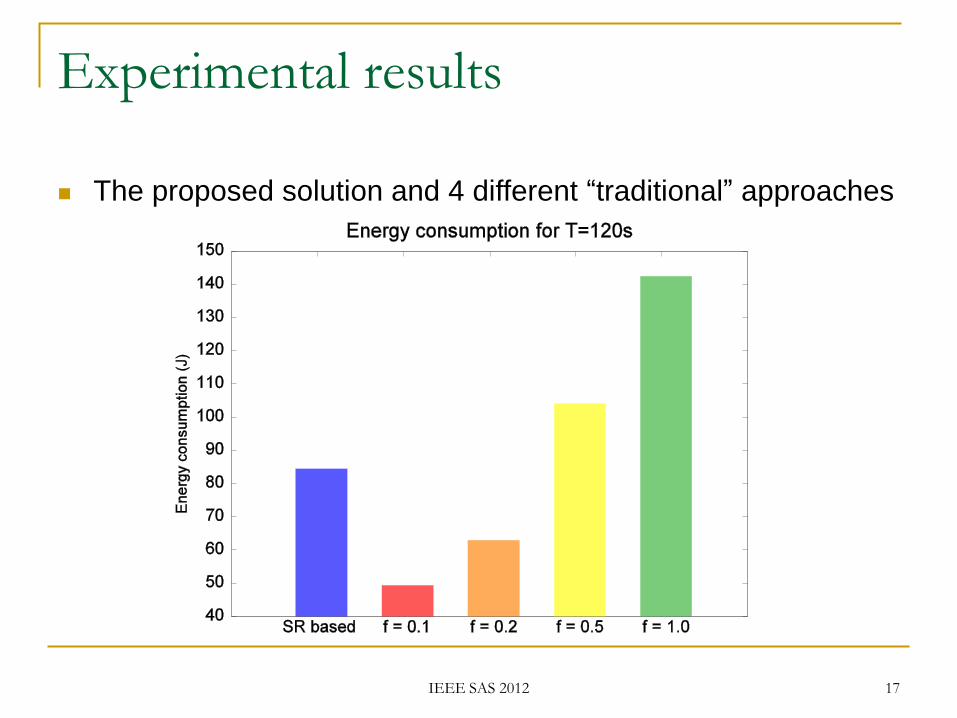
Experimental results
The proposed solution and 4 different “traditional” approaches
IEEE SAS 2012
18
Conclusions
The proposed solution could be used to prolong the
monitoring capability of wireless image sensor networks
The sensing relevancies of source nodes are a valuable
concept that can be largely exploited for wireless sensor
network optimizations
Different sources should be treated differently
IEEE SAS 2012

19
Future Works Additional experimental verifications.
Measurement of the visual monitoring quality
using some Mean Opinion Score (MOS)
mechanism.
Automatic/adaptive assignment of SRs to
deployed source nodes
Centralized or distributed approach?
Others mapping process between SRs Index and
image compress level, for example.
Assignment the SRs to the packet instead of the
image.
IEEE SAS 2012