Embed Size (px)
Citation preview
www.witpress.com, ISSN 1746-4498 (on-line) WIT Transactions on The Built Environment, Vol 171, © 2017 WIT Press
doi:10.2495/STR170041
ENERGY EFFICIENCY OF VENTILATED FAÇADES: RESIDENTIAL BUILDINGS, ALICANTE, SPAIN
ALMUDENA ESPINOSA FERNÁNDEZ1, VÍCTOR ECHARRI IRIBARREN2 & FERNANDO ECHARRI IRIBARREN3
1Department of Architecture, University of Zaragoza, Spain 2Department of Building Construction, University of Alicante, Spain
3Department of Biology, University of Navarre, Spain
ABSTRACT Ventilated façades with external thermal insulation contribute to the construction, in certain climatologies, of a great energetic efficiency in the thermal envelope of the building. This façade allows to eliminate the thermal bridges, reduce the energy demand and improve the level of comfort. These pages describe the research carried out in an isolated residential block in the city centre of Alicante. The house has two façades with different orientation: a ventilated façade (north) and a conventional façade (south). The first one is solved with two sheets of brick, the air camera, the external continuous insulation, the ventilated chamber and the pieces of porcelain stoneware to the outside. The conventional one consists of two sheets with intermediate thermal insulation. The outer sheet is composed of facing brick and the inner sheet by hollow brick of minor thickness with plaster. This system was correct according to the norm NBE-CT-79, but it has been shown that it is insufficient to reach the levels of habitability and the comfort of the current society. The two façades, as well as their adjacent living spaces, have been monitored over a period of two years. Internal and external temperature and humidity, solar radiation, air velocity in the ventilated chamber and surface temperature of each of the material layers of the sections have been obtained. A thermographic study of the two chambers was carried out to determine the thermal bridges and the air infiltration. Through the use of energy simulation tools, comparative results of some parameters have been obtained in both constructive solutions, such as thermal transmissions, average radiant temperatures, operating temperatures or energy demands. By that, we can obtain the conclusions of thermal comfort levels and energy savings of ventilated façades. Keywords: ventilated façades, conventional façade, energy efficiency, simulation, monitoring.
1 INTRODUCTION The conception of the building as shelter of humans, aims to create conditions for the occupants of the building that allow the development of the planned activities within some parameters of comfort. It is necessary, therefore, to establish for the architectural design, the limits that define the comfort zone [1]. It is a strip characterized by the thermal neutrality that varies according to the user, its geographic location, its clothes, age, activity that realizes, etc. Comfort is achieved through the integration of many factors. It is divided into several types, according to the channel of sensory perception that is involved: Thermal, Luminous, Acoustic, Olfactory and Psychological [2]. Of these types of comfort, the first three are those that mainly influence the space perception of a person, and can be treated and modified by the architecture. The comfort parameters are the conditions of the place that affect the sensations of the occupants [3]. The dry air temperature, relative, average radiant, operating, air velocity and relative humidity are environmental parameters, but in addition, there are architectural parameters. Environmental parameters can be measured and standardized. The architectural parameters are directly related to the characteristics of the building and the adaptability to the space.
Structural Studies, Repairs and Maintenance of Heritage Architecture XV 41
www.witpress.com, ISSN 1746-4498 (on-line) WIT Transactions on The Built Environment, Vol 171, © 2017 WIT Press
The following study analyses the influence of an architectural parameter, such as the construction of two façades, in the thermal comfort of two spaces. To do this, the values of energy demand and operating temperature are related to the construction sections and adjacent spaces.
2 DESCRIPTION OF ANALYSED FAÇADES
2.1 Ventilated façade with external insolation
The ventilated façade is a part of the thermal envelope (north façade) of an isolated block of dwellings, located in the city centre of Alicante. Specifically, the research focuses on the thermal influence of the façade on the living space adjacent to it: the living room of the house. It is an unoccupied dwelling during the two years of the investigation. Despite not being inhabited, the air conditioning system has been kept in operation under certain conditions of comfort. The windows of the house have protection elements, roller shutters. The windows corresponding to the room, north orientation, have been kept rolled up during the entire data recording process. Table 1 shows the constructional characteristics of the façade.
2.2 Conventional façade with insolation inside the support
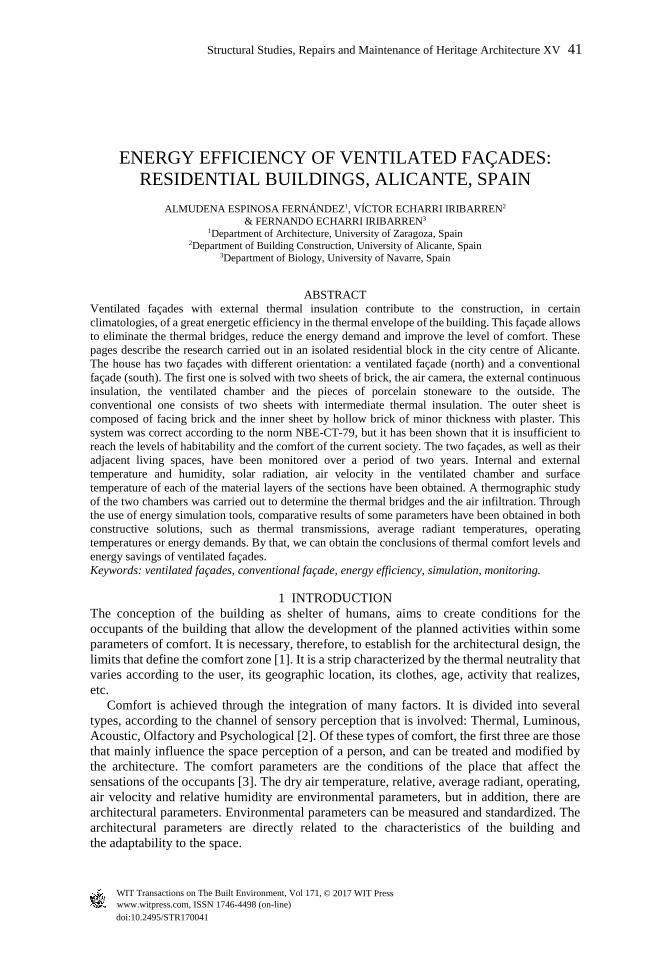
The conventional façade forms part of the thermal envelope (southern façade; Fig. 1) of the block of houses previously described. Specifically, the research focuses on the thermal influence of the façade on the living space adjacent to it: main bedroom of the dwelling. The windows corresponding to this room, facing south, have remained rolled up during the whole process of recording data. The construction characteristics are shown in Table 2.
Figure 1: Typical view of the residential building. Current state.
42 Structural Studies, Repairs and Maintenance of Heritage Architecture XV
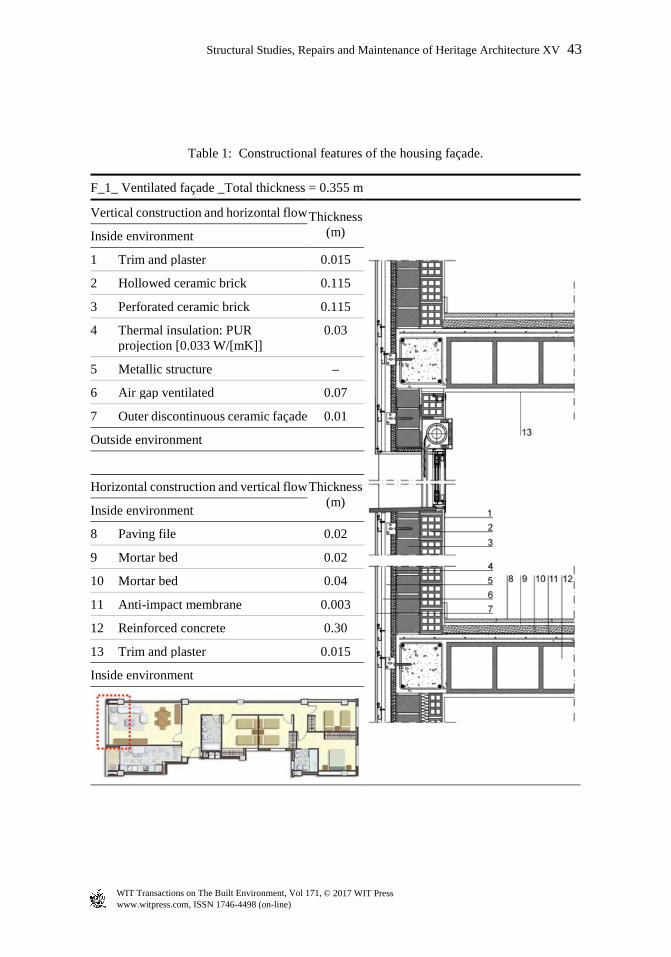
Table 1: Constructional features of the housing façade.
F_1_ Ventilated façade _Total thickness = 0.355 m
Vertical construction and horizontal flow Thickness (m)
Inside environment
1 Trim and plaster 0.015
2 Hollowed ceramic brick 0.115
3 Perforated ceramic brick 0.115
4 Thermal insulation: PUR projection [0.033 W/[mK]]
0.03
5 Metallic structure –
6 Air gap ventilated 0.07
7 Outer discontinuous ceramic façade 0.01
Outside environment
Horizontal construction and vertical flow Thickness (m) Inside environment
8 Paving file 0.02
9 Mortar bed 0.02
10 Mortar bed 0.04
11 Anti-impact membrane 0.003
12 Reinforced concrete 0.30
13 Trim and plaster 0.015
Inside environment
www.witpress.com, ISSN 1746-4498 (on-line) WIT Transactions on The Built Environment, Vol 171, © 2017 WIT Press
Structural Studies, Repairs and Maintenance of Heritage Architecture XV 43
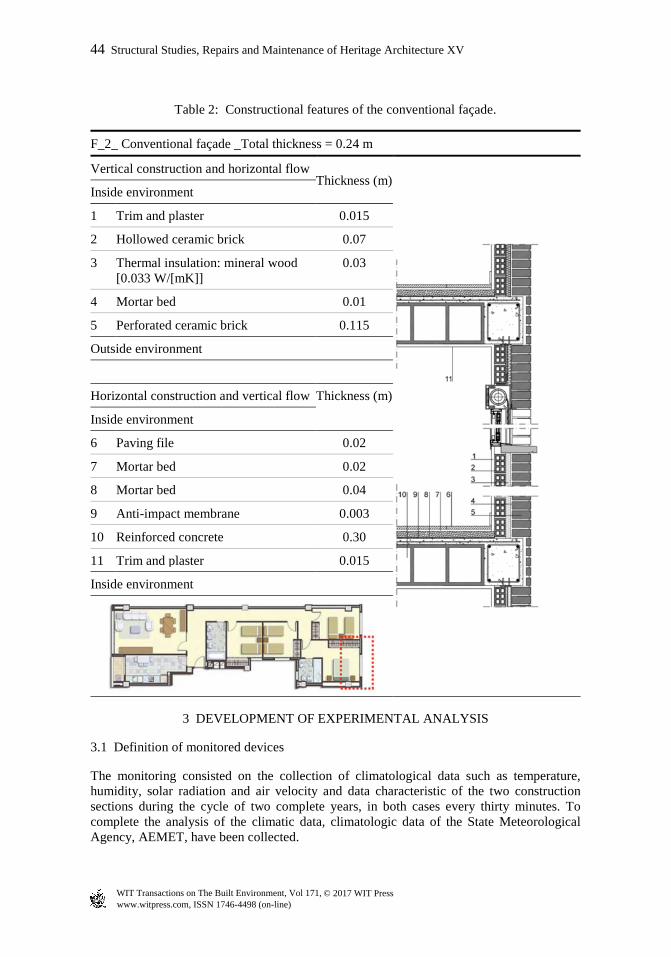
Table 2: Constructional features of the conventional façade.
F_2_ Conventional façade _Total thickness = 0.24 m
Vertical construction and horizontal flow Thickness (m)
Inside environment
1 Trim and plaster 0.015
2 Hollowed ceramic brick 0.07
3 Thermal insulation: mineral wood [0.033 W/[mK]]
0.03
4 Mortar bed 0.01
5 Perforated ceramic brick 0.115
Outside environment
Horizontal construction and vertical flow Thickness (m)
Inside environment
6 Paving file 0.02
7 Mortar bed 0.02
8 Mortar bed 0.04
9 Anti-impact membrane 0.003
10 Reinforced concrete 0.30
11 Trim and plaster 0.015
Inside environment
3 DEVELOPMENT OF EXPERIMENTAL ANALYSIS
3.1 Definition of monitored devices
The monitoring consisted on the collection of climatological data such as temperature, humidity, solar radiation and air velocity and data characteristic of the two construction sections during the cycle of two complete years, in both cases every thirty minutes. To complete the analysis of the climatic data, climatologic data of the State Meteorological Agency, AEMET, have been collected.
www.witpress.com, ISSN 1746-4498 (on-line) WIT Transactions on The Built Environment, Vol 171, © 2017 WIT Press
44 Structural Studies, Repairs and Maintenance of Heritage Architecture XV
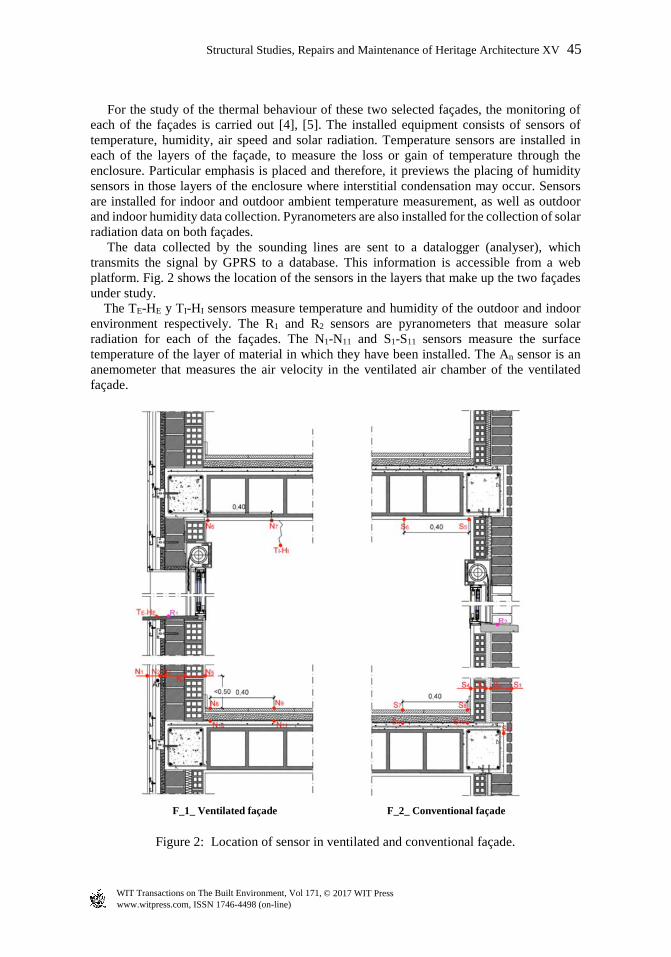
For the study of the thermal behaviour of these two selected façades, the monitoring of each of the façades is carried out [4], [5]. The installed equipment consists of sensors of temperature, humidity, air speed and solar radiation. Temperature sensors are installed in each of the layers of the façade, to measure the loss or gain of temperature through the enclosure. Particular emphasis is placed and therefore, it previews the placing of humidity sensors in those layers of the enclosure where interstitial condensation may occur. Sensors are installed for indoor and outdoor ambient temperature measurement, as well as outdoor and indoor humidity data collection. Pyranometers are also installed for the collection of solar radiation data on both façades. The data collected by the sounding lines are sent to a datalogger (analyser), which transmits the signal by GPRS to a database. This information is accessible from a web platform. Fig. 2 shows the location of the sensors in the layers that make up the two façades under study. The TE-HE y TI-HI sensors measure temperature and humidity of the outdoor and indoor environment respectively. The R1 and R2 sensors are pyranometers that measure solar radiation for each of the façades. The N1-N11 and S1-S11 sensors measure the surface temperature of the layer of material in which they have been installed. The An sensor is an anemometer that measures the air velocity in the ventilated air chamber of the ventilated façade.
F_1_ Ventilated façade F_2_ Conventional façade
Figure 2: Location of sensor in ventilated and conventional façade.
www.witpress.com, ISSN 1746-4498 (on-line) WIT Transactions on The Built Environment, Vol 171, © 2017 WIT Press
Structural Studies, Repairs and Maintenance of Heritage Architecture XV 45
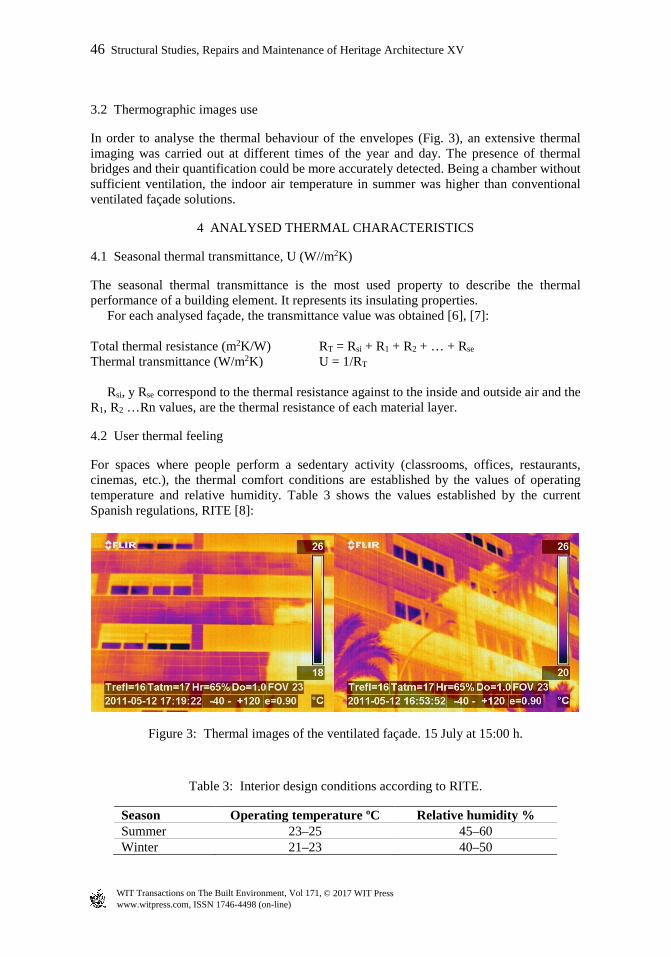
3.2 Thermographic images use
In order to analyse the thermal behaviour of the envelopes (Fig. 3), an extensive thermal imaging was carried out at different times of the year and day. The presence of thermal bridges and their quantification could be more accurately detected. Being a chamber without sufficient ventilation, the indoor air temperature in summer was higher than conventional ventilated façade solutions.
4 ANALYSED THERMAL CHARACTERISTICS
4.1 Seasonal thermal transmittance, U (W//m2K)
The seasonal thermal transmittance is the most used property to describe the thermal performance of a building element. It represents its insulating properties. For each analysed façade, the transmittance value was obtained [6], [7]: Total thermal resistance (m2K/W) RT = Rsi + R1 + R2 + … + Rse Thermal transmittance (W/m2K) U = 1/RT Rsi, y Rse correspond to the thermal resistance against to the inside and outside air and the R1, R2 …Rn values, are the thermal resistance of each material layer.
4.2 User thermal feeling
For spaces where people perform a sedentary activity (classrooms, offices, restaurants, cinemas, etc.), the thermal comfort conditions are established by the values of operating temperature and relative humidity. Table 3 shows the values established by the current Spanish regulations, RITE [8]:
Figure 3: Thermal images of the ventilated façade. 15 July at 15:00 h.
Table 3: Interior design conditions according to RITE.
Season Operating temperature ºC Relative humidity % Summer 23–25 45–60 Winter 21–23 40–50
www.witpress.com, ISSN 1746-4498 (on-line) WIT Transactions on The Built Environment, Vol 171, © 2017 WIT Press
46 Structural Studies, Repairs and Maintenance of Heritage Architecture XV
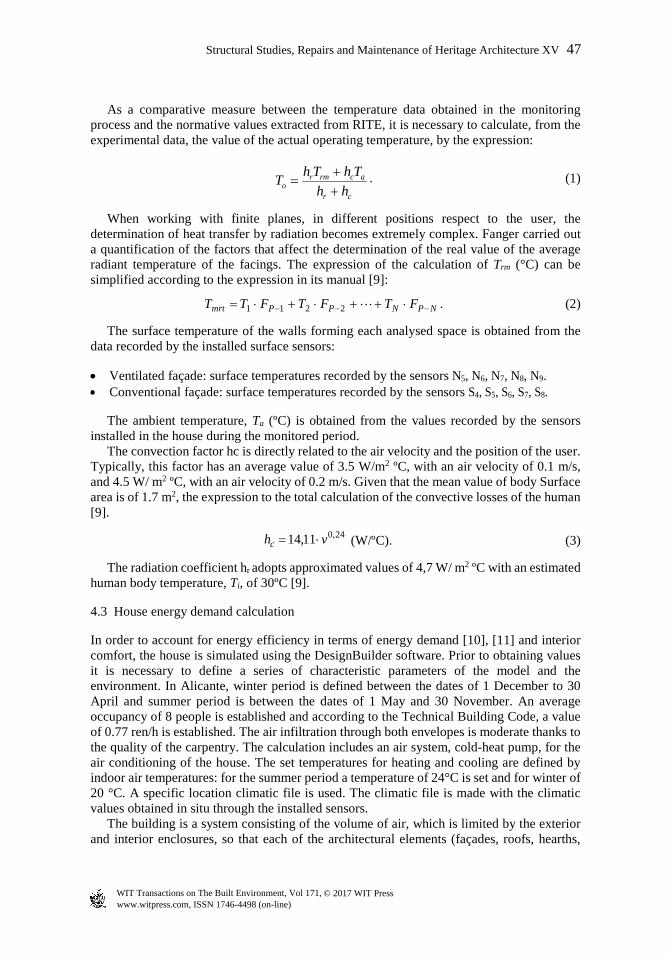
As a comparative measure between the temperature data obtained in the monitoring process and the normative values extracted from RITE, it is necessary to calculate, from the experimental data, the value of the actual operating temperature, by the expression:
. (1)
When working with finite planes, in different positions respect to the user, the determination of heat transfer by radiation becomes extremely complex. Fanger carried out a quantification of the factors that affect the determination of the real value of the average radiant temperature of the facings. The expression of the calculation of Trm (°C) can be simplified according to the expression in its manual [9]:
. (2)
The surface temperature of the walls forming each analysed space is obtained from the data recorded by the installed surface sensors:
• Ventilated façade: surface temperatures recorded by the sensors N5, N6, N7, N8, N9. • Conventional façade: surface temperatures recorded by the sensors S4, S5, S6, S7, S8.
The ambient temperature, Ta (ºC) is obtained from the values recorded by the sensors installed in the house during the monitored period. The convection factor hc is directly related to the air velocity and the position of the user. Typically, this factor has an average value of 3.5 W/m2 ºC, with an air velocity of 0.1 m/s, and 4.5 W/ m2 ºC, with an air velocity of 0.2 m/s. Given that the mean value of body Surface area is of 1.7 m2, the expression to the total calculation of the convective losses of the human [9].
(W/ºC). (3)
The radiation coefficient hr adopts approximated values of 4,7 W/ m2 ºC with an estimated human body temperature, Ti, of 30ºC [9].
4.3 House energy demand calculation
In order to account for energy efficiency in terms of energy demand [10], [11] and interior comfort, the house is simulated using the DesignBuilder software. Prior to obtaining values it is necessary to define a series of characteristic parameters of the model and the environment. In Alicante, winter period is defined between the dates of 1 December to 30 April and summer period is between the dates of 1 May and 30 November. An average occupancy of 8 people is established and according to the Technical Building Code, a value of 0.77 ren/h is established. The air infiltration through both envelopes is moderate thanks to the quality of the carpentry. The calculation includes an air system, cold-heat pump, for the air conditioning of the house. The set temperatures for heating and cooling are defined by indoor air temperatures: for the summer period a temperature of 24°C is set and for winter of 20 °C. A specific location climatic file is used. The climatic file is made with the climatic values obtained in situ through the installed sensors. The building is a system consisting of the volume of air, which is limited by the exterior and interior enclosures, so that each of the architectural elements (façades, roofs, hearths,
cr
acrmro hh
ThThT++
=
NPNPPmrt FTFTFTT −−− ⋅++⋅+⋅= 2211
24,011,14 vhc ⋅=
www.witpress.com, ISSN 1746-4498 (on-line) WIT Transactions on The Built Environment, Vol 171, © 2017 WIT Press
Structural Studies, Repairs and Maintenance of Heritage Architecture XV 47
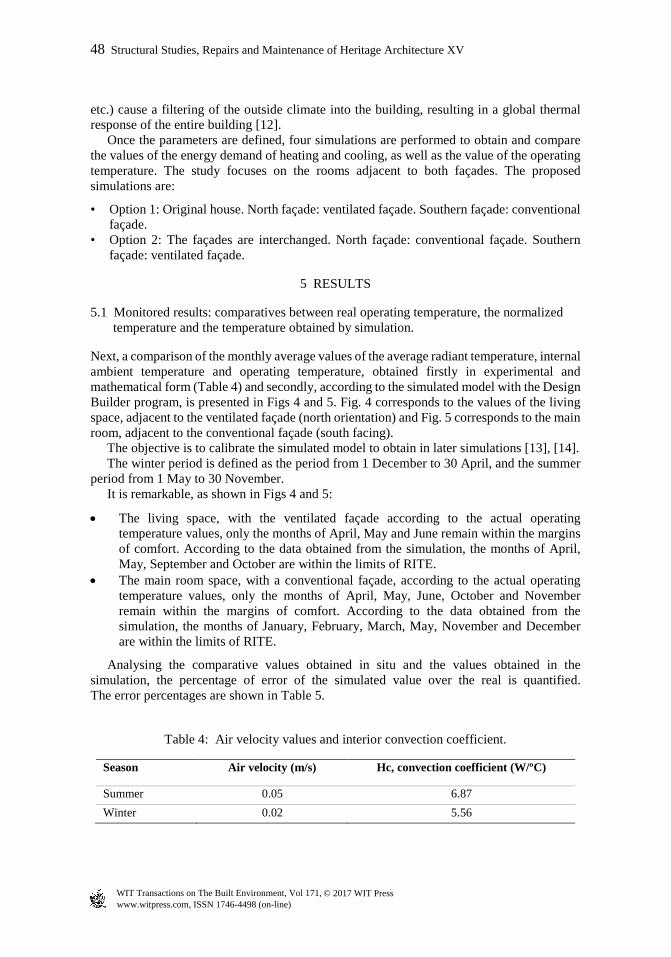
etc.) cause a filtering of the outside climate into the building, resulting in a global thermal response of the entire building [12]. Once the parameters are defined, four simulations are performed to obtain and compare the values of the energy demand of heating and cooling, as well as the value of the operating temperature. The study focuses on the rooms adjacent to both façades. The proposed simulations are:
• Option 1: Original house. North façade: ventilated façade. Southern façade: conventional façade.
• Option 2: The façades are interchanged. North façade: conventional façade. Southern façade: ventilated façade.
5 RESULTS
5.1 Monitored results: comparatives between real operating temperature, the normalized temperature and the temperature obtained by simulation.
Next, a comparison of the monthly average values of the average radiant temperature, internal ambient temperature and operating temperature, obtained firstly in experimental and mathematical form (Table 4) and secondly, according to the simulated model with the Design Builder program, is presented in Figs 4 and 5. Fig. 4 corresponds to the values of the living space, adjacent to the ventilated façade (north orientation) and Fig. 5 corresponds to the main room, adjacent to the conventional façade (south facing). The objective is to calibrate the simulated model to obtain in later simulations [13], [14]. The winter period is defined as the period from 1 December to 30 April, and the summer period from 1 May to 30 November. It is remarkable, as shown in Figs 4 and 5:
• The living space, with the ventilated façade according to the actual operating temperature values, only the months of April, May and June remain within the margins of comfort. According to the data obtained from the simulation, the months of April, May, September and October are within the limits of RITE.
• The main room space, with a conventional façade, according to the actual operating temperature values, only the months of April, May, June, October and November remain within the margins of comfort. According to the data obtained from the simulation, the months of January, February, March, May, November and December are within the limits of RITE.
Analysing the comparative values obtained in situ and the values obtained in the simulation, the percentage of error of the simulated value over the real is quantified. The error percentages are shown in Table 5.
Table 4: Air velocity values and interior convection coefficient.
Season Air velocity (m/s) Hc, convection coefficient (W/ºC)
Summer 0.05 6.87 Winter 0.02 5.56
www.witpress.com, ISSN 1746-4498 (on-line) WIT Transactions on The Built Environment, Vol 171, © 2017 WIT Press
48 Structural Studies, Repairs and Maintenance of Heritage Architecture XV
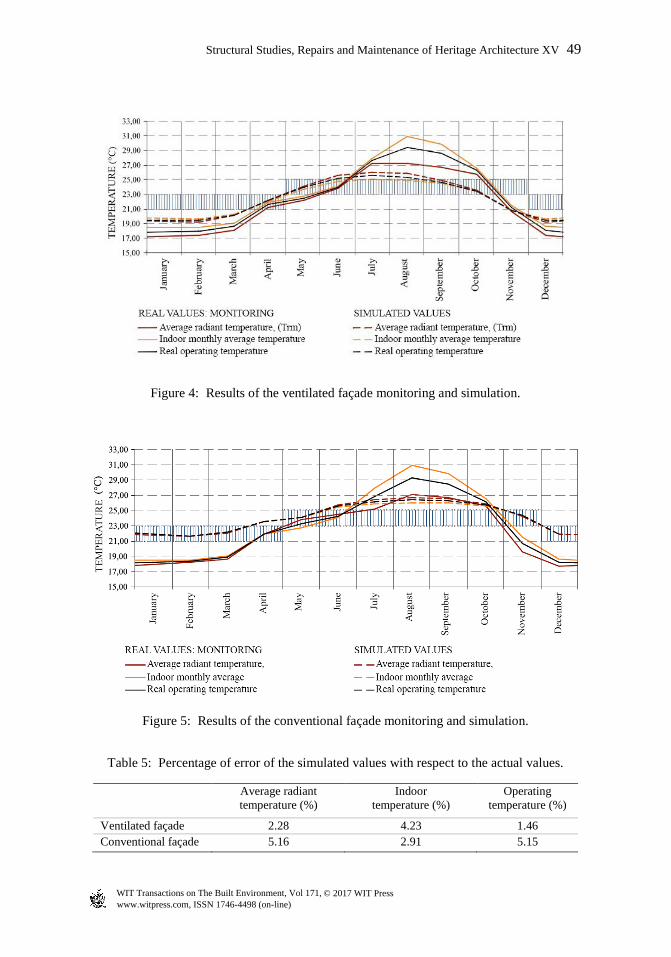
Figure 4: Results of the ventilated façade monitoring and simulation.
Figure 5: Results of the conventional façade monitoring and simulation.
Table 5: Percentage of error of the simulated values with respect to the actual values.
Average radiant temperature (%)
Indoor temperature (%)
Operating temperature (%)
Ventilated façade 2.28 4.23 1.46 Conventional façade 5.16 2.91 5.15
www.witpress.com, ISSN 1746-4498 (on-line) WIT Transactions on The Built Environment, Vol 171, © 2017 WIT Press
Structural Studies, Repairs and Maintenance of Heritage Architecture XV 49
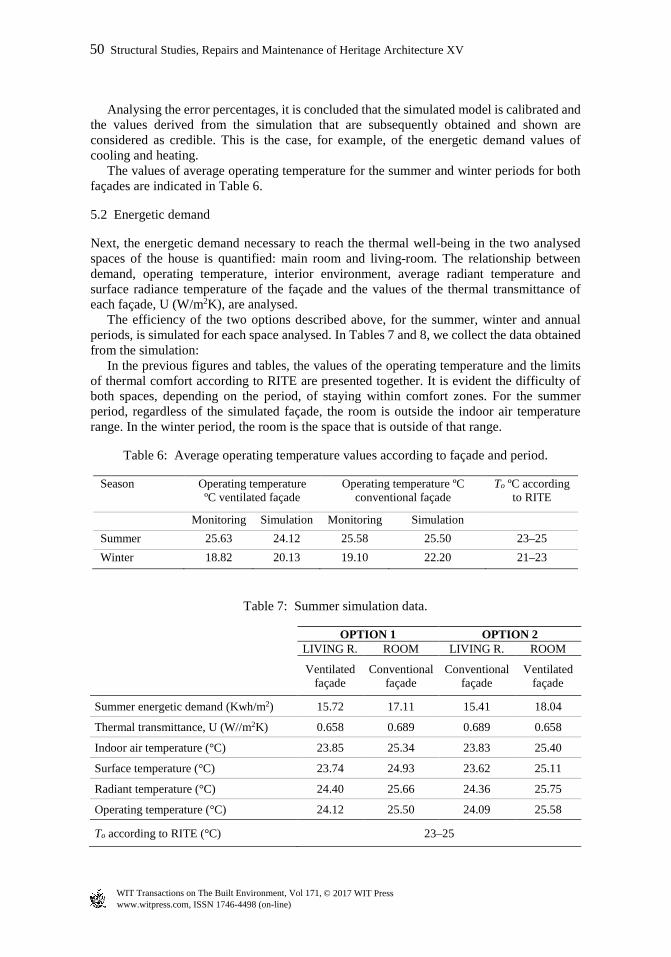
Analysing the error percentages, it is concluded that the simulated model is calibrated and the values derived from the simulation that are subsequently obtained and shown are considered as credible. This is the case, for example, of the energetic demand values of cooling and heating. The values of average operating temperature for the summer and winter periods for both façades are indicated in Table 6.
5.2 Energetic demand
Next, the energetic demand necessary to reach the thermal well-being in the two analysed spaces of the house is quantified: main room and living-room. The relationship between demand, operating temperature, interior environment, average radiant temperature and surface radiance temperature of the façade and the values of the thermal transmittance of each façade, U (W/m2K), are analysed. The efficiency of the two options described above, for the summer, winter and annual periods, is simulated for each space analysed. In Tables 7 and 8, we collect the data obtained from the simulation: In the previous figures and tables, the values of the operating temperature and the limits of thermal comfort according to RITE are presented together. It is evident the difficulty of both spaces, depending on the period, of staying within comfort zones. For the summer period, regardless of the simulated façade, the room is outside the indoor air temperature range. In the winter period, the room is the space that is outside of that range.
Table 6: Average operating temperature values according to façade and period.
Season Operating temperature ºC ventilated façade
Operating temperature ºC conventional façade
To ºC according to RITE
Monitoring Simulation Monitoring Simulation Summer 25.63 24.12 25.58 25.50 23–25 Winter 18.82 20.13 19.10 22.20 21–23
Table 7: Summer simulation data.
OPTION 1 OPTION 2 LIVING R. ROOM LIVING R. ROOM
Ventilated façade
Conventional façade
Conventional façade
Ventilated façade
Summer energetic demand (Kwh/m2) 15.72 17.11 15.41 18.04
Thermal transmittance, U (W//m2K) 0.658 0.689 0.689 0.658
Indoor air temperature (°C) 23.85 25.34 23.83 25.40
Surface temperature (°C) 23.74 24.93 23.62 25.11
Radiant temperature (°C) 24.40 25.66 24.36 25.75
Operating temperature (°C) 24.12 25.50 24.09 25.58
To according to RITE (°C) 23–25
www.witpress.com, ISSN 1746-4498 (on-line) WIT Transactions on The Built Environment, Vol 171, © 2017 WIT Press
50 Structural Studies, Repairs and Maintenance of Heritage Architecture XV
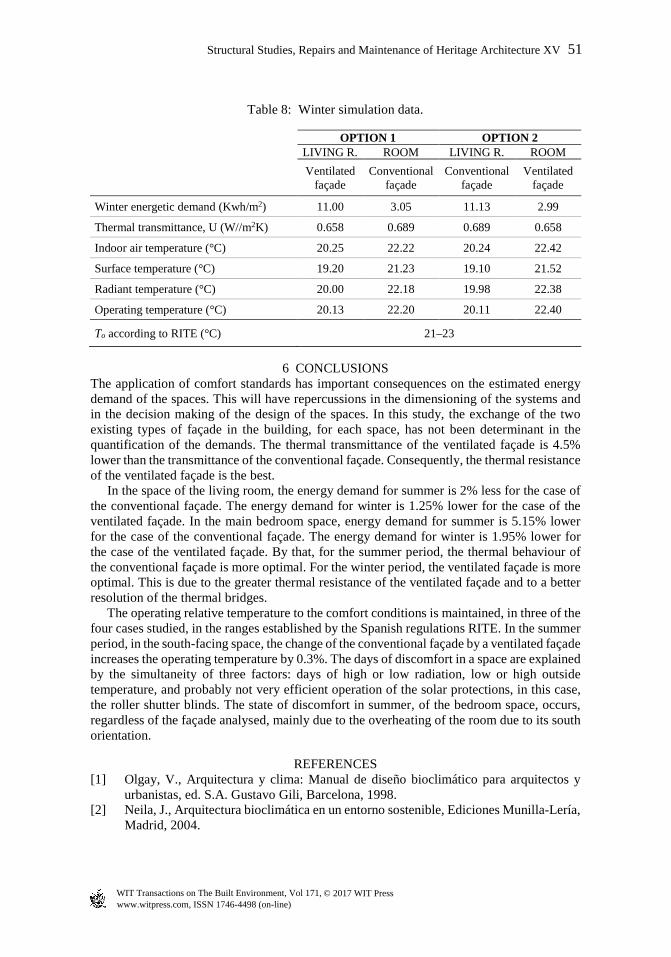
Table 8: Winter simulation data.
OPTION 1 OPTION 2 LIVING R. ROOM LIVING R. ROOM Ventilated
façade Conventional
façade Conventional
façade Ventilated
façade
Winter energetic demand (Kwh/m2) 11.00 3.05 11.13 2.99
Thermal transmittance, U (W//m2K) 0.658 0.689 0.689 0.658
Indoor air temperature (°C) 20.25 22.22 20.24 22.42
Surface temperature (°C) 19.20 21.23 19.10 21.52
Radiant temperature (°C) 20.00 22.18 19.98 22.38
Operating temperature (°C) 20.13 22.20 20.11 22.40
To according to RITE (°C) 21–23
6 CONCLUSIONS The application of comfort standards has important consequences on the estimated energy demand of the spaces. This will have repercussions in the dimensioning of the systems and in the decision making of the design of the spaces. In this study, the exchange of the two existing types of façade in the building, for each space, has not been determinant in the quantification of the demands. The thermal transmittance of the ventilated façade is 4.5% lower than the transmittance of the conventional façade. Consequently, the thermal resistance of the ventilated façade is the best. In the space of the living room, the energy demand for summer is 2% less for the case of the conventional façade. The energy demand for winter is 1.25% lower for the case of the ventilated façade. In the main bedroom space, energy demand for summer is 5.15% lower for the case of the conventional façade. The energy demand for winter is 1.95% lower for the case of the ventilated façade. By that, for the summer period, the thermal behaviour of the conventional façade is more optimal. For the winter period, the ventilated façade is more optimal. This is due to the greater thermal resistance of the ventilated façade and to a better resolution of the thermal bridges. The operating relative temperature to the comfort conditions is maintained, in three of the four cases studied, in the ranges established by the Spanish regulations RITE. In the summer period, in the south-facing space, the change of the conventional façade by a ventilated façade increases the operating temperature by 0.3%. The days of discomfort in a space are explained by the simultaneity of three factors: days of high or low radiation, low or high outside temperature, and probably not very efficient operation of the solar protections, in this case, the roller shutter blinds. The state of discomfort in summer, of the bedroom space, occurs, regardless of the façade analysed, mainly due to the overheating of the room due to its south orientation.
REFERENCES [1] Olgay, V., Arquitectura y clima: Manual de diseño bioclimático para arquitectos y
urbanistas, ed. S.A. Gustavo Gili, Barcelona, 1998. [2] Neila, J., Arquitectura bioclimática en un entorno sostenible, Ediciones Munilla-Lería,
Madrid, 2004.
www.witpress.com, ISSN 1746-4498 (on-line) WIT Transactions on The Built Environment, Vol 171, © 2017 WIT Press
Structural Studies, Repairs and Maintenance of Heritage Architecture XV 51
[3] Ruano, M. (director), Un Vitruvio ecológico. Principios y práctica del proyecto arquitectónico sostenible, ed. S.A. Gustavo Gili, Barcelona, 2007.
[4] Akbari, H., Levinson, R. & Rainer, L., Monitoring the energy-use effects of cool roofs on California commercial buildings. Energy & Buildings, (37), pp. 1007–1016, 2002.
[5] León, A., Muñoz, S., León, J. & Bustamante, P., Monitorización de variables medioambientales y energéticas en la construcción de viviendas protegidas: Edificio Cros-Pirotecnia en Sevilla. Informes de la Construcción, 62(519), pp. 67–82, 2010.
[6] UNE-EN ISO 13786:2011, Prestaciones térmicas de los productos y componentes para edificación. Características térmicas dinámicas. Métodos de cálculo.
[7] Documento de Apoyo al Documento Básico Ahorro de energía, DA DB-HE/1, Cálculo de parámetros característicos de la envolvente, Código Técnico de la Edificación, Normativa Española.
[8] Versión actualizada del Real Decreto 1027/2007, de 20 de julio, por el que se aprueba el Reglamento de Instalaciones Térmicas en los Edificios, teniendo en cuenta las correcciones de errores y modificaciones realizadas sobre el mismo a partir de su publicación en el B.O.E. del 29 de agosto de 2007.
[9] Echarri Iribarren, V., Galiano Garrigós, A.L. & González Avilés, Á.B., Cerámica y climatización saludable: paneles cerámicos radiantes en edificios. Condiciones de confort y demanda energética frente a sistemas convectivos. Informes de la Construcción, 68(544), p. e161, 2016. DOI: http://dx.doi.org/10.3989/ic.15.160.m15.
[10] Barrios, G., Huelsz, G. & Rojas, J., Thermal performance of envelope wall/roofs of intermittent air-conditioned rooms. Applied Thermal Engineering, (40), pp. 1–7, 2012.
[11] Andarini, R., The role of building thermal simulation for energy efficient building design. Energy Procedia, (47), pp. 217–226, 2014.
[12] Sala Lizarraga, J.M., Transmisión de calor en edificios. Arquitectura Ecoeficiente (Vol. I, Chap. 2), eds R. Hernández et al., Servicio Editorial de la UPV/ EHU: San Sebastián, 2012.
[13] Mustafaraj, G., Marini, D., Costa, A. & Keane, M., Model calibration for building energy efficiency simulation. Applied Energy, (130), pp. 72–85, 2014.
[14] Raftery, P., Keane, M. & O’Donnell, J., Calibrating whole building energy models: An evidence-based methodology. Energy & Buildings, (43), pp. 2356–2364, 2011.
www.witpress.com, ISSN 1746-4498 (on-line) WIT Transactions on The Built Environment, Vol 171, © 2017 WIT Press
52 Structural Studies, Repairs and Maintenance of Heritage Architecture XV