Embed Size (px)
Citation preview
The Regulatory Assistance ProjectChinaEuropean UnionUnited States
www.raponline.org
Energy Efficiency Obligations: the UK experience
Presentation to the WC Conference
Warsaw, 25 October 2012
Eoin Lees, Senior Advisor Europe
Regulatory Assistance Project (RAP)
Non-profit organization providing technical and policy assistance to government officials on energy and environmental issues
Principals and senior associates are all former regulators or energy officials with deep experience in energy efficiency and other clean energy alternatives
Funded by several foundations, US DOE & EPA and international agencies & philanthropic organisations
RAP has advised governments in over 18 nations and 40 US states; European office in Brussels.
Contents
Energy efficiency obligations/ White Certificates
GB experience of Energy Efficiency Obligations (EEOs)
Recent developments in EU-27
Do EEOs work i.e. do they actually turn down demand?
EEOs & Openly Tradable WCs
All such activities in EU whether called EEOs or WCs operate the same principle – obligation requires energy provider to prove their activities have resulted in energy efficiency improvements by eligible end use customers - awarded a White Certificate accrediting the extent of the energy savings achieved
Openly tradable WCs are when parties other than the obligated energy providers can earn WCs in their own right and trade them in the market place – really only in Italy, with limited trading in France
GB & Energy Efficiency Obligations
Been on electricity retailers since 1994, gas since 2000Been steadily growing in terms of energy retailer spend
and activity – now only residential sectorEEC2 results (April 2005-March 2008) very positiveFrom April 2008 called CERT with a lifetime CO2 saving
target (undiscounted); financial savings discounted at 3.5%; 40% savings target for low income households
My current estimate of expenditure in CERT by energy retailers is ~€1.4 billion/year or per fuel bill increase per year ~€34 equivalent to ~4% of average GB residential dual fuel bill.
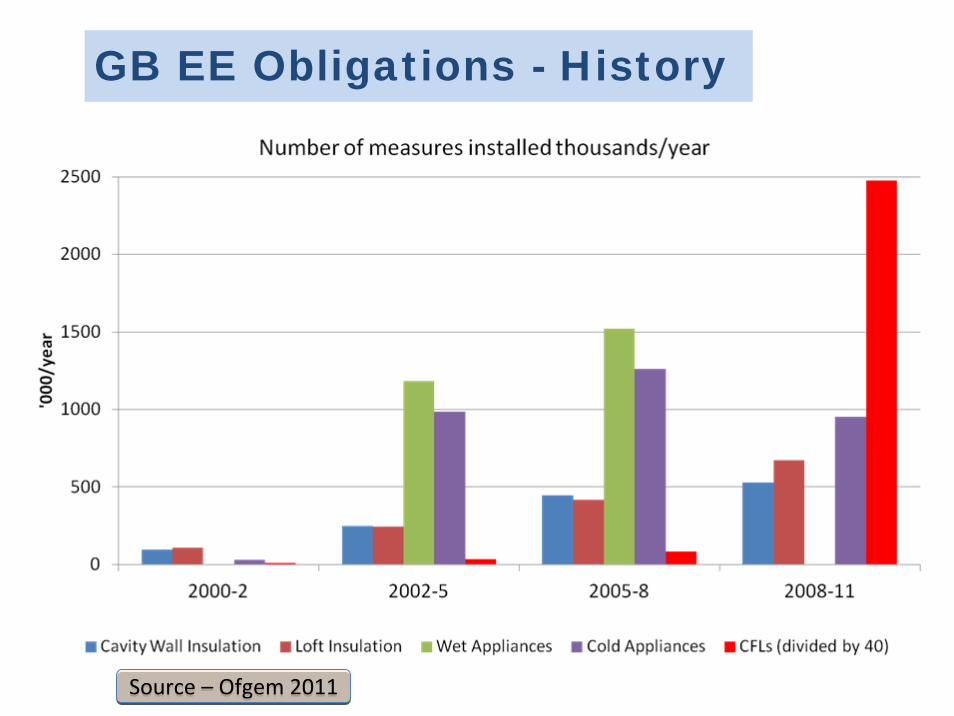
GB EE Obligations - History
Source – Ofgem 2011Source – Ofgem 2011
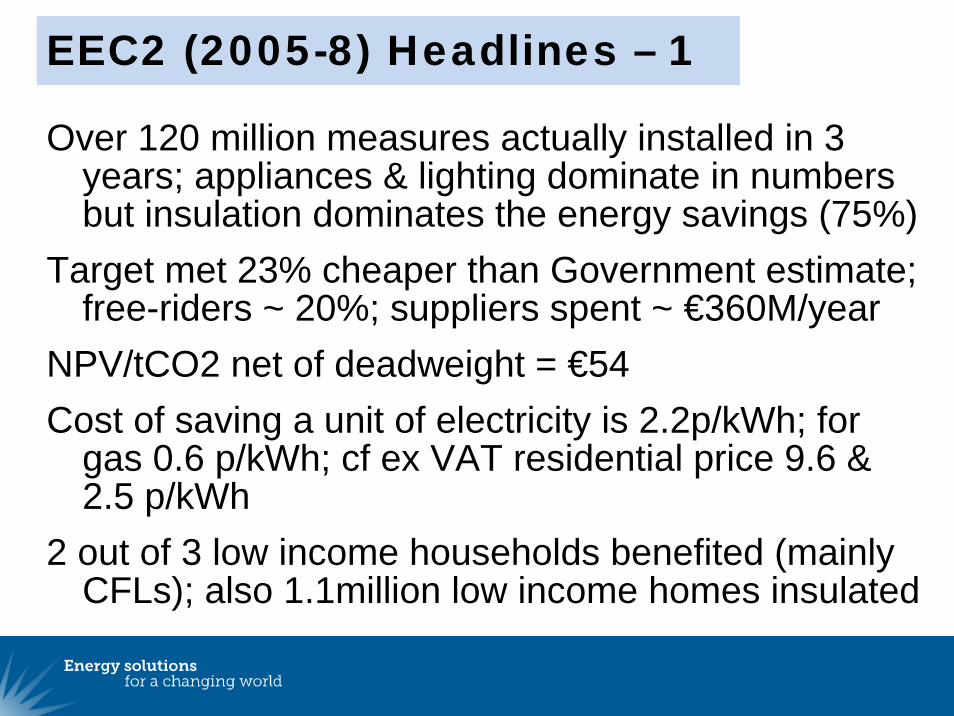
EEC2 (2005-8) Headlines – 1
Over 120 million measures actually installed in 3 years; appliances & lighting dominate in numbers but insulation dominates the energy savings (75%)
Target met 23% cheaper than Government estimate; free-riders ~ 20%; suppliers spent ~ €360M/year
NPV/tCO2 net of deadweight = €54Cost of saving a unit of electricity is 2.2p/kWh; for
gas 0.6 p/kWh; cf ex VAT residential price 9.6 & 2.5 p/kWh
2 out of 3 low income households benefited (mainly CFLs); also 1.1million low income homes insulated
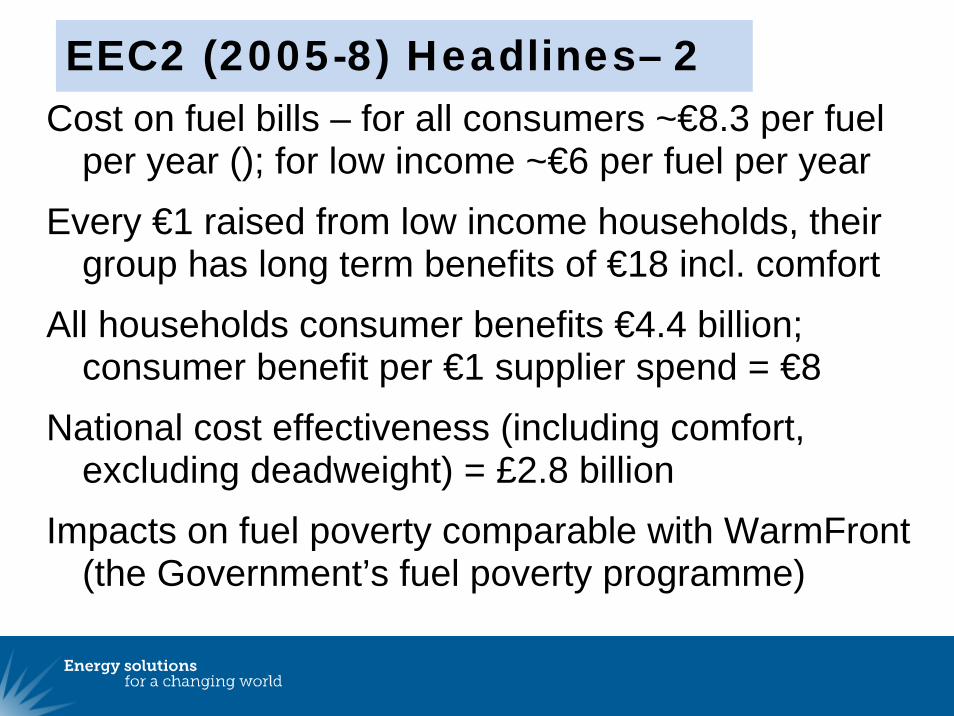
EEC2 (2005-8) Headlines– 2Cost on fuel bills – for all consumers ~€8.3 per fuel
per year (); for low income ~€6 per fuel per yearEvery €1 raised from low income households, their
group has long term benefits of €18 incl. comfortAll households consumer benefits €4.4 billion;
consumer benefit per €1 supplier spend = €8National cost effectiveness (including comfort,
excluding deadweight) = £2.8 billionImpacts on fuel poverty comparable with WarmFront
(the Government’s fuel poverty programme)
Carbon Emissions Reduction Target (CERT)
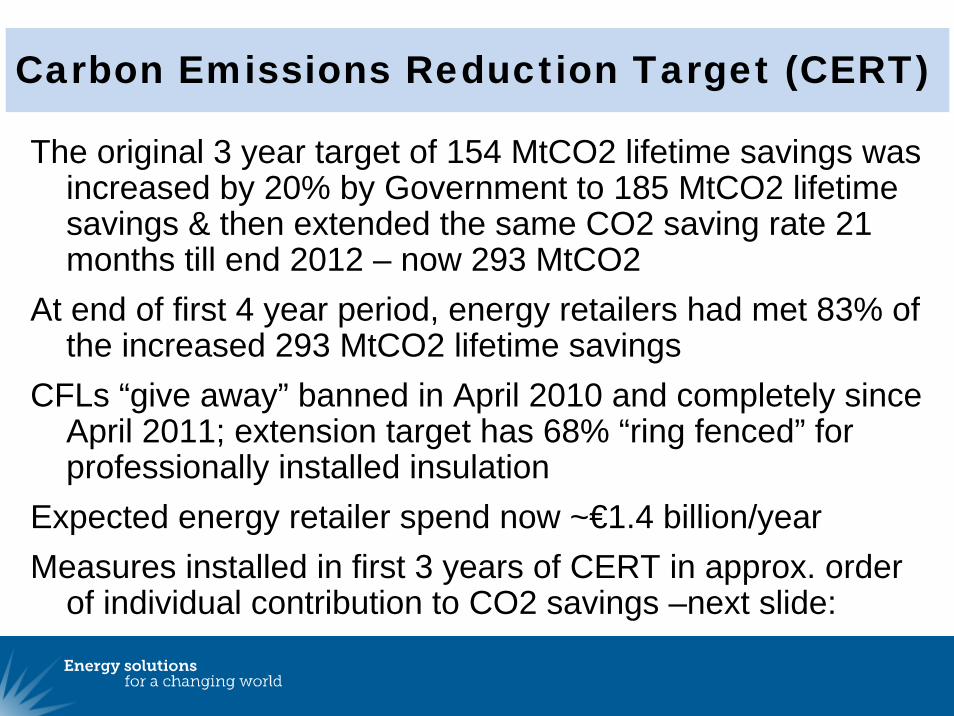
The original 3 year target of 154 MtCO2 lifetime savings was increased by 20% by Government to 185 MtCO2 lifetime savings & then extended the same CO2 saving rate 21 months till end 2012 – now 293 MtCO2
At end of first 4 year period, energy retailers had met 83% of the increased 293 MtCO2 lifetime savings
CFLs “give away” banned in April 2010 and completely since April 2011; extension target has 68% “ring fenced” for professionally installed insulation
Expected energy retailer spend now ~€1.4 billion/yearMeasures installed in first 3 years of CERT in approx. order
of individual contribution to CO2 savings –next slide:
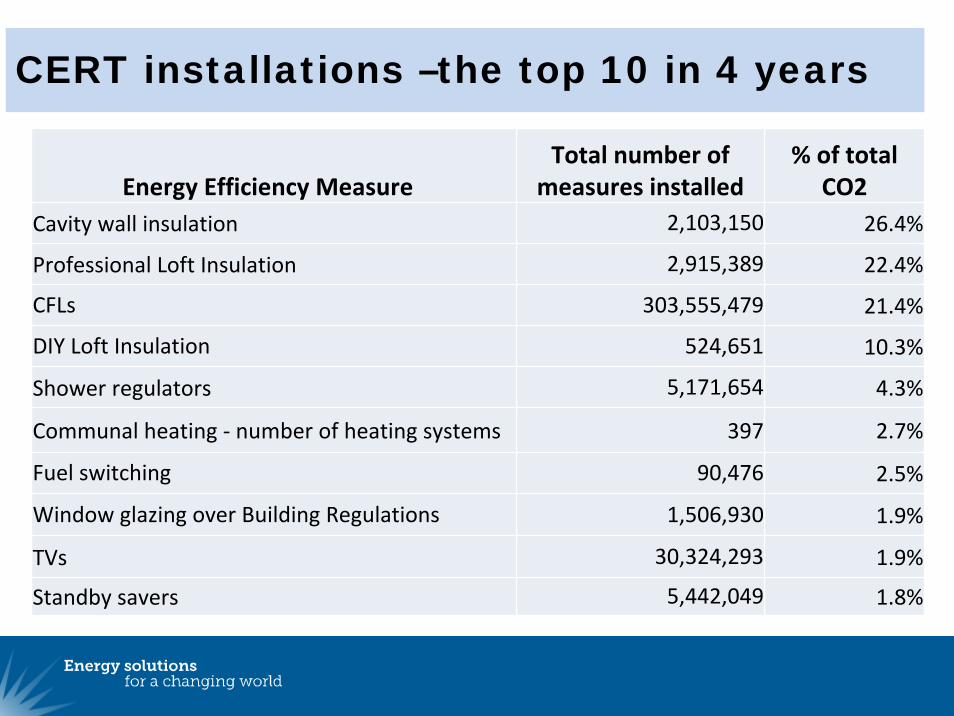
CERT installations –the top 10 in 4 years
Energy Efficiency Measure Total number of
measures installed% of total
CO2Cavity wall insulation 2,103,150 26.4%
Professional Loft Insulation 2,915,389 22.4%
CFLs 303,555,479 21.4%
DIY Loft Insulation 524,651 10.3%
Shower regulators 5,171,654 4.3%
Communal heating ‐ number of heating systems 397 2.7%
Fuel switching 90,476 2.5%
Window glazing over Building Regulations 1,506,930 1.9%
TVs 30,324,293 1.9%
Standby savers 5,442,049 1.8%
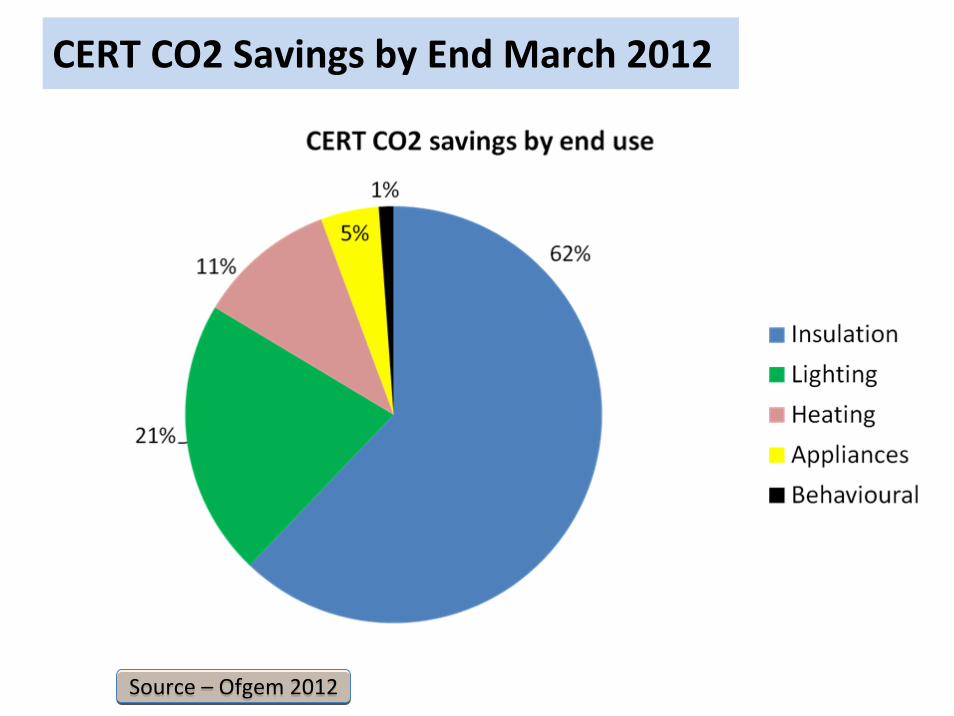
CERT CO2 Savings by End March 2012
Source – Ofgem 2012Source – Ofgem 2012
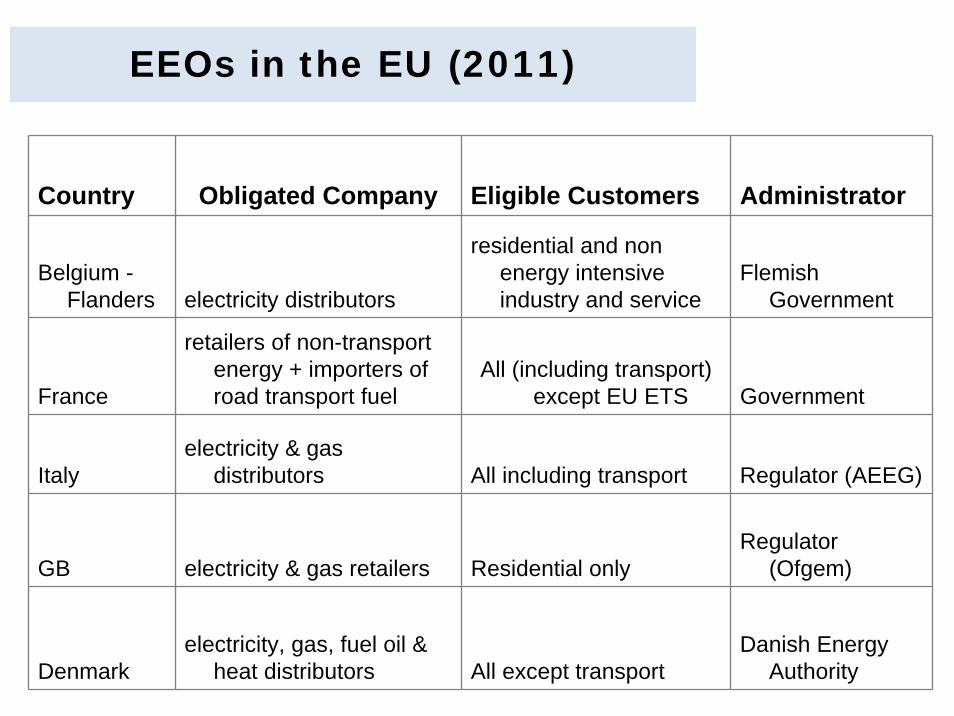
EEOs in the EU (2011)
Country Obligated Company Eligible Customers Administrator
Belgium -Flanders electricity distributors
residential and non energy intensive industry and service
Flemish Government
France
retailers of non-transport energy + importers of road transport fuel
All (including transport) except EU ETS Government
Italyelectricity & gas
distributors All including transport Regulator (AEEG)
GB electricity & gas retailers Residential onlyRegulator
(Ofgem)
Denmarkelectricity, gas, fuel oil &
heat distributors All except transportDanish Energy
Authority
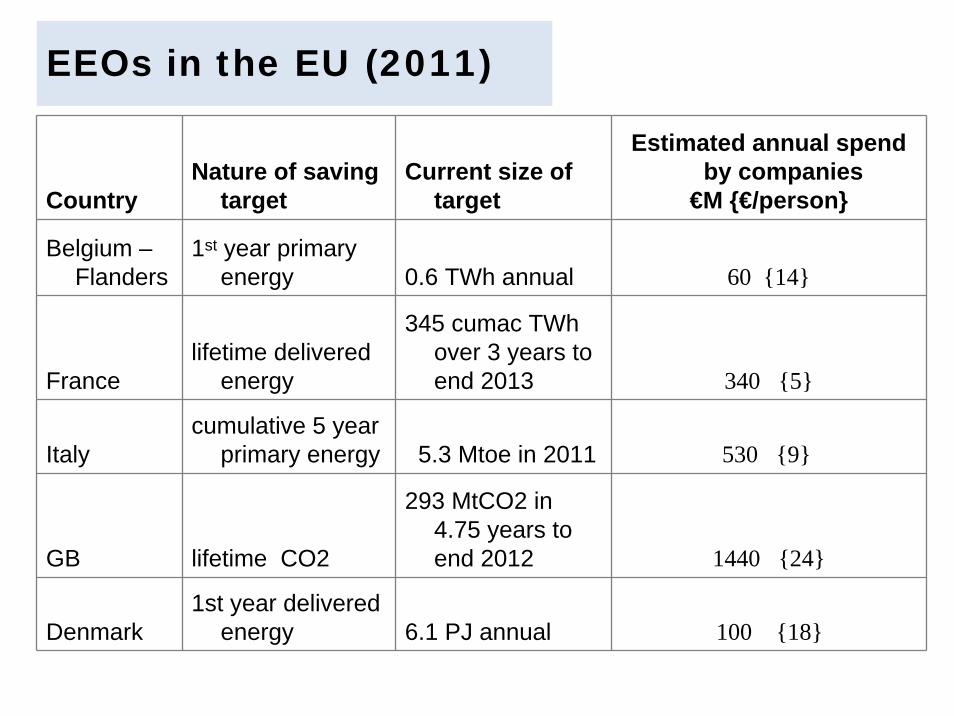
EEOs in the EU (2011)
CountryNature of saving
targetCurrent size of
target
Estimated annual spend by companies
€M {€/person}
Belgium –Flanders
1st year primary energy 0.6 TWh annual 60 {14}
Francelifetime delivered
energy
345 cumac TWh over 3 years to end 2013 340 {5}
Italycumulative 5 year
primary energy 5.3 Mtoe in 2011 530 {9}
GB lifetime CO2
293 MtCO2 in 4.75 years to end 2012 1440 {24}
Denmark1st year delivered
energy 6.1 PJ annual 100 {18}
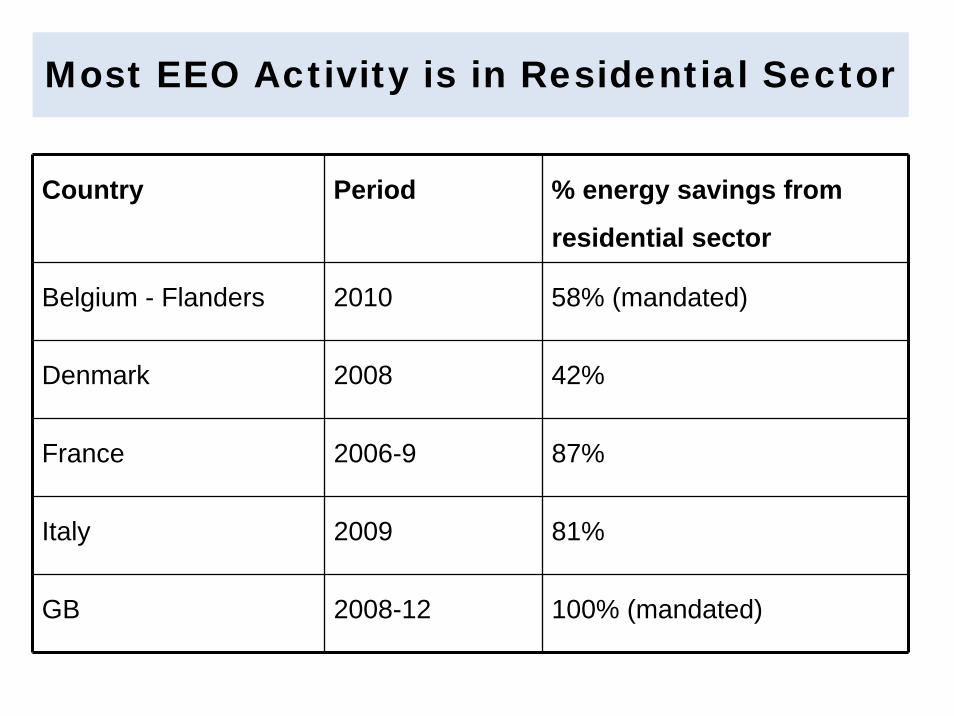
Most EEO Activity is in Residential Sector
Country Period % energy savings from
residential sector
Belgium - Flanders 2010 58% (mandated)
Denmark 2008 42%
France 2006-9 87%
Italy 2009 81%
GB 2008-12 100% (mandated)
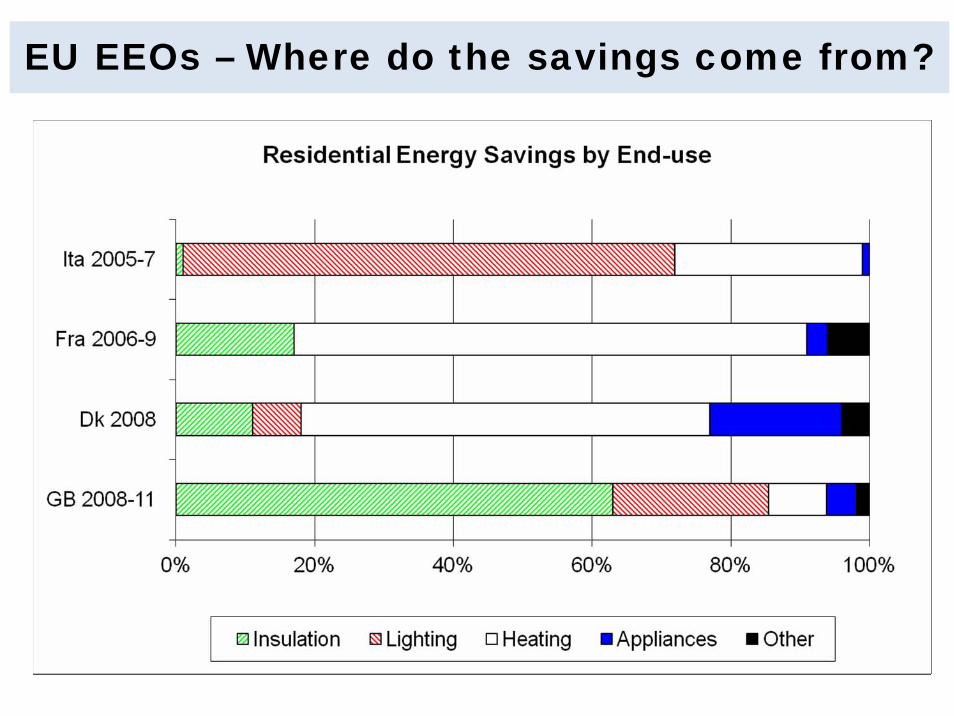
EU EEOs – Where do the savings come from?
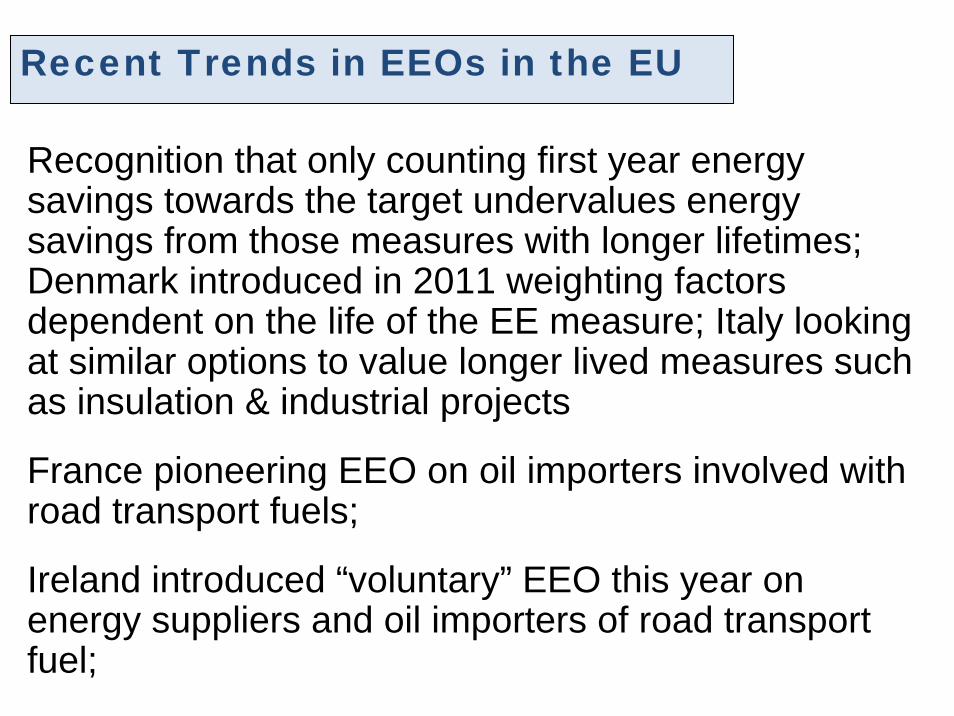
Recognition that only counting first year energy savings towards the target undervalues energy savings from those measures with longer lifetimes; Denmark introduced in 2011 weighting factors dependent on the life of the EE measure; Italy looking at similar options to value longer lived measures such as insulation & industrial projects
France pioneering EEO on oil importers involved with road transport fuels;
Ireland introduced “voluntary” EEO this year on energy suppliers and oil importers of road transport fuel;
Recent Trends in EEOs in the EU
Core element in all: EEO (backed by penalties if target missed);
Relatively few schemes in place (7 + 1 imminent) – they vary quite a lot but all judged to deliver successfully
Different targets, different end use sectors, different obliged actors - reflect local status of energy market, the EE history of the utilities, climate, energy saving opportunities, culture etc.; Perhaps more importantly, different rules for measuring “savings” and for dealing with deadweight/free riders
Initial goals set low and achieved at costs below policy makers’expectations; expanded & energy providers now spending ~€3.2 billion/year; in ~50 operational years of EU EEOs, no energy provider missed it’s overall energy saving target
Observations on EEOs in the EU
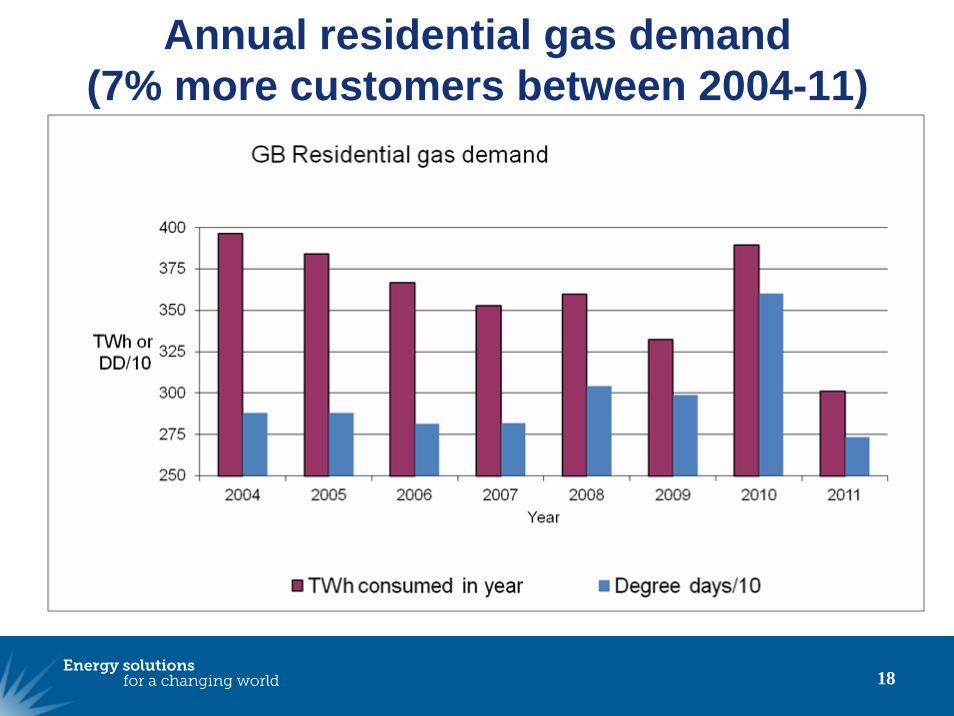
Annual residential gas demand (7% more customers between 2004-11)
18
Is there any evidence that EEOs work? - 1
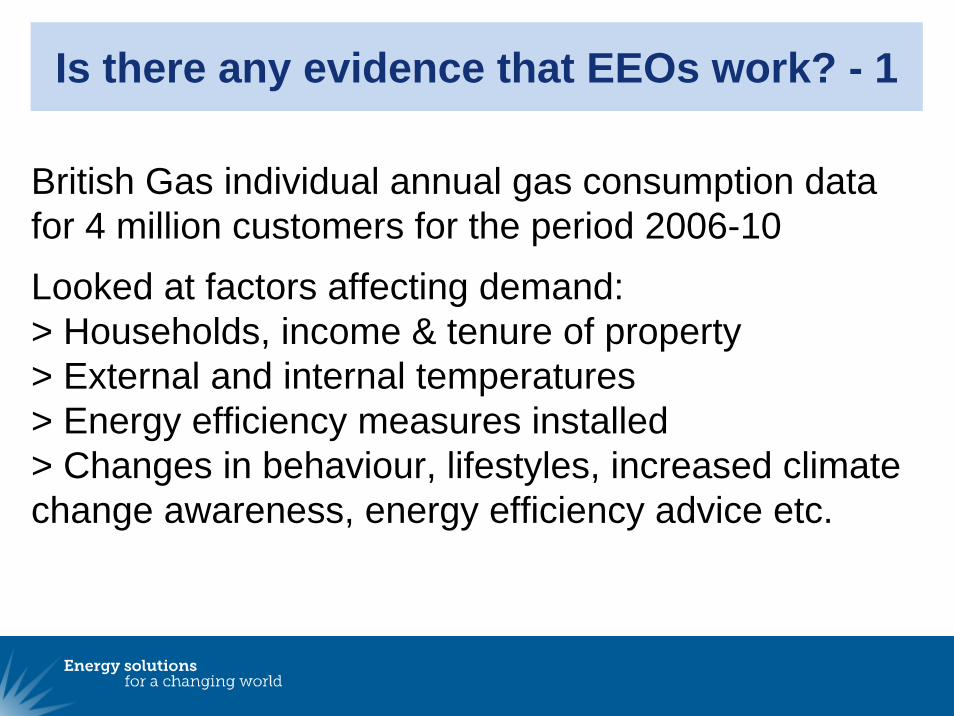
British Gas individual annual gas consumption data for 4 million customers for the period 2006-10Looked at factors affecting demand:> Households, income & tenure of property> External and internal temperatures> Energy efficiency measures installed> Changes in behaviour, lifestyles, increased climate change awareness, energy efficiency advice etc.
Is there any evidence that EEOs work? - 2
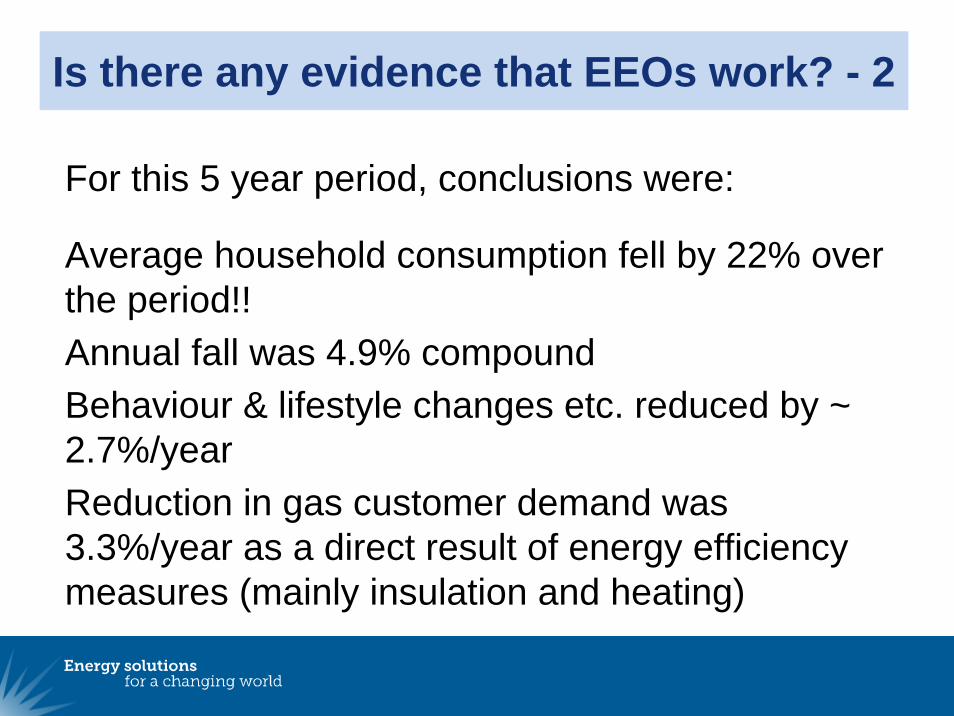
For this 5 year period, conclusions were:
Average household consumption fell by 22% over the period!!Annual fall was 4.9% compound Behaviour & lifestyle changes etc. reduced by ~ 2.7%/year Reduction in gas customer demand was 3.3%/year as a direct result of energy efficiency measures (mainly insulation and heating)
Conclusions on EU EEOsDespite wide variation in the implementation of EEOs& energy market liberalisation status, they have been successful policy toolsMSs with EEOs have evaluated their programmes and expanded them in recent timesIn the largest EEO, over the last 5 years they are contributing to a significant reduction in residential gas demand (22% reduction)EEOs avoid MS Government having to use public expenditure to stimulate EE – relevant to the current financial problems facing MSs