Embed Size (px)
Citation preview

ENERGY EFFICIENCY MANUAL FOR PIGS AND POULTRY FARMS

ENERGY EFFICIENCY MANUAL
FOR PIGS AND POULTRY FARMS
Belgrade, January 2017
The Manual has been prepared and published within the project „Further Implementation of the IPPC/IE Directive in the Intensive Rearing of Poultry and Pigs” implemented by the
Cleaner Production Centre of the Faculty of Technology and Metallurgy, University of Belgrade and funded by the Swedish International Development Cooperation Agency

Authors: Dr Mirjana Stamenić, Dr Johannes Fresner, Christina Krenn, Dr Mirjana Kijevčanin, Bojana Vukadinović
Energy Efficiency Manual for pigs and poultry farms
Reviewers:Prof. Dr Ivanka PopovićProf. Dr Đorđe JanaćkovićProf. Dr Petar Uskoković
Publisher:Faculty of Technology and MetallurgyUniversity of BelgradeBelgrade, Karnegijeva 4
For the publisher:Prof. Dr Đorđe Janaćković, Dean
Editors:Bojana VukadinovićDoc. Dr Mirjana StamenićProf. Dr Mirjana Kijevčanin
Chief editor:Prof. Dr Karlo Raić
Graphics processing and Design:W STUDIOS, Aleksandra Jovanić
Circulation: 300
ISBN: 978-86-7401-342-7
Print:Vizartis d.o.o. Beograd
All rights reserved to Faculty of Technology and Metallurgy, University of Belgrade © 2017.
TABLE OF CONTENTSKeynote address from the Embassy of Sweden in Serbia .............................................................5Keynote address from the Faculty of Technology and Metallurgy of the University of Belgrade ...7Acronyms and abbreviations ......................................................................................................9
1 Introduction .................................................................................................................................111.1 Linkage between energy efficiency and application for integrated permit ...........................111.2 How to use this Manual .....................................................................................................12
2 Energy efficiency as a management approach ..............................................................................152.1 Introduction to energy management ..................................................................................152.2 Integrated management systems .......................................................................................162.3 Elements of an energy management system in detail and reference to BAT recommendations ......................................................................172.4 Planning objectives and targets .........................................................................................18
2.4.1 Continuous improvement .........................................................................................182.4.2 Energy audit .............................................................................................................182.4.3 Identification of energy efficiency options .................................................................252.4.4 Tools ........................................................................................................................262.4.5 Identification of opportunities to optimise energy recovery .......................................272.4.6 System approach ......................................................................................................282.4.7 Process integration ...................................................................................................29
2.5 Procedures .........................................................................................................................302.5.1 Structure and responsibilities ....................................................................................302.5.2 Training, awareness and competence .......................................................................312.5.3 Communication ........................................................................................................322.5.4 Employee involvement ..............................................................................................322.5.5 Documentation of the energy management system ..................................................332.5.6 Effective control of processes....................................................................................332.5.7 Maintenance ............................................................................................................342.5.8 Safeguarding compliance with energy efficiency related legislation and agreements ....................................................................35
2.6 Benchmarking and comparison ..........................................................................................362.6.1 Establishment of energy indicators and systematic comparison ................................36
2.7 Checking performance .......................................................................................................382.7.1 Monitoring and measurement ..................................................................................382.7.2 Corrective and preventive action...............................................................................402.7.3 Maintenance of reports and records .........................................................................40
2.8 Review of the energy management system .........................................................................412.8.1 Maintaining impetus ................................................................................................41
2.9 Development of ENE technologies ......................................................................................423 Energy efficiency measures ..........................................................................................................43
3.1 Combustion .......................................................................................................................433.2 Steam and hot water systems .............................................................................................463.3 Heat recovery .....................................................................................................................51
Although every effort has been made in processing and presenting data and related materials from this publication, it is not possible to guarantee full accuracy thereof. The results directly or indirectly resulting from this publication, as well as presented information, cannot be the only basis for making decisions, and authors of this publication cannot bear any material or other responsibility for damages possibly occasioned due to direct or indirect use thereof. Neither the Faculty of Technology and Metallurgy of the University of Belgrade, nor the competent authorites accept any responsibility whatsoever for loss or damage occasioned, or claimed to have been occasioned, in part or in full as a consequence of any person acting or refraining from acting, as a result of a matter contained in this publication. All or part of this publication may be reproduced without further permission, provided the source is acknowledged.
3.4 Cogeneration .....................................................................................................................533.5 Electric power supply .........................................................................................................563.6 Electric motor driven systems .............................................................................................593.7 Compressed air systems .....................................................................................................613.8 Pumping systems ...............................................................................................................633.9 HVAC (heating, ventilation, air conditioning) ......................................................................653.10 Lighting systems ..............................................................................................................753.11 Drying and separation ......................................................................................................793.12 Tractors and transport mechanization ..............................................................................81
4 Advanced practices ......................................................................................................................834.1 Biogas, CHP .......................................................................................................................834.2 Heat pumps .......................................................................................................................874.3 Solar systems, photovoltaics ..............................................................................................90
5 Supporting tools and templates ...................................................................................................935.1 Tools ..................................................................................................................................93
5.1.1 Boiler efficiency ........................................................................................................935.1.2 Air compressor leakages ...........................................................................................955.1.3 Lights .......................................................................................................................965.1.4 Frequency controlled drives ......................................................................................965.1.5 Water heating ..........................................................................................................965.1.6 Heat losses from pipes .............................................................................................975.1.7 Heat recovery ...........................................................................................................995.1.8 Fuel switching ........................................................................................................100
5.2 Report template ...............................................................................................................1015.2.1 Tool for BAT assessment .........................................................................................1015.2.2 Energy efficiency action plan ..................................................................................101
Appendix: Energy efficiency action plan ........................................................................................103Literature ......................................................................................................................................113
5
Embassy of Sweden in Belgrade
Sweden strongly believes in Energy Efficiency as a pillar for future sustainable development. Its Governments have invested heavily in the search for alternative energy sources ever since the oil crisis of the early 1970s and this effort has resulted in lower consumptions and carbon emissions. Sweden managed to reach its goal of a 50 per cent renewable energy share several years ahead of the Swedish government’s 2020 schedule, in 2012. The most recent figure of 52 per cent for renewable energy – including electricity, district heating and fuel – is the highest in the EU.
These results have been achieved also by the correct and effective planning of measures for industries, providing them with a clear legal framework and a set of tools that supported them in programming their investment plans and reaching significant objectives in terms of energy saving.
For these reasons, SIDA considers Energy Efficiency a priority topic in the frame of environmental protection and strongly supported its inclusion in the project IPPC farms. The Swedish experience shows that significant advantages can be obtained by intensive rearing operators through a modern and balanced set of energy efficiency measures, resulting also in a mid-term improvement of the quality of the environment. The present Manual is, thus, considered an important output of the project, setting up a correct frame for the introduction of the Energy Efficiency Directive in Serbia and providing Serbian operators with practical and immediately applicable tools to improve their performances, while anticipating the targets that will be mandatory when the Country will join the EU.

7
Project IPPC Farms
Energy Efficiency has gained high importance in the field of environmental protection since it is a major pillar of sustainability as a concept for industrial development. Moreover, higher efficiency means lower consumptions and costs providing, in this way, operators with more financial possibilities to invest in technical development and environmental protection. Within its legal framework, the EU has moved forward to include it in the frame of Circular Economy, thus representing a significant part of integrated industrial pollution prevention. Through a specific Directive, the European Union has set up the strategic framework of rules and obligations needed to reach 2020 energy efficiency target.
Intensive rearing sector has significant room for improvements in the field of energy efficiency in terms of savings but also re-use of manure and by-products as a source of additional energy. Technical progress in the field of construction, ventilation and other topics related to energy consumption has reached very advanced level but it is not always well known by operators in the agricultural sector. This Manual is aimed to provide operators with clear explanations of the Best Available Techniques for Energy Efficiency while describing the possible applicable solutions to fulfil them and increase the advantages connected to energy saving. Thanks to a proficient cooperation with the Faculty of Mechanical Engineering and the contribution of international experts with a long experience in the field, we have a Manual which is not only for operators who are obliged to obtain integrated permits, but for all pigs and poultry farms in Serbia.. It will support them in a long-term planning of the necessary investment to fulfil IPPC and EE requirements while saving resources that will provide them with the possibility of further investments for the development of their activity.
Finally, special thanks goes to the Ministry of Agriculture and Environmental Protection for their availability and cooperation during the preparation of the Manual. Their support helped to maintain the necessary coherence between energy efficiency measures and Serbian legal framework on environment, thus strengthening the importance of the Manual in the frame of IPPC Directive implementation. Also, we thank to the Swedish International Development Cooperation Agency and the Embassy of Sweden, without whose financial support would not be possible to implement this project.
Project Team

9
ACRONYMS AND ABBREVIATIONS
BAT Best Available Techniques
BREF Reference Document on Best Available Techniques
BREF EFS BREF for Emissions from Storage
BREF ENE BREF for Energy efficiency
EC European Commission
EED Energy Efficiency Directive
EE Energy Efficiency
ELVs Emission Limit Values
EMAS Eco-Management and Audit Scheme
EMS Environmental Management System
EU European Union
IED Industrial Emissions Directive
IPPC Integrated Pollution Prevention and Control
ISO International Organization for Standardization
ISS Institute for Standardization of Serbia
LPG Liquefied Petroleum Gas
LSG Local Self-Governments
OG Official Gazette
RS Republic of Serbia
SIDA Swedish International Development Cooperation Agency
Introduction 11
INTRODUCTION
LINKAGE BETWEEN ENERGY EFFICIENCY AND APPLICATION FOR INTEGRATED PERMITThe concept of energy efficiency is generally accepted throughout the world. Different levels of social organisations distinguish reasons for putting the energy efficiency in the focus of interests and activities. At the international community level, the reason for that is to reduce adverse environmental impacts, while at the state level, the reasons include undisturbed energy supply, international obligations related to environmental protection and conservation, reduction of costs and increased competitiveness of industry, while at the company level, the reasons are related to profit and competitiveness of the market.
Improved energy efficiency pertains to reduction of energy used in manufacture of a product, for service provision, or for some conducted activity. Improvement of energy efficiency is usually related to technological enhancements, but it can also be a result of better organisation or improvement of economic position of a producer/provider. Energy efficiency should not be equalised to savings or reduced consumption which could be a consequence of either energy shortages for certain activity, or excessive price of energy. In such case, there would be reduction in production scope or deterioration of service/activity quality. Measures of this type do not necessarily bring better economic effects, quite often they may even have negative effects, and cannot be classified as measures for the improvement of energy efficiency.
From economic aspect, energy efficiency has broader meaning and pertains to the reduction of energy consumption per unit of gained monetary result (Gross National Product at the state level, or gained profit or total revenue at the company level). This means that energy efficiency is related to economic efficiency and it includes technological and economic alterations, and changes in behaviour.
The Integrated Pollution Prevention and Control Directive – IPPC Directive 2008/1/EC established a framework which requires from member states to issue permits to installations carrying out activities listed in Annex 1 of the Directive, which include rearing of poultry and pigs with capacities for more than 40,000 places for poultry, more than 2,000 pigs (more than 30 kg weight) or for more than 750 sows.
The IPPC Directive has been transposed into Serbian legislation through the Law on Integrated Pollution Prevention and Control ("Official Gazette of RS", No. 135/2004 and 25/2015) and related bylaws. Integrated permits take into account the overall environmental impact (e.g. air, water, soil emissions) of an installation, and the permit, inter alia, includes energy efficiency as one of crucial matters defined by the IPPC Directive.
The main requirement related to environmental protection pertains to application of "best available techniques" (BAT), which actually mean most recent phases in the development of certain activity and include not only technologies in place, but also the way the facility functions, maintenance and closing and decommission, once the time comes. In the definition of BAT, "available" stands for economically and technically feasible and justified, having taken into account costs and advantages.
1
1.1

Introduction12
Installations obliged to obtain integrated permits, shall submit within the set of required documents the comparison to best available techniques, which is to determine environmental impacts of an installation or activity conducted on a specific location. The higher the level of compliance, the lower the environmental and human health impacts are.
The EU Commission publishes BAT Reference Documents (BREF documents) so as to assist authorities responsible for permitting, and companies in determining best available techniques. Each BREF document refers to a specific industrial sector (vertical BREF) or to a horizontal topic, which is the case with energy efficiency.
BREF document for energy efficiency (Reference Document on Best Available Techniques on Energy Efficiency (ENE), 2009) is applicable to all IPPC installations since it provides guidelines and conclusions on what is deemed BAT for energy efficiency in general sense for all activities listed in Annex 1 of IPPC Directive. The document described 29 best available techniques which can be divided in two groups:
General BAT for the achievement of energy efficiency at the level of an entire installation (BAT 1 - 16)
BAT for the achievement of energy efficiency in systems, processes, activities or equipment (BAT 17- 29)
This Manual is based on BREF document for energy efficiency and follows the structure of that BREF. Yet, description of best available techniques is tailored to the sector for intensive rearing and, where possible, examples and explanations are provided with regard how certain technique could be applied on farms.
The Manual, in addition, describes some techniques not included in the BREF (such as use of renewable energy sources), but can be taken into consideration for farms, and implementation of which could generate significant savings and positive environmental impacts.
Pursuant to Article 9 of the Law on Integrated Pollution Prevention and Control, the application for integrated permit obligatory includes the plan of measures for efficient use of energy to be drafted and submitted by the applicant. The form and the structure of the plan are not specifically defined, but the plan in general should contain the following:
Basic information about the operator, Data about the type, used quantities and costs for fuel and energy used, Main characteristics, operational mode and procedures for maintenance of most energy intensive equipment,
Indicators of energy consumption and comparison to BAT levels, Plan for implementation of measures for the improvement of energy efficiency at the operator's.
The proposed template for efficient use of energy has been attached hereto.
HOW TO USE THIS MANUALThe Manual for Efficient Use of Energy on Farms for Rearing of Poultry and Pigs in its relevant chapters elaborates in details a broad area of energy efficiency, energy management system, measures for the improvement of energy efficiency, advanced solutions for use of renewable energy sources, plan of measures for efficient use of energy, and last but not least, provides examples for calculation of losses and saving effects in some systems for energy and energy fluids supply.
1.2
Introduction 13
Chapter "Energy efficiency as a management approach" addresses the concept for introduction of energy management system at the company level, answering the following questions:
Why introducing the energy management system? What minimal requirements should be in place to make the system functional? Which requirements are met by the company if it has introduced an integrated management system?
How is energy management system integrated into the existing organisational structures of a company?
What is the significance of introduction of all employees into the energy management system? What are the main advantages of the energy management system and which effects can be expected by a company in short- and long-term plans pertaining to the improvement of energy efficiency?
What is energy audit, how is it implemented, who implements it and what is the objective of energy audit?
How are measures defined for the improvement of energy efficiency and how are such measures evaluated and ranked?
What is the importance of benchmarking? In what way are effects of proposed measures monitored and what are the procedures for correction of activities if planned goals and achieved results do not match?
Chapter "Measures for the improvement of energy efficiency" addresses individual systems which can be found on farms. Within this chapter, there are sections which separately analyse measures for the improvement of energy efficiency in heat supply systems, such as: steam and hot water boilers, distributing systems for hot water and steam, as well as in systems for condensate return. Within a separate section, optimisation of combustion process through application of appropriate measures is described, such as: reduction of excess air, reduction of flue gas temperature and burner regulation and control based on continual measurement of oxygen content in flue gases. The section addressing recovery of "waste" heat considers the possibilities and potentials for utilisation of energy of hot flue gas from boilers or furnaces, low temperature circuits, as well as possibilities of coupling both hot and cold circuits in the same system. Measures of energy efficiency in systems for energy supply are separately elaborated for transformer plants, electric motor driven systems and for diesel generators. The importance of power factor correction was stressed as a simple measures requiring low investment costs, but significantly influencing reduction of energy bills. Within the analysis of electricity consumers, examples were provided for the improvement of energy efficiency in conveyor systems and mills, which can be commonly found on a farm. Specific sections analysed possibilities for the improvement of energy efficiency in systems for compressed air, pump systems and heating, ventilation and air conditioning systems. Taking into account the fact that lighting system on farms has significant share in electricity bill, options for the improvement of energy efficiency in the systems were specifically addressed, presenting characteristics of some types of light sources. Light sources commonly found on pig and poultry farms were described in details, with specific view to options of LED lighting use as one of most modern options for the improvement of energy efficiency. At the end of the chapter on measures for the improvement of energy efficiency, efficient drying and separation systems were described, providing also option for rationalisation of energy consumption in operation of transport machines and mechanisation which can be found on farms.
Introduction14
Chapter "Advanced practices" analyses the options for implementation of modern technical solutions on farms using renewable energy sources. Relevant sections of this chapter describe biogas cogeneration systems, heating pumps and solar systems, which imply application of solar collectors for preparation of hot water and photovoltaic cells for the production of electricity from solar energy.
The last chapter contains examples for calculation of losses and saving effects in systems for energy and energy fluids supply. This chapter contains the following examples:
Calculation of boiler efficiency level Calculation of losses caused by leakages in the compressed air system Calculating the effects of replacement of the existing inefficient lighting with new highly efficient lamps
Effects of installation of frequency regulator on the existing electric motor Determining needed quantity of heat for water heating Calculating heat losses due to worn insulation on pipelines for steam or hot water Calculating the effects of waste heat recovery from the boiler hot flue gases Effect of fuel switch
As an addendum to this Manual, programmes were drafted to serve the users for faster quantification of losses, as follows:
1. Programme for calculation of losses due to worn insulation and saving effects, if reparation of the existing insulation is conducted, or if the so far non-insulated pipeline sections are insulated.
2. Programme for calculation of losses due to compressed air leakages.3. Programme for calculation of boiler efficiency level and effects of use of "waste" heat from hot
flue gases by installing economiser.
The main purpose of this Manual is to assist farmers in determining best available techniques for energy efficiency and in drafting the plan for efficient use of energy. However, this manual contains measures not included in BREF document (such as renewable energy sources) and can be useful for farms that are not obliged to obtain integrated permit in planning energy efficiency measures. The Manual should be used in conjunction with BAT Assessment Tool so as to identify techniques in place or introduction of which is needed to meet BAT requirements. Although this Manual is based on BREF documents relevant for this sector, it is always necessary to use BREF documents before making a final decision about the process to be applied in the facility to meet requirements from IPPC/IE Directive.
Energy efficiency as a management approach 15
ENERGY EFFICIENCY AS A MANAGEMENT APPROACH
BAT 1
BAT is to implement and adhere to an energy management system (EnMS) that incorporates, as appropriate to the local circumstances, all of the following features given in chapter 2.3.
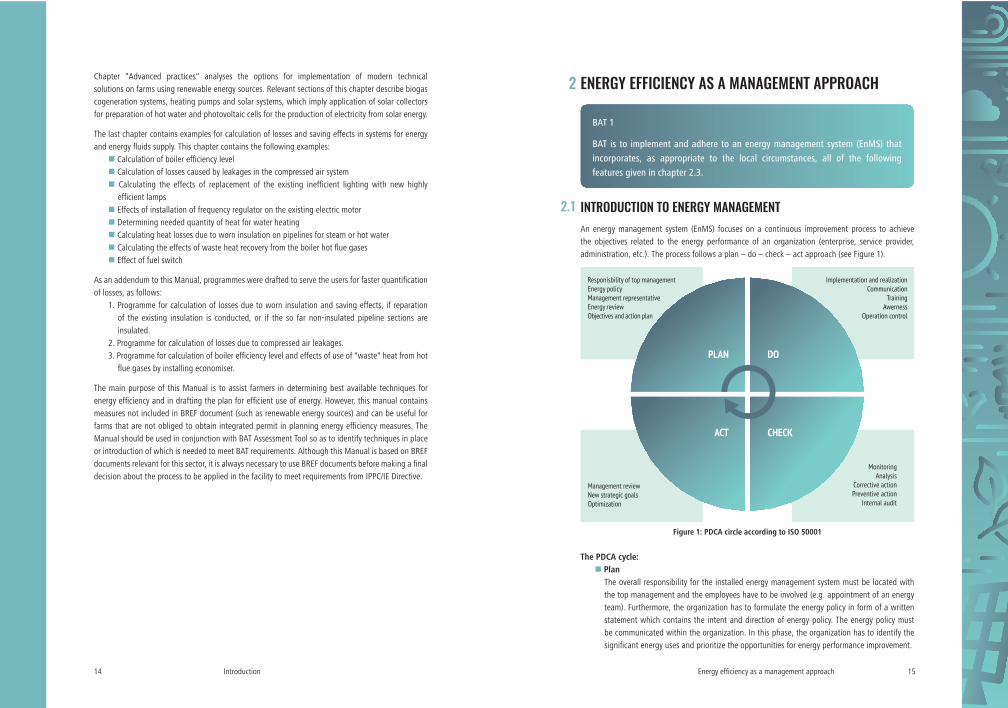
INTRODUCTION TO ENERGY MANAGEMENTAn energy management system (EnMS) focuses on a continuous improvement process to achieve the objectives related to the energy performance of an organization (enterprise, service provider, administration, etc.). The process follows a plan – do – check – act approach (see Figure 1).
MonitoringAnalysis
Corrective actionPreventive action
Internal audit
Implementation and realizationCommunication
TrainingAwerness
Operation control
Responisbility of top managementEnergy policyManagement representativeEnergy reviewObjectives and action plan
Management reviewNew strategic goalsOptimization
PLAN DO
ACT CHECK
Figure 1: PDCA circle according to ISO 50001
The PDCA cycle: PlanThe overall responsibility for the installed energy management system must be located with the top management and the employees have to be involved (e.g. appointment of an energy team). Furthermore, the organization has to formulate the energy policy in form of a written statement which contains the intent and direction of energy policy. The energy policy must be communicated within the organization. In this phase, the organization has to identify the significant energy uses and prioritize the opportunities for energy performance improvement.
2
2.1
Energy efficiency as a management approach16
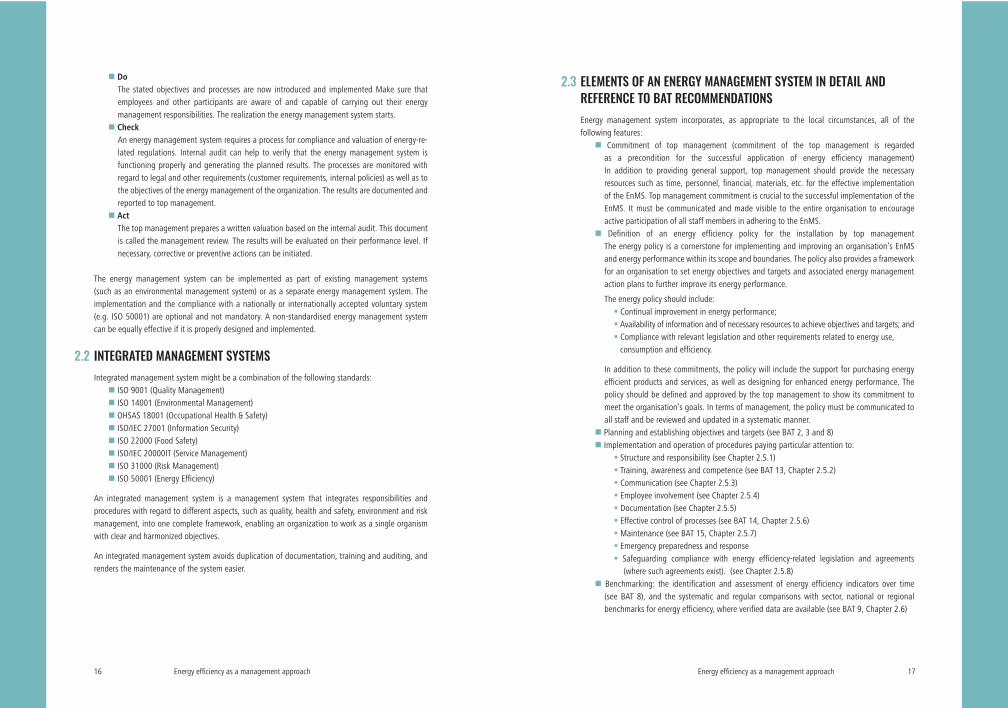
DoThe stated objectives and processes are now introduced and implemented Make sure that employees and other participants are aware of and capable of carrying out their energy management responsibilities. The realization the energy management system starts.
CheckAn energy management system requires a process for compliance and valuation of energy-re-lated regulations. Internal audit can help to verify that the energy management system is functioning properly and generating the planned results. The processes are monitored with regard to legal and other requirements (customer requirements, internal policies) as well as to the objectives of the energy management of the organization. The results are documented and reported to top management.
ActThe top management prepares a written valuation based on the internal audit. This document is called the management review. The results will be evaluated on their performance level. If necessary, corrective or preventive actions can be initiated.
The energy management system can be implemented as part of existing management systems (such as an environmental management system) or as a separate energy management system. The implementation and the compliance with a nationally or internationally accepted voluntary system (e.g. ISO 50001) are optional and not mandatory. A non-standardised energy management system can be equally effective if it is properly designed and implemented.
INTEGRATED MANAGEMENT SYSTEMSIntegrated management system might be a combination of the following standards:
ISO 9001 (Quality Management) ISO 14001 (Environmental Management) OHSAS 18001 (Occupational Health & Safety) ISO/IEC 27001 (Information Security) ISO 22000 (Food Safety) ISO/IEC 20000IT (Service Management) ISO 31000 (Risk Management) ISO 50001 (Energy Efficiency)
An integrated management system is a management system that integrates responsibilities and procedures with regard to different aspects, such as quality, health and safety, environment and risk management, into one complete framework, enabling an organization to work as a single organism with clear and harmonized objectives.
An integrated management system avoids duplication of documentation, training and auditing, and renders the maintenance of the system easier.
2.2
Energy efficiency as a management approach 17
ELEMENTS OF AN ENERGY MANAGEMENT SYSTEM IN DETAIL AND REFERENCE TO BAT RECOMMENDATIONS Energy management system incorporates, as appropriate to the local circumstances, all of the following features:
Commitment of top management (commitment of the top management is regarded as a precondition for the successful application of energy efficiency management) In addition to providing general support, top management should provide the necessary resources such as time, personnel, financial, materials, etc. for the effective implementation of the EnMS. Top management commitment is crucial to the successful implementation of the EnMS. It must be communicated and made visible to the entire organisation to encourage active participation of all staff members in adhering to the EnMS.
Definition of an energy efficiency policy for the installation by top management The energy policy is a cornerstone for implementing and improving an organisation’s EnMS and energy performance within its scope and boundaries. The policy also provides a framework for an organisation to set energy objectives and targets and associated energy management action plans to further improve its energy performance.
The energy policy should include: Continual improvement in energy performance; Availability of information and of necessary resources to achieve objectives and targets; and Compliance with relevant legislation and other requirements related to energy use,consumption and efficiency.
In addition to these commitments, the policy will include the support for purchasing energy efficient products and services, as well as designing for enhanced energy performance. The policy should be defined and approved by the top management to show its commitment to meet the organisation’s goals. In terms of management, the policy must be communicated to all staff and be reviewed and updated in a systematic manner.
Planning and establishing objectives and targets (see BAT 2, 3 and 8) Implementation and operation of procedures paying particular attention to:
Structure and responsibility (see Chapter 2.5.1) Training, awareness and competence (see BAT 13, Chapter 2.5.2) Communication (see Chapter 2.5.3) Employee involvement (see Chapter 2.5.4) Documentation (see Chapter 2.5.5) Effective control of processes (see BAT 14, Chapter 2.5.6) Maintenance (see BAT 15, Chapter 2.5.7) Emergency preparedness and response Safeguarding compliance with energy efficiency-related legislation and agreements
(where such agreements exist). (see Chapter 2.5.8) Benchmarking: the identification and assessment of energy efficiency indicators over time (see BAT 8), and the systematic and regular comparisons with sector, national or regional benchmarks for energy efficiency, where verified data are available (see BAT 9, Chapter 2.6)
2.3
Energy efficiency as a management approach18
Checking performance and taking corrective action paying particular attention to: Monitoring and measurement (see BAT 16, Chapter 2.7.1) Corrective and preventive action (see Chapter 2.7.2) Maintenance of records (see Chapter 2.7.3) Independent (where practicable) internal auditing in order to determine whether or not
the energy efficiency management system conforms to planned arrangements and has been properly implemented and maintained (see BAT 3 and 4, Chapters 2.4.2 and 2.4.3)
Review of the EnMS and its continuing suitability, adequacy and effectiveness by top management
PLANNING OBJECTIVES AND TARGETS
CONTINUOUS IMPROVEMENT
BAT 2
BAT is to continuously minimise the environmental impact of an installation by planning actions and investments on an integrated basis and for the short, medium and long term, considering the cost-benefits and cross-media effects.
Continuous improvement means the actions are repeated over time, i.e. all planning and investment decisions should consider the overall long term aim to reduce the environmental impacts of the operation. This may mean avoiding short term actions to better use available investments over a longer term, e.g. changes to the core process may require more investment and take longer to implement, but may bring bigger reductions in energy use and emissions.
ENERGY AUDIT
BAT 3
BAT is to identify the aspects of an installation that influence energy efficiency by carrying out an audit. It is important that an audit is coherent with a systems approach (see BAT 7).
An energy audit is a process to determine energy performance in an organisation based on data and/or actual measurement, leading to identification of opportunities for the improvement. The audit includes identification of the energy baseline and the selection of energy performance indicators (EnPIs). To conduct the audit, the organisation shall identify different energy use, establish an equipment list and obtain energy consumption details for a specified period, normally a full year on a monthly basis.
2.4
2.4.1
2.4.2
Energy efficiency as a management approach 19
The following essential information should be available for the energy review: Name of the equipment; Unique ID of major equipment (minor equipment such as fluorescence tubes, desktop PC could be grouped together);
Equipment location; Rated power; Type of energy; and Measured energy consumption during a particular period (e.g. monthly record).
When conducting the energy audit, the following items should be noted: sajor equipment with significant energy consumption should be itemized, i.e. energy consumption record should be provided for each piece of equipment;
Installation of sub-meter to monitor and record the energy consumption (such as electricity, diesel, gas and steam) of each major equipment;
When measurement of actual consumption is not available, estimation of energy consumption by power rating and operating hours may be adopted. The energy review should be updated when necessary to add new equipment and expel obsolete items; and
Replacement of estimation by actual data through measurement
Creating energy profile
An energy profile is a useful tool to allow management to have a closer look at the detailed energy consumption status of the organisation.
EXAMPLE
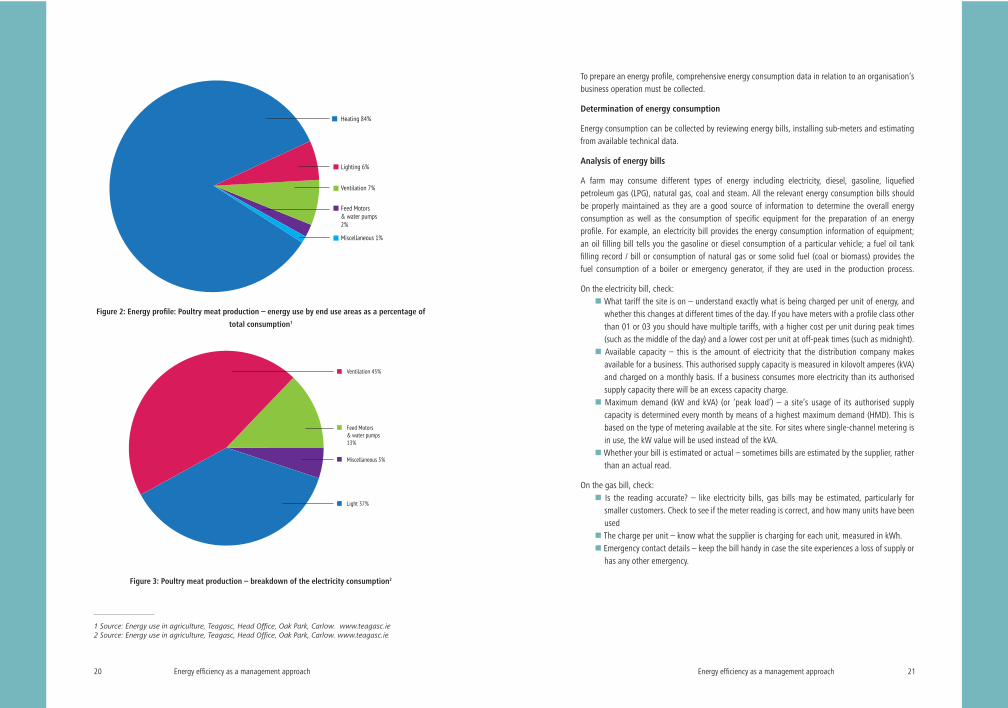
Figure 2 shows the breakdown of energy consumption by end use area as a percentage of total use. In terms of overall energy demand, space heating accounts for over 80 % of total consumption. With regard to electrical energy use (see Figure 3), lighting, ventilation and fans account for over 80 % of the electrical energy consumption. It is clear that the link between ventilation and heating needs careful management because 91 % of the total energy consumption is used for heating and ventilation.
Energy efficiency as a management approach20
Heating 84%
Lighting 6%
Ventilation 7%
Miscellaneous 1%
Feed Motors & water pumps2%
Figure 2: Energy profile: Poultry meat production – energy use by end use areas as a percentage of
total consumption1
Ventilation 45%
Feed Motors & water pumps13%
Miscellaneous 5%
Light 37%
Figure 3: Poultry meat production – breakdown of the electricity consumption2
1 Source: Energy use in agriculture, Teagasc, Head Office, Oak Park, Carlow. www.teagasc.ie 2 Source: Energy use in agriculture, Teagasc, Head Office, Oak Park, Carlow. www.teagasc.ie
Energy efficiency as a management approach 21
To prepare an energy profile, comprehensive energy consumption data in relation to an organisation’s business operation must be collected.
Determination of energy consumption
Energy consumption can be collected by reviewing energy bills, installing sub-meters and estimating from available technical data.
Analysis of energy bills
A farm may consume different types of energy including electricity, diesel, gasoline, liquefied petroleum gas (LPG), natural gas, coal and steam. All the relevant energy consumption bills should be properly maintained as they are a good source of information to determine the overall energy consumption as well as the consumption of specific equipment for the preparation of an energy profile. For example, an electricity bill provides the energy consumption information of equipment; an oil filling bill tells you the gasoline or diesel consumption of a particular vehicle; a fuel oil tank filling record / bill or consumption of natural gas or some solid fuel (coal or biomass) provides the fuel consumption of a boiler or emergency generator, if they are used in the production process.
On the electricity bill, check: What tariff the site is on – understand exactly what is being charged per unit of energy, and whether this changes at different times of the day. If you have meters with a profile class other than 01 or 03 you should have multiple tariffs, with a higher cost per unit during peak times (such as the middle of the day) and a lower cost per unit at off-peak times (such as midnight).
Available capacity – this is the amount of electricity that the distribution company makes available for a business. This authorised supply capacity is measured in kilovolt amperes (kVA) and charged on a monthly basis. If a business consumes more electricity than its authorised supply capacity there will be an excess capacity charge.
Maximum demand (kW and kVA) (or ‘peak load’) – a site’s usage of its authorised supply capacity is determined every month by means of a highest maximum demand (HMD). This is based on the type of metering available at the site. For sites where single-channel metering is in use, the kW value will be used instead of the kVA.
Whether your bill is estimated or actual – sometimes bills are estimated by the supplier, rather than an actual read.
On the gas bill, check: Is the reading accurate? – like electricity bills, gas bills may be estimated, particularly for smaller customers. Check to see if the meter reading is correct, and how many units have been used
The charge per unit – know what the supplier is charging for each unit, measured in kWh. Emergency contact details – keep the bill handy in case the site experiences a loss of supply or has any other emergency.
Energy efficiency as a management approach22
Energy measurement by sub-meters
It is necessary to obtain energy consumption data of different types of equipment in order to prepare the energy profile and monitor energy consumption continuously. To measure energy consumption of different equipment, it is suggested to install sub-meters for individual equipment, such as, electricity meters, diesel meters, LPG meters, steam meters, etc. for diesel / coal boilers, fossil fuel ovens, burners, diesel generators, etc. Reading of sub-meters should be recorded at least once a month. To ensure the accuracy of data, regular maintenance, checking and calibration of the sub-meters shall be arranged at the frequency recommended by the manufacturers or at least once a year. Human error in recording meter reading should also be avoided.
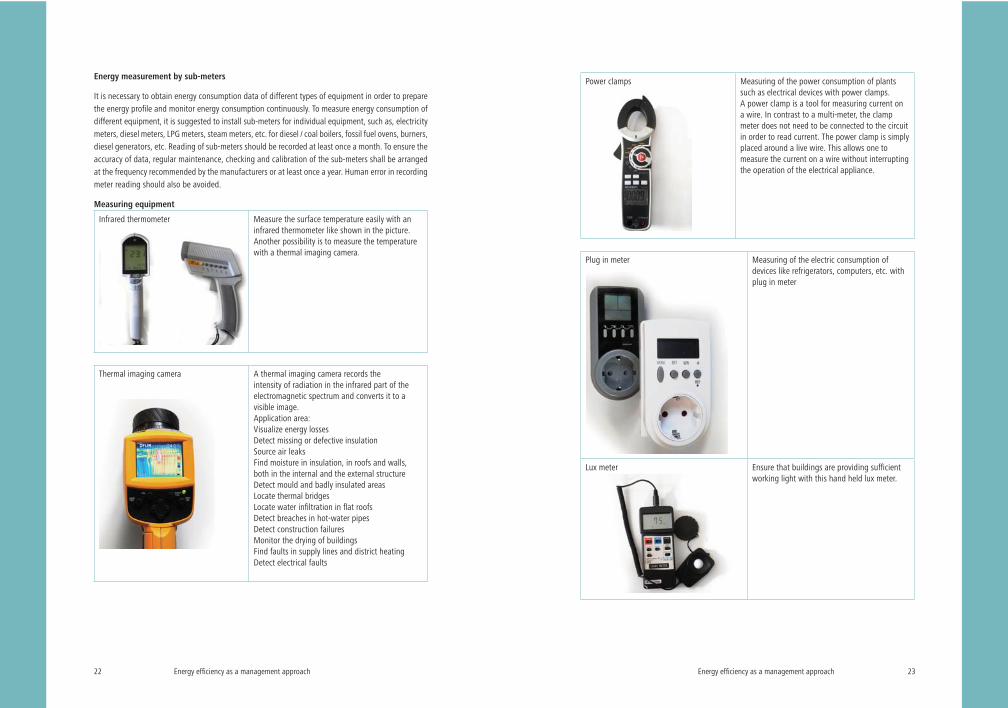
Measuring equipment
Infrared thermometer Measure the surface temperature easily with an infrared thermometer like shown in the picture. Another possibility is to measure the temperature with a thermal imaging camera.
Thermal imaging camera A thermal imaging camera records the intensity of radiation in the infrared part of the electromagnetic spectrum and converts it to a visible image.Application area:Visualize energy lossesDetect missing or defective insulationSource air leaksFind moisture in insulation, in roofs and walls, both in the internal and the external structureDetect mould and badly insulated areasLocate thermal bridgesLocate water infiltration in flat roofsDetect breaches in hot-water pipesDetect construction failuresMonitor the drying of buildingsFind faults in supply lines and district heatingDetect electrical faults
Energy efficiency as a management approach 23
Power clamps Measuring of the power consumption of plants such as electrical devices with power clamps.A power clamp is a tool for measuring current on a wire. In contrast to a multi-meter, the clamp meter does not need to be connected to the circuit in order to read current. The power clamp is simply placed around a live wire. This allows one to measure the current on a wire without interrupting the operation of the electrical appliance.
Plug in meter Measuring of the electric consumption of devices like refrigerators, computers, etc. with plug in meter
Lux meter Ensure that buildings are providing sufficient working light with this hand held lux meter.
Energy efficiency as a management approach24
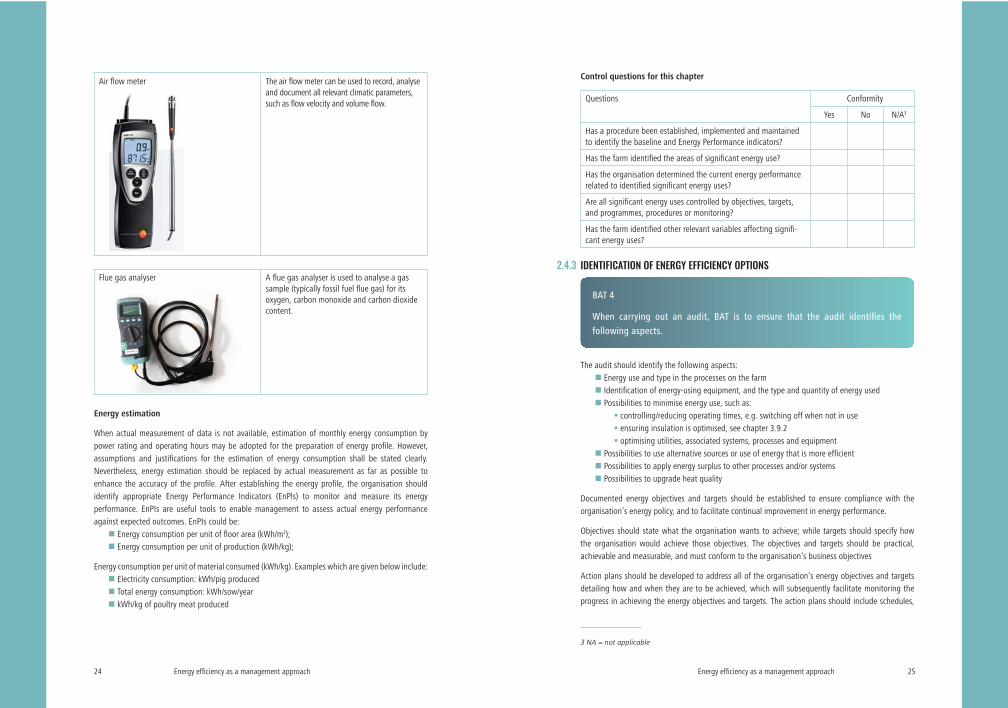
Air flow meter The air flow meter can be used to record, analyse and document all relevant climatic parameters, such as flow velocity and volume flow.
Flue gas analyser A flue gas analyser is used to analyse a gas sample (typically fossil fuel flue gas) for its oxygen, carbon monoxide and carbon dioxide content.
Energy estimation
When actual measurement of data is not available, estimation of monthly energy consumption by power rating and operating hours may be adopted for the preparation of energy profile. However, assumptions and justifications for the estimation of energy consumption shall be stated clearly. Nevertheless, energy estimation should be replaced by actual measurement as far as possible to enhance the accuracy of the profile. After establishing the energy profile, the organisation should identify appropriate Energy Performance Indicators (EnPls) to monitor and measure its energy performance. EnPIs are useful tools to enable management to assess actual energy performance against expected outcomes. EnPIs could be:
Energy consumption per unit of floor area (kWh/m2); Energy consumption per unit of production (kWh/kg);
Energy consumption per unit of material consumed (kWh/kg). Examples which are given below include: Electricity consumption: kWh/pig produced Total energy consumption: kWh/sow/year kWh/kg of poultry meat produced
Energy efficiency as a management approach 25
Control questions for this chapter3
Questions Conformity
Yes No N/A3
Has a procedure been established, implemented and maintained to identify the baseline and Energy Performance indicators?
Has the farm identified the areas of significant energy use?
Has the organisation determined the current energy performance related to identified significant energy uses?
Are all significant energy uses controlled by objectives, targets, and programmes, procedures or monitoring?
Has the farm identified other relevant variables affecting signifi-cant energy uses?
IDENTIFICATION OF ENERGY EFFICIENCY OPTIONS
BAT 4
When carrying out an audit, BAT is to ensure that the audit identifies the following aspects.
The audit should identify the following aspects: Energy use and type in the processes on the farm Identification of energy-using equipment, and the type and quantity of energy used Possibilities to minimise energy use, such as:
controlling/reducing operating times, e.g. switching off when not in use ensuring insulation is optimised, see chapter 3.9.2 optimising utilities, associated systems, processes and equipment
Possibilities to use alternative sources or use of energy that is more efficient Possibilities to apply energy surplus to other processes and/or systems Possibilities to upgrade heat quality
Documented energy objectives and targets should be established to ensure compliance with the organisation’s energy policy, and to facilitate continual improvement in energy performance.
Objectives should state what the organisation wants to achieve; while targets should specify how the organisation would achieve those objectives. The objectives and targets should be practical, achievable and measurable, and must conform to the organisation’s business objectives
Action plans should be developed to address all of the organisation’s energy objectives and targets detailing how and when they are to be achieved, which will subsequently facilitate monitoring the progress in achieving the energy objectives and targets. The action plans should include schedules,
3 NA = not applicable
2.4.3

Energy efficiency as a management approach26
resources and responsibilities for achieving the objectives and targets. However, they should be flexible and be able to be revised to reflect any changes in the objectives and targets.
Control questions for this chapter
Questions Conformity
Yes No N/A
Have energy objectives and targets been clearly defined, docu-mented and established?
Are the energy objectives and energy targets specific, measurable, concrete and understandable?
Are the objectives and targets consistent with the energy policy?
Has an energy performance evaluation system been established to periodically review the achievement of the objectives and targets?
Have the action plans for energy efficiency been documented and updated at defined intervals?
TOOLS
BAT 5
BAT is to use appropriate tools or methodologies to assist with identifying and quantifying energy optimisation.
Tools such as can be used: Energy models, databases and balances Estimates and calculations
2.4.4.1 ENERGY MODELS, DATABASES AND BALANCES
Energy models, databases and balances, are useful tools to carry out a complete and in-depth energy analysis and are likely to be part of an analytical or comprehensive energy audit. A model is a plan or description designed to show where and how energy is used in an installation, unit or system (e.g. a database). The model therefore seeks to record the technical information about an installation, unit or system. It will record the type of equipment, energy consumption and operating data such as running time. It may usefully be part of, or linked to a maintenance system, to facilitate record updating, such as motor rewinding, calibration dates, etc.
Where an energy model, database or balance is used, it may be built up based on system boundaries, e.g.:
Units system (facility, feed production, etc.) Individual equipment (pumps, motors, etc.) Utility systems (e.g. compressed air, pumping, steam/hot water, lighting, etc.)
2.4.4
Energy efficiency as a management approach 27
The auditor must take care that the collected data reflect the actual performance under typical operating conditions.
2.4.4.2 ESTIMATES AND CALCULATIONS
Estimations and calculations of energy consumption can be made for equipment and systems, usually based on manufacturers' or designers' specifications. Often, calculations are based on an easily mea-sured parameter, such as hours-run meters on motors and pumps. However, in such cases, other pa-rameters, such as the load or head and rpm will need to be known (or calculated), as this has a direct effect on the energy consumption. The equipment manufacturer will usually supply this information.
Control questions for this chapter
Questions Conformity
Yes No N/A
Has one of the suggested tools been used to identify energy efficiency options?
• Energy models, databases and balances• Estimates and calculations
IDENTIFICATION OF OPPORTUNITIES TO OPTIMISE ENERGY RECOVERY
BAT 6
BAT is to identify opportunities to optimise energy recovery within the installation, between systems within the installation (see BAT 7) and/or with a third party (or parties).
Heat recovery is the collection and re-use of heat arising from any process that would otherwise be lost. The process might be inherent to a building, such as space heating, ventilation and so on, or could be something carried out as part of business activity, such as air compressors, chillers and the like. Heat recovery can help to reduce the overall energy consumption of the process itself, or provide useful heat for other purposes.
Ventilation systems bring cool fresh air into a building using fans in Air Handling Units (AHUs). The AHUs also contain heating coils to allow the fresh air to be raised to the required temperature by the buildings boiler. The air continues to be heated by the occupants and equipment in the room and all this heat energy is lost when the air is extracted and dumped into the environment.
The addition of heat recovery means that some of the heat contained within the extract air can be recovered. The heat energy is passed into the incoming fresh air effectively pre-heating it and meaning the boiler needs to add less heat. The two air streams need not mix directly to allow the transfer of heat.
2.4.5
Energy efficiency as a management approach28
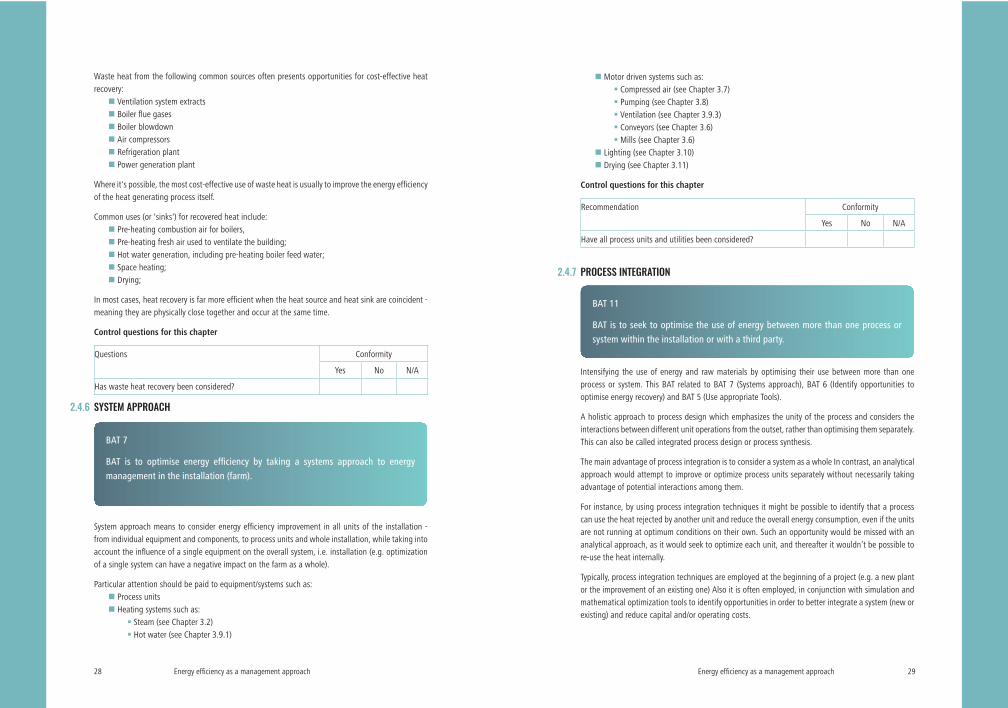
Waste heat from the following common sources often presents opportunities for cost-effective heat recovery:
Ventilation system extracts Boiler flue gases Boiler blowdown Air compressors Refrigeration plant Power generation plant
Where it's possible, the most cost-effective use of waste heat is usually to improve the energy efficiency of the heat generating process itself.
Common uses (or 'sinks') for recovered heat include: Pre-heating combustion air for boilers, Pre-heating fresh air used to ventilate the building; Hot water generation, including pre-heating boiler feed water; Space heating; Drying;
In most cases, heat recovery is far more efficient when the heat source and heat sink are coincident - meaning they are physically close together and occur at the same time.
Control questions for this chapter
Questions Conformity
Yes No N/A
Has waste heat recovery been considered?
SYSTEM APPROACH
BAT 7
BAT is to optimise energy efficiency by taking a systems approach to energy management in the installation (farm).
System approach means to consider energy efficiency improvement in all units of the installation - from individual equipment and components, to process units and whole installation, while taking into account the influence of a single equipment on the overall system, i.e. installation (e.g. optimization of a single system can have a negative impact on the farm as a whole).
Particular attention should be paid to equipment/systems such as: Process units Heating systems such as:
Steam (see Chapter 3.2) Hot water (see Chapter 3.9.1)
2.4.6
Energy efficiency as a management approach 29
Motor driven systems such as: Compressed air (see Chapter 3.7) Pumping (see Chapter 3.8) Ventilation (see Chapter 3.9.3) Conveyors (see Chapter 3.6) Mills (see Chapter 3.6)
Lighting (see Chapter 3.10) Drying (see Chapter 3.11)
Control questions for this chapter
Recommendation Conformity
Yes No N/A
Have all process units and utilities been considered?
PROCESS INTEGRATION
BAT 11
BAT is to seek to optimise the use of energy between more than one process or system within the installation or with a third party.
Intensifying the use of energy and raw materials by optimising their use between more than one process or system. This BAT related to BAT 7 (Systems approach), BAT 6 (Identify opportunities to optimise energy recovery) and BAT 5 (Use appropriate Tools).
A holistic approach to process design which emphasizes the unity of the process and considers the interactions between different unit operations from the outset, rather than optimising them separately. This can also be called integrated process design or process synthesis.
The main advantage of process integration is to consider a system as a whole In contrast, an analytical approach would attempt to improve or optimize process units separately without necessarily taking advantage of potential interactions among them.
For instance, by using process integration techniques it might be possible to identify that a process can use the heat rejected by another unit and reduce the overall energy consumption, even if the units are not running at optimum conditions on their own. Such an opportunity would be missed with an analytical approach, as it would seek to optimize each unit, and thereafter it wouldn’t be possible to re-use the heat internally.
Typically, process integration techniques are employed at the beginning of a project (e.g. a new plant or the improvement of an existing one) Also it is often employed, in conjunction with simulation and mathematical optimization tools to identify opportunities in order to better integrate a system (new or existing) and reduce capital and/or operating costs.
2.4.7

Energy efficiency as a management approach30
Control questions for this chapter
Recommendation Conformity
Yes No N/A
Has process integration been considered?
PROCEDURES
STRUCTURE AND RESPONSIBILITIES
In addition to providing general support, top management should provide the necessary resources such as time, personnel, financial, materials, etc. for the effective implementation of the EnMS.
Key factors for successful implementation of an EnMS include: Top management support; Sufficient resources (personnel, technology, financing etc.); and Management commitment.
To ensure effective operation of the EnMS, top management is required to appoint a management representative (e.g. the technical director) and approve the formation of an energy management team or the task can be included in the e.g. already existing environmental team. The management representative (MR) is responsible for managing all aspects of the EnMS as it evolves. The composition and size of the energy management team should be determined with due consideration of the size and complexity of the organisation.
Control questions for this chapter
Recommendation Conformity
Yes No N/A
Have the roles, responsibilities and authorities for energy mana-gement been defined and documented?
Have a Management Representative and an Energy Manage-ment Team been designated?
Have the required resources (e.g. personnel, technology, finance) for implementation and control of the energy management system been provided by the management?
2.5
2.5.1
Energy efficiency as a management approach 31
TRAINING, AWARENESS AND COMPETENCE
A competent workforce is essential in successfully implementing the organisation’s EnMS and achieving improved energy performance. Competence is normally assessed based on a combination of education, training, skills and experience of the relevant person. Basically, appropriate training should be provided to all relevant personnel. This training should include general concept of energy management as well as skills training (usually on-the-job) to allow personnel to carry out their tasks with an awareness of the impact their activities can have on the energy performance. The level and degree of training will inevitably vary according to job function. For instance, general energy awareness training should be provided for all employees; and energy audit training should be provided for those who are responsible for the establishment of energy profile.
Table 1: Examples of EnMS Training Courses
Targets
EnMS Awareness • All employees
EnMS implementation training
• Middle Management• Management Representative (Energy manager)• Energy Management Team
EnMS Auditor Training • EnMS Internal Audit Team
Control questions for this chapter
Recommendations Conformity
Yes No N/A
Are all the personnel, related to significant energy uses, competent on the basis of appropriate education, training, skills or experience?
Have procedures been established to assure that all the person-nel working for or on behalf of the organisation are aware of
• the importance of conformity with the energy policy, procedures and the requirements of the EnMS?
• their roles, responsibilities and authorities in achieving the requirements of the EnMS?
• the benefits of improved energy performance?• the impacts, actual or potential of their activities and how
their activities and behaviour contribute to the achieve-ment of energy objectives and targets and the potential consequences of departure from specified procedures?
Are training records, certificates and licenses maintained to demonstrate the competence?
BAT 13
BAT is to maintain expertise in energy efficiency and energy-using systems.
2.5.2

Energy efficiency as a management approach32
COMMUNICATION
An internal communication procedure could include how staff members are made aware of energy issues, how decisions are made or information is disseminated to staff etc. This should also make provision for the communication of suggestions /complaints etc. relevant to energy management and how these are dealt with. The communication procedure should also cover the process in responding to comments and suggestions by contractors working for or on behalf of the organisation. Methods for communication include, for example:
Meetings; Videos; Briefings; E-mails, posters, memos, circulars; and Suggestion boxes, employee hotlines.
Externally, the organisation should maintain a documented decision on whether it will communicate its energy policy, EnMS and energy performance. For those who choose to communicate this information externally, they should consider the following aspects:
Type and level of information to be communicated; Targets of communication; Mechanisms and responsible parties to handle and respond to enquiries; Official response time; and Recording system and format of communication and the associated correspondence.
Control questions for this chapter
Recommendations Conformity
Yes No N/A
Does the organisation communicate internally with regard to its energy performance and the EnMS?
Are procedures maintained for communication of energy issues between various levels of the organisation?
Has the organisation established and implemented a process by which any person working for, or on behalf of, the organisation can make comments or suggestions to EnMS?
Has the organisation decided whether its energy policy, EnMS and energy performance should be communicated externally?
EMPLOYEE INVOLVEMENT
Employee involvement means that every employee is regarded as a unique human being, not just a cog in a machine, and each employee is involved in helping the organization meet its goals. Each employee’s input is solicited and valued by his/her management.
Employees and management should recognize that each employee is involved in running the business.
Ideally energy awareness and cultural change should complement other elements of good practice as part of an integrated approach to energy management in organisation.
2.5.3
2.5.4
Energy efficiency as a management approach 33
Control questions for this chapter
Recommendations Conformity
Yes No N/A
Are there any activities to guarantee the involvement of employee in the energy management system?
DOCUMENTATION OF THE ENERGY MANAGEMENT SYSTEM
Documentation within a management system will assist in both EnMS implementation and promoting understanding of system implementation. It provides information and supporting evidence to demonstrate the effectiveness and efficiency of the EnMS.
Documentations could includes: Energy strategy Energy action plan Energy indicators Organisational chart showing energy related responsibilities Key procedures to guarantee energy efficient operations (energy monitoring and controlling, maintenance, purchasing)
Control questions for this chapter
Requirements Conformity
Yes No N/A
Does the company document the EnMS related activities?
EFFECTIVE CONTROL OF PROCESSES
BAT 14
BAT is to ensure that the effective control of processes is implemented.
This BAT requests a company to: Have systems in place to ensure that procedures are known, understood and complied with:
Energy management system (see Chapter 2.1) Maintaining the impetus of energy efficiency initiatives (see Chapter 2.8.1)
Ensure that the key performance indicators are identified, optimised for energy efficiency and monitored (see Chapter 2.6 )
Documentation or recording these parameters
Effective process control includes: Clear instructions for and adequate control of processes under all modes of operation, i.e. preparation, start-up, routine operation, shutdown and abnormal conditions
Identifying the key performance indicators and methods for measuring and controlling these parameters (e.g. flow, pressure, temperature, composition and quantity)
2.5.5
2.5.6
Energy efficiency as a management approach34
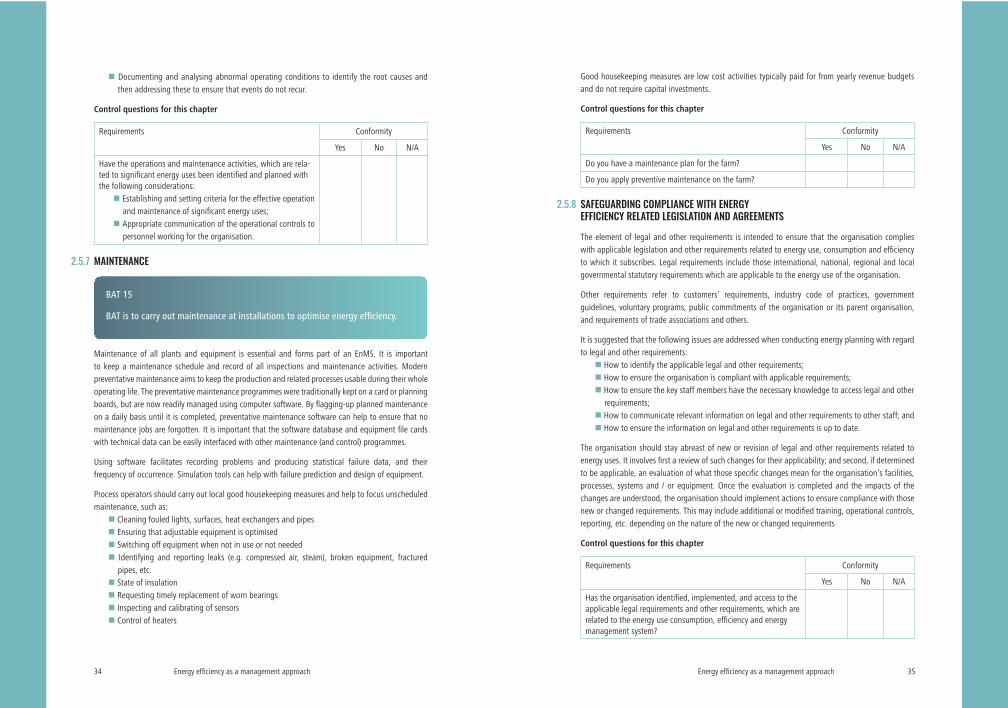
Documenting and analysing abnormal operating conditions to identify the root causes and then addressing these to ensure that events do not recur.
Control questions for this chapter
Requirements Conformity
Yes No N/A
Have the operations and maintenance activities, which are rela-ted to significant energy uses been identified and planned with the following considerations:
Establishing and setting criteria for the effective operation and maintenance of significant energy uses;
Appropriate communication of the operational controls to personnel working for the organisation.
MAINTENANCE
BAT 15
BAT is to carry out maintenance at installations to optimise energy efficiency.
Maintenance of all plants and equipment is essential and forms part of an EnMS. It is important to keep a maintenance schedule and record of all inspections and maintenance activities. Modern preventative maintenance aims to keep the production and related processes usable during their whole operating life. The preventative maintenance programmes were traditionally kept on a card or planning boards, but are now readily managed using computer software. By flagging-up planned maintenance on a daily basis until it is completed, preventative maintenance software can help to ensure that no maintenance jobs are forgotten. It is important that the software database and equipment file cards with technical data can be easily interfaced with other maintenance (and control) programmes.
Using software facilitates recording problems and producing statistical failure data, and their frequency of occurrence. Simulation tools can help with failure prediction and design of equipment.
Process operators should carry out local good housekeeping measures and help to focus unscheduled maintenance, such as:
Cleaning fouled lights, surfaces, heat exchangers and pipes Ensuring that adjustable equipment is optimised Switching off equipment when not in use or not needed Identifying and reporting leaks (e.g. compressed air, steam), broken equipment, fractured pipes, etc.
State of insulation Requesting timely replacement of worn bearings Inspecting and calibrating of sensors Control of heaters
2.5.7
Energy efficiency as a management approach 35
Good housekeeping measures are low cost activities typically paid for from yearly revenue budgets and do not require capital investments.
Control questions for this chapter
Requirements Conformity
Yes No N/A
Do you have a maintenance plan for the farm?
Do you apply preventive maintenance on the farm?
SAFEGUARDING COMPLIANCE WITH ENERGY EFFICIENCY RELATED LEGISLATION AND AGREEMENTS
The element of legal and other requirements is intended to ensure that the organisation complies with applicable legislation and other requirements related to energy use, consumption and efficiency to which it subscribes. Legal requirements include those international, national, regional and local governmental statutory requirements which are applicable to the energy use of the organisation.
Other requirements refer to customers’ requirements, industry code of practices, government guidelines, voluntary programs, public commitments of the organisation or its parent organisation, and requirements of trade associations and others.
It is suggested that the following issues are addressed when conducting energy planning with regard to legal and other requirements:
How to identify the applicable legal and other requirements; How to ensure the organisation is compliant with applicable requirements; How to ensure the key staff members have the necessary knowledge to access legal and other requirements;
How to communicate relevant information on legal and other requirements to other staff; and How to ensure the information on legal and other requirements is up to date.
The organisation should stay abreast of new or revision of legal and other requirements related to energy uses. It involves first a review of such changes for their applicability; and second, if determined to be applicable, an evaluation of what those specific changes mean for the organisation’s facilities, processes, systems and / or equipment. Once the evaluation is completed and the impacts of the changes are understood, the organisation should implement actions to ensure compliance with those new or changed requirements. This may include additional or modified training, operational controls, reporting, etc. depending on the nature of the new or changed requirements
Control questions for this chapter
Requirements Conformity
Yes No N/A
Has the organisation identified, implemented, and access to the applicable legal requirements and other requirements, which are related to the energy use consumption, efficiency and energy management system?
2.5.8
Energy efficiency as a management approach36
BENCHMARKING AND COMPARISON
ESTABLISHMENT OF ENERGY INDICATORS AND SYSTEMATIC COMPARISON
BAT 8 and BAT 9
BAT 8 is to establish energy efficiency indicators.
BAT 9 is to carry out systematic and regular comparisons with sector, national or regional benchmarks, where validated data are available.
This BAT requests a company to: Identify suitable energy efficiency indicators for the farm, and where necessary, individual processes, systems and/or units, and measure their change over time (see Chapter 2.7) or after the implementation of energy efficiency measures (see Chapter 2.4.2)
Identify and record appropriate boundaries associated with the indicators (min and max) Identify and record factors that can cause variation in the energy efficiency
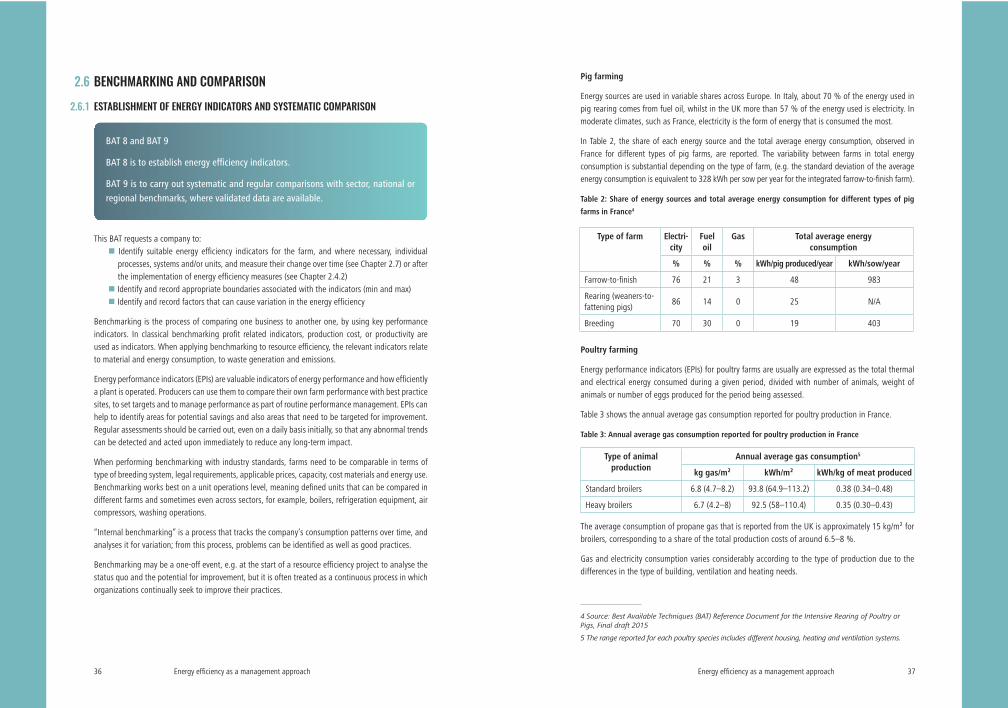
Benchmarking is the process of comparing one business to another one, by using key performance indicators. In classical benchmarking profit related indicators, production cost, or productivity are used as indicators. When applying benchmarking to resource efficiency, the relevant indicators relate to material and energy consumption, to waste generation and emissions.
Energy performance indicators (EPIs) are valuable indicators of energy performance and how efficiently a plant is operated. Producers can use them to compare their own farm performance with best practice sites, to set targets and to manage performance as part of routine performance management. EPIs can help to identify areas for potential savings and also areas that need to be targeted for improvement. Regular assessments should be carried out, even on a daily basis initially, so that any abnormal trends can be detected and acted upon immediately to reduce any long-term impact.
When performing benchmarking with industry standards, farms need to be comparable in terms of type of breeding system, legal requirements, applicable prices, capacity, cost materials and energy use. Benchmarking works best on a unit operations level, meaning defined units that can be compared in different farms and sometimes even across sectors, for example, boilers, refrigeration equipment, air compressors, washing operations.
“Internal benchmarking” is a process that tracks the company’s consumption patterns over time, and analyses it for variation; from this process, problems can be identified as well as good practices.
Benchmarking may be a one-off event, e.g. at the start of a resource efficiency project to analyse the status quo and the potential for improvement, but it is often treated as a continuous process in which organizations continually seek to improve their practices.
2.6
2.6.1
Energy efficiency as a management approach 37
Pig farming
Energy sources are used in variable shares across Europe. In Italy, about 70 % of the energy used in pig rearing comes from fuel oil, whilst in the UK more than 57 % of the energy used is electricity. In moderate climates, such as France, electricity is the form of energy that is consumed the most.
In Table 2, the share of each energy source and the total average energy consumption, observed in France for different types of pig farms, are reported. The variability between farms in total energy consumption is substantial depending on the type of farm, (e.g. the standard deviation of the average energy consumption is equivalent to 328 kWh per sow per year for the integrated farrow-to-finish farm).
Table 2: Share of energy sources and total average energy consumption for different types of pig
farms in France4
Poultry farming
Energy performance indicators (EPIs) for poultry farms are usually are expressed as the total thermal and electrical energy consumed during a given period, divided with number of animals, weight of animals or number of eggs produced for the period being assessed.
Table 3 shows the annual average gas consumption reported for poultry production in France.
Table 3: Annual average gas consumption reported for poultry production in France5
Type of animal production
Annual average gas consumption5
kg gas/m² kWh/m² kWh/kg of meat produced
Standard broilers 6.8 (4.7–8.2) 93.8 (64.9–113.2) 0.38 (0.34–0.48)
Heavy broilers 6.7 (4.2–8) 92.5 (58–110.4) 0.35 (0.30–0.43)
The average consumption of propane gas that is reported from the UK is approximately 15 kg/m² for broilers, corresponding to a share of the total production costs of around 6.5–8 %.
Gas and electricity consumption varies considerably according to the type of production due to the differences in the type of building, ventilation and heating needs.
4 Source: Best Available Techniques (BAT) Reference Document for the Intensive Rearing of Poultry or Pigs, Final draft 2015
5 The range reported for each poultry species includes different housing, heating and ventilation systems.
Type of farm Electri-city
Fuel oil
Gas Total average energy consumption
% % % kWh/pig produced/year kWh/sow/year
Farrow-to-finish 76 21 3 48 983
Rearing (weaners-to-fattening pigs)
86 14 0 25 N/A
Breeding 70 30 0 19 403

Energy efficiency as a management approach38
Data concerning the average electricity consumption for poultry meat houses, observed in France, are reported in Table 4.
Table 4: Annual average electricity consumption for poultry production in France6
Type of animal production Annual average electricity consumptionkWh/m²
Standard broilers 15.2
Broiler breeders 18.8
In addition, EPI for poultry farms (egg production), expressed as energy usage per bird, are given in Table 5.
Table 5: Energy performance indicator (EPI) for egg producers, versus energy consumption in poultry
farms up to 75,000 birds in UK7
Energy performance indica-tor (EPI )
Typical Best Practice
kWh/bird 3.9 2.25
Control questions for this chapter
Requirements Conformity
Yes No N/A
Have energy performance indicators (EPIs) been defined for the farm?
Have procedures been documented and implemented for inter-nal and external benchmarking?
CHECKING PERFORMANCE
MONITORING AND MEASUREMENT
BAT 16BAT is to establish and maintain documented procedures to monitor and measure, on a regular basis, the key characteristics of operations and activities that can have a significant impact on energy efficiency.
2.7.1.1 INDIRECT MEASUREMENT TECHNIQUES
Infrared scanning provides photographic proof of hot spots that cause energy drains. This may be used as part of an audit.
6 Source: Best Available Techniques (BAT) Reference Document for the Intensive Rearing of Poultry or Pigs, Final draft 2015 7 Source: [SEAI, Energy Use in Agriculture 2011 ]
2.7
2.7.1
Energy efficiency as a management approach 39
Critical equipment affecting energy usage, e.g. bearings, capacitors and other equipment may have the operating temperature monitored continuously or at regular intervals.
When the bearing or capacitance starts to breakdown, the temperature of the casing rises.
Other measurements can be made of other changes in energy losses, such as an increase in noise, etc.
2.7.1.2 ESTIMATES AND CALCULATION
Estimations and calculations of energy consumption can be made for equipment and systems, usually based on manufacturers' or designers' specifications. Often, calculations are based on an easily measured parameter, such as hours-run meters on motors and pumps. However, in such cases, other parameters, such as the load or head and rpm will need to be known (or calculated), as this has a direct effect on the energy consumption. The equipment manufacturer will usually supply this information.
2.7.1.3 METERING AND ADVANCED METERING SYSTEMS
Traditional utility meters simply measure the amount of an energy vector used in an installation, activity, or system. They are used to generate energy bills for industrial installations, and generally are read manually. However, modern technological advances result in cheaper meters, which can be installed without interrupting the energy supply (when installed with split-core current sensors) and require far less space than older meters.
Advanced metering infrastructure (AMI) or advanced metering management (AMM) refers to systems that measure, collect and analyse energy usage, from advanced devices such as electricity meters, gas meters, and/or water meters, through to various communication media on request or on a pre-defined schedule. This infrastructure includes hardware and software, for communications, customer associated systems and meter data management.
An example of a structure of an advanced metering system is shown in Figure 4.
Figure 4: Advanced metering system
2.7.1.4 LOW PRESSURE DROP FLOW MEASUREMENT IN PIPEWORK
Flow measurement is used in fluids such as liquid and gaseous raw materials and products, water (raw water, boiler and process waters, etc.), steam, etc. Flows are usually measured by an artificially
SITE
Meters
Level 1
Level 2Level 2UNIT UNIT
Level 3Level 3Level 3Level 3PROCESS/SYSTEM PROCESS/SYSTEM PROCESS/SYSTEM PROCESS/SYSTEM
Energy efficiency as a management approach40
induced pressure drop across an orifice plate, a venturi or pitot tube, or by an inductive flow meter. Traditionally, this results in a permanent pressure drop, particularly for orifice plates and venture, i.e. loss in energy in the system.
A new generation of flow measurement devices reduce the pressure losses significantly, with increased accuracy.
Ultrasonic metering can be used for liquids that are ultrasonically conductive and have a reasonably well-formed flow (not turbulent). They can be permanent or clamp into the pipework.
The latter function is useful to check existing flow meters, check and calibrate pumping systems, etc. As they are non-intrusive, they have no pressure drop.
Control questions for this chapter
Requirements Conformity
Yes No N/A
Are records available to track performance and conformity with the key characteristics?
Has the energy measurement plan been defined and implemented?
Are all monitoring equipment appropriately maintained and calibrated?
CORRECTIVE AND PREVENTIVE ACTION
The findings of monitoring and other reviews of EnMS implementation should be documented. In case nonconformities are identified, the necessary corrective and preventive actions must be initiated and implemented. A follow-up system should be maintained by management to ensure that corrective and preventive actions have been completed and effective.
Control questions for this chapter
Requirements Conformity
Yes No N/A
Have procedures been established to define the responsibility for handling, investigating and controlling, and mitigating noncon-formity?
Are procedures changed and / or updated as a result of correcti-ve action and preventive action?
MAINTENANCE OF REPORTS AND RECORDS
In order to demonstrate the effective functioning of the EnMS, organisations are required to keep legible, identifiable and traceable records. Records provide evidence of actions taken to adhere to the EnMS requirements. A comprehensive system for managing and maintaining records is necessary to
2.7.2
2.7.3
Energy efficiency as a management approach 41
ensure that records are easily identified, collated, indexed, filed, stored, retrieved and maintained for an appropriate length of time.
Records for the EnMS should cover but not necessarily be limited to, the following: Methodology, criteria and result of energy review; Opportunities for improving energy performance; Energy baseline; Energy performance indicators; Training records; Internal communication records; Decision on whether to externally communicate its EnMS and energy performance criteria and results;
Monitoring and measurement results of key operational characteristics; Calibration records; Compliance evaluation results; Internal audit programme and results; Non-conformance records; Corrective and preventive action records; and
Control questions for this chapter
Requirements Conformity
Yes No N/A
Are procedures maintained to ensure periodic review and appropriate approved distribution and revision of all required documents?
Is all documentation legible, readily retrievable and identifiable, and revision level or date identified?
Are obsolete documents promptly removed or otherwise assured against unintended use?
REVIEW OF THE ENERGY MANAGEMENT SYSTEM
MAINTAINING IMPETUS
BAT 12
BAT is to maintain the impetus of the energy efficiency programme by using a variety of techniques.
This BAT requests a company to: Implement a specific energy efficiency management system (see chapter 2.1) Account for energy usage based on real ( metered) values, which places both the obligation and credit for energy efficiency on the user/bill payer
2.8
2.8.1

Energy efficiency as a management approach42
Create of financial profit centres for energy efficiency Benchmarking (see chapter 2.6) Having a fresh look at existing systems, such as using 'operational excellence'
DEVELOPMENT OF ENE TECHNOLOGIES
BAT 10
BAT is to optimise energy efficiency when planning a new installation, unit or system or a significant upgrade.
BAT is applicable to the design of new, modified and renovated facilities, equipment, systems and processes that can have a significant impact on an organisation’s energy performance.
It is recommended to consider and identify energy performance improvement opportunities at the beginning of design, renovation work or modification of any significant energy using facilities, equipment, systems and processes. The whole process involves identifying design inputs, reviewing and verifying the design.
By incorporating the results of energy performance evaluation into the specification, design and procurement activities of relevant project(s), management can ensure that a sustainable design or an aggressive energy retrofit actually leads to targeted energy outcomes.
The following criteria could be considered in energy performance evaluation process during the design of new, modified and renovated facilities, equipment, systems and processes with significant energy impact:
alternative energy sources other possible energy saving measures Energy saving percentage (i.e. compared with the traditional technology), investment cost and payback period
Power rating, power factor and harmonic distortion Energy baseline Lifetime (i.e. frequency of replacement) Impact on efficiency, product quality, existing manufacturing process and production time Technical feasibility After-sale maintenance service and warranty
2.9
Energy efficiency measures 43
ENERGY EFFICIENCY MEASURES
COMBUSTION
BAT 17
BAT is to optimise the energy efficiency of combustion by relevant techniques such as: reduction of excess air, reduction of flue gas temperature and burner regulation and control.
Fuel is, technically speaking, a substance which can chemically react with oxygen (in the first place from the air) and produce heat energy. One kilogram of fuel requires a certain minimum of ambient air to be completely combusted (this minimum amount of air is called Stoichiometric Air or Theoretical Air). This amount of air will completely combust the fuel to Carbon Dioxide (CO2), water (H2O) and Sulphur Dioxide (SO2) if sulphur is present in the fuel. There will be also NOx and O2 in the flue gas. If the fuel does not get enough air for combustion, it will generate smoke and a potential unhealthy mixture of flue gas products (CO or H2 could be present in the flue gas as well). In addition to that, energy will be wasted. The similar applies if too much of excess air is used for combustion – there will be waste of energy. If there is excessive quantity of air there will be higher heat losses with flue gas.
Optimized combustion of fuel within boiler or fired heaters means energy efficient process of energy transformation. The less the losses are, the higher energy efficiency of the process is.
The heat losses within the combusting process can be categorized as: Losses via the flue gas - depending on the flue gas temperature, air/fuel ratio, fuel composition and the level of fouling of the boiler;
Losses due to unburnt fuel, where the chemical energy of fuel is not converted into heat (incomplete combustion causes CO and H2 to occur in the flue gas);
Losses due to unburnt material in the residues, including losses coming from unburnt carbon via the bottom and fly ash from a dry bottom boiler and the slag and fly ash from a wet bottom boiler.
The energy efficiency is a major cost drive for boilers as the fuel cost accounts for more than 90% of the boiler overall costs on a life-cycle basis. An improvement in the energy efficiency in combustion installations has a benefit in CO2 emissions reduction if it results in a reduction of the fuel consumption. In this case, the CO2 is reduced in proportion to the carbon content of the fuel saved. On the other hand, the improvement of efficiency may also be used to increase the energy released by the combustion process while keeping the same fuel flowrate. This may increase the capacity of the production unit while improving the energy efficiency. In this case, there is a specific CO2 emissions reduction (referred to the production level) but there will be no CO2 emissions reduction in absolute value.
3
3.1
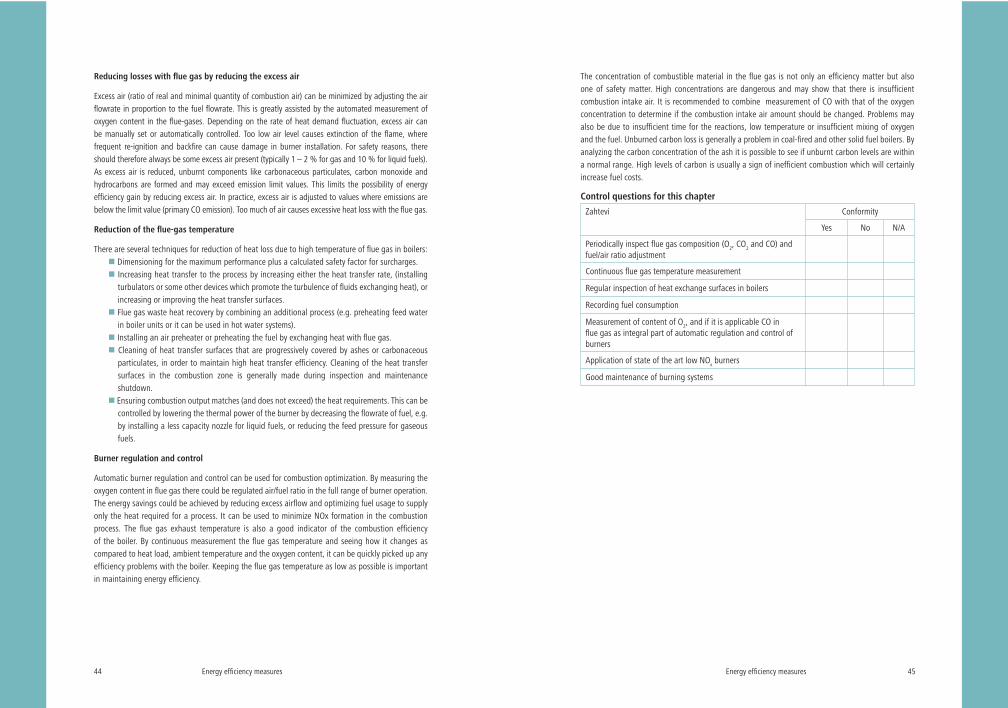
Energy efficiency measures44
Reducing losses with flue gas by reducing the excess air
Excess air (ratio of real and minimal quantity of combustion air) can be minimized by adjusting the air flowrate in proportion to the fuel flowrate. This is greatly assisted by the automated measurement of oxygen content in the flue-gases. Depending on the rate of heat demand fluctuation, excess air can be manually set or automatically controlled. Too low air level causes extinction of the flame, where frequent re-ignition and backfire can cause damage in burner installation. For safety reasons, there should therefore always be some excess air present (typically 1 – 2 % for gas and 10 % for liquid fuels). As excess air is reduced, unburnt components like carbonaceous particulates, carbon monoxide and hydrocarbons are formed and may exceed emission limit values. This limits the possibility of energy efficiency gain by reducing excess air. In practice, excess air is adjusted to values where emissions are below the limit value (primary CO emission). Too much of air causes excessive heat loss with the flue gas.
Reduction of the flue-gas temperature
There are several techniques for reduction of heat loss due to high temperature of flue gas in boilers: Dimensioning for the maximum performance plus a calculated safety factor for surcharges. Increasing heat transfer to the process by increasing either the heat transfer rate, (installing turbulators or some other devices which promote the turbulence of fluids exchanging heat), or increasing or improving the heat transfer surfaces.
Flue gas waste heat recovery by combining an additional process (e.g. preheating feed water in boiler units or it can be used in hot water systems).
Installing an air preheater or preheating the fuel by exchanging heat with flue gas. Cleaning of heat transfer surfaces that are progressively covered by ashes or carbonaceous particulates, in order to maintain high heat transfer efficiency. Cleaning of the heat transfer surfaces in the combustion zone is generally made during inspection and maintenance shutdown.
Ensuring combustion output matches (and does not exceed) the heat requirements. This can be controlled by lowering the thermal power of the burner by decreasing the flowrate of fuel, e.g. by installing a less capacity nozzle for liquid fuels, or reducing the feed pressure for gaseous fuels.
Burner regulation and control
Automatic burner regulation and control can be used for combustion optimization. By measuring the oxygen content in flue gas there could be regulated air/fuel ratio in the full range of burner operation. The energy savings could be achieved by reducing excess airflow and optimizing fuel usage to supply only the heat required for a process. It can be used to minimize NOx formation in the combustion process. The flue gas exhaust temperature is also a good indicator of the combustion efficiency of the boiler. By continuous measurement the flue gas temperature and seeing how it changes as compared to heat load, ambient temperature and the oxygen content, it can be quickly picked up any efficiency problems with the boiler. Keeping the flue gas temperature as low as possible is important in maintaining energy efficiency.
Energy efficiency measures 45
The concentration of combustible material in the flue gas is not only an efficiency matter but also one of safety matter. High concentrations are dangerous and may show that there is insufficient combustion intake air. It is recommended to combine measurement of CO with that of the oxygen concentration to determine if the combustion intake air amount should be changed. Problems may also be due to insufficient time for the reactions, low temperature or insufficient mixing of oxygen and the fuel. Unburned carbon loss is generally a problem in coal-fired and other solid fuel boilers. By analyzing the carbon concentration of the ash it is possible to see if unburnt carbon levels are within a normal range. High levels of carbon is usually a sign of inefficient combustion which will certainly increase fuel costs.
Control questions for this chapter
Zahtevi Conformity
Yes No N/A
Periodically inspect flue gas composition (O2, CO2 and CO) and fuel/air ratio adjustment
Continuous flue gas temperature measurement
Regular inspection of heat exchange surfaces in boilers
Recording fuel consumption
Measurement of content of O2, and if it is applicable CO in flue gas as integral part of automatic regulation and control of burners
Application of state of the art low NOx burners
Good maintenance of burning systems
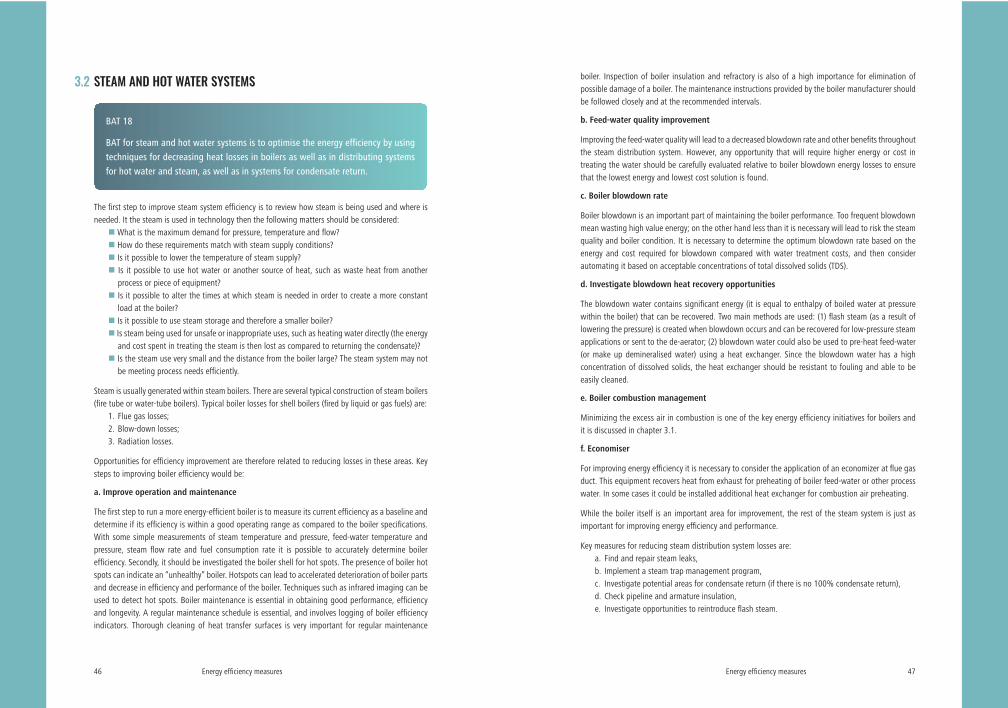
Energy efficiency measures46
STEAM AND HOT WATER SYSTEMS
BAT 18
BAT for steam and hot water systems is to optimise the energy efficiency by using techniques for decreasing heat losses in boilers as well as in distributing systems for hot water and steam, as well as in systems for condensate return.
The first step to improve steam system efficiency is to review how steam is being used and where is needed. It the steam is used in technology then the following matters should be considered:
What is the maximum demand for pressure, temperature and flow? How do these requirements match with steam supply conditions? Is it possible to lower the temperature of steam supply? Is it possible to use hot water or another source of heat, such as waste heat from another process or piece of equipment?
Is it possible to alter the times at which steam is needed in order to create a more constant load at the boiler?
Is it possible to use steam storage and therefore a smaller boiler? Is steam being used for unsafe or inappropriate uses, such as heating water directly (the energy and cost spent in treating the steam is then lost as compared to returning the condensate)?
Is the steam use very small and the distance from the boiler large? The steam system may not be meeting process needs efficiently.
Steam is usually generated within steam boilers. There are several typical construction of steam boilers (fire tube or water-tube boilers). Typical boiler losses for shell boilers (fired by liquid or gas fuels) are:
1. Flue gas losses;2. Blow-down losses;3. Radiation losses.
Opportunities for efficiency improvement are therefore related to reducing losses in these areas. Key steps to improving boiler efficiency would be:
a. Improve operation and maintenance
The first step to run a more energy-efficient boiler is to measure its current efficiency as a baseline and determine if its efficiency is within a good operating range as compared to the boiler specifications. With some simple measurements of steam temperature and pressure, feed-water temperature and pressure, steam flow rate and fuel consumption rate it is possible to accurately determine boiler efficiency. Secondly, it should be investigated the boiler shell for hot spots. The presence of boiler hot spots can indicate an “unhealthy” boiler. Hotspots can lead to accelerated deterioration of boiler parts and decrease in efficiency and performance of the boiler. Techniques such as infrared imaging can be used to detect hot spots. Boiler maintenance is essential in obtaining good performance, efficiency and longevity. A regular maintenance schedule is essential, and involves logging of boiler efficiency indicators. Thorough cleaning of heat transfer surfaces is very important for regular maintenance
3.2
Energy efficiency measures 47
boiler. Inspection of boiler insulation and refractory is also of a high importance for elimination of possible damage of a boiler. The maintenance instructions provided by the boiler manufacturer should be followed closely and at the recommended intervals.
b. Feed-water quality improvement
Improving the feed-water quality will lead to a decreased blowdown rate and other benefits throughout the steam distribution system. However, any opportunity that will require higher energy or cost in treating the water should be carefully evaluated relative to boiler blowdown energy losses to ensure that the lowest energy and lowest cost solution is found.
c. Boiler blowdown rate
Boiler blowdown is an important part of maintaining the boiler performance. Too frequent blowdown mean wasting high value energy; on the other hand less than it is necessary will lead to risk the steam quality and boiler condition. It is necessary to determine the optimum blowdown rate based on the energy and cost required for blowdown compared with water treatment costs, and then consider automating it based on acceptable concentrations of total dissolved solids (TDS).
d. Investigate blowdown heat recovery opportunities
The blowdown water contains significant energy (it is equal to enthalpy of boiled water at pressure within the boiler) that can be recovered. Two main methods are used: (1) flash steam (as a result of lowering the pressure) is created when blowdown occurs and can be recovered for low-pressure steam applications or sent to the de-aerator; (2) blowdown water could also be used to pre-heat feed-water (or make up demineralised water) using a heat exchanger. Since the blowdown water has a high concentration of dissolved solids, the heat exchanger should be resistant to fouling and able to be easily cleaned.
e. Boiler combustion management
Minimizing the excess air in combustion is one of the key energy efficiency initiatives for boilers and it is discussed in chapter 3.1.
f. Economiser
For improving energy efficiency it is necessary to consider the application of an economizer at flue gas duct. This equipment recovers heat from exhaust for preheating of boiler feed-water or other process water. In some cases it could be installed additional heat exchanger for combustion air preheating.
While the boiler itself is an important area for improvement, the rest of the steam system is just as important for improving energy efficiency and performance.
Key measures for reducing steam distribution system losses are:a. Find and repair steam leaks, b. Implement a steam trap management program, c. Investigate potential areas for condensate return (if there is no 100% condensate return),d. Check pipeline and armature insulation,e. Investigate opportunities to reintroduce flash steam.

Energy efficiency measures48
A suggested process to follow for improving the efficiency of hot water system is as follows:
a. Check insulation
Insulation is essential in reducing heat losses from the boiler, pipes and valves. New boilers are often very well insulated; however, older boilers may require more insulation or the insulation may have degraded. Poor insulation can account for losses of up to 10% of total input of energy in boiler. Adding or replacing insulation is a simple and cost-effective measure that can improve hot water system’s efficiency.
b. Reduce boiler exhaust losses
The exhaust flue gas of a boiler is one of the major sources of heat losses. Recovering this heat is a good way of improving boiler efficiency. Condensing boilers have this feature built-in. The exhaust gas can be passed through a heat exchanger with either the return water (in a circulating system) or the intake air to the boiler in order to reduce the energy required by the boiler. Increasing the temperature of the intake air by 20°C will increase the efficiency of the boiler by 1%. This sort of system is called a recuperative burner system, and may need special modifications to burner and its controls.
c. Review/select boiler controls
The effectiveness of boiler control system is one of the key factors in running an efficient hot water system. It should be checked which type of control boiler is using and whether it suits the demands. Some methods of operation control is described as follows:
Burner controls - Possible types of burner control are on/off, high/low and modulating, increasing in efficiency from the former to the latter.
Boiler interlock - By integrating the control of the boiler with thermostats on the heating distribution system, it is possible to avoid ‘dry-cycling’, which is the firing of the boiler while there is no demand for heat. This is quite a simple yet effective measure.
Sequence control - If multiple boilers are used, it is possible to use sequence control to turn unnecessary boilers off and avoid running multiple boilers at part load (low efficiency of boiler).
Optimized start/stop control - Often boilers have time switches to ensure the boiler is only operating during the times that production is running, for example, 8am – 6pm. An optimizer can be installed which receives input from process thermostats, allowing the boiler to operate for the shortest length of day possible while still maintaining the required heating for the process.
d. Maintenance
Regular maintenance of hot water generator is essential to keep it running efficiently. A maintenance routine, maintenance manual and logbook for tracking are all important features in a maintenance plan. A number of specific maintenance tasks should be performed to ensure the best performance and lifetime for boiler. Some of activities within regular and preventive maintenance are as follows:
Analyze flue gas - If using gas/liquid fuel, an analysis of the flue exhaust gases and the concentrations of oxygen, carbon monoxide and carbon dioxide will give an indication of combustion efficiency, which can be compared against the specifications of how boiler should perform. This is a good way of determining the “health” of the boiler.
Energy efficiency measures 49
Remove soot build-up - Gas boilers will create a build-up of soot over time. This soot is a layer of unburnt fuel particles that builds up on the fireside of the heat exchanger. This layer will insulate the water and reduce efficiency. A 1 mm layer of soot will increase the energy required by the boiler by 10%. Removal of this soot is an important maintenance task.
Lime-scale build-up - If the water supply is particularly hard water, then lime-scale build-up can occur on the water side of the heat exchanger. As with the soot build-up, this inhibits the heating of the water (increase the heat resistance on a heat exchange surface). Removal of lime-scale is best done with chemical treatment. Again, this task is important, as a 1 mm layer of lime-scale will create a 7% increase in the energy input to the boiler.
e. Reduce hot water temperature
The temperature set point of a boiler is a major factor in determining the heat lost throughout hot water system. By reducing the temperature of hot water supply to the minimum required for specific application, it is possible to save significant amounts of energy.
f. Conserve hot water consumption
A key efficiency measure is to stop hot water going down the drain. This can be done a number of ways:
Repair leaks - Any leaks in the hot water system are causing system to lose water and waste energy. It is essential to find and repair any leaks as far as possible.
Use efficient fittings - Use efficient nozzles and taps wherever possible. It may involve an initial cost but will soon pay off in both water and energy savings.
Appropriate uses - Ensure that hot water is not being used for jobs for which there is a more suitable alternative.
Consider higher system pressure - There is a trade-off between using higher pressure water sprays (which use more electricity, but less hot water and therefore heating energy), and low-pressure systems. Consider the application of high pressure systems for cleaning or other uses.
g. Analyse system for hot water distribution
Minimizing the distance between hot water boiler and the end uses of hot water will save the significant heat losses from piping.
h. Replace hot water boiler
While the above key energy efficiency measures will help hot water system to run more efficiently, if the boiler is quite old or is in poor condition, then it may be beneficial to consider the replacement of the boiler. Typical hot water boiler lifetimes are 15-20 years. While replacing the boiler may appear to be a large cost, the potential savings in energy and maintenance costs of running the new boiler, as compared to the old, one could make it worthwhile. Replacing the boiler is not as simple as reading the specifications on the nameplate of the old boiler and ordering a new one with those specifications. As a first step, a review should be undertaken that looks at site’s heating demand.

Energy efficiency measures50
Such a review should consider the following points: What is the site’s heating requirements? What fuel supply will be used? Where will the new boiler be located? Is the new boiler a condensing boiler? Will it be compatible with the current site heating system? How will maintenance costs compare to the old boiler? Will there be the reduction in emissions of Carbon-dioxide, Sulphur-dioxide and Nitrogen-oxides?
i. Condensing Boilers
Condensing boilers have an in-built second heat exchanger that recuperates waste heat in the exhaust gases and returns it to the system. It also allows more water vapour in the exhaust to condense and also returns this energy to the system, reducing the energy consumption. Using a condensing boiler as the replacement can save between 10% and 20% of annual energy costs. Condensing boilers are applicable when gaseous fuels are used.
Control questions for this chapter
Requirements Conformity
Yes No N/A
Improve steam/hot water boiler operation and maintenance
Investigate opportunities for feed-water quality improvement
Determine boiler blowdown rate
Investigate blowdown heat recovery opportunities
Boiler combustion management
Review/select boiler controls
Analyse flue gas
Remove soot build-up
Remove lime-scale build-up
Reduce boiler exhaust losses by installing economizer
Check boiler and distribution system insulation
Find and repair steam/hot water leaks
Investigate potential areas for condensate return
Investigate opportunities to reintroduce flash steam
Reduce hot water temperature
Conserve hot water consumption
Consider higher hot water system pressure
Review system for hot water distribution
Consider replacement of hot water boiler
Consider to install condensing boiler
Energy efficiency measures 51
HEAT RECOVERY
BAT 19
BAT for heat recovery recognize the following:- Direct usage: heat exchangers make use of heat as it is in the surplus stream (hot
flue gases from boilers or furnaces).- For low temperature streams it is possible to apply heat pumps (presented in
chapter 4.2).- Multistage operations such as multi-effect evaporation, steam flashing and
combinations of the approaches already mentioned (presented in chapter 3.2).
Heat recovery is the best option for improving process heating system efficiency. It is almost “free” energy from gases or liquids that would be otherwise vented or removed. In high-temperature process applications, heat recovery is doubly important, as the higher the temperature of the combustion gases the more energy is being lost to the surroundings.
Some of the more common heat recovery techniques are discussed below, most of which can save between 5% and 20% of the energy costs. In any case, it should be performed feasibility analysis that presumes the following steps:
1. Identifying the heat sourcea. Roughly estimate how much heat is available?b. When is the heat available?c. Where is the heat available?
2. Identify the heat sink a. Roughly estimate how much heat is requested?b. When is the heat needed?c. Where is the heat needed?
3. Is there a match between heat source and sink?a. Useful quantities of heat?b. Are the sources and sinks synchronized??c. Where are the locations of sources and sinks?
4. Estimate the economicsa. Capital costs?b. Running costs?c. Payback period?
Combustion air pre-heating
The simplest and yet one of the most effective techniques is to pass the exhaust gases through a heat exchanger to transfer heat to the intake combustion air, thereby reducing the fuel required to heat the process. This measure directly influences on efficiency of boiler. Yet, it is possible to use waste heat within another system or unit, thus improving efficiency of the system as a whole.
3.3

Energy efficiency measures52
Cascading
If there are multiple process heating applications, it is possible to cascade waste heat from one process to another. If there is exhaust gases from one process that are, e.g. at 120°C, while another process is being heated to only 80°C, then it is possible to use the waste heat of the exhaust of the first to assist in heating the second. This technique can be used to cascade waste heat through multiple different processes, either by using the exhaust of the original process in subsequently lower temperature processes, or by using the waste heat from each process in the next.
Hot water and steam generation
Waste heat from a flue gas can be used to assist in the generation of hot water (e.g. sanitary hot water). Using the exhaust gases of a process to preheat intake water for a hot water boiler, or feed-water of the steam generation boiler, is a very simple and yet efficient way to reduce total energy costs. Steam generation requires higher temperatures of flue gas (e.g. flue gas from furnaces).
Absorption cooling
As well as using exhaust gases for heating, it may also be possible to use them for cooling. It is possible to use the exhaust to absorb heat and vent it to the atmosphere, thereby reducing the load on cooling system and saving energy. The possibilities for absorption cooling are highly dependent on technology. Maintenance costs can be significant and should be investigated thoroughly.
Heat recovery from compressor unit
While over 90% of the energy input to compressors is lost as heat, it is usually at a relatively low grade for process work. However, it is commonly at temperatures suitable for building services and other applications. Recovering this heat can prove highly cost-effective, reducing overall energy bills and also benefiting the environment. In practice, air-cooled compressors can provide hot air at up to 80oC and water-cooled compressors can provide hot water up to 95 oC. A typical air compressor of 47 l/s capacity consumes 22 kW at full load, of which 20 kW can be recovered as heat. If the recovered heat replaces electric heating, the effective cost of generating compressed air will fall by up to 90%. Even where the replaced fuel source is a cheaper fossil fuel or gas, considerable cost savings can still be made.
In general, the capital cost of the additional equipment necessary for heat recovery is relatively modest, providing a quick return on investment. In some cases, heat recovery systems can replace heating or hot water systems entirely, thus reducing overall capital costs.
Kontrolna pitanja u vezi poglavlja
Requirements Conformity
Yes No N/A
Identify waste heat sources
Identify heat needs
Investigate match between waste heat source and heat needs
Utilize waste heat from flue gas – economiser/air preheater
Utilize waste heat from compressed air system
Energy efficiency measures 53
COGENERATION
BAT 20
BAT is to seek possibilities for cogeneration, inside and/or outside the installation (with a
third party).
The European Union has adopted a new common framework to promote energy efficiency. The Energy Efficiency Directive (2012/27/EU) - EED aims to put the Union back on track towards achieving its 20% energy efficiency target by 2020. This Directive amended Directives 2009/125/EC and 2010/30/EU and repelled Directives 2004/8/EC and 2006/32/EC. According to EED Member States are obliged to perform detailed cost-benefit analysis for all new electricity and heat generation installations and existing installations which are substantially refurbished or whose permit or license is updated considering possibility of installation with high-efficiency cogeneration. It should be encouraged the introduction of measures and procedures to promote cogeneration installations considering its high efficiency.
CHP plants are those producing combined heat and power. There are different cogeneration technologies and there is difference according to default power to heat ratio:
1. Combined cycle gas turbines (gas turbines combined with waste heat recovery boilers and steam boilers),
2. Steam turbine (backpressure),3. Steam condensing extraction turbine (backpressure, uncontrolled extraction condensing
turbines and extraction condensing turbines),4. Gas turbine with heat recovery boilers,5. Internal combustion engines (Otto or Diesel engines with heat recovery),6. Micro turbines,7. Stirling engines,8. Fuel Cells with heat recuperation,9. Steam engines,
10. Organic Rankin Cycle.
Each technology is characterized with parameter called power-heat ratio, thus, size of CHP plant is determined according to this parameter. Highest power-heat ration has technology (1) – 0.95, and the lowest (2) and (3) – 0.45. Technology with IC engines (5) has power-heat ratio 0.75. It is essential to have actual data on power-heat demand. Especially important is to exact determine heat demand, since produced power could be easily distributed in outer power network.
CHP plant based on IC engine is presented on Figure 5.
3.4
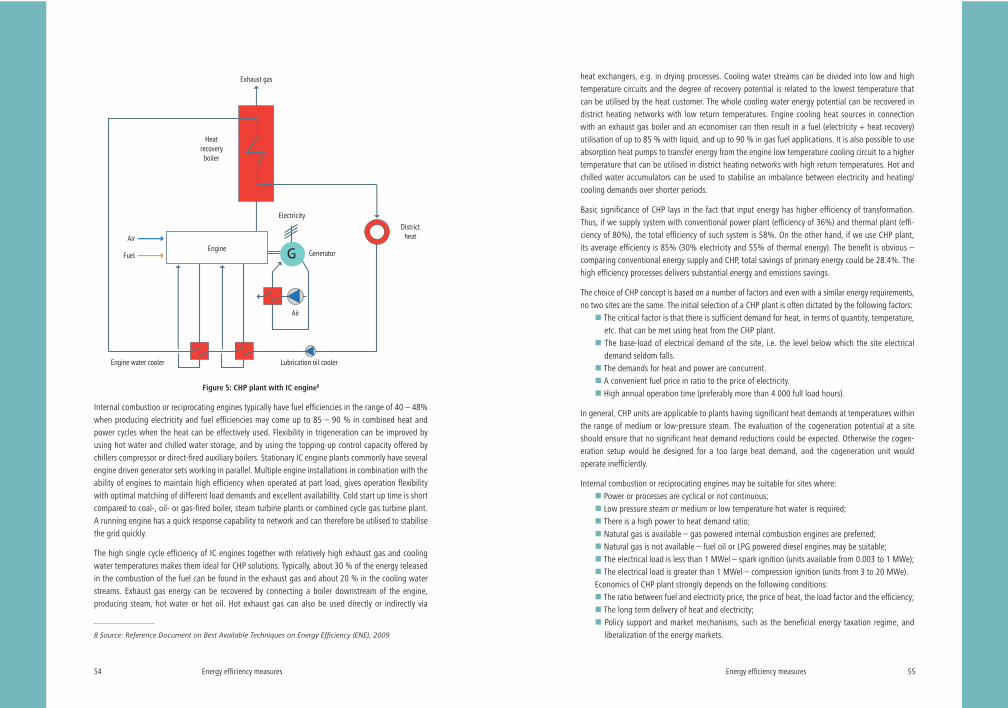
Energy efficiency measures54
Figure 5: CHP plant with IC engine8
Internal combustion or reciprocating engines typically have fuel efficiencies in the range of 40 – 48% when producing electricity and fuel efficiencies may come up to 85 – 90 % in combined heat and power cycles when the heat can be effectively used. Flexibility in trigeneration can be improved by using hot water and chilled water storage, and by using the topping-up control capacity offered by chillers compressor or direct-fired auxiliary boilers. Stationary IC engine plants commonly have several engine driven generator sets working in parallel. Multiple engine installations in combination with the ability of engines to maintain high efficiency when operated at part load, gives operation flexibility with optimal matching of different load demands and excellent availability. Cold start up time is short compared to coal-, oil- or gas-fired boiler, steam turbine plants or combined cycle gas turbine plant. A running engine has a quick response capability to network and can therefore be utilised to stabilise the grid quickly.
The high single cycle efficiency of IC engines together with relatively high exhaust gas and cooling water temperatures makes them ideal for CHP solutions. Typically, about 30 % of the energy released in the combustion of the fuel can be found in the exhaust gas and about 20 % in the cooling water streams. Exhaust gas energy can be recovered by connecting a boiler downstream of the engine, producing steam, hot water or hot oil. Hot exhaust gas can also be used directly or indirectly via
8 Source: Reference Document on Best Available Techniques on Energy Efficiency (ENE), 2009
Exhaust gas
DistrictheatAir
Air
Fuel
Heatrecovery
boiler
Engine
Electricity
GeneratorG
Engine water cooler Lubrication oil cooler
Energy efficiency measures 55
heat exchangers, e.g. in drying processes. Cooling water streams can be divided into low and high temperature circuits and the degree of recovery potential is related to the lowest temperature that can be utilised by the heat customer. The whole cooling water energy potential can be recovered in district heating networks with low return temperatures. Engine cooling heat sources in connection with an exhaust gas boiler and an economiser can then result in a fuel (electricity + heat recovery) utilisation of up to 85 % with liquid, and up to 90 % in gas fuel applications. It is also possible to use absorption heat pumps to transfer energy from the engine low temperature cooling circuit to a higher temperature that can be utilised in district heating networks with high return temperatures. Hot and chilled water accumulators can be used to stabilise an imbalance between electricity and heating/cooling demands over shorter periods.
Basic significance of CHP lays in the fact that input energy has higher efficiency of transformation. Thus, if we supply system with conventional power plant (efficiency of 36%) and thermal plant (effi-ciency of 80%), the total efficiency of such system is 58%. On the other hand, if we use CHP plant, its average efficiency is 85% (30% electricity and 55% of thermal energy). The benefit is obvious – comparing conventional energy supply and CHP, total savings of primary energy could be 28.4%. The high efficiency processes delivers substantial energy and emissions savings.
The choice of CHP concept is based on a number of factors and even with a similar energy requirements, no two sites are the same. The initial selection of a CHP plant is often dictated by the following factors:
The critical factor is that there is sufficient demand for heat, in terms of quantity, temperature, etc. that can be met using heat from the CHP plant.
The base-load of electrical demand of the site, i.e. the level below which the site electrical demand seldom falls.
The demands for heat and power are concurrent. A convenient fuel price in ratio to the price of electricity. High annual operation time (preferably more than 4 000 full load hours).
In general, CHP units are applicable to plants having significant heat demands at temperatures within the range of medium or low-pressure steam. The evaluation of the cogeneration potential at a site should ensure that no significant heat demand reductions could be expected. Otherwise the cogen-eration setup would be designed for a too large heat demand, and the cogeneration unit would operate inefficiently.
Internal combustion or reciprocating engines may be suitable for sites where: Power or processes are cyclical or not continuous; Low pressure steam or medium or low temperature hot water is required; There is a high power to heat demand ratio; Natural gas is available – gas powered internal combustion engines are preferred; Natural gas is not available – fuel oil or LPG powered diesel engines may be suitable; The electrical load is less than 1 MWel – spark ignition (units available from 0.003 to 1 MWe); The electrical load is greater than 1 MWel – compression ignition (units from 3 to 20 MWe).
Economics of CHP plant strongly depends on the following conditions: The ratio between fuel and electricity price, the price of heat, the load factor and the efficiency; The long term delivery of heat and electricity; Policy support and market mechanisms, such as the beneficial energy taxation regime, and liberalization of the energy markets.
Energy efficiency measures56
Control questions for this chapter
Requirements Conformity
Yes No N/A
Check power-heat ratio within company energy demand through a year
Determine annual operating time of CHP
Determine fuel/electricity price ratio and subventions for pro-duced power and heat
Define most appropriate high efficiency CHP technology for specific implementation
Is there possibility for trigeneration (combined heat, cool and electricity production)?
ELECTRIC POWER SUPPLY
BAT 21, 22, 23
BAT 21 is to increase the power factor according to the requirements of the local electricity distributor.
BAT 22 is to check the quality of power supply (harmonics and application of filters if required).
BAT 23 is to optimise the power supply efficiency.
Losses and efficiency Transformers are inherently very efficient, by design. Efficiency varies from 96 per cent to 99 per cent.
However, transformer efficiency depends on load (% loading), making efficiency dependent not only on design but also on the effective operating load.
Transformer losses are of two types:1. No-load loss also referred to as 'core loss'—the power consumed to sustain the magnetic field
in the transformer's core.2. Load loss—associated with full-load current flow in the transformer windings and due,
primarily, to the resistance of the winding material. Because transformers traditionally used copper windings, load loss is also referred to as 'copper loss'. According to Ohm's Law for power in a resistor (P=I2R), copper loss varies with the square of the load current.
3.5
Energy efficiency measures 57
Reducing transformer losses
Greatly oversized transformers can contribute to inefficiency. When transformers are matched to their loads, efficiency increases
Capital costs for transformers depends on construction and its components. Amorphous iron is expensive but reduces core loss to less than 30 per cent of conventional steel core losses. An alternative, less expensive core material is silicone steel which has higher losses than amorphous iron but lower than standard carbon steel.
Control questions for this chapter
Requirements Conformity
Yes No N/A
Ensure power cables have the correct dimensions for the power demand (e. g. according to DIN VDE 0298 and/or SRPS HD 60364-5-52:2012)
Keep online transformer(s) operating at a load above 40 – 50 % of the rated power
Use high efficiency/low loss transformers
Place equipment with a high current demand as close as possib-le to the power source, so the losses are minimized
Power factor correction
Some devices, due to its construction and operation principle produces reactive power and send it back to the grid. The reactive power loads distribution network, therefore external suppliers, make additional charges for reactive power if this exceeds a certain threshold. Usually, a certain target power factor of cos of between 1.0 and 0.95 (lagging) is specified, at which point the reactive energy requirement is significantly reduced. If this is not the case, consumer will have additional cost at its electricity bill.
Control questions for this chapter
Requirements Conformity
Yes No N/A
Monitor power factor and compensate to power factor of > 0.95 by installing a condenser bank
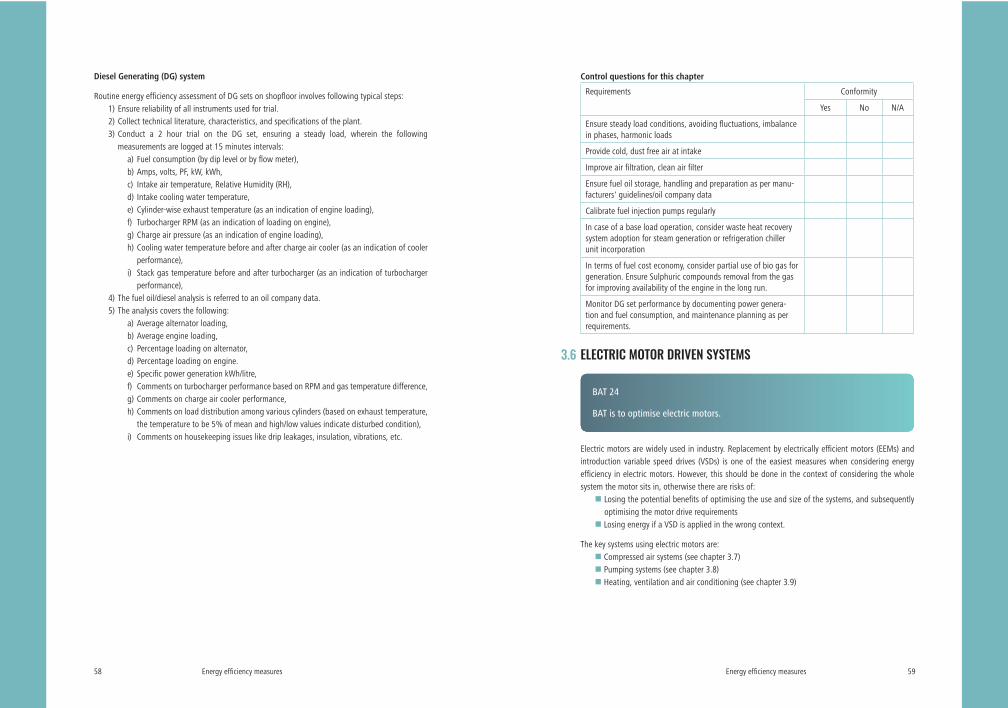
Energy efficiency measures58
Diesel Generating (DG) system
Routine energy efficiency assessment of DG sets on shopfloor involves following typical steps:1) Ensure reliability of all instruments used for trial.2) Collect technical literature, characteristics, and specifications of the plant.3) Conduct a 2 hour trial on the DG set, ensuring a steady load, wherein the following
measurements are logged at 15 minutes intervals:a) Fuel consumption (by dip level or by flow meter),b) Amps, volts, PF, kW, kWh,c) Intake air temperature, Relative Humidity (RH),d) Intake cooling water temperature,e) Cylinder-wise exhaust temperature (as an indication of engine loading),f) Turbocharger RPM (as an indication of loading on engine),g) Charge air pressure (as an indication of engine loading),h) Cooling water temperature before and after charge air cooler (as an indication of cooler
performance),i) Stack gas temperature before and after turbocharger (as an indication of turbocharger
performance),4) The fuel oil/diesel analysis is referred to an oil company data.5) The analysis covers the following:
a) Average alternator loading,b) Average engine loading,c) Percentage loading on alternator,d) Percentage loading on engine.e) Specific power generation kWh/litre,f) Comments on turbocharger performance based on RPM and gas temperature difference,g) Comments on charge air cooler performance,h) Comments on load distribution among various cylinders (based on exhaust temperature,
the temperature to be 5% of mean and high/low values indicate disturbed condition),i) Comments on housekeeping issues like drip leakages, insulation, vibrations, etc.
Energy efficiency measures 59
Control questions for this chapter
Requirements Conformity
Yes No N/A
Ensure steady load conditions, avoiding fluctuations, imbalance in phases, harmonic loads
Provide cold, dust free air at intake
Improve air filtration, clean air filter
Ensure fuel oil storage, handling and preparation as per manu-facturers' guidelines/oil company data
Calibrate fuel injection pumps regularly
In case of a base load operation, consider waste heat recovery system adoption for steam generation or refrigeration chiller unit incorporation
In terms of fuel cost economy, consider partial use of bio gas for generation. Ensure Sulphuric compounds removal from the gas for improving availability of the engine in the long run.
Monitor DG set performance by documenting power genera-tion and fuel consumption, and maintenance planning as per requirements.
ELECTRIC MOTOR DRIVEN SYSTEMS
BAT 24
BAT is to optimise electric motors.
Electric motors are widely used in industry. Replacement by electrically efficient motors (EEMs) and introduction variable speed drives (VSDs) is one of the easiest measures when considering energy efficiency in electric motors. However, this should be done in the context of considering the whole system the motor sits in, otherwise there are risks of:
Losing the potential benefits of optimising the use and size of the systems, and subsequently optimising the motor drive requirements
Losing energy if a VSD is applied in the wrong context.
The key systems using electric motors are: Compressed air systems (see chapter 3.7) Pumping systems (see chapter 3.8) Heating, ventilation and air conditioning (see chapter 3.9)
3.6
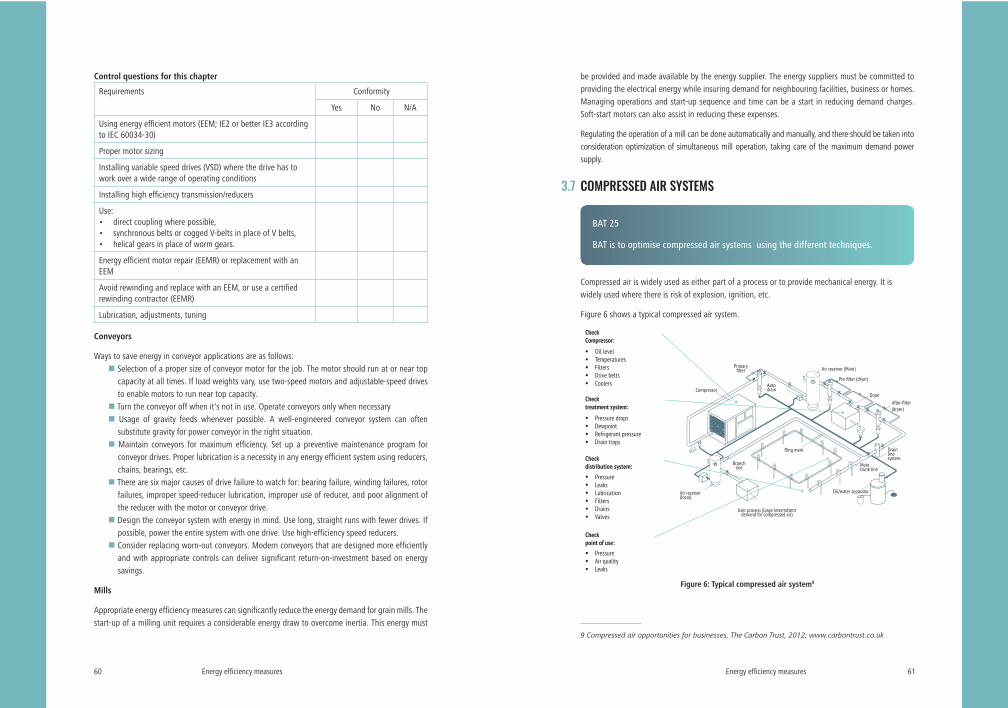
Energy efficiency measures60
Control questions for this chapter
Requirements Conformity
Yes No N/A
Using energy efficient motors (EEM; IE2 or better IE3 according to IEC 60034-30)
Proper motor sizing
Installing variable speed drives (VSD) where the drive has to work over a wide range of operating conditions
Installing high efficiency transmission/reducers
Use:• direct coupling where possible,• synchronous belts or cogged V-belts in place of V belts,• helical gears in place of worm gears.
Energy efficient motor repair (EEMR) or replacement with an EEM
Avoid rewinding and replace with an EEM, or use a certified rewinding contractor (EEMR)
Lubrication, adjustments, tuning
Conveyors
Ways to save energy in conveyor applications are as follows: Selection of a proper size of conveyor motor for the job. The motor should run at or near top capacity at all times. If load weights vary, use two-speed motors and adjustable-speed drives to enable motors to run near top capacity.
Turn the conveyor off when it's not in use. Operate conveyors only when necessary Usage of gravity feeds whenever possible. A well-engineered conveyor system can often substitute gravity for power conveyor in the right situation.
Maintain conveyors for maximum efficiency. Set up a preventive maintenance program for conveyor drives. Proper lubrication is a necessity in any energy efficient system using reducers, chains, bearings, etc.
There are six major causes of drive failure to watch for: bearing failure, winding failures, rotor failures, improper speed-reducer lubrication, improper use of reducer, and poor alignment of the reducer with the motor or conveyor drive.
Design the conveyor system with energy in mind. Use long, straight runs with fewer drives. If possible, power the entire system with one drive. Use high-efficiency speed reducers.
Consider replacing worn-out conveyors. Modern conveyors that are designed more efficiently and with appropriate controls can deliver significant return-on-investment based on energy savings.
Mills
Appropriate energy efficiency measures can significantly reduce the energy demand for grain mills. The start-up of a milling unit requires a considerable energy draw to overcome inertia. This energy must
Energy efficiency measures 61
be provided and made available by the energy supplier. The energy suppliers must be committed to providing the electrical energy while insuring demand for neighbouring facilities, business or homes. Managing operations and start-up sequence and time can be a start in reducing demand charges. Soft-start motors can also assist in reducing these expenses.
Regulating the operation of a mill can be done automatically and manually, and there should be taken into consideration optimization of simultaneous mill operation, taking care of the maximum demand power supply.
COMPRESSED AIR SYSTEMS
BAT 25
BAT is to optimise compressed air systems using the different techniques.
Compressed air is widely used as either part of a process or to provide mechanical energy. It is widely used where there is risk of explosion, ignition, etc.
Figure 6 shows a typical compressed air system.
CheckCompressor:
Oil levelTemperaturesFiltersDrive beltsCoolers
Checktreatment system:
Pressure dropsDewpointRefrigerant pressureDrain traps
Check distribution system:
PressureLeaksLubricationFiltersDrainsValves
Checkpoint of use:
PressureAir qualityLeaks
Compressor
Primary
Autodrain
Air receiver (Main)
Dryer
(dryer)
Drainlinesystem
Oil/water separatorAir receiver(local)
User process (large intermittentdemand for compressed air)
Ring main
Main trunk line
Branchline
Figure 6: Typical compressed air system9
9 Compressed air opportunities for businesses, The Carbon Trust, 2012; www.carbontrust.co.uk
3.7

Energy efficiency measures62
Control questions for this chapter
Requirements Conformity
Yes No N/A
Overall system design, including multi-pressure systems
Upgrade compressor guaranteeing a consumption of in between 0,08 kWh/sm³ to 0,10 kWh/sm³
Improve cooling, drying and filtering
Reduce frictional pressure losses (for example by increasing pipe diameter)
Improvement of drives (high efficiency motors)
Improvement of drives (speed control)
Use of advanced control systems to optimize system efficiency (e. g. using a rigid screw compressor for the base load and a frequency controlled speed drive screw compressors for covering the peeks in load)
Recover waste heat of compressor unit (e.g. sanitary water or space heating)
Use external cool air as intake
Storage of compressed air near highly-fluctuating uses
Replace pneumatic tools by electric tools where possible
Reduce air leaks by checking the air distribution system (e. g. every 3 months) with a focus on connectors and flexible hoses
More frequent filter replacement
Optimise working pressure to as low as possible value
Energy efficiency measures 63
PUMPING SYSTEMS
BAT 26
BAT is to optimise pumping systems by using the techniques according to applicability.
Pumps are not only one component of pumping systems which also include motors, drives, piping and valves (closing, regulating and safety valves). Typically, much less than half the electricity input to a pumping system is converted into useful movement of fluid. The rest is dissipated in the various components that make up the system. Energy losses are even greater when the system is not operating at its design point. There is, therefore, a considerable potential for saving electricity, by both improving component efficiencies and through better system design.
Energy efficiency measures: Operate pumps near their best efficiency point (BEP), Ensure adequate net positive suction head (NPSH) at site of installation, Modify pumping system and pumps losses to minimize throttling, Ensure availability of basic instruments at pumps like pressure gauges, flow meters, Adapt to wide load variation with variable speed drives or sequenced control of multiple units, Avoid operating more than one pump for the same application, Use booster pumps for small loads requiring higher pressures, To improve the performance of heat exchangers, reduce the difference in temperature between the inlet and outlet rather than increasing the flow rate,
Repair seals and packing to minimize water loss by dripping, Balance the system to minimize flows and reduce pump power requirements, Avoid pumping head with a free-fall return (gravity), and use the siphon effect, Conduct a water balance to minimize water consumption, thus optimize pump operation, Avoid cooling water re-circulation in DG sets, air compressors, refrigeration systems, cooling towers feed water pumps, condenser pumps and process pumps,
In multiple pump operations, carefully combine the operation of pumps to avoid throttling, Replace old pumps with energy efficient pumps, To improve the efficiency of oversized pumps, install variable speed drive, downsize /replace impeller, or replace with a smaller pump,
Optimize the number of stages in multi-stage pump if margins in pressure exist, Reduce the system resistance by pressure drop assessment and pipe size optimization, Regularly check for vibration to predict bearing damage, misalignments, unbalance, foundation looseness etc.
3.8
Energy efficiency measures64
Control questions for this chapter
Requirements Conformity
Yes No N/A
Avoid over-sizing when selecting pumps and replace oversized pumps by adequately designed pumps (volume delivery and pres-sure head)
Match the correct pump to the correct motor for the duty
Design of pipework system to minimize length of pipe work, number of knees etc. to keep pressure drop low, keep velocity below 5 m/s
Shut down unnecessary pumps
Use of variable speed drives (VSDs) for pumps which work over a range of working conditions
Use of multiple pumps in parallel to serve different volume levels
Use of booster pumps to serve different pressure levels
Where unplanned maintenance becomes excessive, check for: • Cavitation,• Wear,• Wrong type of pump.
Energy efficiency measures 65
HVAC (HEATING, VENTILATION, AIR CONDITIONING)
BAT 27
BAT is to optimise heating, ventilation and air conditioning systems.
Heating, ventilating and air conditioning system should provide favourable conditions for animals within objects.
Heating and hot water preparation can account for 60 % of your total energy use. By ensuring that efficient heating systems are specified, operated and maintained the potential savings can be substantial. There are three key ways of cutting heating costs:
1. Turning down operating parameters
Lowering set points by just 1 °C can potentially reduce the annual heating bill by up to 8.
2. Replace inefficient boilers
It is very important to have all elements of heating system operating in efficient manner. Therefore, it is impotent to keep boiler efficiency as high as it is possible. (For more information regarding boilers see chapter 3.1)
3. Install de-stratification fans
In commercial or industrial buildings with warm air heaters and high ceilings, de-stratification fans can reduce energy use by 20 % by blowing warm air down to ground level where it's needed.
Control questions for this chapter
Requirements Conformity
Yes No N/A
Improve the efficiency of heating systems through: • recovery or use of wasted heat, • heat pumps• radiative and local heating systems coupled with reduced
temperature set points in the non-occupied areas
Approximately 60 % of heat (see Figure 7) is lost through the building envelope. In particular to improve the efficiency of a building one have to look at:
Cavity wall and roof insulation, Windows and glazing, including the benefits of double glazing, low-emissivity glass and integrated blinds,
Air infiltration and the importance of replacing broken seals and improving draught proofing.
3.9

Energy efficiency measures66
Roof22%
Windows26%
Walls9%
Floor8%
Ventilation
35%
Figure 7: Heat losses10
A good starting point for improving building envelope is to look around a building and create a checklist of areas to inspect regularly and problems to look out for. Check roofs and lofts, walls, windows and doors which can offer low or no cost efficiency measures.
Figure 8 shows typical poultry farm with (left) the ceiling and walls well insulated with polyurethane sandwich boards or polyurethane foam and (right) without any kind of insulation.
a) b)Figure 8: Typical poultry farm with (left) the ceiling and walls well insulated with polyurethane
sandwich boards or polyurethane foam and (right) without any kind of insulation 11
10 Building fabric, energy saving techniques to improve the energy efficiency of building structures, The Carbon Trust, 2012; www.carbontrust.co.uk11 Source: http://www.thermamasta.co.za/chicken-loft-insulation/
Energy efficiency measures 67
Energy saving measures
Roofs and lofts
Over 20% of heat in a building is lost through the roof. Improving insulation levels in this area can often be cost effective, particularly with pitched roofs.
Examples of energy saving measures are listed below: Inspect for signs of damage; Insulating pitched roofs; Insulating flat roofs
Walls
Around 9 % of heat lost in a building is through the envelope. Improving insulation here is particularly cost-effective in cavity walls.
Examples of energy saving measures are listed below: Regularly check buildings for damp: Damp can cause significant damage to the building structure and reduces its insulating properties. Repair split downpipes, faulty gutters and leaky roofs immediately to prevent further damage. Check for signs of damp and condensation at least once a year, preferably in winter months when condensation risk is at its highest.
Seal gaps in walls: Check walls for draughts, especially around skirting and roof joins as well as around window and door frames. Seal any gaps where draughts can be felt to reduce heating costs and improve comfort.
External insulated rendered systems: One of the most common ways to insulate a solid external wall is by applying insulation board to the external side of the building envelope and protecting it with a specialist render. This method can be employed in new build construction and also during refurbishment of existing buildings.
Windows
Used effectively, windows can reduce requirements for lighting and mechanical cooling. However, they can account for over a quarter of a building’s heat loss. Glazing lets in solar heat, and whilst this can be beneficial in reducing heating requirements in colder weather, it can make buildings uncomfortably warm in summertime.
Examples of energy saving measures are listed below: Keep windows closed, Make good use of natural daylight, Undertake regular maintenance: Regularly check windows, replace broken or cracked panes and frames. Fit draught stripping where appropriate and replace any sections showing wear or damage.
use windows with good transmission coefficient - double glazing is now a minimum requirement when replacing windows.
Doors
Easy access to almost any building is essential, but open doors can allow uncontrolled quantities of air into a building, reducing comfort conditions and wasting energy.
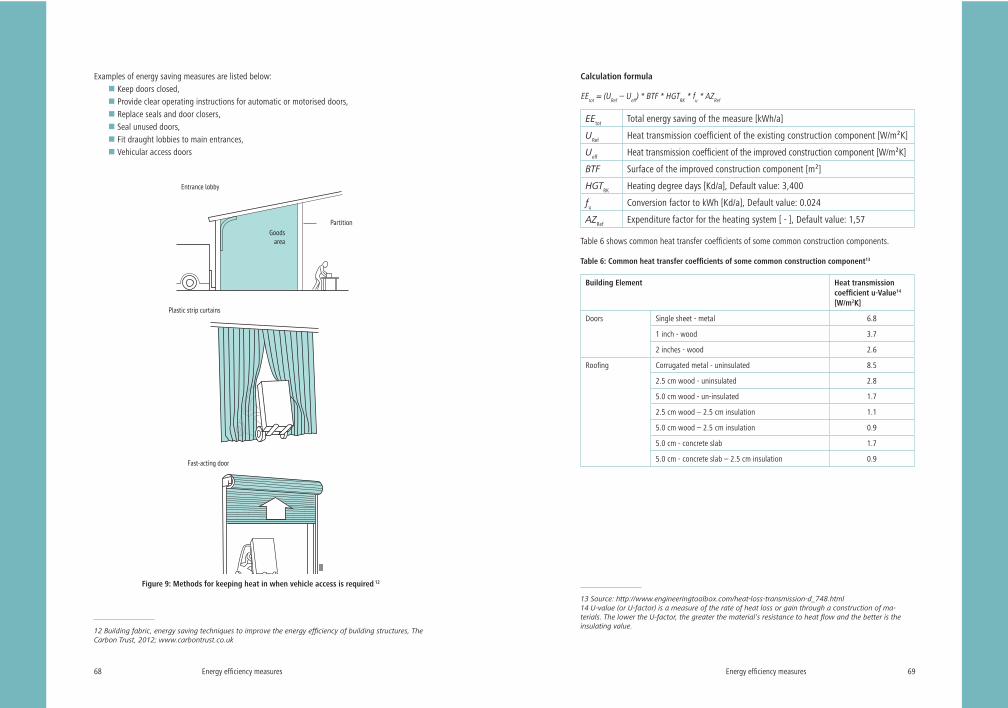
Energy efficiency measures68
Examples of energy saving measures are listed below: Keep doors closed, Provide clear operating instructions for automatic or motorised doors, Replace seals and door closers, Seal unused doors, Fit draught lobbies to main entrances, Vehicular access doors
Entrance lobby
Goodsarea
Partition
Plastic strip curtains
Fast-acting door
Figure 9: Methods for keeping heat in when vehicle access is required 12
12 Building fabric, energy saving techniques to improve the energy efficiency of building structures, The Carbon Trust, 2012; www.carbontrust.co.uk
Energy efficiency measures 69
Calculation formula
EEtot = (URef – Ueff) * BTF * HGTRK * fu * AZRef
EEtot Total energy saving of the measure [kWh/a]
URef Heat transmission coefficient of the existing construction component [W/m²K]
Ueff Heat transmission coefficient of the improved construction component [W/m²K]
BTF Surface of the improved construction component [m²]
HGTRK Heating degree days [Kd/a], Default value: 3,400
fu Conversion factor to kWh [Kd/a], Default value: 0.024
AZRef Expenditure factor for the heating system [ - ], Default value: 1,57
Table 6 shows common heat transfer coefficients of some common construction components.
Table 6: Common heat transfer coefficients of some common construction component13
Building Element Heat transmission coefficient u-Value14 [W/m2K]
Doors Single sheet - metal 6.8
1 inch - wood 3.7
2 inches - wood 2.6
Roofing Corrugated metal - uninsulated 8.5
2.5 cm wood - uninsulated 2.8
5.0 cm wood - un-insulated 1.7
2.5 cm wood – 2.5 cm insulation 1.1
5.0 cm wood – 2.5 cm insulation 0.9
5.0 cm - concrete slab 1.7
5.0 cm - concrete slab – 2.5 cm insulation 0.9
13 Source: http://www.engineeringtoolbox.com/heat-loss-transmission-d_748.html14 U-value (or U-factor) is a measure of the rate of heat loss or gain through a construction of ma-terials. The lower the U-factor, the greater the material’s resistance to heat flow and the better is the insulating value.
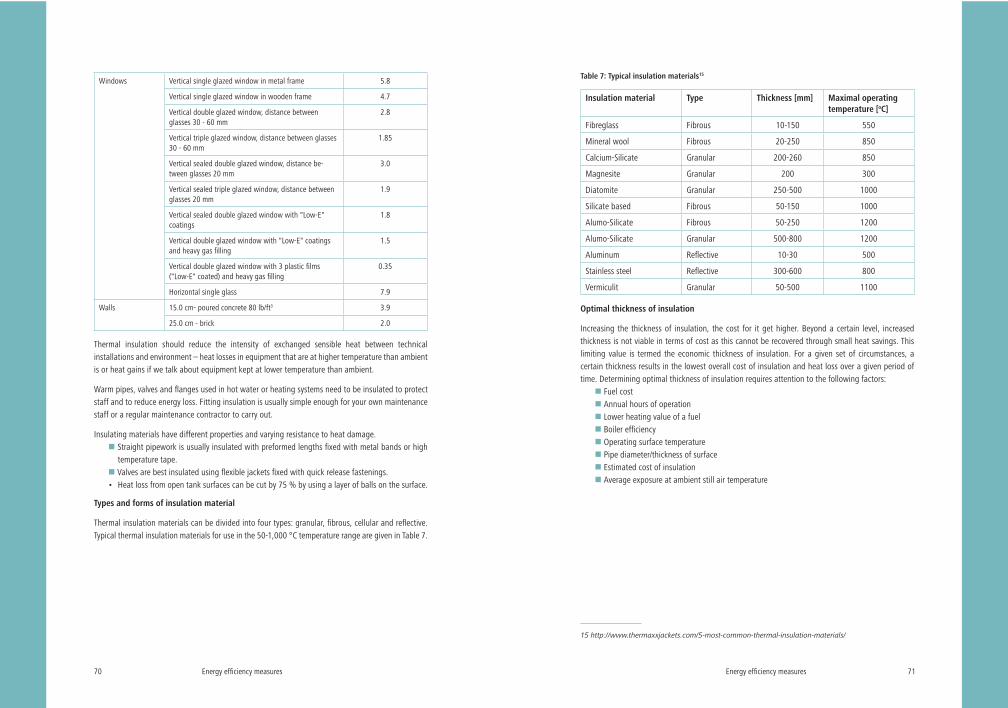
Energy efficiency measures70
Windows Vertical single glazed window in metal frame 5.8
Vertical single glazed window in wooden frame 4.7
Vertical double glazed window, distance between glasses 30 - 60 mm
2.8
Vertical triple glazed window, distance between glasses 30 - 60 mm
1.85
Vertical sealed double glazed window, distance be-tween glasses 20 mm
3.0
Vertical sealed triple glazed window, distance between glasses 20 mm
1.9
Vertical sealed double glazed window with "Low-E" coatings
1.8
Vertical double glazed window with "Low-E" coatings and heavy gas filling
1.5
Vertical double glazed window with 3 plastic films ("Low-E" coated) and heavy gas filling
0.35
Horizontal single glass 7.9
Walls 15.0 cm- poured concrete 80 lb/ft3 3.9
25.0 cm - brick 2.0
Thermal insulation should reduce the intensity of exchanged sensible heat between technical installations and environment – heat losses in equipment that are at higher temperature than ambient is or heat gains if we talk about equipment kept at lower temperature than ambient.
Warm pipes, valves and flanges used in hot water or heating systems need to be insulated to protect staff and to reduce energy loss. Fitting insulation is usually simple enough for your own maintenance staff or a regular maintenance contractor to carry out.
Insulating materials have different properties and varying resistance to heat damage. Straight pipework is usually insulated with preformed lengths fixed with metal bands or high temperature tape.
Valves are best insulated using flexible jackets fixed with quick release fastenings.• Heat loss from open tank surfaces can be cut by 75 % by using a layer of balls on the surface.
Types and forms of insulation material
Thermal insulation materials can be divided into four types: granular, fibrous, cellular and reflective. Typical thermal insulation materials for use in the 50-1,000 °C temperature range are given in Table 7.
Energy efficiency measures 71
Table 7: Typical insulation materials15
Insulation material Type Thickness [mm] Maximal operating temperature [oC]
Fibreglass Fibrous 10-150 550
Mineral wool Fibrous 20-250 850
Calcium-Silicate Granular 200-260 850
Magnesite Granular 200 300
Diatomite Granular 250-500 1000
Silicate based Fibrous 50-150 1000
Alumo-Silicate Fibrous 50-250 1200
Alumo-Silicate Granular 500-800 1200
Aluminum Reflective 10-30 500
Stainless steel Reflective 300-600 800
Vermiculit Granular 50-500 1100
Optimal thickness of insulation
Increasing the thickness of insulation, the cost for it get higher. Beyond a certain level, increased thickness is not viable in terms of cost as this cannot be recovered through small heat savings. This limiting value is termed the economic thickness of insulation. For a given set of circumstances, a certain thickness results in the lowest overall cost of insulation and heat loss over a given period of time. Determining optimal thickness of insulation requires attention to the following factors:
Fuel cost Annual hours of operation Lower heating value of a fuel Boiler efficiency Operating surface temperature Pipe diameter/thickness of surface Estimated cost of insulation Average exposure at ambient still air temperature
15 http://www.thermaxxjackets.com/5-most-common-thermal-insulation-materials/

Energy efficiency measures72
Control questions for this chapter
Requirements Conformity
Yes No N/A
Reduce heating/cooling needs by: • building insulation • efficient glazing • air infiltration reduction • automatic closure of doors • reduction of the set point for heating and raising it for coo-
ling, where is applicable
Ventilation
Figure 10 shows a typical ventilation system.
DOL 2400Alarm
DOL 234FClimate computer DOL 278
Emergency opening
DOL 114Temperature and humidity sensor
DOL 19CO2 sensor
Dynamic air
DA 600Exhaust unit Heating pipes
DOL 12Outside air temperature sensor
Actuator
DA 2000High pressure cooling pump
DA 2000High pressure cooling pipes and nozzles
DA 1200Wall inlet
DA 1540Ceiling inlet
Figure 10: Typical ventilation system16
For animal welfare reasons, minimum ventilation rates should always be sufficient to provide fresh air, oxygen and sufficient humidity and to remove unwanted gases. The indoor thermal comfort demand in pig housing systems is generally governed by the stage of growth of animals kept in the dwelling. In some cases it is possible to use systems with natural ventilation. This matter is covered in chapter 4.6.3. Comparing to systems with forced ventilation, natural ventilation uses less energy, but on the
16 Heating, ventilation and air conditioning, Carbon Trust, 2012; www.carbontrust.co.uk
Energy efficiency measures 73
other hand, indoor air parameters are harder keeping within necessary limits, and response time in regulation is much longer comparing to forced ventilating systems.
General energy saving measures for ventilation system are given below: To select the correct type of fans and to consider their position in the building; To install fans with a low energy use per m³ of air; To use the fans efficiently, e.g. operating one fan on full capacity is more economical than operating two on half their capacity;
To maintain and keep clean fans and controlling devices; To select the appropriate size and shape of air ducts and preserve internal smoothness, in order to maintain maximum air throughput; consider new plastic conical profile fan ducts;
To ensure that ventilation cowls have smooth, slow internal bends to avoid restricting airflow; To use adjustable flap windows to optimise the ventilation needs; To use a variable speed drive for three-phase electric motors. Reducing the speed of the fan, by tailoring the speed to the exact requirement at any time, may allow significant energy savings (about 20 % and up to 50 %).
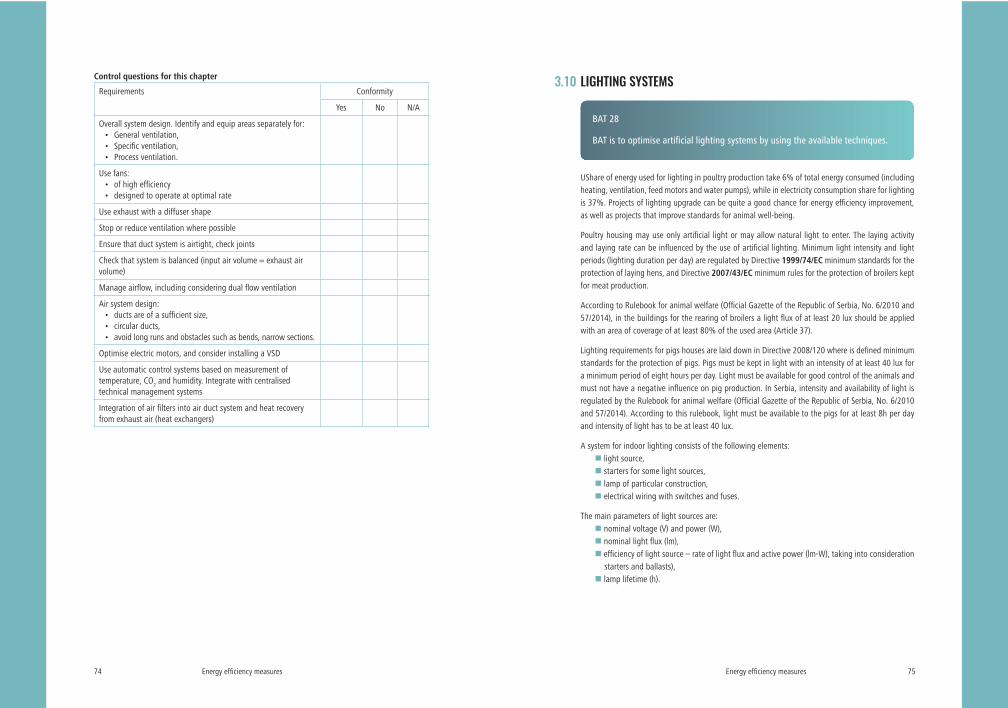
Energy efficiency measures74
Control questions for this chapter
Requirements Conformity
Yes No N/A
Overall system design. Identify and equip areas separately for:• General ventilation,• Specific ventilation,• Process ventilation.
Use fans:• of high efficiency• designed to operate at optimal rate
Use exhaust with a diffuser shape
Stop or reduce ventilation where possible
Ensure that duct system is airtight, check joints
Check that system is balanced (input air volume = exhaust air volume)
Manage airflow, including considering dual flow ventilation
Air system design: • ducts are of a sufficient size,• circular ducts,• avoid long runs and obstacles such as bends, narrow sections.
Optimise electric motors, and consider installing a VSD
Use automatic control systems based on measurement of temperature, CO2 and humidity. Integrate with centralised technical management systems
Integration of air filters into air duct system and heat recovery from exhaust air (heat exchangers)
Energy efficiency measures 75
LIGHTING SYSTEMS
BAT 28
BAT is to optimise artificial lighting systems by using the available techniques.
UShare of energy used for lighting in poultry production take 6% of total energy consumed (including heating, ventilation, feed motors and water pumps), while in electricity consumption share for lighting is 37%. Projects of lighting upgrade can be quite a good chance for energy efficiency improvement, as well as projects that improve standards for animal well-being.
Poultry housing may use only artificial light or may allow natural light to enter. The laying activity and laying rate can be influenced by the use of artificial lighting. Minimum light intensity and light periods (lighting duration per day) are regulated by Directive 1999/74/EC minimum standards for the protection of laying hens, and Directive 2007/43/EC minimum rules for the protection of broilers kept for meat production.
According to Rulebook for animal welfare (Official Gazette of the Republic of Serbia, No. 6/2010 and 57/2014), in the buildings for the rearing of broilers a light flux of at least 20 lux should be applied with an area of coverage of at least 80% of the used area (Article 37).
Lighting requirements for pigs houses are laid down in Directive 2008/120 where is defined minimum standards for the protection of pigs. Pigs must be kept in light with an intensity of at least 40 lux for a minimum period of eight hours per day. Light must be available for good control of the animals and must not have a negative influence on pig production. In Serbia, intensity and availability of light is regulated by the Rulebook for animal welfare (Official Gazette of the Republic of Serbia, No. 6/2010 and 57/2014). According to this rulebook, light must be available to the pigs for at least 8h per day and intensity of light has to be at least 40 lux.
A system for indoor lighting consists of the following elements: light source, starters for some light sources, lamp of particular construction, electrical wiring with switches and fuses.
The main parameters of light sources are: nominal voltage (V) and power (W), nominal light flux (lm), efficiency of light source – rate of light flux and active power (lm-W), taking into consideration starters and ballasts),
lamp lifetime (h).
3.10
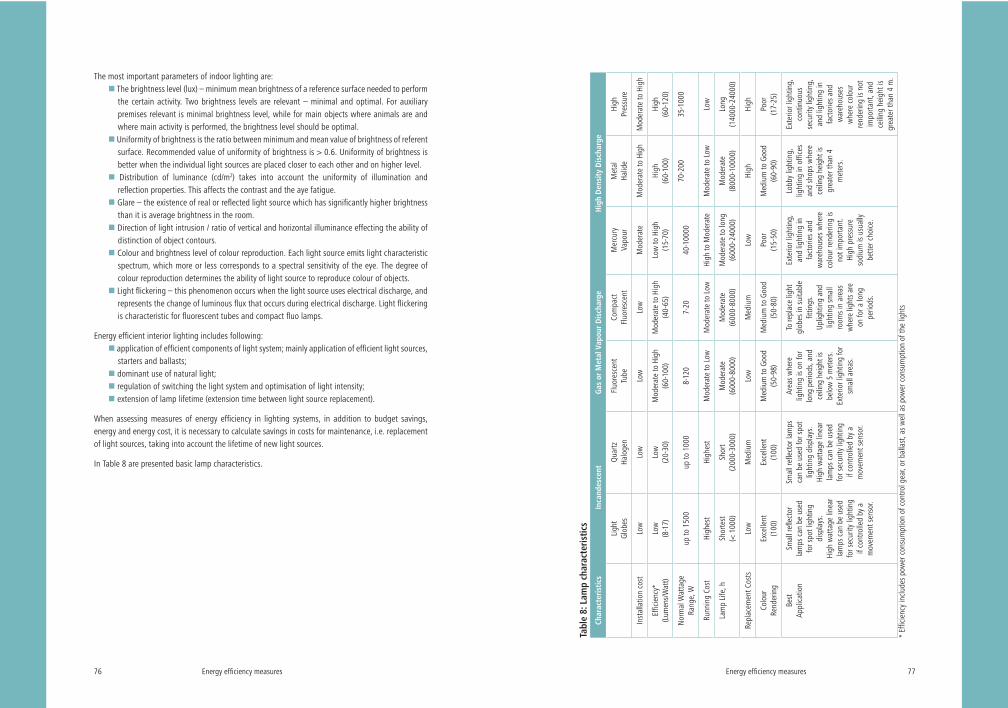
Energy efficiency measures76
The most important parameters of indoor lighting are: The brightness level (lux) – minimum mean brightness of a reference surface needed to perform the certain activity. Two brightness levels are relevant – minimal and optimal. For auxiliary premises relevant is minimal brightness level, while for main objects where animals are and where main activity is performed, the brightness level should be optimal.
Uniformity of brightness is the ratio between minimum and mean value of brightness of referent surface. Recommended value of uniformity of brightness is > 0.6. Uniformity of brightness is better when the individual light sources are placed closer to each other and on higher level.
Distribution of luminance (cd/m2) takes into account the uniformity of illumination and reflection properties. This affects the contrast and the aye fatigue.
Glare – the existence of real or reflected light source which has significantly higher brightness than it is average brightness in the room.
Direction of light intrusion / ratio of vertical and horizontal illuminance effecting the ability of distinction of object contours.
Colour and brightness level of colour reproduction. Each light source emits light characteristic spectrum, which more or less corresponds to a spectral sensitivity of the eye. The degree of colour reproduction determines the ability of light source to reproduce colour of objects.
Light flickering – this phenomenon occurs when the light source uses electrical discharge, and represents the change of luminous flux that occurs during electrical discharge. Light flickering is characteristic for fluorescent tubes and compact fluo lamps.
Energy efficient interior lighting includes following: application of efficient components of light system; mainly application of efficient light sources, starters and ballasts;
dominant use of natural light; regulation of switching the light system and optimisation of light intensity; extension of lamp lifetime (extension time between light source replacement).
When assessing measures of energy efficiency in lighting systems, in addition to budget savings, energy and energy cost, it is necessary to calculate savings in costs for maintenance, i.e. replacement of light sources, taking into account the lifetime of new light sources.
In Table 8 are presented basic lamp characteristics.
Energy efficiency measures 77
Tabl
e 8:
Lam
p ch
arac
teris
tics
Char
acte
ristic
sIn
cand
esce
ntG
as o
r M
etal
Vap
our
Dis
char
geH
igh
Den
sity
Dis
char
ge
Ligh
t Gl
obes
Qua
rtz
Halo
gen
Fluo
resc
ent
Tube
Com
pact
Fl
uore
scen
tM
ercu
ry
Vapo
urM
etal
Ha
lide
High
Pr
essu
re
Inst
alla
tion
cost
Low
Low
Low
Low
Mod
erat
eM
oder
ate
to H
igh
Mod
erat
e to
Hig
h
Effic
ienc
y*
(Lum
ens/
Wat
t)Lo
w
(8-1
7)Lo
w
(20-
30)
Mod
erat
e to
Hig
h (6
0-10
0)M
oder
ate
to H
igh
(40-
65)
Low
to H
igh
(15-
70)
High
(6
0-10
0)Hi
gh
(60-
120)
Nor
mal
Wat
tage
Ra
nge,
Wup
to 1
500
up to
100
08-
120
7-20
40-1
0000
70-2
0035
-100
0
Runn
ing
Cost
High
est
High
est
Mod
erat
e to
Low
Mod
erat
e to
Low
High
to M
oder
ate
Mod
erat
e to
Low
Low
Lam
p Li
fe, h
Shor
test
(<
100
0)Sh
ort
(200
0-30
00)
Mod
erat
e (6
000-
8000
)M
oder
ate
(600
0-80
00)
Mod
erat
e to
long
(6
000-
2400
0)M
oder
ate
(800
0-10
000)
Long
(1
4000
-240
00)
Repl
acem
ent C
osts
Low
Med
ium
Low
Med
ium
Low
High
High
Colo
ur
Rend
erin
gEx
celle
nt
(100
)Ex
celle
nt
(100
)M
ediu
m to
Goo
d (5
0-98
)M
ediu
m to
Goo
d (5
0-80
)Po
or
(15-
50)
Med
ium
to G
ood
(60-
90)
Poor
(1
7-25
)
Best
Ap
plic
atio
n Sm
all r
eflec
tor
lam
ps c
an b
e us
ed
for s
pot l
ight
ing
disp
lays
.Hi
gh w
atta
ge li
near
la
mps
can
be
used
fo
r sec
urity
ligh
ting
if co
ntro
lled
by a
m
ovem
ent s
enso
r.
Smal
l refl
ecto
r lam
ps
can
be u
sed
for s
pot
light
ing
disp
lays
.Hi
gh w
atta
ge li
near
la
mps
can
be
used
fo
r sec
urity
ligh
ting
if co
ntro
lled
by a
m
ovem
ent s
enso
r.
Area
s w
here
lig
htin
g is
on fo
r lo
ng p
erio
ds, a
nd
ceili
ng h
eigh
t is
belo
w 5
met
ers.
Exte
rior l
ight
ing
for
smal
l are
as.
To re
plac
e lig
ht
glob
es in
sui
tabl
e fit
tings
.Up
light
ing
and
light
ing
smal
l ro
oms
in a
reas
w
here
ligh
ts a
re
on fo
r a lo
ng
perio
ds.
Exte
rior l
ight
ing,
an
d lig
htin
g in
fa
ctor
ies
and
war
ehou
ses
whe
re
colo
ur re
nder
ing
is no
t im
porta
nt.
High
pre
ssur
e so
dium
is u
sual
ly
bette
r cho
ice.
Lobb
y lig
htin
g,
light
ing
in o
ffice
s an
d sh
ops
whe
re
ceili
ng h
eigh
t is
grea
ter t
han
4 m
eter
s.
Exte
rior l
ight
ing,
co
ntin
uous
se
curit
y lig
htin
g,
and
light
ing
in
fact
orie
s an
d w
areh
ouse
s w
here
col
our
rend
erin
g is
not
impo
rtant
, and
ce
iling
hei
ght i
s gr
eate
r tha
n 4
m.
* Ef
ficie
ncy
incl
udes
pow
er c
onsu
mpt
ion
of c
ontro
l gea
r, or
bal
last
, as
wel
l as
pow
er c
onsu
mpt
ion
of th
e lig
hts
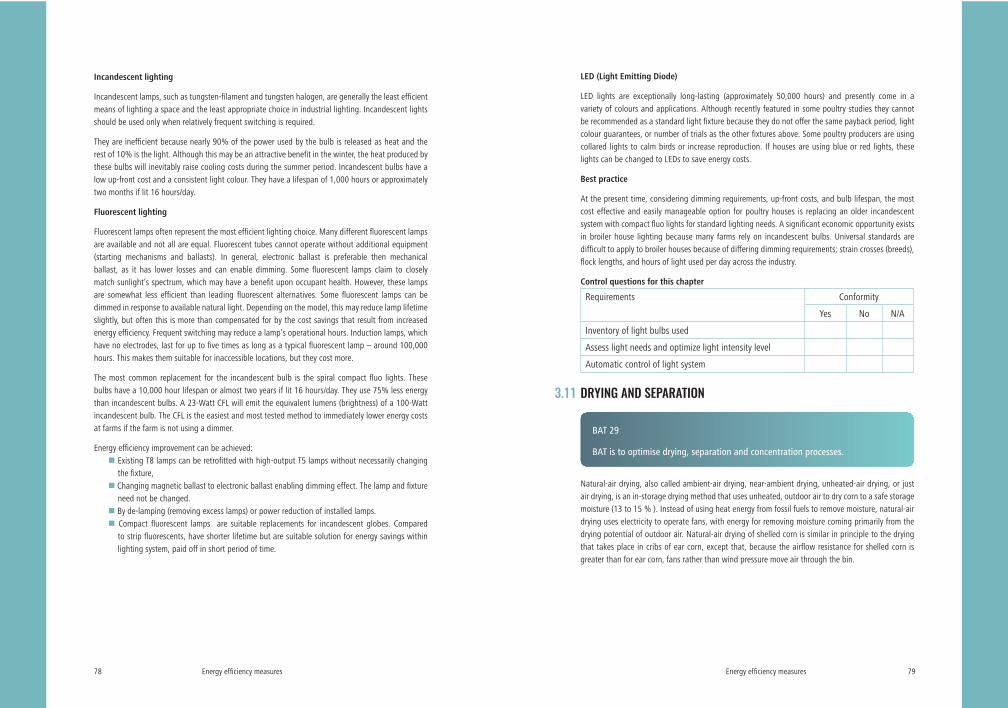
Energy efficiency measures78
Incandescent lighting
Incandescent lamps, such as tungsten-filament and tungsten halogen, are generally the least efficient means of lighting a space and the least appropriate choice in industrial lighting. Incandescent lights should be used only when relatively frequent switching is required.
They are inefficient because nearly 90% of the power used by the bulb is released as heat and the rest of 10% is the light. Although this may be an attractive benefit in the winter, the heat produced by these bulbs will inevitably raise cooling costs during the summer period. Incandescent bulbs have a low up-front cost and a consistent light colour. They have a lifespan of 1,000 hours or approximately two months if lit 16 hours/day.
Fluorescent lighting
Fluorescent lamps often represent the most efficient lighting choice. Many different fluorescent lamps are available and not all are equal. Fluorescent tubes cannot operate without additional equipment (starting mechanisms and ballasts). In general, electronic ballast is preferable then mechanical ballast, as it has lower losses and can enable dimming. Some fluorescent lamps claim to closely match sunlight’s spectrum, which may have a benefit upon occupant health. However, these lamps are somewhat less efficient than leading fluorescent alternatives. Some fluorescent lamps can be dimmed in response to available natural light. Depending on the model, this may reduce lamp lifetime slightly, but often this is more than compensated for by the cost savings that result from increased energy efficiency. Frequent switching may reduce a lamp’s operational hours. Induction lamps, which have no electrodes, last for up to five times as long as a typical fluorescent lamp – around 100,000 hours. This makes them suitable for inaccessible locations, but they cost more.
The most common replacement for the incandescent bulb is the spiral compact fluo lights. These bulbs have a 10,000 hour lifespan or almost two years if lit 16 hours/day. They use 75% less energy than incandescent bulbs. A 23-Watt CFL will emit the equivalent lumens (brightness) of a 100-Watt incandescent bulb. The CFL is the easiest and most tested method to immediately lower energy costs at farms if the farm is not using a dimmer.
Energy efficiency improvement can be achieved: Existing T8 lamps can be retrofitted with high-output T5 lamps without necessarily changing the fixture,
Changing magnetic ballast to electronic ballast enabling dimming effect. The lamp and fixture need not be changed.
By de-lamping (removing excess lamps) or power reduction of installed lamps. Compact fluorescent lamps are suitable replacements for incandescent globes. Compared to strip fluorescents, have shorter lifetime but are suitable solution for energy savings within lighting system, paid off in short period of time.
Energy efficiency measures 79
LED (Light Emitting Diode)
LED lights are exceptionally long-lasting (approximately 50,000 hours) and presently come in a variety of colours and applications. Although recently featured in some poultry studies they cannot be recommended as a standard light fixture because they do not offer the same payback period, light colour guarantees, or number of trials as the other fixtures above. Some poultry producers are using collared lights to calm birds or increase reproduction. If houses are using blue or red lights, these lights can be changed to LEDs to save energy costs.
Best practice
At the present time, considering dimming requirements, up-front costs, and bulb lifespan, the most cost effective and easily manageable option for poultry houses is replacing an older incandescent system with compact fluo lights for standard lighting needs. A significant economic opportunity exists in broiler house lighting because many farms rely on incandescent bulbs. Universal standards are difficult to apply to broiler houses because of differing dimming requirements; strain crosses (breeds), flock lengths, and hours of light used per day across the industry.
Control questions for this chapter
Requirements Conformity
Yes No N/A
Inventory of light bulbs used
Assess light needs and optimize light intensity level
Automatic control of light system
DRYING AND SEPARATION
BAT 29
BAT is to optimise drying, separation and concentration processes.
Natural-air drying, also called ambient-air drying, near-ambient drying, unheated-air drying, or just air drying, is an in-storage drying method that uses unheated, outdoor air to dry corn to a safe storage moisture (13 to 15 % ). Instead of using heat energy from fossil fuels to remove moisture, natural-air drying uses electricity to operate fans, with energy for removing moisture coming primarily from the drying potential of outdoor air. Natural-air drying of shelled corn is similar in principle to the drying that takes place in cribs of ear corn, except that, because the airflow resistance for shelled corn is greater than for ear corn, fans rather than wind pressure move air through the bin.
3.11
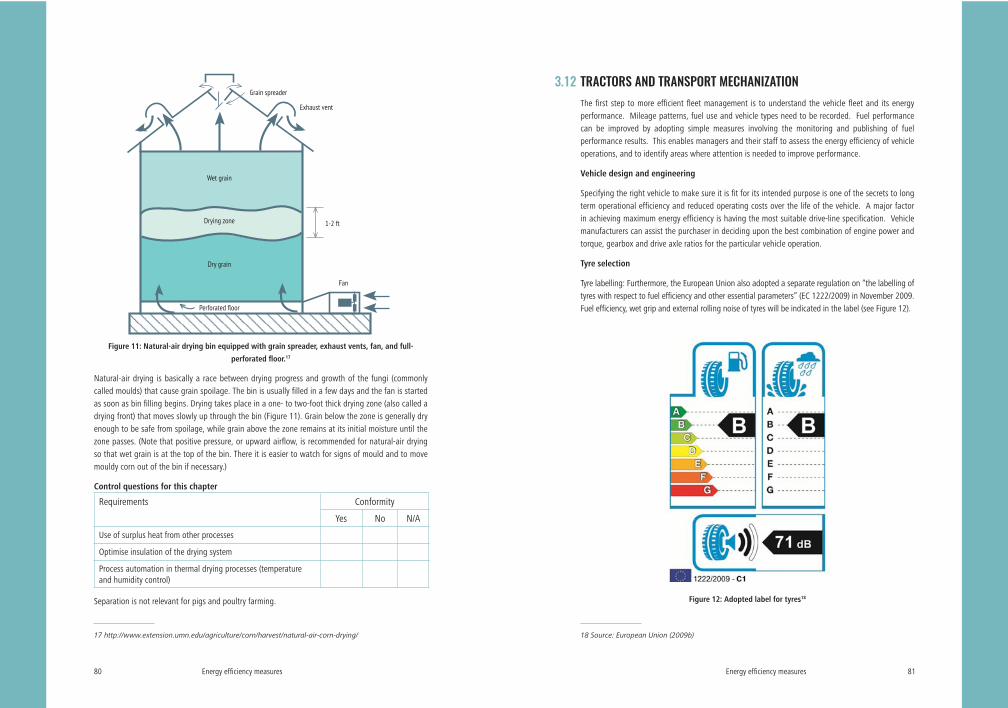
Energy efficiency measures80
Grain spreader
Exhaust vent
Wet grain
Drying zone
Dry grain
1-2 ft
Fan
Figure 11: Natural-air drying bin equipped with grain spreader, exhaust vents, fan, and full-
perforated floor.17
Natural-air drying is basically a race between drying progress and growth of the fungi (commonly called moulds) that cause grain spoilage. The bin is usually filled in a few days and the fan is started as soon as bin filling begins. Drying takes place in a one- to two-foot thick drying zone (also called a drying front) that moves slowly up through the bin (Figure 11). Grain below the zone is generally dry enough to be safe from spoilage, while grain above the zone remains at its initial moisture until the zone passes. (Note that positive pressure, or upward airflow, is recommended for natural-air drying so that wet grain is at the top of the bin. There it is easier to watch for signs of mould and to move mouldy corn out of the bin if necessary.)
Control questions for this chapter
Requirements Conformity
Yes No N/A
Use of surplus heat from other processes
Optimise insulation of the drying system
Process automation in thermal drying processes (temperature and humidity control)
Separation is not relevant for pigs and poultry farming.
17 http://www.extension.umn.edu/agriculture/corn/harvest/natural-air-corn-drying/
Energy efficiency measures 81
TRACTORS AND TRANSPORT MECHANIZATIONThe first step to more efficient fleet management is to understand the vehicle fleet and its energy performance. Mileage patterns, fuel use and vehicle types need to be recorded. Fuel performance can be improved by adopting simple measures involving the monitoring and publishing of fuel performance results. This enables managers and their staff to assess the energy efficiency of vehicle operations, and to identify areas where attention is needed to improve performance.
Vehicle design and engineering
Specifying the right vehicle to make sure it is fit for its intended purpose is one of the secrets to long term operational efficiency and reduced operating costs over the life of the vehicle. A major factor in achieving maximum energy efficiency is having the most suitable drive-line specification. Vehicle manufacturers can assist the purchaser in deciding upon the best combination of engine power and torque, gearbox and drive axle ratios for the particular vehicle operation.
Tyre selection
Tyre labelling: Furthermore, the European Union also adopted a separate regulation on “the labelling of tyres with respect to fuel efficiency and other essential parameters” (EC 1222/2009) in November 2009. Fuel efficiency, wet grip and external rolling noise of tyres will be indicated in the label (see Figure 12).
Figure 12: Adopted label for tyres18
18 Source: European Union (2009b)
3.12
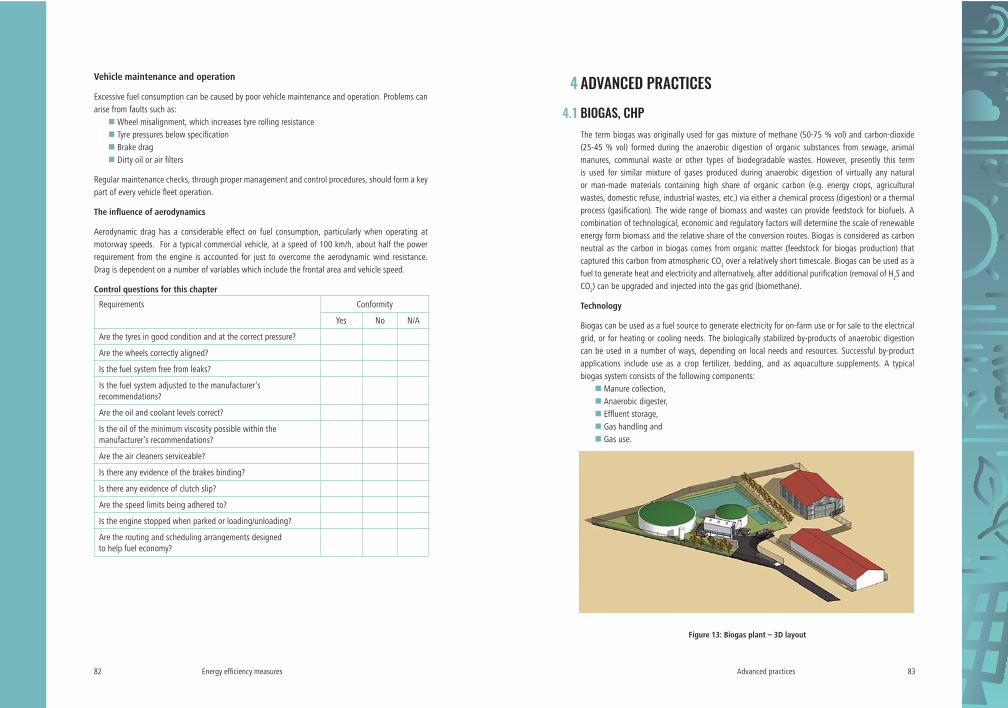
Energy efficiency measures82
Vehicle maintenance and operation
Excessive fuel consumption can be caused by poor vehicle maintenance and operation. Problems can arise from faults such as:
Wheel misalignment, which increases tyre rolling resistance Tyre pressures below specification Brake drag Dirty oil or air filters
Regular maintenance checks, through proper management and control procedures, should form a key part of every vehicle fleet operation.
The influence of aerodynamics
Aerodynamic drag has a considerable effect on fuel consumption, particularly when operating at motorway speeds. For a typical commercial vehicle, at a speed of 100 km/h, about half the power requirement from the engine is accounted for just to overcome the aerodynamic wind resistance. Drag is dependent on a number of variables which include the frontal area and vehicle speed.
Control questions for this chapter
Requirements Conformity
Yes No N/A
Are the tyres in good condition and at the correct pressure?
Are the wheels correctly aligned?
Is the fuel system free from leaks?
Is the fuel system adjusted to the manufacturer’s recommendations?
Are the oil and coolant levels correct?
Is the oil of the minimum viscosity possible within the manufacturer’s recommendations?
Are the air cleaners serviceable?
Is there any evidence of the brakes binding?
Is there any evidence of clutch slip?
Are the speed limits being adhered to?
Is the engine stopped when parked or loading/unloading?
Are the routing and scheduling arrangements designed to help fuel economy?
Advanced practices 83
ADVANCED PRACTICES
BIOGAS, CHPThe term biogas was originally used for gas mixture of methane (50-75 % vol) and carbon-dioxide (25-45 % vol) formed during the anaerobic digestion of organic substances from sewage, animal manures, communal waste or other types of biodegradable wastes. However, presently this term is used for similar mixture of gases produced during anaerobic digestion of virtually any natural or man-made materials containing high share of organic carbon (e.g. energy crops, agricultural wastes, domestic refuse, industrial wastes, etc.) via either a chemical process (digestion) or a thermal process (gasification). The wide range of biomass and wastes can provide feedstock for biofuels. A combination of technological, economic and regulatory factors will determine the scale of renewable energy form biomass and the relative share of the conversion routes. Biogas is considered as carbon neutral as the carbon in biogas comes from organic matter (feedstock for biogas production) that captured this carbon from atmospheric CO2 over a relatively short timescale. Biogas can be used as a fuel to generate heat and electricity and alternatively, after additional purification (removal of H2S and CO2) can be upgraded and injected into the gas grid (biomethane).
Technology
Biogas can be used as a fuel source to generate electricity for on-farm use or for sale to the electrical grid, or for heating or cooling needs. The biologically stabilized by-products of anaerobic digestion can be used in a number of ways, depending on local needs and resources. Successful by-product applications include use as a crop fertilizer, bedding, and as aquaculture supplements. A typical biogas system consists of the following components:
Manure collection, Anaerobic digester, Effluent storage, Gas handling and Gas use.
Figure 13: Biogas plant – 3D layout
4
4.1

Advanced practices84
Livestock facilities use manure management systems to collect and store manure because of sanitary, environmental, and farm operational considerations. Manure is collected and stored as liquids, slurries, semi-solids, or solids.
Raw manure. Manure is excreted with a solids content of 8 to 25 %, depending on animal type. It can be diluted by various process waters or thickened by air-drying or by adding some solid materials, e.g. bedding materials.
Liquid manure. Liquid manure is a mixture of solid manure and urine, with some small contents of bedding material. Manure diluted with some water19 can be pumped as a liquid. Manure has been diluted to a solids content of less than 5 %. This manure is typically “flushed” from where it is excreted, using fresh or recycled water. The manure and flush water can be pumped to treatment and storage tanks, ponds, lagoons, or other suitable structures before land application. Liquid manure systems may be adapted for biogas production and energy recovery in “warm” climates. In colder climates, biogas recovery can be used, but is usually limited to gas flaring for odour control.
FarmPumping
unit
Homogenizationand collectiontank for liquid
biomass
Screw charger ofsolid biomass
Digesterheatingwith hot
water
Heat for technologicalpurposes and heating
Electricity
DigesterGasholder
InsulationBeam dome
Biogas
Mixing device
Digested biomassdischarge
Condensateextractor
Waste gas
Automaticcontrol unit
Co-generation unit
Figure 14: Process flow diagram of biogas production plant with CHP unit
Slurry manure. Manure handled as slurry has been diluted to a solids content of about 5 to 10 %. Slurry manure is usually collected by a mechanical “scraper” system. This manure can be pumped, and is often treated or stored in tanks, ponds, or lagoons prior to land application. Manure managed in this manner may be used for biogas recovery.
Semi-solid manure. Manure handled as a semi-solid has a solids content of 10 to 20 %. This manure is typically scraped. Water is not added to the manure, and the manure is typically stored until it is spread on local fields. Fresh scraped manure (less than two weeks old) can be used for biogas and energy production in all climates, because it can be heated to promote bacterial growth.
19 Belić, S., Belić, A., Savić, R., Otpadna voda sa farmi – ekološki problem ili đubrivo, Letopis naučnih radova Poljoprivrednog fakulteta, 29 (1) (2005) str. 169-177
Advanced practices 85
The digester is the element of the manure management system that optimizes naturally occurring anaerobic bacteria to decompose and treat the manure while producing biogas. Digesters are covered with an airtight impermeable cover to trap the biogas. The choice of which digester to use is driven by the existing (or planned) manure handling system at the facility. The digester must be designed to operate as part of the facility’s operations. There are several different constructions of digesters:
Covered lagoon digester. Covered lagoons are used to treat and produce biogas from liquid manure with less than 3 % solids. Generally, large lagoon volumes are required, preferably with depths greater than 3,5 m. The typical volume of the required lagoon can be roughly estimated by multiplying the daily manure flush volume by 40 to 60 days. Covered lagoons for energy recovery are compatible with flush manure systems in warm climates. Covered lagoons may be used in cold climates for seasonal biogas recovery and odour control (gas flaring). There are two types of covers, bank-to-bank and modular. A bank-to-bank cover is used in moderate to heavy rainfall regions. A modular cover is used for arid regions.
Complete mix digester. Complete mix digesters are engineered tanks, above or below ground, that treat slurry manure with a solids concentration in the range of 3 to 10 %. These structures require less land than lagoons and are heated. Complete mix digesters are compatible with combinations of scraped and flushed manure.
Plug flow digester. Plug flow digesters are engineered, heated, rectangular tanks that treat scraped dairy manure with a range of 11 to 13 % total solids. Pig manure cannot be treated with a plug flow digester due to its lack of fibre.
Fixed film digester. Fixed-film digesters consist of a tank filled with plastic media. The media supports a thin layer of anaerobic bacteria called biofilm (hence the term "fixed-film"). As the waste manure passes through the media, biogas is produced. Like covered lagoon digesters fixed-film digesters are best suited for dilute waste streams typically associated with flush manure handling or pit recharge manure collection. Fixed-film digesters can be used for both dairy and swine wastes. However, separation of dairy manure is required to remove slowly degradable solids.
The products of the anaerobic digestion of manure in digesters are biogas and effluent. The effluent is a stabilized organic solution that has value as a fertilizer and other potential uses. Waste storage facilities are required to store treated effluent because the nutrients in the effluent cannot be applied to land and crops year round. The size of the storage facility and storage period must be adequate to meet farm requirements during the non-growing season. Facilities with longer storage periods allow flexibility in managing the waste to accommodate weather changes, equipment availability and breakdown, and overall operation management.
A gas handling system removes biogas from the digester and transports it to the end-use, such as a gas-engine or boiler unit. Biogas can be utilized in a variety of ways (it is 60 - 80 percent methane, with a heating value of approximately 22-30 MJ/m3). Gas of this quality can be used to generate electricity; it may be used as fuel for a boiler, space heater, or refrigeration equipment; or it may be directly combusted as a cooking and lighting fuel. Electricity can be generated for on-farm use or for sale to the local electric power grid. The most common technology for generating electricity is an internal combustion engine with a generator. The predicted gas flow rate and the operating plan are used to size the electricity generation equipment. Biogas can also be used directly on-site as a fuel
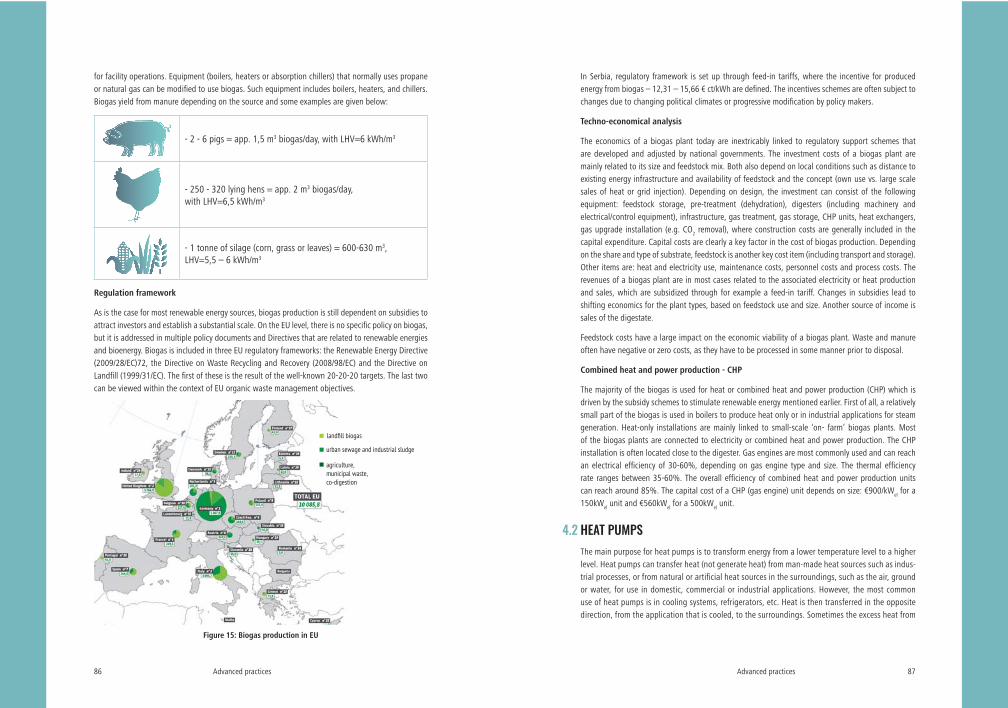
Advanced practices86
for facility operations. Equipment (boilers, heaters or absorption chillers) that normally uses propane or natural gas can be modified to use biogas. Such equipment includes boilers, heaters, and chillers. Biogas yield from manure depending on the source and some examples are given below:
- 2 - 6 pigs = app. 1,5 m3 biogas/day, with LHV=6 kWh/m3
- 250 - 320 lying hens = app. 2 m3 biogas/day, with LHV=6,5 kWh/m3
- 1 tonne of silage (corn, grass or leaves) = 600-630 m3, LHV=5,5 – 6 kWh/m3
Regulation framework
As is the case for most renewable energy sources, biogas production is still dependent on subsidies to attract investors and establish a substantial scale. On the EU level, there is no specific policy on biogas, but it is addressed in multiple policy documents and Directives that are related to renewable energies and bioenergy. Biogas is included in three EU regulatory frameworks: the Renewable Energy Directive (2009/28/EC)72, the Directive on Waste Recycling and Recovery (2008/98/EC) and the Directive on Landfill (1999/31/EC). The first of these is the result of the well-known 20-20-20 targets. The last two can be viewed within the context of EU organic waste management objectives.
Figure 15: Biogas production in EU
Advanced practices 87
In Serbia, regulatory framework is set up through feed-in tariffs, where the incentive for produced energy from biogas – 12,31 – 15,66 € ct/kWh are defined. The incentives schemes are often subject to changes due to changing political climates or progressive modification by policy makers.
Techno-economical analysis
The economics of a biogas plant today are inextricably linked to regulatory support schemes that are developed and adjusted by national governments. The investment costs of a biogas plant are mainly related to its size and feedstock mix. Both also depend on local conditions such as distance to existing energy infrastructure and availability of feedstock and the concept (own use vs. large scale sales of heat or grid injection). Depending on design, the investment can consist of the following equipment: feedstock storage, pre-treatment (dehydration), digesters (including machinery and electrical/control equipment), infrastructure, gas treatment, gas storage, CHP units, heat exchangers, gas upgrade installation (e.g. CO2 removal), where construction costs are generally included in the capital expenditure. Capital costs are clearly a key factor in the cost of biogas production. Depending on the share and type of substrate, feedstock is another key cost item (including transport and storage). Other items are: heat and electricity use, maintenance costs, personnel costs and process costs. The revenues of a biogas plant are in most cases related to the associated electricity or heat production and sales, which are subsidized through for example a feed-in tariff. Changes in subsidies lead to shifting economics for the plant types, based on feedstock use and size. Another source of income is sales of the digestate.
Feedstock costs have a large impact on the economic viability of a biogas plant. Waste and manure often have negative or zero costs, as they have to be processed in some manner prior to disposal.
Combined heat and power production - CHP
The majority of the biogas is used for heat or combined heat and power production (CHP) which is driven by the subsidy schemes to stimulate renewable energy mentioned earlier. First of all, a relatively small part of the biogas is used in boilers to produce heat only or in industrial applications for steam generation. Heat-only installations are mainly linked to small-scale ‘on- farm’ biogas plants. Most of the biogas plants are connected to electricity or combined heat and power production. The CHP installation is often located close to the digester. Gas engines are most commonly used and can reach an electrical efficiency of 30-60%, depending on gas engine type and size. The thermal efficiency rate ranges between 35-60%. The overall efficiency of combined heat and power production units can reach around 85%. The capital cost of a CHP (gas engine) unit depends on size: €900/kWel for a 150kWel unit and €560kWel for a 500kWel unit.
HEAT PUMPSThe main purpose for heat pumps is to transform energy from a lower temperature level to a higher level. Heat pumps can transfer heat (not generate heat) from man-made heat sources such as indus-trial processes, or from natural or artificial heat sources in the surroundings, such as the air, ground or water, for use in domestic, commercial or industrial applications. However, the most common use of heat pumps is in cooling systems, refrigerators, etc. Heat is then transferred in the opposite direction, from the application that is cooled, to the surroundings. Sometimes the excess heat from
4.2
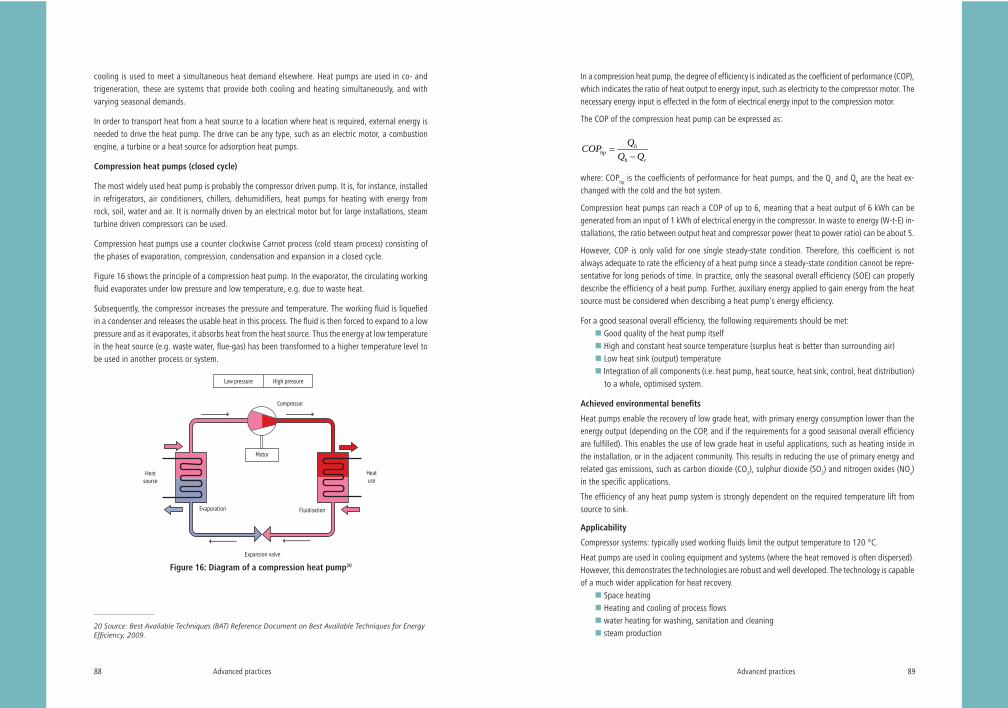
Advanced practices88
cooling is used to meet a simultaneous heat demand elsewhere. Heat pumps are used in co- and trigeneration, these are systems that provide both cooling and heating simultaneously, and with varying seasonal demands.
In order to transport heat from a heat source to a location where heat is required, external energy is needed to drive the heat pump. The drive can be any type, such as an electric motor, a combustion engine, a turbine or a heat source for adsorption heat pumps.
Compression heat pumps (closed cycle)
The most widely used heat pump is probably the compressor driven pump. It is, for instance, installed in refrigerators, air conditioners, chillers, dehumidifiers, heat pumps for heating with energy from rock, soil, water and air. It is normally driven by an electrical motor but for large installations, steam turbine driven compressors can be used.
Compression heat pumps use a counter clockwise Carnot process (cold steam process) consisting of the phases of evaporation, compression, condensation and expansion in a closed cycle.
Figure 16 shows the principle of a compression heat pump. In the evaporator, the circulating working fluid evaporates under low pressure and low temperature, e.g. due to waste heat.
Subsequently, the compressor increases the pressure and temperature. The working fluid is liquefied in a condenser and releases the usable heat in this process. The fluid is then forced to expand to a low pressure and as it evaporates, it absorbs heat from the heat source. Thus the energy at low temperature in the heat source (e.g. waste water, flue-gas) has been transformed to a higher temperature level to be used in another process or system.
Compressor
Motor
Heatsource
Heatuse
Evaporation Fluidisation
Expansion valve
Low pressure High pressure
Figure 16: Diagram of a compression heat pump20
20 Source: Best Available Techniques (BAT) Reference Document on Best Available Techniques for Energy Efficiency, 2009.
Advanced practices 89
In a compression heat pump, the degree of efficiency is indicated as the coefficient of performance (COP), which indicates the ratio of heat output to energy input, such as electricity to the compressor motor. The necessary energy input is effected in the form of electrical energy input to the compression motor.
The COP of the compression heat pump can be expressed as:
hhp
h c
QCOPQ Q
where: COPhp is the coefficients of performance for heat pumps, and the Qc and Qh are the heat ex-changed with the cold and the hot system.
Compression heat pumps can reach a COP of up to 6, meaning that a heat output of 6 kWh can be generated from an input of 1 kWh of electrical energy in the compressor. In waste to energy (W-t-E) in-stallations, the ratio between output heat and compressor power (heat to power ratio) can be about 5.
However, COP is only valid for one single steady-state condition. Therefore, this coefficient is not always adequate to rate the efficiency of a heat pump since a steady-state condition cannot be repre-sentative for long periods of time. In practice, only the seasonal overall efficiency (SOE) can properly describe the efficiency of a heat pump. Further, auxiliary energy applied to gain energy from the heat source must be considered when describing a heat pump’s energy efficiency.
For a good seasonal overall efficiency, the following requirements should be met: Good quality of the heat pump itself High and constant heat source temperature (surplus heat is better than surrounding air) Low heat sink (output) temperature Integration of all components (i.e. heat pump, heat source, heat sink, control, heat distribution) to a whole, optimised system.
Achieved environmental benefits
Heat pumps enable the recovery of low grade heat, with primary energy consumption lower than the energy output (depending on the COP, and if the requirements for a good seasonal overall efficiency are fulfilled). This enables the use of low grade heat in useful applications, such as heating inside in the installation, or in the adjacent community. This results in reducing the use of primary energy and related gas emissions, such as carbon dioxide (CO2), sulphur dioxide (SO2) and nitrogen oxides (NOx) in the specific applications.
The efficiency of any heat pump system is strongly dependent on the required temperature lift from source to sink.
Applicability
Compressor systems: typically used working fluids limit the output temperature to 120 °C.
Heat pumps are used in cooling equipment and systems (where the heat removed is often dispersed). However, this demonstrates the technologies are robust and well developed. The technology is capable of a much wider application for heat recovery.
Space heating Heating and cooling of process flows water heating for washing, sanitation and cleaning steam production

Advanced practices90
Drying/dehumidification Evaporation Distillation Concentration (dehydration).
They are also used in co- and trigeneration systems.
The most common waste heat streams in industry are cooling fluid, effluent, condensate, moisture, and condenser heat from refrigeration plants. Because of the fluctuation in waste heat supply, it may be necessary to use large (insulated) storage tanks to ensure stable operation of the heat pump.
Note:
Usually, applicability and sizing of the heat pumps should be based on the heating requirements, and on the temperature difference between source and delivery temperatures (if the temperature difference between source and delivery temperatures is lower, the heat pump COP is greater).
Also, in spite of the fact that heat pumps can provide all the hot water and space heating requirements of a building, the capital cost of a system to meet the peak space heating requirement can be high and therefore some design strategies advocate using an additional heater (e.g. pallet heater) for those occasions when maximum heating is required.
SOLAR SYSTEMS, PHOTOVOLTAICSSolar energy can supply and/or supplement many farm energy requirements. The following is a brief discussion of a few applications of solar energy technologies in agriculture.
Space and water heating
As it was already stated in the Chapter 3, farms often have substantial air and water heating requirements. Modern pig and poultry farms raise animals in enclosed buildings, where it is necessary to carefully control temperature and air quality to maximize the health and growth of the animals. Heating this air requires large amount of energy. With proper planning and design solar air/space heaters can be incorporated into farm buildings to preheat incoming fresh air. These systems can also be used to supplement natural ventilation levels during summer months depending on the region and weather. Solar water heating can provide hot water for pen or equipment cleaning or for preheating water going into a conventional water heater. A properly-sized solar water heating system could cut costs in half.21
There are four basic types of solar water-heater systems available. These systems share following elements: a glazing (typically glass) over a dark surface to gather solar heat; one or two tanks to store hot water; and associated plumbing with or without pumps to circulate the heat-transfer fluid from the tank to the collectors and back again:22
21 Garg, H., Advances in Solar Technology: volume III Heating Agricultural and Photovoltaic Applications of Solar Energy. Reidel Publishing Company, USA, 1987; Goedseels, V. New Perspectives for Energy Savings on Agriculture: Current Progress in Solar Technologies. Reidel Publishing Company, USA, 1986; WFE, Using Renewable in Agriculture: Sector Overview, Wisconsin Focus on Energy. Wisconsin, 2002; Union of Con-cerned Scientists, Renewable Energy and Agriculture: A Natural Fit. UCS, Cambridge, 2009 www.ucssusa.org/elean-energy/coalvswind/gd. 22 Schnepf, R., Energy Uses in Agriculture: Background and Issues. Congressional Research Service, CRS Report Code 32677, USA, 2005; Schnepf, R., Agricultural Based Renewable Energy Production. Congres-sional Research Service, CRS Report Code 32712, USA, 2007.
4.3
Advanced practices 91
Drain down systems pump water from the hot water tank through the solar collector, where it is heated by the sun and returned to the tank. Valves automatically drain the system when sensors detect freezing temperatures.
Drain back systems use a separate plumbing line filled with fluid, to gather the sun’s heat. These systems operate strictly on gravity. When the temperature is near freezing, the pump shuts off and the transfer fluid drains back into the solar storage tank.
Anti-freeze closed-loop systems rely on an antifreeze solution to operate through cold and winter months. Anti-freeze solutions are separated from household water by a double-walled heat exchange.
Bread box batch systems are passive systems in which the storage tank also functions as the collector. One or two water tanks, painted black, are placed in a well-insulated box or other enclosure that has a south wall made of clear plastic or glass and titled at the proper angle. This allows the sun to shine directly on the tank and heat a batch of water.
A solar water heater can provide hot water for washing or cleaning, and in some instances be used to heat the water for a radiant floor system for either people or animals. Indirectly, using water-filled drums or tanks that gain heat from the sun can be used in greenhouses as thermal mass, moderating the temperature and providing warmth when the sun is down.
Figure 17: Solar water heater

Advanced practices92
Electricity supply (photovoltaic)
Solar electric, or photovoltaic (PV), systems convert sun light directly to electricity. They work any time the sun is shining, but more electricity is produced when they sun light is more intensive and strikes the PV modules directly (as when rays of sunlight are perpendicular to the PV modules). They can also power an electrical appliance directly, or store solar energy in a battery. In areas with no utility lines, PV systems are often cheaper and require less maintenance than diesel generators, wind turbines, or batteries alone. And where utilities charge for new lines, a PV generating system is often much.23
PV allows for the production of electricity–without noise or air pollution-from a clean, renewable resource. PV can be used to power lighting, automatic supplement feeders etc.
Crop and grain drying
Using the sun to dry crops and grain is one of the oldest and mostly widely used applications of solar energy. The simplest and least expensive techniques is to allow crops to dry naturally in the field, or to spread grain and fruit out in the sun after harvesting. More sophisticated solar dryers protect grain and fruit, reduce losses, dry faster and more uniformly, and produce a better quality product than open air methods. The basic components of a solar dryer are an enclosure or shed, screened drying trays or racks, and a solar collector. In hot, arid climates, the collector may not even be necessary. The southern side of the enclosure itself can be glazed to allow sunlight to dry the material. The collector can be as simple as a glazed box with a dark coloured interior to absorb the solar energy that heats air. The air heated in the solar collector moves, either by natural convection or forced by a fan, up through the material being dried. The size of the collector and rate of airflow depends on the amount of material being dried, the moisture content of the material, the humidity in the air, and the average amount of solar radiation available during the drying season (Schepens, 1986).
There are a relatively small number of large solar crop dryers around the world. This is because the cost of the solar collector can be high, and drying rates are not as controllable as they are with natural gas or propane powered dryers. Using the collector at other times of the year, such as for heating farm building, may make a solar dryer more cost effective.
Note:
Solar panels are typically used to heat water for hot water application. Therefore prior to the solar panels installing, the requirements of hot water quantity, conditions and availability of the roof construction, and payback time should be checked. The number of solar panels needed, will depend on the amount and temperature of hot water required – for the most solar systems maximum temperature is about 60 °C. Solar systems can get water over 80oC but with additional system to lift temperatures.
Also, for the PV systems, the only way in which PV can be viable is the introduction of a suitable feed-in tariff, and the current availability of the tariffs should be checked with the authorities.
23 New York State Energy Research Development Authority, Introduction to Solar Energy Applications For Agriculture, NYSERDA, New York. USA, 2009, www.power Naturally.org; EREC, Agricultural Appli-cations of Solar Energy. Energy Efficiency and Renewable Energy Cleaning house (EREC) United State Department of Energy, Merrifield, USA, 2003.
Supporting tools and templates 93
SUPPORTING TOOLS AND TEMPLATES
TOOLS
BOILER EFFICIENCY
To determine loss in boiler units (flue gas loss, heat insulation loss, blow-down loss (only in steam boilers)), the software for the boiler efficiency determination has been developed, as an integral part of this Manual.
Software consists of the input part, where data necessary for calculation have to be defined:1. Boiler capacity [t/h] or [kW]2. Inlet/outlet parameters of water/feed water and steam [oC, bar(a)]3. Fuel type and fuel characteristics (composition and lower heating value-LHV)4. Flue gas composition/excess air [CO2,s, O2,s, COs, SO2,s [%]/ [-]]5. Flue gas temperature [oC]6. Estimation of heat loss through boiler envelope [%] – corresponding to the LHV7. Estimation of heat loss due to blow-down of boiler [%]– corresponding to the LHV8. Estimation of heat loss due to ash and unburned carbon [%]– corresponding to the LHV9. Fuel price [RSD/kg] or [RSD/m3]
The user should check the option of EE measurea. Burner optimisationb. Flue gas heat recoveryc. Boiler insulation improvementd. Blow-down recovery
Depending of checked option user should input data on investment cost for different type of energy efficiency improvement
The short presentation of the results consists of the following data:1. Heat loss with flue gas, [%]2. Boiler efficiency [%]3. Boiler efficiency improvement (depending on EE measure)4. Fuel savings [%], [RSD] – comparing to the base case5. Simple payback period of investment
EXAMPLE:
Boiler unit combusts natural gas (composition: CH4 = 94.0 %, C2H6 = 2.0 %, C3H8 = 1.0 %, C4H10 = 1.0%, CO2 = 1.0 %, N2 = 1.0 %; Lover Heating Value is LHV=37182 kJ/m3). There is no combustion air preheating. Flue gas composition is measured with gas analyzer (composition is of flue gas is in Vol%, on dry gas basis). The results of flue gas analysis are: CO2,s =8.3%, O2,s=6.467%. Temperature of flue gas is 220 oC. Estimation for loss through boiler envelope is 2% comparing to LHV of fuel. There are no losses due to blow-down of the boiler.
5
5.1
5.1.1
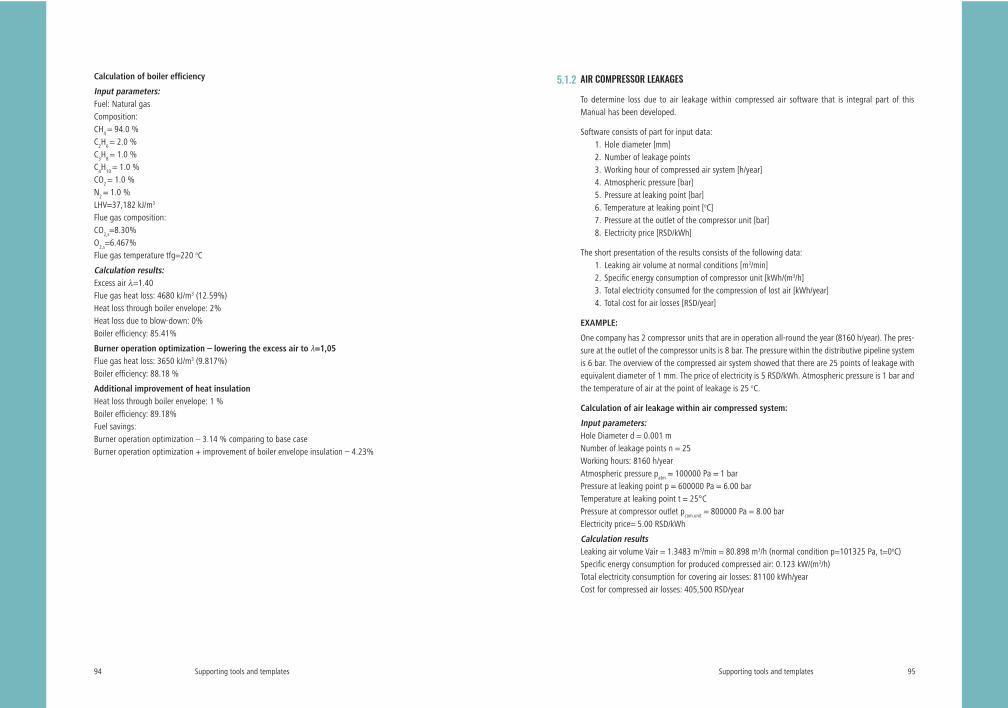
Supporting tools and templates94
Calculation of boiler efficiency
Input parameters:Fuel: Natural gasComposition:CH4 = 94.0 %C2H6 = 2.0 %C3H8 = 1.0 %C4H10 = 1.0 %CO2 = 1.0 %N2 = 1.0 %LHV=37,182 kJ/m3
Flue gas composition:CO2,s=8.30%O2,s=6.467%Flue gas temperature tfg=220 oC
Calculation results:Excess air =1.40Flue gas heat loss: 4680 kJ/m3 (12.59%)Heat loss through boiler envelope: 2%Heat loss due to blow-down: 0%Boiler efficiency: 85.41%
Burner operation optimization – lowering the excess air to =1,05Flue gas heat loss: 3650 kJ/m3 (9.817%)Boiler efficiency: 88.18 %
Additional improvement of heat insulationHeat loss through boiler envelope: 1 %Boiler efficiency: 89.18%Fuel savings:Burner operation optimization – 3.14 % comparing to base caseBurner operation optimization + improvement of boiler envelope insulation – 4.23%
Supporting tools and templates 95
AIR COMPRESSOR LEAKAGES
To determine loss due to air leakage within compressed air software that is integral part of this Manual has been developed.
Software consists of part for input data:1. Hole diameter [mm]2. Number of leakage points3. Working hour of compressed air system [h/year]4. Atmospheric pressure [bar]5. Pressure at leaking point [bar]6. Temperature at leaking point [oC]7. Pressure at the outlet of the compressor unit [bar]8. Electricity price [RSD/kWh]
The short presentation of the results consists of the following data:1. Leaking air volume at normal conditions [m3/min]2. Specific energy consumption of compressor unit [kWh/(m3/h]3. Total electricity consumed for the compression of lost air [kWh/year]4. Total cost for air losses [RSD/year]
EXAMPLE:
One company has 2 compressor units that are in operation all-round the year (8160 h/year). The pres-sure at the outlet of the compressor units is 8 bar. The pressure within the distributive pipeline system is 6 bar. The overview of the compressed air system showed that there are 25 points of leakage with equivalent diameter of 1 mm. The price of electricity is 5 RSD/kWh. Atmospheric pressure is 1 bar and the temperature of air at the point of leakage is 25 oC.
Calculation of air leakage within air compressed system:
Input parameters:Hole Diameter d = 0.001 mNumber of leakage points n = 25Working hours: 8160 h/yearAtmospheric pressure patm = 100000 Pa = 1 barPressure at leaking point p = 600000 Pa = 6.00 barTemperature at leaking point t = 25°CPressure at compressor outlet pcom.unit = 800000 Pa = 8.00 barElectricity price= 5.00 RSD/kWh
Calculation resultsLeaking air volume Vair = 1.3483 m3/min = 80.898 m3/h (normal condition p=101325 Pa, t=0oC)Specific energy consumption for produced compressed air: 0.123 kW/(m3/h)Total electricity consumption for covering air losses: 81100 kWh/yearCost for compressed air losses: 405,500 RSD/year
5.1.2

Supporting tools and templates96
LIGHTS
Determine the simple payback period for the investment of replacement of the existing lighting system in a industrial plant. The total number of lamps is 100 (each lamp is equipped with 3 light bulbs, each bulb is 36 W). The lighting system operates 5,280 h/year. The upgrade of existing system envisages the installation of new efficient compact –fluo lighting system that consumes 60% less than existing system. Maintenance cost of existing system is 12% of total cost for electricity, while the maintenance cost for new lighting system is 8% of electricity consumption. Unit cost of electricity is 5 RSD/kWh, where investment cost for new lighting system is 8,400 EUR.
EXAMPLE:
Input parameter:Number of lamps: 100Number of light bulbs per lamp: 3Power of light bulb: 36 WAdditional power for starters and dimmers: 15% of bulb powerOperating hour: 5,280 h/yearMaintenance cost of existing lighting system: 12% of total electricity costPower of CF light bulbs with starter: 14.4 WMaintenance cost of existing lighting system: 8% of total electricity costElectricity price: 5 RSD/kWhInvestment cost: 8,400 EUR
Calculation results:Electricity consumption of existing lighting system: 65,580 kWh/yearTotal cost for electricity and maintenance for existing lighting system: 367,300 RSD/yearElectricity consumption of new efficient lighting system: 26,230 kWh/yearTotal cost for electricity and maintenance for new efficient lighting system: 141,650 RSD/yearTotal savings: 225,600 RSD/yearSimple payback period: 4.6 years
FREQUENCY CONTROLLED DRIVES
To determine how quickly energy-efficient drive technology amortizes, the Energy Savings Estimator allows to estimate potential energy savings across the entire drive train. The free SinaSave energy-efficiency software uses your key system data to calculate the savings potential in your specific drive application:
http://www.industry.usa.siemens.com/drives/us/en/electric-drives/medium-voltage-drives/energy-savings-calculator/pages/energy-savings-calculators.aspx
WATER HEATING
One of the available free software for calculation could be found on the following link:
http://www.lenntech.com/calculators/energy/energy-cost-water.htm
The software calculates the energy which is needed to heat water with a certain flow by specifying the
5.1.4
5.1.5
5.1.3
Supporting tools and templates 97
starting temperature and desired end temperature of the water. It also calculates the cost of heating when using electricity or natural gas heating for the water.
The formula used for this calculation is:
0 0out inlt tout inl
p pQ m c t c t , kW
Gde je:
Q kW Heat for heating the water from inlt to outt
m kg/s Mass flow of water
0
t
pc kJ/kgK Specific heat of water for temperature interval 0t
inlt oC Inlet water temperature
outt oC Outlet water temperature
HEAT LOSSES FROM PIPES
In order to determine losses due to deteriorated insulation of hot surfaces of pipelines a software that is integral part of this Manual has been developed.
Software consists of part for input data:1. Insulation material – mineral wool2. Cover plate material – aluminium or steel3. Ambient temperature [oC]4. Air velocity [m/s] – if the pipeline is inside the building, the velocity can be taken as 0 m/s5. Outer pipe diameter [mm] – nominal pipe diameter without insulation6. Surface temperature of steel pipe [oC] – it can be taken as temperature of the fluid transported
in the pipeline7. Thickness of existing insulation [mm] – if there is no insulation, the value of this parameter is 0 mm8. Length of pipeline [m]9. Boiler efficiency [%]10. Lower heating value of fuel LHV [kJ/kg] for solid and liquid fuels or [kJ/m3] for gaseous fuels11. Working hours [h/year] – the working hours of heating/steam system12. Fuel price [RSD/kg] or [RSD/m3]13. Improvement insulation thickness [mm] – if the option Effects of insulation improvement is
checked than it is necessary to input data14. Emission factor of pipe surface – there is two possible choices – oxidized steel surface or
oxidized aluminium surface15. The user should check what is the point of interest for calculation of heat losses through
insulated/uninsulated pipelines:
5.1.6
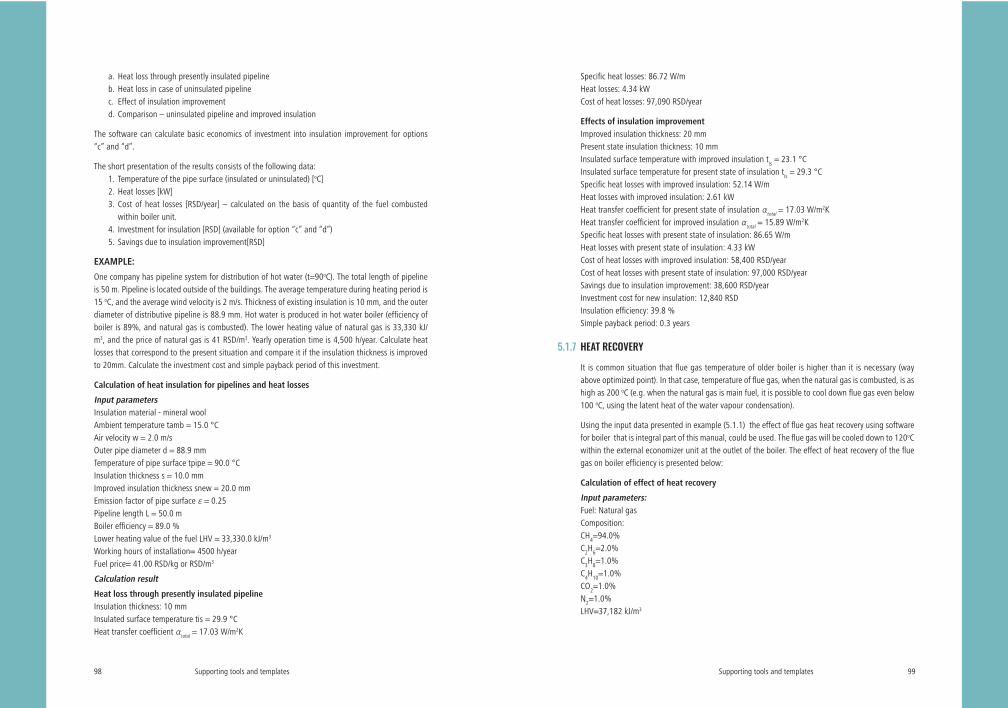
Supporting tools and templates98
a. Heat loss through presently insulated pipelineb. Heat loss in case of uninsulated pipelinec. Effect of insulation improvementd. Comparison – uninsulated pipeline and improved insulation
The software can calculate basic economics of investment into insulation improvement for options “c” and “d”.
The short presentation of the results consists of the following data:1. Temperature of the pipe surface (insulated or uninsulated) [oC]2. Heat losses [kW]3. Cost of heat losses [RSD/year] – calculated on the basis of quantity of the fuel combusted
within boiler unit.4. Investment for insulation [RSD] (available for option “c” and “d”)5. Savings due to insulation improvement[RSD]
EXAMPLE:
One company has pipeline system for distribution of hot water (t=90oC). The total length of pipeline is 50 m. Pipeline is located outside of the buildings. The average temperature during heating period is 15 oC, and the average wind velocity is 2 m/s. Thickness of existing insulation is 10 mm, and the outer diameter of distributive pipeline is 88.9 mm. Hot water is produced in hot water boiler (efficiency of boiler is 89%, and natural gas is combusted). The lower heating value of natural gas is 33,330 kJ/m3, and the price of natural gas is 41 RSD/m3. Yearly operation time is 4,500 h/year. Calculate heat losses that correspond to the present situation and compare it if the insulation thickness is improved to 20mm. Calculate the investment cost and simple payback period of this investment.
Calculation of heat insulation for pipelines and heat losses
Input parametersInsulation material - mineral woolAmbient temperature tamb = 15.0 °CAir velocity w = 2.0 m/sOuter pipe diameter d = 88.9 mmTemperature of pipe surface tpipe = 90.0 °CInsulation thickness s = 10.0 mmImproved insulation thickness snew = 20.0 mmEmission factor of pipe surface = 0.25Pipeline length L = 50.0 mBoiler efficiency = 89.0 %Lower heating value of the fuel LHV = 33,330.0 kJ/m3
Working hours of installation= 4500 h/yearFuel price= 41.00 RSD/kg or RSD/m3
Calculation result
Heat loss through presently insulated pipelineInsulation thickness: 10 mmInsulated surface temperature tis = 29.9 °CHeat transfer coefficient total = 17.03 W/m2K
Supporting tools and templates 99
Specific heat losses: 86.72 W/mHeat losses: 4.34 kWCost of heat losses: 97,090 RSD/year
Effects of insulation improvementImproved insulation thickness: 20 mmPresent state insulation thickness: 10 mmInsulated surface temperature with improved insulation tis = 23.1 °CInsulated surface temperature for present state of insulation tis = 29.3 °CSpecific heat losses with improved insulation: 52.14 W/mHeat losses with improved insulation: 2.61 kWHeat transfer coefficient for present state of insulation total = 17.03 W/m2KHeat transfer coefficient for improved insulation total = 15.89 W/m2KSpecific heat losses with present state of insulation: 86.65 W/mHeat losses with present state of insulation: 4.33 kWCost of heat losses with improved insulation: 58,400 RSD/yearCost of heat losses with present state of insulation: 97,000 RSD/yearSavings due to insulation improvement: 38,600 RSD/yearInvestment cost for new insulation: 12,840 RSDInsulation efficiency: 39.8 %Simple payback period: 0.3 years
HEAT RECOVERY
It is common situation that flue gas temperature of older boiler is higher than it is necessary (way above optimized point). In that case, temperature of flue gas, when the natural gas is combusted, is as high as 200 oC (e.g. when the natural gas is main fuel, it is possible to cool down flue gas even below 100 oC, using the latent heat of the water vapour condensation).
Using the input data presented in example (5.1.1) the effect of flue gas heat recovery using software for boiler that is integral part of this manual, could be used. The flue gas will be cooled down to 120oC within the external economizer unit at the outlet of the boiler. The effect of heat recovery of the flue gas on boiler efficiency is presented below:
Calculation of effect of heat recovery
Input parameters:Fuel: Natural gasComposition:CH4=94.0%C2H6=2.0%C3H8=1.0%C4H10=1.0%CO2=1.0%N2=1.0%LHV=37,182 kJ/m3
5.1.7

Supporting tools and templates100
Flue gas composition:CO2,s=8.3%O2,s=6.467%Temperature of flue gas tfg=220 oCTemperature of flue gas after the external economizer tfg_eco=120 oC
Calculation results:Excess air =1.40Flue gas heat loss 4,680 kJ/m3 (12.6%)Heat loss through boiler envelope 2%Heat loss due to blow-down 0%Boiler efficiency 85.41%
Optimization of the burner’s operation parameters– lowering the excess air to =1.05 and heat recovery of flue gas– tfg_eco=120 oC following with additional improvement of heat insulationFlue gas heat loss 1,899 kJ/m3 (5.11%)Boiler efficiency 93.89 %Fuel savings 9.03 %
FUEL SWITCHING
There is a rising question for determining possibility and justification of switching from the high content fuel (e.g. fuel oil) to a low carbon fuel (e.g. natural gas) at new and existing boiler. The effect of such technical measure should be evaluated using the methodology for calculation the effects on fuel consumption and reduction of GHG emission. The first step should cover determination of the baseline boiler efficiency, fuel consumption and GHG emission, which follows the calculation of project boiler efficiency, fuel consumption and GHG emission.
The annual emission reduction is then calculated as difference: ERy = BEy - PEy
, ,
,
PJ i y i PLi
y fuel jBL
FC LHVBE EF - Baseline emission
Where: Consumption of the fuel i in year, t/year
LHVi Lower heating value of fuel i (TJ/t)
EFfuel,j CO2 emission factor for the baseline fuel j, tCO2/year)
BL Baseline boiler efficiency
PL Design boiler efficiency
, ,y PJ i y i PLi
PE FC LHV - emission
5.1.8
Supporting tools and templates 101
REPORT TEMPLATE
TOOL FOR BAT ASSESSMENT
The purpose of the Excel tool is to assist in preparation of the BAT Assessment document, required to be submitted as a part of IPPC Application. Tool for comparison with BAT is excel document with the relevant best available techniques for intensive rearing sector. The biggest part of the tool consists of the technique of vertical BREF for the intensive rearing of poultry or pigs (Best Available Techniques Reference Document for the Intensive Rearing of Poultry or Pigs, final draft 2015). It also refers to BATs from horizontal BREF documents on Best Available Techniques on Energy Efficiency (Reference Doc-ument on Best Available Techniques on Energy Efficiency (ENE), 2009), and Emissions from Storage (Reference Document on Best Available Techniques on Emissions from Storage (EFS), 2006).
The final document, BAT Assessment Report, should be prepared in accordance with the Rulebook on the contents, layout and completing the application for integrated permit (Official Gazette of the Republic of Serbia No 30/06 and 32/2016).
Additional explanations for the preparation of the BAT Assessment document are given in the IPPC Manual for Intensive Rearing of Poultry and Pigs.
The electronic version of the Excel tool is provided with this manual
ENERGY EFFICIENCY ACTION PLAN
According to the article 9 of the Law on Integrated Pollution Prevention and Control („Official Gazette of RS“, no 135/04 and 25/15) farm that is required to obtain an IPPC permit, in addition to the IPPC application shall submit the Energy efficiency plan to the competent authority.
In order to make preparation of this plan easier to the operator the template of the plan and guidance for the preparation is developed and given in the appendix of this manual. For the assessment of potential measures or the improvement, the operators can use the measures described in Chapters 2-4 of this manual, while the action plan should be aligned with the programme of measures for bringing of the existing installation in compliance with prescribed conditions. Description of the plan, as well as other plans that are mandatory part of the documentation submitted with the application for an integrated permit, can be found in the Manual for preparation of application for integrated permit.
5.2
5.2.1
5.2.2
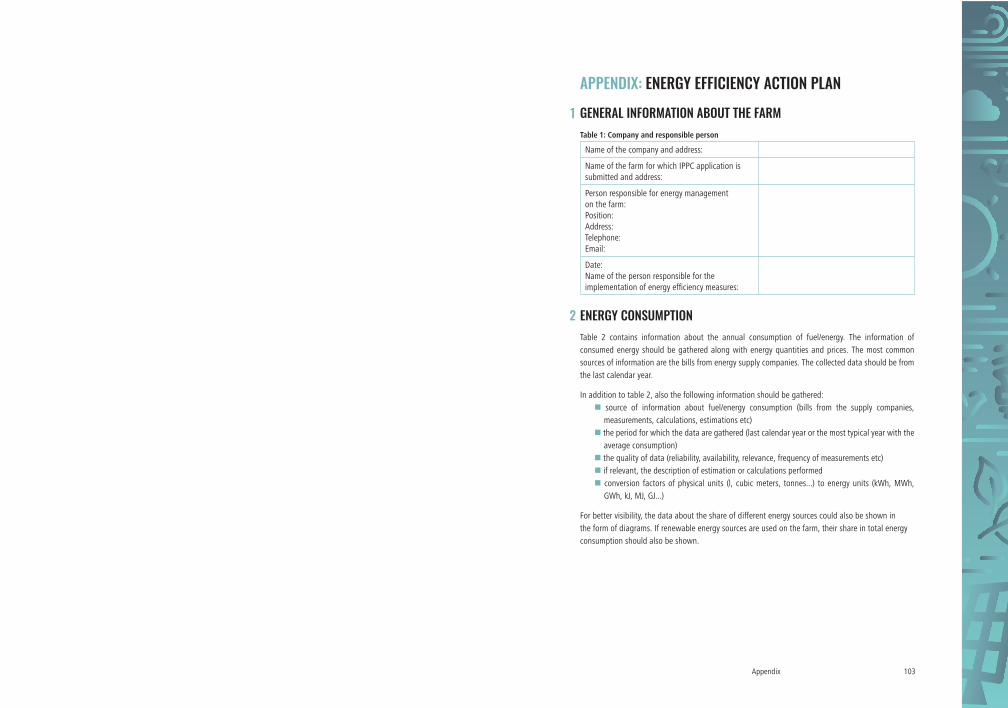
Appendix 103
APPENDIX: ENERGY EFFICIENCY ACTION PLAN
GENERAL INFORMATION ABOUT THE FARMTable 1: Company and responsible person
Name of the company and address:
Name of the farm for which IPPC application is submitted and address:
Person responsible for energy management on the farm:Position:Address:Telephone:Email:
Date:Name of the person responsible for the implementation of energy efficiency measures:
ENERGY CONSUMPTIONTable 2 contains information about the annual consumption of fuel/energy. The information of consumed energy should be gathered along with energy quantities and prices. The most common sources of information are the bills from energy supply companies. The collected data should be from the last calendar year.
In addition to table 2, also the following information should be gathered: source of information about fuel/energy consumption (bills from the supply companies, measurements, calculations, estimations etc)
the period for which the data are gathered (last calendar year or the most typical year with the average consumption)
the quality of data (reliability, availability, relevance, frequency of measurements etc) if relevant, the description of estimation or calculations performed conversion factors of physical units (l, cubic meters, tonnes...) to energy units (kWh, MWh, GWh, kJ, MJ, GJ...)
For better visibility, the data about the share of different energy sources could also be shown in the form of diagrams. If renewable energy sources are used on the farm, their share in total energy consumption should also be shown.
1
2
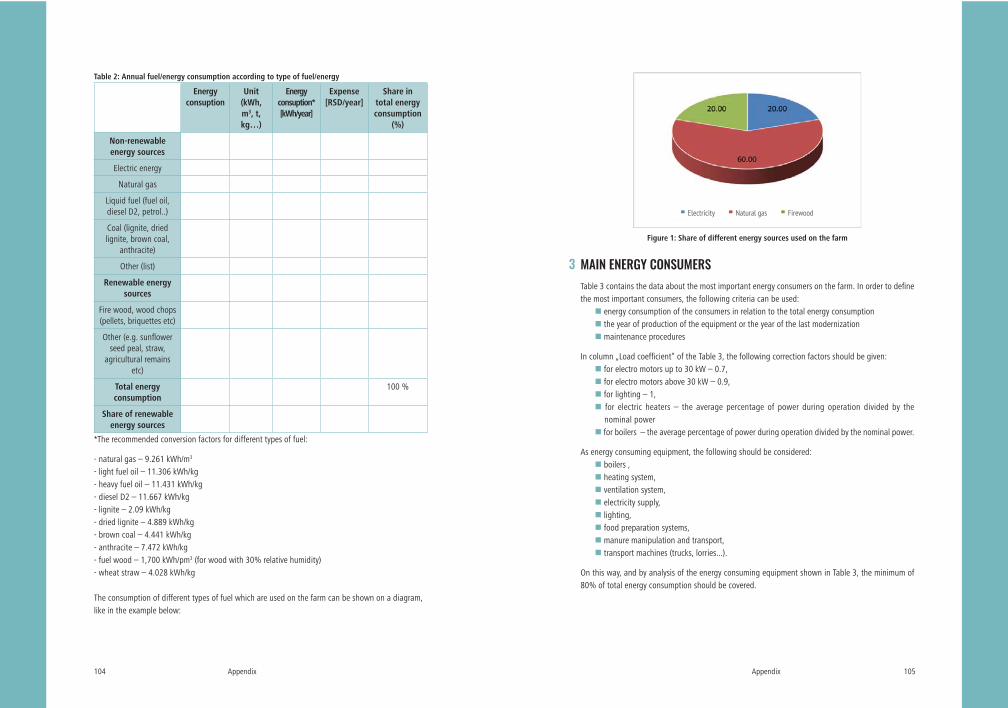
Appendix104
Table 2: Annual fuel/energy consumption according to type of fuel/energy
Energy consuption
Unit (kWh, m3, t, kg…)
Energy consuption* [kWh/year]
Expense [RSD/year]
Share in total energy consumption
(%)
Non-renewable energy sources
Electric energy
Natural gas
Liquid fuel (fuel oil, diesel D2, petrol..)
Coal (lignite, dried lignite, brown coal,
anthracite)
Other (list)
Renewable energy sources
Fire wood, wood chops (pellets, briquettes etc)
Other (e.g. sunflower seed peal, straw,
agricultural remains etc)
Total energy consumption
100 %
Share of renewable energy sources
*The recommended conversion factors for different types of fuel:
- natural gas – 9.261 kWh/m3
- light fuel oil – 11.306 kWh/kg- heavy fuel oil – 11.431 kWh/kg- diesel D2 – 11.667 kWh/kg- lignite – 2.09 kWh/kg- dried lignite – 4.889 kWh/kg- brown coal – 4.441 kWh/kg- anthracite – 7.472 kWh/kg- fuel wood – 1,700 kWh/pm3 (for wood with 30% relative humidity)- wheat straw – 4.028 kWh/kg
The consumption of different types of fuel which are used on the farm can be shown on a diagram, like in the example below:
Appendix 105
3
Figure 1: Share of different energy sources used on the farm
MAIN ENERGY CONSUMERS Table 3 contains the data about the most important energy consumers on the farm. In order to define the most important consumers, the following criteria can be used:
energy consumption of the consumers in relation to the total energy consumption the year of production of the equipment or the year of the last modernization maintenance procedures
In column „Load coefficient“ of the Table 3, the following correction factors should be given: for electro motors up to 30 kW – 0.7, for electro motors above 30 kW – 0.9, for lighting – 1, for electric heaters – the average percentage of power during operation divided by the nominal power
for boilers – the average percentage of power during operation divided by the nominal power.
As energy consuming equipment, the following should be considered: boilers , heating system, ventilation system, electricity supply, lighting, food preparation systems, manure manipulation and transport, transport machines (trucks, lorries...).
On this way, and by analysis of the energy consuming equipment shown in Table 3, the minimum of 80% of total energy consumption should be covered.
Electricity Natural gas Firewood
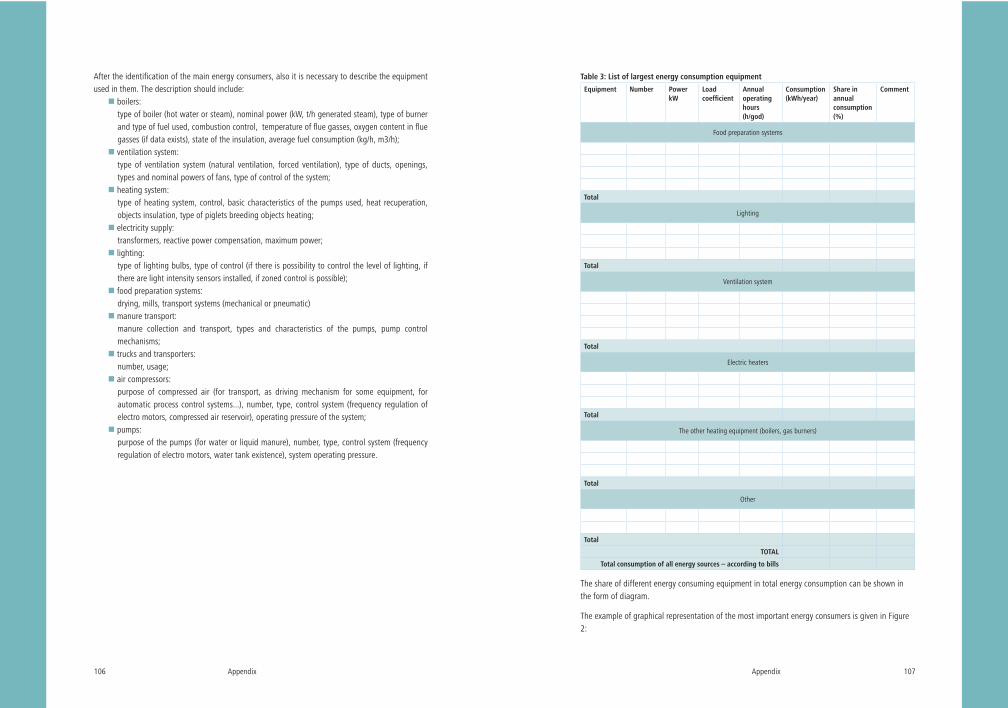
Appendix106
After the identification of the main energy consumers, also it is necessary to describe the equipment used in them. The description should include:
boilers: type of boiler (hot water or steam), nominal power (kW, t/h generated steam), type of burner
and type of fuel used, combustion control, temperature of flue gasses, oxygen content in flue gasses (if data exists), state of the insulation, average fuel consumption (kg/h, m3/h);
ventilation system: type of ventilation system (natural ventilation, forced ventilation), type of ducts, openings,
types and nominal powers of fans, type of control of the system; heating system:
type of heating system, control, basic characteristics of the pumps used, heat recuperation, objects insulation, type of piglets breeding objects heating;
electricity supply: transformers, reactive power compensation, maximum power;
lighting: type of lighting bulbs, type of control (if there is possibility to control the level of lighting, if
there are light intensity sensors installed, if zoned control is possible); food preparation systems:
drying, mills, transport systems (mechanical or pneumatic) manure transport:
manure collection and transport, types and characteristics of the pumps, pump control mechanisms;
trucks and transporters: number, usage;
air compressors: purpose of compressed air (for transport, as driving mechanism for some equipment, for
automatic process control systems...), number, type, control system (frequency regulation of electro motors, compressed air reservoir), operating pressure of the system;
pumps: purpose of the pumps (for water or liquid manure), number, type, control system (frequency
regulation of electro motors, water tank existence), system operating pressure.
Appendix 107
Table 3: List of largest energy consumption equipment
Equipment Number Power kW
Load coefficient
Annual operating hours (h/god)
Consumption (kWh/year)
Share in annual consumption (%)
Comment
Food preparation systems
Total
Lighting
Total
Ventilation system
Total
Electric heaters
Total
The other heating equipment (boilers, gas burners)
Total
Other
Total
TOTAL
Total consumption of all energy sources – according to bills
The share of different energy consuming equipment in total energy consumption can be shown in the form of diagram.
The example of graphical representation of the most important energy consumers is given in Figure 2:

Appendix108
Figure 2: Energy consumption share by equipment
INDICATORS AND BENCHMARKINGOne of the most widely used indicators that asses the level of the energy efficiency of a company is specific energy consumption. From tables below, it can be seen that the specific energy consumption can be expressed in different ways (kWh/m2, kWh/animal, kWh/product (meat, eggs etc)).
Table 4 refers to the energy consumption indicators (e.g. total energy consumption per animal for pigs, or total energy consumption per m2 of space used for broiler rearing). If data are available it would be desirable to calculate energy efficiency indicators for the last three years, so that energy efficiency trend in that period can be assessed. The obtained values, if applicable, should be compared to the values from BREF for intensive rearing of pigs and poultry, which are given in Tables 5 -9 depending on type of animals on the farm. A short comment should be given about the performances of the farm compared to the reference values.
Table 4: Indicators
Indicator Value of the indicator
Unit Comment
Intensive rearing of pigs
Total energy consumption per animal
kWh/animal/year.
Intensive rearing of broilers
Total energy consumption per area of objects
kWh/m²
Egg production
Total energy consumption per hen
kWh/hen
4
Lighting Ventilation system Food preparation system Pumps Heating system
Appendix 109
The calculated indicators for the farm should be compared to the relevant values from the following tables (if applicable) in order to calculate the energy efficiency improvement potential:
Table 5: Indicators of energy consumption for pig farms in France 1
Type of the farm Electric energy
Fuel oil Natural gas
Total average energy
consumption
% % % kWh/animal/year
kWh/sow/year
Farm with closed cycle of production (all rearing phases)
76 21 3 48 983
Finishers production (from piglets to finishers)
86 14 0 25 NP
Piglet breading farm 70 30 0 19 403
Table 6: Average annual consumption of gaseous fuels in the production of poultry in France
Type of production Average annual consumption of gaseous fuels**
kWh/m²
Standard broilers (from 1,8 – 2,1 kg live weight)
93.8 (64.9-113.2)
Heavy broilers (from 2,8 – 3,5 kg live weight)
92.5 (58 – 110.4)
Broiler breading (without fattening)
-
Hens in breading (from the 1st day till 18. weeks of age)
47.6
**The range of values given in table includes farms with different object types, different heating and
ventilation systems
Table 7: Average annual consumption of electric energy in the production of poultry in France
Type of production
Average annual consumption of electric energy
kWh/m² 25 % from lower measured values
[kWh/m²]
25 % from higher measured values
[kWh/m²]
Standard broilers 15.2 9.4 20.3
Broiler breading (without fattening)
18.8 - -
1 Source: Best Available Techniques (BAT) Reference Document for the Intensive Rearing of Poultry or Pigs, Final draft 2015

Appendix110
Table 8: Estimated total energy consumption on egg laying hen farm and hens in breading from 1st
day till 18 weeks of age in France
Type of production El. energykWh/hen
Gaseous fuelkWh/hen
Hens 0.45 1.42
Hens in breading (from the 1st day till 18. weeks of age)
NA 3.15
Besides that, specific energy consumption for poultry farms (egg production), given as energy consumption per hen are given in Table 9.
Table 9: Recommended and real specific energy consumption for egg production for poultry farm of
up to 75.000 hens in Great Britain2
Energy consumption indicator Typical Best practice
kWh/hen 3.9 2.25
Besides the specific energy consumption shown in Tables 5-9 for different types of farms, BREF for intensive rearing of poultry and pigs gives also the data about the specific consumption in different EU countries. When relevant indicator is chosen, it is important to check all of the values given in BREF document to insure that the comparison is performed with the farm of the same type and similar conditions.
Reliable data about the specific energy consumption (by energy sources) are of key importance in comparison statistics performed for the farms. On some farms, the main energy source is electric energy (as is the case on most poultry farms in Serbia), while on the other farms other forms of energy are used as well (fossil fuels or renewable energy sources). In that sense, The formation of data base on national level about energy consumption on farms is very important. The data base should include data on different energy sources used on the farm, specific consumptions and relevant indicators such as specific energy consumption, as the level of energy efficiency and the potential for improvement could be assessed.
The comparison of specific energy consumption on the farm with the data from farms in other countries (benchmark values) can be show as proposed in Table 10.
Table 10: Comparative statistics
Energy consumption indicator
kWh/unit Comparative value
Deviation - comment
2 Source: SEAI, Energy Use in Agriculture 2011
Appendix 111
SYSTEMS AND EQUIPMENT ANALYSISThe questions given in Table 11 should serve the operator as a reminder for the description of different systems and equipment used on the farm and for the estimation of the performance of the farm compared to the best practice. Besides that, these questions can help the operator for defining the measures for efficient use of energy.
Table 11: Questions for energy efficiency assessment on the farm
No Question If relevant, describe shortly and propose energy efficiency increase
measure
1 Do you monitor total energy consumption, calculate indicators and control consumption?
2 Is the roof of the pig houses or houses insulated?
3 Is the building envelope insulated?
4 Do you recover heat from exhaust air?
5 Do you use box creeps with thermostatic control?
6 Do you use under-floor heating pads?
7 Are hot water pipes insulated?
8 Do you measure and control boiler efficiency regularly?
9 Do you control temperatures?
10 Are you using energy efficient air inlets, fans, and outlets?
11 Do you regularly clean the air ducts, inlets, outlets?
12 Are you using energy efficient lights?
13 Do you use a dry, mechanical feeding system?
14 Do you use energy efficient pumps and aerators, if applicable?
15 Do you use frequency controlled drives on motors for pumps and fans?
16 Do you operate a biogas plant?
5
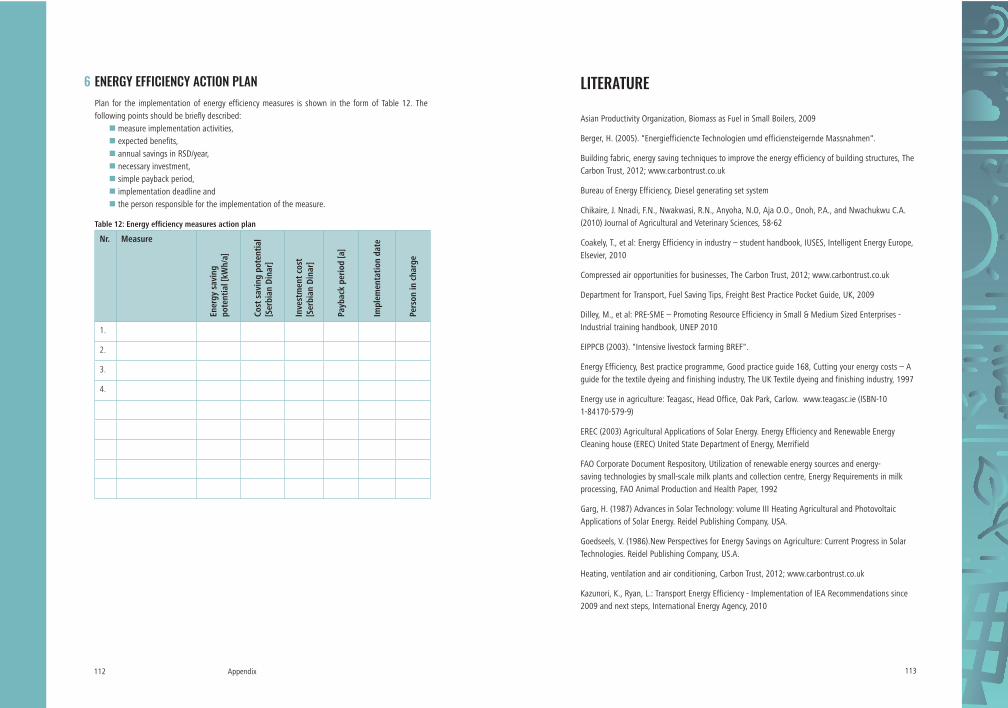
Appendix112
ENERGY EFFICIENCY ACTION PLANPlan for the implementation of energy efficiency measures is shown in the form of Table 12. The following points should be briefly described:
measure implementation activities, expected benefits, annual savings in RSD/year, necessary investment, simple payback period, implementation deadline and the person responsible for the implementation of the measure.
Table 12: Energy efficiency measures action plan
Nr. Measure
Ener
gy s
avin
g po
tent
ial [
kWh/
a]
Cost
sav
ing
pote
ntia
l [S
erbi
an D
inar
]
Inve
stm
ent c
ost
[Ser
bian
Din
ar]
Payb
ack
perio
d [a
]
Impl
emen
tatio
n da
te
Pers
on in
cha
rge
1.
2.
3.
4.
6
113
LITERATURE
Asian Productivity Organization, Biomass as Fuel in Small Boilers, 2009
Berger, H. (2005). "Energiefficiencte Technologien umd efficiensteigernde Massnahmen".
Building fabric, energy saving techniques to improve the energy efficiency of building structures, The Carbon Trust, 2012; www.carbontrust.co.uk
Bureau of Energy Efficiency, Diesel generating set system
Chikaire, J. Nnadi, F.N., Nwakwasi, R.N., Anyoha, N.O, Aja O.O., Onoh, P.A., and Nwachukwu C.A. (2010) Journal of Agricultural and Veterinary Sciences, 58-62
Coakely, T., et al: Energy Efficiency in industry – student handbook, IUSES, Intelligent Energy Europe, Elsevier, 2010
Compressed air opportunities for businesses, The Carbon Trust, 2012; www.carbontrust.co.uk
Department for Transport, Fuel Saving Tips, Freight Best Practice Pocket Guide, UK, 2009
Dilley, M., et al: PRE-SME – Promoting Resource Efficiency in Small & Medium Sized Enterprises - Industrial training handbook, UNEP 2010
EIPPCB (2003). "Intensive livestock farming BREF".
Energy Efficiency, Best practice programme, Good practice guide 168, Cutting your energy costs – A guide for the textile dyeing and finishing industry, The UK Textile dyeing and finishing industry, 1997
Energy use in agriculture: Teagasc, Head Office, Oak Park, Carlow. www.teagasc.ie (ISBN-10 1-84170-579-9)
EREC (2003) Agricultural Applications of Solar Energy. Energy Efficiency and Renewable Energy Cleaning house (EREC) United State Department of Energy, Merrifield
FAO Corporate Document Respository, Utilization of renewable energy sources and energy-saving technologies by small-scale milk plants and collection centre, Energy Requirements in milk processing, FAO Animal Production and Health Paper, 1992
Garg, H. (1987) Advances in Solar Technology: volume III Heating Agricultural and Photovoltaic Applications of Solar Energy. Reidel Publishing Company, USA.
Goedseels, V. (1986).New Perspectives for Energy Savings on Agriculture: Current Progress in Solar Technologies. Reidel Publishing Company, US.A.
Heating, ventilation and air conditioning, Carbon Trust, 2012; www.carbontrust.co.uk
Kazunori, K., Ryan, L.: Transport Energy Efficiency - Implementation of IEA Recommendations since 2009 and next steps, International Energy Agency, 2010

114
NYSERDA (2009). Introduction to Solar Energy Applications For Agriculture. New York State Energy Research Development Authority, New York. Available at www.power Naturally.org.
Pagan, R., et al: Eco-efficiency for the Dairy Processing Industry, The UNEP Working Group for Cleaner Production in the Food Industry, Sustainable Business
Rajeeb, G., et al: Opportunities and Challenges in Implementing Pollution Prevention Strategies to Help Revive the Ailing Carpet Manufacturing Sector of Nepal
Schepens, G.(1986) Solar Energy in Agriculture and Industry: Potentials of Solar Heat in European Agricultural Assessment. Reidel Publishing Company, U.S.A.
Schnepf, R. (2005) Energy Uses in Agriculture: Background and Issues. Congressional Research Service, CRS Report Code 32677, U.S.A.
Schnepf, R. (2007). Agricultural Based Renewable Energy Production. Congressional Research Service, CRS Report Code 32712, U.S.A.
Society of Light and Lighting, Action Energy, General Information Report, Energy efficiency in lighting – an overview, Carbon Trust
Syntech Fibres, Boiler Feedwater Treatment (Part II), Water Treatment Fundamentals, 1998 – 2011
The Government’s Energy Efficiency Best Practise Programme, Energy efficient refurbishment of hotels and guesthouses,
UCS (2009) Renewable Energy and Agriculture: A Natural Fit. Union of Concerned Scientists, Cambridge. Available at www.ucssusa.org/elean-energy/coalvswind/gd.
United Nation Environmental Programme, Cleaner Production – Energy Efficiency Manual, UK, 2004
WFE, (2002) Using Renewable in Agriculture: Sector Overview Wisconsin Focus on Energy. Wisconsin.


The project is funded by the Embassy of Sweden in Belgrade


![Prudent and efficient use of antimicrobials in pigs and poultry...Prudent and ef cient use of antimicrobials in pigs and poultry FAO ANIMAL PRODUCTION AND HEALTH / MANUAL 23 ISSN [print]](https://img.pdfslide.us/doc/110x75/6002d0545171c9059a42cb2d/prudent-and-efficient-use-of-antimicrobials-in-pigs-and-poultry-prudent-and.jpg)